Article

Evaluation of Hydrological and Hydraulic Models Applied in Typical Mediterranean Ungauged Watersheds Using Post-Flash-Flood Measurements

by
Aristeidis Kastridis
* and
Dimitrios Stathis
Department of Forest and Water Engineering, Faculty of Forestry and Natural Environment, Aristotle University of Thessaloniki, 54124 Thessaloniki, Greece
*
Author to whom correspondence should be addressed.
Hydrology 2020, 7(1), 12; https://doi.org/10.3390/hydrology7010012
Submission received: 15 December 2019 / Revised: 21 January 2020 / Accepted: 14 February 2020 / Published: 18 February 2020

Abstract

:
In this paper, three different flash floods episodes were analyzed, which occurred in October 2006, February 2010, and June 2018 in the Chalkidiki peninsula (North Greece). The Soil Conservation Service (SCS) model and a revised assessment of the CN parameter were applied to estimate the flood hydrographs, and Hydrologic Engineering Center’s-River Analysis System (HEC-RAS) software was used for the flood simulations. Initially, hydrological and hydraulic models were calibrated at Vatonias watershed (240.90 km2, North Greece), where three rain gauges and one water level station are located. Vatonias is located very close to the Stavros ungauged watersheds and presents similar geomorphology and land use conditions. The effectiveness and accuracy of the methodology were validated using post-flash-flood measurements. The root mean square error goodness of fit was used to compare the observed and simulated flood depths. Critical success index was calculated for the assessment of the accuracy of observed and modeled flooded areas. The results showed that the dense forest vegetation was not capable of preventing the flash flood generation or reducing the peak discharge, especially in small watersheds characterized by short concentration times. The main cause of flash flood generation was the human interference that influenced the hydraulic characteristics of streams and floodplains. The revised assessment of the CN parameter enhanced the estimation and spatial distribution of CN over the entire watershed. The results revealed that the proposed methodology could be a very useful tool to researchers and policy makers for flood risk assessment of higher accuracy and effectiveness in ungauged Mediterranean watersheds.

1. Introduction

Flash floods are natural phenomena that are an integral part of the hydrological cycle. Most of them are the result of intense meteorological conditions, but they are also influenced by other factors such as the relief, land uses, geomorphology, and human interference. In addition, flash floods are considered to be by far the most dangerous, frequent, and widespread worldwide phenomenon, especially in ephemeral streams [1,2,3]. These phenomena often generate serious negative consequences for humans, such as infrastructure, property, and crop destruction, with significant financial cost for repairs, restoration, and rehabilitation; sometimes human lives are even lost [4,5,6,7].
The continuously growing trend of flash flood phenomena and their devastating effects worldwide require the constant improvement of flood risk management and modeling [8,9]. In Greece, as in the rest area of Eastern Mediterranean area, the increased demand for agricultural land, the increasing value of land due to exploitation for touristic and real estate purposes, and the unregulated building of settlements with the tolerance of the state have led to the gradual trespass of torrents, the reduction of streambed width, and in some cases to their complete disappearance. Under these circumstances, the hydraulic characteristics of streams and floodplains have been altered dramatically and have resulted in the intensification of the flood phenomena [10,11,12,13]. The protective role of forests from flash flood generation is questionable, and according to previous research studies is very limited, indicating that forests have negligible effects on the reduction of peak discharge during extreme rainfall events [10,12,14,15].
Over the past years, considerable efforts have been made to estimate flood risk and simulate flood events, using hydrological and hydraulic models [16,17,18,19,20,21,22,23]. However, these models require the existence of large time series and reliable stream flow and rainfall data, which in most Mediterranean areas are unfortunately not available, especially for medium and small watersheds. To overcome these practical difficulties, post-flash-flood measurements could be considered very useful for the evaluation of the hydrological and hydraulic models by reproducing the flood events and comparing the observed flooded area and flood depth with the simulated version.
In the current study, three different flash floods episodes, which occurred in October 2006, February 2010, and June 2018, were analyzed. The flood events were simulated and the simulation results were compared with the post-flood measurements and flood depths of the flooded areas in order to evaluate and validate the hydrological and hydraulic models used in the current research work. Hydrological and hydraulic models were applied for four medium and small typical Mediterranean watersheds located in a highly touristic area of Greece, in Chalkidiki Peninsula, northern Greece. For the enhanced evaluation of hydrological and hydraulic models, a calibration and validation process were applied in a typical Mediterranean gauged watershed. The calibration of hydrological and hydraulic models was initially performed in the Vatonias watershed, which presents similar geomorphology and land use conditions as the watersheds in the Stavros area. The research examines the three specific flash flood events, since they caused uncountable damage to infrastructure (roads, bridges, etc.), buildings, vehicles, agricultural land, olive groves, and livestock deaths that cost millions of euros.
The objectives of the current research are: (i) the simulation of the aforementioned flood episodes using hydrological and hydraulic models, (ii) the evaluation of the accuracy of hydrological and hydraulic models comparing the results with the post-flash-flood measurements values, (iii) the calibration of the hydrological and hydraulic models in typical Mediterranean area conditions, and (iv) the increase of knowledge on the relation between the flood risk and the human interference in ephemeral torrents in the Mediterranean area.

2. Materials and Methods

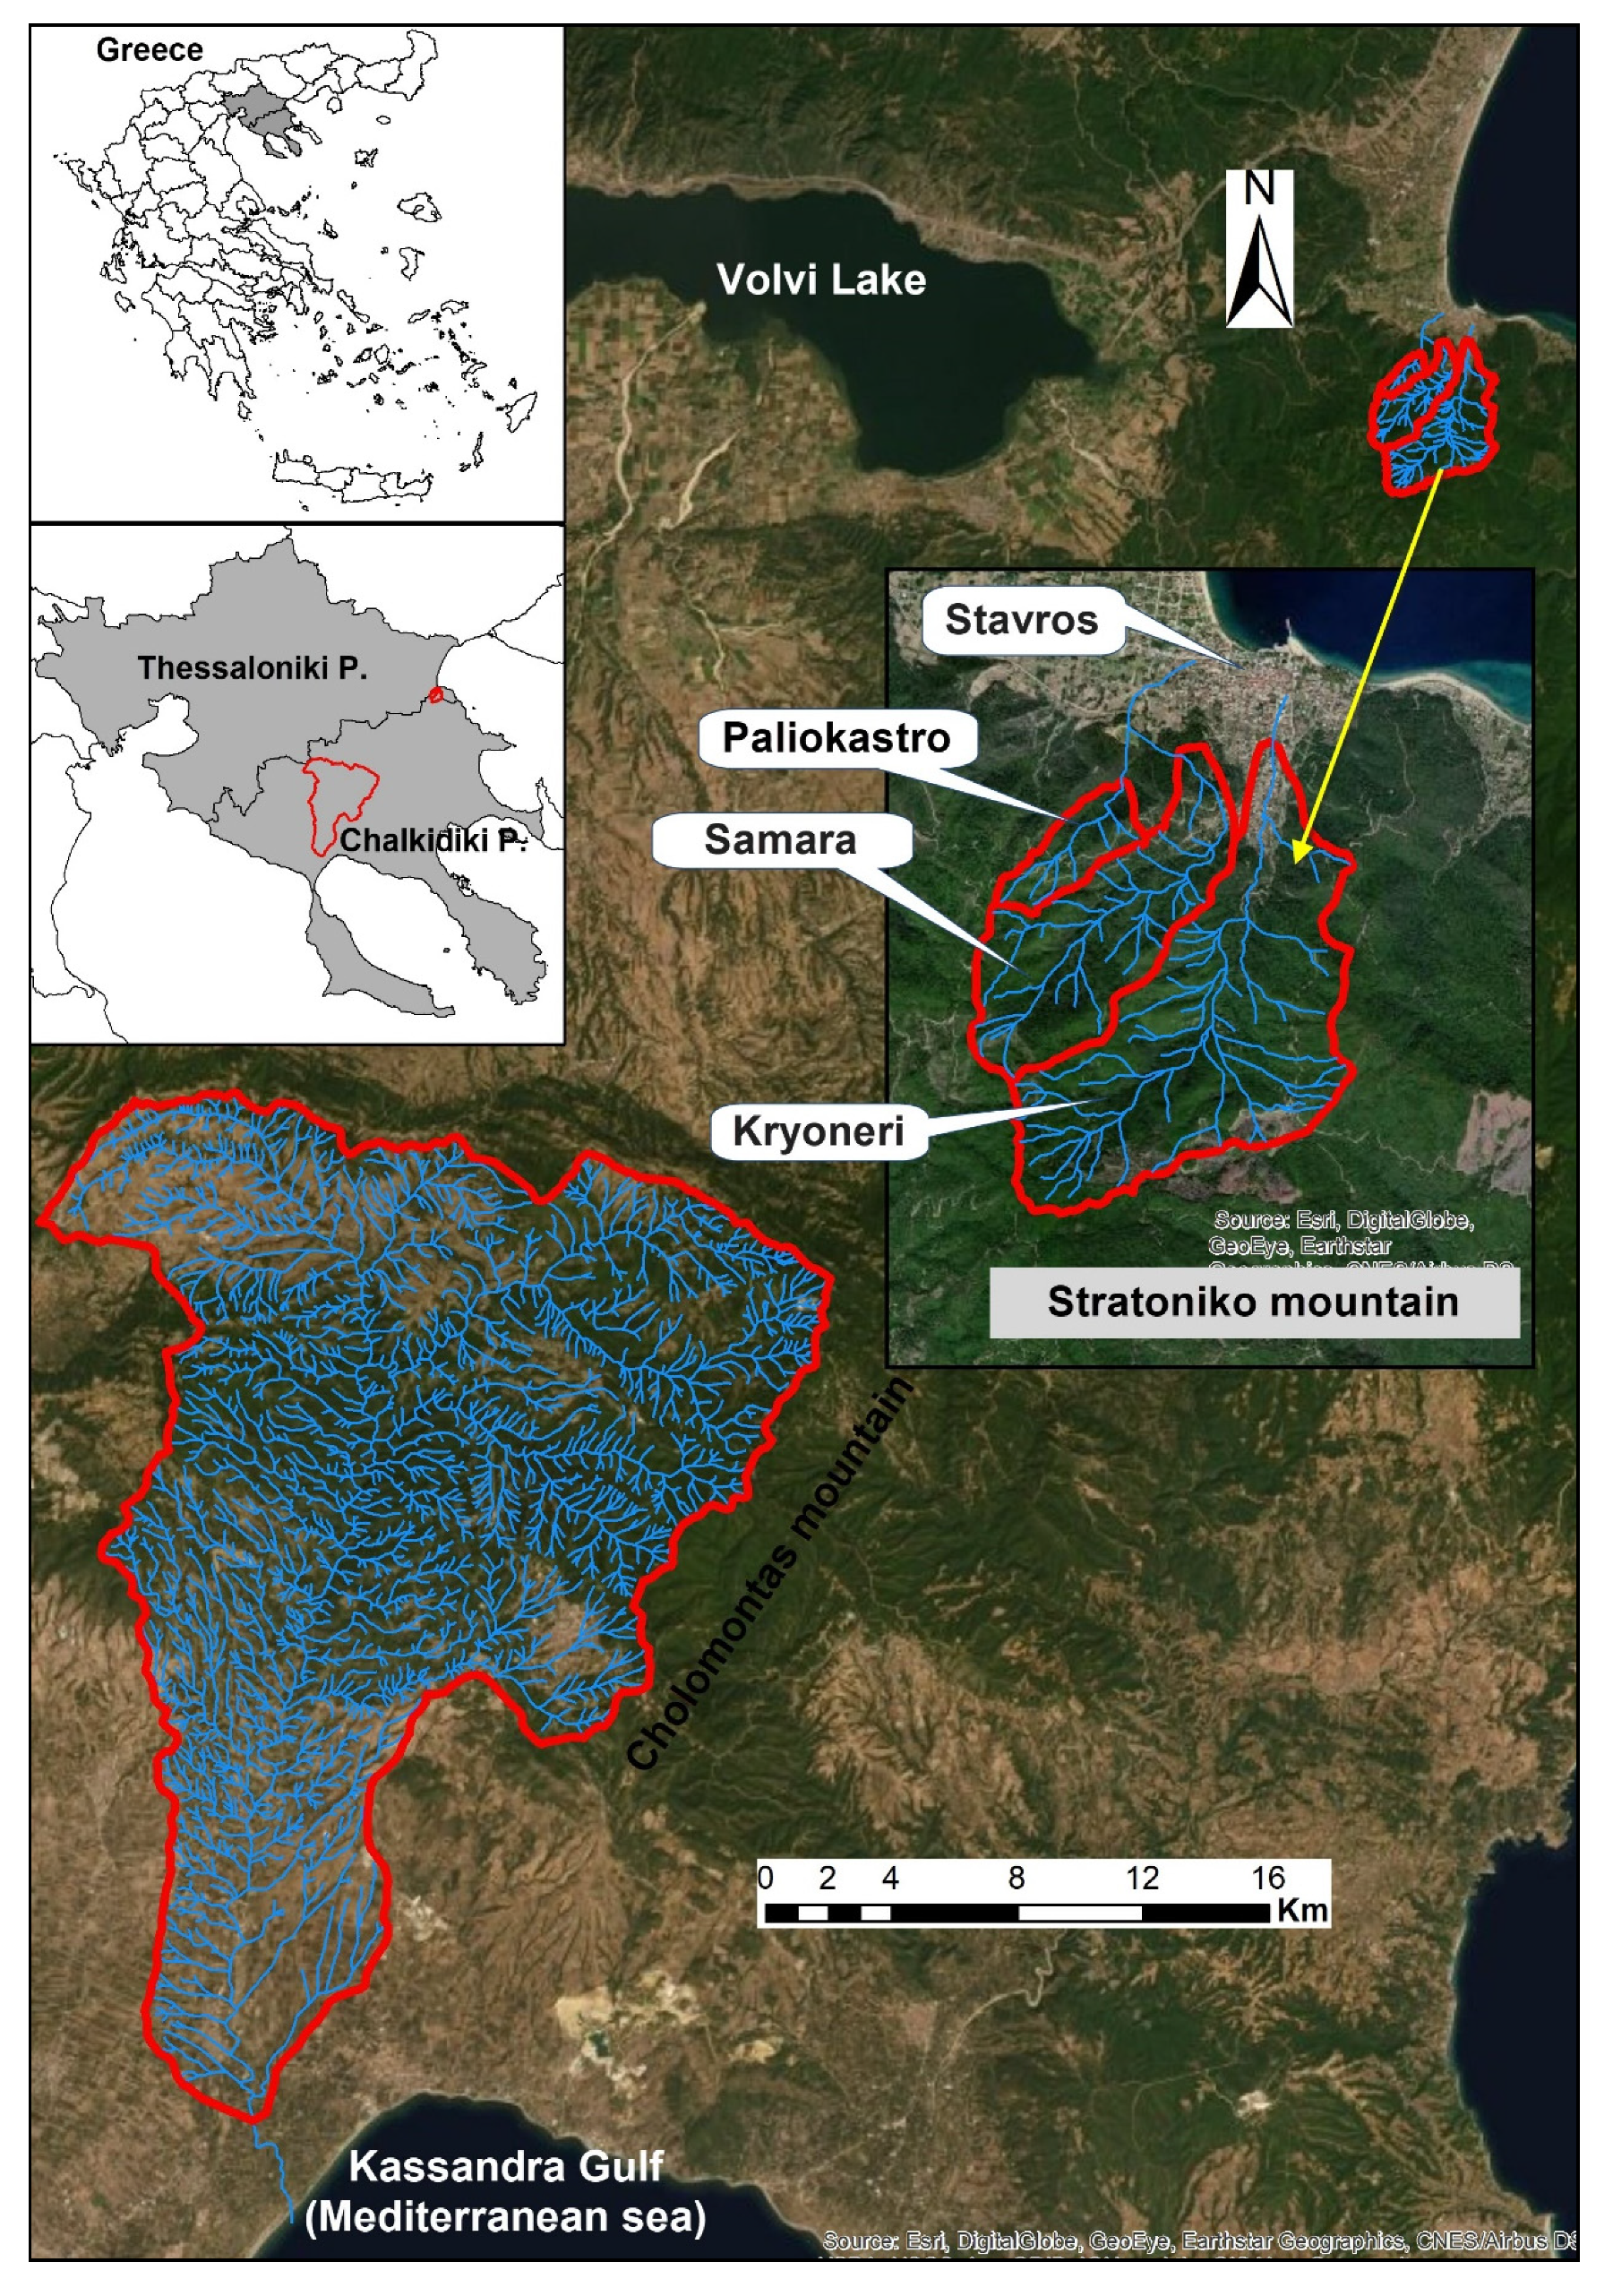
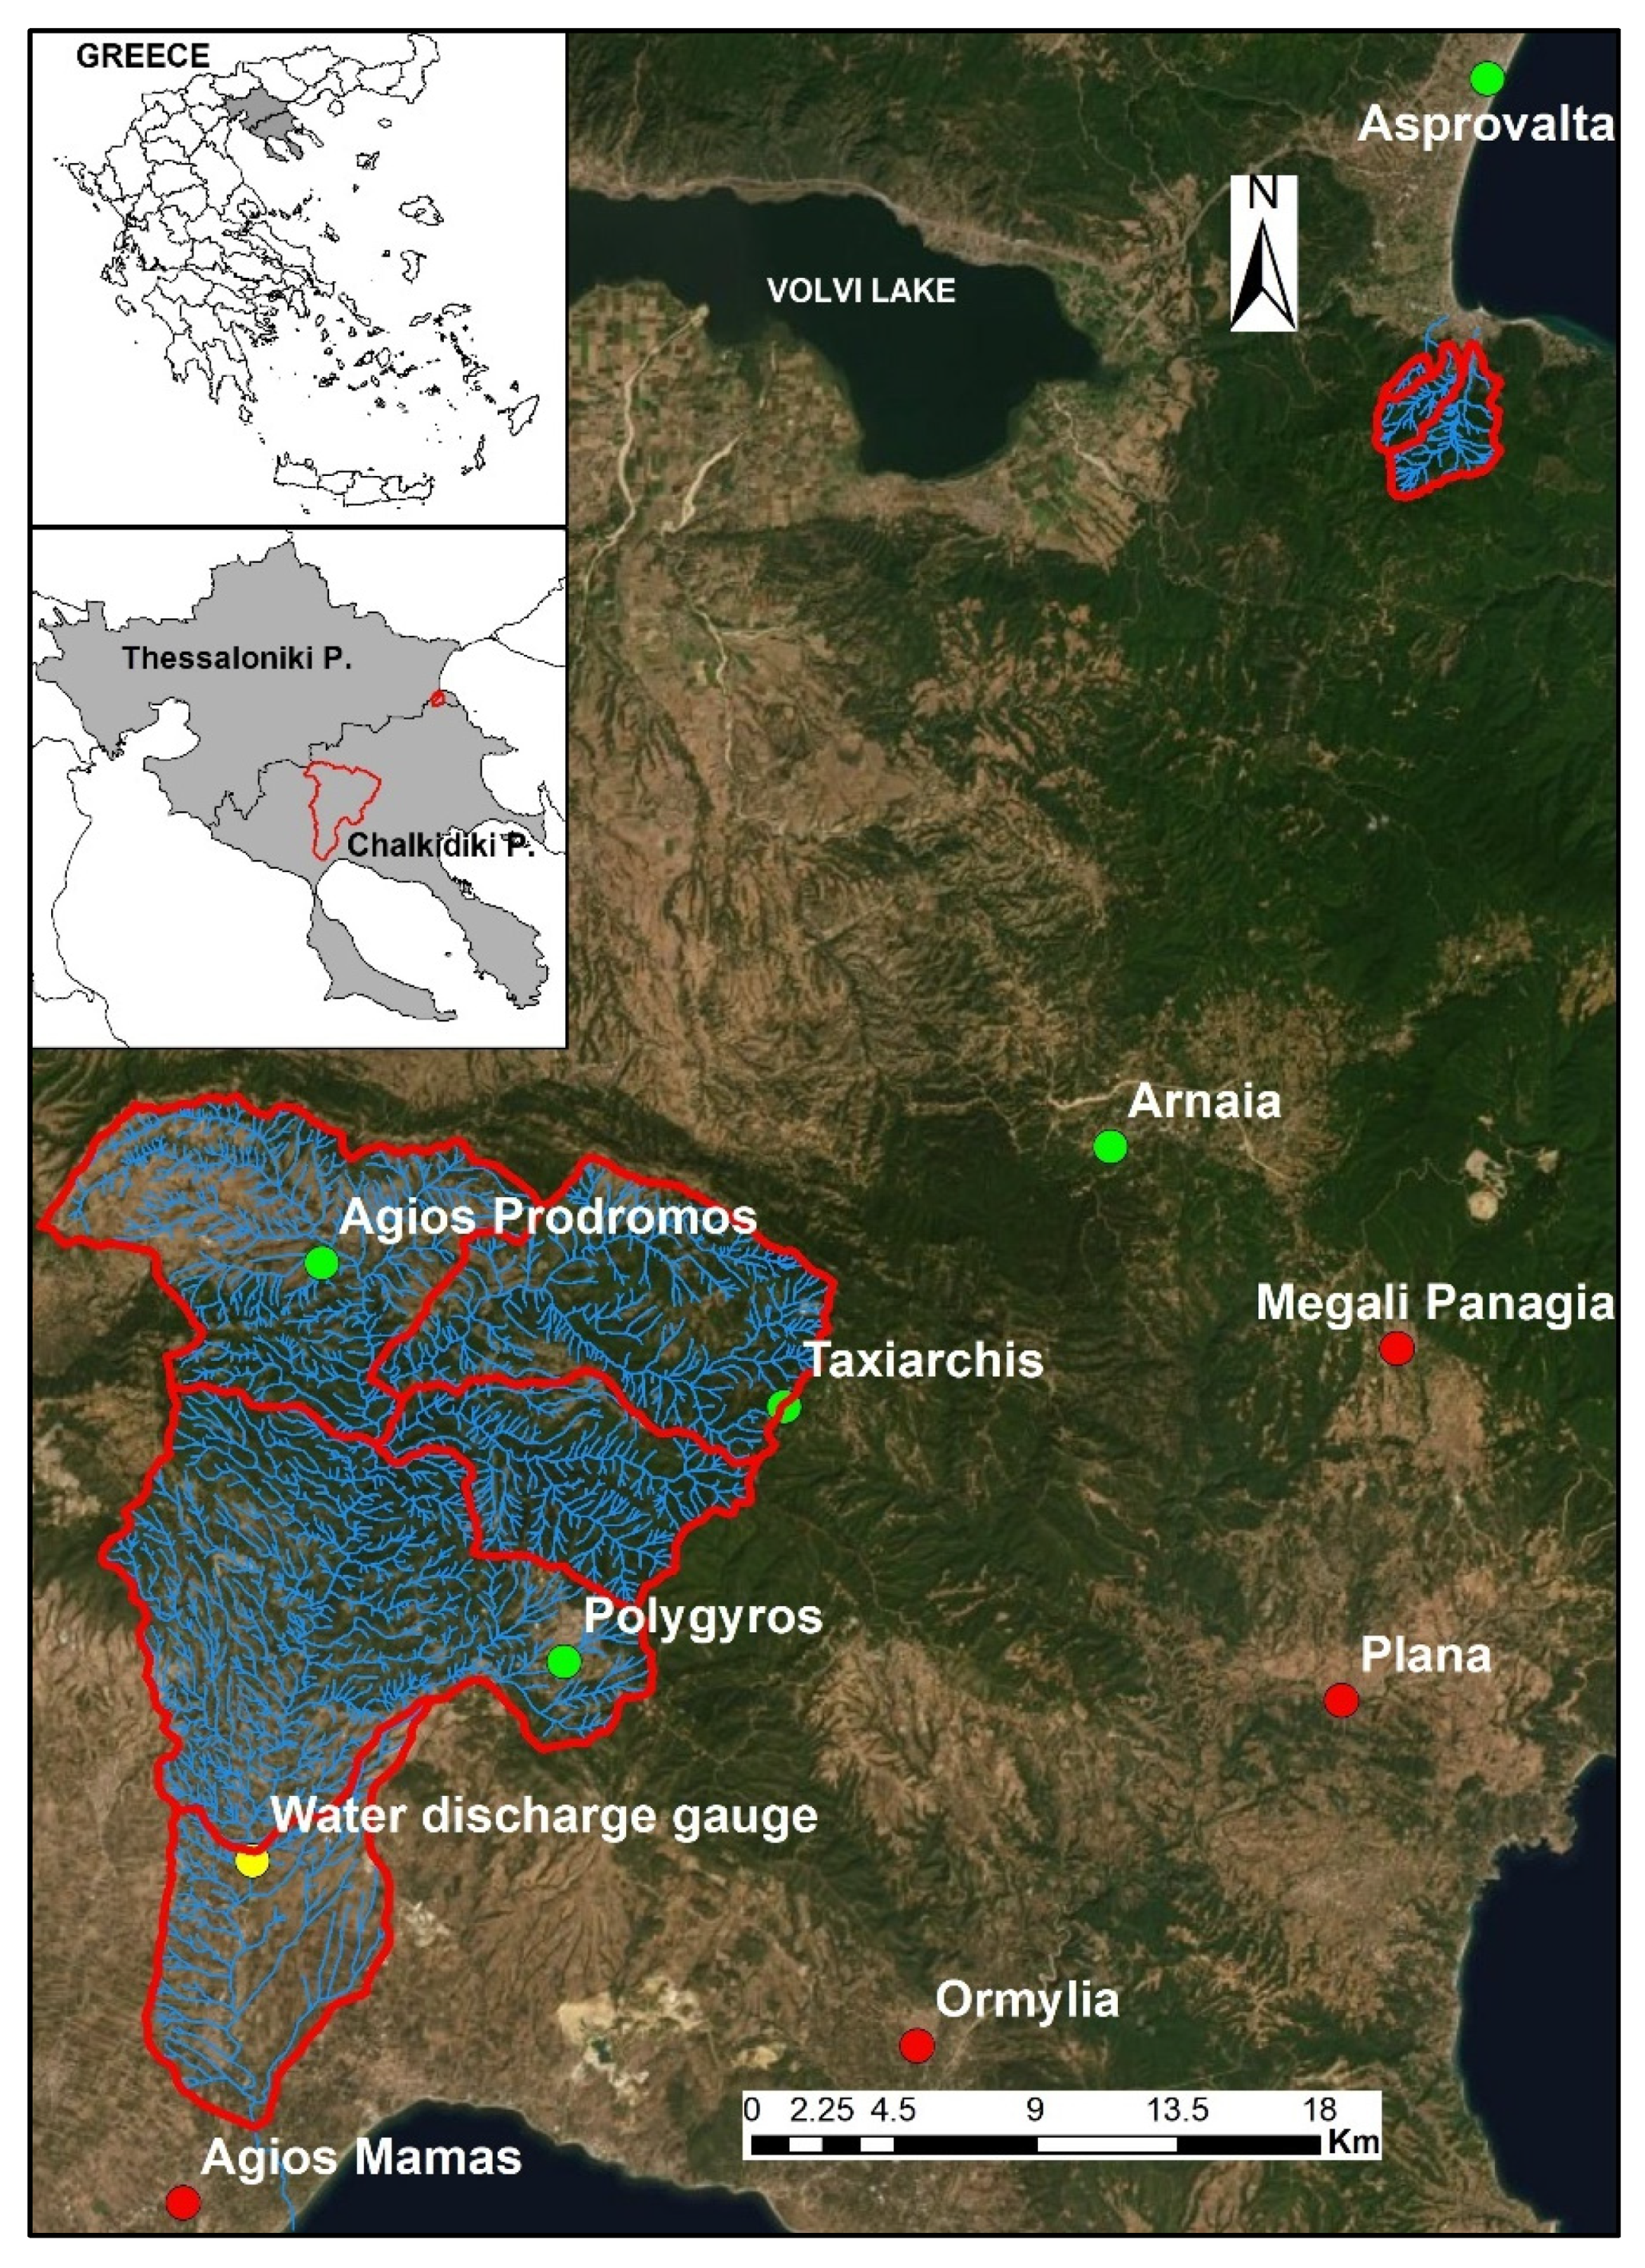
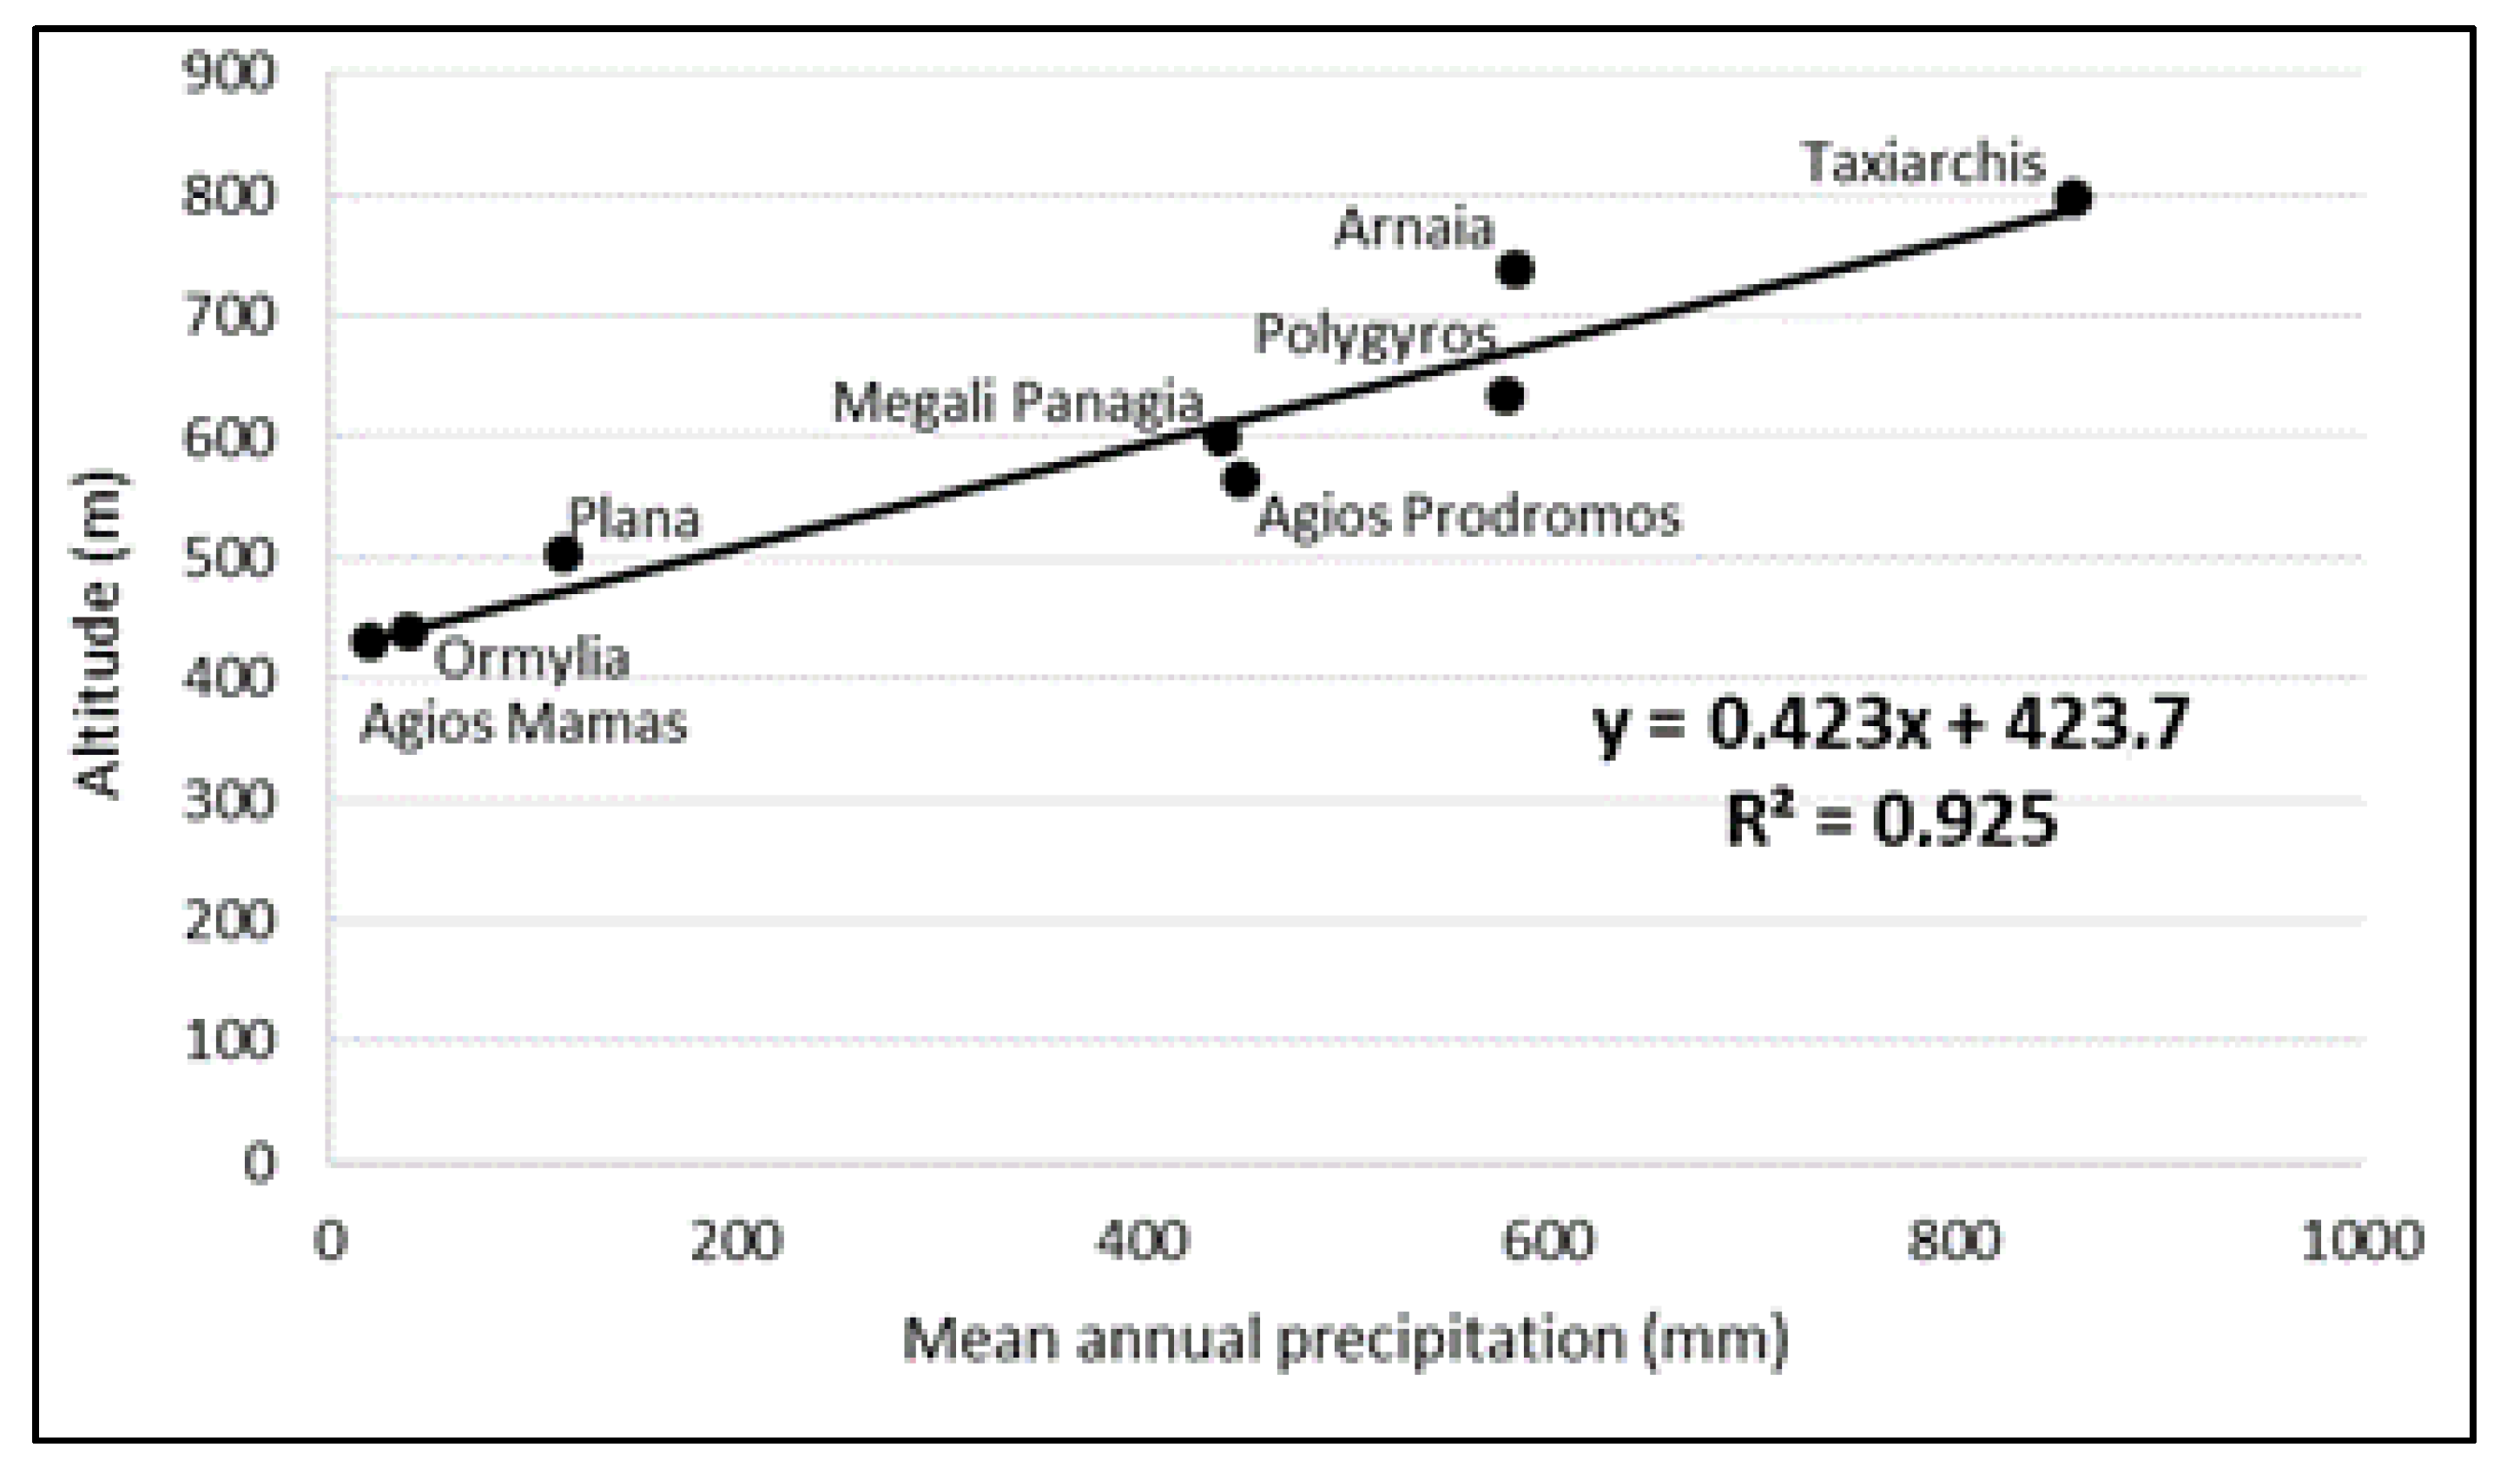
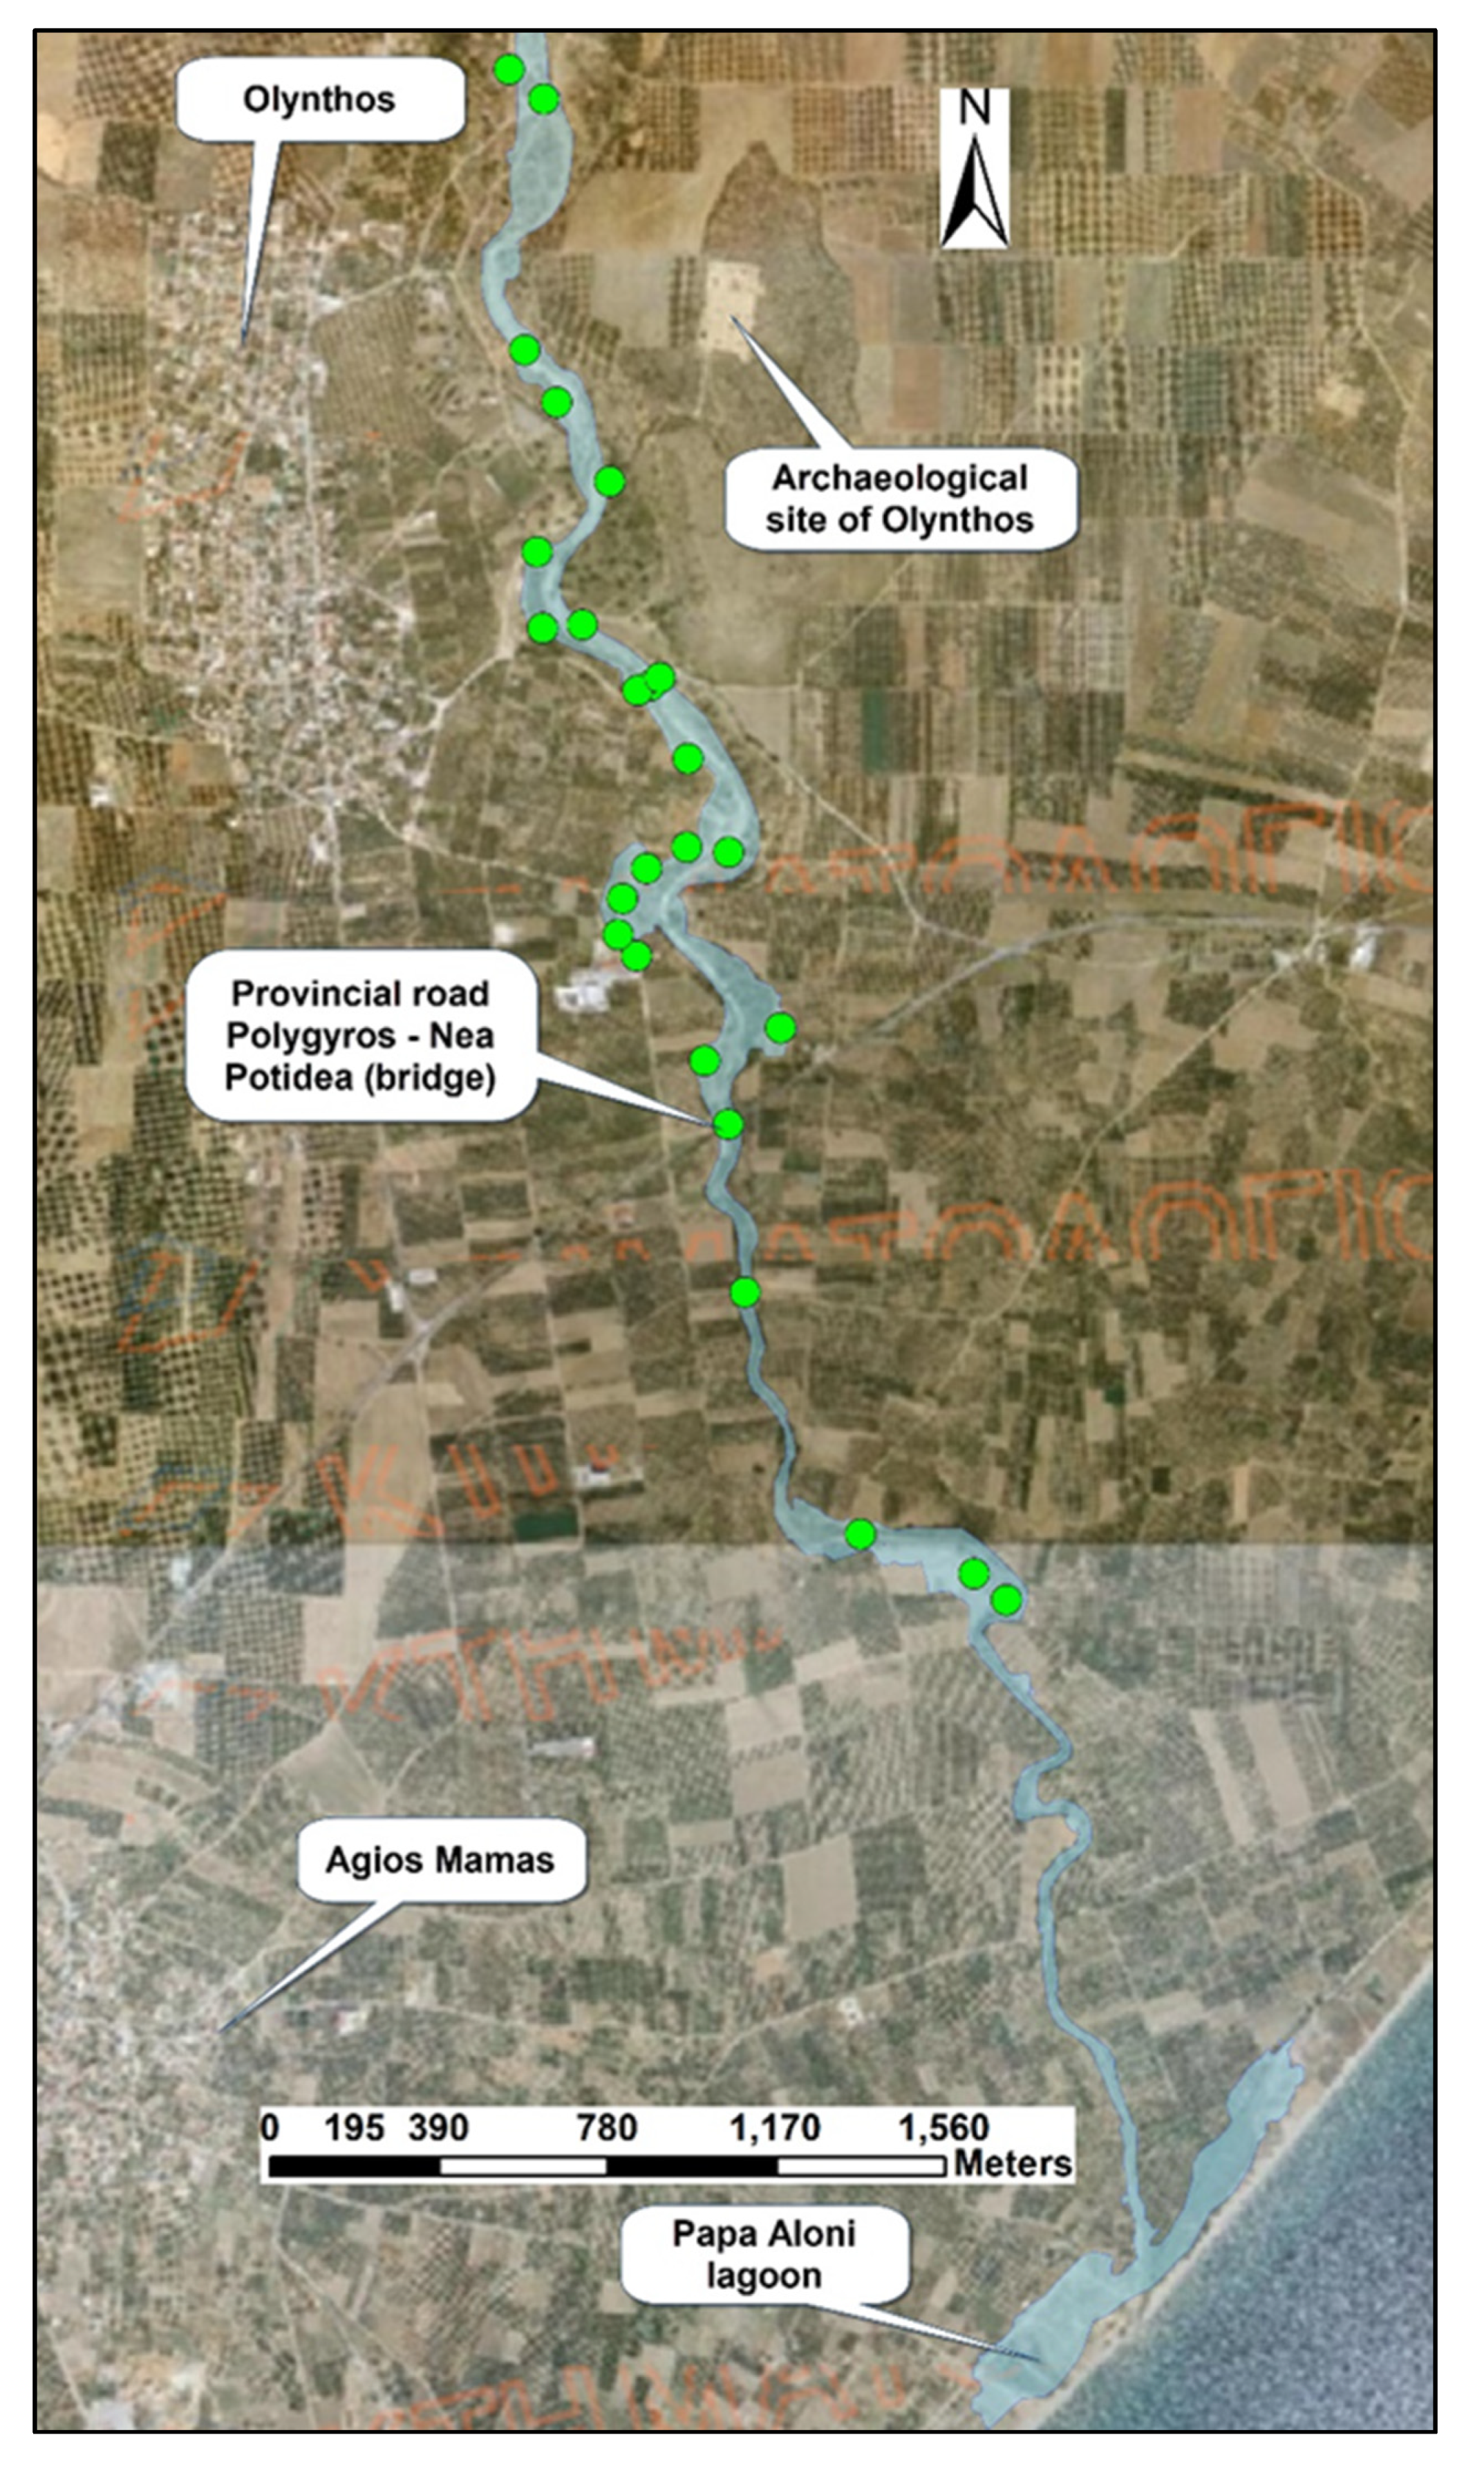
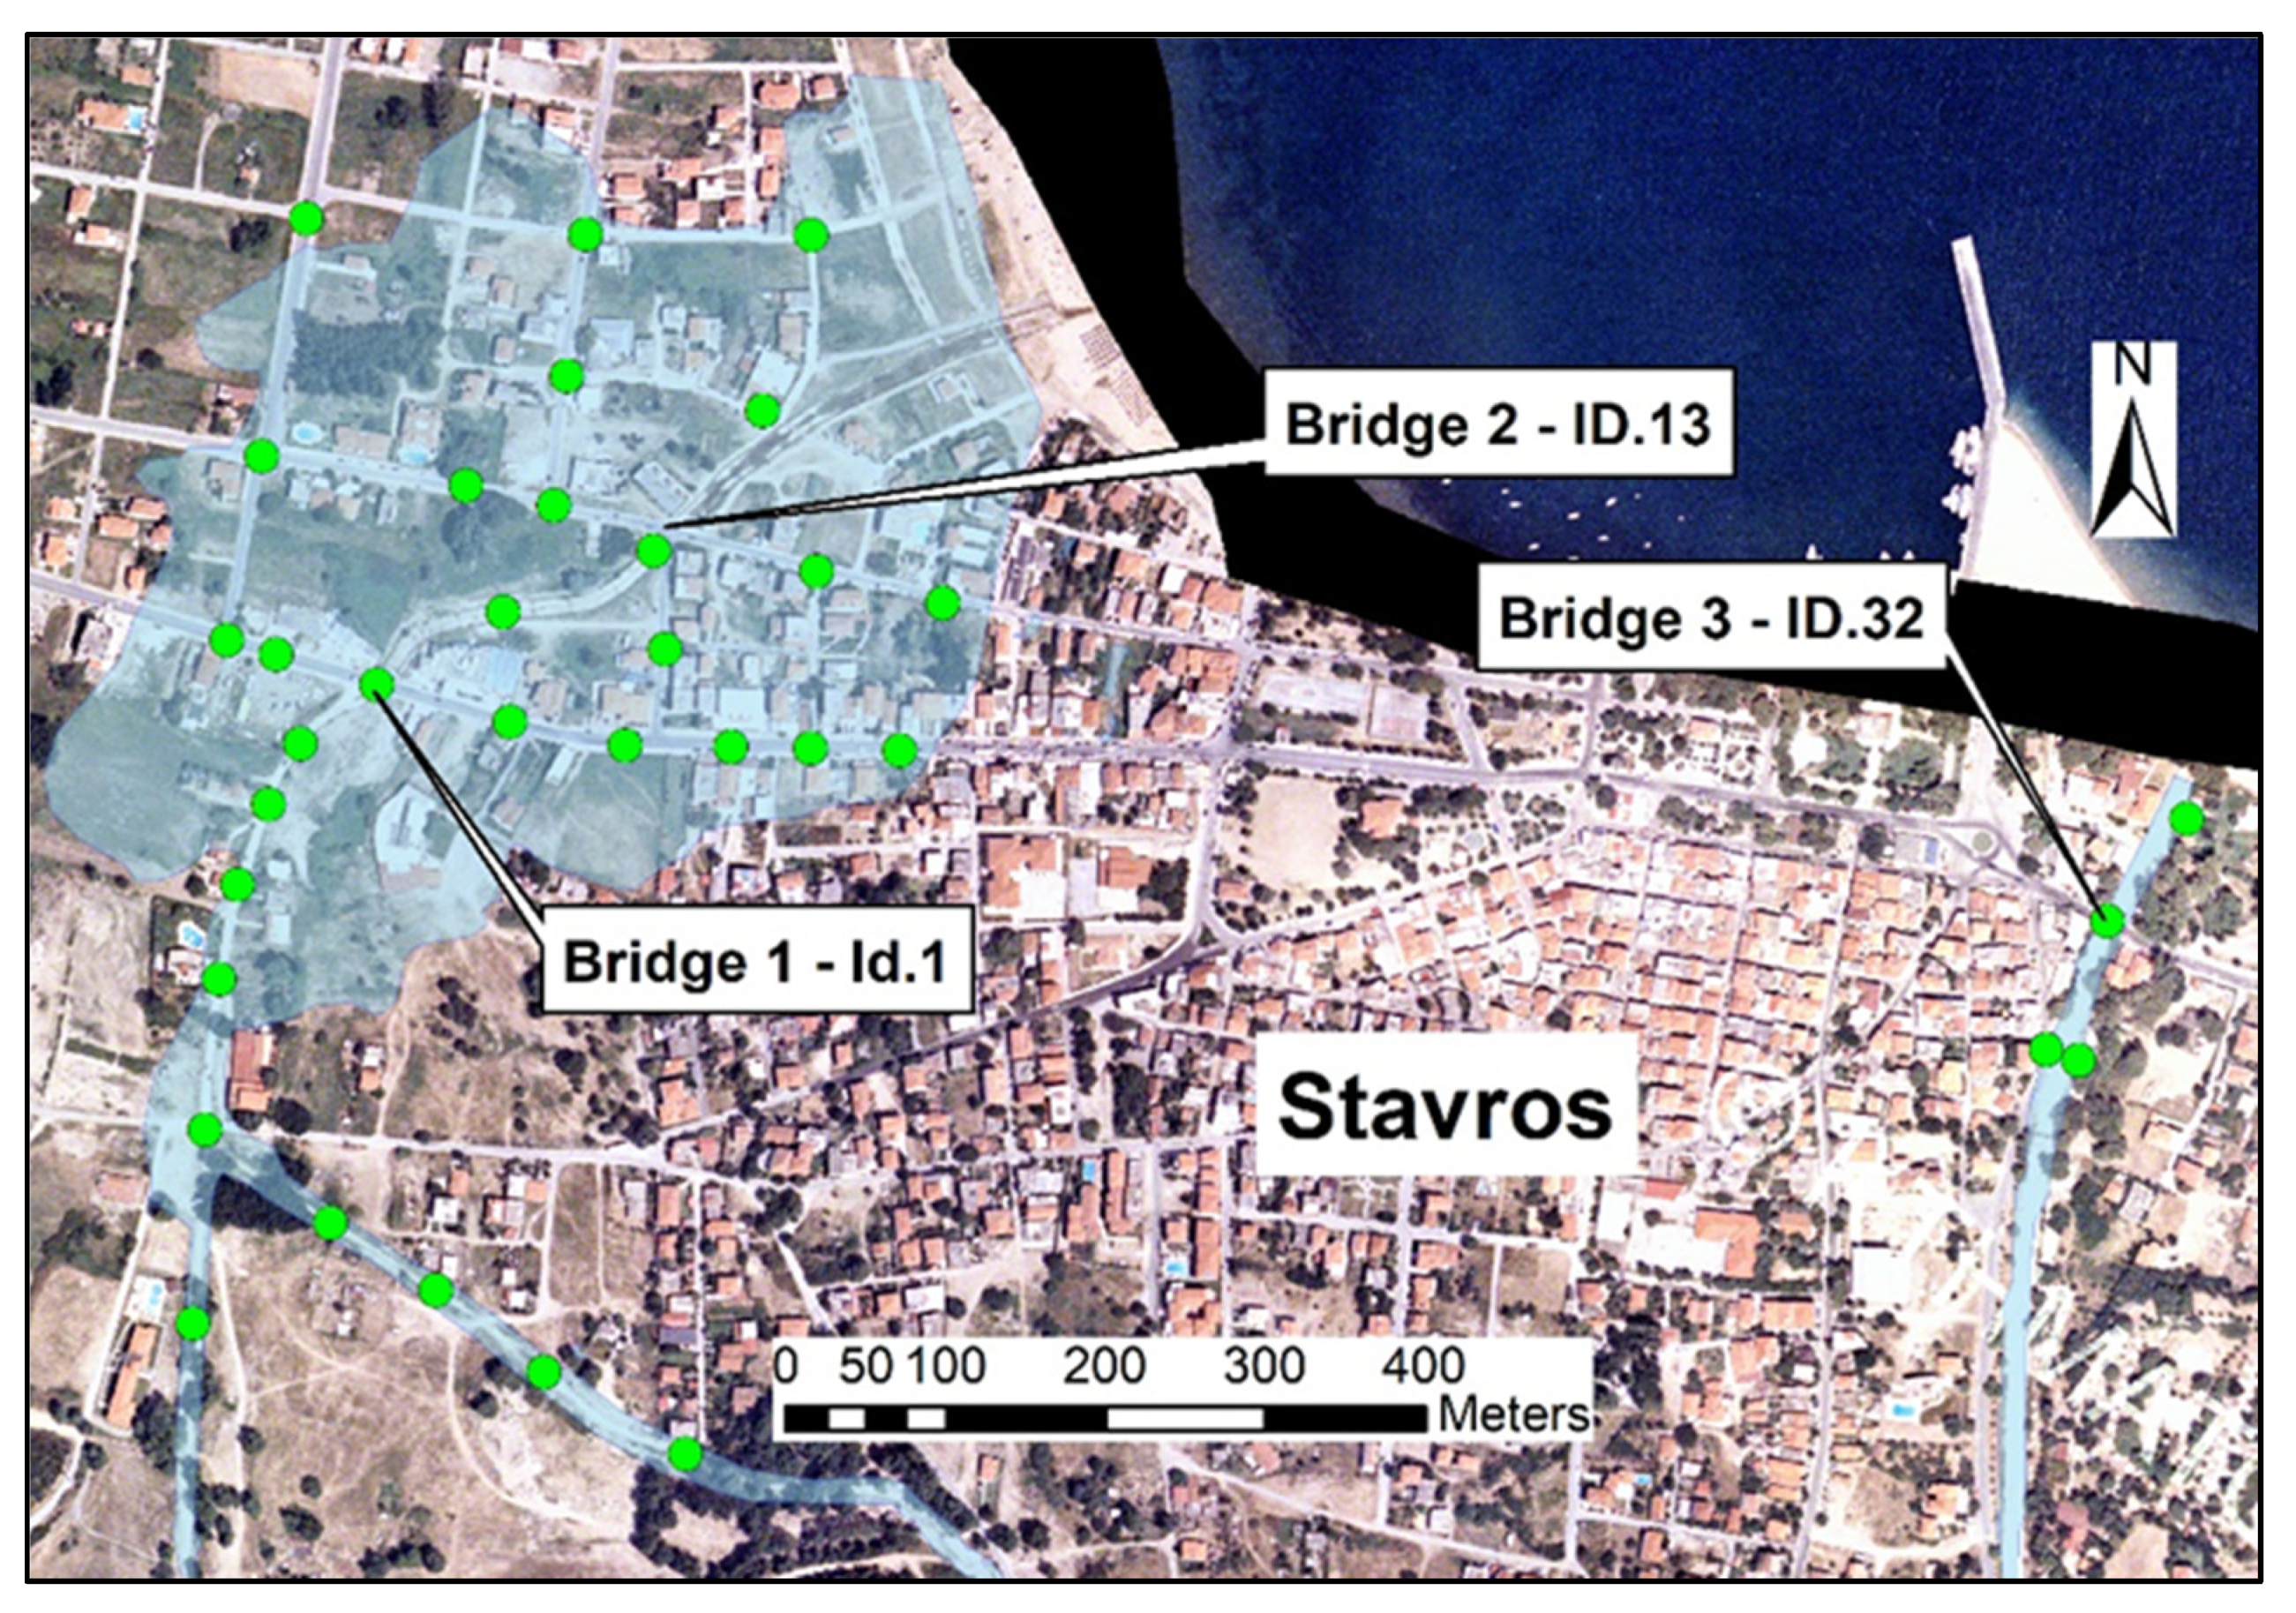
2.1. Watersheds Description

Hydrological and hydraulic models were applied in four typical Mediterranean watersheds (Vatonias, Kryoneri, Samara, and Paliokastro). Vatonias is the first watershed, in which the calibration process of the models was carried out, and is located in the central area of Chalkidiki Peninsula (North Greece). The Vatonias basin area is 240.90 km2 and the sources of the main stream are located in the Cholomontas mountain range at 1161 m above sea level. The main stream flows in a southwest direction for about 32.4 km, passes very close to the Olynthos settlement, and flows into the Kassandra gulf (Mediterranean Sea) (Figure 1). The relief of the watershed could be characterized as relatively steep, with an average slope of 20.91%, but with considerable differentiation between the floodplain and the areas above 500 m altitude. The dominant geological formation of the basin is semi-metamorphic rocks of Triassic-middle Jurassic periods (quartzites and phyllites), which are rocks that are impermeable to water and of considerable thickness (up to 500 m). Additionally, there are Mesozoic metamorphic rocks (epigneiss, gabbro, dunites, peridotites) that respond to water infiltration as an impermeable formation. A significant area is covered by Neogene formations of the upper Miocene-lower Pliocene (red clay series, basal conglomerates series), which present medium to high permeability, as well as sedimentary rocks of the Quaternary-Holocene (alluvial deposits), characterized by high permeability to water. Regarding the land uses, Vatonias basin contains typical Mediterranean vegetation, in which sclerophyllous vegetation is the dominant type (39%), while agriculture areas represent 30% of the total (crops represent 17.5% and olive groves 12.5%), followed by broad-leaved forests (15.30%).
Kryoneri, Samara, and Paliokastro watersheds are located in the northeast of the Vatonias basin (southeast area of Thessaloniki prefecture), at a distance of approximately 30 km (Figure 1). These three basins form one single floodplain, where the significant touristic destination of Stavros settlement is located. According to the Greek Census Report (2011), the permanent residents of Stavros settlement number 4468, but during the summer months the population is particularly high. In the past, the three torrents have been flooded several times, causing serious destruction, with the most recent and significant one being the flash flood of June 2018. The Kryoneri torrent flows from the south to the north, passes through the settlement of Stavros from the east side, and flows into the Strymonikos gulf (Mediterranean Sea), while on the west side of the settlement flow two torrents, namely Samara and Paliokastro, which contribute to one stream west of the settlement that flows into the Strymonikos gulf. The mean slope of the area exceeds 50% and could be characterized as extremely intense, a fact that significantly contributes to the phenomenon of rapid air mass concentration. Over 90% of the watershed area is covered by broad-leaved forest, while the dominant rock of the area is gneiss, exceeding 90% of the total. Despite the significant presence of forest area in the watersheds, the described physical conditions of the study area can be considered as favorable to the generation of flash flood events.
Based on the available meteorological data, the climate of the region could be characterized as a typical Mediterranean climate, with very dry and warm summers and relatively mild winters. Most of the precipitation is distributed in the Cholomontas and Stratoniko mountain ranges, while the intense relief of the mountains causes rapid condensation of humidity and warm air masses, which are transported from the Aegean Sea, causing frequent and severe flash flood events. The mean annual rainfall ranges from 430 to 800 mm, with a maximum in autumn and a secondary peak in spring.

2.2. Floodplain Delineation

The Vatonias floodplain consists of Quaternary-Holocene sedimentary rocks, which are mainly alluvial deposits. Alluvial deposits consist of sand, grit, clay, terra rossa, gravel, and cobble in various gradation and ranging proportions, resulting from the gradual degradation, erosion, and leaching of Neogene formations. Alluvial deposits are formations in lowland areas, valleys, and floodplains, with considerable thickness and extended surface development, which present frequent and rapid changes in their lithological composition and grain size distribution towards their horizontal and vertical development. They are characterized by high erodibility and medium to high permeability. There are sediments typical of coastal lakes and lagoons present to a lesser extent, which are located at the seafront on either side of the main stream. The dominant type of land use in the floodplain is the cultivation of olive groves. There are numerous oil mills and livestock farms, and very close to Vatonias torrent, Olynthos settlement is located. At a distance of 3 km before the main stream flows into the Mediterranean Sea, Vatonias presents a dramatical decrease in its width, with a parallel reduction of mean slope of less than 1%, caused by the intense human activity and exploitation of the area as cultivation land. Furthermore, adjacent to the coast line there are numerous touristic infrastructures.
The Stavros floodplain consists of Quaternary-Holocene sedimentary rocks, mainly alluvial fans that are characterized by medium to high permeability. The intense residential development of the previous years and the high demand for touristic infrastructures has formed the main characteristics of the area; almost all the area of the floodplain is covered by building construction. As a result, the natural dimensions of the streams and stream paths have changed significantly, especially in the last 60 years, creating extremely favorable conditions for flood generation.

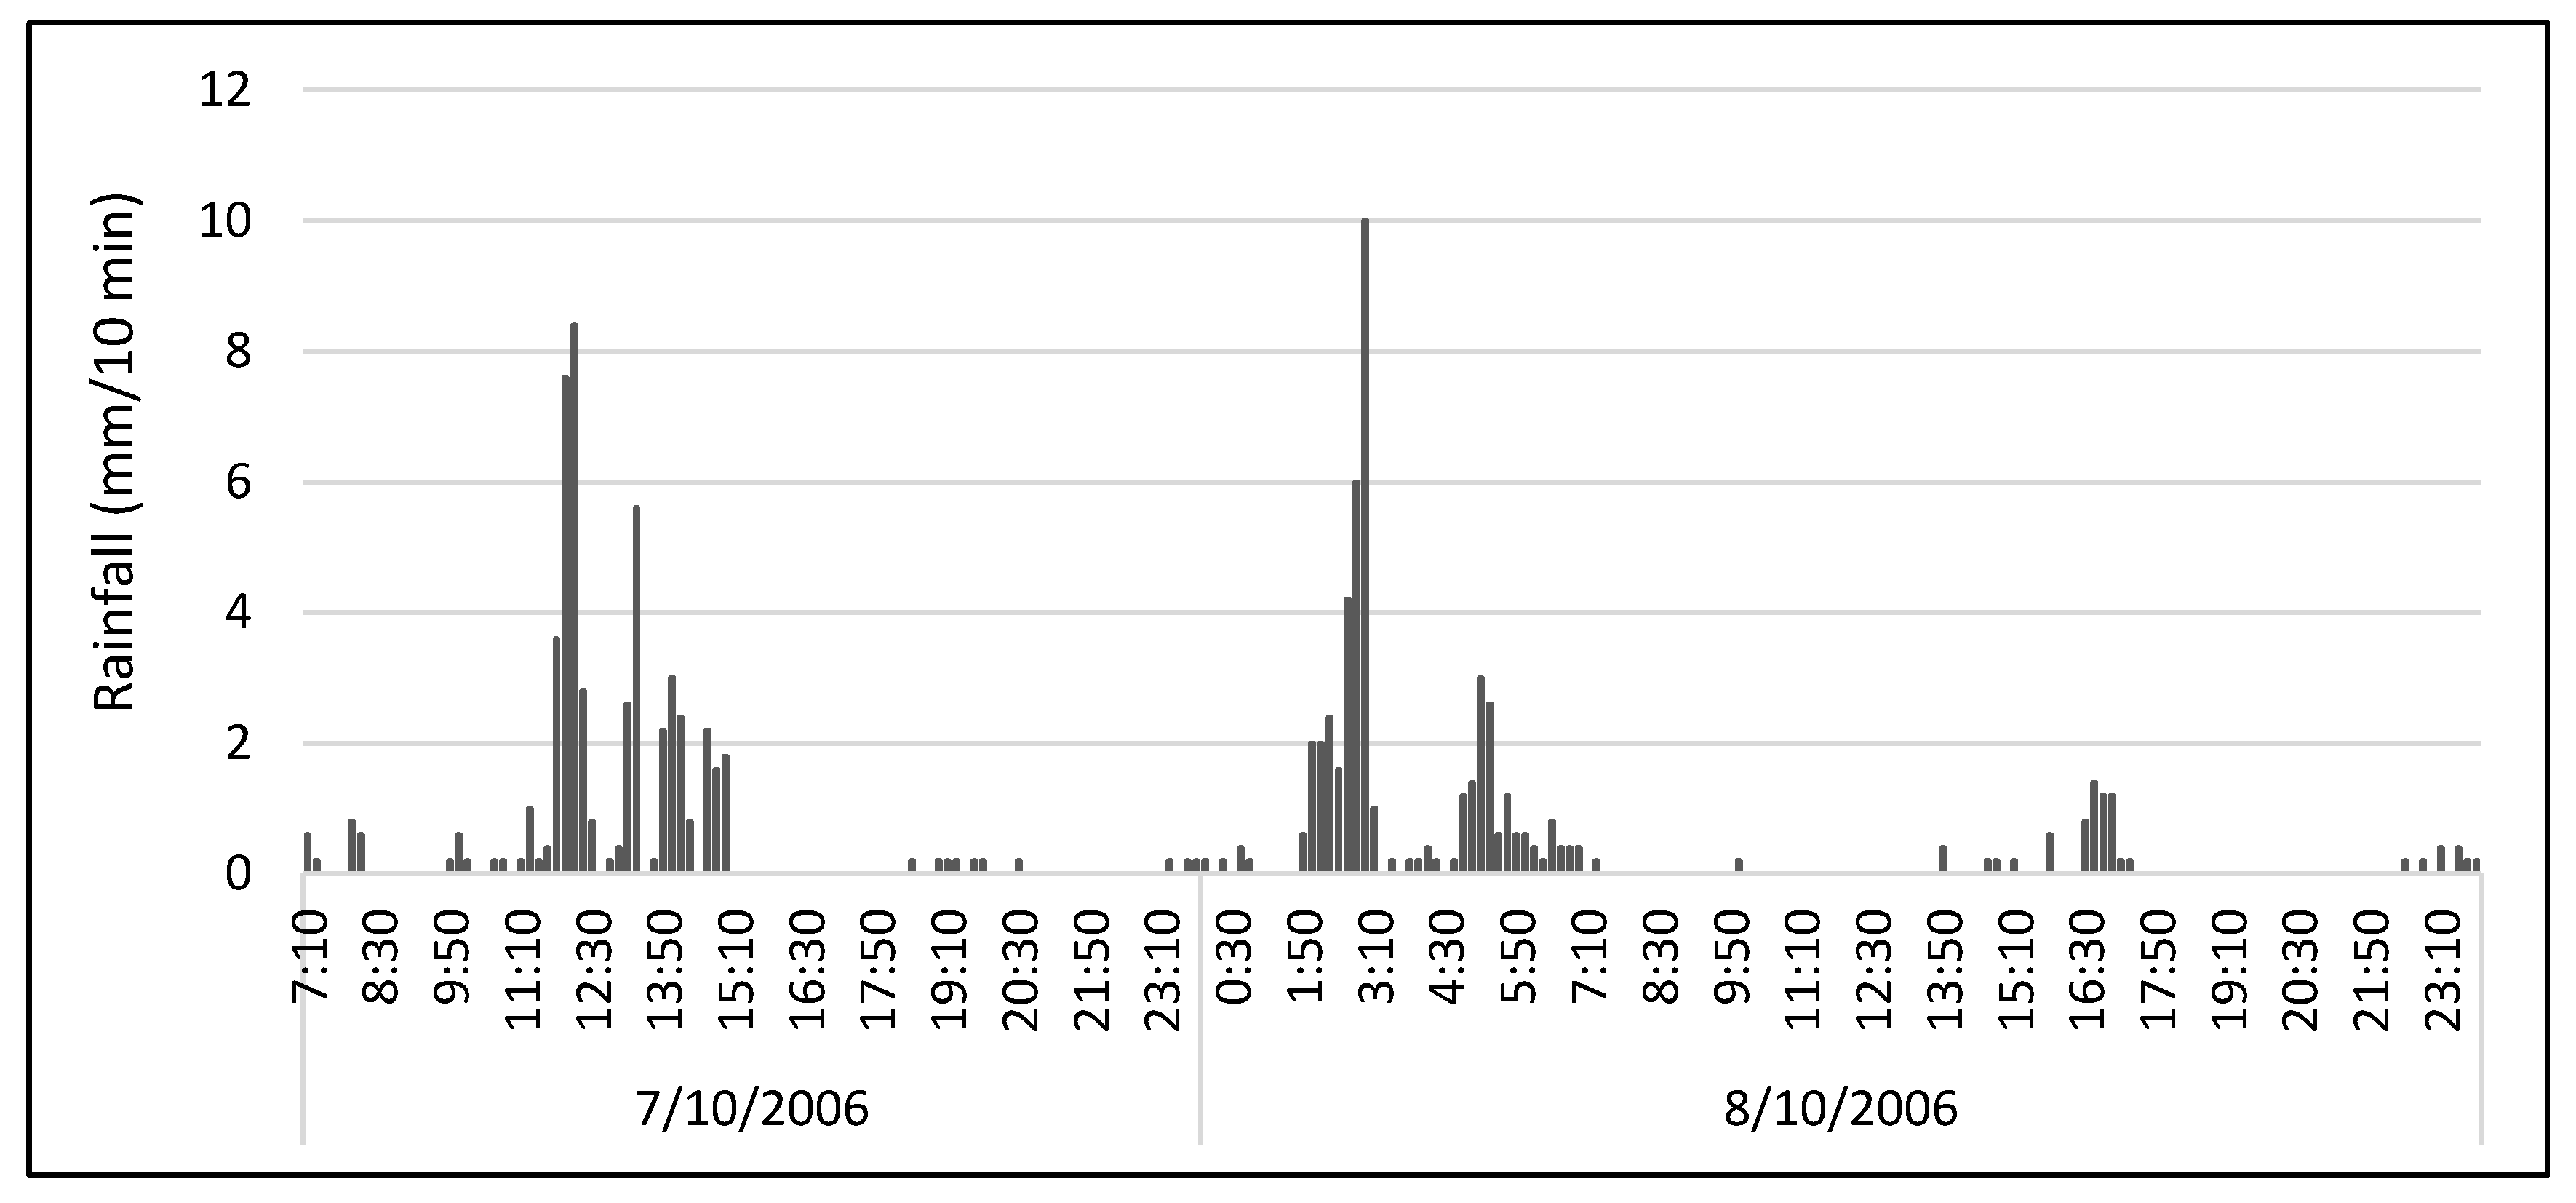
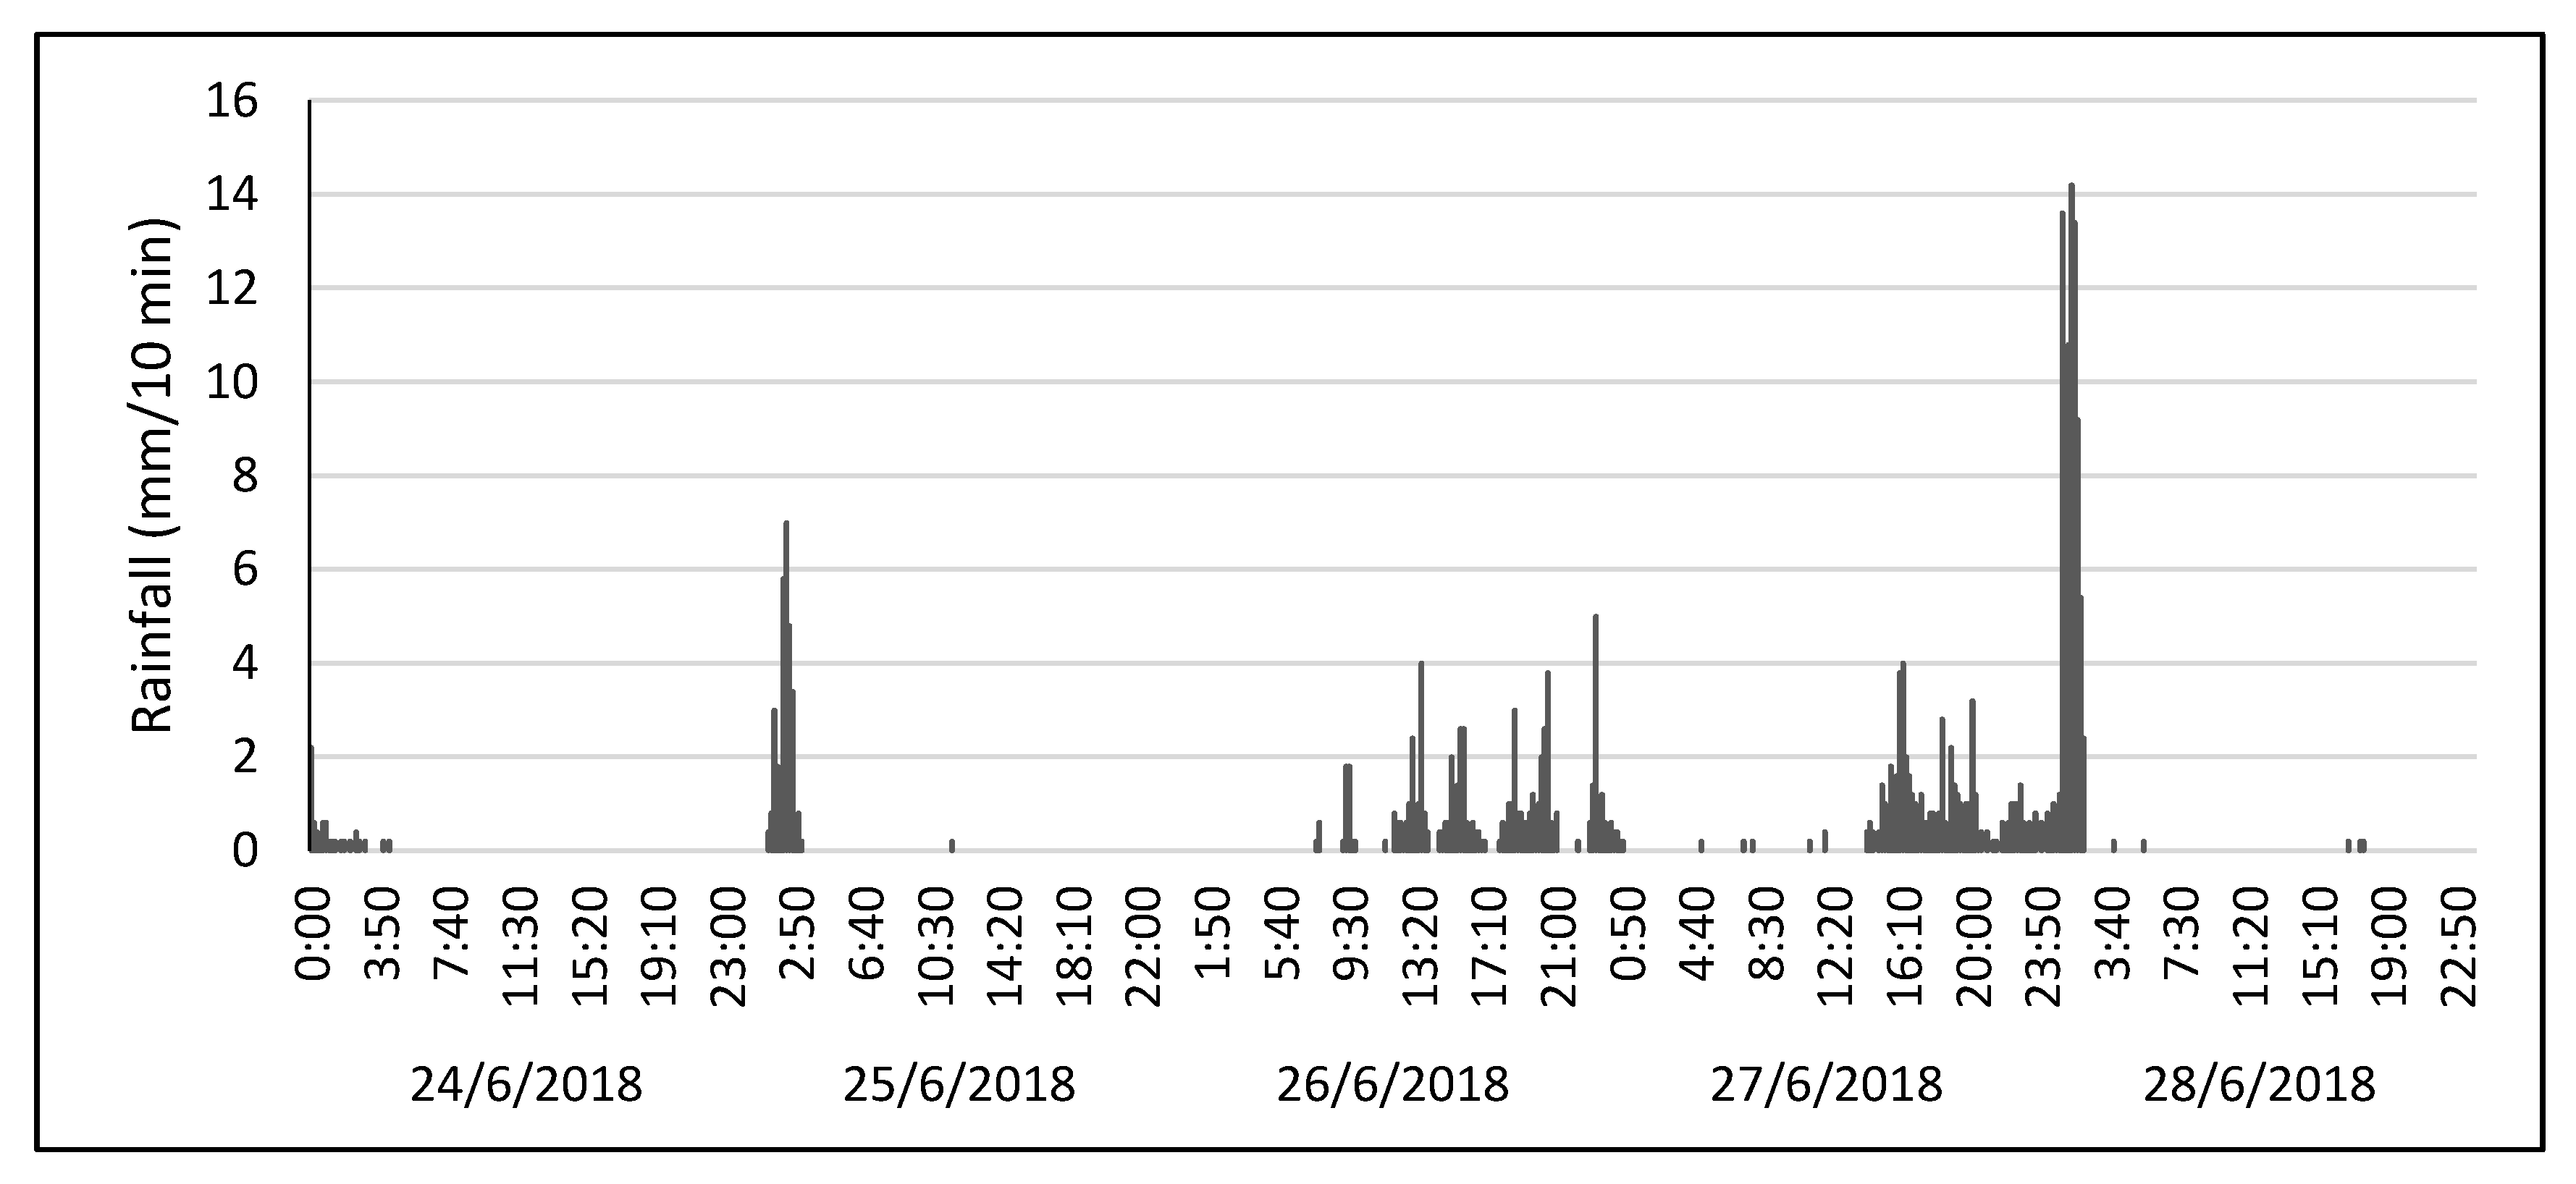
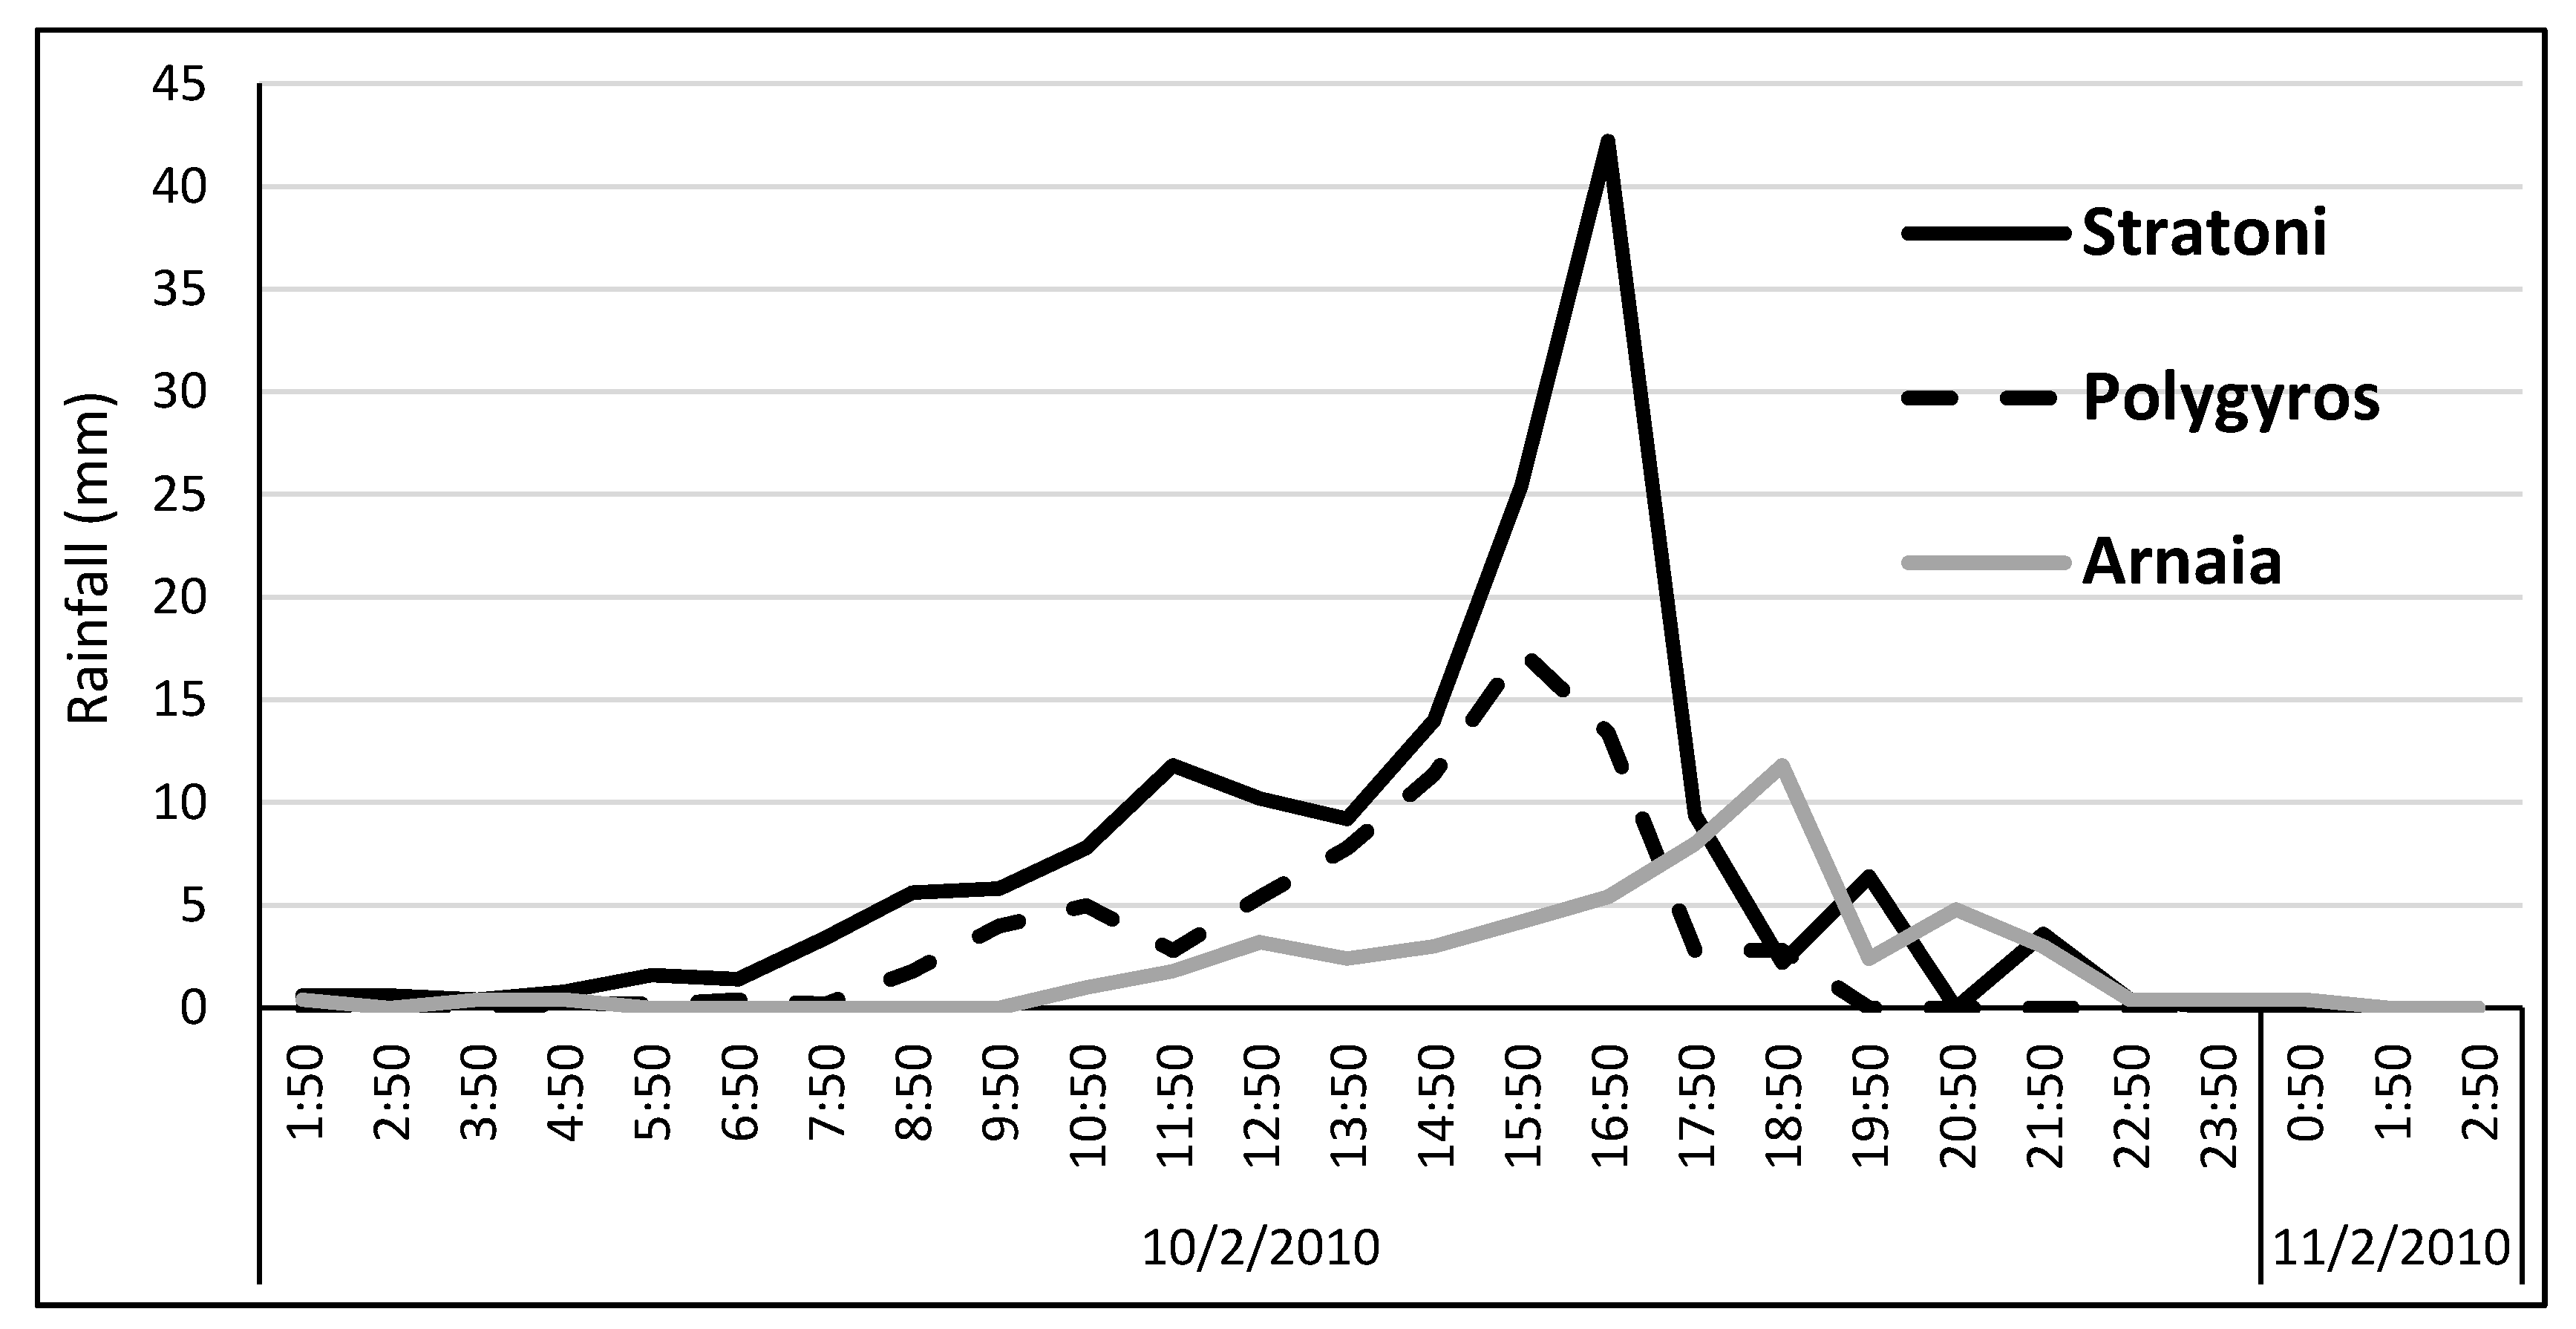
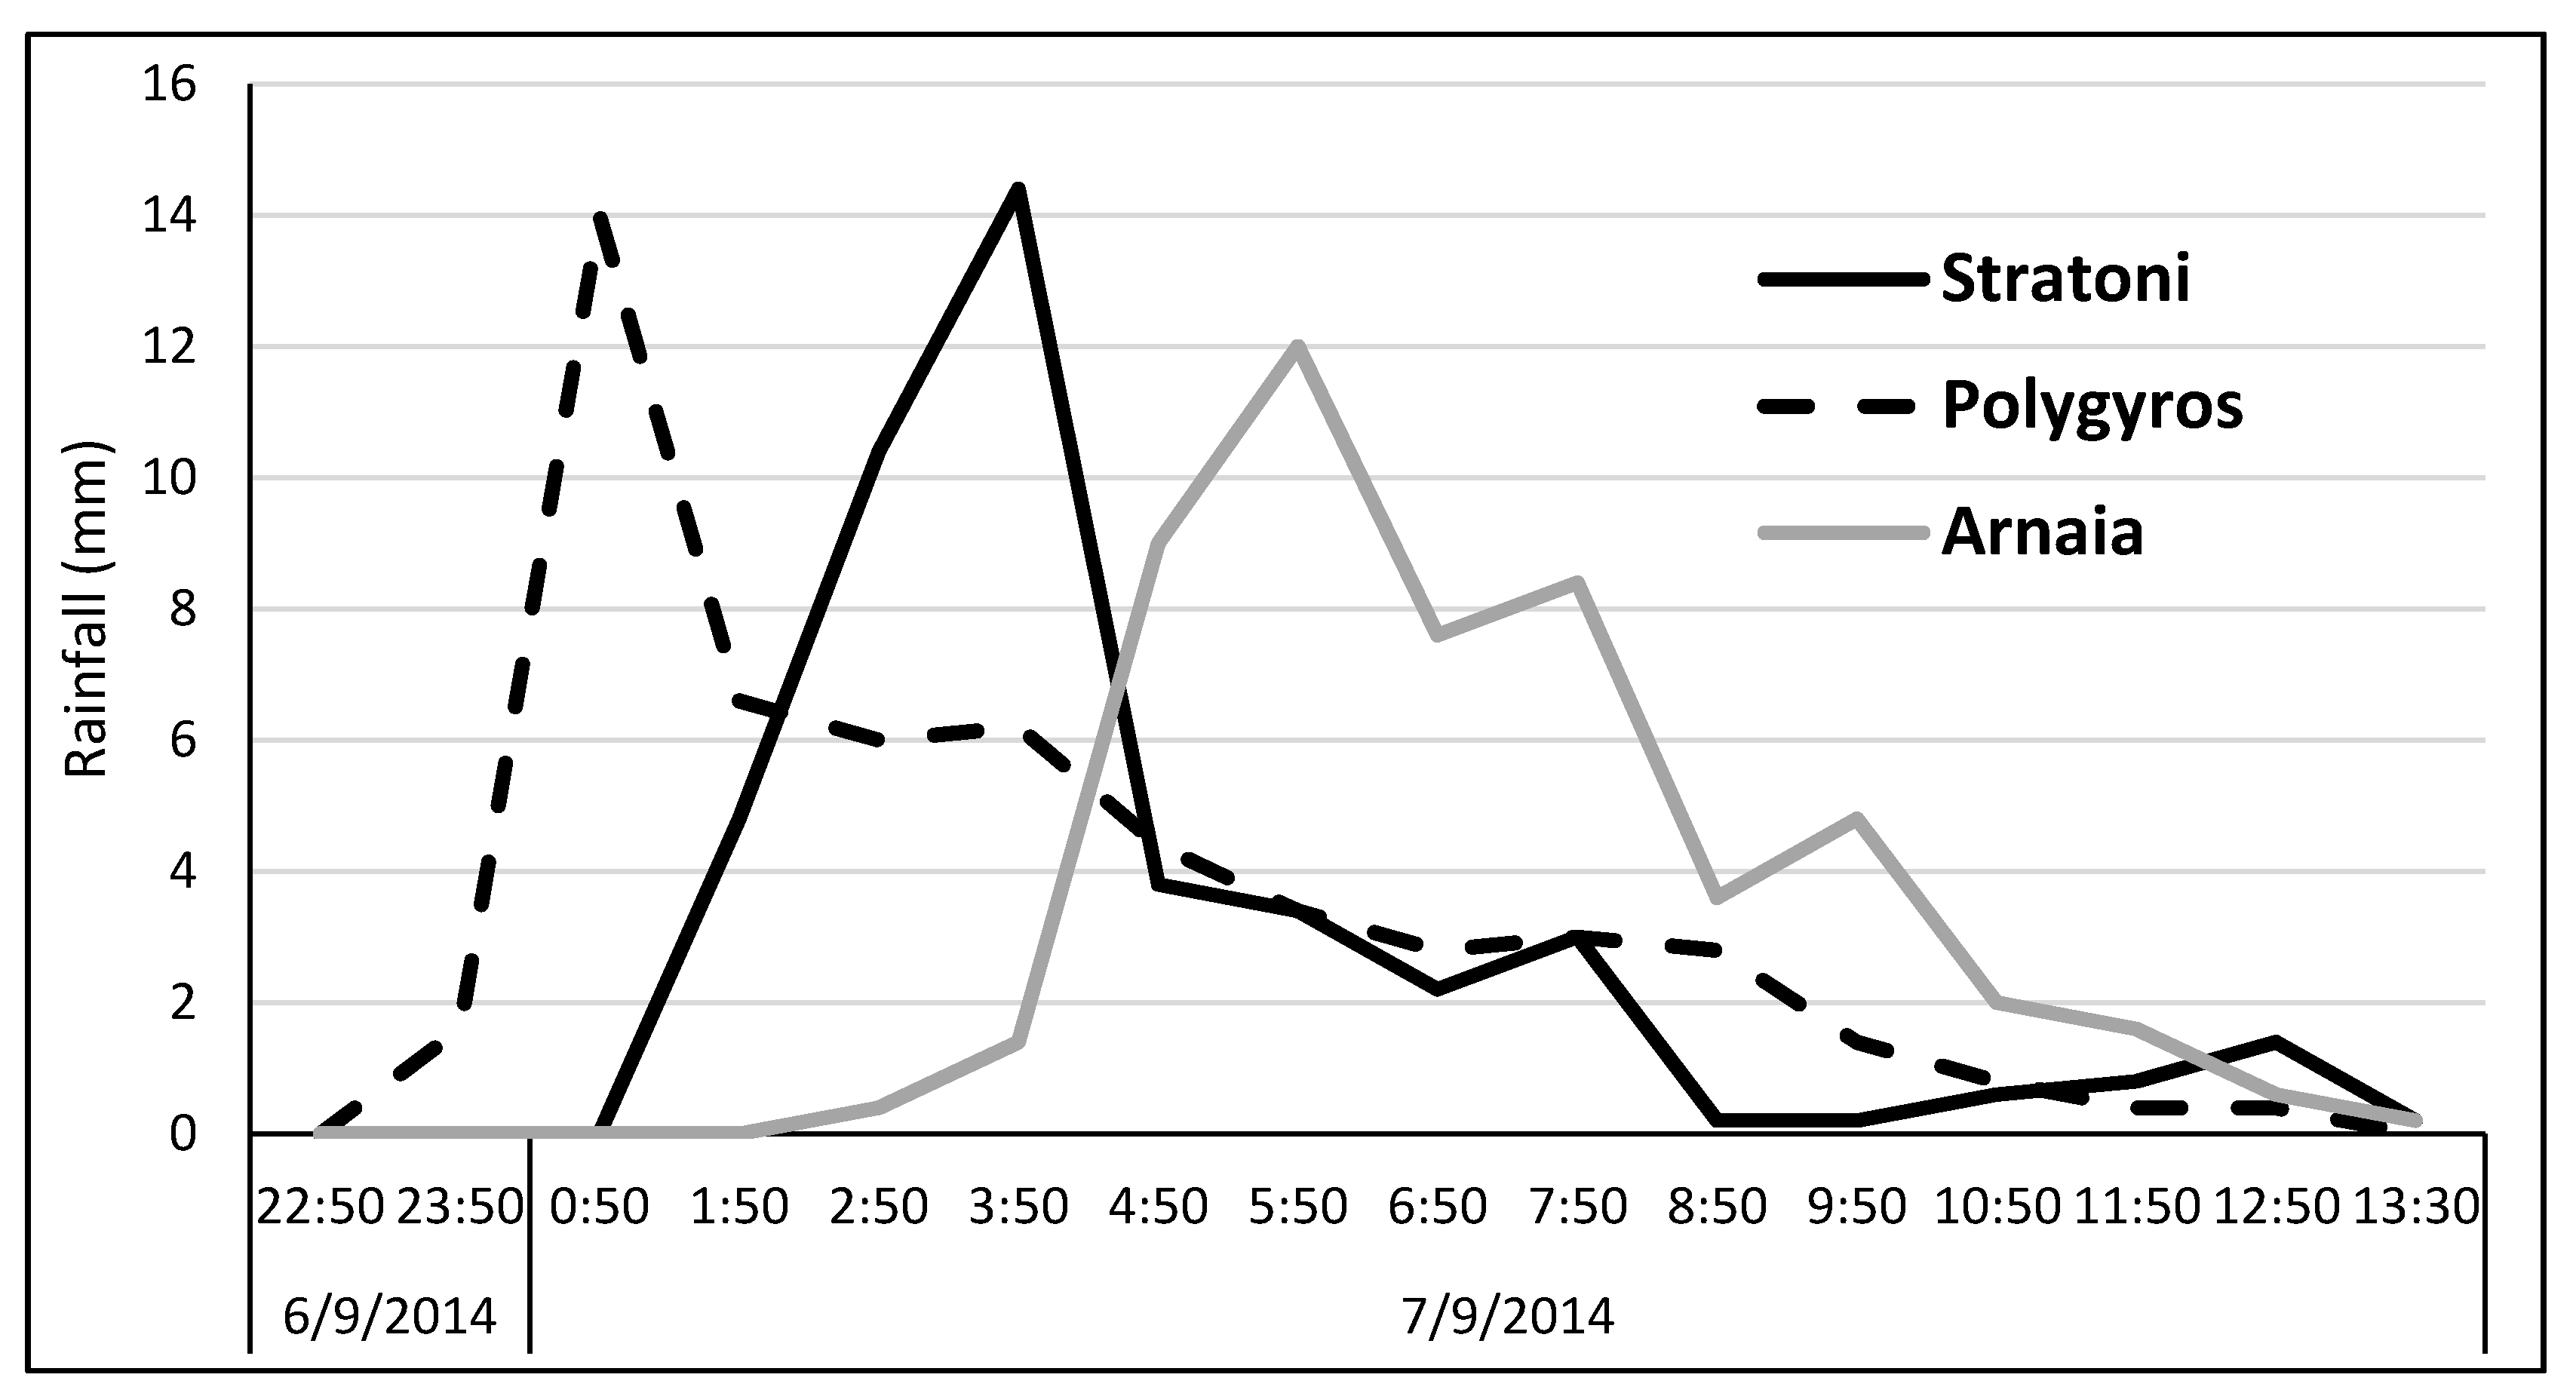
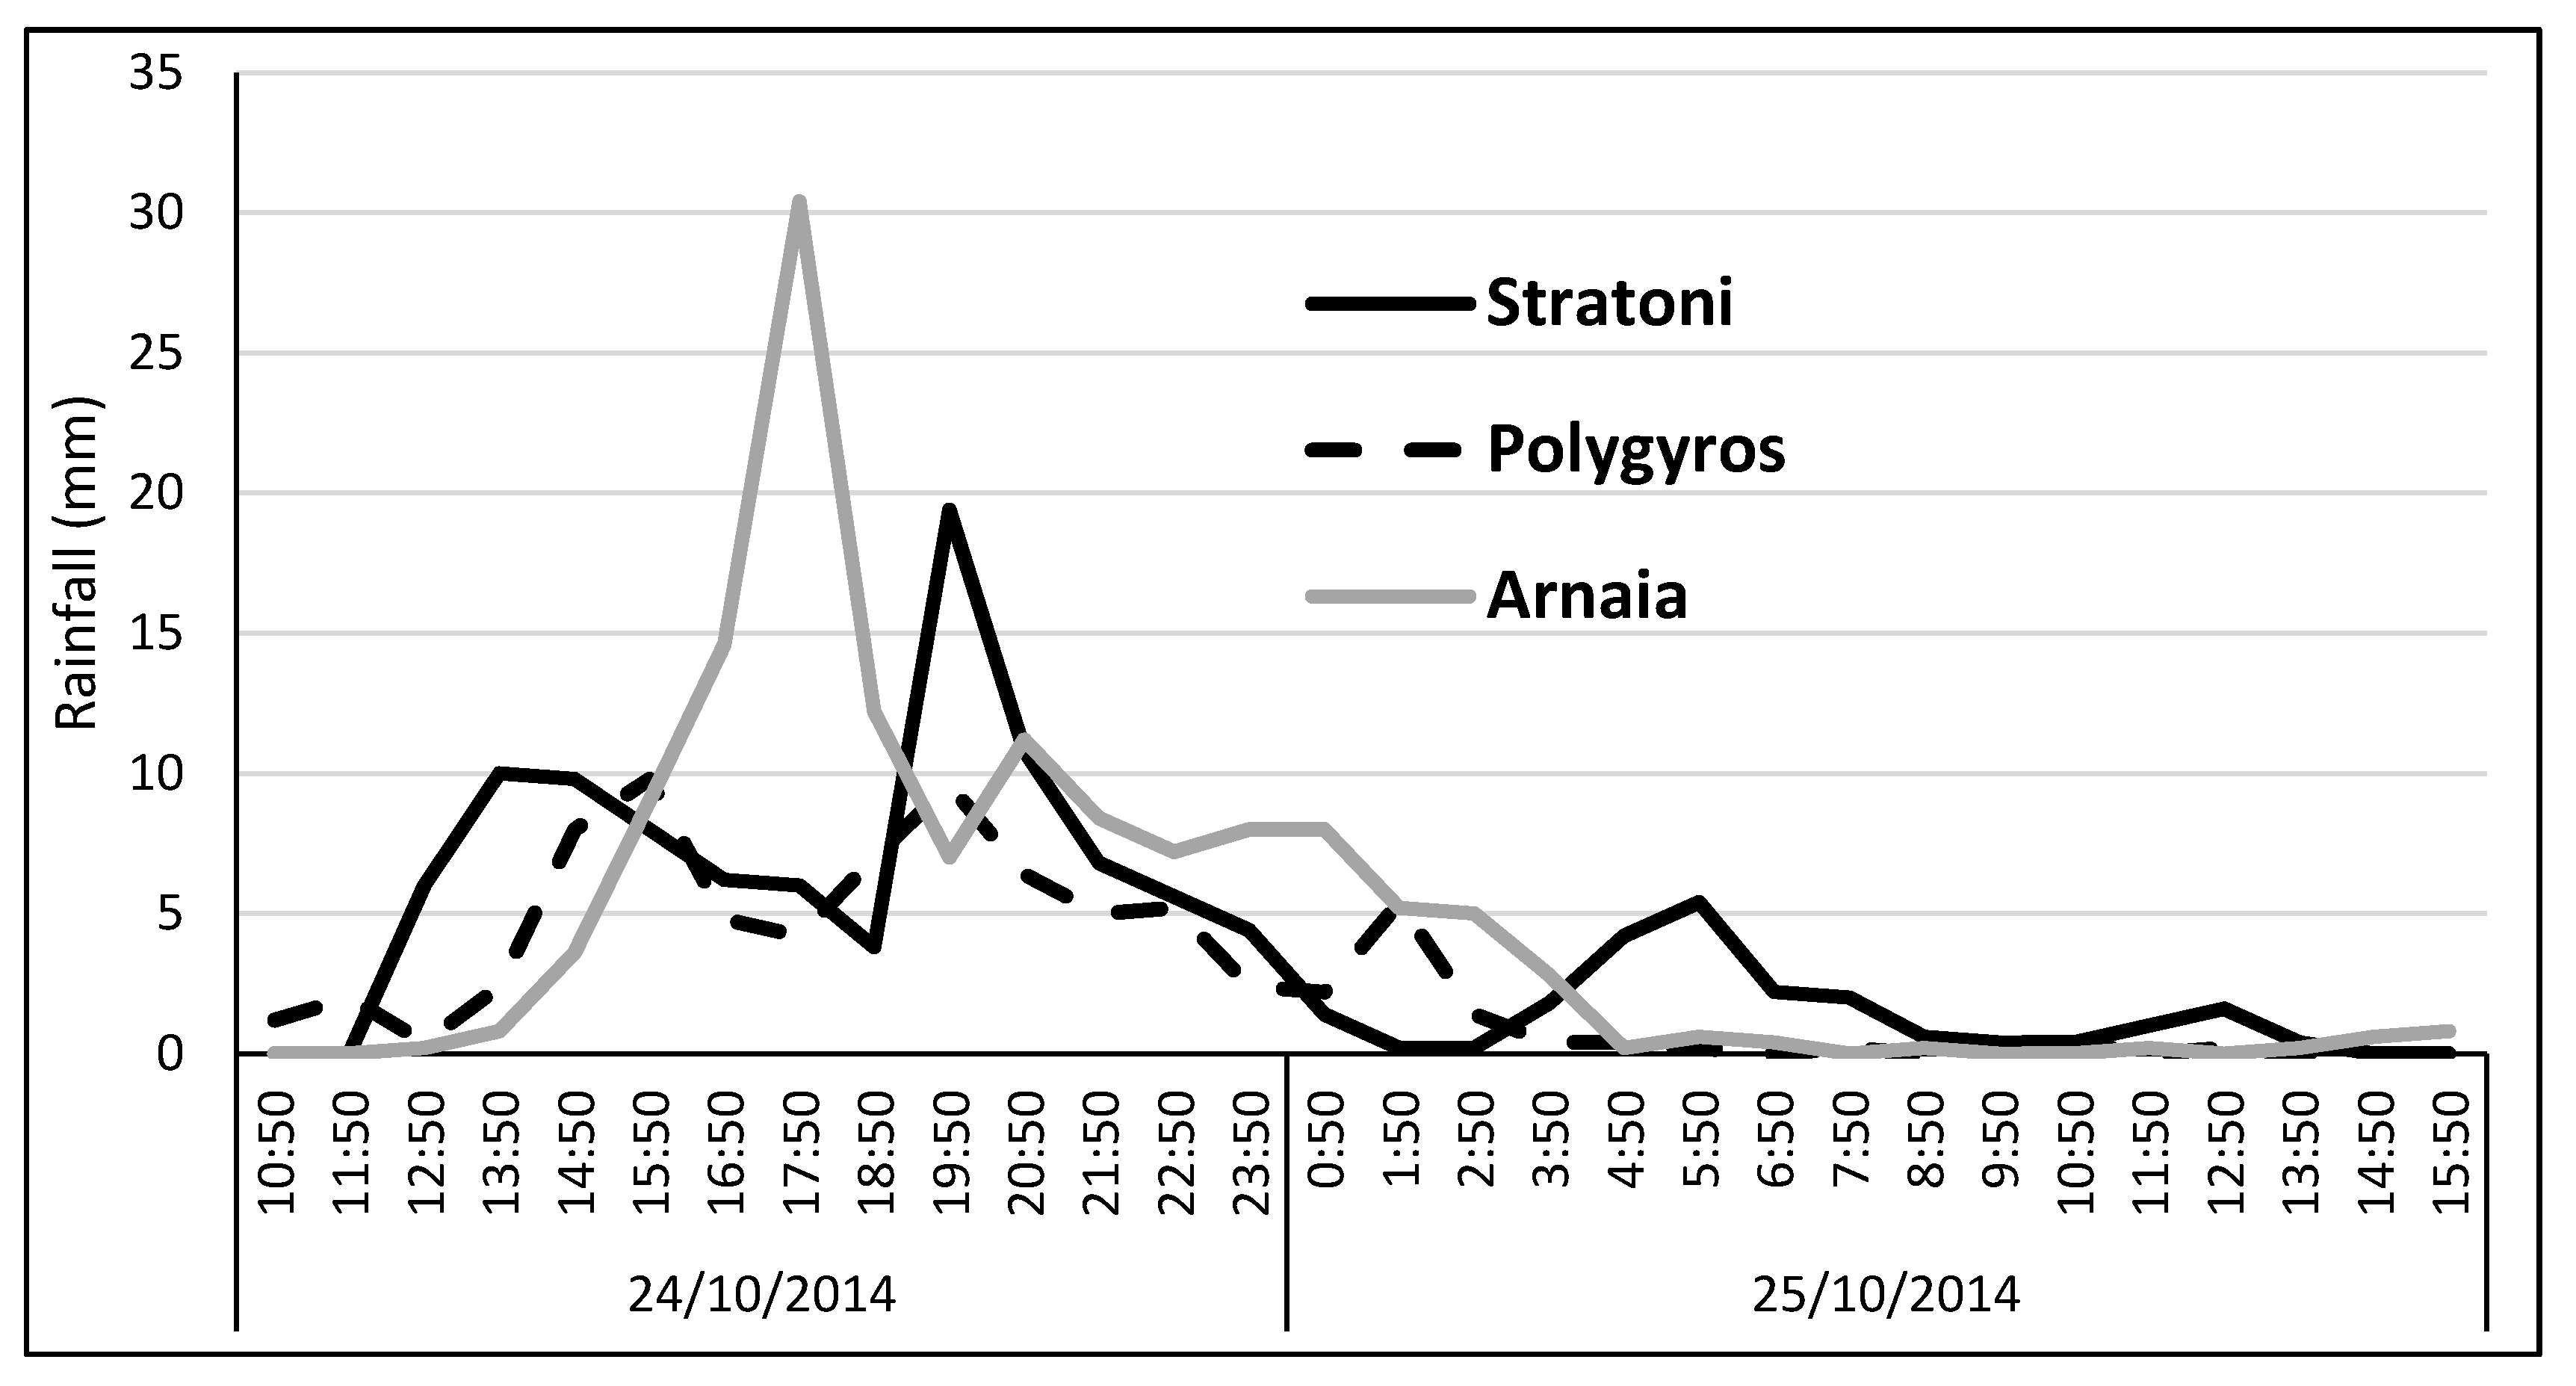
2.3. Flash Floods of October 2006, February 2010, and June 2018

The storm of 7–8 October 2006 was the most intense among the three rainfalls according to the data from the meteorological stations in the area and affected almost all the Chalkidiki Peninsula and southeast parts of Thessaloniki prefecture, causing overbank flow in the Vatonias torrent and many other streams in the area. The highest rainfall intensities were recorded by 4 meteorological stations that operate in the study area. Taxiarchis, Arnaia, Agios Prodromos, and Polygyros are the locations of the meteorological stations [24], and the highest values for the October 2006 rainfall were 86.6 mm/24 h, 98 mm/24 h, 74.4 mm/24 h, and 53.6 mm/24 h, respectively (Figure 2).
The storm recorded on 10th of February 2010 was located in the central and eastern part of the Chalkidiki Peninsula, causing overbank flow in the Vatonias torrent and significant destruction on the east coast of Chalkidiki, especially in Stratoni and Olympiada settlements [12]. The highest intensities of the rainfall in Taxiarchis, Arnaia, Agios Prodromos, Polygyros, and Stratoni meteorological stations were 70.7 mm/24 h, 53.4 mm/24 h, 39.5 mm/24 h, 75.6 mm/24 h, and 163.4 mm/24 h, respectively.
The storm on 27–28 June 2018 affected mainly Thessaloniki prefecture, especially the east part close to the coast of the Strymonikos gulf (Mediterranean Sea), and caused significant damage to Stavros, Vrasna, and Asprovalta settlements. The highest intensity of the particular rainfall event was 141.4 mm/24 h (Figure 3), which was recorded by the rain gauge located at Asprovalta settlement at a distance of 3 km from Stavros settlement. Four days before the flash flood of 28 June, 160 mm of rainfall was recorded, which was a very unusual phenomenon for the area, and especially for the specific period of the summer season.

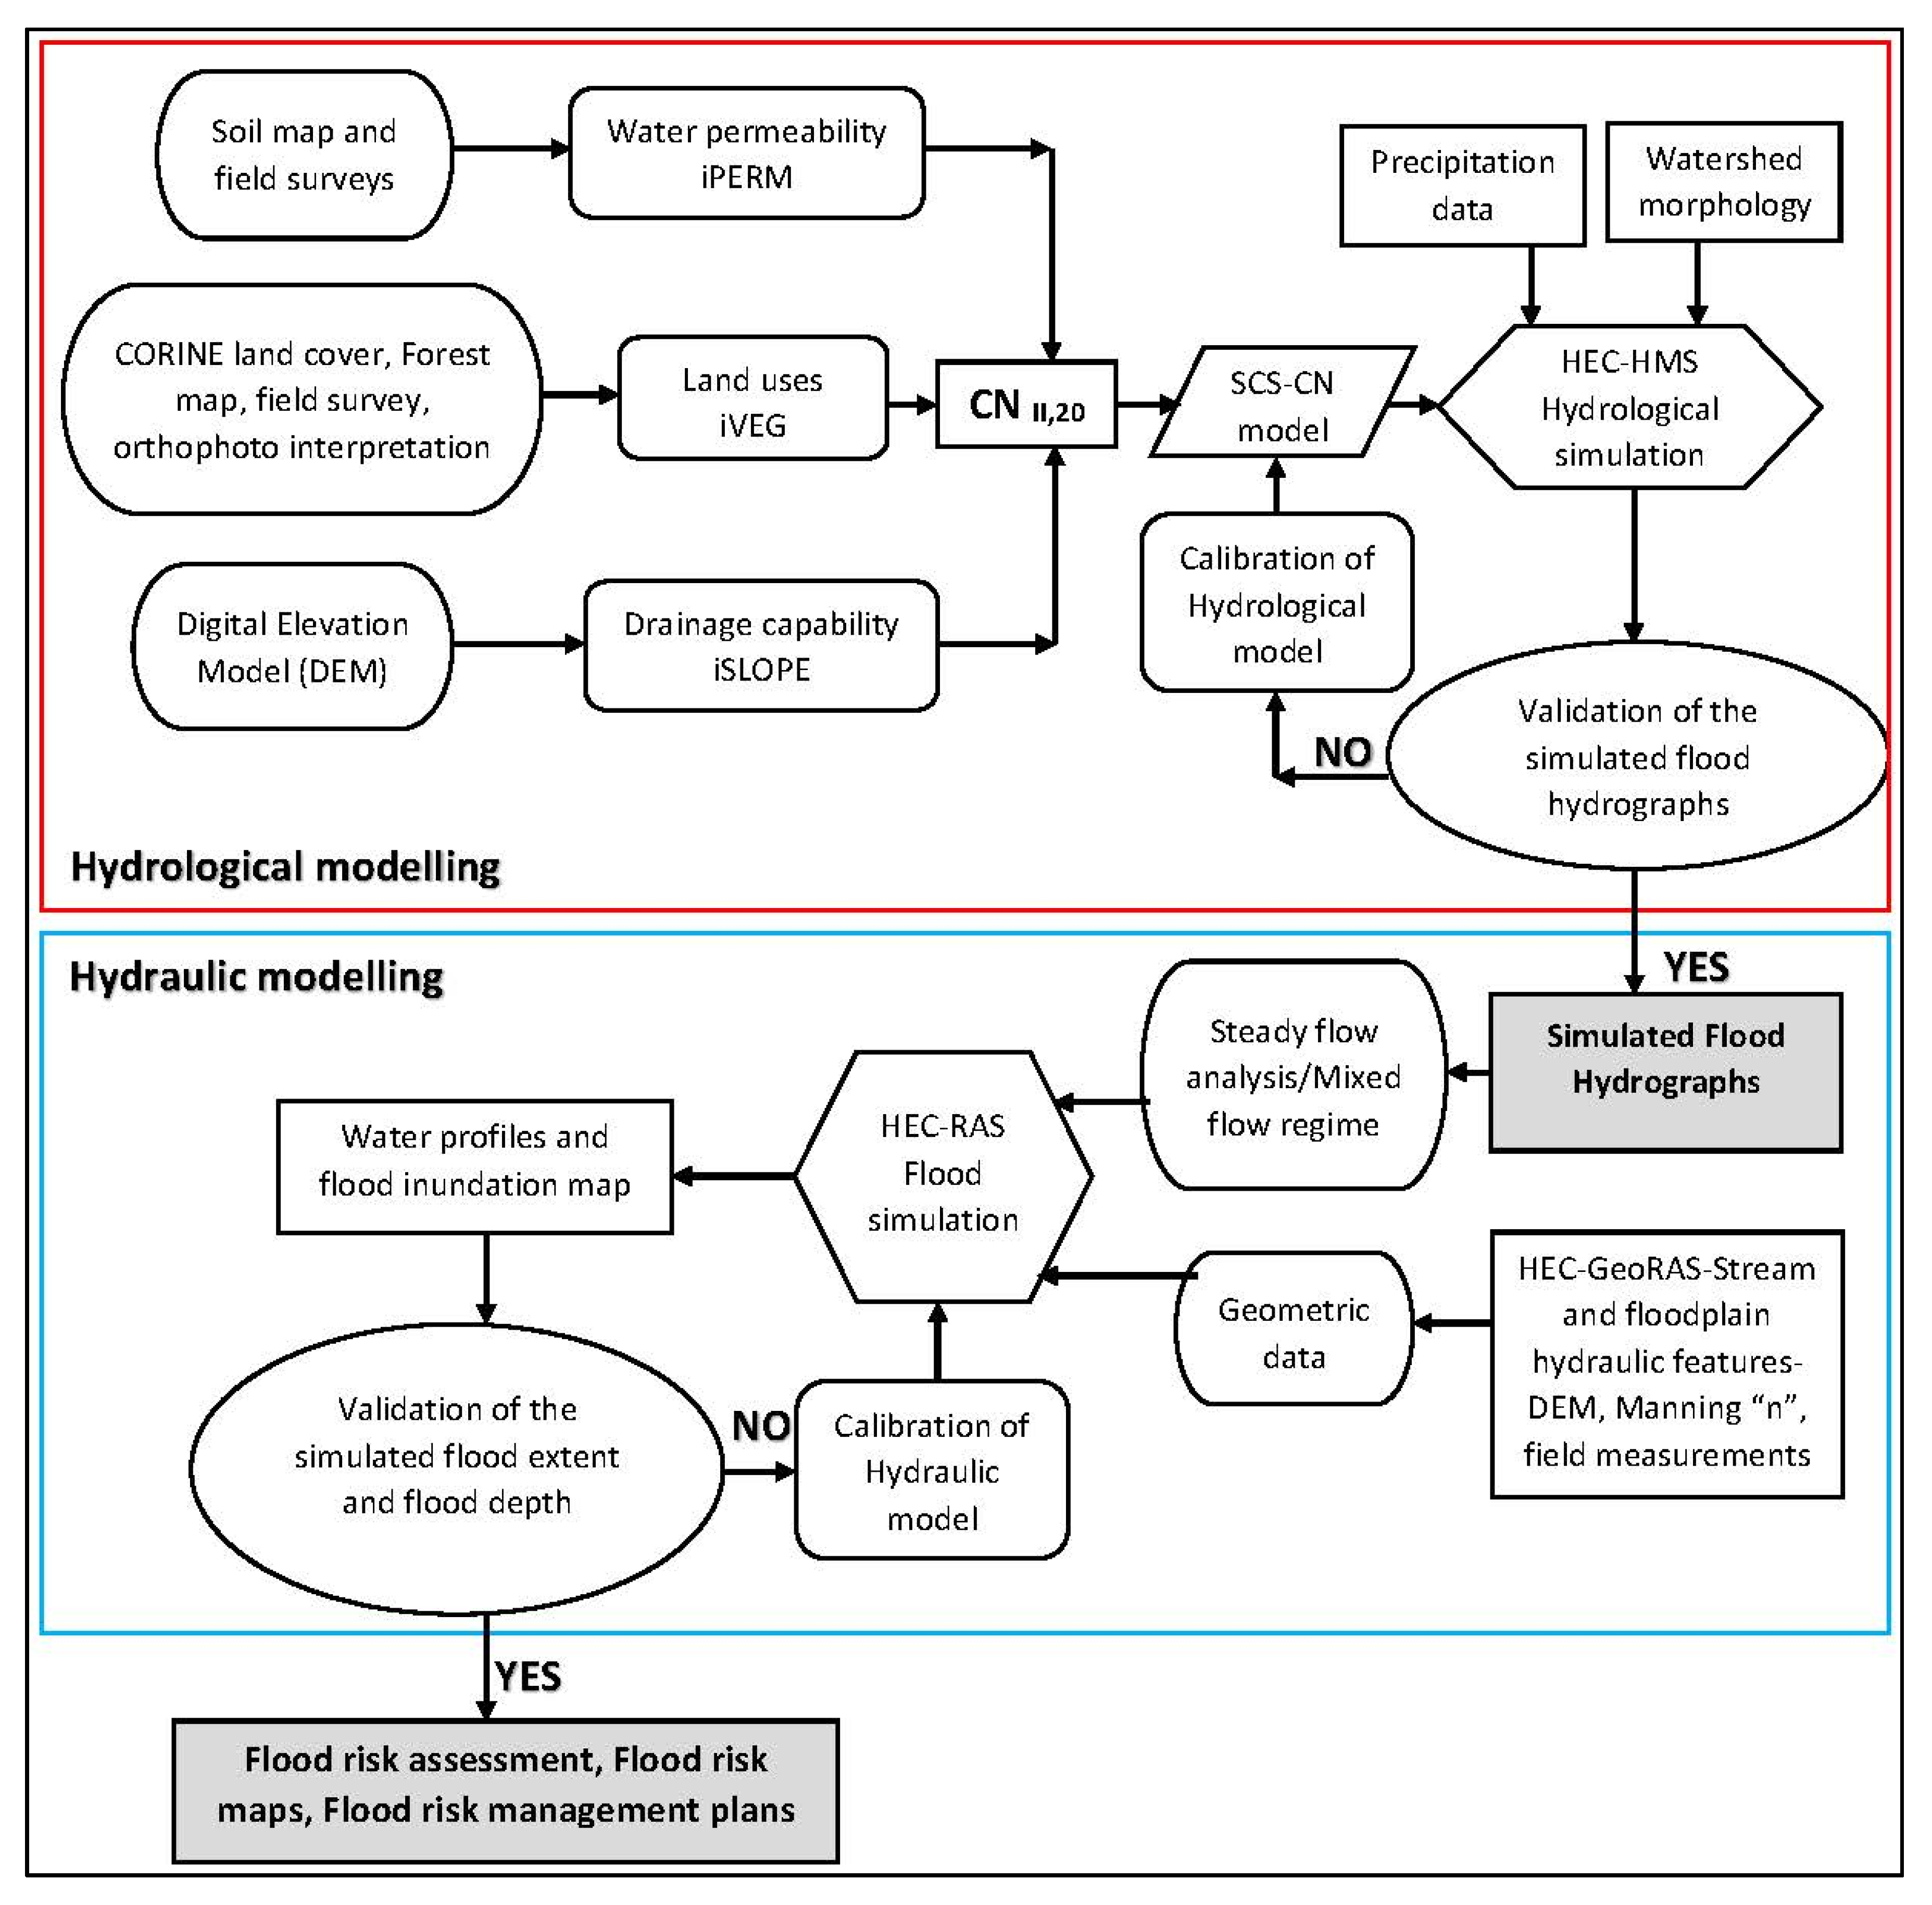
2.4. Hydrological Modeling

Hydrological and hydraulic modeling was implemented in four different watersheds and validation processes were performed using post-flash-flood measurements. Initially, the rainfall runoff model of the Soil Conservation Service curve number (SCS-CN) [25] was applied at Vatonias watershed to estimate the hydrographs of the two rainfall events in October 2006 and February 2010. The Hydrologic Engineering Center’s-Hydrologic Modeling System (HEC-HMS) software [26] was used to estimate the flood hydrographs. Subsequently, the data from the hydrographs were simulated using the River Analysis System (HEC–RAS) software from U.S. Army Corps of Engineers [27], and the preparation of the hydraulic parameters was completed using the HEC–GeoRAS software [28].
The main components of the HEC-HMS software are the basin model (loss method, transform method, basin area, base flow method, etc.), loss (initial abstraction, curve number, impervious area), transform (graph type, lag time), meteorological model (precipitation), control specification (time interval), and time-series data (units, time interval, time window, table with data). In the current work, we applied the SCS-CN (loss method) and Soil Conservation Servise (SCS) unit hydrograph (transform method), while no baseflow method (ephemeral streams without baseflow) was applied. Additionally, initial abstraction was set to zero for antecedent moisture conditions III (AMCIII) values, and for AMCII was set without any value (in HEC-HMS, when the value of the initial abstraction is empty, HEC-HMS calculates the hydrographs by applying 20% initial water abstraction). Areas impervious to water were incorporated into the CN parameter, thus zero value was set for the respective field. For watersheds that were characterized by steep relief, larger peak rate factor was defined, according to the HEC-HMS user’s manual. The lag time was defined by calculating the difference between the time of the precipitation peak and the time of the observed peak discharge at the outlet point of the watershed. To estimate the hydrographs of the two rainfalls (October 2006 and February 2010) in the Vatonias watershed, the SCS-CN model was used, a well-known and widely applied model in many countries [29,30,31,32,33] and in Greece [22,34,35,36,37,38,39,40,41,42,43]. The CN is a dimensionless empirical parameter for predicting runoff and infiltration from rainfall excess [39]. It ranges from 30 to 100, with the highest numbers indicating high runoff potential. In this study, it was decided not to apply the well-known CN values from the Technical Release 55 table [44] and instead to apply a relatively new methodology for the enhanced quality and spatial distribution of CN, which was presented by the Deucalion project [45]. In this method, the spatial estimation of the CN was carried out in geographic information system software using three characteristic raster layers of spatial information, referring to the main factors that interact with one another for the production of flood runoff. The reference value of the CN parameter corresponding to the average humidity conditions (type II) and an initial loss rate of 20% are denoted as CNΙΙ,20. This value is estimated by taking into account the dominant factors (Table 1) of water permeability, land uses, and drainage capability of the watershed, according to the following empirical equation:
CNΙΙ,20 = 10 + 9 × iPERM + 6 × iVEG + 3 × iSLOPE
where iPERM, iVEG, and iSLOPE are factors that describe the water permeability, land uses, and drainage capability, respectively, and receive values [1,2,3,4,5] according to the information presented in Table 1. Equation (1) has been validated in Mediterranean watersheds by the research team of the Deucalion project [45].
Antecedent moisture conditions (AMC) II and the corresponding CNII values are considered representative of 50% of the flood events. The value that corresponds to the average humidity conditions (AMC II) is related to the other two typical initial soil moisture conditions (AMC I and AMC III), according to the following empirical relationships [46]:
CNI = 4.2 CNII/10 − 0.058 CNII
CNIII = 23 CNII/10 + 0.13 CNII
The range of antecedent moisture conditions for each class is shown in Table 2.
The water permeability (iPERM) assessment was based on the soil and geological characteristics of the basin and the dominant type of construction, which were determined using the geological maps (1: 50,000) provided by the Institute of Geology and Mineral Exploration of Greece (IGME), as well as field surveys. The vegetation factor (iVEG) was estimated using the Coordination of Information on the Environment (CORINE) land cover data [47]. A correction was made to the polygons with codes 243 and 324 for the accuracy enhancement of the boundaries between crop land and forested areas, using the forest map that was obtained from the Hellenic Cadastre. Aiming at the improvement of the CN accuracy for the olive groves, the results of previous research studies from Mediterranean regions [48,49] were taken into account. The drainage capability factor (iSLOPE) was estimated using the digital elevation model (DEM, 5 m × 5 m resolution), which was available from the Hellenic Cadastre. Some errors that were detected and could have negatively affected the results were corrected. The DEM file was converted into a slope raster file, which was used for the classification of the iSLOPE factor. It is very common practice to use geographic information system software for the enhanced spatial distribution of geomorphological factors [45]. All raster calculations were conducted using the Arc Geographic Information System (GIS) 10.2 software. The classification of the iPERM, iVEG, and iSLOPE factors was implemented using Table 3, Table 4 and Table 5.
Using the proposed revised methodology [45] for the estimation of the CN parameter, CN estimation is more qualitative, since classification of combined geomorphologic and land use features are used, classified according to their influence on runoff generation and offering the opportunity for calibration of higher accuracy. Three rain gauges (Polygyros, Agios Prodromos, Taxiarchis) are located within the Vatonias watershed. The distances among them are less than 10 km, even though only Polygyros operates, providing data for 10 min of recording. The daily rainfall data from Agios Prodromos and Taxiarchis rain gauges were disaggregated because 24-h data were not sufficient to estimate the flood hydrographs. Due to the lack of adequate rainfall data, the 24-h rainfall data from Taxiarchis and Agios Prodromos were disaggregated according to the 10-min rainfall distribution of Polygyros. Precipitation is very difficult to forecast because of the intense variability in both space and time [50,51]. The disaggregation of daily rainfall data using hourly or 10-min rainfall data from adjacent rain gauges is a commonly accepted practice [52,53]. To check the validity of the hypothesis that rainfall of the two storm events (October 2006 and February 2010) had similar distribution within the Vatonias watershed, the data of three adjacent rain gauges, namely Polygyros (10-min records), Arnaia (1-h records), and Stratoni (10-min records) (Figure 4), were used to compare the rainfall distribution of significant storm events.
Comparing the rain distribution values of the storm events (Figure 5, Figure 6 and Figure 7), it is evident that there is a significant similarity in rainfall distribution values among the data obtained from the three rain gauges, despite the fact that there is a distance (17–35 km) among them.
According to the storm data (Figure 5, Figure 6 and Figure 7), rainfall distribution from the Polygyros rain gauge can be used to disaggregate the 24-h rainfall data form Taxiarchis and Agios Prodromos rain gauges, where the distance among them is less than 10 km.
The Vatonias watershed was divided into four sub-watersheds (Figure 4) according to the mean elevation because of the significant differentiation of rainfall distribution in relation to the altitude (Figure 8) within the Vatonias watershed, and the SCS-CN model was applied separately to these four sub-watersheds.
The flood hydrographs of the four sub-watersheds were combined into one at the outlet point of the Vatonias watershed, where the automated water level meter station is located. In October 2006, the maximum flood depth was measured to be 4.27 m and in February 2010 was 3.30 m. The Manning coefficient of roughness (n) was estimated to be equal to 0.040, since there is no vegetation in the channel, banks are steep and contain trees and bushes, while the bottom contains gravel, cobble, and boulders. The stream mean slope (J%) at the linear part where the water level meter station is located was estimated to be 0.66%.
The SCS-CN model was applied for the two storm events (October 2006 and February 2010) in the Vatonias watershed. The flood events were simulated using the SCS-CN model and the results from the simulations were compared with the data obtained from the water level meter and the post-flood measurements alongside the stream banks. The data from the water level gauge were converted into the flow discharge hydrograph using the Manning–Strickler equation. This process was performed to calibrate the SCS-CN model. The calibrated model was used to reproduce the flood hydrographs of the three watersheds (Kryoneri, Samara, Paliokastro) in the Stavros area. The process of applying a calibrated hydrological model to an ungauged watershed it is widely used and it is very useful to reduce the uncertainties of the model results [19].

2.5. Hydraulic Modeling

The water discharge values that were calculated by the SCS-CN model were used to simulate the flood events at Vatonias and Stavros watersheds. The hydraulic and geomorphological features of torrents and floodplains were prepared and processed using the HEC-GeoRAS extension. The processed data from HEC-GeoRAS were imported into the HEC-RAS software, where the hydraulic flood simulation was performed. The theoretical base and model equations that were applied by HEC-RAS are available in the user’s manual [27]. In this study, 1D modelling was implemented, while the simulation of flood events was performed by applying the steady gradually varied flow with the mixed flow regime. Because of the lack of sufficient data, especially high resolution Digital Terrain Model (DTM) of the floodplain, it was not feasible to apply unsteady flow analysis, which is more suitable for the hydraulic modeling of flash flood events in urban landscapes. The input data for the steady flow analysis were the maximum discharge, which was calculated by the flood hydrographs, while normal depth was chosen for external boundary conditions and assigned to the upstream and downstream slopes. All the elements of the flood simulation (floodplain, stream bed and banks, bridges) were assigned with a Manning roughness coefficient according to the HEC-RAS user’s manual [27]. The roughness tables were provided by the Ministry of the Environment, Planning, and Public Works of Greece (2002) [54], along with the field surveys in the flooded areas.
A digital elevation model (DEM) of 5 m × 5 m resolution was used as an input in HEC-GeoRAS to calculate the hydraulic and geomorphological features. The DEM was available from the Hellenic Cadastre, and was the most accurate and provided the best resolution in Greece. Several stream bed discontinuities were detected, mainly at the junctions with bridges, caused by the incorporation of the bridges highs into the DEM raster cells. These were manually modified after the field survey and the accurate measurement of bridges dimensions. The same process was implemented in locations where the heights of big trees were incorporated into the DEM, especially in locations alongside the stream banks, where the vegetation (e.g., Platanus orientalis, Salix species, Populus species) was considerably dense. The heights of the buildings were incorporated into the DEM but the 5 m × 5 m resolution was not sufficient to accurately describe the urban landscape, especially the streets among the buildings.

2.6. Post-Flood Measurements

After the flash floods of February 2010 and June 2018, field surveys were organized in the flooded areas in order to collect useful data in relation to the flood extent and flood depth. Throughout the floodplains, the maximum flood extent was measured in specific locations. The flood depth in the stream bed, but also in various points within the Vatonias (Figure 9) and Stavros (Figure 10) floodplains, and the dimensions of the constructed works (bridges, culverts) that failed to channel the maximum water discharge were also measured. The field survey was organized according to United States Geological Survey (USGS) Techniques and Methods 3–A24 [55], with an emphasis on high water marks that included wash lines, lines of dried mud on surfaces, seed lines, and leaves or pine straw stuck in various places.
Residents and local authorities who witnessed the flood events were interviewed and important information was obtained about the duration of the phenomena, the exact time that the flood occurred, and the exact location of several flooded houses and facilities. All the post-flood measurement locations were assigned with coordinates using GPS and exported to shape file format in the WGS84 coordinate system for further analysis (Table 6 and Table 7).
Orthoimages dating from 2007 and black and white orthoimages dating from 1945 provided by the Hellenic Cadastre were used to address any significant land use changes, stream flow direction alternations, or any other important geomorphology changes that may have influenced the flood generation process. The results of the flood simulation were compared and evaluated using the mapped maximum flooded area and flood depth.
The root mean square error (RMSE) goodness of fit was used to compare the observed and simulated flood depths at the 35 points of the Stavros floodplain and 25 points of the Vatonias floodplain (Table 3 and Table 4). A measure of fit (FitA) was calculated by applying the critical success index (CSI) [56] for enhanced assessment of the accuracy of observed (FAobs) and modeled (FAmod) flooded areas. The following equation [57] was used to calculate the FitA(%):
Fit A ( % ) = FAobs FAmod FAobs FAmod × 100
Figure 11 illustrates a flowchart with the proposed methodology, the data, the models, and the software that were used during the hydrological and hydraulic modeling.

3. Results

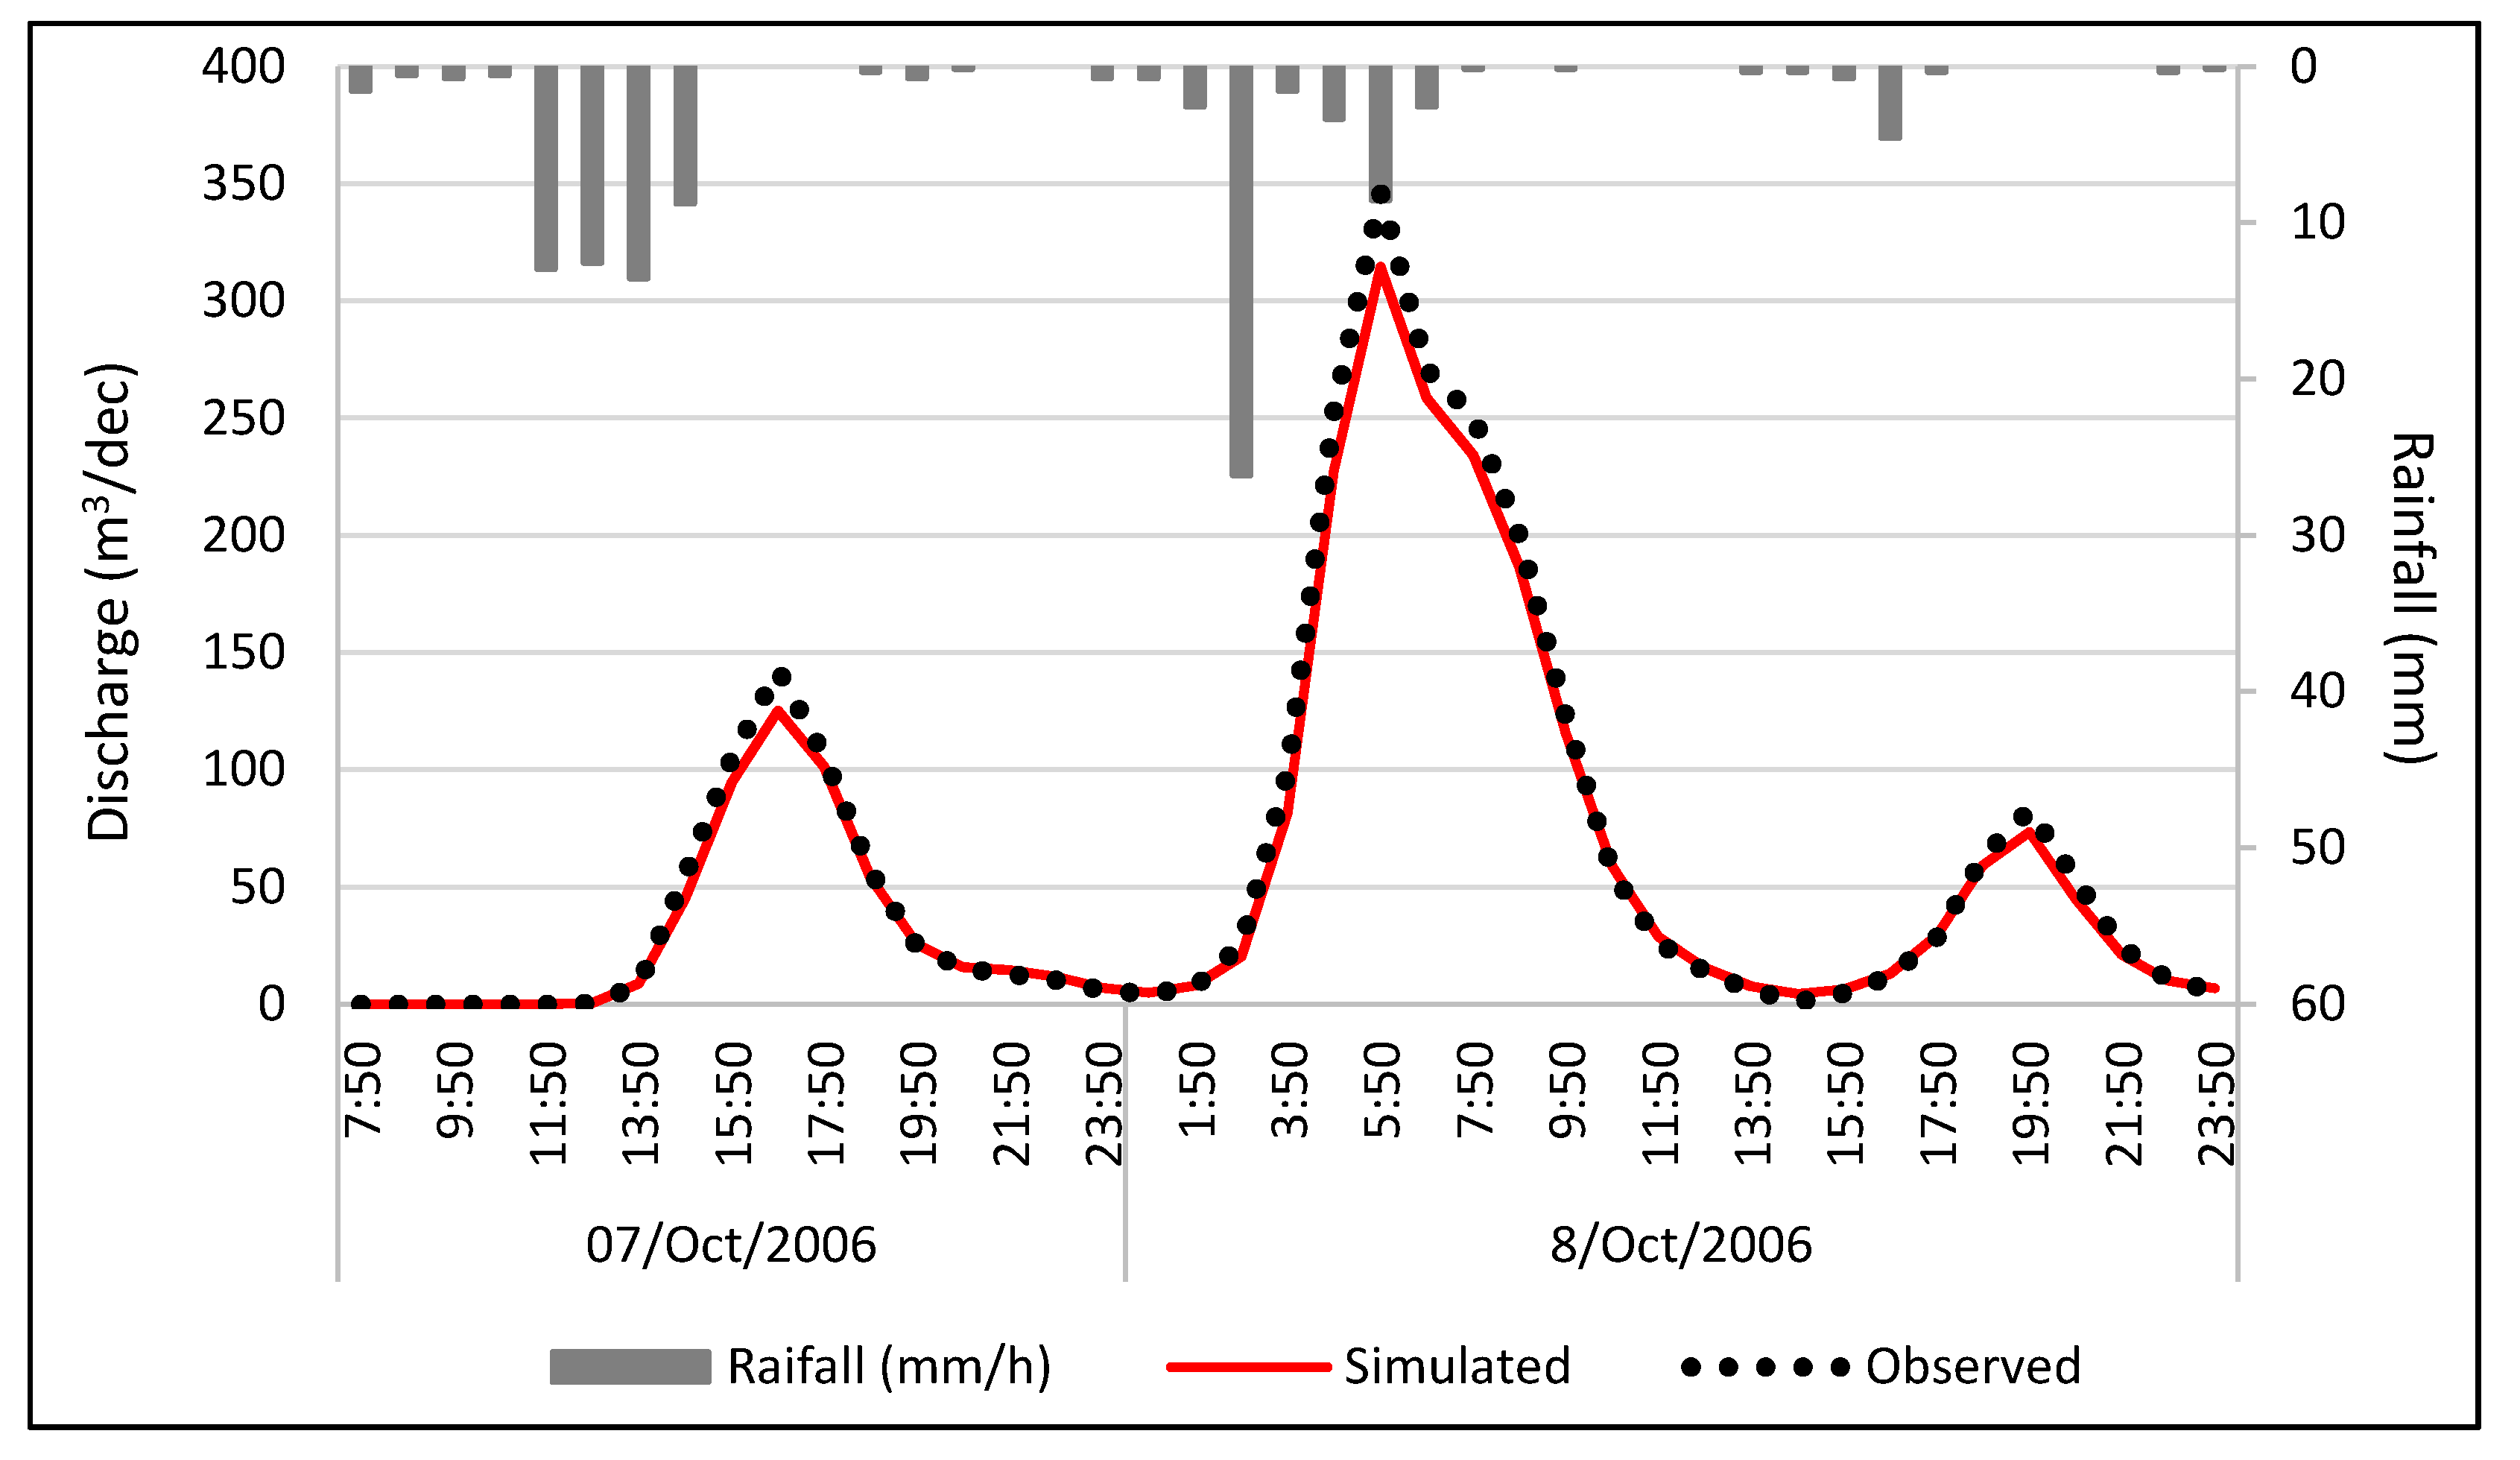
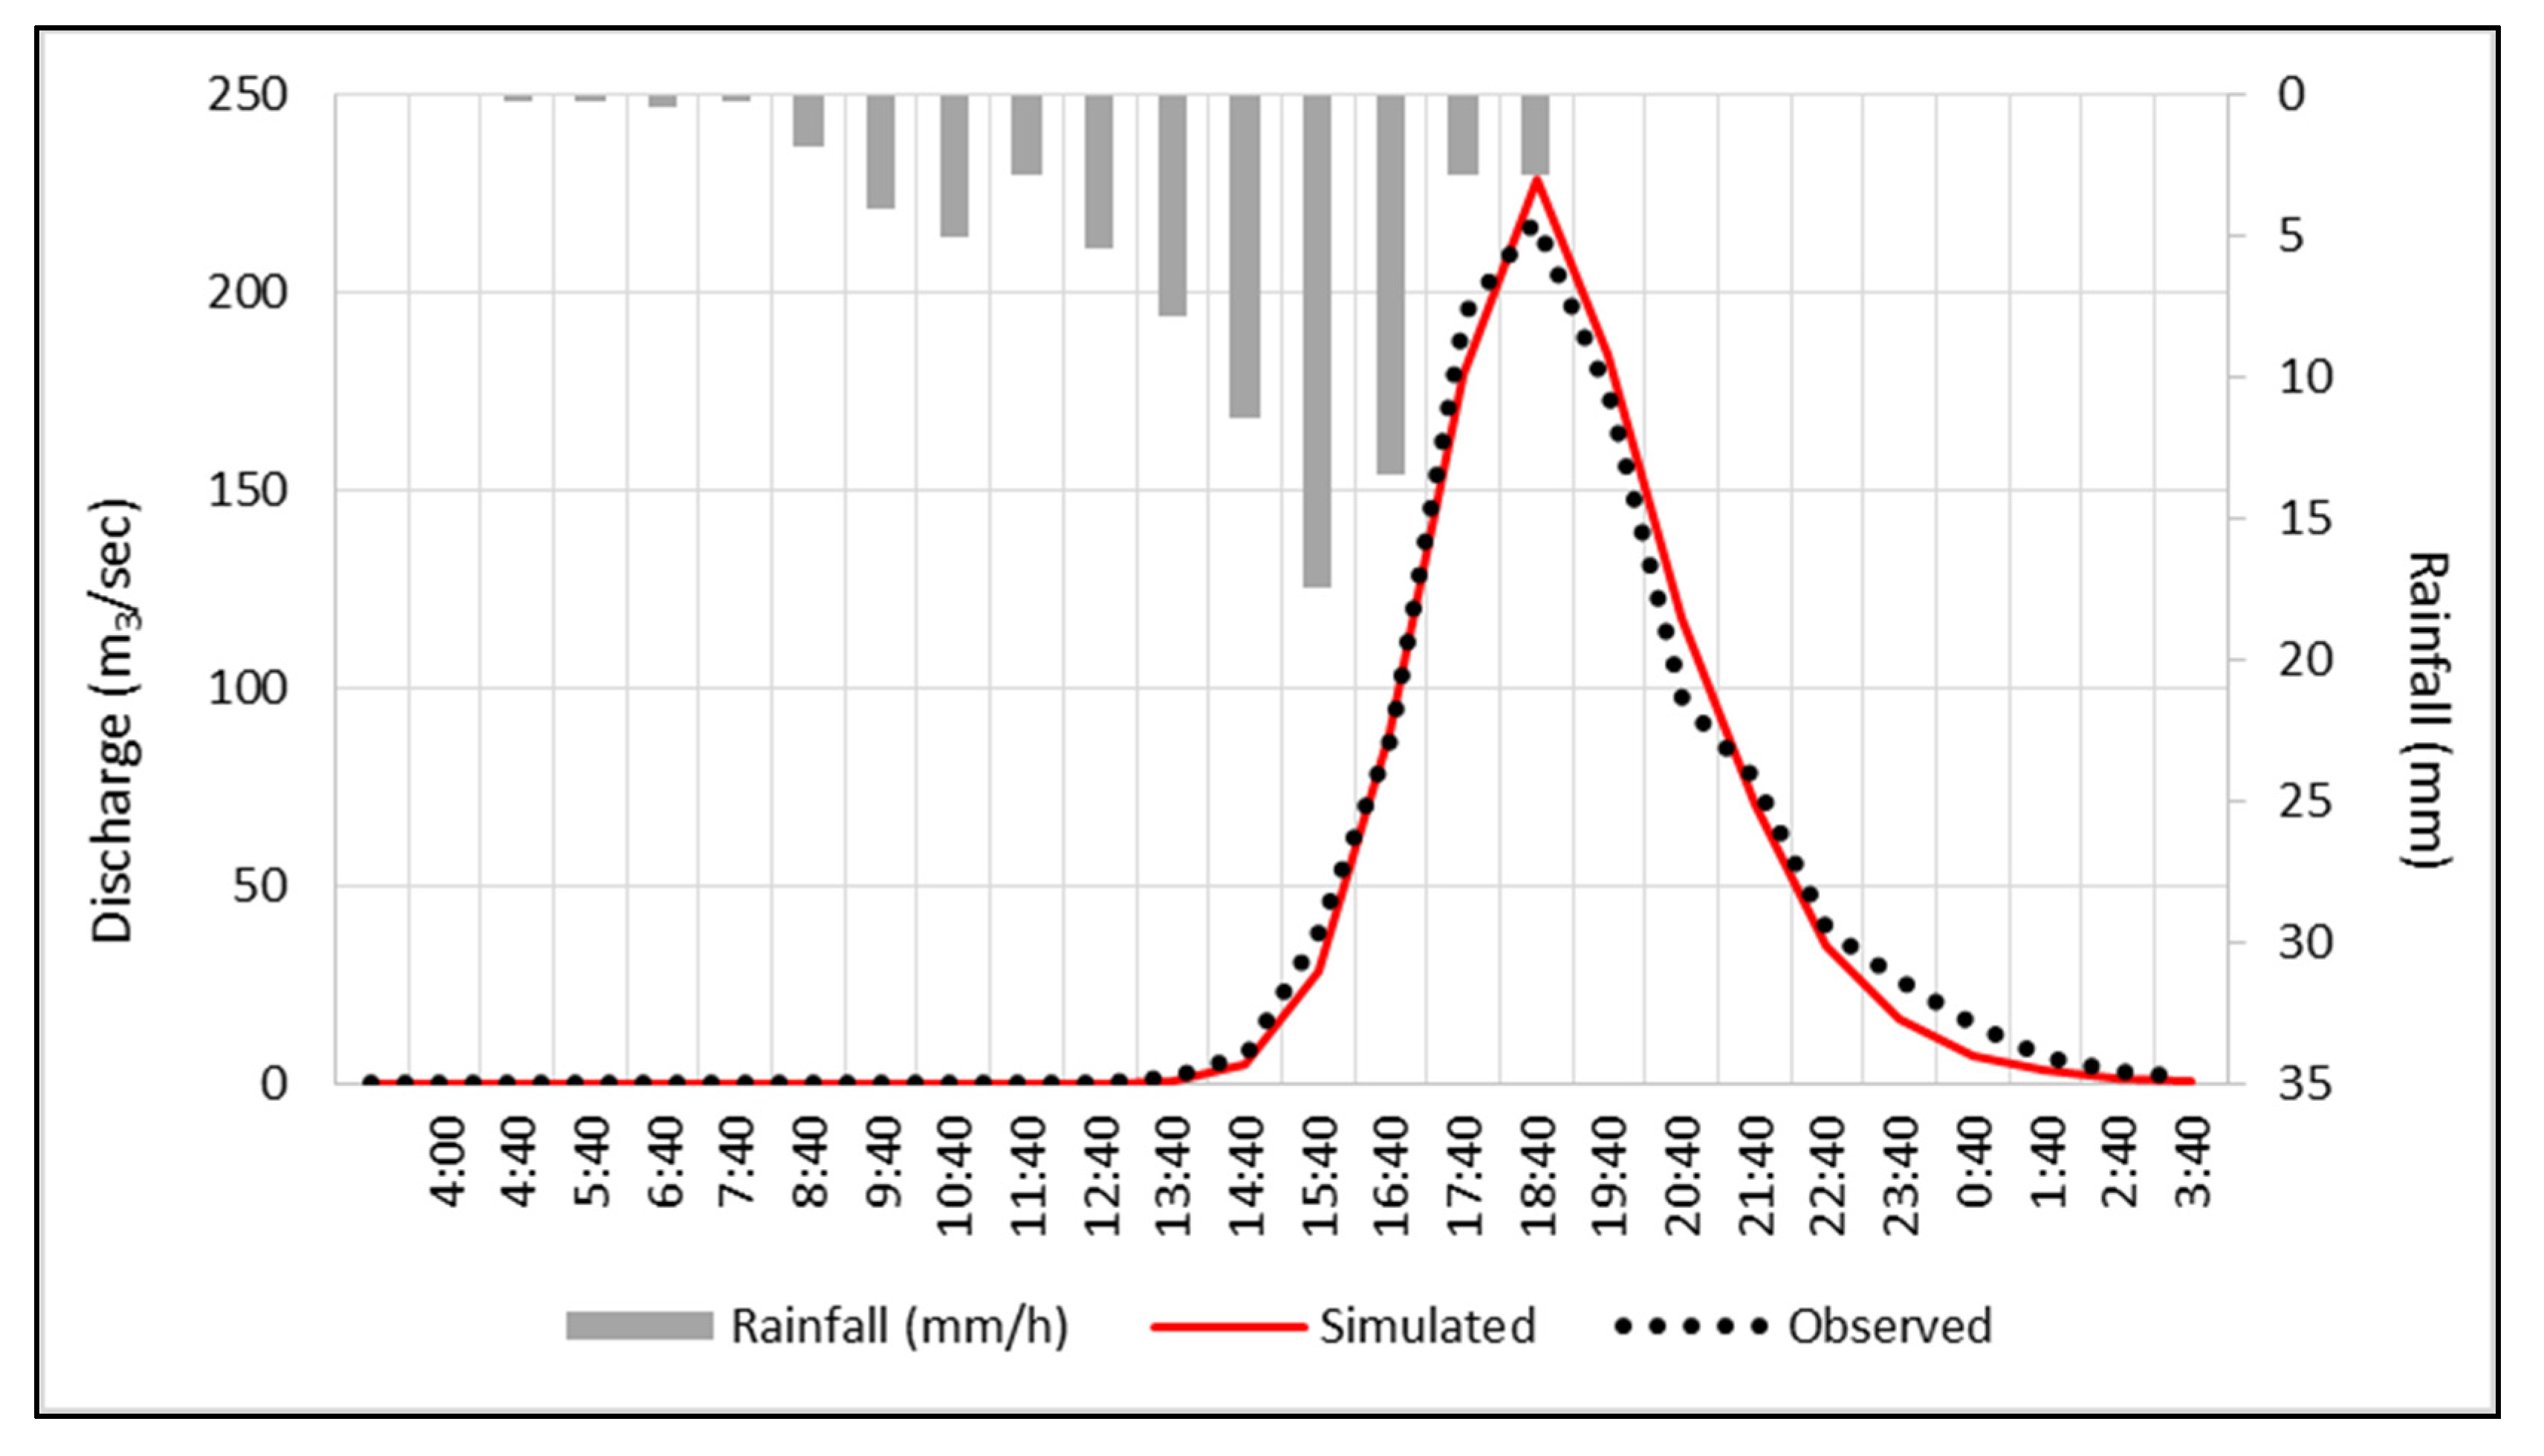
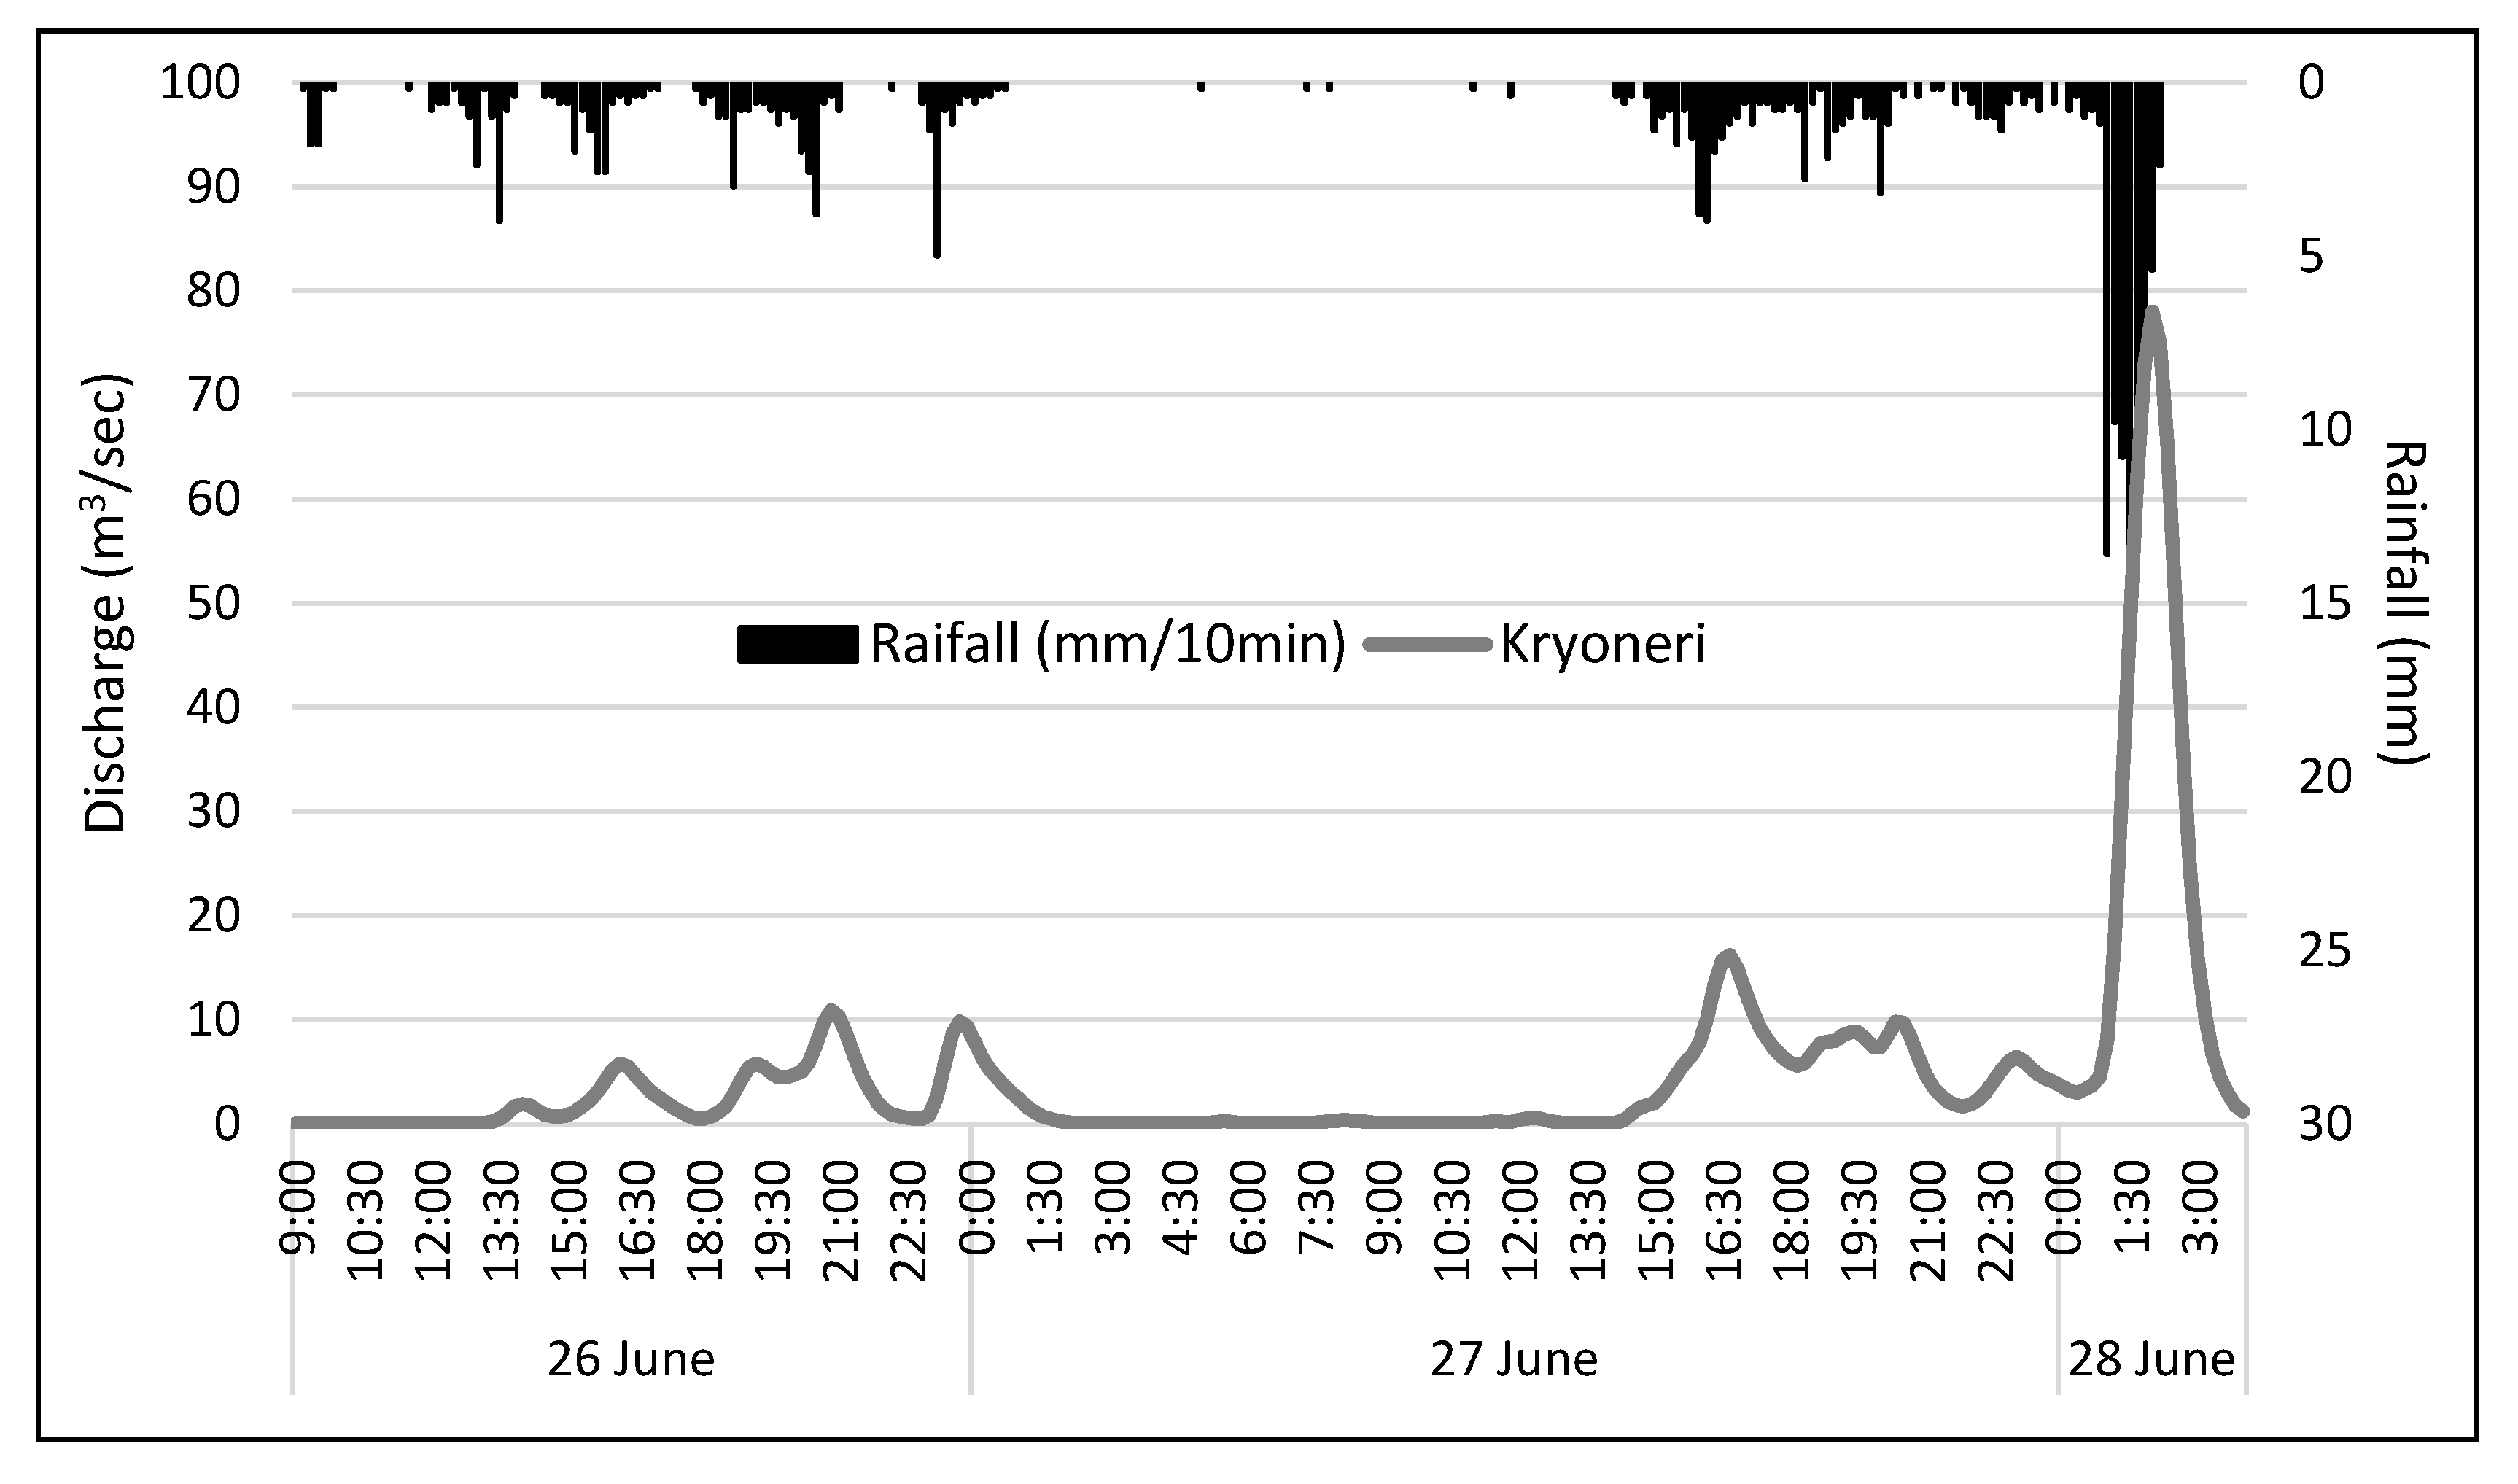
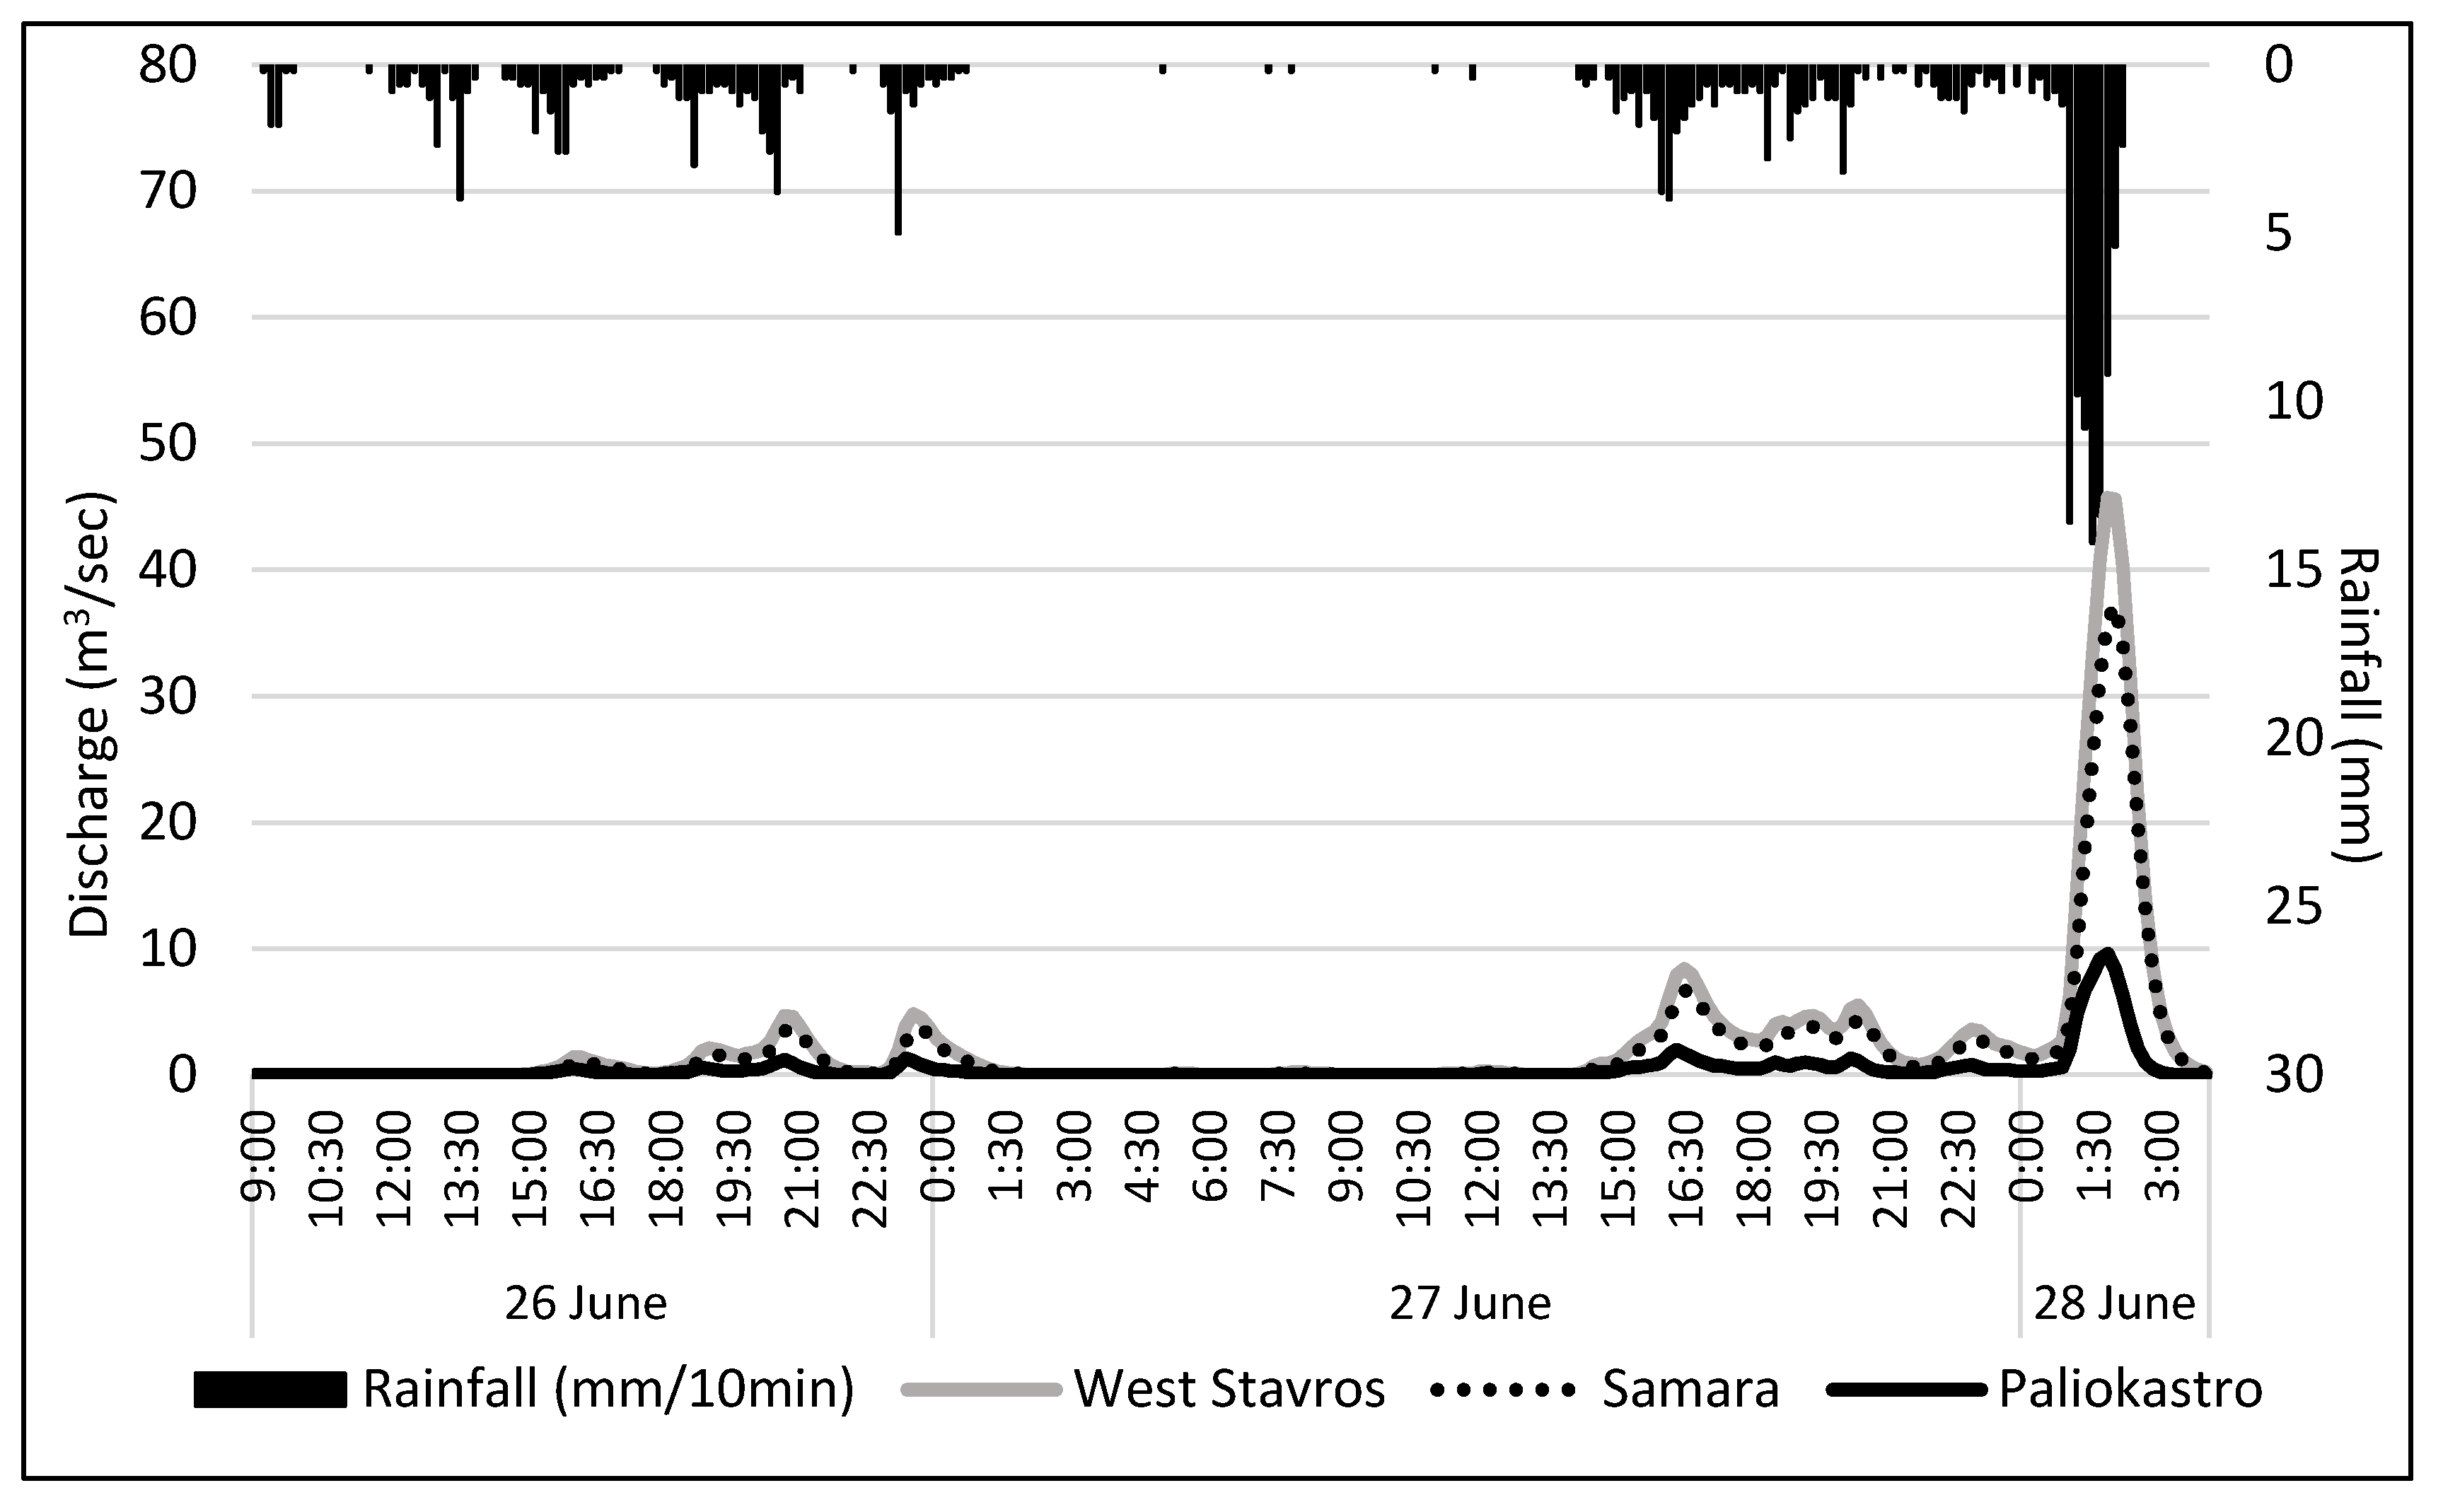
3.1. Hydrological Modeling

The two storm events (October 2006 and February 2010) had different initial conditions for soil moisture because of differences in antecedent rainfall days. Thus, during the implementation of the SCS-CN model, AMCII (CNII) was applied for the October 2006 storm and AMCIII (CNIII) was applied for the storm in February 2010. The lag time was calculated as the difference between the time of the precipitation peak and the time of the observed peak discharge at the outlet point of the Vatonias watershed. The lag time for the storm in October 2006 was estimated at approximately 2 h 40 min to 2 h 50 min, and for the storm in February 2010 it was from 2 h 50 min to 3 h.
On 7-8th of October 2006, precipitation series showed three rainfall peaks. The first occurred between 13:00 and 13:50 (13.6 mm/h), the second and most intense between 02:30 and 02:50 (26.2 mm/h), and the third between 16:00 and 16:50 (2.6 mm/h). The observed maximum discharge was 345.9 m3/sec (Figure 12) at 05:50 on 8 of October, slightly higher than the respective value simulated with the SCS-CN model (314.4 m3/sec).
The storm on 10th of February 2010 was of lower intensity and the rainfall peak occurred between 15:00 and 15:40. The observed maximum discharge was recorded at 18:40 and was 218.62 m3/sec, lower than that simulated with the SCS-CN model, which was calculated as 228.90 m3/sec (Figure 13). The results of the applied hydrological model revealed that the calibrated SCS-CN model and the produced hydrographs managed to describe the observed hydrographs of the two storm events (October 2006 and February 2010) with a very satisfying accuracy, despite the difference between the observed and simulated maximum discharges.
The calibrated SCS-CN model was applied to the three watersheds (Kryoneri, Samara, Paliokastro) of the Stavros region in order to produce the hydrographs of the June 2018 storm event. Over the preceding 4 days, 160.8 mm of rainfall were recorded, and consequently AMCIII (CNIII) was applied to the SCS-CN model for the calculation of flood hydrographs. The lag time was estimated using the Giandotti equation [58] and validated using personal interviews with residents and local authorities of the Stavros settlement, who witnessed the exact time of the flood’s maximum discharge. The maximum discharge of the Kryoneri stream was recorded between 01:50 and 02:10 on 28th of June, the peak flow value was 78 m3/sec (Figure 14), and the lag time was 33 min. At the west side of Stavros, the maximum discharge of the Samara and Paliokastro torrents was recorded between 01:50 and 02:10, the summarized peak flow was 45.7 m3/sec, and the lag time was calculated as 28 min and 17 min, respectively (Figure 15).

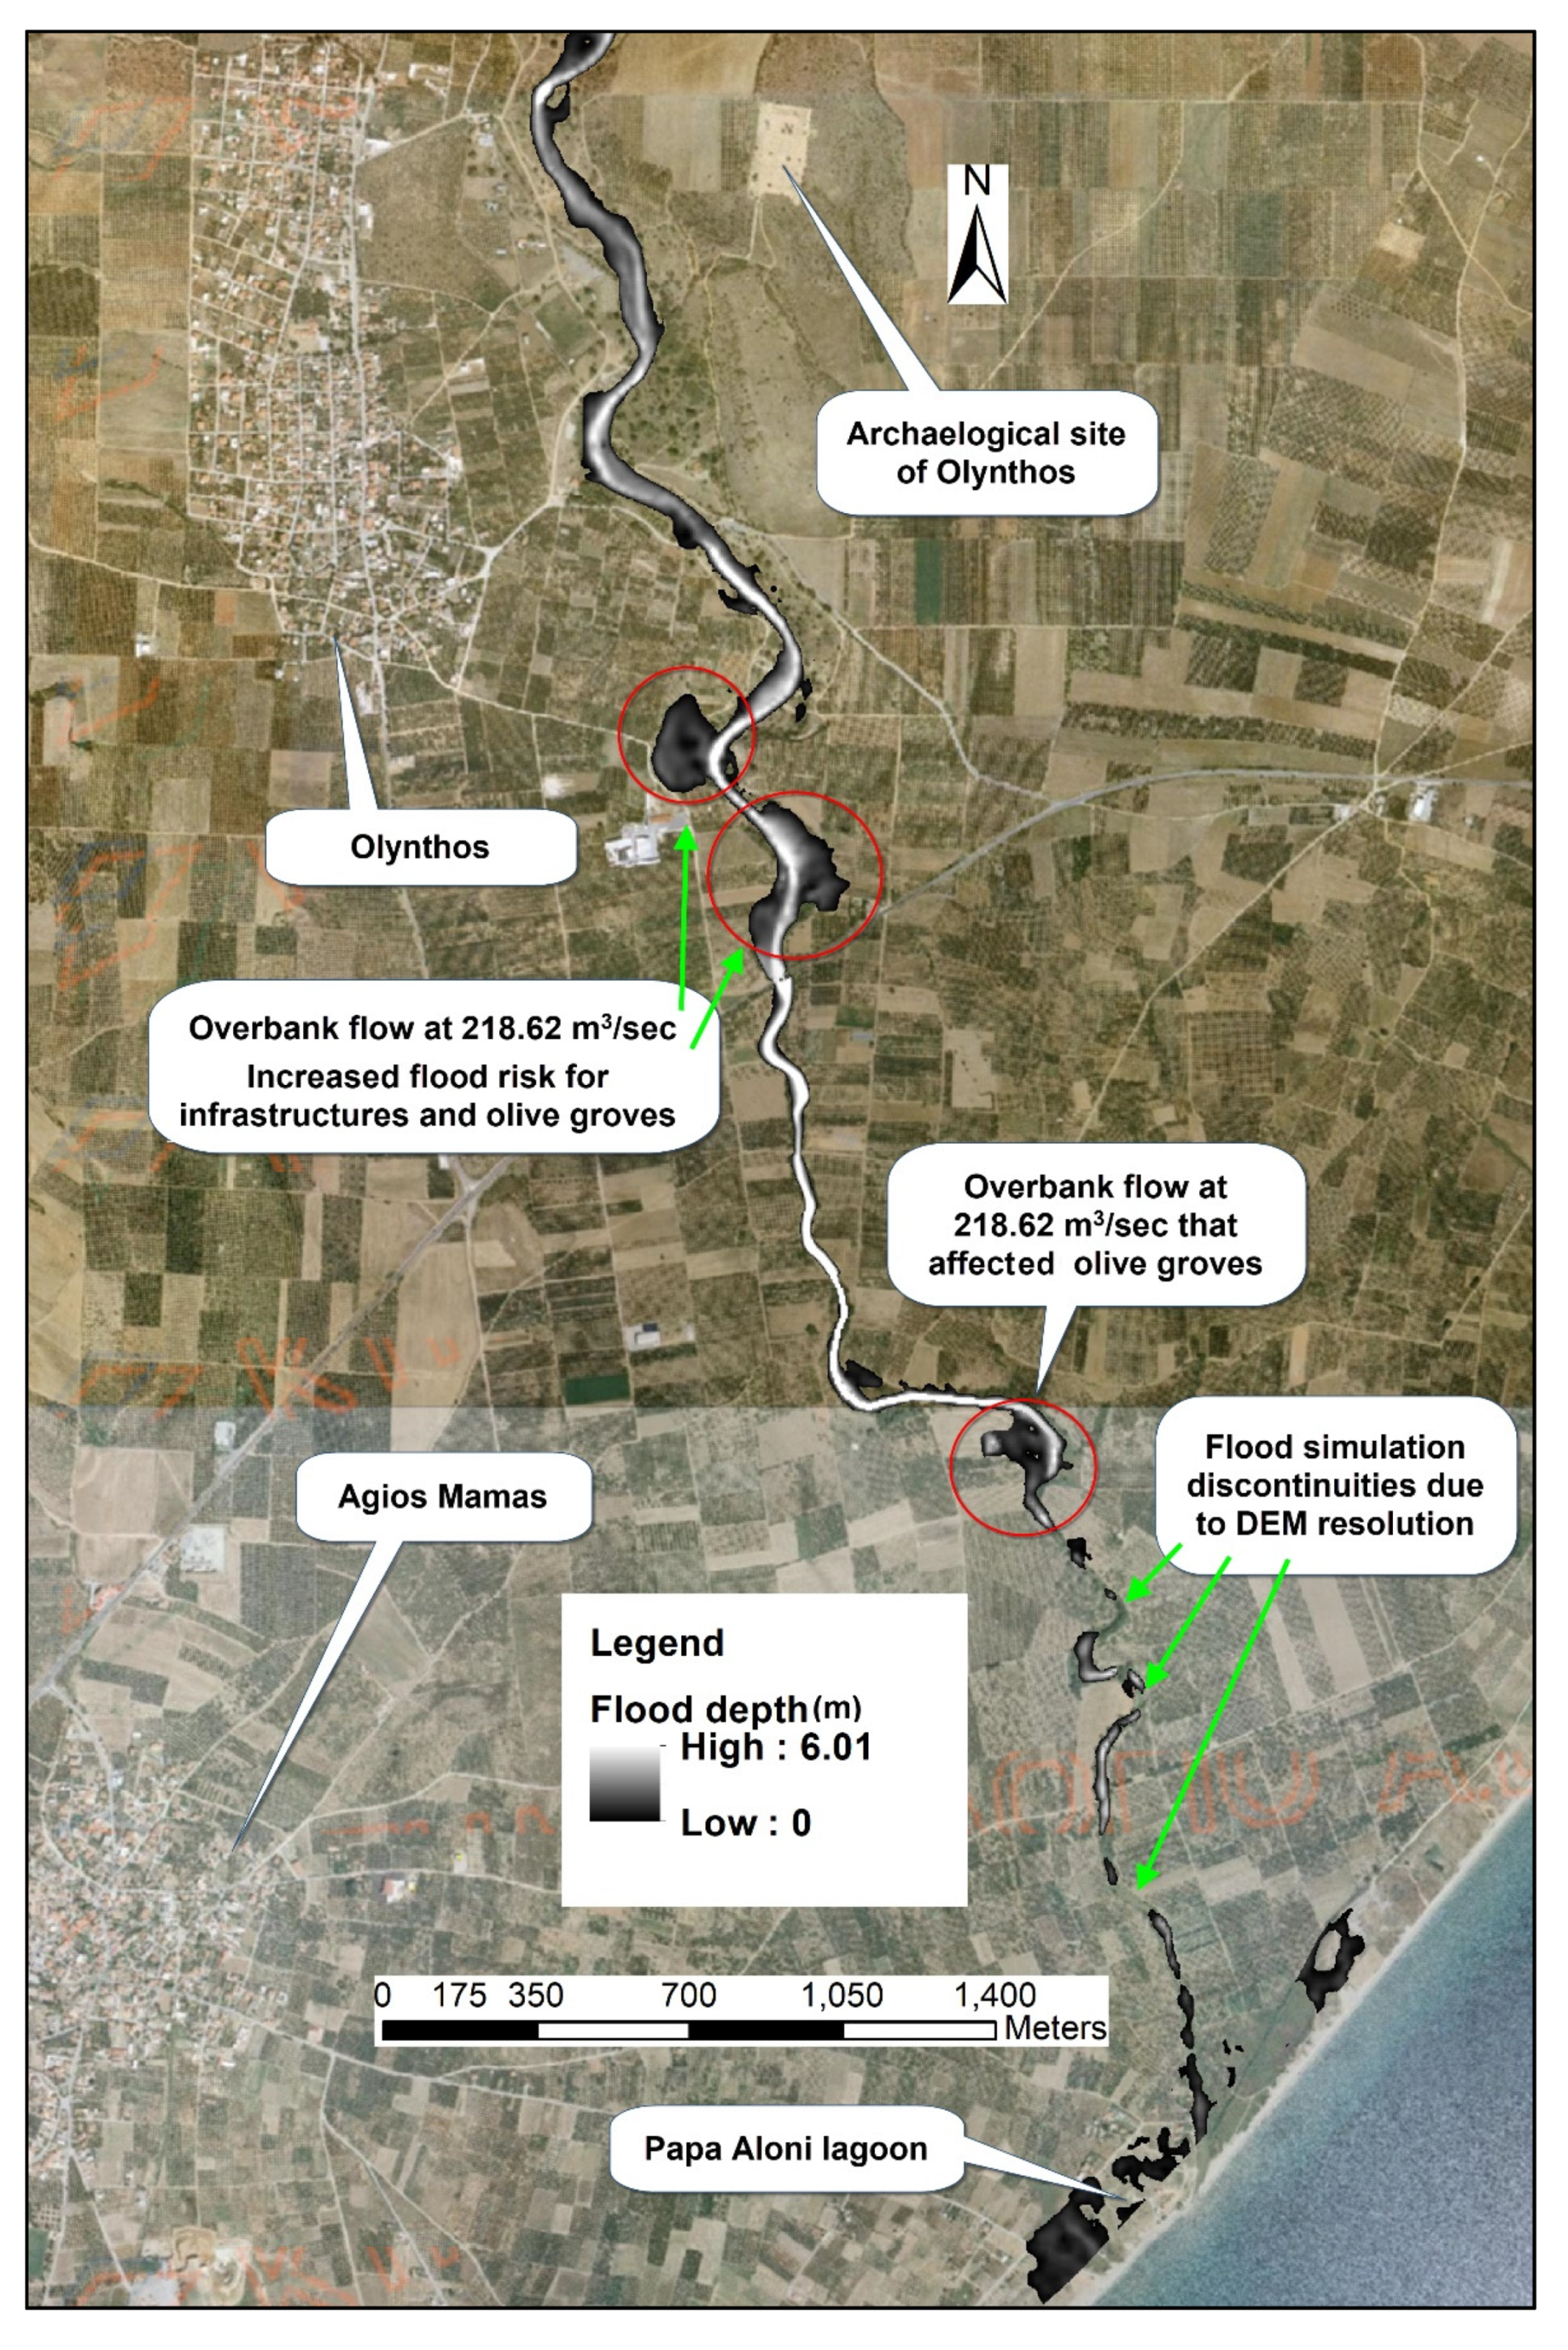
3.2. Hydraulic Modeling and Post-Flood Measurements

HEC-RAS software was used to carry out the hydraulic modeling process, using as the flow input the maximum discharges that were calculated through the calibrated SCS-CN model for Kryoneri, Samara, and Paliokastro watersheds. The simulated flood depth and flood extent were compared with the post-flood measurements from Vatonias and Stavros floodplains in order to validate the accuracy of the simulation process.
Regarding the flood simulation for the February 2010 event at the Vatonias floodplain, where the calibration process was implemented, the results showed a remarkable accuracy, especially concerning the flood extent (Figure 16). More specifically, from the comparison of the observed and simulated flood area with the CSI applied, the goodness of fit (FitA %) was 84.23%. The RMSE was calculated by comparing the observed and simulated flood depths at the 25 post-flood measurement points of the Vatonias floodplain, and RMSE was 0.45 m. The main problem for this floodplain was located in the area near to the coast line, where the dimensions of the main stream width were dramatically reduced and the mean slope of the stream is less than 1%. The problematic conditions increase the possibility of flood events near the coast line, which is depicted in Figure 16. From the results of the statistical analysis (CSI, RMSE) and the simulation of flood depth and extent, it can be concluded that the calibration of the SCS-CN model was detailed and accurate. The calibrated and validated SCS-CN model constitutes a very useful tool that could be utilized in flood risk assessment, flood management, and dimensioning of floods to prevent works in numerous ungauged watersheds in the Mediterranean region.
Regarding the Stavros floodplain, the simulated flood depth and flood extent were delineated very well compared to the respective observed values. It was not feasible to accurately depict the flood depth because of the dense building blocks. The CSI results of the Stavros floodplain, obtained from the comparison between the observed and the respective modeled inundated areas, revealed that the goodness of fit (FitA %) was 71.38%. The results of the hydraulic model, especially the flood depth, were influenced by the DEM resolution, and for that reason the CSI is high for both floodplains, while the RMSE is increased in the Stavros floodplain compared to Vatonias floodplain. The dense urban structures influenced the DEM and the hydraulic simulation in the Stavros floodplain. CSI values over 65% are generally acceptable [13,56] and show that the accuracy of the flood simulation is very close to the real flood extent. The comparison between the simulated and observed flood depths at the 35 points of the Stavros floodplain showed an acceptable accuracy [13,56], where RMSE was estimated at 0.51 m.

3.3. Critical Locations of Increased Flood Risk

The results of flood simulation in the case of the Kryoneri stream and the comparison between the observed and simulated flood depth and extent values showed an acceptable accuracy. The estimated maximum discharge was 78 m3/sec, slightly lower than the observed discharge that was calculated at the bridge 3 (Figure 17) cross-section (Table 4, Id. 32), which was 84 m3/sec. Minor overflow for bridge 3 was simulated and confirmed by the observed water flow traces that were found on the metal bars of the bridge. Flood simulation showed a critical overbank flow upstream of bridge 3, but at the same point there are no observed flood water marks. This difference between the simulated and observed flood extent could be attributed to the DEM resolution (5 m × 5 m) at the specific location, since the stream width was not accurately dimensioned in the DEM, mainly due to the influence of the dense urban structures and vegetation. The main problem for the Kryoneri stream is that the dimensions of bridge 3 were not the appropriate ones needed to successfully channel the peak discharge. Approximately 100 m upstream of bridge 3, the maximum discharge capability was calculated at 121.10 m3/sec, while the maximum discharge capability of the bridge was 84 m3/sec (Figure 17), which is considered a very significant decrease (30.6 %) and is the primary cause of flood generation in the Kryoneri stream.
With regard to the western streams (Samara and Paliokastro), the calculated sum of the peak discharge was 45.7 m3/sec, while the maximum discharge capability of the two existing bridges was 15.68 m3/sec (Figure 17, bridge 1, Id. 1) and 39.52 m3/sec (Figure 17, bridge 2, Id. 13).
These two bridges overflowed during the flood event of June 2018, causing significant problems at the west side of the Stavros settlement. According to the field survey, the overbank flow began at the contribution point of the two streams (Samara and Paliokastro, Figure 17, red circle), where the main stream is a cement country road (Figure 18). The water flowed downstream following the shortest route to the sea through the buildings and cropland. The comparison between the orthoimages dating from 1945 and 2007 revealed the total extinction of the Samara natural main stream (Figure 17) and the diversion of the stream using earthen levees (Figure 18), a fact that increases the flood hazard west of the Stavros settlement.

3.4. Discusion on Flood Generation Causes

According to the results, the main causes of flood generation in the western streams of the Stavros floodplain were: (i) the total extinction of the natural route of the Samara main stream, (ii) the diversion of the main stream using levees constructed by loose earth materials, (iii) the use of a cement road as the main stream, and (iv) the insufficient dimensions of bridges 1 and 2 (Figure 18).
The hydraulic modeling applied in the four watersheds revealed that the flood hazard is very intense, mainly because of the human interference that is associated with the alternation of the natural route, the hydraulic characteristics of the main streams, and insufficient technical works (bridges, culverts, etc.) parallel to the intense urban sprawl on the floodplains and coastal zone of the study area. Faccini et al. [10] found that the urban sprawl and the reduction of the stream width significantly influence the flash flood risk. There is a strong relation between the intense urbanization of the Mediterranean coastal watersheds and the increase of the flash flood risk [59]. Respectively, Diakakis et al. [11] in their research on the causes of the flood of Mandra in 2017 (Greece) indicate the influence of human interference that concerns the total alternation of the main stream dimensions and flow paths. Additionally, Segura-Beltrán et al. [13] analyzed the flash flood of the Girona River (Spain) in 2007 and found that some human-induced factors, such as artificially narrow stream width, walls, and roads, caused the overbank flow. Similar findings from other researches [12,36,60,61,62,63] in watersheds very close to the study area (Chalkidiki region) showed the significant influence of insufficient dimensions of technical works, which increased the flash flood generation potential and its impact.
With regard to the land uses, the fact that a significant part of the watershed area is covered by dense coniferous and broadleaved forests but that this was proven to be insufficient to reduce the peak discharge to a level that would retain the flash flood impact. In fact, forests are not capable of retaining the extreme rainfall amounts, even if the percentage of forested area is significant [10]. More specifically, during extreme rainfall events the European forests have negligible effects on the reduction of maximum discharge [14]. This is attributed to the fact that forest soil water retention capacity is decreases very quickly during an extreme rainfall event, and for this reason AMC is of higher importance than the vegetation type [15,60]. Additionally, research studies conducted within the study area [12,36,61,62] have shown that despite the significant percentage of forested areas, the watersheds of the Chalkidiki region are extremely susceptible to flash flood generation.
Therefore, under these circumstances, it is very important for the achievement of efficient flood prevention plans that hydrologists and policy makers take into account all of the flash flood generation factors in similar Mediterranean environments, focusing on the current hydraulic characteristics of streams and floodplains that directly affect the flow path, flow depth, flow velocity, and maximum discharge. Measures should be taken in cases that technical works are of limited discharge capability in relation to the estimated maximum discharges.

4. Conclusions

Three different flood events were reconstructed using hydrological and hydraulic models that were applied in four small and medium scale typical Mediterranean watersheds in northern Greece. The hydrological and hydraulic models were calibrated and validated in the Vatonias watershed, and the calibrated models were applied in three ungauged watersheds. The flood simulation was validated using post-flood measurements that were recorded after the flash flood of June 2018. The results showed that the vegetation cover was not sufficient to prevent the flash flood generation, especially in small watersheds with short concentration times, despite the almost total coverage of the watersheds area (Kryoneri, Samara, Paliokastro) with dense forests. Additionally, the human interference that influences the hydraulic characteristics of floodplains, such as the alternation of the physical route and dimensions of mains streams, was proven to be the main cause of flash flood generation in the research area.
From a methodological point of view, the revised assessment of CN parameters was confirmed to be a very useful tool for the enhanced and detailed estimation and spatial distribution of CN over the entire watershed area. The results from the hydrological and hydraulic models were validated using post flood measurements, and this process revealed that the methodology was accurate and quite simple to be apply and repeat. This multidisciplinary and integrated methodology can be considered very useful to the research community, as well as to policy makers, for the successful implementation of high-significance protective construction and flood prevention works, flood risk assessment, flood management, and flood mapping in Mediterranean ungauged watersheds.

Author Contributions

A.K. performed the analyses and prepared the manuscript. A.K. and D.S. designed the study. A.K. applied the software. A.K. implemented the validation process. A.K. and D.S. performed the field work. D.S. provided guidance during the whole work. All authors have read and agreed to the published version of the manuscript.

Funding

This research received no external funding.

Conflicts of Interest

The authors declare no conflict of interest.

References

  1. House, P.K.; Baker, V.R. Paleohydrology of flash floods in small desert watersheds in western Arizona. Water Resour. Res. 2001, 37, 1825–1839. [Google Scholar] [CrossRef]
  2. Dhar, N.O.; Nandargy, S. Hydrometeorological aspects of floods in India. Nat. Hazards 2003, 28, 1–33. [Google Scholar] [CrossRef]
  3. Yatheendradas, S.; Wagener, T.; Gupta, H.; Unkrich, C.; Goodrich, D.; Schaffner, M.; Stewart, A. Understanding uncertainty in distributed flash flood forecasting for semiarid regions. Water Resour. Res. 2008, 44, 44. [Google Scholar] [CrossRef]
  4. Barredo, J.I. Major flood disasters in Europe: 1950–2005. Nat. Hazards 2007, 42, 125–148. [Google Scholar] [CrossRef]
  5. Merz, B.; Kreibich, H.; Schwarze, R.; Thieken, A. Assessment of economic flood damage. Nat. Hazards Earth Syst. Sci. 2010, 10, 1679–1724. [Google Scholar] [CrossRef]
  6. Papagiannaki, K.; Lagouvardos, K.; Kotroni, B. A database of high-impact weather events in Greece: A descriptive impact analysis for the period 2001–2011. Nat. Hazards Earth Syst. Sci. 2013, 13, 727–736. [Google Scholar] [CrossRef]
  7. Diakakis, M.; Deligiannakis, G. Flood fatalities in Greece: 1970–2010. J. Flood Risk Manag. 2015, 10, 115–123. [Google Scholar] [CrossRef]
  8. Kundzewicz, W.; Kaczmare, Z. Coping with hydrological extremes. Water Int. 2000, 25, 66–75. [Google Scholar] [CrossRef]
  9. Ebert, A.; Kerle, N.; Stein, A. Urban social vulnerability assessment with physical proxies and spatial metrics derived from air and spaceborne imagery and GIS data. Nat. Hazards 2009, 48, 275–294. [Google Scholar] [CrossRef]
  10. Faccini, F.; Luino, F.; Paliaga, G.; Sacchini, A.; Turconi, L.; de Jong, C. Role of rainfall intensity and urban sprawl in the 2014 flash flood in Genoa City, Bisagno catchment (Liguria, Italy). Appl. Geogr. 2018, 98, 224–241. [Google Scholar] [CrossRef]
  11. Diakakis, M.; Andreadakis, E.; Nikolopoulos, E.I.; Spyrou, N.I.; Gogou, M.E.; Deligiannakis, G.; Katsetsiadou, N.K.; Antoniadis, Z.; Melaki, M.; Georgakopoulos, A.; et al. An integrated approach of ground and aerial observations in flash flood disaster investigations. The case of the 2017 Mandra flash flood in Greece. Int. J. Disaster Risk Reduct. 2019, 33, 290–309. [Google Scholar] [CrossRef]
  12. Sapountzis, M.; Stathis, D. Relationship between Rainfall and Run-off in the Stratoni Region (N. Greece) after the storm of 10th February 2010. Glob. NEST J. 2014, 16, 420–431. [Google Scholar]
  13. Segura-Beltrán, F.; Sanchis-Ibor, C.; Morales-Hernández, M.; González-Sanchis, M.; Bussi, G.; Ortiz, E. Using post-flood surveys and geomorphologic mapping to evaluate hydrological and hydraulic models: The flash flood of the Girona River (Spain) in 2007. J. Hydrol. 2016, 541, 310–329. [Google Scholar] [CrossRef] [Green Version]
  14. De Jong, C. European perspectives on forest hydrology. In Forest Hydrology: Processes, Management and Assessment; Amatya, D., Williams, T., Bren, L., De Jong, C., Eds.; CABI: Wallingford, UK, 2016; pp. 69–87. [Google Scholar]
  15. Hegg, C. Waldwirkung auf Hochwasser (Forest impacts on floods). LWF Wissen 2006, 55, 29–33. [Google Scholar]
  16. Pilgrim, D.H.; Chapman, T.G.; Doran, D.G. Problems of rainfall-runoffmodeling in arid and semiarid regions. Hydrol. Sci. J. 1988, 33, 379–400. [Google Scholar] [CrossRef]
  17. Smith, D.I. Flood damage estimation-a review of urban stage-damage curves and loss functions. Water SA 1994, 20, 231–238. [Google Scholar]
  18. Anselmo, V.; Galeati, G.; Palmieri, S.; Rossi, U.; Todini, E. Flood risk assessment using an integrated hydrological and hydraulic modeling approach: A case study. J. Hydrol. 1996, 175, 533–554. [Google Scholar] [CrossRef]
  19. Vélez, J.J.; Puricelli, M.; López Unzu, F.; Francés, F. Parameter extrapolation to ungauged basins with a hydrological distributed model in a regional framework. Hydrol. Earth Syst. Sci. 2009, 13, 229–246. [Google Scholar] [CrossRef] [Green Version]
  20. Braud, I.; Roux, H.; Anquetin, S.; Maubourguet, M.M.; Manus, C.; Viallet, P.; Dartus, D. The use of distributed hydrological models for the Gard 2002 flash flood event: Analysis of associated hydrological processes. J. Hydrol. 2010, 394, 162–181. [Google Scholar] [CrossRef] [Green Version]
  21. Booij, M.J. Impact of climate change on river flooding assessed with different spatial model resolutions. J. Hydrol. 2005, 303, 176–198. [Google Scholar] [CrossRef]
  22. Myronidis, D.; Emmanouloudis, D.; Stathis, D.; Stefanidis, P. Integrated flood hazard mapping in the framework of the E.U. directive on the assessment and management of flood risks. Fresenius Environ. Bull. 2009, 18, 102–111. [Google Scholar]
  23. Lacasta, A.; Morales-Hernández, M.; Murillo, J.; García-Navarro, P. An optimized GPU implementation of a 2D free surface simulation model on unstructured meshes. Adv. Eng. Softw. 2014, 78, 1–15. [Google Scholar] [CrossRef]
  24. Kastridis, A.; Stathis, D. The Effect of Rainfall Intensity on the Flood Generation of Mountainous Watersheds (Chalkidiki Prefecture, North Greece). In Perspectives on Atmospheric Sciences; Karacostas, T., Bais, A., Nastos, P., Eds.; Springer International Publishing: Cham, Switzerland, 2017; pp. 341–347. [Google Scholar] [CrossRef]
  25. Soil Conservation Service (SCS). National Engineering Handbook; Section 4; U.S. Department of Agriculture: Washington, DC, USA, 1972. [Google Scholar]
  26. Hydrologic Modeling System HEC—HMS; User’s Manual, Version 4.2; US Army Corps of Engineers, Hydrologic Engineering Center: Davis, CA, USA, 2016.
  27. HEC—RAS. River Analysis System; User’s Manual, Version 4.1; US Army Corps of Engineers, Hydrologic Engineering Center: Davis, CA, USA, 2010.
  28. HEC—GeoRAS. GIS Tools for Support of HEC—RAS Using ArcGIS; User’s Manual, Version 4.2; US Army Corps of Engineers, Hydrologic Engineering Center: Davis, CA, USA, 2009.
  29. Steenhuis, T.; Winchell, M.; Rossing, J.; Zollweg, J.A.; Walters, M. SCS runoff equation revisited for variable-source runoff areas. J. Irrig. Drain. Eng. ASCE 1995, 121, 234–238. [Google Scholar] [CrossRef]
  30. Van Dijk, A.I.J.M. Selection of an appropriately simple storm runoff model. Hydrol. Earth Syst. Sci. 2010, 14, 447–458. [Google Scholar] [CrossRef] [Green Version]
  31. Mitra, S.S.; Wright, J.; Abhisek, S.; Ghosh, A.R. An integrated water balance model for assessing water scarcity in a data-sparse interfluve in eastern India. Hydrol. Sci. J. 2015, 60, 1813–1827. [Google Scholar] [CrossRef]
  32. Rezaei-Sadr, H. Influence of coarse soils with high hydraulic conductivity on the applicability of the SCS-CN method. Hydrol. Sci. J. 2017, 62, 843–848. [Google Scholar] [CrossRef]
  33. Verma, S.; Verma, R.K.; Mishra, S.K.; Singh, A.; Jayaraj, G.K. A revisit of NRCS-CN inspired models coupled with RS and GIS for runoff estimation. Hydrol. Sci. J. 2017, 62, 1891–1930. [Google Scholar] [CrossRef]
  34. Stathis, D.; Sapountzis, M.; Myronidis, D. Assessment of land use change effect on design storm hydrograph using the SCS curve number method. Fresenius Environ. Bull. 2010, 19, 1928–1934. [Google Scholar]
  35. Kastridis, A.; Stathis, D. Natural and Anthropogenic Flash Flood Generation in Mountainous Watersheds—The Case of Apollonia Torrent. In Proceedings of the Protection and Restoration of the Environment XI. Water Resources Management, Thessaloniki, Greece, 3–6 July 2012; pp. 126–135. [Google Scholar]
  36. Nalbantis, Ι.; Lymperopoulos, S. Assessment of flood frequency after forest fires in small ungauged basins based on uncertain measurements. Hydrol. Sci. J. 2012, 57, 52–72. [Google Scholar] [CrossRef]
  37. Kaffas, K.; Hrissanthou, V. Application of a continuous rainfall-runoff model to the basin of Kosynthos river using the hydrologic software HEC-HMS. Glob. NEST J. 2014, 16, 188–203. [Google Scholar]
  38. Kastridis, A.; Kamperidou, V. Evaluation of the post-fire erosion and flood control works in the area of Cassandra (Chalkidiki, North Greece). J. For. Res. 2015, 26, 209–217. [Google Scholar] [CrossRef] [Green Version]
  39. Yannopoulos, S.; Eleftheriadou, E.; Mpouri, S.; Giannopoulou, I. Implementing the Requirements of the European Flood Directive: The Case of Ungauged and Poorly Gauged Watersheds. Environ. Process. 2015, 2, 191–207. [Google Scholar] [CrossRef] [Green Version]
  40. Soulis, K.X.; Valiantzas, J.D.; Dercas, N.; Londra, P.A. Analysis of the runoff generation mechanism for the investigation of the SCS-CN method applicability to a partial area experimental watershed. Hydrol. Earth Syst. Sci. 2009, 13, 605–615. [Google Scholar] [CrossRef] [Green Version]
  41. Soulis, K.X.; Ntoulas, N.; Nektarios, P.; Kargas, G. Runoff reduction from extensive green roofs having different substrate depth and plant cover. Ecol. Eng. 2017, 102, 80–89. [Google Scholar] [CrossRef]
  42. Soulis, K. Estimation of SCS Curve Number variation following forest fires. Hydrol. Sci. J. 2018, 63, 1332–1346. [Google Scholar] [CrossRef]
  43. Papaioannou, G.; Efstratiadis, A.; Vasiliades, L.; Loukas, A.; Papalexiou, S.M.; Koukouvinos, A.; Tsoukalas, I.; Kossieris, P. An Operational Method for Flood Directive Implementation in Ungauged Urban Areas. Hydrology 2018, 5, 24. [Google Scholar] [CrossRef] [Green Version]
  44. USDA, United States Department of Agriculture. Urban Hydrology for Small Watersheds, Technical Release 55 (TR-55), 2nd ed.; Natural Resources, Conservation Service, Conservation Engineering Division: Washington, DC, USA, 1986. [Google Scholar]
  45. Efstratiadis, A.; Koutsoyiannis, D.; Mamassis, N.; Dimitriadis, P.; Maheras, A. Literature Review of Flood Hydrology and Related Tools, DEUCALION—Assessment of Flood Flows in Greece under Conditions of Hydroclimatic Variability: Development of Physically-Established Conceptual-Probabilistic Framework and Computational Tools. Available online: https://www.itia.ntua.gr/getfile/1215/1/documents/Report_WP3_1_1.pdf (accessed on 13 November 2019).
  46. Chow, V.T.; Maidment, D.R.; Mays, L.W. Applied Hydrology; McGraw-Hill: New York, NY, USA, 1988; p. 572. ISBN 0 07-010810-2. [Google Scholar]
  47. CORINE Land Cover. European Environment Agency (EEA) 2012. Available online: https://land.copernicus.eu/pan-european/corine-land-cover/clc-2012 (accessed on 22 October 2019).
  48. Arhonditsis, G.; Giourga, C.; Loumou, A.; Koulouri, M. Quantitative Assessment of Agricultural Runoff and Soil Erosion Using Mathematical Modeling: Applications in the Mediterranean Region. Environ. Manag. 2002, 30, 434–453. [Google Scholar] [CrossRef]
  49. Romero, P.; Castro, G.; Gómez, J.A.; Fereres, E. Curve Number Values for Olive Orchards under Different Soil Management. Soil Sci. Soc. Am. J. 2007, 71, 1758–1769. [Google Scholar] [CrossRef]
  50. Mitsopoulos, I.D.; Mironidis, D. Assessment of Post Fire Debris Flow Potential in a Mediterranean Type Ecosystem. In Proceedings of the First International Conference on Monitoring, Simulation, Prevention and Remediation of Dense and Debris Flows, Rhodes, Greece, June 7–9 2006; pp. 221–229. [Google Scholar] [CrossRef] [Green Version]
  51. Ioannou, K.; Myronidis, D.; Lefakis, P.; Stathis, D. The use of Artificial Neural Networks (ANNs) for the forecast of precipitation levels of Lake Doirani (N. Greece). Fresenius Environ. Bull. 2010, 19, 1921–1927. [Google Scholar]
  52. Socolofsky, S.A.; Adams, E.E.; Entekhabi, D. Disaggregation of daily rainfall for continuous watershed modeling. J. Hydrol. Eng. 2001, 6, 300–309. [Google Scholar] [CrossRef]
  53. Choi, J.; Socolofsky, S.A.; Olivera, F. Hourly Disaggregation of Daily Rainfall in Texas Using Measured Hourly Precipitation at Other Locations. J. Hydrol. Eng. 2008, 13, 476–487. [Google Scholar] [CrossRef] [Green Version]
  54. Ministry of Environment, Planning and Public Works of Greece. Drainage of Hydraulic Road Works. In Guidelines for the Study of Road Works; General Secretariat for Public Works, Directorate of Road Constructions: Athens, Greece, 2002. [Google Scholar]
  55. Koenig, T.A.; Bruce, J.L.; O’Connor, J.E.; McGee, B.D.; Holmes, R.R., Jr.; Hollins, R.; Forbes, B.T.; Kohn, M.S.; Schellekens, M.; Martin, Z.W.; et al. Identifying and preserving high-water mark data: U.S. Geol. Surv. Tech. Methods 2016, 3, 47. [Google Scholar]
  56. Altenau, E.H.; Pavelsky, T.M.; Bates, P.D.; Neal, J.C. The effects of spatial resolution and dimensionality on modeling regional scale hydraulics in a multichannel river. Water Resour. Res. 2017, 53, 1683–1701. [Google Scholar] [CrossRef] [Green Version]
  57. Bates, P.D.; De Roo, A. A simple raster-based model for flood inundation simulation. J. Hydrol. 2000, 236, 54–77. [Google Scholar] [CrossRef]
  58. Giandotti, M. Previsione delle piene e delle magre dei corsi d’acqua. Ministero LL.PP. In Memorie e Studi Idrografici; Servizio Idrografico Italiano: Rome, Italy, 1934; p. 13. (In Italian) [Google Scholar]
  59. Jodar-Abellan, A.; Valdes-Abellan, J.; Pla, C.; Gomariz-Castillo, F. Impact of land use changes on flash flood prediction using a sub-daily SWAT model in five Mediterranean ungauged watersheds (SE Spain). Sci. Total Environ. 2019, 657, 1578–1591. [Google Scholar] [CrossRef] [PubMed]
  60. Schleppi, P. Forested water catchments in a changing environment. In Forest Management and the Water Cycle: An Ecosystem-Based Approach; Bredemeier, M., Cohen, S., Godbold, D.L., Lode, E., Pichler, V., Schleppi, P., Eds.; Ecological Studies; Springer: New York, NY, USA, 2011; Volume 212, pp. 89–110. [Google Scholar]
  61. Stathis, D.; Stefanidis, P. Analysis of the Conditions of Flood Formation in Torrents in Area of North Chalkidiki (Greece) in October 2000. In Proceedings of the Conference: Third Balkan Scientific Conference, Study, Conservation and Utilization of Forest Resources, Sofia, Bulgaria, 2–6 October 2001; Volume 3, pp. 213–222. [Google Scholar]
  62. Stefanidis, P.; Kalinderis, I.; Tziaftani, F. The Cause and the Mechanism of the 7–8 October 2006 Flood at Olympiada Chalkidiki (north Greece). In Proceedings of the International Conference Erosion and Torrent Control as a Factor in Sustainable River Basin Management, Belgrade, Serbia, 25–28 September 2007. [Google Scholar]
  63. Myronidis, D.; Ioannou, K. Forecasting the Urban Expansion Effects on the Design Storm Hydrograph and Sediment Yield Using Artificial Neural Networks. Water 2019, 11, 31. [Google Scholar] [CrossRef] [Green Version]
Figure 1. The four watersheds included in the study area.
Hydrology 07 00012 g001
Figure 2. Rainfall intensity at Polygyros observatory during the October 2006 flood event.
Hydrology 07 00012 g002
Figure 3. Rainfall intensity at Asprovalta observatory during the June 2018 flood event.
Hydrology 07 00012 g003
Figure 4. Location of the rainfall observatories used for the hydrologic modeling (the observatories marked in red are no longer in operation).
Hydrology 07 00012 g004
Figure 5. Rainfall intensity at Stratoni, Polygyros, and Arnaia observatories during the February 2010 flood event.
Hydrology 07 00012 g005
Figure 6. Rainfall intensity at Stratoni, Polygyros, and Arnaia observatories during the September 2014 event.
Hydrology 07 00012 g006
Figure 7. Rainfall intensity at Stratoni, Polygyros, and Arnaia observatories during the October 2014 event.
Hydrology 07 00012 g007
Figure 8. Relation between mean annual precipitation and altitude.
Hydrology 07 00012 g008
Figure 9. Post-flood points and observed flood extent (blue area) at the Stavros floodplain.
Hydrology 07 00012 g009
Figure 10. Post-flood points and observed flood extent (blue area) at the Stavros floodplain.
Hydrology 07 00012 g010
Figure 11. Flowchart of the methodology, data, models, and software that were used. Curve Number, CN; SCS-CN, Soil Conservation Service Curve Number; HEC-HMS, Hydrologic Engineering Center’s-Hydrologic Modeling System; HEC-RAS, Hydrologic Engineering Center’s-River Analysis System.
Hydrology 07 00012 g011
Figure 12. Observed and simulated (after the model calibration) hydrographs for the October 2006 flood event at Vatonias stream.
Hydrology 07 00012 g012
Figure 13. Observed and simulated (after the model calibration) hydrographs of the October 2010 flood event at Vatonias stream.
Hydrology 07 00012 g013
Figure 14. Simulated hydrograph of the June 2018 flood event at Kryoneri stream (east Stavros).
Hydrology 07 00012 g014
Figure 15. Simulated hydrographs of the June 2018 flood event at Samara and Paliokastro streams (west Stavros).
Hydrology 07 00012 g015
Figure 16. Simulation of the February 2010 flood event at the Vatonias stream.
Hydrology 07 00012 g016
Figure 17. Simulation of June 2018 flood event at Kryoneri, Samara, and Paliokastro streams.
Hydrology 07 00012 g017
Figure 18. Display of flood marks and infrastructures that alter flow propagation.
Hydrology 07 00012 g018
Table 1. Coding of geomorphology characteristics for estimation of the reference value of the CN parameter (CNΙΙ,20). Note: iPERM represents water permeability; iVEG represents land uses; iSLOPE represents drainage capability.
Water PermeabilityiPERMVegetation DensityiVEGDrainage CapabilityiSLOPE
Very high1Very dense1Negligible1
High2Dense2Low2
Medium3Sparse3Medium3
Low4Very sparse4High4
Very low5No vegetation5Very high5
Source: Deucalion 2014.
Table 2. Classification of antecedent moisture classes (AMC) for the Soil Conservation Service (SCS) method of rainfall abstractions ([20], Table 4.2. p. 4.12.).
AMC GroupTotal 5-day Antecedent Rainfall (mm)
Dormant SeasonGrowing Season
ILess than 13Less than 35
II13 to 2835 to 53
IIIOver 28Over 53
Table 3. Water permeability (iPERM) classes based on the soil and geological characteristics of the basin and the dominant type of construction.
Water Permeability (iPERM)Soil CharacteristicsGeological or Hydro-Lithological CharacteristicsStructural Characteristics
Very High
(1)
Very light and well drained soilsHighly karstic carbonates, extensively developed, fragmented limestones, dolomites, marbles-------
High
(2)
Sandy and gravelly soils with a low content of sludge and clayRiver deposits, non-coherent conglomerates, Triassic brecciasVery small settlements
Medium
(3)
Sandy thick soils, sludges and silty soils, sandy clayGranular sediments, schists, cohesive sandstones, slate or fine-grained limestones in alternations with schist formationsSparsely built areas, significant garden development, urban parks
Low
(4)
Fine clay soils, clay soils, soils poor in organic materialsFlysch, metamorphic, plutonic and volcanic rocks, alternations of sands, marls, clays, conglomerates, marl limestones, sandstones, molassic depositsDiscontinuous urban fabric with small gardens
Very Low
(5)
Shallow soils that swell when are wet, claysImpermeable solid rocks (granite)Shopping centers, areas with dense building construction
Source: Deucalion 2014.
Table 4. Vegetation classes (iVEG) based on land cover characteristics.
Vegetation Classes (iVEG)Land Cover Characteristics
Very Dense(1)Forests (coniferous, broad-leaved, mixed)
Dense(2)Transitional woodland-shrubs, orchards, olive groves, riparian vegetation
Sparse(3)Pastures, crops, vineyards, grasslands, shrubs
Very Sparse(4)Sparsely vegetated areas, non-irrigated arable land, dunes, wetlands, discontinuous urban fabric
No vegetation(5)Bare or rocky terrain, artificial surfaces (roads, buildings)
Source: Deucalion 2014.
Table 5. Drainage capacity (iSLOPE) classes based on mean slope and associated soil characteristics.
Drainage Capacity (iSLOPE)Mean Slope (%)Other Characteristics
Negligible(1)0%Inadequate drainage system, frequent and extensive floods, unformed hydrographic network
Low(2)1–2%Significant floodplain areas, occasional floods, poorly formed hydrographic network
Medium(3)2–10%Small floodplain areas, rare floods, shallow, low depth hydrographic network
High(4)10–30%Insignificant floodplain areas, well-formed hydrographic network, existence of artificial drainage network
Very High(5)30%Mountainous relief
Source: Deucalion 2014.
Table 6. Flood depth points at the Vatonias floodplain after the flood in February 2010.
IdStreet NameFlood Depth (m)XY
1Unnamed rural road023.34828740.301443
2Unnamed rural road2.923.34923640.300835
3Archaeological Site of Olynthos1.7523.35224840.2886
4Archaeological Site of Olynthos0.4523.35190740.288491
5Archaeological Site of Olynthos0.2523.35251140.288757
6Unnamed rural road0.8523.35154440.284139
7Unnamed rural road023.35192840.282949
8Unnamed rural road2.5523.34877240.295589
9Unnamed rural road0.123.35327640.285221
10Unnamed rural road0.5523.35142640.283387
11Unnamed rural road0.723.35586440.281469
12Unnamed rural road3.6523.35495240.275934
13Unnamed rural road4.123.35814340.270898
14Provincial road Polygyros: Nea Potidea (bridge)3.9523.35445240.279435
15Unnamed rural road0.923.35380140.280767
16Unnamed rural road0.523.3532940.287081
17Unnamed rural road0.7523.35038440.289853
18Unnamed rural road0.423.34930840.289774
19Unnamed rural road0.523.35219140.284774
20Unnamed rural road0.823.36123140.270093
21Unnamed rural road0.623.36212340.26955
22Olynthos football field0.323.3491440.291372
23Olynthos football field0.4523.34963940.294497
24Olynthos football field0.2523.35109740.292848
25Unnamed rural road0.9523.35442340.285123
Table 7. Flood depth points at the Stavros floodplain after the flood on June 2018.
IdStreet NameFlood Depth (m)XY
1Georgios Papandreou: Bridge 1, west stream1.5523.68986740.665598
2Ellispondou, west main stream1.523.68930340.665266
3Ellispondou, west main stream1.523.68884140.664469
4Ellispondou, west main stream1.523.68906940.664923
5Ellispondou, west main stream1.523.68870940.663935
6Ellispondou, west main stream1.523.68860440.663083
7Samara main stream1.7523.68953740.662564
8Samara main stream1.7523.69031840.662182
9Samara main stream1.7523.69112240.661726
10Samara main stream1.7523.69217340.661267
11Paliokastro main stream1.623.68852140.661993
12West main stream1.623.69080140.66601
13Panagouli: Bridge 2, west stream1.5523.69191440.666361
14Panagouli0.523.69117440.666614
15Georgios Papandreou0.223.69249540.665254
16Georgios Papandreou0.2523.69170640.665261
17Georgios Papandreou0.323.69085440.665392
18Georgios Papandreou0.223.69308440.665251
19Aristoteli0.623.69271940.667151
20Panagouli0.323.69312440.666246
21Georgios Papandreou0.2523.68911940.665768
22Panagouli0.523.69052340.666723
23Georgios Papandreou0.223.68875540.665848
24Panagouli0.1523.68900940.666886
25Aristoteli0.223.69140540.668144
26Aristoteli0.623.69126840.667345
27Kosti Palama0.5523.69307240.668142
28Panagouli0.1523.6940640.666071
29Lambraki0.423.69200340.665803
30Georgios Papandreou0.223.69374340.665236
31Andreas Papandreou023.68933140.668227
32Paleologou: Bridge 3, Kryoneri stream1.5523.70269940.664298
33Xrysostomou Smyrnis, Kryoneri stream023.70248940.663516
34Xrysostomou Smyrnis, Kryoneri stream023.70224640.663572
35Kryoneri stream, near the coast line023.70328540.664876

