Abstract
Drought monitoring needs comprehensive and integrated meteorological and hydrologic data. However, such data are generally not available in extensive catchments. The present study aimed to analyze drought in the central plateau catchment of Iran using the terrestrial water storage deficit index (TSDI). In this arid catchment, the meteorological and hydrologic observed data are scarce. First, the time series of terrestrial water storage changes (TWSC) obtained from the gravity recovery and climate experiment (GRACE) was calculated and validated by the water budget output. Then, the studied area was divided into semi-arid, arid, and hyper-arid zones and the common drought indices of SPI and RDIe within a timescale of 3, 6, and 12 months were calculated to compare the results obtained from the TSDI by using the meteorological data of 105 synoptic stations. Based on the results, the study area experienced a drought with extreme severity and expansion during 2007–2008. The drought spatial distribution map obtained from three indices indicated good conformity. Based on the maps, the severity, duration, and frequency of drought in the semi-arid zone were greater than that in other zones, while no significant drought occurred in the hyper-arid zone. Furthermore, the temporal distribution of drought in all three zones indicated that the TSDI could detect all short- and long-term droughts. The study results showed that the TSDI is a reliable, integrated, and comprehensive index. Using this index in arid areas with little field data led to some valuable results for planning and water resource management.
1. Introduction
Drought is a natural stochastic phenomenon that can involve a bigger area than other natural disasters, thus, it can negatively affect the lives of more people [1]. Drought characterization is very important because this hydrologic phenomenon leads to some economic, agricultural, and social effects in the case of its continuity [2]. The appropriate characterization of drought leads to the prediction of its probable occurrence in the future.
Drought indices are regarded as the quantitative criteria expressing the severity and duration of drought based on the intended use by accumulating the data related to variables such as precipitation, air temperature, evapotranspiration, soil moisture, and the like in the form of a number. Such indices are more functional and useful for studying drought than the raw data of the mentioned variables because each of these indices is developed based on meteorological and hydrologic parameters simultaneously, thus indicating the status of several parameters affecting drought with a number. According to these indices, water resource managers can plan to prepare and encounter the effects of this phenomenon [3,4]. More than 150 drought indices are currently being used worldwide. However, most studies have been conducted based on the indices related to precipitation rate, with other climatic parameters such as air temperature and evapotranspiration rarely considered [5]. Additionally, due to the lack of coherent, reliable, and comprehensive historical data on groundwater and soil moisture, there are fewer indices involved in the groundwater status and water storage in different layers of soil and its related parameters.
The groundwater level is regarded as a very good index for studying drought because the soil water content is very sensitive to drought duration and can report the climatic conditions both inter-annual and annually [6]. Coherent, integrated, and long-term experiments from hydrometeorological, snow gauge, meteorological stations, and observed wells with appropriate spatial distribution should be available to develop drought indices based on parameters like Terrestrial Water Storage (TWS) [7]. Establishing and maintaining such a network, especially in very broad catchments, entail high costs, which makes it almost impossible to study drought with these parameters.
The Gravity Recovery and Climate Experiment (GRACE) is one remote sensing tool that aims to measure the water storage changes and moisture in soil layers at different depths. Knowledge of the changes of terrestrial water storage, groundwater, and soil moisture can develop valuable multi-criteria indices for evaluating drought because these components, unlike the precipitation-based drought indices, indicate the real needs of nature for water [8].
Recent studies have indicated that long-term and short-term droughts can be detected properly by the indices based on GRACE data [9,10,11]. This index has no limitation of the indices related to surface parameters such as soil moisture in low depths, vegetation health status, and runoff because the surface parameters gradually disappear with continuous drought [12]. Thus, they lose the ability to monitor and study the development and severity of drought while the components of depth in long-term droughts could be an appropriate parameter for determining the severity and duration of this phenomenon [13]. It has been proven that the result obtained from the GRACE TWSC is very useful for a better understanding of large-scale hydrological processes and multiyear extreme events [12,14]. Thus, the results of these studies can be helpful in research related to water resource management and climate change [15,16].
Using the drought indices based on meteorological data such as the SPI and RDI in Iran is very common due to the simple calculation of their required parameters such as precipitation and air temperature. However, the study of drought, which is regarded as a progressing phenomenon, with these indices may not be sufficiently precise due to the low number and inhomogeneous spatial distribution of meteorological or hydrologic stations rather than the extent of the area [17,18,19,20].
In the present study, by considering the changes of climate in the studied area, three climatic zones were considered in terms of aridity, then the drought characteristics were identified with three different indices. To calculate the SPI and RDI, the data from 105 meteorological stations with at least 30 years of monthly records were used, and the data of Terrestrial Water Storage Change (TWSC) during 2002–2016 were used to determine the TSDI. Finally, the spatiotemporal distribution of drought was compared based on these indices.
2. Materials and Methods
2.1. The Area under Study
The central plateau catchment of Iran is an arid area with a size of about 825,000 square kilometers including 51% of the total area with a sensitive climate in Iran. In this unique catchment, low-elevated and low-precipitation deserts are located in the center of a region limited by the Alborz Mountains in the north, to the Zagros Mountains in the west and south, and to the Border Mountains of Iran in the east. Thus, there are different climates including high mountains, plains, mountainous lands, salt marsh, and vast desert plains in the central plateau catchment of Iran, which are very different and even contradictory in terms of meteorological parameters. In addition, the shortage of meteorological stations with sufficient data makes the study of water storage changes and drought monitoring difficult. Based on reports from the Ministry of Power, all rivers in the studied area end in lakes, swamps, and internal deserts. Therefore, the studied area is an endorheic catchment with zero input and output water discharge. Furthermore, the volume of surface water can be disregarded in comparison to that of the groundwater reserves used in agriculture, industry, and drinking. Figure 1 illustrates the study area along with the meteorological station located in the area, the topography, and its average precipitation. The central plateau catchment of Iran is located between 48°08 ′to 61°23′E longitude and 26°22′ to 37°28′N latitude.
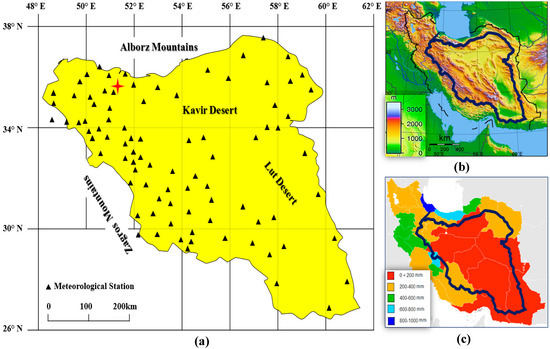
Figure 1.
The area under study. (a) The catchment area and meteorological station located in and around, (b) Topography, (c) Average annual precipitation.
As illustrated in Figure 1, the spatial distribution of meteorological stations in this area is not homogenous. For example, a high density of stations can be observed in the west, while a few stations are available in the central and southeast areas (Figure 1a). The average annual precipitation (Figure 1c) is very low due to the high mountains surrounding this area (Figure 1b).
Based on the reports published by the Ministry of Power, the central plateau of Iran is divided into mountains (44.5%), plains and foothills (41.9%), and deserts and swamps (13.6%). About 75% and 25% of the total precipitation takes place in the mountainous areas and deserts, respectively. Furthermore, based on the same reports, the real evapotranspiration in mountainous areas, plains and foothills, and desert areas is about 64.5%, 81%, and 93.3%, respectively. The hydrologic year in this area usually starts in early October and precipitation reaches its maximum annual rate in the late winter and spring. Additionally, the air temperature increases in March and reaches its maximum in summer.
The location of megacities with a very high population and the need for water in this area should be emphasized. Precipitation and groundwater reserves are the most important source of domestic, industrial, and agricultural water use in this catchment. However, the water from precipitation is mainly reduced by evapotranspiration, and only a slight portion of this amount is stored in the area by penetrating the soil as soil moisture (in low depth) or groundwater (in high depth).
2.2. Meteorological Data
In this arid area, in order to model the water budget and study drought, appropriate data related to meteorological parameters are required (at least 30 years in months). In this catchment, many meteorological stations are available, though the 105 stations located in the catchment and its surroundings, as seen in Figure 1, were selected due to the spatial position and lack of sufficient data at some of these stations.
To study drought and develop the water budget model, the mean data of monthly temperature and monthly accumulative precipitation were collected from these stations. In addition, since the field data of evapotranspiration were not available in this area, this parameter was extracted as a time series from the Global Land Data Assimilation System Version 2.1 (GLDAS_NOAH10_M v2.1). This set of data includes monthly data with a 1° resolution that provides up-to-date global land surface model outputs using observation-based forcing, while preserving the consistency of the long-term climatology to the extent possible [21,22,23].
2.3. The Required Data for GRACE and Method of Calculating Terrestrial Water Storage
The level-2 data (monthly data with resolution 1° × 1°) from Release-05 (RL-05) produced at the Center for Space Research (CSR), Austin, Texas, USA were used to calculate the terrestrial water storage changes in the central plateau catchment of Iran. The period from April 2002 to March 2016 was selected as the time interval to coincide with the first full month when the GRACE data were available. To smooth the satellite data, the homogeneous Gaussian filter with a radius of 300 km was used.
2.4. Validation of Water Storage Changes
In many studies, the GRACE TWSC have been compared and calibrated with hydrological models or geophysical methods [24]. In this catchment, no accurate and complete hydrologic model was available. To evaluate the TWSC resulting from GRACE, a water budget model should be developed to specify the water storage changes in the catchment. For this purpose, the water balance equation was used as follows [25]:
where S is the water storage volume in the earth; P is precipitation; ET is evapotranspiration; and Q is the output runoff from the catchment. The output runoff of this catchment can be determined from the hydrometeorological stations at the desired catchment borders. As it is endorheic, the output water volume of this catchment equals zero. Thus, based on the above equation, the water storage changes in the catchment can be calculated by subtracting the amount of precipitation from evapotranspiration over the desired time interval [14]. Furthermore, we used mascon solutions of the GRACE data [26] to illustrate the time series for the variability in the terrestrial water storage in the studied area and compared it with TWSC results from GRACE [27].
2.5. Classification of the Area Based on Aridity
As a general definition, aridity is defined as the shortage of moisture in an area [28]. Aridity has many conceptual differences when compared to drought. Aridity is a spatial feature, while drought is a temporal one. In other words, an arid or humid climate are among the fixed meteorological and geographical features of an area while drought is not considered as the fixed feature of an area. However, if the precipitation rate is less than the normal value during a certain time period, the area will face drought in that time period. Indeed, drought can occur in every climatic condition. Therefore, determining whether an area has an arid climate or is humid depends on the rates of precipitation and evapotranspiration [29]. Many different methods have been presented for classifying the level of aridity [30]. The aridity index (AI) in the UNEP (1992) method was defined as the annual precipitation ratio (P) to potential evapotranspiration (PET) in the studied area:
In this method, the potential evapotranspiration is calculated by the Thornthwaite method. The index suggested by UNEP was approved by the Food and Agriculture Organization (FAO) and is widely used as the aridity index worldwide [31].
2.6. Calculation of Drought Indices
2.6.1. Standardized Precipitation Index (SPI)
The Standardized Precipitation Index (SPI) is one of the most effective indices of drought developed by McKee (1993), which is based on the probable precipitation with a specified amount. In other words, each precipitation with a certain amount includes an occurrence probability. These probabilities are standardized as the zero index indicates the precipitation mean. In this case, half of the precipitation is less than the mean, and the other half exceeds the mean. The index is negative for drought and positive during wet years. The SPI will have a larger negative or positive number if an increase takes place in drought and wet conditions. This index is calculated by different time scales to recognize long-term and short-term drought [32]. The main advantage of this index is its simple calculation because, unlike many other drought indices, only precipitation data are required for its determination [33]. SPI can be compared and matched to other indices both in terms of time and place, although it is not significantly affected by climatic and topographic changes [34].
In this study, SPI with 3, 6, and 12-month timescales were used as a comparison with other indices to identify the duration and severity of drought. To calculate SPI, the gamma probability density function was first fitted to the long-term precipitation data (at least 30 years of monthly data) of 105 synoptic meteorological stations. Then, the density function was converted into the cumulative probability function. In the final step, the SPI value was equal to zero average probability, and the variance was equal to precipitation probability as follows:
In Equations (3) and (4), P is the cumulative probability of precipitation with the intended intensity and more. C0, C1, C2, d1, d2, and d3 are the fixed coefficients equal to 2.515517, 0.802853, 0.010328, 1.432788, 0.189269, and 0.001308, respectively. After calculating the SPI for each point in the desired time period, the drought severity was determined using Table 1 [35].

Table 1.
The classification of drought by using SPI and RDIst.
2.6.2. Modified Reconnaissance Drought Index (RDIe)
SPI is the most common index for monitoring the drought severity when a small amount of data are available. However, the shortage of input water to the system compared to its long-term normal amount cannot be merely considered to characterize the drought in one broad area with different climates. Indeed, the balance between precipitation and water need should be considered in defining the drought. In defining the RDI, the amount of precipitation and potential evapotranspiration was considered as the input and output of the meteorological system, respectively. Although the output of the system is actual evapotranspiration, and not the potential, PET was used in this index to avoid complexity in measuring the drought.
The initial value of RDI for the specified time period (k) was obtained through the following equation. The value was calculated for the specified time periods during 1–12 months.
where and represent the precipitation and potential evapotranspiration from the j-th month of the hydrologic year, respectively. As October is the first month of the hydrologic year in the study area, j = 1 belongs to this month.
RDI was calculated by normalized and standardized methods. In the standardization form of this index, the logarithm of the initial values is first derived, and then the standardized RDI is calculated by subtracting the arithmetic mean from them. Finally, the obtained value is divided by the standard deviation (Equation (6)).
where equals and and represent the arithmetic mean and standard deviation, respectively. As the behavior is generally like SPI, it can be used with the same classification. By using these two indices, drought was classified as shown in Table 1 [36].
Furthermore, in the RDI, the precipitation amount was considered as the input for the system while part of the precipitation was not accessible by the plant due to the percolation in the deep layers of soil [37]. Thus, the recorded amount of precipitation at the meteorological stations is not an accurate value for the system input, but rather a part of the precipitation that infiltrates into the root zone, which is called “effective precipitation”, so should be considered as the system input. Effective precipitation depends on many factors such as the status of climatic factors, depth of the root zone at each point, soil structure and texture, land slope, and the previous moisture of the soil. Multiple experimental methods have been suggested for calculating the effective precipitation, among which some can be used locally based on the effective parameters in a specific area [38].
The US. Bureau of Reclamation (USBR) suggested a method for calculating the effective precipitation in arid and semi-arid areas. In this method, the percentage of effective precipitation was specified by classifying the total monthly precipitation. The effective precipitation can be obtained by the linear Interpolation of the total monthly precipitation (Table 2) [39].
Table 2.
Estimating the effective precipitation based on the total monthly precipitation classes (U.S. Bureau of Reclamation method).
By replacing the effective precipitation in Equation (5), the initial value of the drought index (RDI) is converted as shown by :
The process of calculating the standardized forms (RDIest) is conducted as per Equation (6) and the drought classification ranges are represented in Table 1. In the present study, RDIest was calculated during 3, 6, and 12-month time intervals.
2.6.3. Terrestrial Storage Deficit Index (TSDI)
The Terrestrial Storage Deficit Index (TSDI) can create a good image of wet years and droughts in the long-term. To calculate the TSDI, the terrestrial storage deficit (TSD) is first calculated cumulatively. The Terrestrial Storage Deficit (TSD) can be determined monthly based on Equation (8):
where represents the terrestrial storage deficit for the i-th year and j-th month. indicates the terrestrial water storage changes in the same year and month, which was calculated based on mm from the GRACE data. is described as the average of terrestrial water storage changes in all j-th months during the desired time period. Moreover, and are the maximum and minimum terrestrial water storage changes in the j-th month, respectively.
TSD can vary from −100 to +100, indicating hyper-arid and hyper-humid conditions, respectively. Accordingly, the TSDI was calculated based on the drought index of the previous month and the TSD of the current month by Equation (9) as follows:
To calculate the p and q coefficients in the above equation, the TSD was first drawn cumulatively (vertical axis) versus time (horizontal axis), and then the best possible line was fit into this graph (Figure 2).
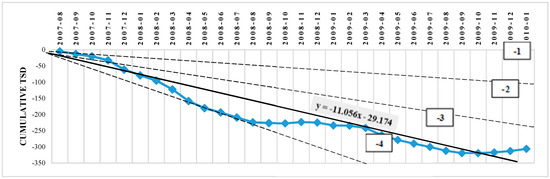
Figure 2.
Terrestrial Storage Deficit (TSD) Cumulative graph and division of this graph area into four equal parts.
The slope of this line is called m, the y-intercept is b, and the above coefficients can be calculated by Equation (10) [11]:
Palmer divided droughts into four groups in terms of severity. Based on this classification, the value of parameter c was extracted from Table 3.
Table 3.
The determination of the coefficient c by using the Palmer classification.
Here, the drought severity can be determined based on the SPI, and parameter c is determined based on Table 1 and Table 3. By considering parameters c = −3, m = −11.056, and b = −29.174, p and q can be determined using Equation (10) as p = 0.7252 and q = 0.0746. Substituting the p and q amounts in Equation (11), the TSDI in the basin was obtained using Equation (11).
where TSDI for the first month needs TSDI0, which will be 2% of TSD1, according to [13]. Finally, the conditions of the desired area were evaluated by calculating the TSDI based on Table 4 [40].
Table 4.
The classification of the area condition by using TSDI.
3. Results
3.1. Classifying the Area Based on Aridity
The area was classified by the UNEP (1992) method based on the aridity level. Accordingly, 10% of the area mostly included the central and southeast areas of the Iran central plateau located in the hyper-arid zone, 73% of the area belonged to the cities around deserts and plains in the arid zone, and the other areas mainly included higher elevated areas located in the semi-arid zone. In this catchment, no area had humid or sub-humid climates. Table 5 indicates the climate classification ranges in the UNEP. Figure 3 illustrates the spatial distribution of each zone with different climates in the area under study.
Table 5.
The classification of the area based on the aridity severity by using the UNEP method (1992).
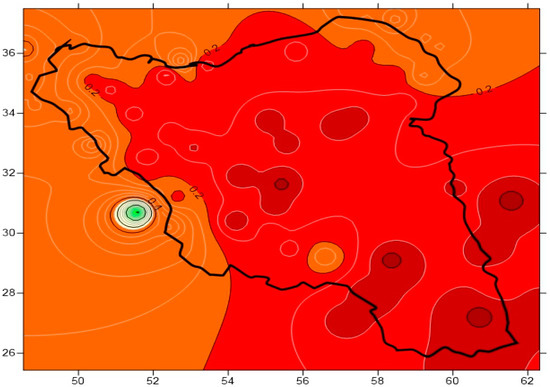
Figure 3.
The spatial distribution of the zones with different aridity.
Aridity is formed due to high atmospheric pressure, continental winds, rain shadow effect, and cold ocean currents [28,41,42]. The composition of some suggested phenomena at one point can determine the aridity severity at that point [43]. For example, most of the mentioned parameters exist in the southeast and central desert plains of the studied area (located in the latitude between 20° and 30°), which are located in the hyper-arid zone. However, there was less air temperature and cold ocean current effects in the northwest and northeast parts of the studied area (located in the latitudes higher than 30°). Thus, this part of the area belonged to the semi-arid zone. The regions between these two areas with interstitial conditions are zoned as arid.
3.2. Assessing the Evapotranspiration Data of GLDAS
The actual evapotranspiration is regarded as one of the factors affecting the water budget, although there are no integrated and reliable data due to the complexity of measurement and its variation from one point to another in a wide area like the Iran central plateau. Evapotranspiration depends on many factors, while air temperature and precipitation are two of the most effective parameters. Since precipitation mostly occurs in winter and early spring and the maximum air temperature takes place in summer, it seems that evapotranspiration should not be more significant in these two seasons. Thus, as illustrated in Figure 4, the maximum evapotranspiration occurred in late spring (May) when the two necessary parameters of precipitation and temperature were simultaneously present. However, the evapotranspiration was almost zero in summer when the air temperature was the highest due to the lack of precipitation.
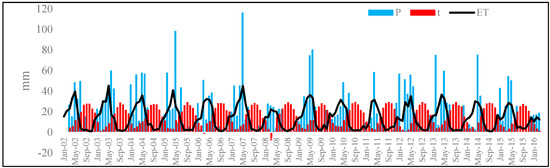
Figure 4.
The precipitation, temperature, and evapotranspiration anomalies from 2002 to 2016.
3.3. The Comparison of GRACE Recovered TWSC by Water Budget
The TWSC for the Iran central plateau from April 2002 to 2016 was calculated by using the GRACE data. To validate the time series, the TWSC was compared to the results obtained from the water budget model. The TWSC varied from −133.9 to 89 mm and the maximum and minimum time series obtained from the water budget were −32.9 and 44.8 mm, respectively. The two vertical axes were used for a better comparison of these two time-series fluctuations, where the left axis related to the equivalent water height (EWH) through GRACE, and the right axis indicated the changes of this parameter through the water budget equation. In every time series, the periodic seasonal changes were completely obvious with relatively good conformity to each other. The peak of these series occurred in the late winter and early spring when the area received several consecutive months of precipitation of more than the annual average, and the rate of evapotranspiration was lower. Its minimum annual temperature occurred in summer when the precipitation was often close to zero, and air temperature was considerably more than the annual average.
Since the water budget equation excluded the parameters of soil moisture and groundwater, the range of changes in the TWSC resulting from the water budget with the GRACE TWSC was different. In the studied area, rainfall was regarded as almost the only source of groundwater recharge. Therefore, increasing the amount of the stored water in underground reservoirs depends on the rainfall season. Then, the water storage changes were similar in terms of trend and frequency while they were different in terms of the range of changes. As illustrated in Figure 5, a negative trend in the GRACE TWSC was observed from 2008 onwards, leading to the separation of its time series from the water budget output. This negative trend with the slope of −0.72 resulted from the significant lapse of annual precipitation in this time period and the irregular withdrawal of groundwater in this highly populated catchment.
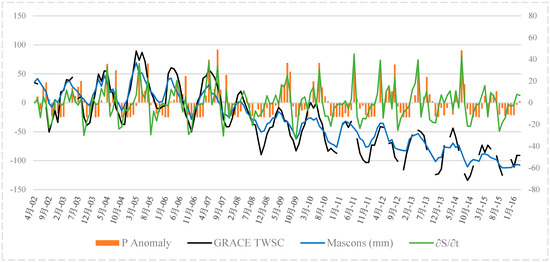
Figure 5.
Comparison of the TWSC resulting from the GRACE data for the water budget and precipitation anomalies.
3.4. Spatial Distribution of Drought by SPI, RDIe, and TSDI
As shown in Figure 6, the long-term average of annual precipitation was slightly more than 150 mm. The precipitation rate decreased during the 2007–2008 hydrologic year when the total amount of precipitation was less than 50 mm leading to the most arid year since 2002. Precipitation returned to its normal value in 2009, while it declined to less than the average level during 2010 and 2011. As previously mentioned, the main source of groundwater recharge in this area is precipitation leading to the good accordance of the precipitation anomaly diagram with the GRACE TWSC. Thus, both drought indices based on meteorological and GRACE data during 2007–2008 should have an extensive drought with different degrees in the catchment.
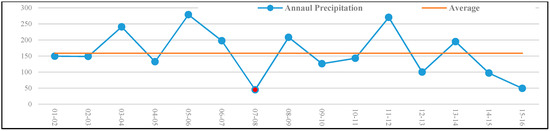
Figure 6.
Comparison of annual precipitation fluctuations in the studied area with the long-term average.
The spatial distribution of drought severity based on SPI, RDIe, and TSDI during 2007–2008 is shown in Figure 7a–c, respectively. The map of the first two indices calculated by discrete data such as temperature and precipitation was plotted using the Kriging method. All three figures show that about 90% of the area suffered from drought with different intensities.
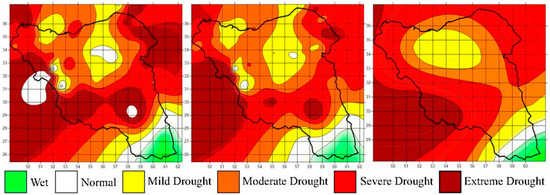
Figure 7.
Spatial distribution and drought intensity during the 2007–2008 hydrologic year based on three drought indices. (a) SPI; (b) RDIe; (c) TSDI.
Based on the SPI, a narrow strip of the west and northeast parts and parts of the central area experienced extreme drought while the maps resulting from the RDIe and TSDI showed only the western parts in extreme drought. The southeast parts of the studied area based on all three indices showed the wet condition, normal, mild, and moderate drought, respectively, which had very good conformity. In addition, the central parts experienced severe drought and as we moved toward the northern borders of the area, the drought intensity was reduced and areas with mild and moderate drought were observed. In this part, all three maps were matched to each other. Most areas located in the hyper-arid zone by climatic classification (the southeast areas and small parts of the center) faced less damage due to the drought, which indicated that such areas were more resistant against the occurrence of drought when compared to others. The SPI allocated more areas to extreme drought in comparison to the two other indices due to the lack of attention to the system water need (evapotranspiration) and the full dependency of this index on the precipitation rate. The drought spatial distribution map resulting from the RDIe had a higher correlation to the TSDI. Figure 8 illustrates the percentage of catchment area allocated to different drought intensities based on the indices. The correlation coefficient between the TDSI and RDIe was 83% and was 71% between the TDSI and SPI.
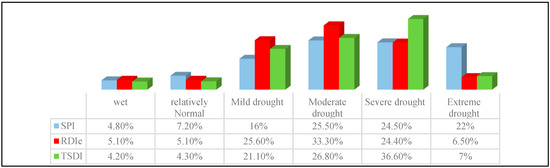
Figure 8.
The percentage of area experiencing different drought intensities based on the SPI, RDIe, and TSDI.
3.5. Temporal Characteristics of Droughts Based on the SPI, RDIe, and TSDI
3.5.1. Semi-Arid Conditions
About 17% of the Iran central plateau consists of the semi-arid zone where the average annual precipitation is about 330 mm. To compare the TSDI to SPI and RDIe, the indices were calculated and drawn with annual, 6-month, and 3-month time intervals (Figure 9). Figure 9a illustrates the changes in the TSDI with precipitation anomalies relative to the long-term precipitation average. The good conformity between these parameters showed that the terrestrial water storage increased whenever the precipitation rate was more than the average level and vice versa. As shown in this figure, the TSDI varied from 4.20 to −4.20 and the precipitation anomaly varied from 105.84 to −27.26.
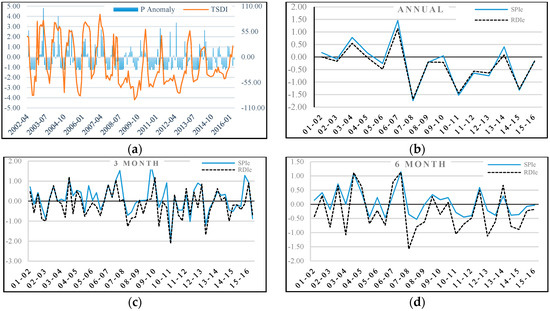
Figure 9.
Drought detection and monitoring in the semi-arid zone of the studied area by (a) TSDI; (b) Annual SPI and RDIe; (c) SPI-3 and RDIe-3; (d) SPI-6 and RDIe-6.
If any drought index stays below −1 during three consecutive months, this time interval is considered as drought. Furthermore, the drought is considered as finished if the index stays over −1 for three months after a drought phenomenon. Accordingly, this area experienced eight droughts with different severity and duration during April 2002–March 2016. Table 6 indicates the duration and severity of all droughts. In arid and semi-arid areas, the short-term droughts were normal and considered to have a high probability of occurrence. However, in the semi-arid area, the TSDI could detect five short-term drought events (less than six months). According to the slope of accumulative TSDI, three of these event were moderate droughts and the two others were severe. In most cases (except for one), the 3-month, 6-month, and annual SPI with a value more than −0.5 could not recognize drought well. However, the 3-month, 6-month, and annual RDIe always recorded drought successfully. However, the severity of all droughts was reported as mild, except for one case of moderate severity. In addition to short-term droughts, the TSDI discovered three long-term droughts for more than one year. The first drought lasted 29 months from August 2007 to January 2010 with the accumulative slope of −3.43. In this time interval, the minimum values of annual SPI and RDIe were calculated as −1.74 and −1.68, respectively. Based on these indices, the drought severity was classified as severe. The second long-term drought took place during June 2010–January 2013. The slope of accumulative TSDI for this drought was −2.91 and was classified as a moderate drought. The minimum values of the annual SPI and RDIe in these 31 months were −1.50 and −1.44, respectively, which were completely consistent with the TSDI. The third drought lasted for 19 months, and the annual TSDI, SPI, and RDIe drought was −1.89, −1.32, and −1.28, respectively. Thus, based on the TSDI, the area was in mild drought conditions at that time while the drought severity was moderate based on the two other indices.
Table 6.
Duration and severity of droughts in the semi-arid zone of the studied area.
3.5.2. Arid Conditions
About 73% of the Iran central plateau is in arid climatic conditions where the annual average precipitation is almost 125 mm. Figure 10 illustrates the drought indices in this arid area. Based on Figure 10a, the TSDI in this area varied from 3.99 to −3.19 and the precipitation anomalies varied from 73.50 to −10.20. In this area, good conformity was observed between the precipitation anomalies with the TSDI. In addition, four droughts including three long-term and one short-term drought were recognized. The short-term drought occurred for four months from November 2009 to February 2010. Neither the SPI and RDIe discovered this phenomenon.
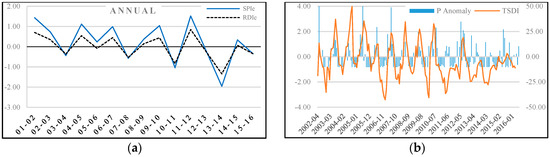
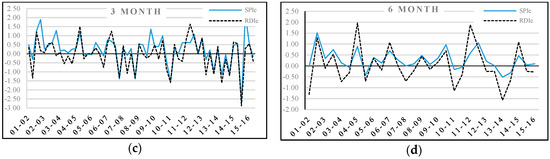
Figure 10.
Drought detecting and monitoring in the arid zone of the studied area by (a) TSDI; (b) Annual SPI and RDIe; (c) SPI-3 and RDIe-3; (d) SPI-6 and RDIe-6.
Table 7 indicates the features related to the duration and severity of droughts. The first event started in August 2006 and continued for 18 months. The minimum value of the TSDI and its accumulative slope were −3.41 and −2.53, respectively. In other words, in this time interval, a moderate drought occurred while this drought was mild in terms of annual SPI and RDIe with values slightly less than −0.5. The second long-term drought continued for 17 months from December 2010 to April 2012. The accumulative slope of the TSDI equal to −2.11 evaluated the severity of this drought as moderate, with good conformity to the annual SPI. However, based on the annual RDIe equal to −0.84, this drought intensity was mild. The last drought started in December 2012 and ended in June 2014. According to the TSDI, this drought, which lasted for 19 months, was reported as mild. Although based on all-time intervals of SPI and RDIe, this phenomenon was reported as moderate (less than −1) or severe (less than −1.5). Only the 6-month SPI estimated this drought as mild.
Table 7.
The severity and duration of droughts in the arid zone of the studied area.
3.5.3. Hyper-Arid Conditions
In the hyper-arid zone, which includes about 10% of the Iran central plateau, the annual average precipitation is about 80 mm. Figure 11 illustrates the TSDI, SPI, and RDIe with different time scales. The TSDI (Figure 11a) showed only one drought lasting for five months beginning in August 2005 with mild severity. According to Table 8, the annual SPI and RDIe evaluated this drought as mild (Figure 11b), while these indices with 3- and 6-month timescales showed the severity of this phenomenon as moderate (Figure 11c,d).
Figure 11.
Drought detecting and monitoring in the hyper-arid zone of the studied area by (a) TSDI; (b) Annual SPI and RDIe; (c) SPI-3 and RDIe; (d) SPI-6 and RDIe-6.
Table 8.
The time and severity of hyper-arid droughts in the area under study.
It is worth noting that other droughts were recognized by the SPI and RDIe in this area (Figure 11b), while no signal was observed in the TSDI. For example, a drought that occurred from 2010 to 2011 was evaluated as severe by an annual SPI of −1.85 and as a moderate drought by an annual RDIe of −1.40. The 3-month and 6-month indices indicated this phenomenon as moderate drought. Similarly, it happened in the 3- and 6-month indices.
4. Discussion
Drought is regarded as a phenomenon with gradual movement and determining its beginning, end, and severity is complicated and ambiguous. Drought monitoring and evaluation requires integrated data from meteorological and hydrologic components. These data were not available in the studied area due to the expansion of the catchment. The current study aimed to conduct spatiotemporal monitoring and analysis of drought using the gravity recovery and climate experiment (GRACE) and compare the results to common indices of drought to present a new method for drought monitoring and evaluating in a broad area with scarce data. A total of 105 stations with monthly data over 30 years were selected for calculating the SPI and RDIe, which requires the meteorological parameters of precipitation and temperature. To validate the trend and variation of the GRACE TWSC, the obtained time series was compared to the water storage changes resulting from the water budget model. It was observed that the trend of changes in these two time-series had good conformity to each other.
To better comprehend the effect of climate on hydrologic phenomena such as drought, the studied area was divided into semi-arid, arid, and hyper-arid zones by using the UNEP (1992) method. In the semi-arid zone, the precipitation anomalies were considerably bigger than that of the other two zones, leading to very different annual average precipitation from one year to another. In the studied time interval, eight droughts occurred in the semi-arid zone for 103 months while four droughts took place in the arid zone for 58 months. In the hyper-arid part, only one drought that lasted five months was detected by the TSDI. Thus, it can be concluded that each area with a higher precipitation average and anomalies is more exposed to multiple, severe, and long-term droughts and vice versa. Table 9 indicates the number of precipitation anomalies versus the long-term average precipitation, TSDI, duration, and frequency of drought that occurred in each zone separately.
Table 9.
Comparison of the range of precipitation anomalies, TSDI, frequency, and total drought durations in each climatic zone (2002 to 2016).
The annual average precipitation in the hydrologic year (2007–2008) dropped to 70% in more than 90% of the studied area, leading to extensive drought in the Iran central plateau. To study the spatial distribution of this extended drought, SPI, RDIe, and TSDI were used as the indices. Although SPI showed that the extreme drought was more extended than the other two indices, there was good conformity among these indices. However, like some recent studies [44], the correlation coefficient of TSDI vs. RDIe was higher than that of TSDI vs. SPI. The maps illustrated that the hyper-arid areas were resistant to this drought and vice versa. Droughts were long and severe in the semi-arid zone while they were moderate and short in the arid zone. Drought indices with a 3-month timescale showed short-term fluctuations of evapotranspiration, which can be used to evaluate the soil moisture status. Indices with a 6-month scale can be used to disregard the periodic seasonal effects, and indices with a 12-month timescale disregarding the short-term effects showed its long-term status in applications to determine the conditions for surface runoff, reservoir storage, and groundwater level. The general conformity of the TSDI by all these indices indicated the comprehensiveness of this index, and considered all of the parameters involved in a drought such as soil moisture and groundwater level.
Despite the comprehensive and integrated TSDI for drought discovery and monitoring, especially in areas where the required in situ data were significantly rare, the several-month delay in accessing the GRACE data and the lack of long-term data were among the disadvantages that cannot be used for the real-time study of drought. These disadvantages can be removed by restarting the follow-on GRACE mission as soon as possible. However, some effects were made to use the numerical algorithms and models to develop the current GRACE TWSC time series, all of which are at the top of the line.
Author Contributions
A.N. wrote the manuscript with support from S.H.G.N., G.J., and S.S.M.N.; G.J. and S.S.M.N. helped supervise the project; A.N. and G.J. conceived the original idea. S.H.G.N. supervised the project; A.N. and G.J. designed the computational framework and analyzed the data; A.N. performed the calculations; A.B. and S.H.G.N. wrote the manuscript with input from all authors; G.J. and S.S.M.N. conceived the study and were in charge of the overall direction and planning; A.N., G.J., and S.S.M.N. contributed to the interpretation of the results. S.H.G.N. took the lead in writing the manuscript. All authors provided critical feedback and helped shape the research, analysis, and manuscript.
Funding
This research received no external funding.
Conflicts of Interest
The authors declare no conflicts of interest.
References
- Wilhite, D.A. The enigma of drought. In Drought Assessment, Management, and Planning: Theory and Case Studies; Kluwer Academic Publishers: Norwell, MA, USA, 1993; pp. 3–15. [Google Scholar]
- Wilhite, D.A. Drought as a Natural Hazard: Concepts and Definitions. In Droughts. A 903 Global Assessment; Routledge: London, UK, 2000; pp. 3–18. [Google Scholar]
- Zink, M.; Samaniego, L.; Kumar, R.; Thober, S.; Mai, J.; Schäfer, D.; Marx, A. The German drought monitor. Environ. Res. Lett. 2016, 11, 074002. [Google Scholar] [CrossRef]
- Lorenz, D.J.; Otkin, J.A.; Svoboda, M.; Hain, C.R.; Anderson, M.C.; Zhong, Y. Predicting, U.S. Drought Monitor States Using Precipitation, Soil Moisture, and Evapotranspiration Anomalies. Part I: Development of a Nondiscrete USDM Index. J. Hydrometeorol. 2017, 18, 1943–1962. [Google Scholar] [CrossRef]
- Keyantash, J.A.; Dracup, J.A. The quantification of drought: An evaluation of drought indices. Bull. Am. Meteorol. Soc. 2002, 83, 1167–1180. [Google Scholar] [CrossRef]
- Frappart, F.; Papa, F.; Güntner, A.; Tomasella, J.; Pfeffer, J.; Ramillien, G.; Moreira, D.M. The spatio-temporal variability of groundwater storage in the Amazon River Basin. Adv. Water Resour. 2019, 124, 41–52. [Google Scholar] [CrossRef]
- Frappart, F.; Ramillien, G. Monitoring groundwater storage changes using the Gravity Recovery and Climate Experiment (GRACE) satellite mission: A review. Remote Sens. 2018, 10, 829. [Google Scholar] [CrossRef]
- Sinha, D.; Syed, T.H.; Famiglietti, J.S.; Reager, J.T.; Thomas, R.C. Characterizing Drought in India Using GRACE Observations of Terrestrial Water Storage Deficit. J. Hydrometeorol. 2017, 18, 381–396. [Google Scholar] [CrossRef]
- Chen, J.L.; Wilson, C.R.; Tapley, B.D.; Yang, Z.L.; Niu, G.Y. 2005 drought event in the Amazon River basin as measured by GRACE and estimated by climate models. J. Geophys. Res. 2009, 114. [Google Scholar] [CrossRef]
- Chen, J.L.; Wilson, C.R.; Tapley, B.D.; Longuevergne, L.; Yang, Z.L.; Scanlon, B.R. Recent La Plata basin drought conditions observed by satellite gravimetry. J. Geophys. Res. Atmos. 2010, 115. [Google Scholar] [CrossRef]
- Yirdaw, S.Z.; Snelgrove, K.R.; Agboma, C.O. GRACE Satellite observations of terrestrial moisture changes for drought characterization in the Canadian Prairie. J. Hydrometeorol. 2008, 356, 84–92. [Google Scholar] [CrossRef]
- Leblanc, M.J.; Tregoning, P.; Ramillien, G.; Tweed, S.O.; Fakes, A. Basin-scale, integrated observations of the early 21st century multiyear drought in southeast Australia. Water Resour. Res. 2009, 45. [Google Scholar] [CrossRef]
- Narasimhan, R.; Srinivasan, R. Development and evaluation of Soil Moisture Deficit Index (SMDI) and Evapotranspiration Deficit Index (ETDI) for agricultural drought monitoring. Agric. For. Meteorol. 2005, 133, 69–88. [Google Scholar] [CrossRef]
- Frappart, F.; Ramillien, G.; Ronchail, J. Changes in terrestrial water storage versus rainfall and discharges in the Amazon basin. Int. J. Climatol. 2013, 33, 3029–3046. [Google Scholar] [CrossRef]
- Tapley, B.D.; Bettadpur, S.; Ries, J.C.; Thompson, P.F.; Watkins, M.M. GRACE measurements of mass variability in the Earth system. Science 2004, 305, 503–505. [Google Scholar] [CrossRef] [PubMed]
- Mo, X.; Wu, J.J.; Wang, Q.; Zhou, H. Variations in water storage in China over recent decades from GRACE observations and GLDAS. Nat. Hazards Earth Syst. Sci. 2016, 16, 469–482. [Google Scholar] [CrossRef]
- Dinpashoh, Y.; Fakheri-Fard, A.; Moghaddam, M.; Jahanbakhsh, S.; Mirnia, M. Selection of variables for the purpose of regionalization of Iran’s precipitation climate using multivariate methods. J. Hydrometeorol. 2004, 297, 109–123. [Google Scholar] [CrossRef]
- Raziei, T.; Saghafian, B.; Paulo, AA.; Pereira, LS.; Bordi, I. Spatial patterns and temporal variability of drought in western Iran. Water Resour. Manag. 2009, 23, 439–455. [Google Scholar] [CrossRef]
- Shahabfar, A.; Eitzinger, J. Spatial and temporal analysis of drought in Iran by using drought indices, European Meteorological Society (EMS). In Proceedings of the 7th European Conference on Applied Climatology (ECAC) (EMS2008), Amsterdam, The Netherlands, 29 September–3 October 2008. [Google Scholar]
- Asadi Zarch, M.A.; Malekinezhad, H.; Mobin, M.H.; Dastorani, M.T.; Kousari, M.R. Drought Monitoring by Reconnaissance Drought Index (RDI) in Iran. Water Resour. Manag. 2011, 25, 3485–3504. [Google Scholar] [CrossRef]
- Beaudoing, H.; Rodell, M. NASA/GSFC/HSL, GLDAS Noah Land Surface Model L4 Monthly 1.0 × 1.0 Degree V2.1; Goddard Earth Sciences Data and Information Services Center (GES DISC): Greenbelt, MD, USA, 2016. [Google Scholar]
- Swenson, S.; Wahr, J. Estimating large-scale precipitation minus evapotranspiration from GRACE satellite gravity measurements. J. Hydrometeorol. 2006, 7, 252–270. [Google Scholar] [CrossRef]
- Rodell, M.; Houser, P.R.; Jambor, U.; Gottschalck, J.; Mitchell, K.; Meng, C.-J.; Arsenault, K.; Cosgrove, A.; Radakovich, J.; Bosilovich, M.; et al. The Global Land Data Assimilation System. Bull. Am. Meteor. Soc. 2004, 85, 381–394. [Google Scholar] [CrossRef]
- Andersen, O.B.; Seneviratne, S.I.; Hinderer, J.; Viterbo, P. GRACE-derived terrestrial water storage depletion associated with the 2003 European heat wave. Geophys. Res. Lett. 2005, 32. [Google Scholar] [CrossRef]
- Castle, S.L.; Thomas, B.F.; Reager, J.T.; Rodell, M.; Swenson, S.C.; Famiglietti, J.S. Groundwater depletion during drought threatens future water security of the Colorado River Basin. Geophys. Res. Lett. 2014, 41, 5904–5911. [Google Scholar] [CrossRef] [PubMed]
- D.N. Wiese. 2015 GRACE Monthly Global Water Mass Grids NETCDF RELEASE 5.0. Ver. 5.0. PO.DAAC, CA, USA. Available online: http://dx.doi.org/10.5067/TEMSC-OCL05 (accessed on 1 July2017).
- Joodaki, G.; Wahr, J.; Swenson, S. Estimating the human contribution to groundwater depletion in the Middle East, from GRACE data, land surface models, and well observations. Water Resour. Res. 2014, 50, 2679–2692. [Google Scholar] [CrossRef]
- Adams, W.M.; Agnew, C.; Anderson, E. Water Resources in the Arid Realm. Trans. Inst. Br. Geogr. 1993, 18, 539. [Google Scholar] [CrossRef]
- Thornthwaite, C.W. An Approach toward a Rational Classification of Climate. Geogr. Rev. 1948, 38, 55–94. [Google Scholar] [CrossRef]
- McGinnies, W.G. Climatic and biological classifications of arid lands: A comparison. In Arid Lands Today and Tomorrow; Whitehead, E.E., Hutchinson, C.F., Timmermann, B.N., Varady, R.G., Eds.; Westview Press: Boulder, CO, USA, 1988; pp. 61–68. [Google Scholar]
- Barrow, C.J. World Atlas of Desertification (United Nations Environment Programme); Middleton, N., Thomas, D.S.G., Eds.; Edward Arnold: London, UK, 1992; Volume 3, p. 249. ISBN 0-340-55512-2. [Google Scholar]
- Agnew, C. Using the SPI to Identify Drought. Drought Network News. 2000. Available online: http://digitalcommons.unl.edu/droughtnetnews/1 (accessed on 29 August 2008).
- Soul’e, P.T. Spatial patterns of drought frequency and duration in the contiguous USA based on multiple drought event definitions. Int. J. Climatol. 1992, 12, 11–24. [Google Scholar] [CrossRef]
- Lana, X.; Serra, C.; Burgueňo, A. Patterns of monthly rainfall shortage and excess in terms of the Standardized Precipitation Index for Catalonia (NE Spain). Int. J. Climatol. 2001, 21, 1669–1691. [Google Scholar] [CrossRef]
- Vicente-Serrano, S.M. Differences in spatial patterns of drought on different time scales: An analysis of the Iberian Peninsula. Water Resour. Manag. 2006, 20, 37–60. [Google Scholar] [CrossRef]
- Tsakiris, G.; Vangelis, H. Establishing a Drought Index Incorporating Evapotranspiration. Eur. Water 2005, 9, 3–11. [Google Scholar]
- Tigkas, D.; Tsakiris, G. Early estimation of drought impacts on rainfed wheat yield in Mediterranean climate. Environ. Process. 2015, 2, 97–114. [Google Scholar] [CrossRef]
- Tigkas, D.; Vangelis, H.; Tsakiris, G. Introducing a Modified Reconnaissance Drought Index (RDIe) Incorporating Effective Precipitation. Procedia Eng. 2016, 162, 332–339. [Google Scholar] [CrossRef]
- Dastane, N.G. Effective Rainfall in Irrigated Agriculture, Food and Agriculture Organization of the United Nations: Rome, Italy, 1975.
- Cao, Y.; Nan, Z.; Cheng, G. GRACE Gravity Satellite Observations of Terrestrial Water Storage Changes for Drought Characterization in the Arid Land of Northwestern China. Remote Sens. 2015, 7, 1021–1047. [Google Scholar] [CrossRef]
- Thompson, M.L. Weather Variability, Climatic Change, and Grain Production. Sci. New Ser. 1975, 188, 535–541. [Google Scholar] [CrossRef] [PubMed]
- Walton, K. The Arid Zone; Aldine Publishing Company: Chicago, IL, USA, 1969. [Google Scholar]
- Stadler, S.J. Aridity indexes. In Encyclopedia of World Climatology; Oliver, J.E., Ed.; Springer Science & Business Media: Berlin/Heidelberg, Germany, 2005; pp. 89–94. [Google Scholar]
- Thomas, B.F.; Famiglietti, J.S.; Landerer, F.W.; Wiese, D.N.; Molotch, N.P.; Argus, D.F. GRACE Groundwater Drought Index: Evaluation of California Central Valley groundwater drought. Remote Sens. Environ. 2017, 198, 384–392. [Google Scholar] [CrossRef]
© 2019 by the authors. Licensee MDPI, Basel, Switzerland. This article is an open access article distributed under the terms and conditions of the Creative Commons Attribution (CC BY) license (http://creativecommons.org/licenses/by/4.0/).