Article

Land Use Change Detection and Prediction in Upper Siem Reap River, Cambodia

1
School of Environment, the University of Auckland, Auckland 1010, New Zealand
2
Faculty of Engineering, the University of Auckland, Auckland 1010, New Zealand
3
Faculty of Agriculture, Kyushu University, Fukuoka 819-0395, Japan
*
Author to whom correspondence should be addressed.
Hydrology 2019, 6(3), 64; https://doi.org/10.3390/hydrology6030064
Submission received: 18 June 2019 / Revised: 23 July 2019 / Accepted: 23 July 2019 / Published: 25 July 2019

Abstract

:
Siem Reap River has played a crucial role in maintaining the Angkor temple complex and livelihood of the people in the basin since the 12th century. Land use in this watershed has changed considerably over the last few decades, which is thought to have had an influence on river. This study was carried out as part of assessing the land use and climate change on hydrology of the upper Siem Reap River. The objective was to reconstruct patterns of annual deforestation from 1988 to 2018 and to explore scenarios of land use 40 and 80 years into the future. A supervised maximum likelihood classification was applied to investigate forest cover change in the last three decades. Multi-layer perceptron neural network-Markov chain (MLPNN-MC) was used to forecast land use and land cover (LULC) change for the years 2058 and 2098. The results show that there has been a significantly decreasing trend in forest cover at the rate 1.22% over the last three decades, and there would be a continuous upward trend of deforestation and downward trend of forest cover in the future. This study emphasizes the impacts of land use change on water supply for the Angkor temple complex (World Heritage Site) and the surrounding population.

1. Introduction

Land use and land cover (LULC) change has become a popular topic in recent decades because change in the landscape is linked to so many vital environmental processes [1,2]. Ecosystem function, biological cycles, and biodiversity can be profoundly changed by alteration of land cover [3]. The most common and widespread LULC changes across the globe are deforestation, agricultural expansion, and urbanization [4,5,6]. The trend in LULC has been toward cash crop plantations due to various government policies, growing physical infrastructure, social, and economic development in various parts of mountainous areas in Southeast Asia. Forests have become the main focus for conversion to agriculture plantation [7].
The mountainous forested areas of Cambodia have been transformed into agricultural land through economic land concessions (ELC). ELC is the process of long-term (usually 70 to 90 years) granting the state-owned land to private sector operations for economic development through agricultural and industrial–agricultural operations, including large-scale plantations, stock rearing, and factory construction [8]. According to the Ministry of Agriculture, Forestry, and Fishery (MAFF) of Cambodia, a total land area of 1,204,750 hectares of ELC was granted to 118 companies [9] over the last decade. Land use in mountain areas has seen a rapid transformation from native forests to cash crops, including rubber, acacia, cassava, sugarcane, jatropha, and other crops [10]. These changes have undoubtedly altered the distribution of biotic populations and pathways of ecosystem function [11] in steepland terrain.
It is essential to have a good understanding of the historic trends and drivers of LULC change because these can help to establish practical and effective land conservation and management, as well as facilitate modeling of future LULC change [2]. Remote sensing (RS) technology provides an effective way to extract a time series of LULC information [12]. A variety of land use models have been developed to simulate and predict the future of LULC change [13], mainly by coupling RS and geographic information system (GIS) data. Land use change models are tools used to analyze and provide a better understanding of the causes and consequences of land use changes. They can be used to investigate complex driving forces that affect the spatiotemporal patterns of LULC changes [14]. They have been widely applied as a basis for land use planning, policy-making, and environmental impact assessment [15]. Land use models have been used by researchers to analyze and forecast LULC change, employing techniques such as Markov chain [16,17], artificial neural network [18], cellular automata [19], and logistic regression [20]. However, each model has its own limitation, and these have been discussed extensively in the literature [21]. The ANN and Markov chain limitations were addressed in this study. For instance, MC is a qualitative model that does not incorporate various variables of land use change [22], and ANN mode is the “black-box” that limits understanding of land use change [21].
One strategy for dealing with these shortcomings has been to develop an integrated model that leverages the strengths of the various techniques [23]. The land-use change modeler (LCM) tool is an integrated LULC change model that employs both multi-Layer perceptron neural network (MLPNN) and Markov chain (MC) methods. The MLPNN consists of three layers, named ‘input’, ‘hidden’, and ‘output’; these are used to define complex non-linear relationships between LULC changes and driving variables of change. This technique has been shown to produce accurate estimates of transition potential [24,25]. According to Roodposhti et al. [26], “transition potential represents the behavioral propensities of the actors determining land-use change and is defined based on the inferred logic from a set of transition rules which offer an easily understandable and transparent way to find the most reliable land-use class allocation”. The MC method is applied to calculate the transition probability matrix of predicted LULC change, based on the transition results of MLPNN. This LCM has been successfully applied in many studies for analysis and prediction of urban growth around the world such as in Guanzhong, China [11]; Patna district, India [23]; Cairo Region, Egypt [27]; Banda Aceh, Indonesia [28]; Kailash Sacred Landscape, Nepal [29]; Dhaka city, Bangladesh [30]; and Asmara, Eritrea [31]. However, only a few studies have carried out LULC change analysis and forecasting at the watershed scale. Two examples are the Neka Watershed in Iran [32] and the Des Plaines River watershed in the USA [33].
In this study, the LCM tool was applied to simulate and project LULC change in the upper Siem Reap basin, Cambodia, a catchment that has experienced considerable change over the last few decades. There has been no previous modelling work of LULC change in the catchment, and the LCM has not previously been applied in this monsoon-dominated mountain environment. This environment is characterized by two seasons: A dry season from November to April, and a rainy season from May to October [34]. It is important to note that the fundamental assumption in our modelling framework is that state change is represented strictly as a function of probability—there is no consideration of contingencies that may be introduced by social, economic, or administrative factors.
The objective of this study is to evaluate LULC change trend and annual rate of deforestation from 1988 to 2018 using supervised classification, and to predict future LULC maps for years 2058 and 2098 using the LCM tool. The results of this paper will be used in future studies to further assess the impacts of LULC and future climate changes on river flows that maintain the Angkor temple complex, a World Heritage Site. The Angkor temple is sited on sand substrate [35] and requires a constant water supply to avoid land subsidence and collapse. As outlined in the following section, the water supply to the temple complex and the municipality is vital for a number of economic, social, and cultural reasons, and thus it is of utmost importance to understand the factors that might impact this resource in the future.

2. Study Area

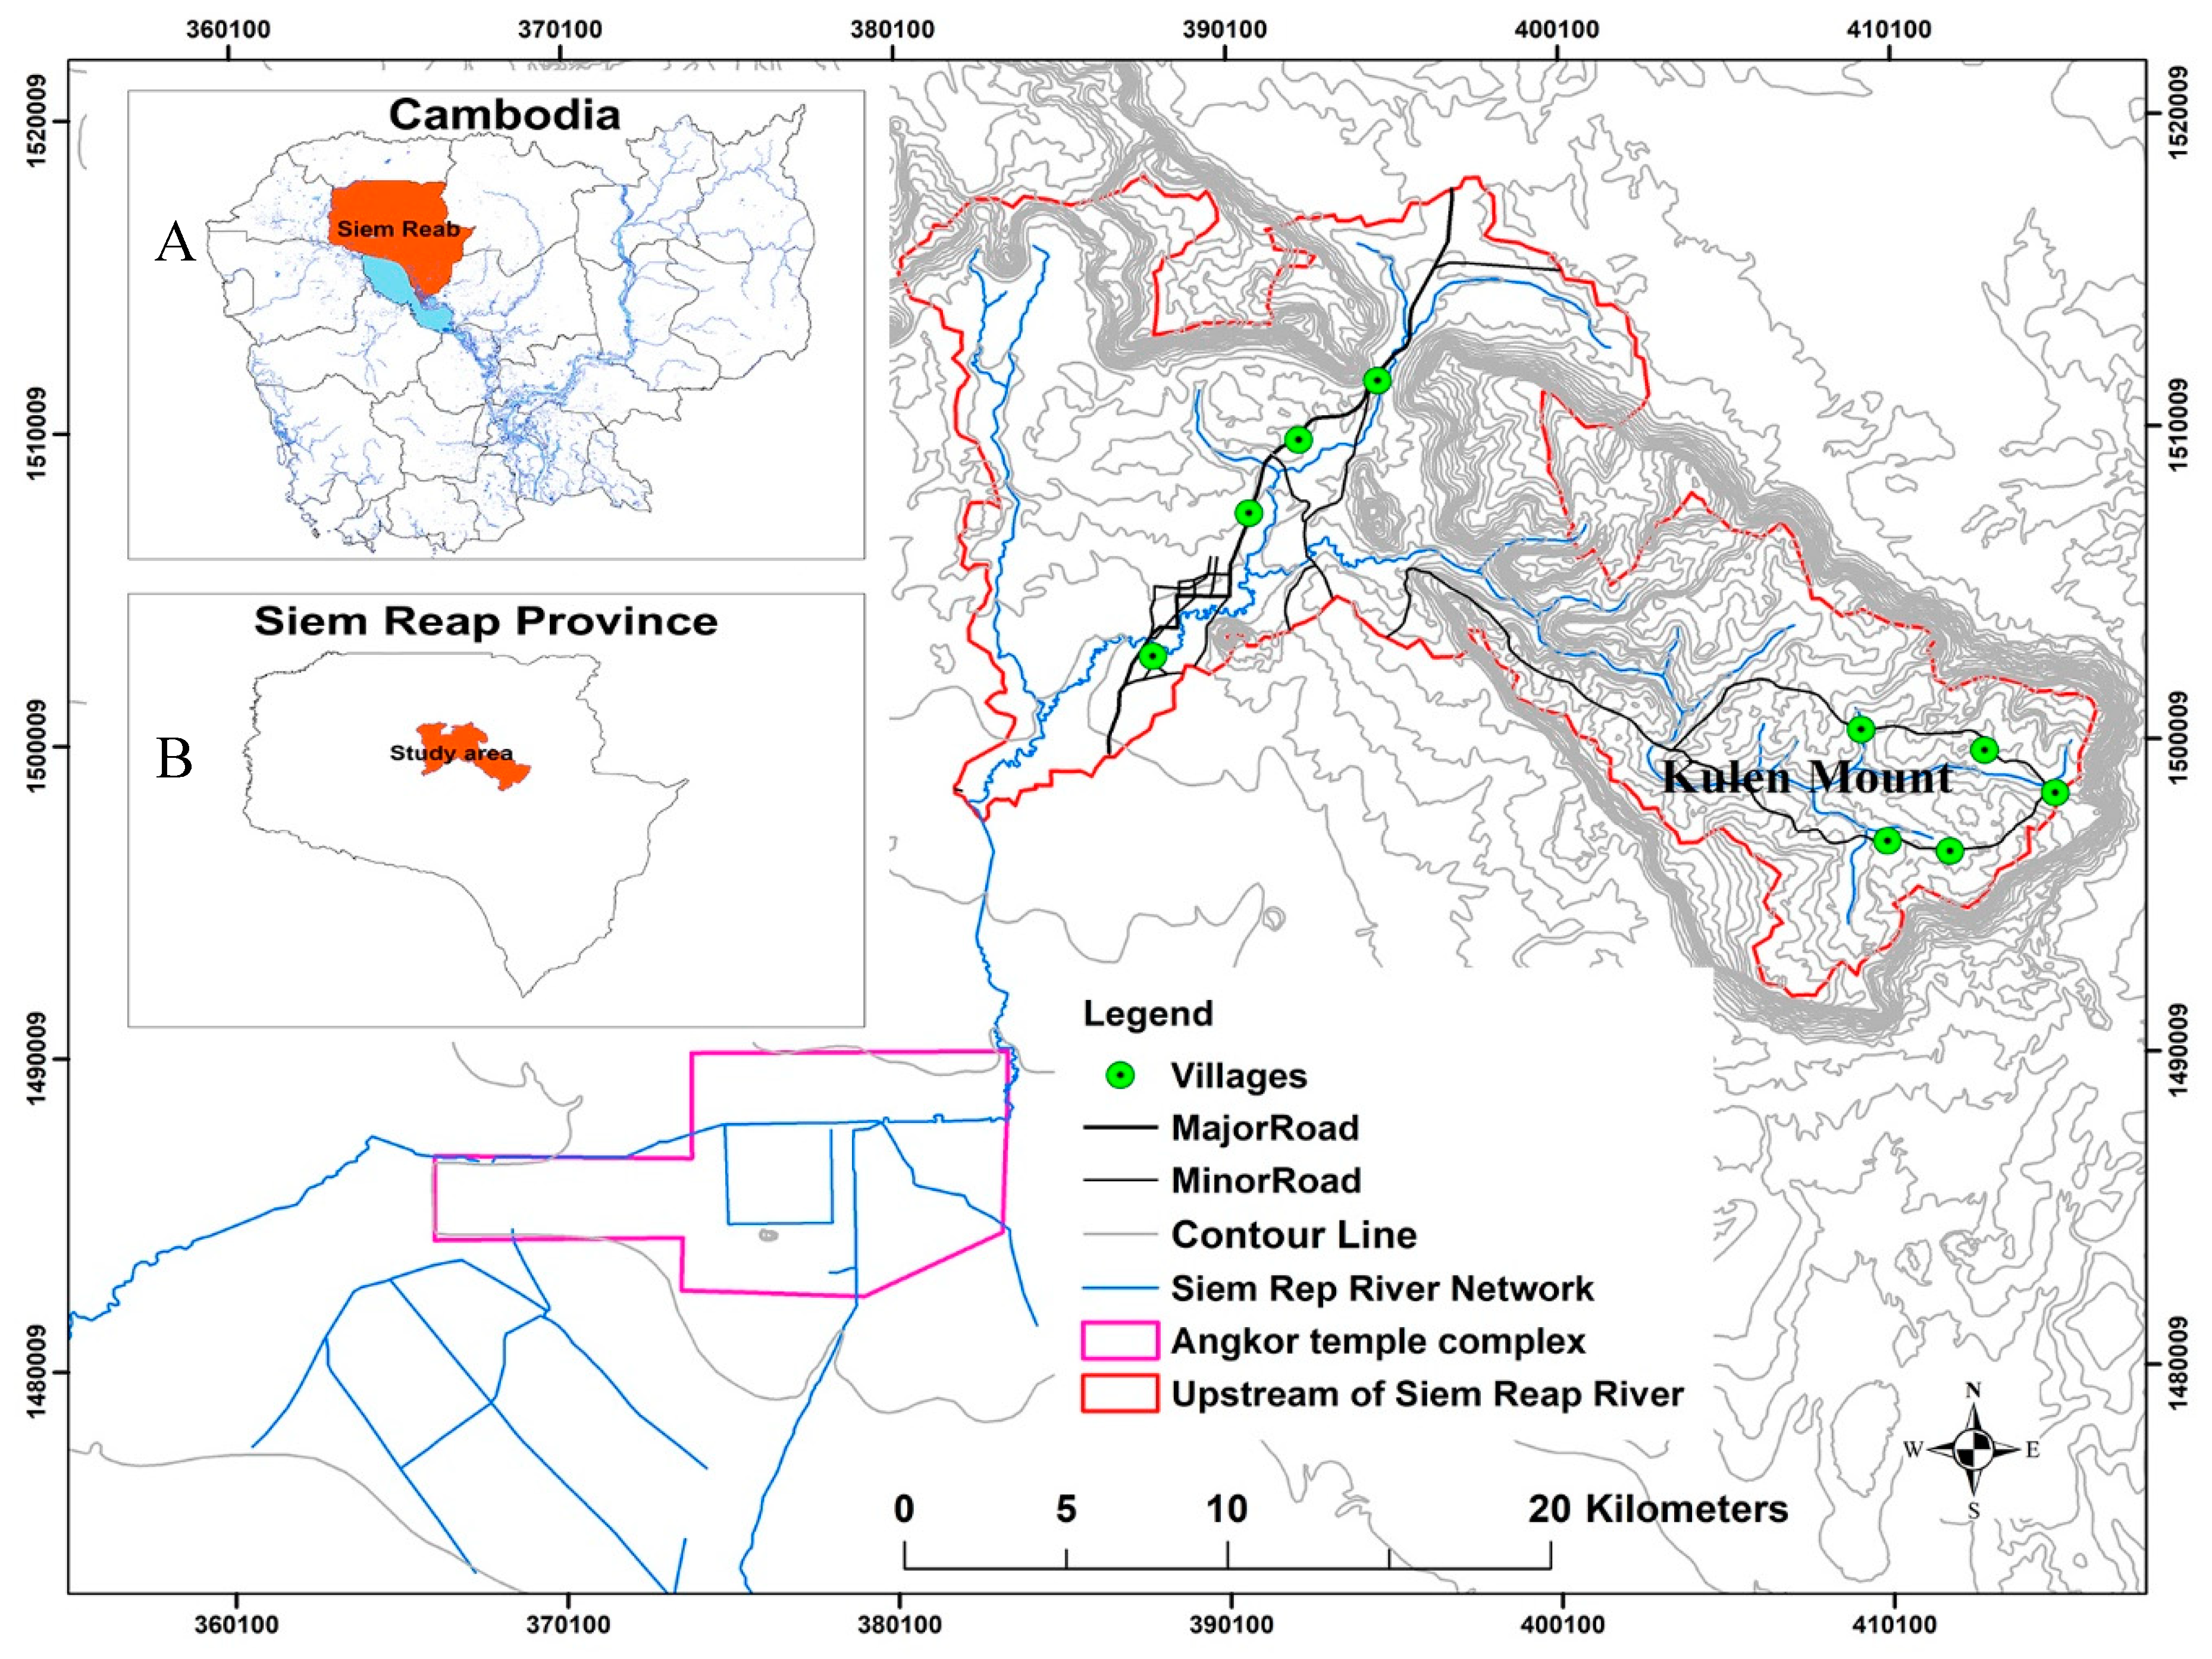
Siem Reap province, northwestern Cambodia, is the site of numerous ancient temples, including Angkor Wat temple. More than one million tourists visit Angkor Wat annually, and the sustainability of this vital cultural and spiritual landmark depends critically on the supply of water from the upper source catchment. Thus, our study focuses on the upper Siem Reap River watershed, located about 20 km from the Siem Reap downtown area and about 374 km from Phnom Penh capital city as in Figure 1. It is located mainly within the Banteay Srei and Svay Leu districts, in the Siem Reap Province.
The hydrological regime of the catchment is driven by two seasons, a rainy season and a dry season. According to the Siem Reap Provincial Department of Water Resources and Meteorology (PDWRAM), the annual average temperature is 28 °C, with an average minimum of 25 °C in the rainy season, an average maximum of 34 °C in the dry season, and the annual average rainfall is 1580 mm in the rainy season in Siem Reap province.
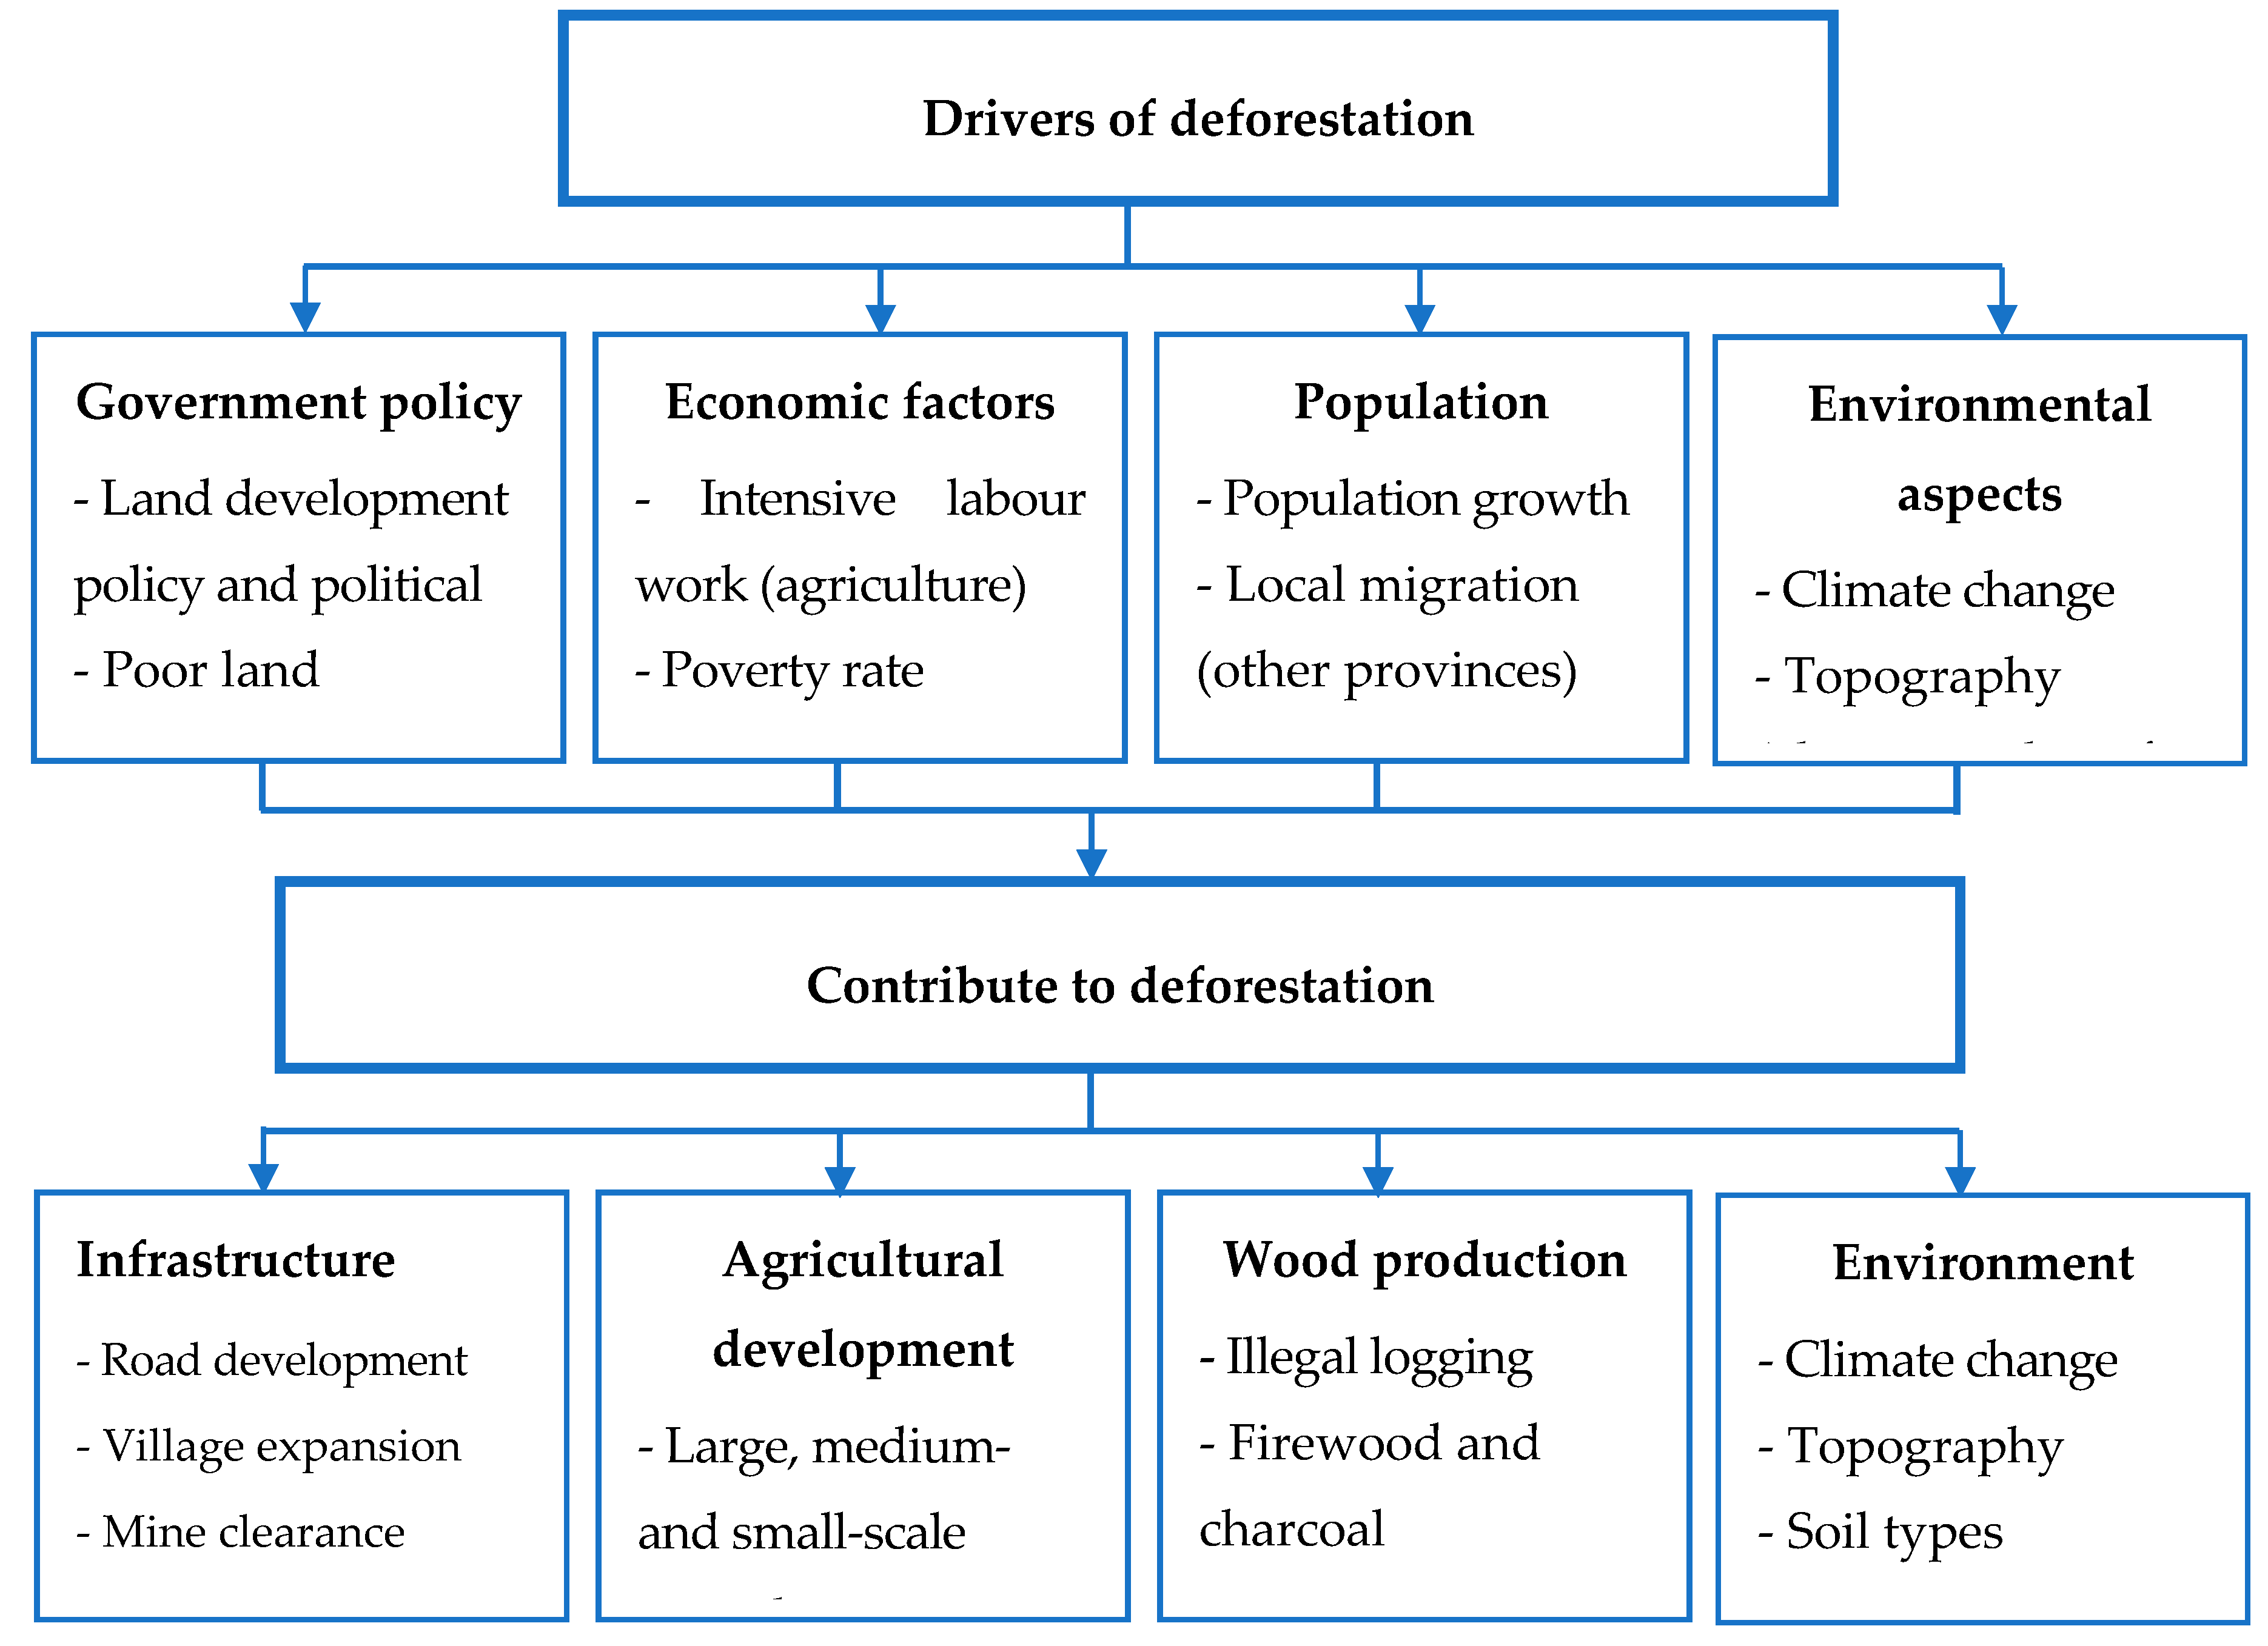
The upper Siem Reap watershed includes large swaths of lowland evergreen natural forests and agricultural land. Much of the catchment has a fairly gentle slope, and is thus attractive for agricultural land use, especially in areas above the Angkor temple complex up to Kulen mountainous range and the eastern part of the upper Kulen Mountain. The landscape has changed significantly over the last few decades, most prominently by deforestation. There are several factors driving this change, including a loosely enforced land management framework, as well as socio-economic, demographic, and environmental factors (see Figure 2). The Cambodian government framework on land management therefore plays a critical role in regulating LULC change in the catchment.
According to established boundaries, reflected in Ministry of Environment maps, about 54% of the study watershed should be a protected area/national park with forest cover, but recent fieldwork (early 2019), reveals significant portions of the protected areas have been disturbed, owing to poor enforcement of regulations. In periods running up to political elections, as politicians look for support from the local community, they may overlook illegal encroachments upon forest land. Consequently, these areas become legally titled to the occupiers following the election.
Although there are a few tourism sites in this upstream watershed, the majority of people who live there are farmers and some younger workers who seek employment in Siem Reap town. Typical family size is increasing, and thus, they require more land for farming and crop cultivation: Deforestation is a common option. According to the local authority of Anlong Thom village [36] in the watershed area (early 2019), in some cases, there are migrants from other provinces who come into the watershed and clear parts of the forest for plantation and then resell the land.
Given the extent of these recent changes, the trend of land use and land cover is likely to affect the runoff characteristics of the basin. According to Bruijnzeel [37] and Foley et al. [1] LULC change can have significant influence on runoff and groundwater in the watershed. The conversion from natural forest to agriculture crop in this catchment might change the streamflow patterns and increase peak flows, owing to reduced interception by forest canopy. It can also influence weather factors, through changing surface temperature, increasing evaporation, and decreasing transpiration rates. Moreover, studies have found that there is a clear positive correlation between forest cover and water yield [38]. Wang et al. [39], for instance, found that mean annual runoff declined by 2.3% following an increase of 25% in the proportion of forestland in a mountainous watershed. Khoi and Suetsugi [40] discovered an increase in streamflow, from 0.2 to 0.4%, was associated with a decline of 16.3% in forestland catchment. Since LULC has changed considerably over the last few decades, it is reasonable to assume that this will exert some influence on water yield and streamflow peaks in the upstream catchment of Siem Reap River, and thus may have significant effects on the Angkor temple complexes and the people in the watershed area.

3. Materials and Methods

3.1. Landsat Imagery

A series of Landsat images from the last 30 years was used in this study catchment to assess the annual rates and decadal trend of deforestation. The images were acquired from the United States Geological Survey (USGS) (http://glovis.usgs.gov). The USGS started to organize the Landsat archive into a formal tiered data collection structure in 2016. The data collection is classed into three categories: Tier 1, Tier 2, and Real-Time. Data in Tier 1 meet formal geometric and radiometric quality criteria, while Tier 2 data do not. Real-Time data are images available immediately following acquisition. The collection provides a consistent archive of known data quality to support time-series analyses.
This study used data from Landsat Collection 1 Level-2 and Tier 1, particularly Landsat thematic mapper (TM) and operational land imager satellite (OLI) and thermal infrared sensor (TIRS) images from 1987 to 2017 (see Table 1). However, the 2012 and 2013 images from Landsat did not meet the necessary quality criteria (less than 20% cloud free) in the study area. TM carried the Landsat 4 and Landsat 5, and the images consist of seven bands with a spatial resolution of 30 m while OLI and TIRS images consist of 11 bands with a spatial resolution of 30 m, except Band 8, which is 15 m [41]. The images were selected from various dates in the dry season, from December to early May in order to avoid cloud cover.
We used shuttle radar topography mission (SRTM; 30-m pixel resolution) data to develop a digital elevation model (DEM), and used this to generate slope and aspect maps for the study area. Major and minor roads, rivers, and villages shape files were collected from the GIS unit under the Ministry of Water Resources and Meteorology (MOWRAM), Cambodia and Siem Reap PDWRAM. The boundary vector data for the Angkor complex were collected from the Apsara Authority. Our GIS database was used to derive slope and aspect drivers of LULC change using slope, aspect functions, and distance from main road, minor road, river, and villages using Euclidean distance functions. These functions are available in the 3D analyst and spatial analyst toolboxes in ArcGIS.

3.2. Retrospective Change Detection and Forward Modelling

3.2.1. LULC Trend Detection and Annual Rate of Deforestation from 1988 to 2018

The Landsat images were processed and analyzed using the ArcGIS 10.4 software (ESRI, 2016) and Erdas (2016). All satellite images were projected in Universal Transverse Mercator (UTM), Zone 48 North. A true color composite was generated using an appropriate band combination for every image and this was used for training samples for each LULC class. The maximum likelihood option under supervised classification is the most common and widely used classification [42]. This was applied to classify all the images from 1988 to 2018 in the study area. Supervised image classification is mainly based on users’ knowledge and experience, to generate representative parameters for each LULC class in the study areas.
Users employ a representative subset of pixels in the image, representing all classes in the image, to train the model. This is known as a ‘signature’ for making feature classes. Three LULC categories were established for the study area: Forest areas, non-forest areas, and water body. The non-forest areas included agricultural land, roads, houses, and other human-modified terrain.
After the image classification process, an accuracy assessment is needed to quantify the reliability of a classified image. Therefore, 100 to 120 random control points were checked and verified across the catchment in order to assess the accuracy of the classification in each year. After verification through satellite images and Digital Globe WorldView (via Google Earth), an error matrix table was generated. This is a standard accuracy assessment procedure; it has rows and columns matching the dimensions of the classified image. This table shows the level of correspondence between the classified results and interpreted classes. The overall accuracy was derived from the total number of correctly classified sample points in every class divided by the total number of sample points. The kappa coefficient is a measure of how the classification results compare to values assigned by chance, or, it reflects the difference between actual agreement and the agreement expected by chance [43,44]. Values of the kappa coefficient range from 0 to 1: The higher the coefficient value, the more successful the image classification process. Agreement and disagreement sample points were recorded in the matrix table, and then an overall accuracy and kappa statistic was calculated as in the following equations:
O v e r a l l   a c c u r a c y = i = 1 X i N
where: Xi is the number of corrected classifications and N is the total number of reference points.
k = P o P e 1 P e
where:
k = Cohen’s kappa statistic,
Po = the relative observed agreement among raster, and
Pe = the hypothetical probability of chance agreement.
Furthermore, 20 ground-truthed points selected from different classes across the watershed were checked during the field visit in January and February 2019. Finally, the LULC trend change and the annual deforestation rate for the last three decades were calculated. The drivers of deforestation were then assessed on a qualitative basis.

3.2.2. The Land Change Modeler (LCM)

Land change modeler (LCM) is an innovative land planning and decision support system that is integrated into TerrSe IDRISI software. It has been developed by Clark Labs for analysing land cover change, and empirically modelling relationships between sites of change and explanatory variables. The LCM tool was applied for change analysis and prediction of future LULC change in the upper Siem Reap River catchment. This model was selected because it has proven effective in land use change prediction [27,32], automated, and user-friendly workflow. Maps of LULC in 1998, 2008, and 2018 (Figure 3a–c) were used as the basis for performing the land change analysis and prediction of future LULC maps since LULC in this study area has changed significantly over the last two decades, and forest cover appears to be on a trajectory toward further decline in the near future, as assessed during a field visit in early 2019 (new roads are under construction and medium-scale agriculture continues to expand on Kulen Mountain). LULC changes between 1998 and 2008 (Epoch 1) were used to simulate LULC map 2018, and LULC maps 2058 and 2098 were using LULC changes between 2008 and 2018 (Epoch 2). The 1988 dataset is left out of this analysis; there was an increase in forest cover between 1988 and 1998, which is considered somewhat anomalous, and is not consistent with the past 20-year trend of steadily increasing deforestation. Although it is difficult to predict, there is some evidence that this trend will continue, given the current political situation as well as economic and population growth. This LCM model combines multi-layer perceptron neural network (MLPNN) and Markov chains (MC) models [25]. There are three main sections in the LCM operation: (1) Change analysis, (2) transition potentials, and (3) change prediction.
First, the change analysis was based on interval changes in LULC between time 1 (1998, in our case) and time 2 (2008) [25]. In this study, cross-tabulation analysis was carried out to examine LULC changes between 1998 and 2008 (Epoch 1), 2008 and 2018 (Epoch 2), and 1998 and 2018 (Epoch 3), respectively. The areas that underwent change from one class to another were identified and quantitatively assessed, using this analysis. The gains and losses, and the spatial trend of change for each land use class for all epochs were summarized in a graphical form.
Second, LULC change in Epoch 1 and the selected seven drivers of LULC change (discussed in 3.2.3) were fed into the model to generate transition potential maps, which reflect the probability of change of each pixel from one class to another, using the MLPNN method. The elevation, slope, aspect, and distance from the river were set as static while the major road, minor road, and villages were considered to be dynamic. This method generates transition potential maps using 50% of sample pixels to train the model, and another 50% are used to test how well the model performed in predicting change. This method is based on the supervised backpropagation (BP) training algorithm. It is also widely applicable for classification and prediction of LULC changes, and it is sophisticated enough to deal with non-linear relationships [30]. The minimum number of random sample pixels in each class was set as 10,000 out of a total of 454,815 model pixels. The criteria for acceptable accuracy in the model was set to 80% [45].
Third, the MC, which is commonly used to forecast the LULC change [46] at a desired time [24,25], was applied to calculate transition probability matrix of Epoch 1 and simulate the LULC map 2018 after achieving satisfactory in MLPNN. The MC for land use prediction was calculated using the following equations.
S ( t + 1 ) = P ij × S ( t )
where S ( t + 1 ) (t+1): represents the state probability of time t+1, S ( t + 1 ) (t) S ( t ) is the state probability at time of t, and Pij P ij is a transition probability matrix in a state that is calculated as the following [40,41]:
P ij = | P 1 , 1 P 1 , 2 P 2 , 1 P 2 , 2 P N , 1 P N , 2 P 1 , N P 2 , N P N , N | ( 0   P ij 1 and j = 1 N P ij = 1 , ( i , j = 1 , 2 , , n ) ) .
After production of forecasted LULC map 2018, a validation process was performed by comparing the simulated and the actual LULC maps 2018 by using kappa index statistics. The kappa index consists of four components: (1) Kappa standard (Kstandard), which is known as Cohen’s kappa statistic (proportion of pixels correctly assigned versus the proportion may be correct by chance), (2) kappa for no information (Kno), representing the proportion of correctly classified pixels relative to the expected proportion (assessed by a simulation), (3) kappa for grid cell location (Klocation), which is the spatial accuracy associated with the level of agreement of location, and (4) kappa for stratum-level location (KlocationStrata), which is an accuracy associated with the correct assignment predefined strata (Pontius 2000; Cohen 1960). The kappa variable ranges from 0 to 1 and reflects total agreement between images.
Finally, LULC maps 2058 and 2098 were projected using transition potential maps from Epoch 2 and the same setting of predictive driver variables used in the simulation of LULC map 2018.

3.2.3. Selection of Driver Variables

The meetings were structured such that local experts (PDWRAM officers, Apsara Authority officers, and local authority officers) were asked to comment on previous and recent trends in LULC change in the watershed, based on their informal observations, monitoring work, civil planning initiatives, and information gathered in the course of their daily work. A consensus evolved that the key drivers of deforestation were (1) landmine clearance and (2) improvement of road infrastructure. New roads have triggered significant loss of forest through illegal logging, shifting cultivation, charcoal production, and agricultural expansion, but systematic data on these factors were not available. There are no hard rules for setting up the driving forces of LULC changes, and selection depends on possible and available factors in each individual study area [23]. According to various studies on LULC change and forecasting, some of the more influential driver variables include topographic factors such as elevation, slope, and aspect, as well as proximity to features such as rivers and roads [23,27,29,32].
For this study, a total of seven driver variables were considered for the LULC change model: (1) Elevation, (2) slope, (3) aspect, and distance from (4) river, (5) major road, (6) minor road, and (7) villages. Drivers of change can be input into the model as static or dynamic components, based on an assessment of their behaviour over time (Eastman, 2012). Static variables are constraints for the transition that do not change over time, while dynamic variables are drivers that are updated during the course of a model run, such as the extents of development or infrastructure. The first four driver variables were considered to be static variables, while the latter three proximity measures were considered to be dynamic (Figure 3d–j). Most development and change naturally occurs close to roads and villages, and this infrastructure is changing quickly, relative to landscape variables [23]. These seven parameters of change were applied in the model to simulate LULC map to 2018 and forecast LULC maps out to 2058 and 2098.
Topographic variables were included in the model because weather factors such as temperature and rainfall change with elevation. Slope was important in determining the potential bounds of human occupation and development. For example, gentle slopes are attractive for agriculture production and domestic development, and thus, these areas are more likely to experience land cover change, while steep slopes are less likely to undergo change. Roads provide easy access to remote areas and these routes facilitate deforestation close to the roadways. The margins of villages have seen profound change to accommodate a growing population, with more rapid agricultural and domestic development at their outskirts. Cambodian people have always lived close to, or along the margins of rivers because these corridors provide water for domestic and stock usage, fish for food, and fertilized soil to grow crops.
Cramér’s V test was applied to test the relationship between the seven drivers and LULC change from 1998 to 2008. A high value of Cramér’s V indicates a high degree of association between two nominal variables [47]; the score ranges from 0 to +1. According to Cramér’s V analysis, the drivers of change associated with LULC change ranged from the moderate to weak association as follows: Elevation (0.6256), distance from major road (0.4413), distance from villages (0.1558), slope (0.1515), aspect (0.1515), distance from minor road (0.1346), and distance from river (0.1261).
To sum up, there were two main analyses in this study: (1) To detect LULC change trend and assess the annual rate of deforestation from 1988 to 2018 using supervised classification and (2) to predict future LULC maps for years 2058 and 2098 using LCM. The workflow for the methodology of the study is presented in Figure 4.

4. Results

The results of the analysis are broken into two main parts, for clarity: (1) The LULC trend detection and annual rate of deforestation analysis, including the reasons behind the change trends and accuracy assessment and (2) land change modeler results, which consist of land change analysis from 1998 to 2018, simulation of LULC map year 2018 using MLPNN and MC methods, validation by comparing the simulated and the actual classification 2018, and prediction of LULC maps 2058 and 2098 using LULC maps 2008–2018 and calibration driver parameters that were adapted from the best results in the 2018 simulation.

4.1. LULC Trend Detection and Annual Rate of Deforestation Analysis

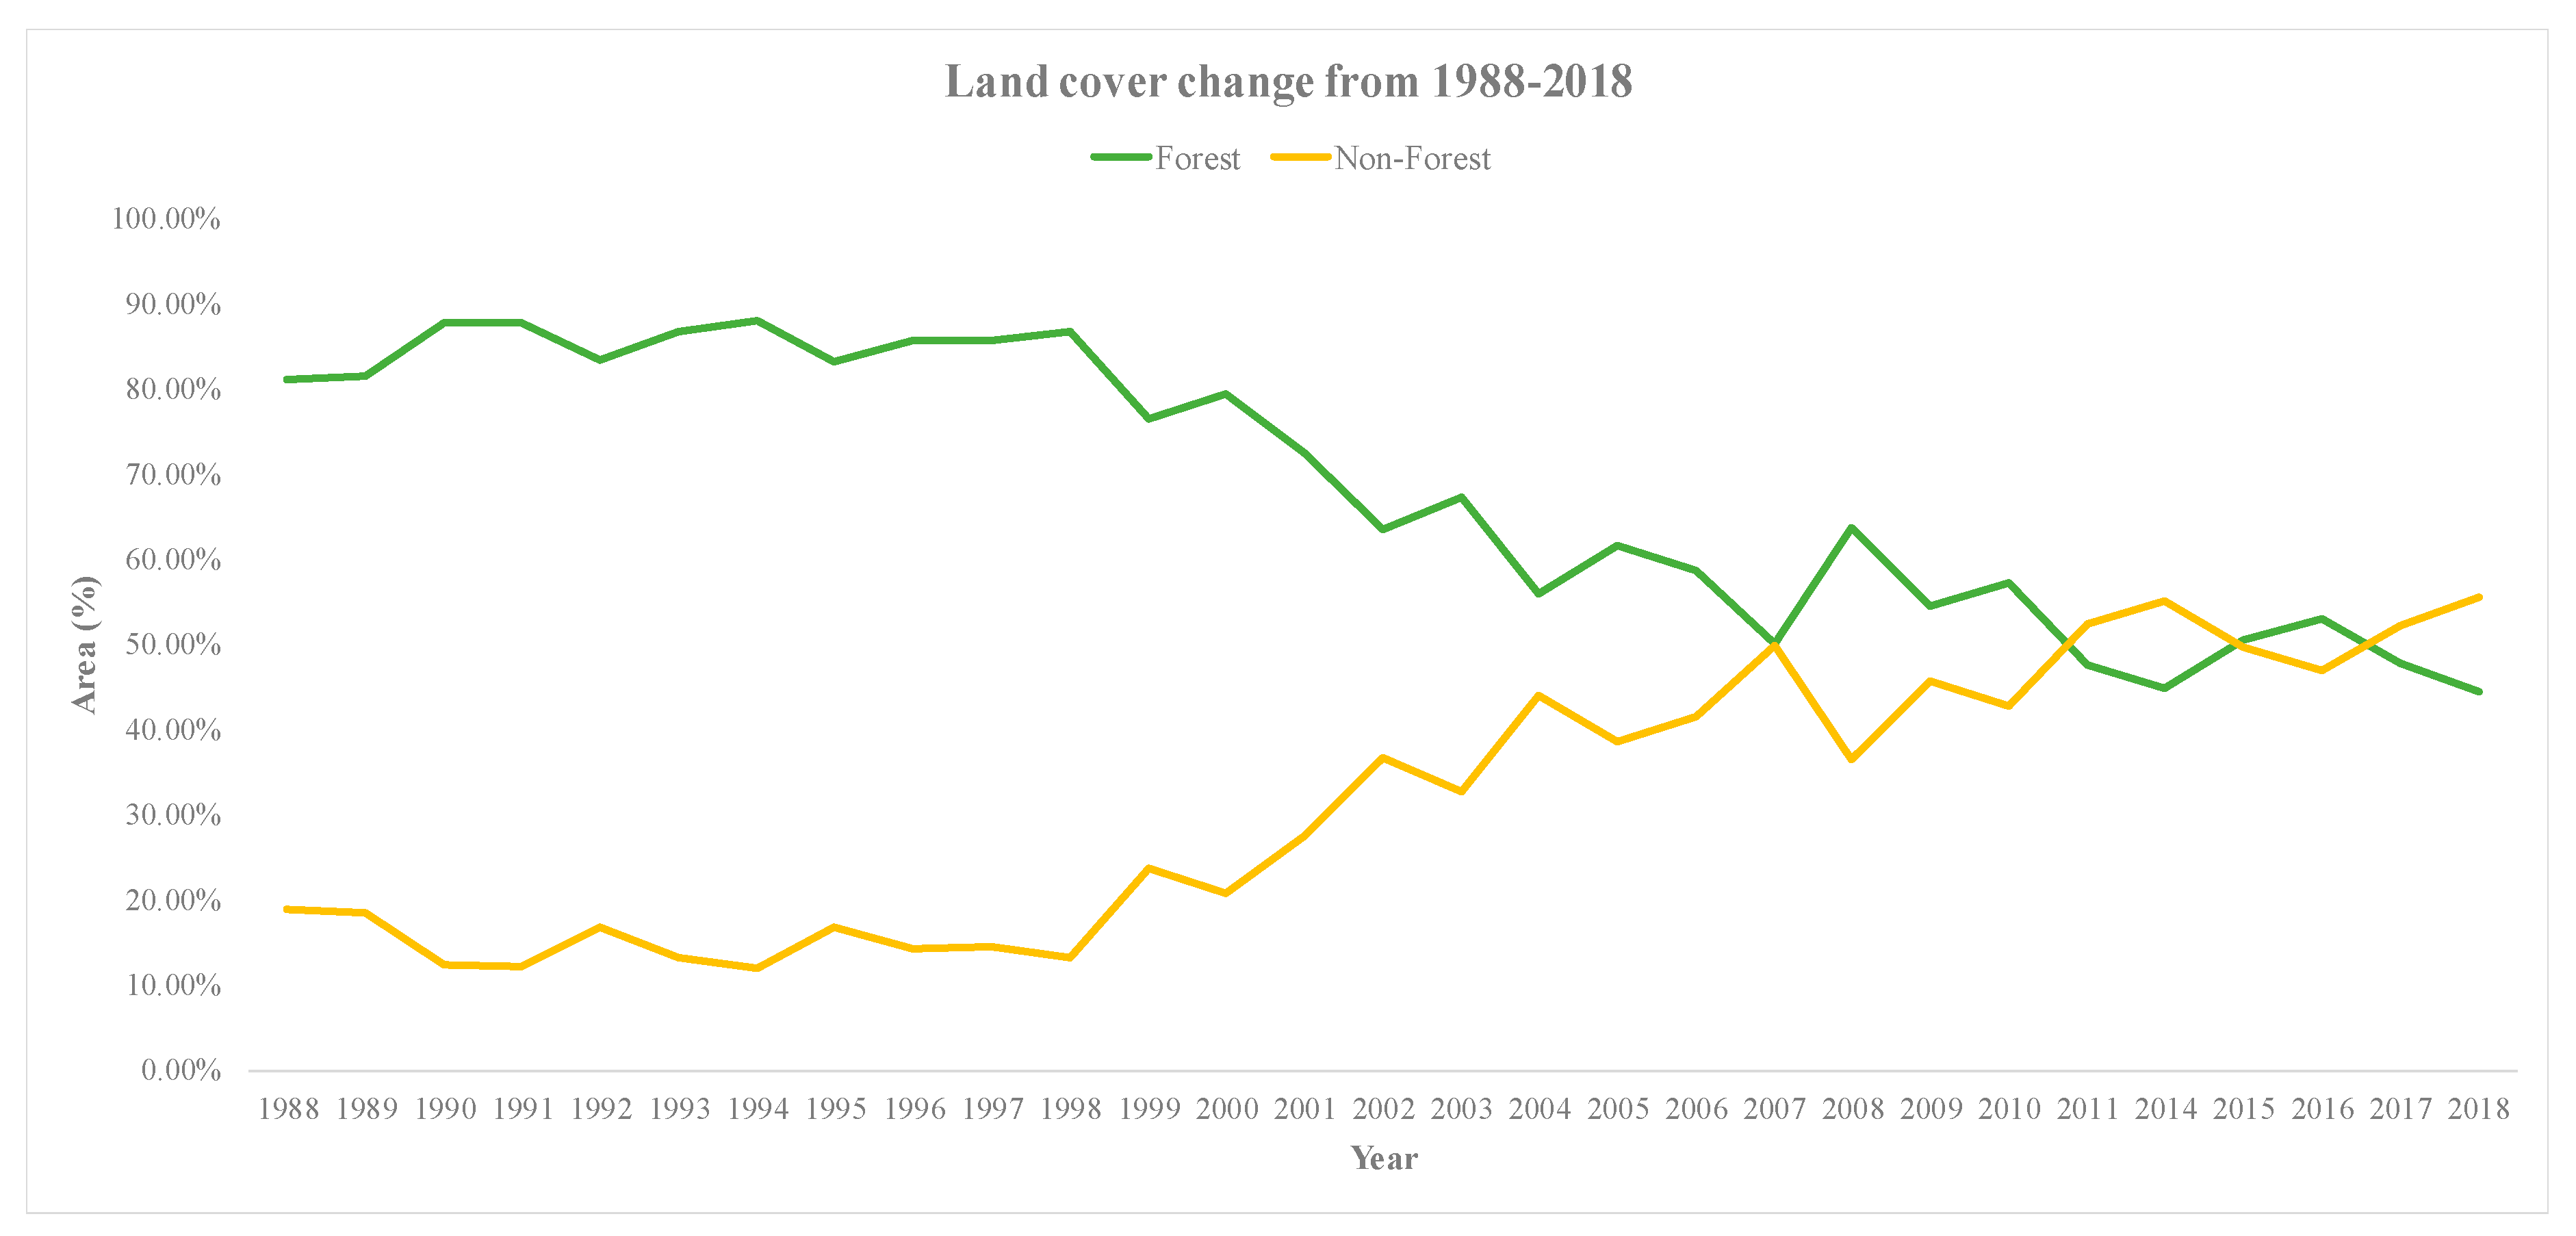
Based on the information from the classified images for the last three decades in the upstream catchment of the Siem Reap River, there is a trend of decreasing forest cover with a corresponding, inverse trend in non-forest cover. It can be seen in Figure 5 that forest cover increased very slightly in the first decade (1988–1998). Following this, there was a decreasing trend in the last two decades (1998–2008 and 2008–2018); the reasons behind those changes are discussed at the end of this section.
According to this analysis, the annual deforestation rate for the last 30 years was 1.22%, which is similar to rates of forest cover changes in the Greater Mekong Sub-region, particularly Cambodia and Myanmar at (−1.20%) from 1990 to 2015 [48]. While the net gain in forest cover was 0.57% annually for the first decade, over the last two decades (1998–2008 and 2008–2018) there was a net decrease of 2.32% and 1.91%, respectively. It emerges that deforestation proceeded at a remarkable rate −36.61% between 1988 and 2018. Thus, non-forest areas became the majority cover type in the watershed. Forest covered areas, inversely, decreased by almost half, from 81.08% (331.87 km2) to 44.47% (182.02 km2) over the same epoch (see Table 2). The extent of forested land retreated to more upland or mountainous areas, or sites with increasingly marginal potential for cultivation and other development. Pixels with water cover type (natural lakes, wide river reaches) made up less than 0.08% of the catchment for 17 years (1988, 1990, 1992, 1993, 1999, 2000, 2004, 2005, 2007, and from 2009 to 2018), and there was no water detected in the remaining 12 years.
There were two main factors behind the low rate of forest cover change in the first decade: (1) Limited access to the road network, and (2) landmine hazard, since this area was a stronghold of the Khmer Rouge. In addition to this, cultivators followed traditional practices and remained within their farming boundaries, with little additional land clearance. There was less illegal logging and agricultural expansion, only small-scale activities, and there was firewood and charcoal production for household usage only. Therefore, the disturbance areas were primarily in the lower elevation areas close to the road and village environs.
In the second decade, the proportion of forest cover declined more quickly: More than one-third of the catchment area was stripped. The most likely cause of this relatively rapid deforestation can be traced to improved access to road infrastructure and landmine clearance. These improvements may have facilitated illegal logging activities, firewood and charcoal production, and cultivation. Gaughan et al. [49] underlined that land use changes from 1989–2005 in the Siem Reap watershed could be related to these factors, which were triggered by explosive growth in tourism.
In the third decade, the extent of forested area gradually dropped almost 10% with some ups and downs due to fluctuations in the costs of agricultural production. Farms often change their agriculture crops, and some years they do not grow any crops; hence, natural regeneration could be improved. A notable peak in 2008 might relate to the global economic crisis, which heavily affected agriculture, tourism, and other sectors. The main reason behind the decrease in forest coverage in this last decade could be further improvement of road infrastructure and large-scale agricultural expansion, including shifting cultivation that has been a significant forest clearance in the Mount Kulen range.
The key drivers were determined based on informal interviews/meetings with regional and local officials (see Section 3.2.3, above), and these are summarized in Table 3.

4.2. Accuracy Assessment

While the average overall accuracy of the classification of all images (1988–2018) was 91.46%, the kappa statistic was 82.48%. The minimum overall accuracy and kappa were 86% and 70.76%, respectively, and the maximum values were 97.37% and 94.92%. There was no individual class with an overall accuracy below 70%, which was deemed satisfactory. Annual overall accuracy and kappa statistic for each frame over the last three decades are shown in Table 4.

4.3. The Land Change Modeler (LCM)

4.3.1. LULC Change Analysis

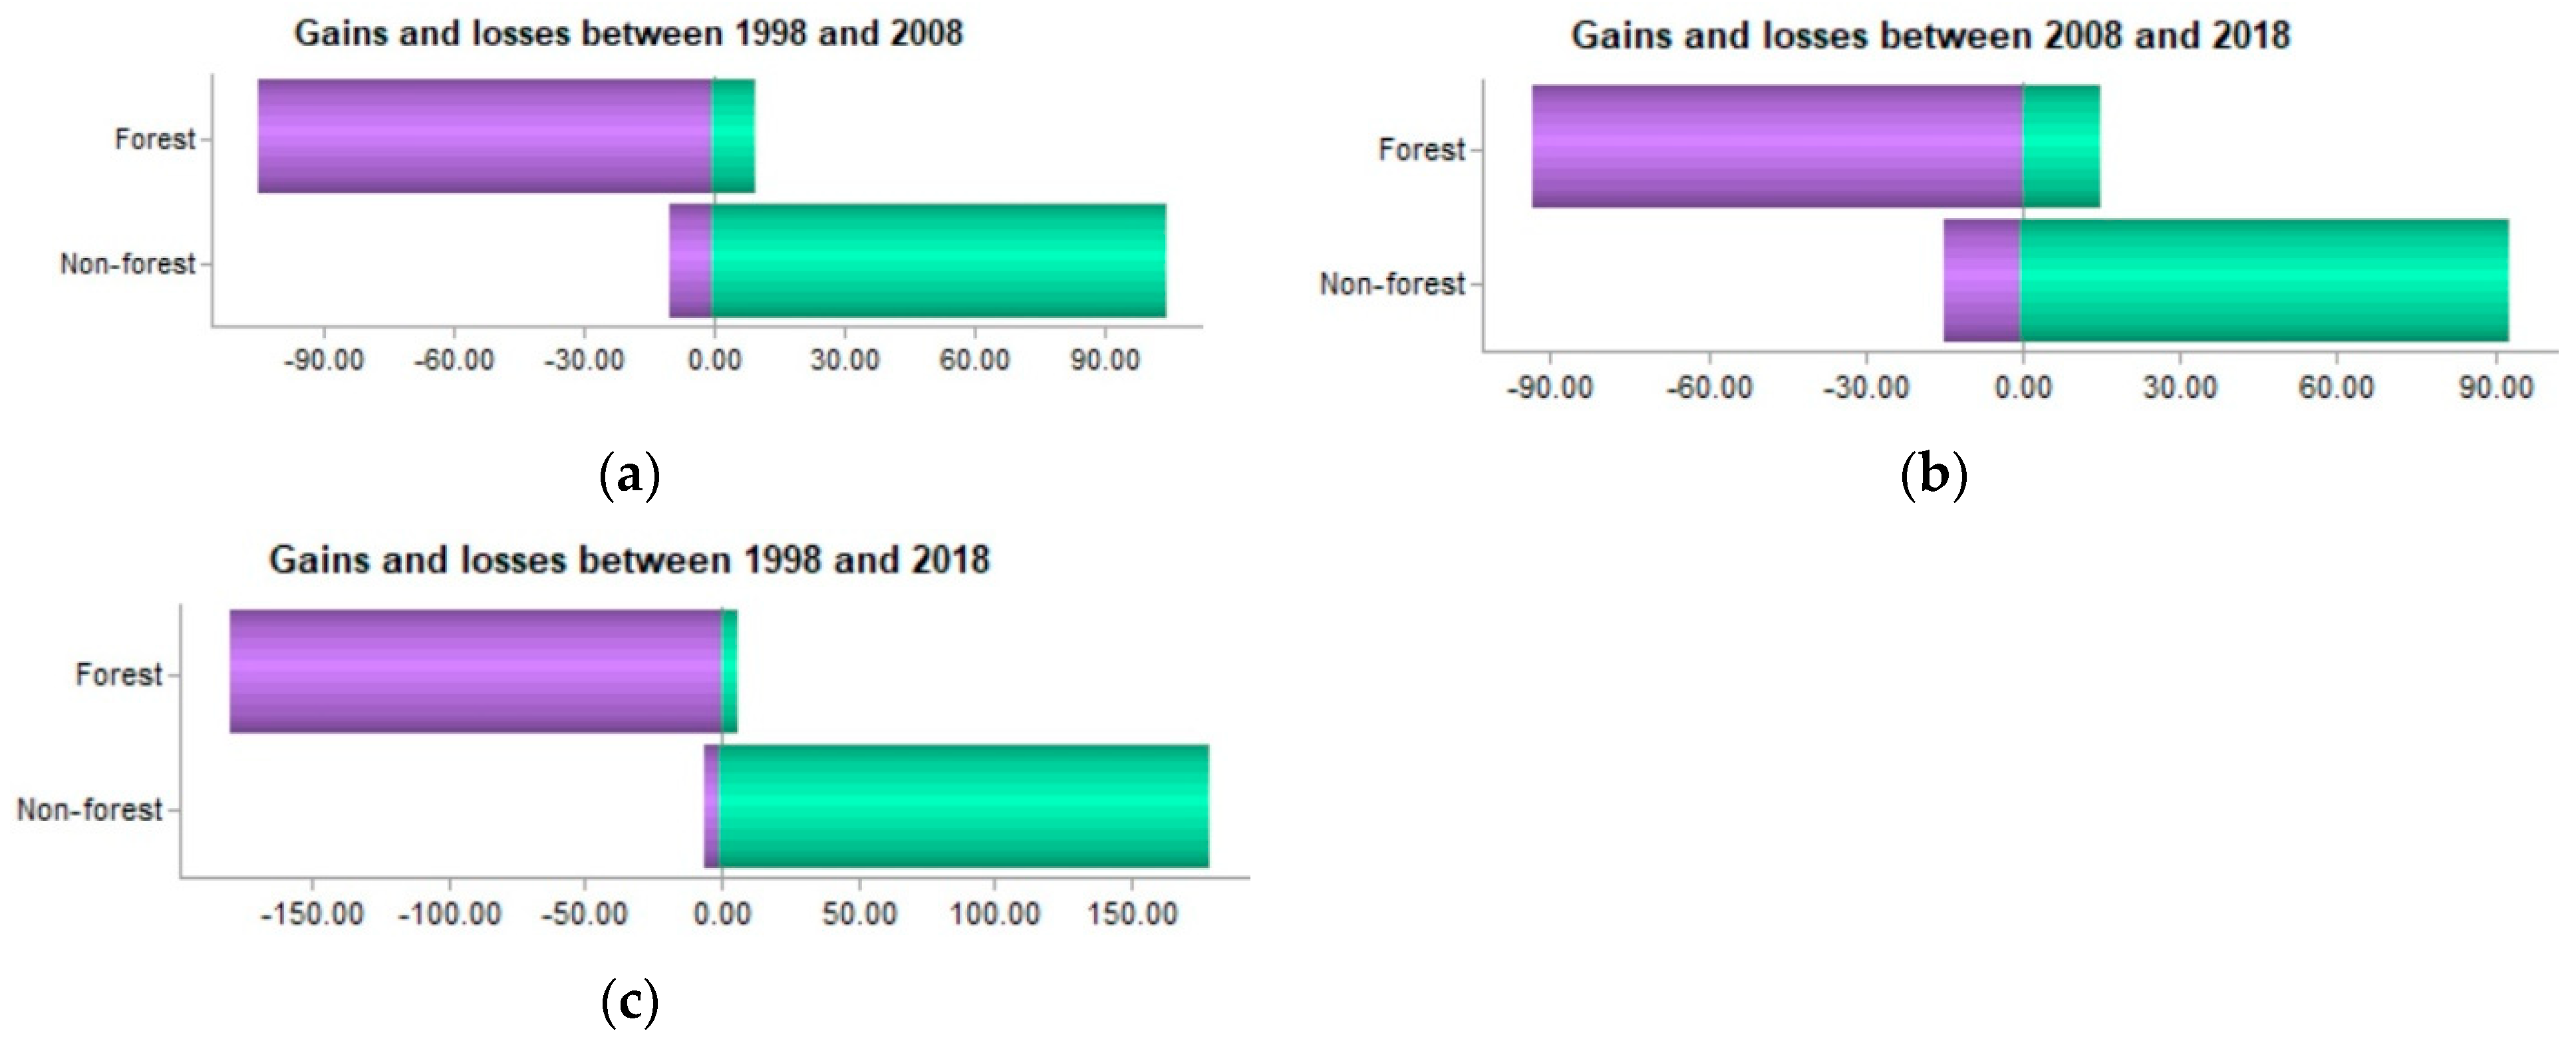
The LULC maps from 1998, 2008, and 2018 were selected to perform the change analysis and cross-tabulate analysis, thus the surface areas (gains and losses) and spatial changes of each class were assessed for Epoch 1 (1998–2008), Epoch 2 (2008–2018), and Epoch 3 (1998–2018). In this analysis, there were four possible transitions: Non-Forest remained the same (NF-NF), non-forest changed to forest or regeneration (NF-F), forest stayed the same (F-F), and forest changed to non-forest (F-NF). During Epoch 1, while forest covered areas had decreased 104.89 km2 (25.62%) and become non-forest areas (F-NF), areas that regenerated from non-forest to forest (NF-F) constituted 10 km2 (2.44%), thus the net deforestation was 94.89 km2 (23.1%). During Epoch 2, there appeared to be a decrease of 93.20 km2 (22.77%) of forest cover (F-NF) and the forest recovery (NF-F) was 14.84 km2 (3.63%), hence the net deforestation was 78.36 km2 (19.14%). During Epoch 3, the conversion from forest cover to non-forest (F-NF) was 179.31 km2 (43.81%) and the regrowth forest (NF-F) was 6.06 km2 (1.48%). The regeneration of forest from one epoch to another was not cumulative because it was disturbed or wiped out in the later epoch. Therefore, the net deforestation was 173.25 km2 (42.08%). The pattern of gains and losses for the LULC classes in all epochs is shown in Figure 6a–c.
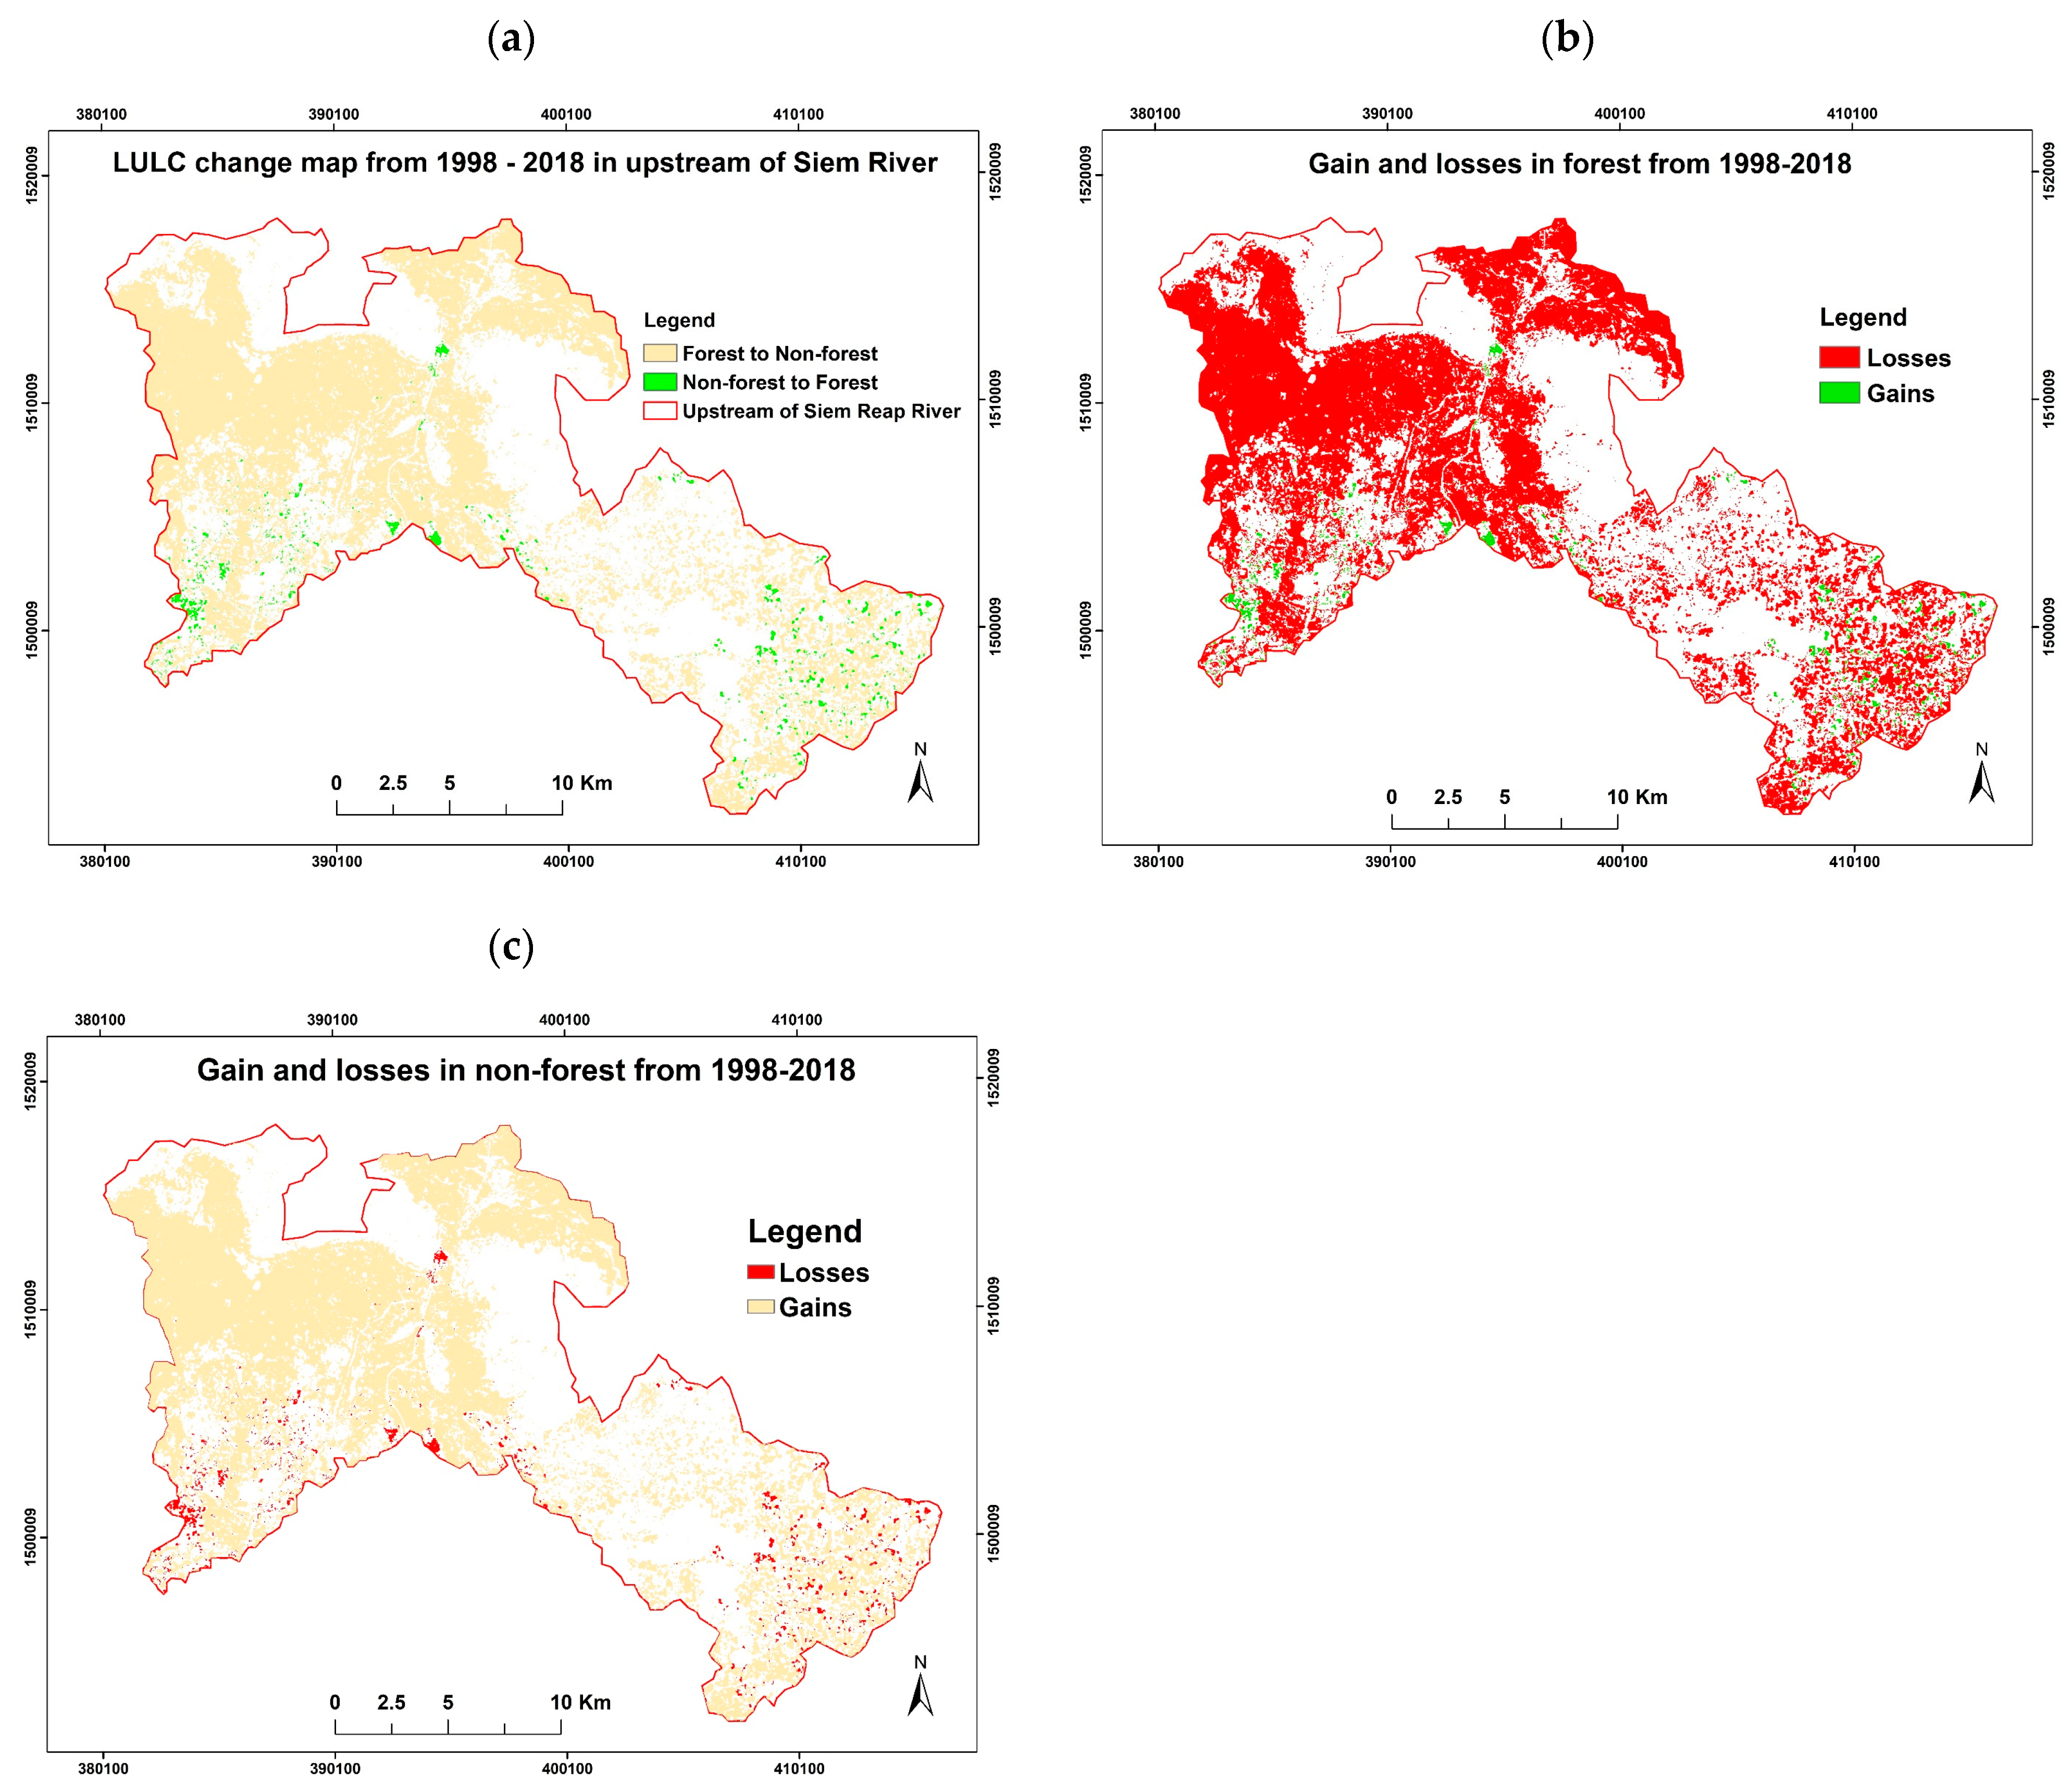
It can be seen from the land change maps that there were substantial losses of forest cover and reciprocal gains in non-forest cover in all periods. The LULC change and gains and losses maps of each class (forest and non-forest) from 1998–2018 are shown in Figure 7a–c.

4.3.2. The Spatial Trend of Change

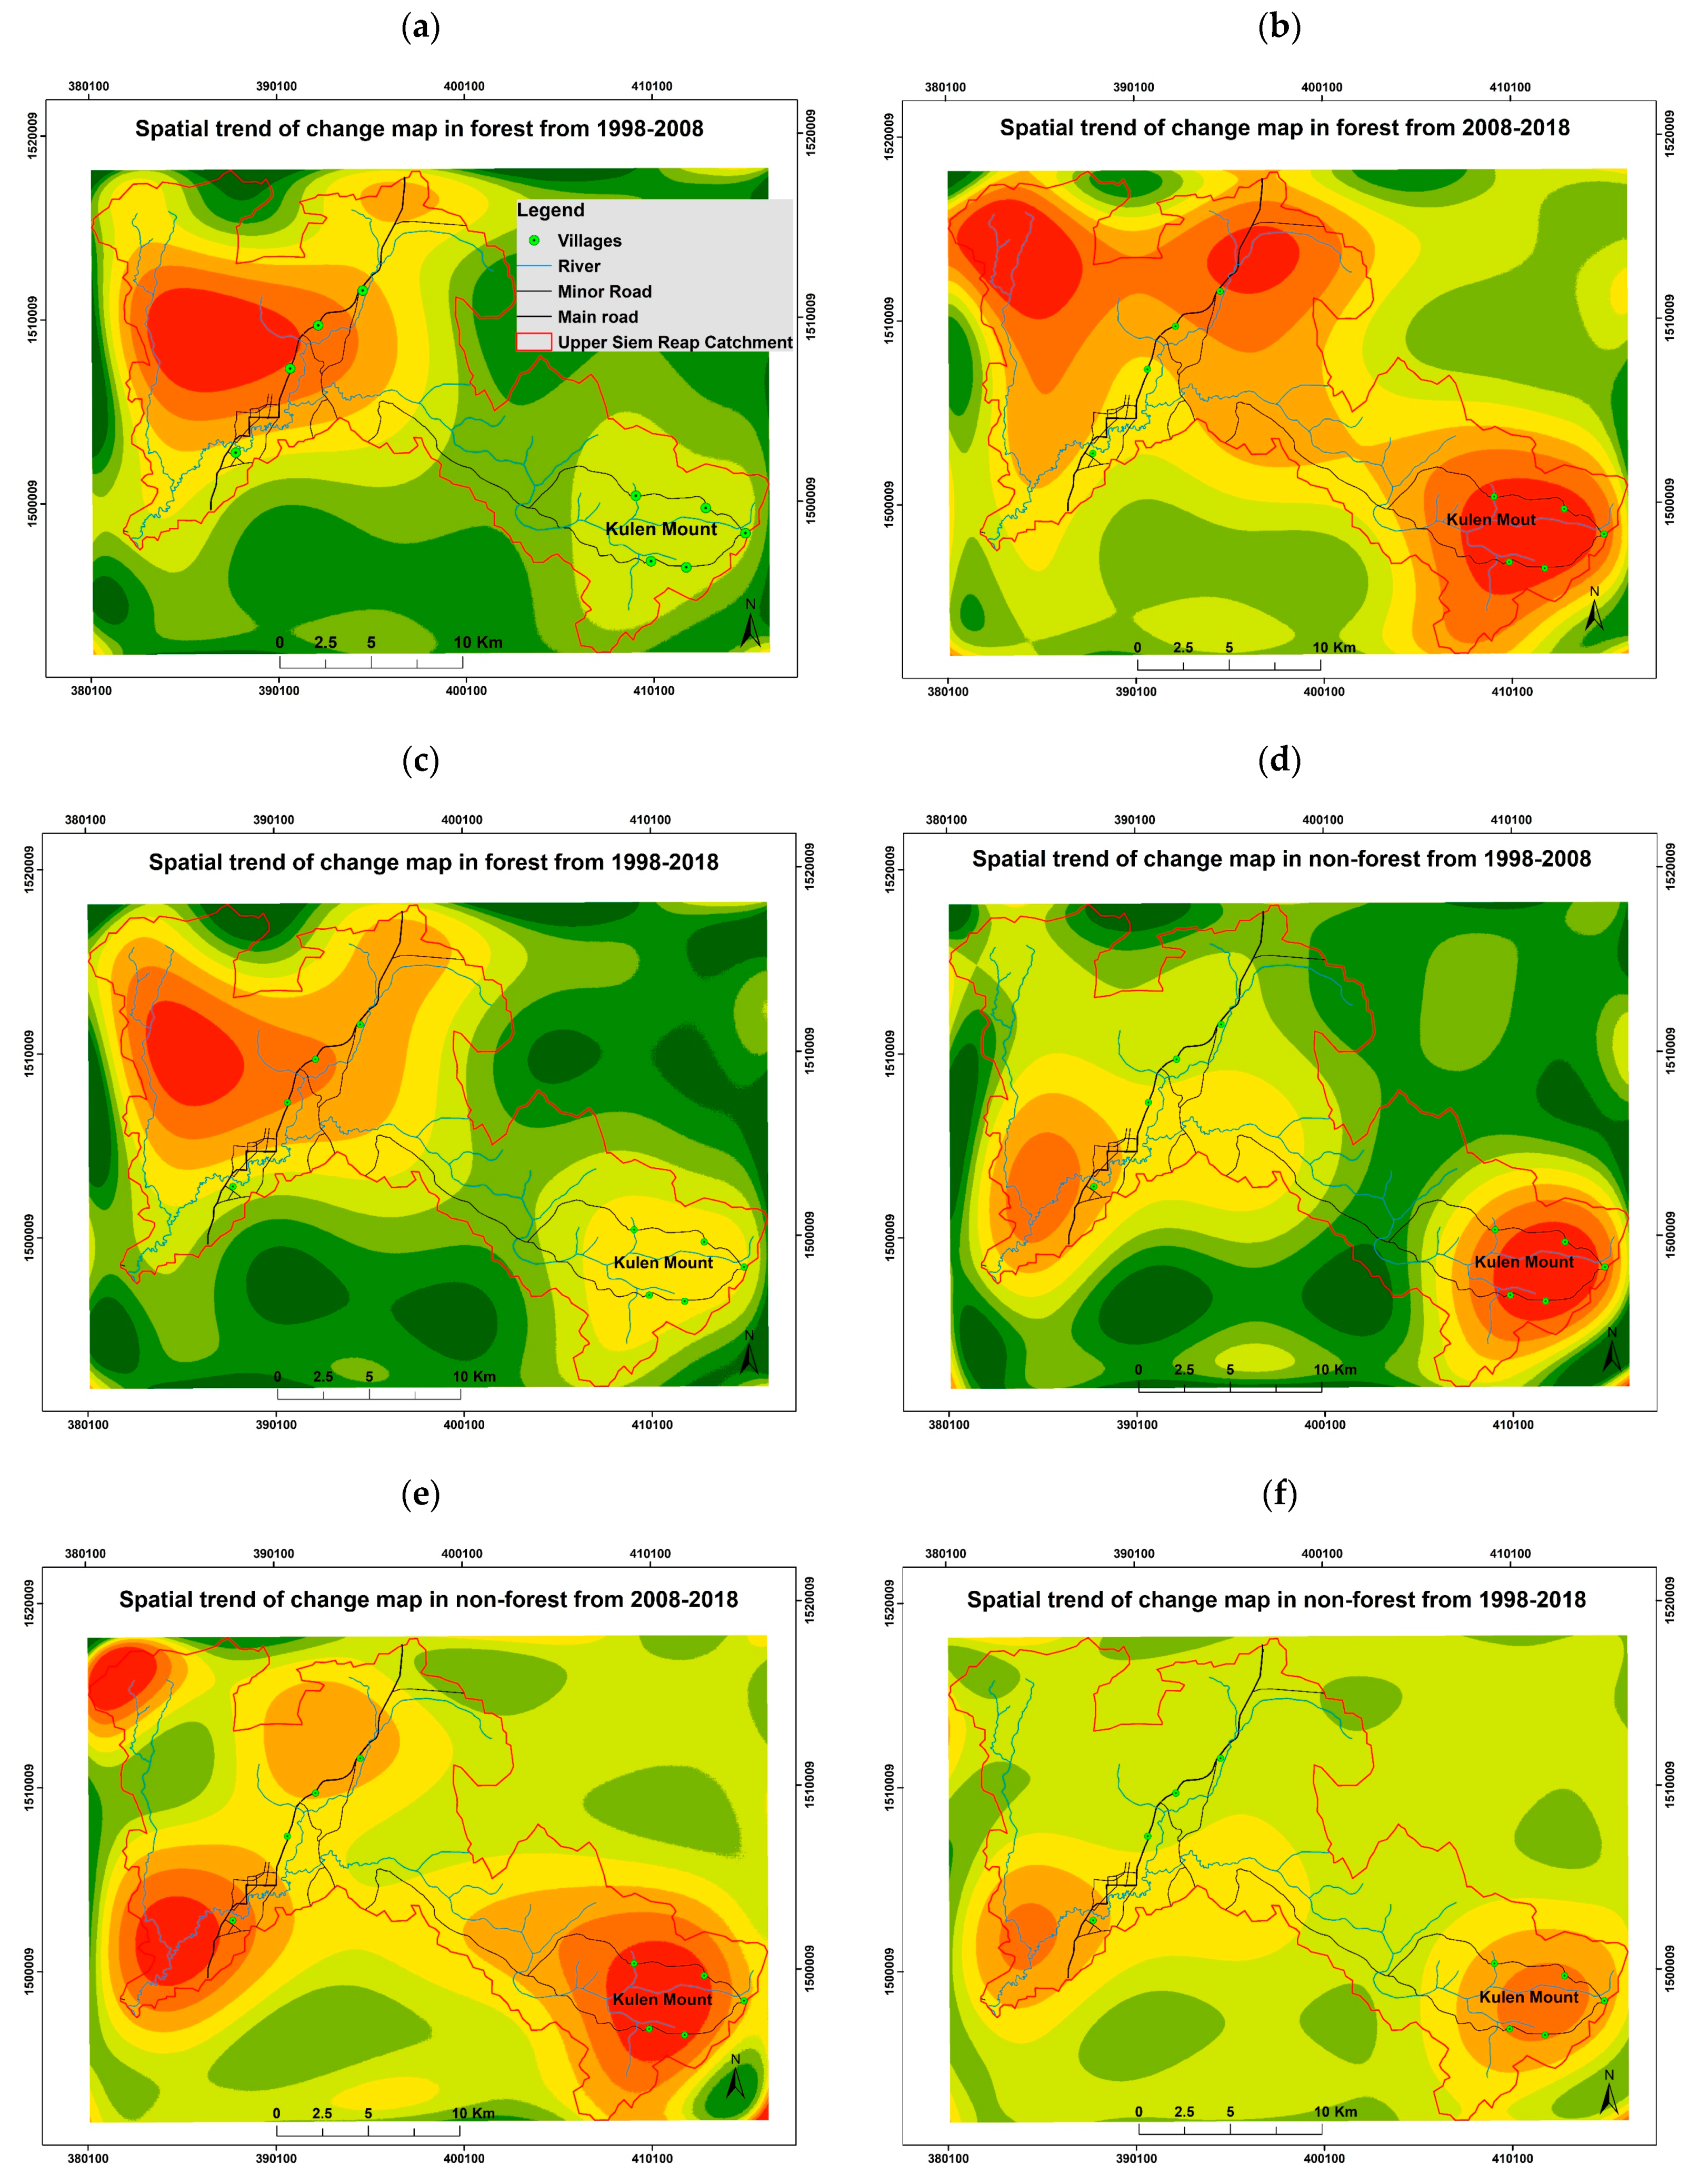
A generalized trend surface, representing the spatial weighting of the state transitions within a given epoch, is a useful technique for visualizing the geographic ‘hot-spots’ of change. This tool was developed by Eastman [25]. The level of detail can be generalized by using a lower polynomial order, while higher-order (up to 9 terms) surfaces reveal more spatial details of the trend. In this study, a ninth-order surface was selected for a detailed visualisation of the trend of land use change across the whole catchment. The spatial trend maps of both forest and non-forest changes in Epoch 1 (1998–2008), 2 (2008–2018), and 3 (1998–2018) are shown in Figure 8a–f.
In Figure 8a,c, it can be seen that the spatial trend of change in forest cover in Epochs 1 and 3 occurred in similar locations. A notable change happened around the west of the map (dense red colour), along the main road (red and yellow colours), in the east of the catchment area (yellow colour), and in the lower right (south-east) of the map area (the Mount Kulen range). These changes were closely linked to the landmine clearance and development of access road infrastructure. Greater road access contributed to increased firewood and charcoal production, illegal logging activities, shifting cultivation, and agricultural expansion.
During Epoch 2, significant forest change took place in a few locations, such as along the main road (most notably in the north), in the north-west and the south-east of map (Figure 8b). Trends in forest change continued the pattern established in Epoch 1, with further incursion into the former forest. There are three driving factors that may be responsible for this: Further development of access roads such as the main road (under construction on Mount Kulen), secondary roads, village roads, and trekking roads (around the watershed areas), large-scale agricultural expansion, and shifting cultivation (mainly cashew plantation).
Deforestation began at lower elevations and proceeded to higher elevations. While in the first epoch (1998–2008) deforestation occurred in areas with elevations from 40 to 100 m above mean sea level (a.m.s.l.), in the second epoch (2008–2018), further encroachment of forest took place at elevations of 100 to around 120 a.m.s.l. On the other hand, there was a different pattern of deforestation along the top of Mount Kulen. The disturbances are scattered throughout the mountain range, since farmers have been shifting cultivation for more than six decades. However, the density of these scattered farming plots has increased considerably over the last two decades (both Epochs 1 and 2: 1998–2008 and 2008–2018) with the elevation from 320 to 420 a.m.s.l.
The trend surfaces within non-forested areas in the epoch of 1998–2008 (Figure 8d) and 1998–2018 (Figure 8f) exhibit a similar form, with hot-spots of change in the southwest part of the map and southeast part of the map or in the Mount Kulen range. However, a majority of change happened in the southwest part of the map (close to the lower main road), the north part (close to upper main road), the northwest and the southeast of the map (Figure 8e) during 2008–2018. Forest regeneration generally occurred in the mountainous areas such as the north part (close to upper main road), the northwest and the southeast of the map, and in areas close to the protected area of Apsara Authority or in temple areas in the southwest part of the map (close to the lower main road). There are often encroachments upon this government-owned land due to lax enforcement of land laws.

4.3.3. Multi-Layer Perceptron Markov chain (MLP-MC) analysis

MLPNN-MC methods were applied to simulate LULC change to year 2018 using LULC maps years 1998 and 2008 (Epoch 1) and drivers of change. A further aim was to predict LULC maps out to years 2058 and 2098 using LULC maps years 2008 to 2018 (Epoch 2) and successful calibration of drivers setting of simulated LULC map 2018.
The MLP-MC method, as other spatial models, normally carried data, model, and future predictions uncertainty [50]. Noise in land use data input can cause uncertainty, but it was reduced by a validation process by comparing classified images with ground truth [51] and field survey. Further reduction of uncertainty of input data was carried out by MLPNN-MC, which is capable of handling data uncertainties [51,52,53]. During training and testing, the model worked with drivers and hidden layers under 10,000 interactions to generate the expected transition of Epoch 1 by minimizing the root mean square (RMS) (training RMS 0.165 and testing RMS 0.164). Moreover, sensitivity analysis can lower the model uncertainty [53,
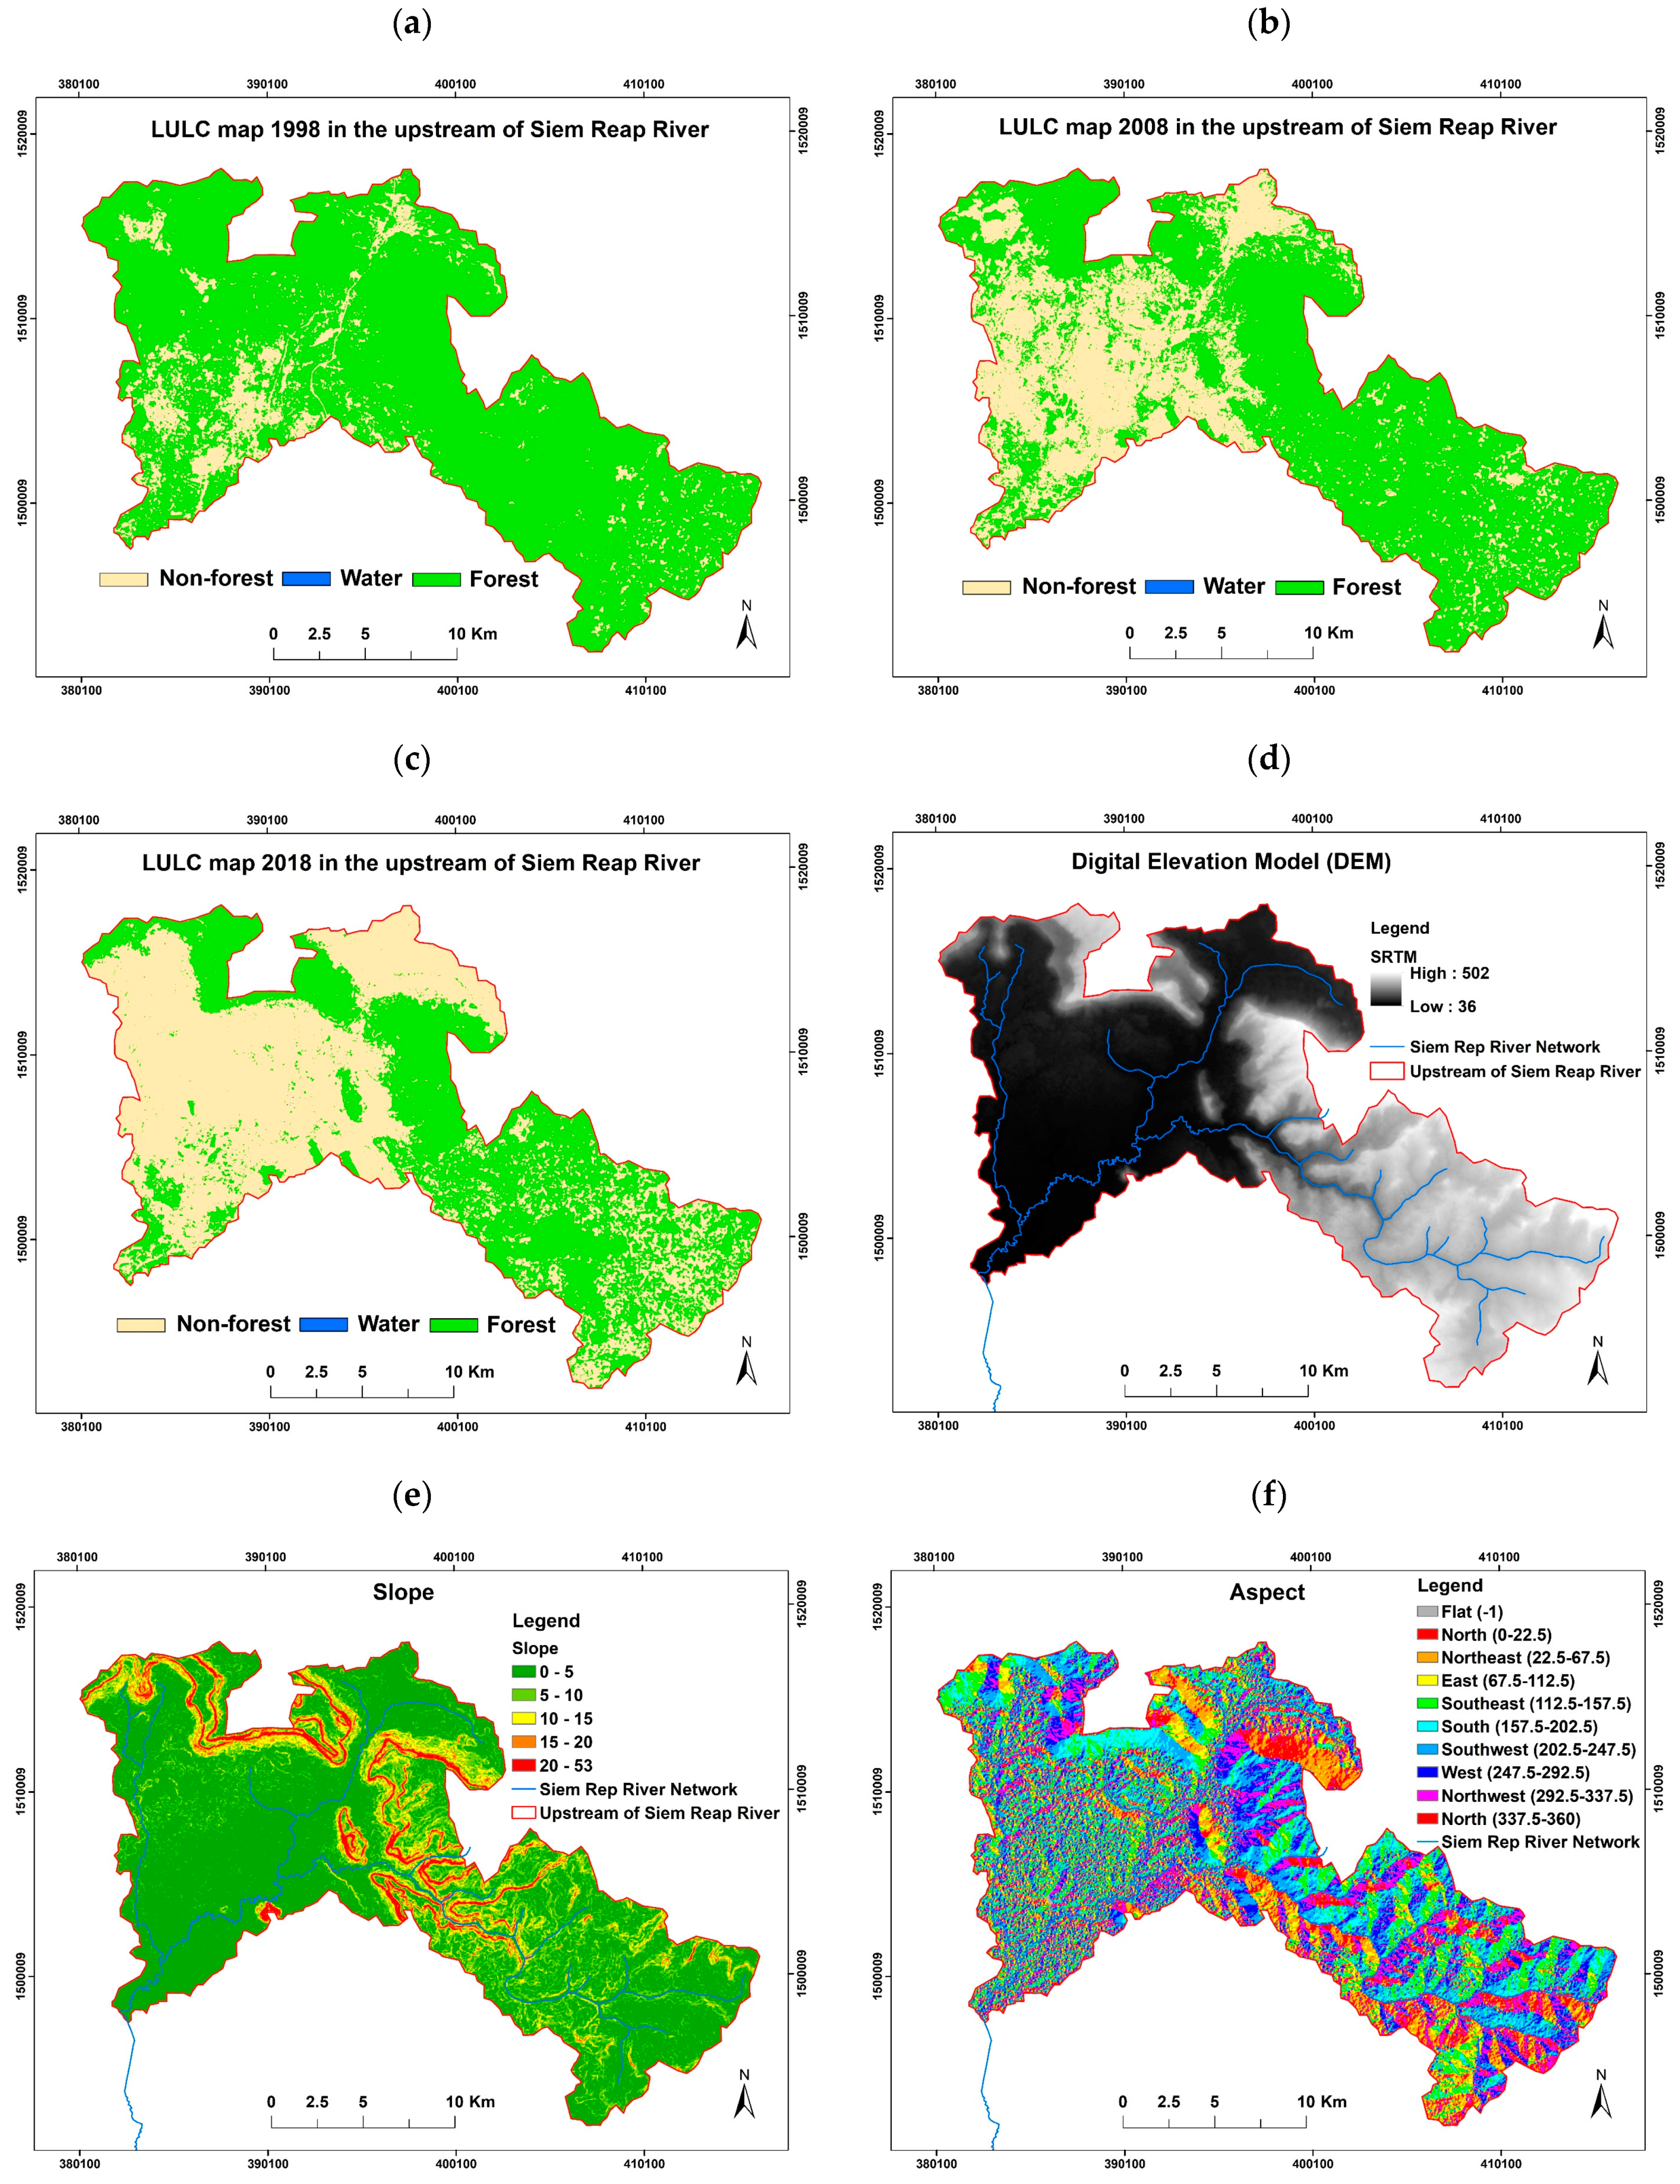
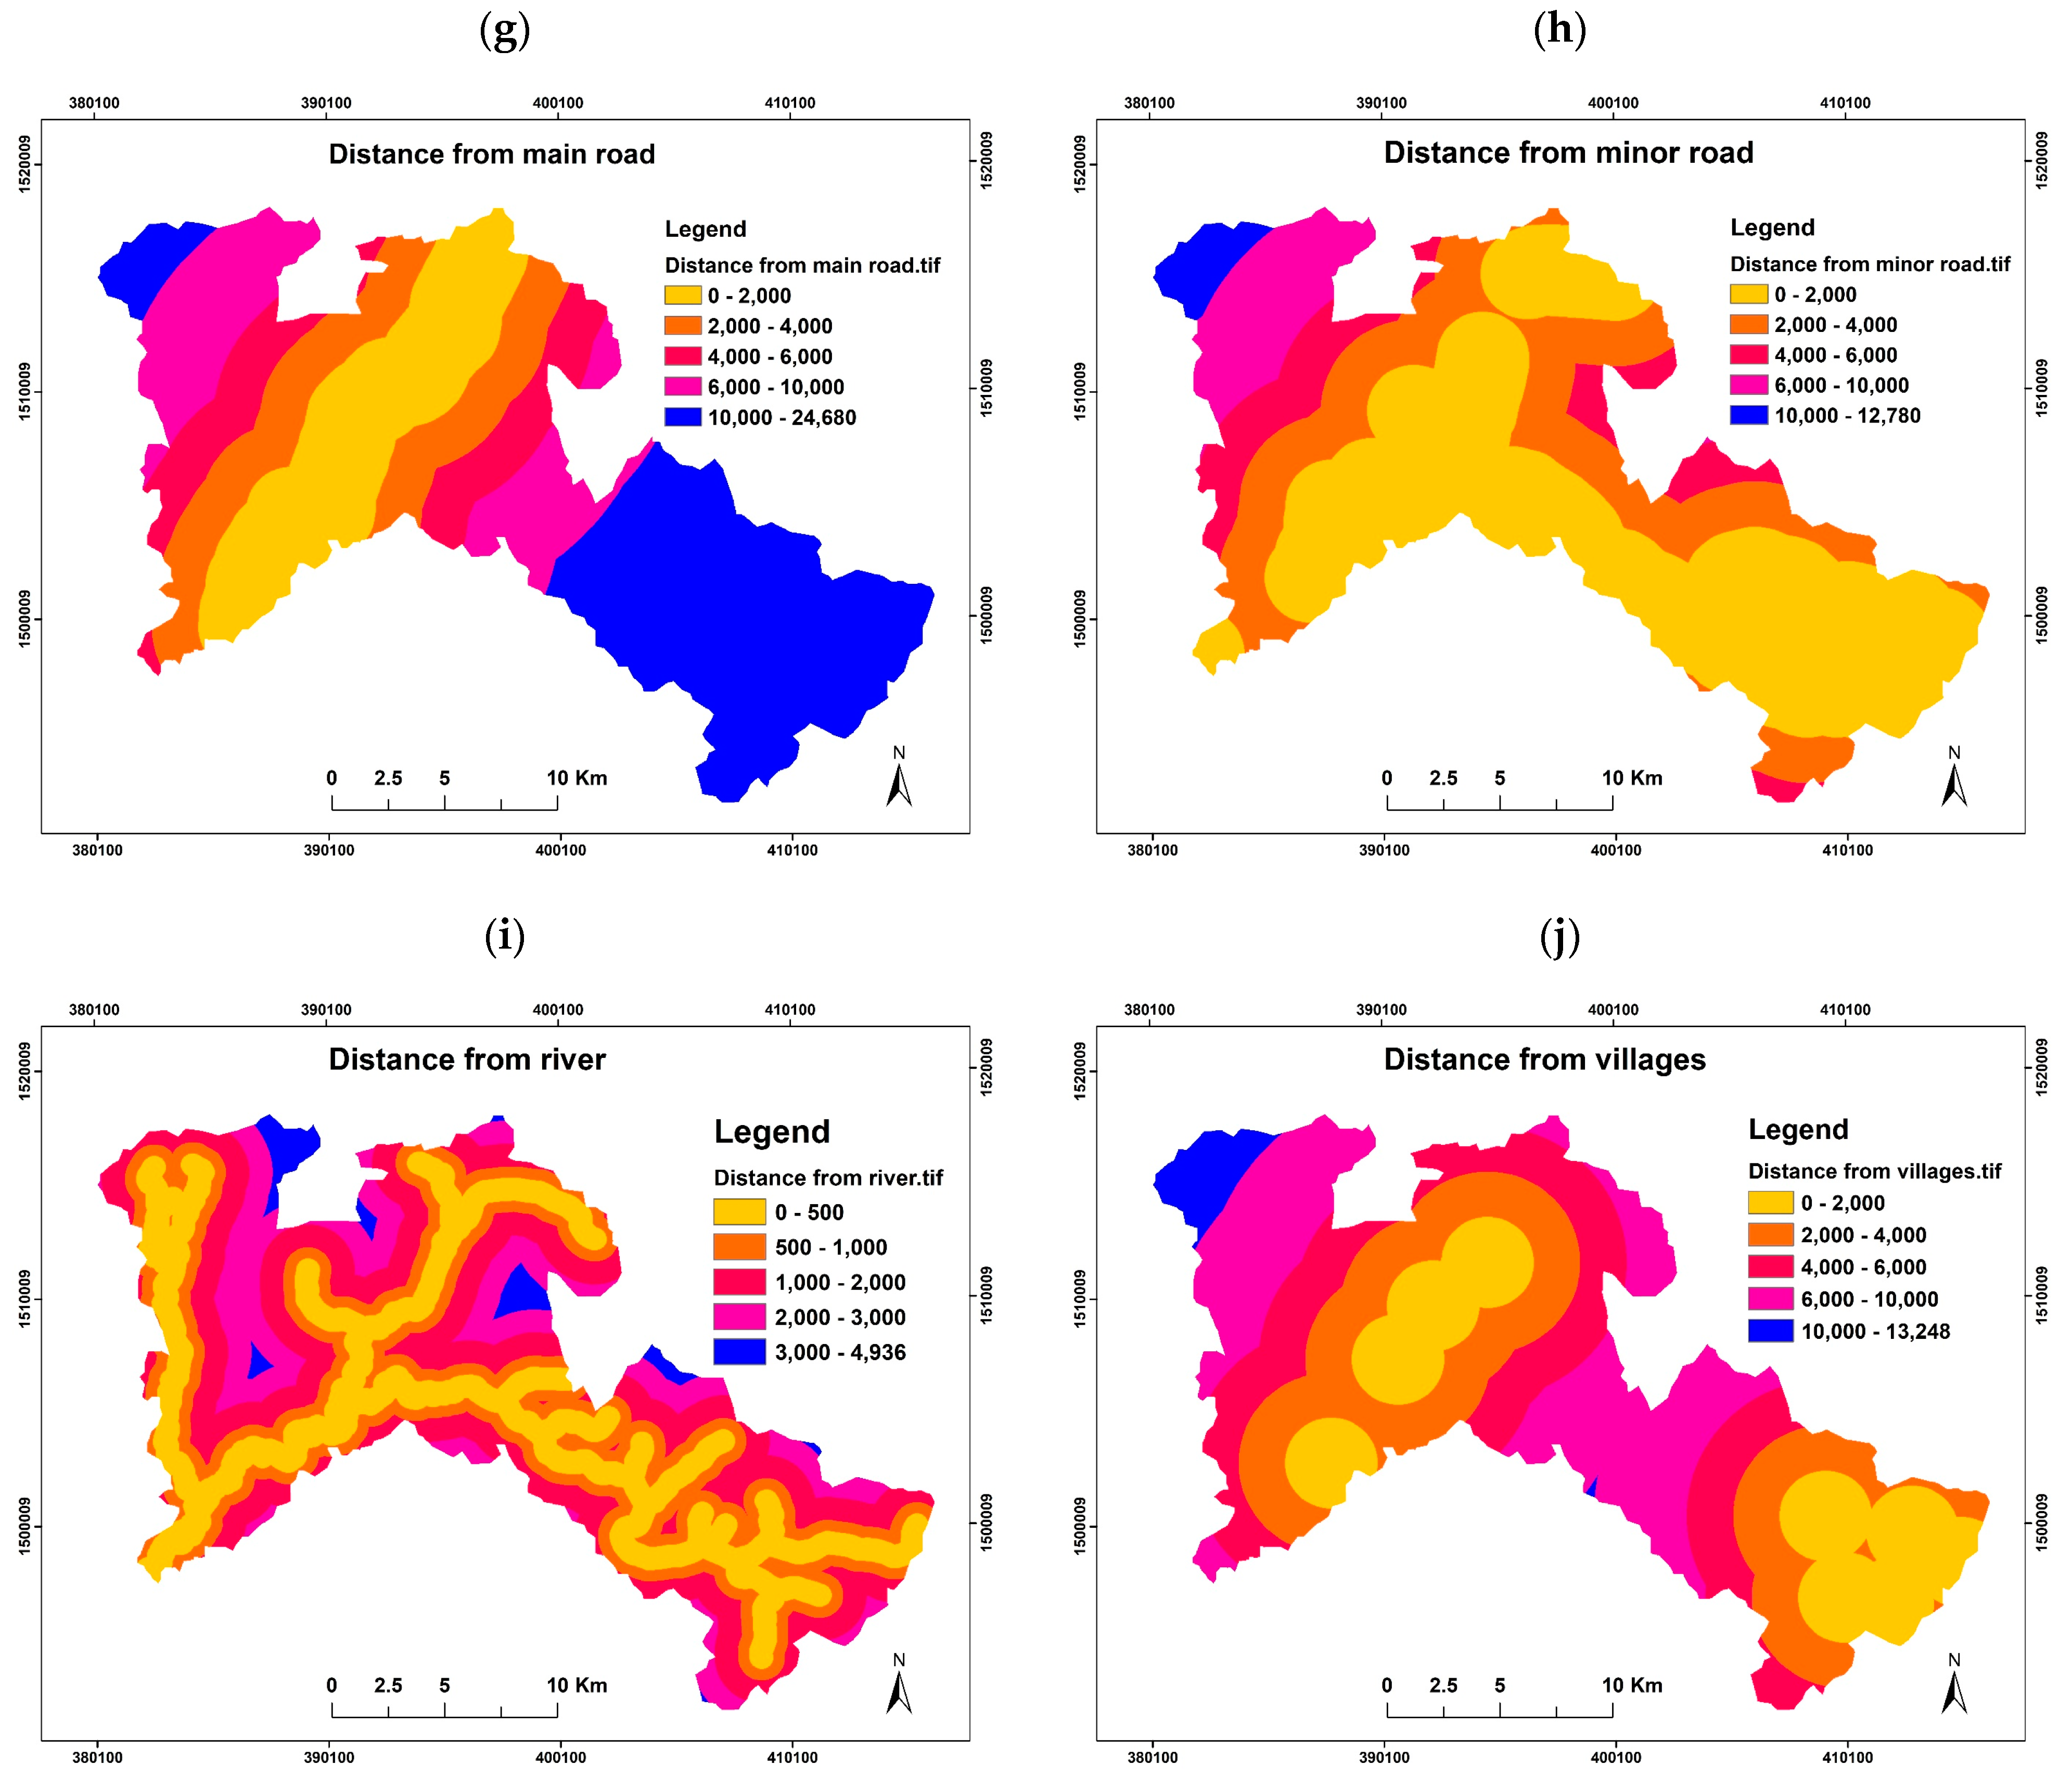
54]. Sensitivity analysis of drivers for LULC changes between 1998 to 2008 can be tested through MLPANN. Each driver was fed in the model separately to identify their influential factors contributing to land use change in the study catchment. The relative influence of each driver was evaluated by the model as shown in Table 5.
The most influential factors were elevation, distance from main road, and distance from villages, and the least influence drivers were distance from minor road, slope, and aspect. Elevation was one of the most effective discriminant variables for LULC change because deforestation happens mainly at lower elevations across the catchment. Similarly, distance from main road was a good predictor, since roads provided easy access for logging. Another significant driver factor is distance from villages. It can clearly be seen that villages in the catchment are loci for forest clearance, particularly those villages located along the main road. As the population grows, rates of deforestation surrounding villages will continue to grow.
A combination of all seven drivers of change and LULC maps in Epoch 1 were fed in the MLPNN, and it produced the potential transition maps (F-NF and NF-F) with an accuracy rate of 93.29%, which was satisfactory and easily surpassed the acceptance threshold of 80% [45].
The MC technique was then used with the potential transition results from MLPNN to generate the transition probability matrix and simulate LULC map 2018. As shown in Table 6, the probability of non-forest areas remaining as non-forest areas (NF-NF) was 81.51%, and the probability of change in the non-forest land to forest land (NF-F) was only 18.49% in year 2018. The probability of forested areas staying the same (F-F) was 70.48% and the probability of change from forest areas to non-forest areas (F-NF) was only 29.52% in the same year.
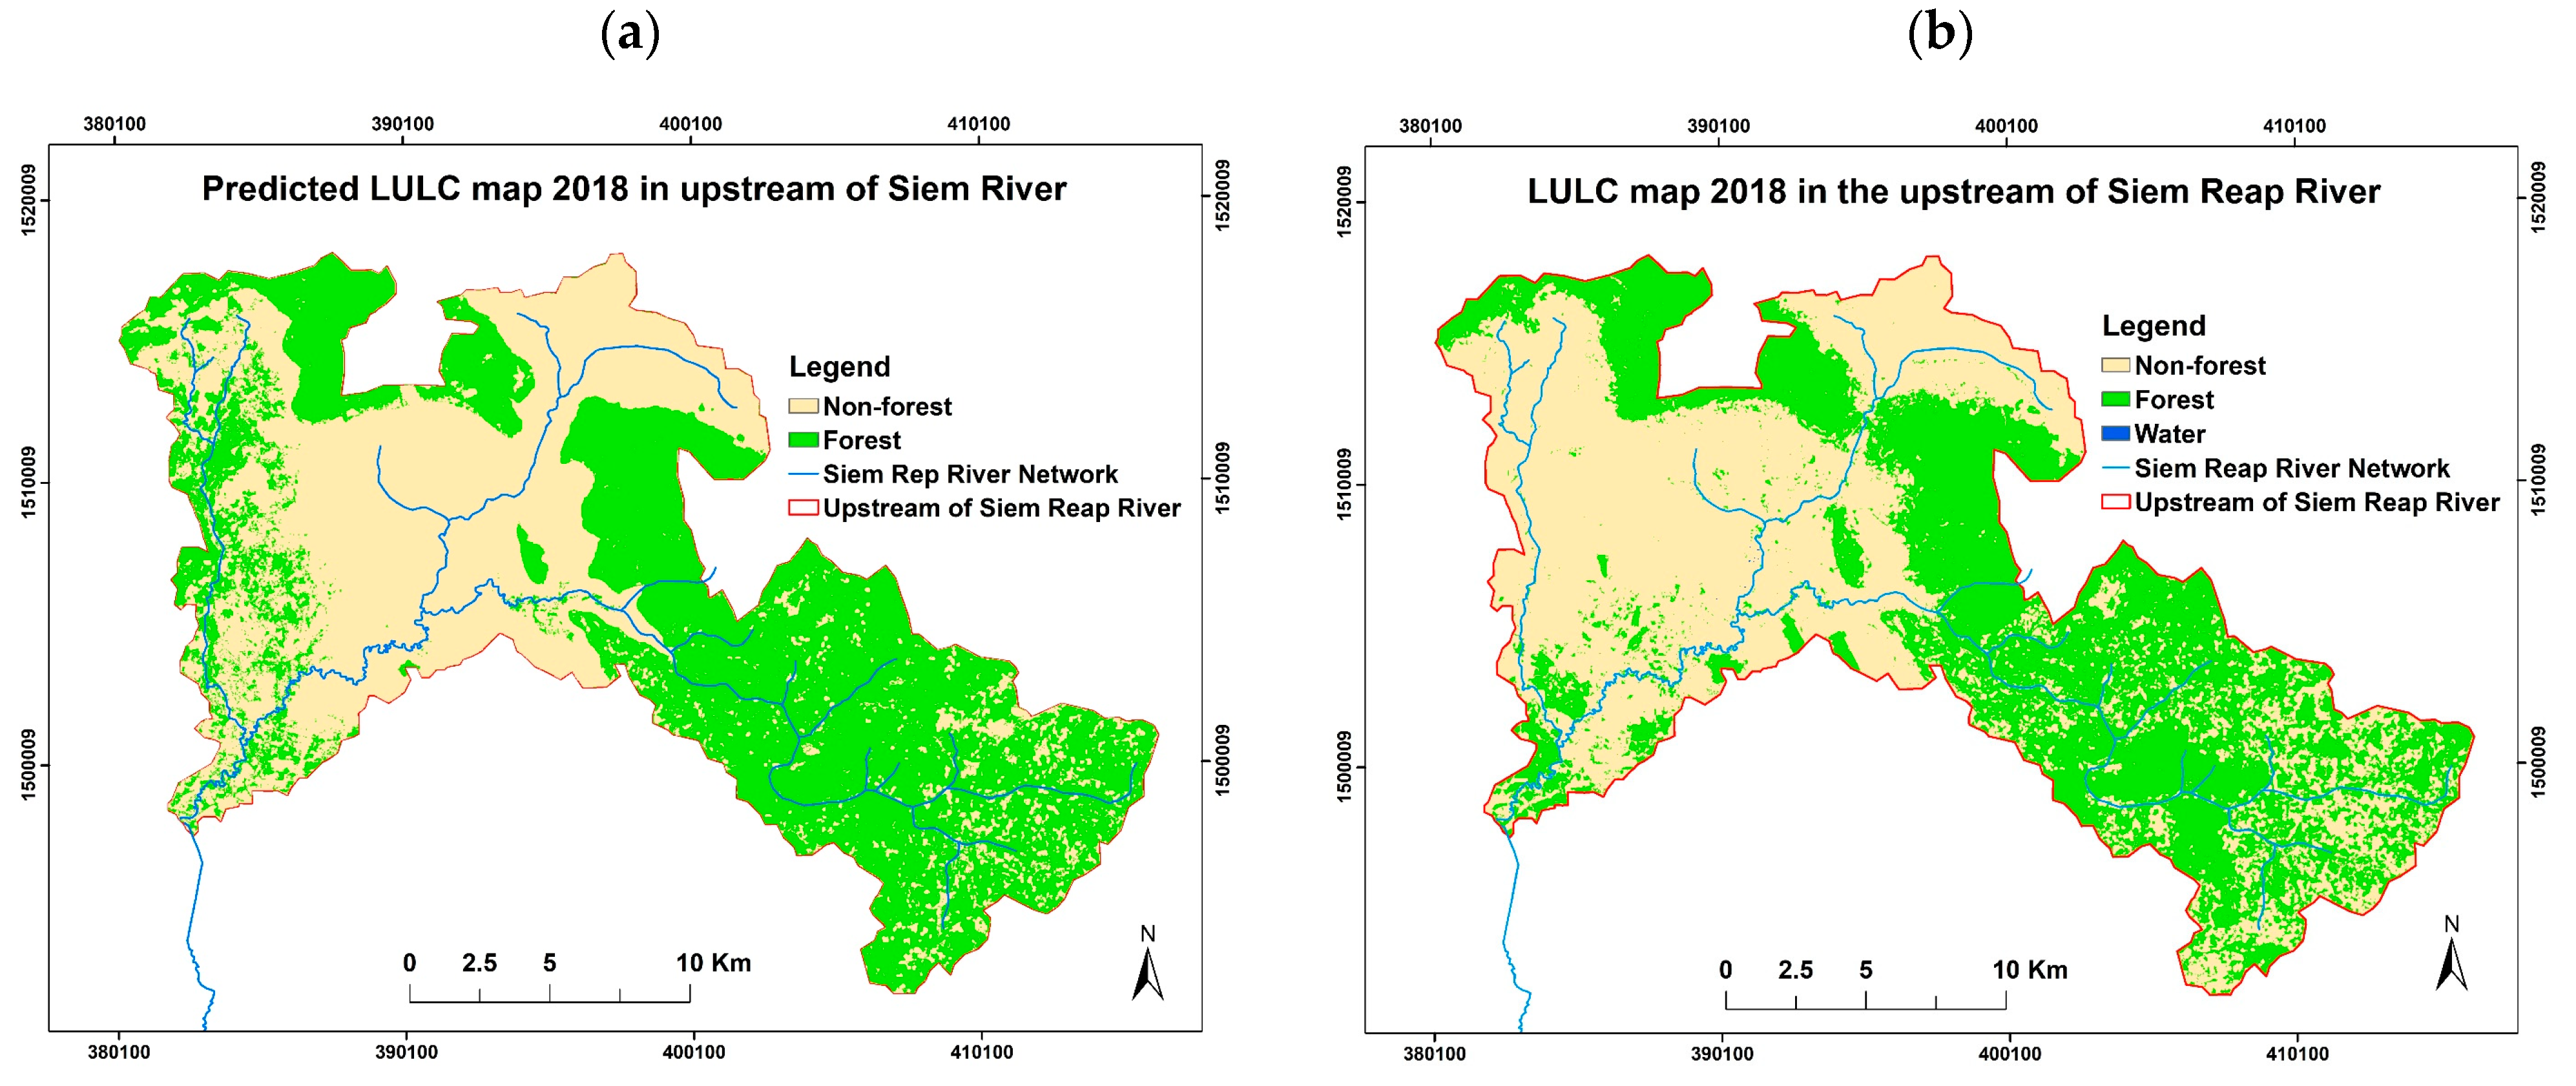
After simulation of LULC map 2018 using MLPANN-MC, a validation process was carried out by comparing pixels of the simulated and actual LULC maps 2018 (Figure 9a,b) using kappa index statistics. Based on this comparison, the statistical results show that the general kappa statistic or Cohen’s kappa statistic, Kstandard was 0.8112, Kno value was 0.8349, Klocation was 0.8560, and KlocationStrata was 0.8560. According to this statistic, all kappa index values were greater than 0.70, showing good agreement between simulated and actual LULC change. It indicated that the simulated and observed land use were very similar.
Furthermore, it is difficult to overcome the uncertainty of future LULC maps since it is inherently spatial and cannot be represented in model [51,55]. Therefore, it is assumed that LULC change in Epoch 2 (2008–2018) would follow the same trend in the next four and eight decades.

4.3.4. Predicting Future LULC Maps 2058 and 2098

After successful validation of modelled and actual LULC maps 2018, simulation of LULC maps 2058 and 2098 was performed using the same setting of driver parameters and LULC maps in Epoch 2. The transition probability matrixes of simulated LULC maps 2058 and 2098 are shown in Table 7 and Table 8.
Based on Table 7, the probability of non-forest areas remaining in the same class (NF-NF) was 81.11% and the probability of change in the non-forest land to forest land (NF-F) was 19.89% in the year 2058. The probability of forested areas staying the same (F-F) was 28.55% and the probability of change from forest areas to non-forest areas (F-NF) was only 71.45% in the same year. According to Table 8, the probability of non-forest areas remaining the same class (NF-NF) was 78.39% and the probability of change in the non-forest land to forest land (NF-F) was 21.61% in the year 2098. The probability of forested areas staying the same (F-F) was 22.36% and the probability of change from forest areas to non-forest areas (F-NF) was only 77.64% in the same year.
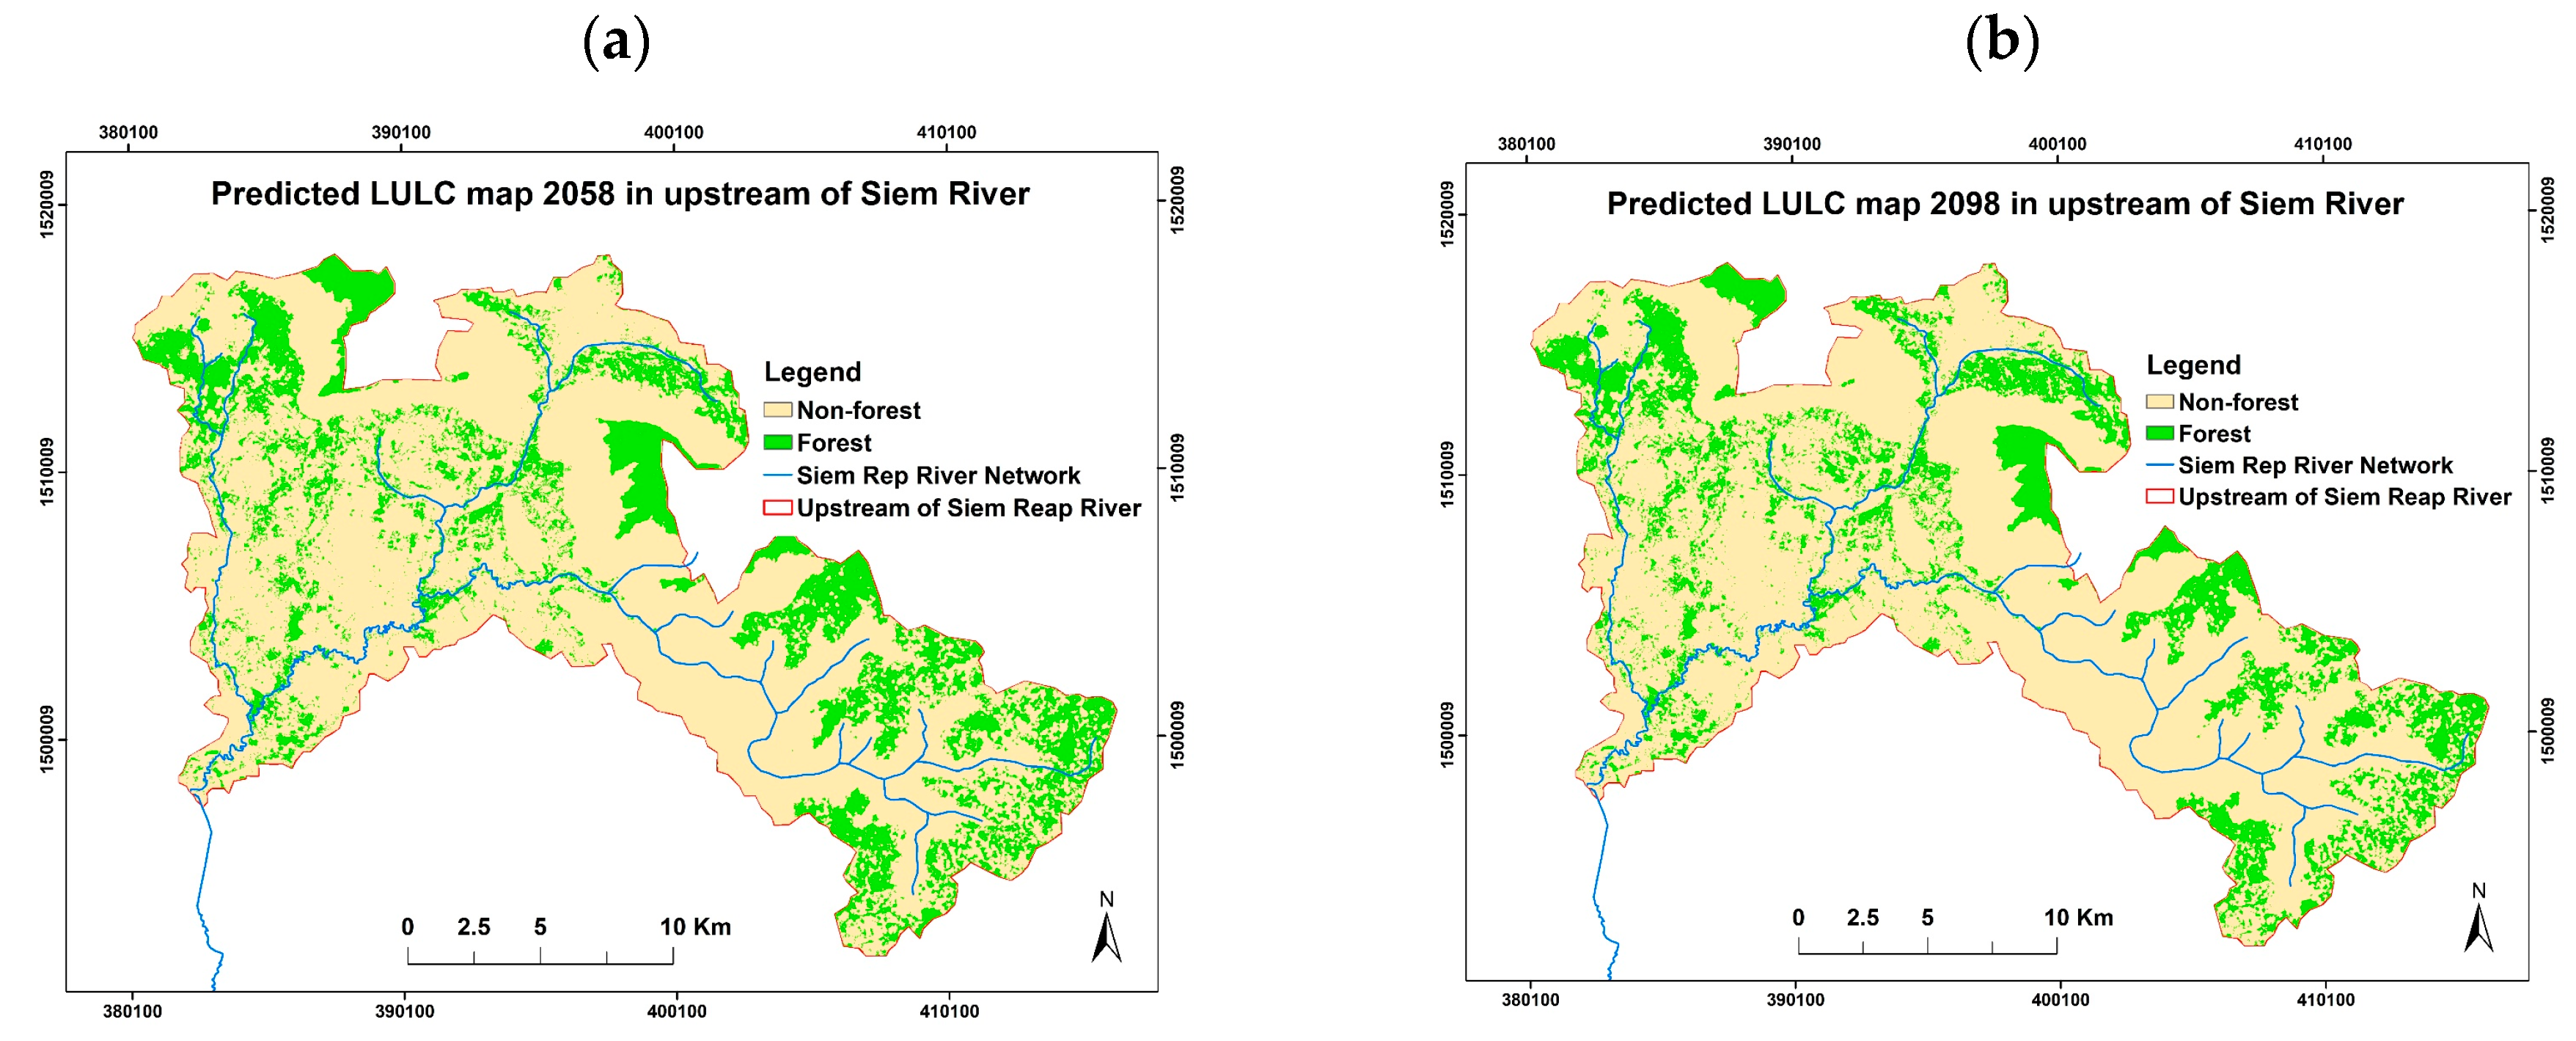
The LULC maps 2058 and 2098 images were generated as shown in Figure 10. The prediction revealed that there would be an increase in non-forest areas, from 227.30 km2 (55.53%) to 313.12 km2 (76.49%) between 2018 and 2058. Conversely, the total forest area would decrease from 182.02 km2 (44.47%) to 96.20 km2 (23.50%) in the same period. Furthermore, the non-forest covered areas would also continue to increase from 313.12 km2 (76.49%) to 320.44 km2 (78.28%) between 2058 and 2098. The forest covered areas would decrease from 96.20 km2 (23.50%) to 88.88 km2 (21.71%) in the same period. There was a small proportion of water in both predicted years, accounting for less than 0.01%. While the non-forest covered class could be expanded up to 22.75% of the catchment from 2018 to 2098, the forest cover naturally could be dropped the same proportion in upstream of Siem Reap River, Cambodia. LULC maps 2058 and 2098 are presented in Figure 10a,b.
The results from this model seem to indicate that there would be a continuous upward trend of non-forest and downward trend of forest cover in the future at the upstream of Siem Reap River. However, this model did not include a number of factors that might affect the system trajectory, including government policies and framework, socio-economic, and demographic information.

5. Conclusions and Discussion

LULC in the Siem Reap watershed has changed considerably over the last few decades. Given these highly dynamic conditions, and the great importance of water supply to the Angkor Wat complex, determining the current and future LULC is crucial. Based on the analysis, there has been a strongly decreasing trend in forest cover over the last three decades (1988–2018). The deforestation over that interval has been remarkable, at 36.61%. The average annual deforestation rate is 1.22%. Non-Forest areas have thus become the majority cover type in the watershed. The main reasons behind these trends are landmine clearance and road infrastructure development, which have contributed significantly to the expansion of agriculture, shifting cultivation, illegal logging, and firewood and charcoal production.
According to the LCM analysis, the majority of forest loss occurred within a low band of terrain elevation, between 40 to 120 m a.m.s.l., as well as in areas along the main road from south to north, in the west part of the catchment, and in some parts of Kulen National park at elevations of 320 to 420 a.m.s.l. The remaining forest cover is mainly located on the steep slopes of mountainous areas. This is consistent with the relative weighting of driver influence (Table 5), showing that elevation, distance from major roads, and distance from villages are more important than distance from minor road and river, slope, and aspect. The model also reveals that there would be a continuous upward trend of non-forest and downward trend of forest cover in the future (year 2058 and 2098) at the upstream of Siem Reap River, Cambodia. This forecasting results might have high possibility according to the field visit on the early of 2019 because it is observed that a main road and secondary roads are under construction along Mount Kulen, which provide an easy access and promote further deforestation in Mount Kulen range, but an actual spatial and quantity change might be different from the simulation LULC change (can be less or more than the prediction results). Overall, this model works satisfactorily and acceptable to simulate and forecast the LULC change in this study.
This model can be improved by including other missing parameters of change such as government policies and framework on land management, socio-economic, and demographic information, which have significant impact on the land use changes and future change. The LCM may be an imperfect model, but it can help to simulate the possible future of LULC maps with sufficient and visible driver factors of change. In addition, although GIS and LCM enable researchers to analyse and predict future LULC maps scenarios, high-resolution images should be used in the model in order to achieve further accuracy and prediction results.
Furthermore, since the indigenous communities have lived within the Mount Kulen National Park boundary, the scattered plots of regrowth and deforestation have appeared over the period of time. This evidence shows the shifting cultivation which is commonly practiced by people live in the upland regions. However, those scattered areas of deforestation have been converted into permanent agriculture since 2009, and those scatter plots have been increased significantly in the last decade. Therefore, the Cambodian government as well as related agencies should have visible plans either to identify the protected areas and shifting cultivation boundaries or even relocate the indigenous communities outside the protected boundary. Moreover, reforestation and forest-regrow should be taken into account by Cambodian government to restore forest cover and sustain the river flow since this watershed is important in providing water to maintain the Angkor complex, particularly Angkor Temple, which is a World Heritage Site.
The results of this study will contribute to the sustainable land management and development managers and related agencies involved in the decision-making process. These outcomes will also be an important step for further study on the effect of LULC and climate changes on hydrology because the continuous decrease of forest cover in the watershed may influence the hydrological components such as infiltration rate, runoff, and base flow [56], as well as water yield, which could threaten the unique characteristics of the river, including sustainable of Angkor temple, drinking supplies, and irrigation.

Author Contributions

K.C. conducted data collection, model running, analysed the results, and wrote the paper. J.T. and A.S. supervised the research, provided comments, and corrected the manuscript. T.O. guided in land use analysis.

Funding

This research received no funding.

Acknowledgments

The authors would like to thank supervisors, anonymous reviewers and editors for their valuable comments and suggestions that helped to improve the manuscript.

Conflicts of Interest

Authors declare no conflict of interest.

References

  1. Foley, J.A.; DeFries, R.; Asner, G.P.; Barford, C.; Bonan, G.; Carpenter, S.R.; Chapin, F.S.; Coe, M.T.; Daily, G.C.; Gibbs, H.K. Global consequences of land use. Science 2005, 309, 570–574. [Google Scholar] [CrossRef] [PubMed]
  2. Mwangi, H.; Lariu, P.; Julich, S.; Patil, S.; McDonald, M.; Feger, K. Characterizing the intensity and dynamics of land-use change in the Mara River Basin, East Africa. Forests 2017, 9, 8. [Google Scholar] [CrossRef]
  3. D Behera, M.; Borate, S.N.; Panda, S.N.; Behera, P.R.; Roy, P.S. Modelling and analyzing the watershed dynamics using Cellular Automata (CA)–Markov model–A geo-information based approach. J. Earth Syst. Sci. 2012, 121, 1011–1024. [Google Scholar] [CrossRef]
  4. Mubea, K.; Goetzke, R.; Menz, G. Applying cellular automata for simulating and assessing urban growth scenario based in Nairobi, Kenya. Int. J. Adv. Comput. Sci. Appl. 2014, 5, 1–13. [Google Scholar] [CrossRef]
  5. Hosonuma, N.; Herold, M.; De Sy, V.; De Fries, R.S.; Brockhaus, M.; Verchot, L.; Angelsen, A.; Romijn, E. An assessment of deforestation and forest degradation drivers in developing countries. Environ. Res. Lett. 2012, 7, 044009. [Google Scholar] [CrossRef]
  6. Geist, H.J.; Lambin, E.F. What Drives Tropical Deforestation; LUCC Report Series; UCC International Project Office: Louvain-la-Neuve, Belgium, 2001; Volume 4, p. 116. [Google Scholar]
  7. Carmona, A.; Nahuelhual, L. Combining land transitions and trajectories in assessing forest cover change. Appl. Geogr. 2012, 32, 904–915. [Google Scholar] [CrossRef]
  8. Neef, A.; Touch, S.; Chiengthong, J. The politics and ethics of land concessions in rural Cambodia. J. Agric. Environ. Ethics 2013, 26, 1085–1103. [Google Scholar] [CrossRef]
  9. Kozak Dehlin, S. Economic Land Concessions in Cambodia-At the Expense of Adequate Housing? A Minor Field Study. 2015. Available online: http://lup.lub.lu.se/student-papers/record/5434299 (accessed on 1 May 2018).
  10. Economic Land Concessions. Available online: https://opendevelopmentcambodia.net/profiles/economic-land-concessions/ (accessed on 1 May 2018).
  11. Liu, J.; Li, J.; Qin, K.; Zhou, Z.; Yang, X.; Li, T. Changes in land-uses and ecosystem services under multi-scenarios simulation. Sci. Total Environ. 2017, 586, 522–526. [Google Scholar] [CrossRef]
  12. Chen, J.; Mao, Z.; Philpot, B.; Li, J.; Pan, D. Detecting changes in high-resolution satellite coastal imagery using an image object detection approach. Int. J. Remote. Sens. 2013, 34, 2454–2469. [Google Scholar] [CrossRef]
  13. Sohl, T.L.; Wimberly, M.C.; Radeloff, V.C.; Theobald, D.M.; Sleeter, B.M. Divergent projections of future land use in the United States arising from different models and scenarios. Ecol. Model 2016, 337, 281–297. [Google Scholar] [CrossRef] [Green Version]
  14. Verburg, P.H.; Schot, P.P.; Dijst, M.J.; Veldkamp, A. Land use change modelling: Current practice and research priorities. GeoJournal 2004, 61, 309–324. [Google Scholar] [CrossRef]
  15. Li, X.; Chen, G.; Liu, X.; Liang, X.; Wang, S.; Chen, Y.; Pei, F.; Xu, X. A new global land-use and land-cover change product at a 1-km resolution for 2010 to 2100 based on human–environment interactions. Ann. Am. Assoc. Geogr. 2017, 107, 1040–1059. [Google Scholar] [CrossRef]
  16. Islam, M.S.; Ahmed, R. Land use change prediction in Dhaka city using GIS aided Markov chain modeling. J. Life Earth Sci. 2011, 6, 81–89. [Google Scholar] [CrossRef]
  17. Daniel, C.J.; Frid, L.; Sleeter, B.M.; Fortin, M. State-and-transition simulation models: A framework for forecasting landscape change. Methods Ecol. Evol. 2016, 7, 1413–1423. [Google Scholar] [CrossRef]
  18. Mas, J.; Puig, H.; Palacio, J.L.; Sosa-Lopez, A. Modelling deforestation using GIS and artificial neural networks. Environ. Model. Softw. 2004, 19, 461–471. [Google Scholar] [CrossRef]
  19. Berberoglu, S.; Akın, A.; Clarke, K.C. Cellular automata modeling approaches to forecast urban growth for adana, Turkey: A comparative approach. Landsc. Urban Plan. 2016, 153, 11–27. [Google Scholar] [CrossRef]
  20. Alsharif, A.A.; Pradhan, B. Urban sprawl analysis of Tripoli Metropolitan city (Libya) using remote sensing data and multivariate logistic regression model. J. Indian Soc. Remote Sens. 2014, 42, 149–163. [Google Scholar] [CrossRef]
  21. Triantakonstantis, D.; Mountrakis, G. Urban growth prediction: A review of computational models and human perceptions. J. Geogr. Inf. Syst. 2012, 4, 555. [Google Scholar] [CrossRef]
  22. Lacono, M.; Levinson, D.; El-Geneidy, A.; Wasfi, R. A Markov chain model of land use change. TeMA J. Land Use Mobil. Environ. 2015, 8, 263–276. [Google Scholar]
  23. Mishra, V.N.; Rai, P.K. A remote sensing aided multi-layer perceptron-Markov chain analysis for land use and land cover change prediction in Patna district (Bihar), India. Arab. J. Geosci. 2016, 9, 249. [Google Scholar] [CrossRef]
  24. Sangermano, F.; Eastman, J.R.; Zhu, H. Similarity Weighted Instance-based Learning for the Generation of Transition Potentials in Land Use Change Modeling. Trans. GIS 2010, 14, 569–580. [Google Scholar] [CrossRef]
  25. Eastman, J.R. IDRISI Selva Manual; Clark Labs: Worcester, MA, USA, 2012. [Google Scholar]
  26. Roodposhti, M.S.; Aryal, J.; Bryan, B.A. A novel algorithm for calculating transition potential in cellular automata models of land-use/cover change. Environ. Model. Softw. 2019, 112, 70–81. [Google Scholar] [CrossRef]
  27. Megahed, Y.; Cabral, P.; Silva, J.; Caetano, M. Land cover mapping analysis and urban growth modelling using remote sensing techniques in greater Cairo region—Egypt. ISPRS Int. J. Geo-Inf. 2015, 4, 1750–1769. [Google Scholar] [CrossRef]
  28. Achmad, A.; Hasyim, S.; Dahlan, B.; Aulia, D.N. Modeling of urban growth in tsunami-prone city using logistic regression: Analysis of Banda Aceh, Indonesia. Appl. Geogr. 2015, 62, 237–246. [Google Scholar] [CrossRef]
  29. Uddin, K.; Chaudhary, S.; Chettri, N.; Kotru, R.; Murthy, M.; Chaudhary, R.P.; Ning, W.; Shrestha, S.M.; Gautam, S.K. The changing land cover and fragmenting forest on the Roof of the World: A case study in Nepal’s Kailash Sacred Landscape. Landsc. Urban Plan. 2015, 141, 1–10. [Google Scholar] [CrossRef]
  30. Ahmed, B.; Ahmed, R. Modeling urban land cover growth dynamics using multi-temporal satellite images: A case study of Dhaka, Bangladesh. ISPRS Int. J. Geo-Inf. 2012, 1, 3–31. [Google Scholar] [CrossRef]
  31. Tewolde, M.G.; Cabral, P. Urban sprawl analysis and modeling in Asmara, Eritrea. Remote Sens. 2011, 3, 2148–2165. [Google Scholar] [CrossRef]
  32. Shooshtari, S.J.; Gholamalifard, M. Scenario-based land cover change modeling and its implications for landscape pattern analysis in the Neka Watershed, Iran. Remote Sens. Appl. Soc. Environ. 2015, 1, 1–19. [Google Scholar] [CrossRef]
  33. Wilson, C.O.; Weng, Q. Simulating the impacts of future land use and climate changes on surface water quality in the Des Plaines River watershed, Chicago Metropolitan Statistical Area, Illinois. Sci. Total Environ. 2011, 409, 4387–4405. [Google Scholar] [CrossRef]
  34. Touch, V.; Martin, R.J.; Scott, J.F.; Cowie, A.; Li Liu, D. Climate change adaptation options in rainfed upland cropping systems in the wet tropics: A case study of smallholder farms in North-West Cambodia. J. Environ. Manag. 2016, 182, 238–246. [Google Scholar] [CrossRef]
  35. Angkor Water Crisis. Available online: https://en.unesco.org/courier/2017-april-june/angkor-water-crisis (accessed on 24 July 2018).
  36. Chim, K.; Local Authority of Anlong Thom Village, Siem Reap, Cambodia. Personal communication, 2019.
  37. Bruijnzeel, L.A. Hydrology of Moist Tropical Forests and Effects of Conversion: A State of Knowledge Review; Free University: Amsterdam, The Netherlands, 1990. [Google Scholar]
  38. Vertessy, R.A.; Watson, F.; O’Sullivan, S.; Davis, S.; Campbell, R.; Benyon, R.; Haydon, S. Predicting water yield from mountain ash forest catchments. Ind. Rep. 1998, 98, 38. [Google Scholar]
  39. Wang, S.; Kang, S.; Zhang, L.; Li, F. Modelling hydrological response to different land use and climate change scenarios in the Zamu River basin of northwest China. Hydrol. Process. 2008, 22, 2502–2510. [Google Scholar] [CrossRef]
  40. Khoi, D.N.; Thom, V.T. Parameter uncertainty analysis for simulating streamflow in a river catchment of Vietnam. Glob. Ecol. Conserv. 2015, 4, 538–548. [Google Scholar] [CrossRef] [Green Version]
  41. Barsi, J.A.; Lee, K.; Kvaran, G.; Markham, B.L.; Pedelty, J.A. The spectral response of the Landsat-8 operational land imager. Remote Sens. 2014, 6, 10232–10251. [Google Scholar] [CrossRef]
  42. Qian, J.; Zhou, Q.; Hou, Q. Comparison of pixel-based and object-oriented classification methods for extracting built-up areas in arid zone. In ISPRS Workshop on Updating Geo-spatial Databases with Imagery & the 5th ISPRS Workshop on DMGISs; National Geomatics Center of China sponsored: Beijing, China, 2007; pp. 163–171. [Google Scholar]
  43. Congalton, R.G. A review of assessing the accuracy of classifications of remotely sensed data. Remote. Sens. Environ. 1991, 37, 35–46. [Google Scholar] [CrossRef]
  44. Rogan, J.; Miller, J.; Stow, D.; Franklin, J.; Levien, L.; Fischer, C. Land-cover change monitoring with classification trees using Landsat TM and ancillary data. Photogramm. Eng. Remote Sens. 2003, 69, 793–804. [Google Scholar] [CrossRef]
  45. Eastman, J.R. IDRISI Andes Tutorial; Clark Labs: Worcester, MA, USA, 2006. [Google Scholar]
  46. Sang, L.; Zhang, C.; Yang, J.; Zhu, D.; Yun, W. Simulation of land use spatial pattern of towns and villages based on CA–Markov model. Math. Comput. Model. 2011, 54, 938–943. [Google Scholar] [CrossRef]
  47. Tajbakhsh, S.M.; Memarian, H.; Moradi, K.; Aghakhani Afshar, A.H. Performance comparison of land change modeling techniques for land use projection of arid watersheds. Glob. J. Environ. Sci. Manag. 2018, 4, 263–280. [Google Scholar] [CrossRef]
  48. Costenbader, J.; Broadhead, J.; Yasmi, Y.; Durst, P.B. Drivers Affecting Forest Change in the Greater Mekong Subregion (GMS): An Overview; FAO: Rome, Italy, 2015. [Google Scholar]
  49. Gaughan, A.E.; Binford, M.W.; Southworth, J. Tourism, forest conversion, and land transformations in the Angkor basin, Cambodia. Appl. Geogr. 2009, 29, 212–223. [Google Scholar] [CrossRef]
  50. Pontius, R.G.; Neeti, N. Uncertainty in the difference between maps of future land change scenarios. Sustain. Sci. 2010, 5, 39. [Google Scholar] [CrossRef]
  51. Xu, T.; Gao, J.; Coco, G. Simulation of urban expansion via integrating artificial neural network with Markov chain–cellular automata. Int. J. Geogr. Inf. Sci. 2019, 1–24. [Google Scholar] [CrossRef]
  52. Grekousis, G.; Manetos, P.; Photis, Y.N. Modeling urban evolution using neural networks, fuzzy logic and GIS: The case of the Athens metropolitan area. Cities 2013, 30, 193–203. [Google Scholar] [CrossRef]
  53. Tayyebi, A.; Tayyebi, A.H.; Arsanjani, J.J.; Moghadam, H.S.; Omrani, H. FSAUA: A framework for sensitivity analysis and uncertainty assessment in historical and forecasted land use maps. Environ. Model. Softw. 2016, 84, 70–84. [Google Scholar] [CrossRef]
  54. Ferchichi, A.; Boulila, W.; Farah, I.R. Reducing uncertainties in land cover change models using sensitivity analysis. Knowl. Inf. Syst. 2018, 55, 719–740. [Google Scholar] [CrossRef]
  55. Mustafa, A.; Heppenstall, A.; Omrani, H.; Saadi, I.; Cools, M.; Teller, J. Modelling built-up expansion and densification with multinomial logistic regression, cellular automata and genetic algorithm. Comput. Environ. Urban Syst. 2018, 67, 147–156. [Google Scholar] [CrossRef] [Green Version]
  56. Zhang, Y.; Schilling, K.E. Increasing streamflow and baseflow in Mississippi River since the 1940 s: Effect of land use change. J. Hydrol. 2006, 324, 412–422. [Google Scholar] [CrossRef]
Figure 1. Map of the study area (WGS 84 Zone 48 N). The province of Siem Reap is located in the north of Cambodia (A), and the study area is in the central part of the province (B). The study catchment is the primary water source for the network of canals that supply the Angkor complex and the Siem Reap municipality.
Hydrology 06 00064 g001
Figure 2. Deforestation drivers in the upstream of Siem Reap River.
Hydrology 06 00064 g002
Figure 3. LULC map of upstream Siem Reap River in year: (a) 1998, (b) 2008, and (c) 2018 and the different drivers in LULC change in the study: (d) Digital elevation model, (e) slope, (f) aspect, (g) distance from main road, (h) minor road, (i) distance from river, and (j) distance from villages (distance unit is meter).
Hydrology 06 00064 g003aHydrology 06 00064 g003b
Figure 4. Overview of the methodology of land use and land cover (LULC) maps and prediction in the upper Siem Reap River.
Hydrology 06 00064 g004
Figure 5. Land cover change in Siem Reap upstream.
Hydrology 06 00064 g005
Figure 6. Gains and losses (in km2) in the year (a) 1998–2008, (b) 2008–2018, and (c) 1998–2018.
Hydrology 06 00064 g006
Figure 7. (a) LULC classes change during 1998–2018 and gains and losses of each class in from 1998 to 2018 (b) forest, and (c) non-forest.
Hydrology 06 00064 g007
Figure 8. The spatial trend of change in forest (ac) and non-forest (df) cover during 1998–2018 (red to dark green colour represents high to low level of trend change).
Hydrology 06 00064 g008
Figure 9. Predicted (a) and actual (b) LULC maps 2018.
Hydrology 06 00064 g009
Figure 10. Predicted LULC maps for years (a) 2058 and (b) 2098.
Hydrology 06 00064 g010
Table 1. Landsat data from 1988 to 2018.
NNameLandsat TypePixelBandsDate
1LT051270511988031101T1Landsat 4-5 TM C1-L2, Tier130 m7 Bands13-Feb-88
2LT051270511989031101T1Landsat 4-5 TM C1-L2, Tier130 m7 Bands11-Mar-89
3LT051270511990011701T1Landsat 4-5 TM C1-L2, Tier130 m7 Bands17-Jan-90
4LT051270511991020501T1Landsat 4-5 TM C1-L2, Tier130 m7 Bands05-Feb-91
5LT051270501992041201T1Landsat 4-5 TM C1-L2, Tier130 m7 Bands12-Apr-92
6LT041270511993050101T1Landsat 4-5 TM C1-L2, Tier130 m7 Bands01-May-93
7LT051270511994123001T1Landsat 4-5 TM C1-L2, Tier130 m7 Bands30-Dec-94
8LT051270511995032001T1Landsat 4-5 TM C1-L2, Tier130 m7 Bands20-Mar-95
9LT051270511996010201T1Landsat 4-5 TM C1-L2, Tier130 m7 Bands02-Jan-96
10LT051270511997122201T1Landsat 4-5 TM C1-L2, Tier130 m7 Bands22-Dec-97
11LT051270511998010701T1Landsat 4-5 TM C1-L2, Tier130 m7 Bands07-Jan-98
12LT051270511999012601T1Landsat 4-5 TM C1-L2, Tier130 m7 Bands26-Jan-99
13LT051270512000021401T1Landsat 4-5 TM C1-L2, Tier130 m7 Bands01-Mar-00
14LT051270512001021601T1Landsat 4-5 TM C1-L2, Tier130 m7 Bands16-Feb-01
15LE071270512002021101T1Landsat 7 ETM+, L2, Tier130 m8 Bands11-Feb-02
16LT051270512003122301T1Landsat 4-5 TM C1-L2, Tier130 m7 Bands23-Dec-03
17LT051270512004122501T1Landsat 4-5 TM C1-L2, Tier130 m7 Bands25-Dec-04
18LT051270512005022701T1Landsat 4-5 TM C1-L2, Tier130 m7 Bands27-Feb-05
19LT051270512006021401T1Landsat 4-5 TM C1-L2, Tier130 m7 Bands14-Feb-06
20LT051270512007020101T1Landsat 4-5 TM C1-L2, Tier130 m7 Bands01-Feb-07
21LT051270512008122001T1Landsat 4-5 TM C1-L2, Tier130 m7 Bands20-Dec-08
22LT051270512009020601T1Landsat 4-5 TM C1-L2, Tier130 m7 Bands06-Feb-09
23LT051270512010122601T1Landsat 4-5 TM C1-L2, Tier130 m7 Bands26-Dec-10
24LT051270512011012701T1Landsat 4-5 TM C1-L2, Tier130 m7 Bands27-Jan-11
25LC081270512014020401T1Landsat 8 OLI/TIRS C1-L2, Tier130 m11 Bands04-Feb-14
26LC081270512015012201T1Landsat 8 OLI/TIRS C1-L2, Tier130 m11 Bands22-Jan-15
27LC081270512016041401T1Landsat 8 OLI/TIRS C1-L2, Tier130 m11 Bands14-Apr-16
28LC081270512017022801T1Landsat 8 OLI/TIRS C1-L2, Tier130 m11 Bands28-Feb-17
29LC081270512018021801T1Landsat 8 OLI/TIRS C1-L2, Tier130 m11 Bands15-Feb-18
Table 2. Amount of changes in LULC during 1988–2018.
Year19882018Change 1988–2018
LULC TypesArea (km2)Percentage (%)Area (km2)Percentage (%)Area (km2)Percentage (%)
Forest331.8781.08%182.0244.47%−149.85−36.61%
Non-Forest77.4618.92%227.3055.53%149.8436.61%
Water0.000.00%0.010.00%0.010.00%
Table 3. Drivers of deforestation for the last three decades at the upper of Siem Reap watershed.
DriversFirst Decade (1988–1998)Second Decade (1998–2008)Third Decade (2008–2018)
Illegal loggingLow causeMedium causeLow cause
Shifting cultivationMedium causeMedium causeHigh cause
Small scale agriculture expansionLow causeLow causeLow cause
Firewood and charcoal productionLow causeHigh causeLow cause
Limited access to road infrastructurePrevent deforestation
Landmine hazardPrevent deforestation
Landmine clearance High cause
Improved access to road infrastructure High causeHigh cause
Large scale agriculture expansion Low causeHigh cause
Table 4. Results from LULC classification over the last three decades.
YearForest Non-ForestWaterTotalOverall AccuracyKappa Coefficient
1988331.8777.460.01409.330.930.85
1989333.5475.790.00409.330.900.77
1990358.8950.440.00409.330.940.85
1991359.2150.120.00409.330.900.77
1992340.8468.490.00409.330.930.83
1993355.0954.190.05409.330.970.92
1994360.3149.020.00409.330.870.71
1995340.3768.960.00409.330.900.74
1996350.6158.730.00409.330.890.74
1997350.3459.000.00409.330.900.78
1998355.2754.060.00409.330.930.79
1999312.7596.580.00409.330.910.81
2000324.6684.630.04409.330.930.85
2001297.00112.330.00409.330.870.73
2002259.40149.930.00409.330.880.78
2003275.24134.090.00409.330.930.87
2004229.15180.180.00409.330.920.86
2005251.84157.430.07409.330.880.77
2006239.86169.480.00409.330.880.80
2007205.16204.170.00409.330.970.95
2008260.38148.960.00409.330.860.74
2009222.59186.720.03409.330.920.84
2010234.16175.140.03409.330.920.84
2011194.77214.340.23409.330.910.82
2014183.12225.900.31409.330.920.90
2015206.63203.130.21409.970.950.90
2016216.93192.370.03409.330.930.88
2017195.68213.500.16409.330.960.93
2018182.02227.300.01409.330.950.90
Table 5. Sensitivity analysis of drivers of LULC change.
NDrivers of LULC ChangeAccuracy (%)Influence Order
1Elevation46.79 1
2Slope25.00 6
3Aspect26.12 5
4Distance from main road42.77 2
5Distance from minor road24.97 7
6Distance from river28.96 4
7Distance from villages32.60 3
Table 6. Markov transition probability matrix of simulated LULC map 2018.
LULC TypesNon-ForestForest
Non-Forest0.81510.1849
Forest0.29520.7048
Table 7. Markov transition probability matrix of simulated LULC map 2058.
LULC TypesNon-ForestForest
Non-Forest0.80110.1989
Forest0.71450.2855
Table 8. Markov transition probability matrix of simulated LULC map 2098.
LULC TypesNon-ForestForest
Non-Forest0.78390.2161
Forest0.77640.2236

