Article

Assessment of Surface Water Resources of Eastern Iraq

by
Khayyun A. Rahi
1,
Abdul-Sahib T. Al-Madhhachi
2,* and
Safaa N. Al-Hussaini
1
1
Department of Environmental Engineering, College of Engineering, Mustansiriyah University, Bab Al Muadham, Baghdad 10047, Iraq
2
Department of Water Resources Engineering, College of Engineering, Mustansiriyah University, Bab Al Muadham, Baghdad 10047, Iraq
*
Author to whom correspondence should be addressed.
Hydrology 2019, 6(3), 57; https://doi.org/10.3390/hydrology6030057
Submission received: 16 May 2019 / Revised: 23 June 2019 / Accepted: 24 June 2019 / Published: 26 June 2019

Abstract

:
Large amounts of runoff is generated in western Iran and flows into eastern Iraq due to relatively intensive rainstorms along the international border line. Currently, most of this runoff is being wasted by evaporation instead of being stored and preserved for later uses. This paper is an attempt to (1) assess and harness the water resources of eastern Iraq, and (2) propose a storage scheme to use the harvested water in the water shortage times. The runoff of eight catchment areas (Mandali, Qazania, Tursaq, Mirzabad, Galal Badra, al-Chabbab, al-Teeb, and Dwaireeg) is estimated using regression equations derived for areas in the western and southern parts of the United States of America. Several models were selected from two states based on catchment area location, average terrain elevation, average annual precipitation, and slope of main stream. Observed runoffs of Tursaq, Galal Badra, and al-Chabbab streams are analyzed using normal probability plots. Statistical analysis shows that there is no a statistically significant difference between observed and predicted runoffs for different return periods. The study proposes a water reservoir to be constructed within al-Shiwiaja Marsh to accommodate runoff generated within Mandali, Qazania, Tursaq, Mirzabad, and Galal Badra streams. The capacity of the proposed reservoir is 3000 Mm3 and the expected inflow from these streams is projected to exceed the capacity of the reservoir. The proposed reservoir will contribute to the flow of the River Tigris during the non-rainy seasons. More studies are needed to propose and design a storage scheme for two remaining streams (al-Teeb and Dwaireeg).

1. Introduction

Life could not exist on Earth without water. Water resources seem abundant, but less than one percent of it readily is available for human use. Worldwide water resources are stressed due to ever-increasing demands that are associated with the exponential world population growth. Water for food protection, drinking, and fisheries and environmental protection has been stressed due to world population and economic growth [1]. In arid and semi-arid countries, water shortage problems are more challenging. Water shortage problems are even more challenging in Iraq. Iraq is facing growing water problems due to decrease in recharges of the Euphrates and Tigris and increase in salinity. Rahi and Halihan [2], Rahi and Halihan [3], and Rahi [4] have studied the salinity problems in the Euphrates, the Tigris, and the Shatt al-Arab rivers, respectively. In the three papers, the authors have reached a similar conclusion that Iraq is facing a water shortage crisis and stresses the need to explore all possible water resources to augment the water supplies of the country. Hence, the search for means to overcome water shortages becomes an urgent task.
Rainwater harvesting involves a great potential as an innovational and non-conventional water resources. Water harvesting is defined as collection of runoff for its productive use [5]. It can be grouped into two main categories; rainwater harvesting techniques, which harvest runoff from roofs or ground surfaces (sheet flow harvesting); and the other category is flood water harvesting systems, which harvest water from water courses (valleys). Water harvesting systems are mainly implemented in arid and semi-arid zones with annual rainfall ranging from 100–400 mm where rain-fed agriculture could not be sustained. Groundwater potential assessment along with watershed management and environmental assessment can be performed with respect to the geographic characteristics of a drainage basin [6]. Various parameters of the stream and its drainage such as water quality index, pollution index, and metal index can be used to estimate the watershed behavior throughout heavy rainfalls [7,8].
Iraq is located within the northern temperate zone with high semi-stable air pressure and a semi-continental climate affected by the Mediterranean climate [9,10]. The climate of Iraq is characterized by a long hot summer and a short cold winter. Winter is characterized by the movement of south-east warm rainfall producing fronts. In summer, Iraq is affected by hot winds, especially on the southern and central parts causing high temperatures. January is the coldest month with a mean daily temperature ranges from 3 °C to 12 °C, while July is the warmest month with a mean daily temperature of 38 °C. Temperature in the summer can reach as high as 50 °C [9].
Several local studies had been performed to analyze the morphometric properties of some parts of the Iraqi lands [6,8,11,12,13,14,15,16,17]. Zakaria et al. [11] studied the possibility of using macro rain water-harvesting techniques in irrigation in northern Sinjar District, northwest of Iraq. Their results showed the harvesting of significant amounts of runoff ranging between 0.6 million cubic meters (Mm3) and 42.4 Mm3 annually. The harvested runoff can be used as supplementary crops irrigation. Hassan et al. [12] studied the morphometric properties of Bulkana area, northeast of Iraq. The authors found that the basin of Bulkana has an approximately circular-shaped basin with low drainage density. Malik et al. [6] used remote sensing and the geographic information system (GIS) techniques in analyzing the morphometric properties of al-Chabab river basin in eastern part of Iraq. The authors concluded that there is no real danger of flood at the studied river basin due to rectangular shape of morphometric. Awchi and Kalyana [15] studied the features of drought and its impact on northern of Iraq using GIS techniques. They indicated that the most severe drought periods within the study area were during 1997 to 2001 and 2006 to 2010, with the highest level of drought associated with the northeastern parts of the area. Al-Sudani [8] used Thornthwaite equations to estimate potential and actual evapotranspiration, water balance, and morphometric properties for Khanaqin Basin, eastern of Iraq. They found that water surplus in the basin was 36 mm divided into natural recharge of groundwater and surface runoff in seasonal valleys and rivers. Ali [16] selected a possible site for water harvesting in Badra, eastern Iraq, using GIS techniques. Ali [16] classified the region into three zones based on the suitability for water harvesting: High suitability zone, moderate suitability zone, and low suitability zone. Ibrahim et. al. [17] selected a potential dam site for rainwater harvesting at Dohuk Governorate, northern Iraq, using spatial data to determine the suitability of selected area.
More than fifty water courses are flowing from Turkey or Iran into Iraq [18]. Most of their catchment areas are located within these countries. The outflow of these streams depends greatly on annual rainfall rates and watershed characteristics. Rainfall seasons in Iraq are winter and fall. Ninety percent of the rainfall comes between November to April. Few scattered showers may fall in the month of October. In terms of annual rainfall rate, Iraq may be divided into three zones [19]. The first zone is located in the north-east corner of Iraq. The annual rainfall of this zone exceeds 400 mm and agriculture is completely rainfall dependent [4,19]. The second zone, which is the area of interest in this research, is characterized by a rainfall rate of 200–400 mm. This zone extends from Al-Jezerah province, south to southwest of Mosul City, to the eastern border strip down to north of Amarah City. The third zone is of annual rain of less than 200 mm. This zone includes Baghdad and the rest of the country [10].
Although major valleys flowing from the east are important water suppliers for Iraq, they are unreliable, because no water-sharing agreement existed with Iran. Iran had dammed most of the valleys and cutoff most of the flow to Iraq especially in dry and average water years. Ali [18] has discussed the negative effects on Iraqi water resources resulted by the Iranian actions. On the other hand, in wet water years (for instance, in recent years of 2018–2019), a large volume of runoff flows into Iraq, inundating vast surface area [20]. Therefore, water is flowing into Iraq during extreme floods only when the flow exceeds the storage capacity of the Iranian reservoirs. The importance of these water resources imposes an urgent need to evaluate or quantify the flowing water of the major valleys in eastern Iraq, on Iraqi–Iranian border. This paper is prepared to present a water resources management scheme that includes (1) quantifying the water resources of eastern Iraq for eight catchment areas (Mandali, Qazania, Tursaq, Mirzabad, Galal Badra, al-Chabbab, al-Teeb, and Dwaireeg), and (2) proposing a storage system and a reservoir to use the harvested water during water deficit times. The proposed storage facility will contribute to the flow of the Tigris River during the dry seasons. One of the difficulties in this study is that all the studied watersheds fall within Iran. The geopolitics prevailed in the region make these watersheds not accessible for the needed examinations.

2. Materials and Methods

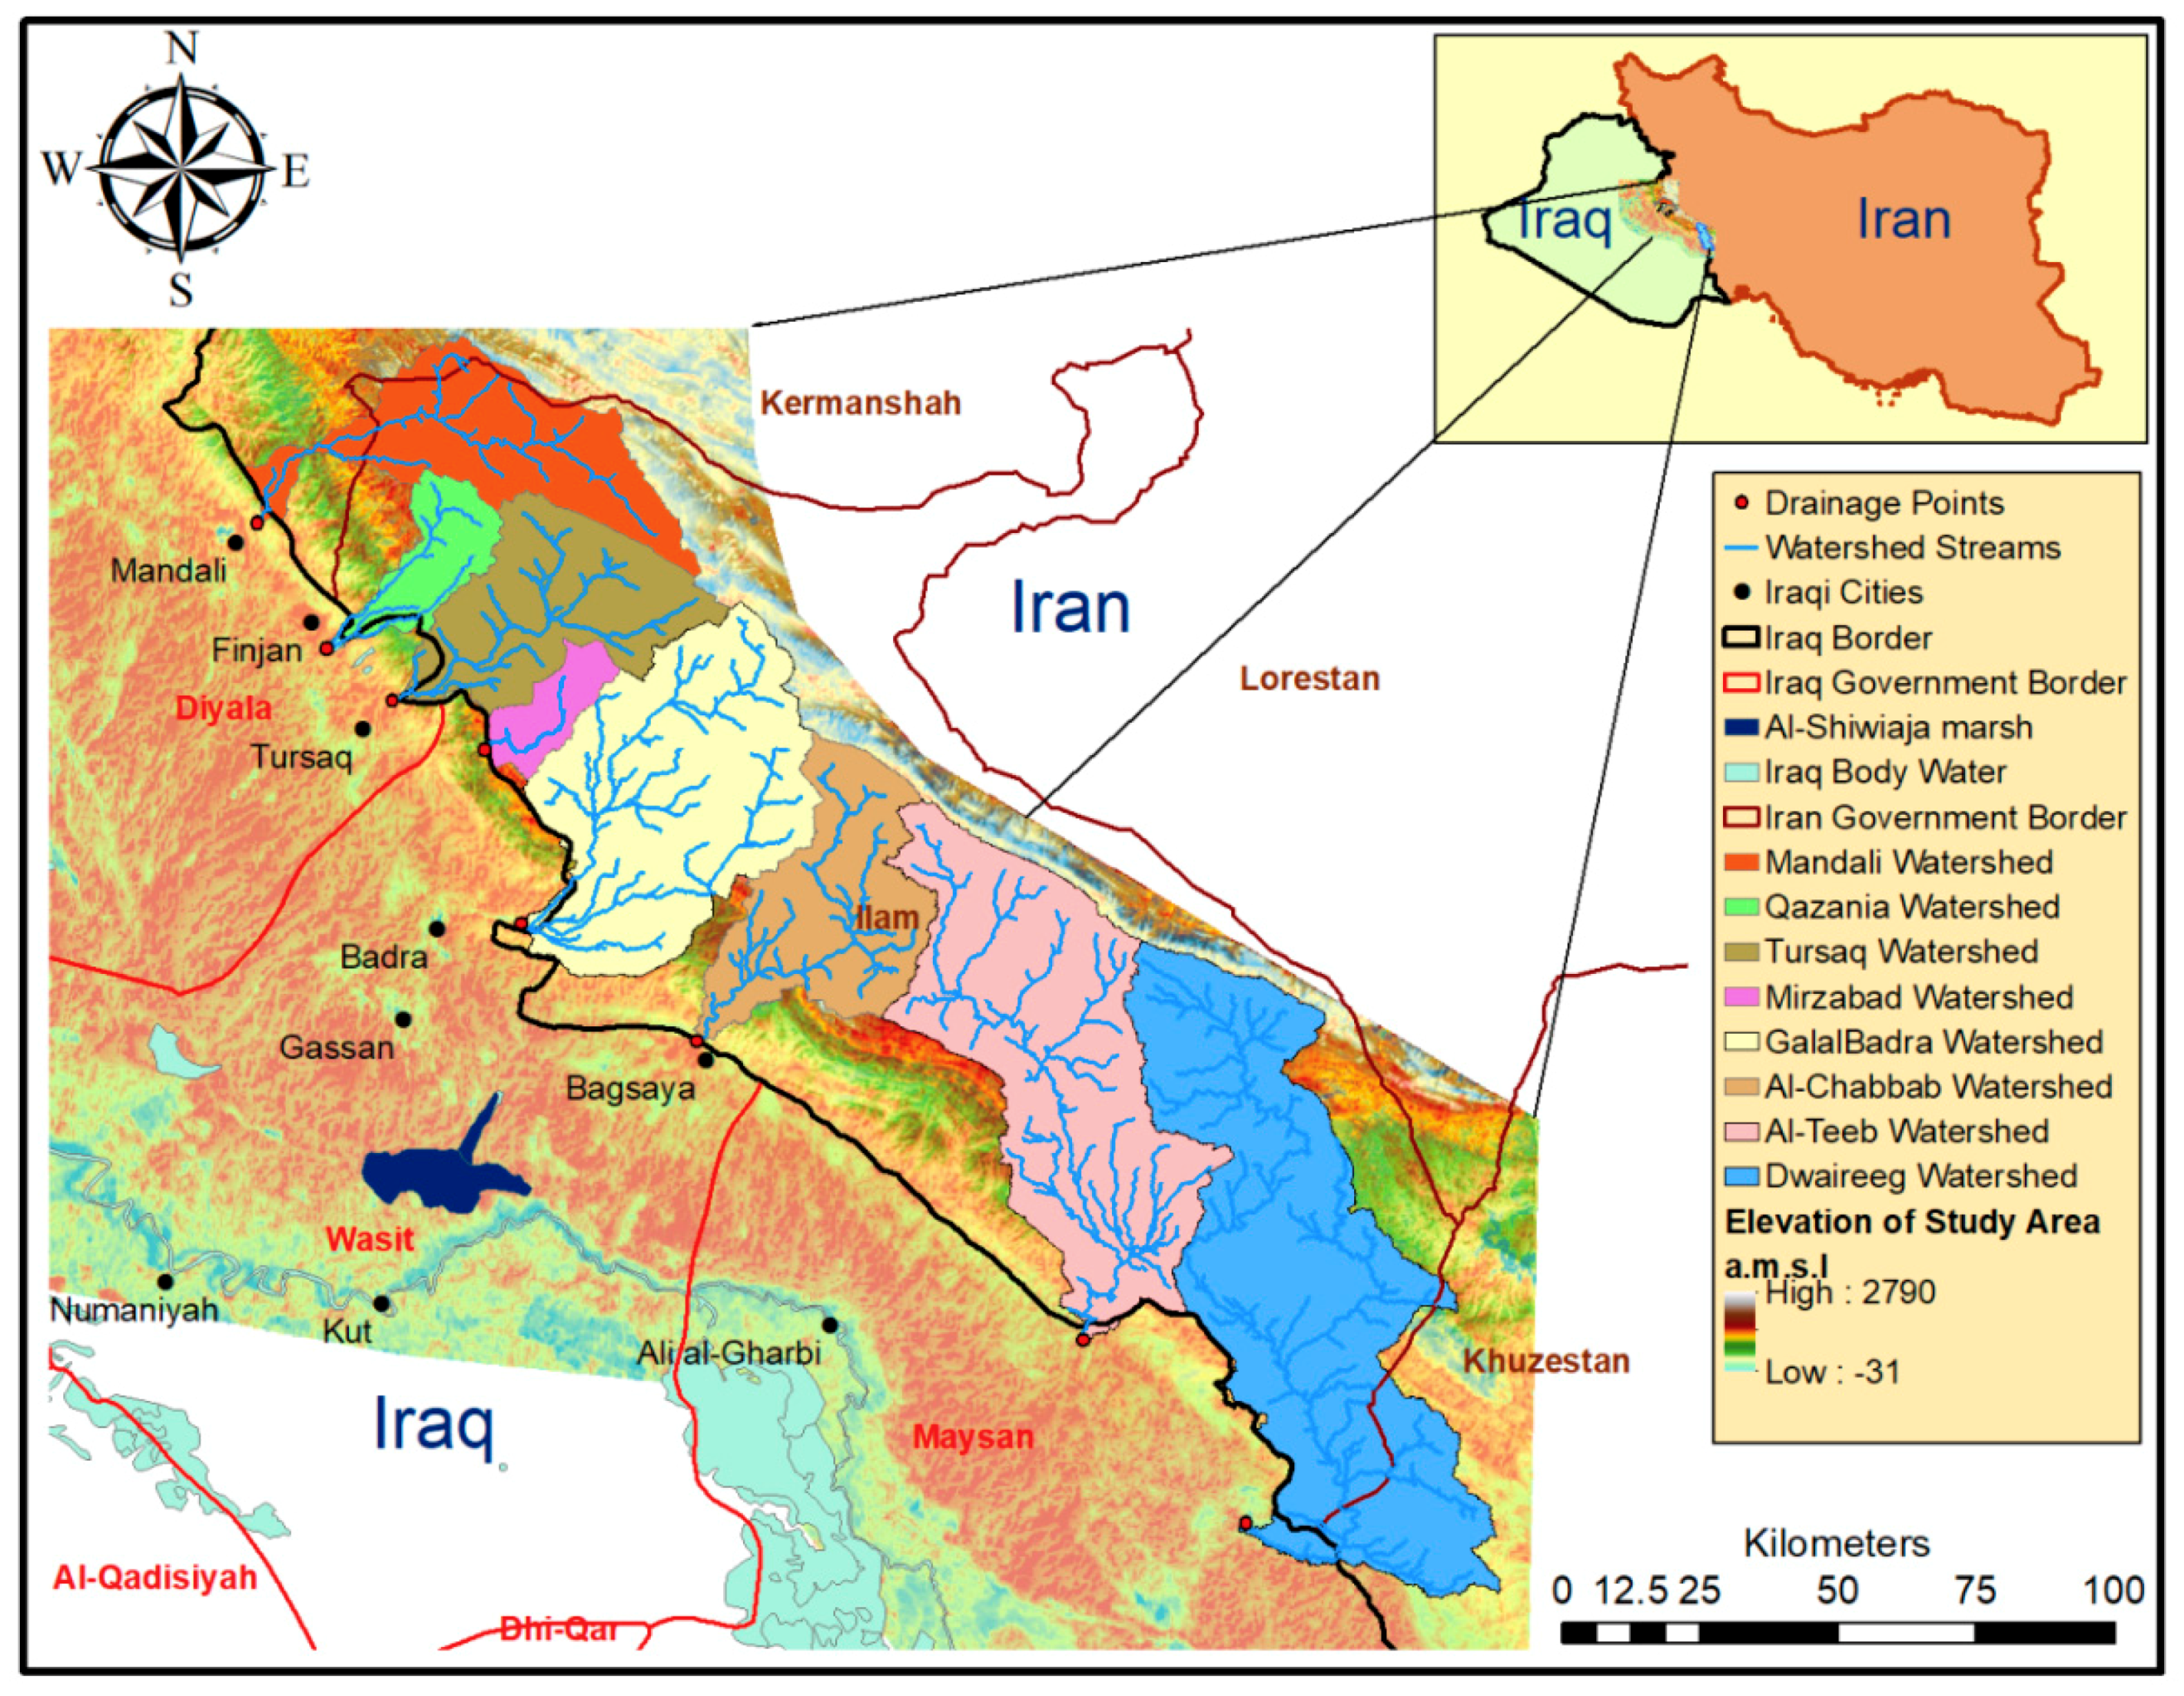
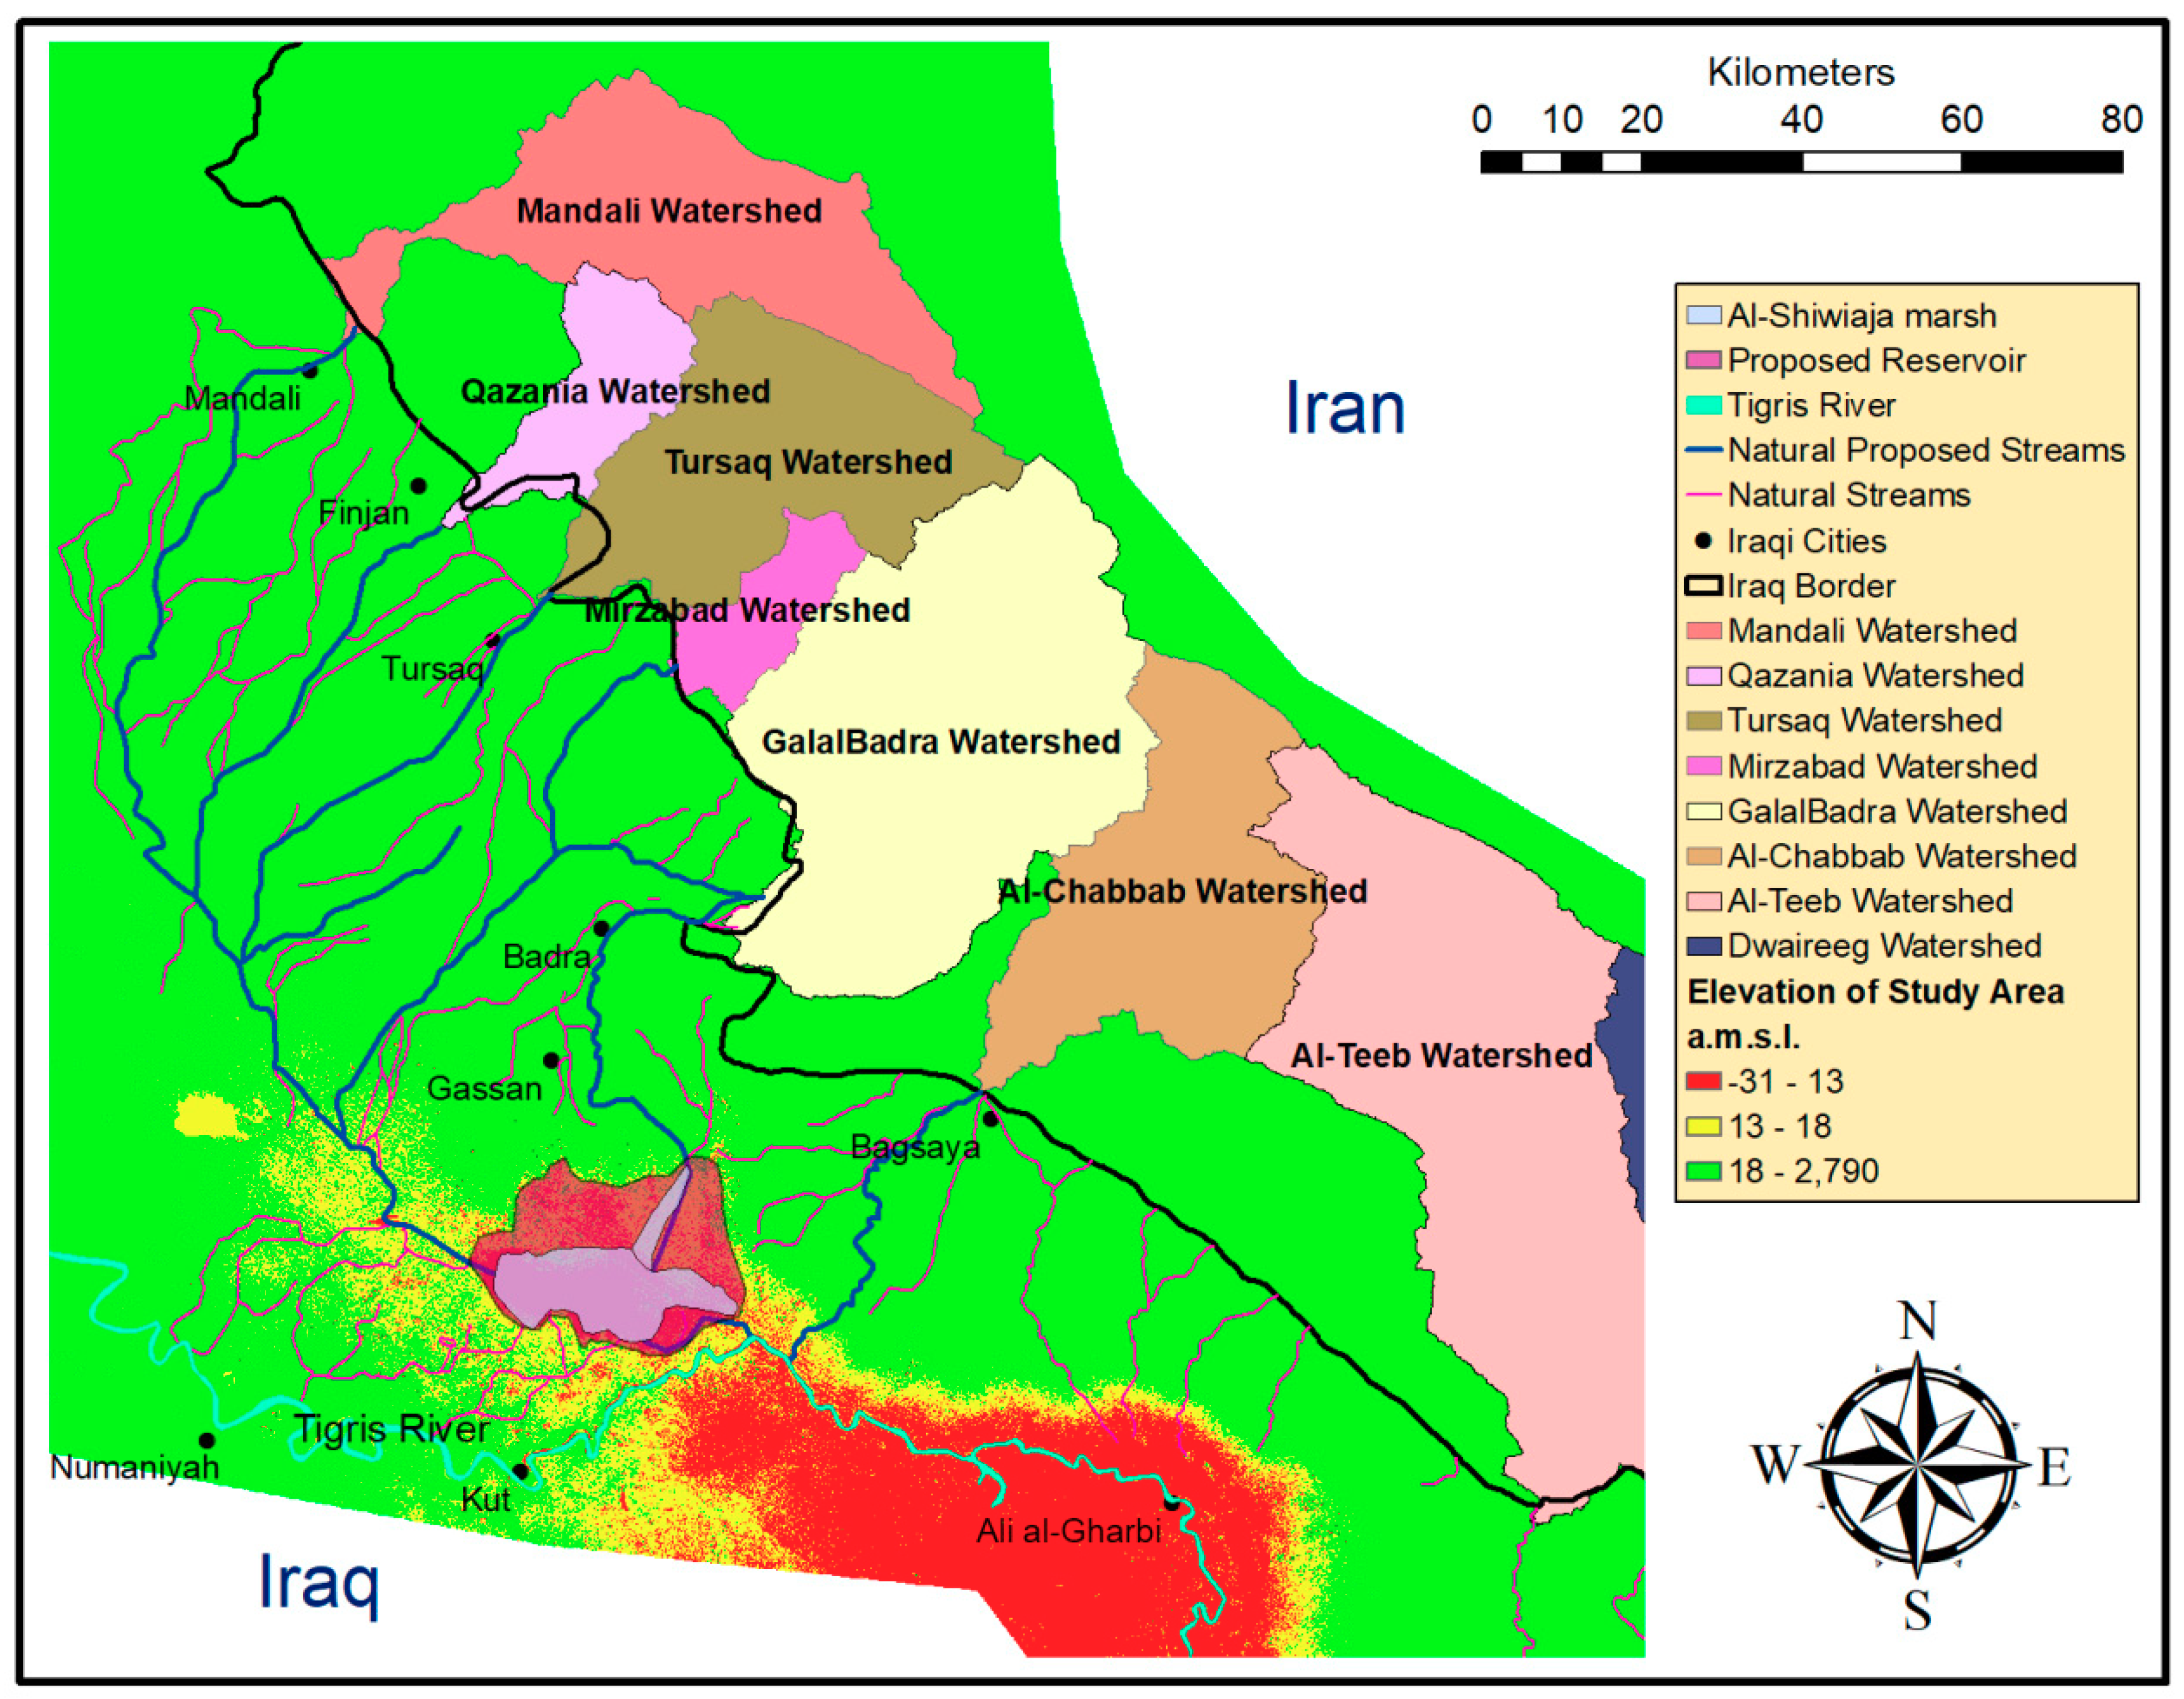
2.1. Study Area Description

The study area is characterized by several, relatively large, peripheral valleys along with numerous smaller ones. Most of these valleys originate within western Iran and flow toward eastern Iraq. The study area is located between (34°05′56″–31°59′28′′) N and (45°20′06′′–47°59′02′′) E. Hydrologically, the study area is integrated (into one main outlet) units containing catchment areas, valleys, and runoff zone. The catchment areas cover about 20,000 km2 located in both Iraq and Iran (Figure 1). The Iraqi part of the catchment is mainly flat land. Its elevation ranges from 400 m above mean sea level (a.m.s.l.) at the international border line to about 25 m (a.m.s.l.) at the southeast end of the region. The Iranian part consists of high lands with an elevation of more than 2500 m (a.m.s.l.). It includes a series of hills and mountain ranges with a basin divide runs along the peaks within Iran.
The major valleys starting from north are Mandali, Qazania, Tursaq, Mirzabad, Galal Badra, al-Chabbab, al-Teeb, and Dwaireeg (Figure 1). The first five valleys flood water drains into al-Shuwiaja Marsh. Galal Badra has the largest runoff with a peak runoff of more than 2000 m3/s for the 100-year flood. Al-Chabbab valley flows into the Tigris River downstream of Kut City; its runoff is considered outside al-Shuwiaja Marsh system. The 100-year flood of al-Chabbab valley may reach 800 m3/s (estimated).

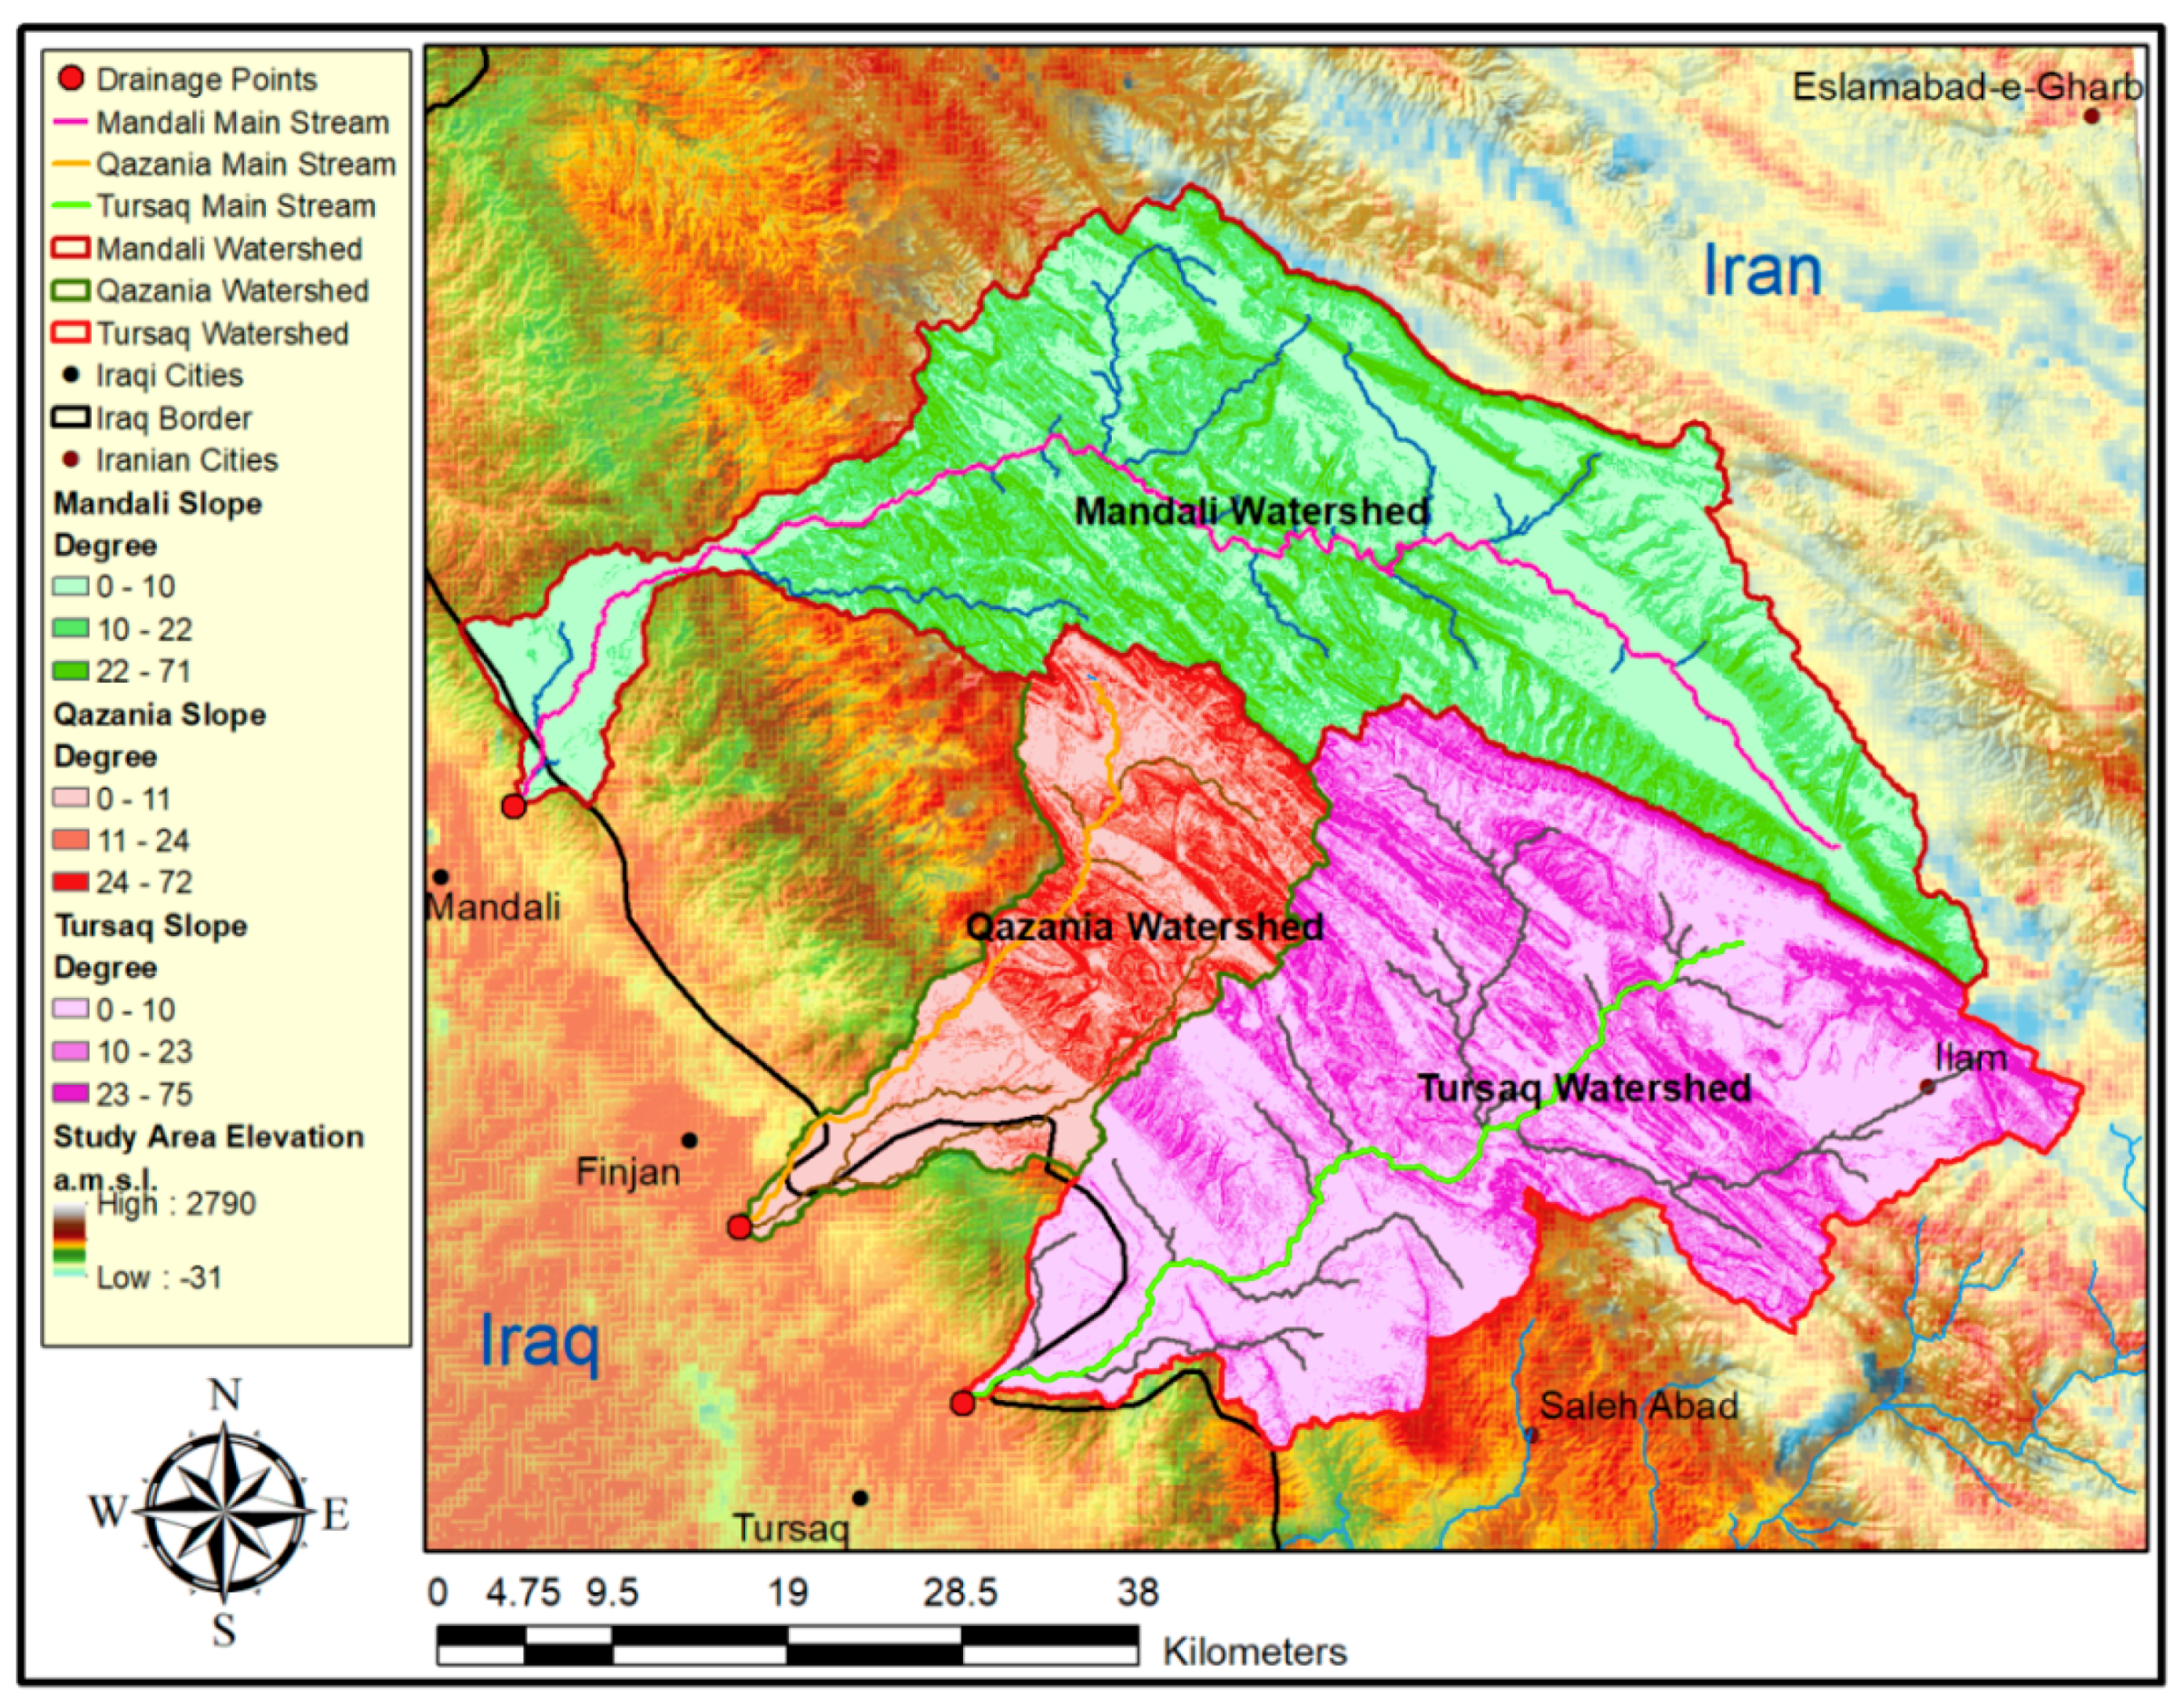
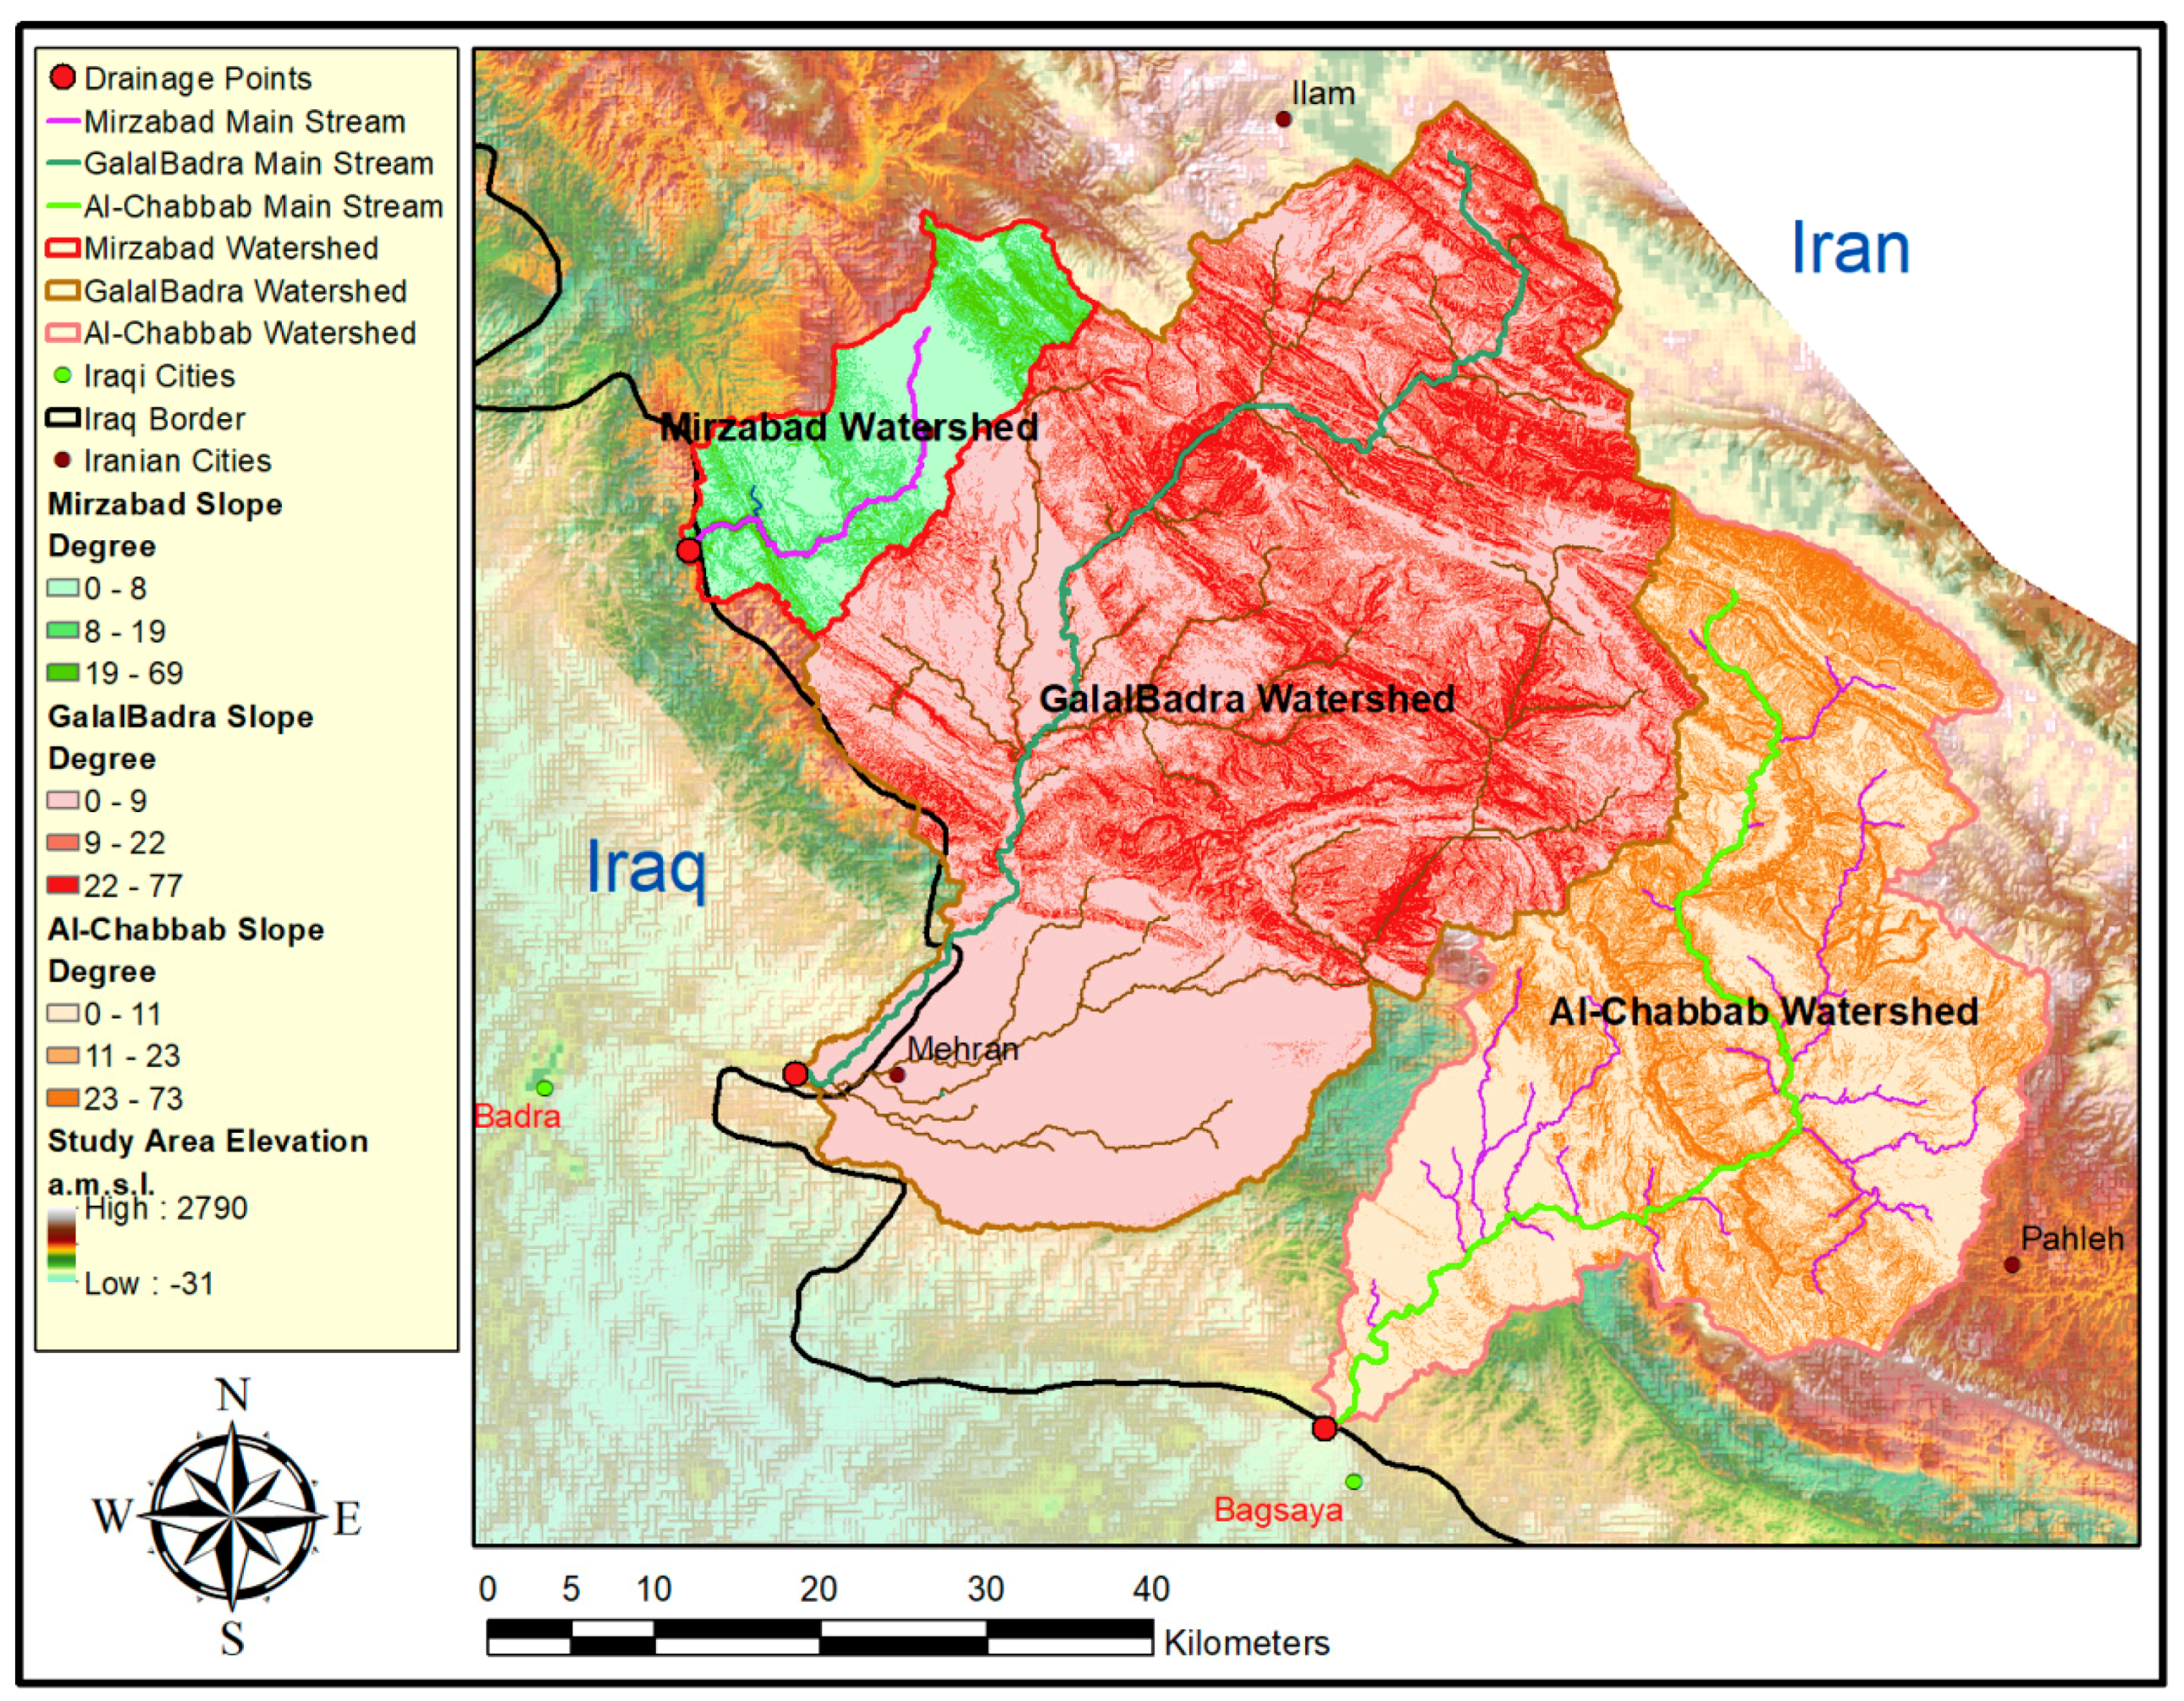
2.2. Watershed Characteristics

The GIS was applied to delineate the eight watersheds. The “Arc Hydro Tools” with “Terrain Preprocessing” were utilized to obtain the flow direction, flow accumulation, stream definition, and drainage point outlets of the watersheds. The watershed was delineated through “Arc Hydro Tools”. Terrain slope area for each watershed was obtained using surface function via “Spatial Analyst Tools”. The slope of main stream for each watershed was calculated based on the differences in terrain elevation and the length of main stream. The hydrological characteristics of eight watersheds are described in Table 1.
Mandali watershed has a catchment area of 1246.10 km2, with 7.87 km2 located within Iraq. The drainage outlet is located at 5.45 km northeast of the City of Mandali. Its coordinates are 33°46′52′′N and 45°35′38′′ E (Table 1 and Figure 2). Mandali watershed is in Diyala Government in eastern Iraq. The elevation data from the digital elevation model (DEM) of the Mandali watershed show that elevation ranges from 163 m to 2626 m (a.m.s.l.) with an average of 1101 m (a.m.s.l.). The terrain slope ranges from 7.80 to 71.00 degrees with an average of 12.56 degrees. The total length of the main stream in Mandali watershed was 107 km with an elevation of 163 m to 1313 m (a.m.s.l.). The slope of the main stream (S) in Mandali watershed ranged from 0.009 to 0.013 with an average of 0.011 (Table 1 and Figure 2).
Qazania watershed has a catchment area of 419.75 km2 of which 33.70 km2 is located within Iraq territory. The drainage outlet located at 5.4 km southeast of Finjan Town with coordinates of 45°43′34′′ E and 33°34′26′′ N (Table 1 and Figure 2). Qazania watershed is in Diyala Governorate. The DEM of Qazania watershed ranges from 95 m to 1689 m (a.m.s.l) with an average of 747 m (a.m.s.l.). The terrain slope of Qazania watershed ranges from 8.44 to 72.00 degrees with an average of 13.77 degrees. The total length of the main stream in the watershed is 43 km with elevation of 97 m to 950 m (a.m.s.l.). The slope of the main stream (S) is between 0.014 and 0.042 with an average of 0.027 (Table 1 and Figure 2).
The area of the Tursaq watershed is 1218.90 km2 of which 36.88 km2 is in Iraq. The drainage outlet located at 7.57 km northeast of Tursaq Town with coordinates of 45°51′18′′ E and 33°29′13′′N (Table 1 and Figure 2). Tursaq watershed is distributes between Diyala Governorate of Iraq and Ilam Governorate of Iran. The DEM of the watershed ranges from 159 m to 2565 m (a.m.s.l.) with an average of 980 m (a.m.s.l.). The watershed slope is 7.74 to 75.00 degrees with an average of 12.50 degrees. The total length of the main stream in the watershed is 67 km with an elevation of 159 m to 1021 m (a.m.s.l.). The S value is between 0.008 to 0.018 with an average of 0.012 (Table 1 and Figure 2).
The area of the Mirzabad watershed is 274.28 km2. It is mostly located in the Iranian side of the international border. The runoff point of the watershed is about 33.55 km northeast of Badra city with coordinates of 46°01′59′′ E and 33°24′25′′ N (Table 1 and Figure 3). Mirzabad area is part of Wasit Governorate of Iraq. The DEM of the watershed ranges from 275 m to 1862 m (a.m.s.l.) with an average of 723 m (a.m.s.l.). The terrain slope of Mirzabad watershed is between 5.35 degrees and 69.00 degrees with an average of 9.24 degrees. The total length of main stream in the watershed is 30.44 km with a terrain elevation of 277 m to 703 m (a.m.s.l.). The S of the main stream ranges from 0.012 to 0.015 with an average of 0.014 (Table 1 and Figure 3).
Galal Badra is the most important stream in the study area [21]. The total area of its watershed is 2306.09 km2. A small fraction of the watershed area (24.39 km2) is located in Iraq; the rest is within the Iranian territory. The drainage outlet is 15 km to the east of Badra City with coordinates of 46°05′56′′ E and 33°07′19′′ N (Table 1 and Figure 3). Galal Badra area is within Wasit Governorate of Iraq. The DEM of the watershed ranges from 115 m to 2724 m (a.m.s.l.) with an average of 929 m (a.m.s.l.). The terrain slope ranges from 6.80 to 77.00 degrees with an average of 11.70 degrees. The total length of the main stream is 95.32 km with an elevation of 118 m to 1837 m (a.m.s.l.). The slope (S) of the main stream is between 0.006 and 0.024 with an average of 0.018 (Table 1 and Figure 3).
Al-Chabbab watershed area is 1275.02 km2, nearly all of its falls in Iran territory. The drainage outlet is located at 3.75 km northwest of Bagsaya Town with coordinates of 46°26′10′′ E and 32°55′34′′ N (Table 1 and Figure 3). Al-Chabbab area is within Wasit Governorate of Iraq. The DEM of the watershed ranges from 110 m to 2790 m (a.m.s.l.), with an average of 960 m (a.m.s.l.). The terrain slope ranges from 8.66 to 73.00 degrees with an average of 13.38 degrees. The total length of the main stream is 88.52 km with an elevation of 112 m to 1330 m (a.m.s.l.). The slope (S) of the main stream is between 0.006 and 0.019 with an average of 0.013 (Table 1 and Figure 3).
The total area of al-Teeb watershed is 2738.28 km2, mostly located within Iran territory. The drainage outlet located at 45.67 km east of Ali al-Gharbi City with coordinates of 47°10′19′′ E and 32°25′48′′ N (Table 1 and Figure 4). Al-Teeb area is part of Maysan Governorate of Iraq. The DEM of the watershed ranges from 53 m to 2494 m (a.m.s.l.), with an average of 801 m (a.m.s.l.). The terrain slope of the watershed ranges from 6.22 to 72.00 degrees with an average of 11.25 degrees. The total length of the main stream is 142.52 km with an elevation between 54 m and 1366 m (a.m.s.l.). The slope (S) of the main stream ranges from 0.003 to 0.016 with an average of 0.009 (Table 1 and Figure 4).
The Dwaireeg watershed has a catchment area of 3666.90 km2, most of which falls within the Iranian territory. The drainage outlet is located at 45.11 km to northeast of the City of Amara with coordinates of 47°28′44′′ E and 32°7′34′′ N (Table 1 and Figure 4). Dwaireeg area is located in Maysan Governorate of Iraq. The DEM of the watershed ranges from 14 m to 2195 m (a.m.s.l.) with an average of 420 m (a.m.s.l.). The terrain slope (S) of ranges from 2.45 to 72.00 degrees with an average of 6.36 degrees. The total length of the main stream is 206.60 km with an elevation of 18 m to 1185 m (a.m.s.l.). The slope (S) of the main stream ranges from 0.001 to 0.013 with an average of 0.005 (Table 1 and Figure 4).
The values of catchment area (A), average DEM (E), and slope of the main stream (S) in Table 1 of eight watersheds are used to predict the flow rate (runoffs) of these watersheds using regression equations adopted by the United States Geological Survey (USGS) for ungagged sites, as discussed in the next section. The flow rates of eight catchment areas are estimated using regression equations from similar areas in the western and southern parts of the United States of America (USA). The regression equations to predict runoffs for the ungagged stations are applied because they need fewer parameters and due to geopolitics prevailed in the region that make the studied watersheds not accessible for detailed examinations. The estimated flow rates are compared with observed runoffs of Tursaq, Galal Badra, and al-Chabbab watersheds according to data availability.

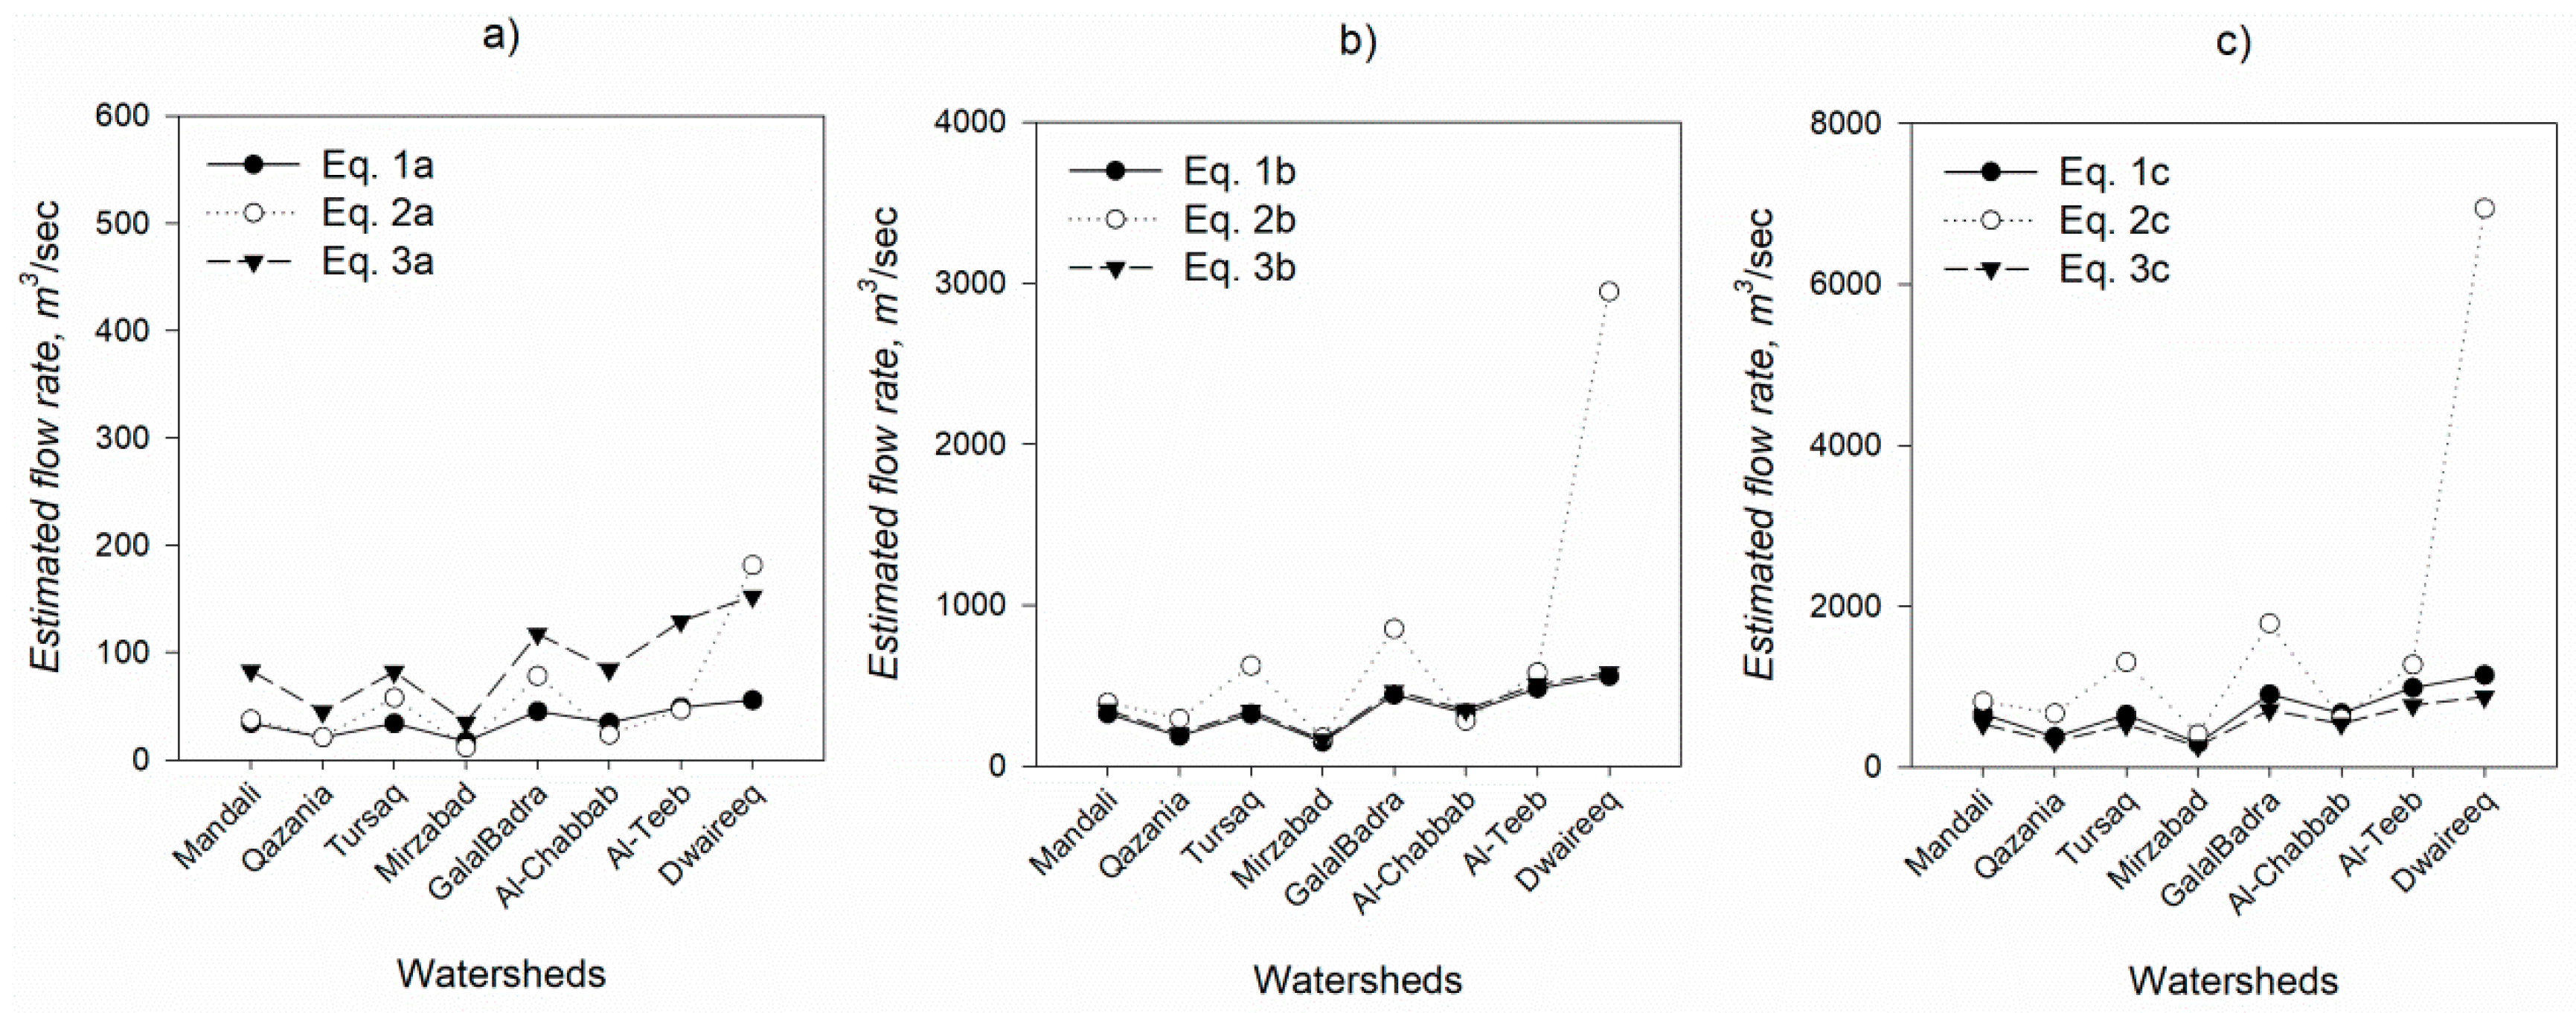
2.3. Precipitation and Runoff Calculations

Winter and fall are the rainy seasons in Iraq and Iran. Ninety percent of the rainfall comes between November to April with few scattered showers fall in October. The average annual rainfall was acquired from Iraq meteorological organization and seismology [9] and World Weather Online [22]. Average annual rainfall of Galal Badra was obtained from Al-Shamaa and Ali’s [21] study. Table 2 shows the average annual rainfall for some metrological stations within the eight watersheds in eastern Iraq, on the Iraqi–Iranian border, from October of 1995 to March of 2019. Data of average annual rainfall for the years 1995 to 2009 are missing in some of these watersheds. The average annual precipitation (P) in the last row of Table 2 is used to estimate the flow rate of the eight watersheds. As anticipated by Al-Madhhachi et al.’s [20] study, large amounts of rainfall in 2018–2019 seasons fell in Iraqi–Iranian borders on these watersheds due to global warming phenomena.
The runoffs for each of the studied streams (locally called valleys) were calculated using regression equations adopted by the USGS [23]. These equations were developed to estimate magnitude and frequency of floods for given areas in the USA. The USGS has developed regression equations to estimate the flow rate and frequency of floods in ungagged stations for every state in the USA. States were divided into specific hydrological areas, and for each area a set of equations were produced. After thorough examination of these equations, six sets of these regression equations (from Arizona and Texas) are applied to the study area streams based on hydrological and meteorological similarities between these streams and the ones in the USA, where the equations were developed. Three set of equations were selected from each state based on catchment area (A), average DEM (E), average annual precipitation (P), and slope of the main stream (S). The regression equations developed for these hydrologic regions are designed to estimate peak runoffs for return periods of 2, 25, and 100 years. The selected equations from Arizona regions are listed below [23]:
Q 2 = 87.0 A 0.433   ( a ) Q 25 = 586.0 A 0.487   ( b ) Q 100 = 1100.0 A 0.499   ( c )
Q 2 = 5.66 A 0.673 E 0.605 P 1.03   ( a ) Q 25 = 186.0 A 0.626 E 1.14 P 0.944   ( b ) Q 100 = 553 A 0.610 E 1.30 P 0.915   ( c )
Q 2 = 96.6 A 0.555   ( a ) Q 25 = 685.0 A 0.471   ( b ) Q 100 = 1230.0 A 0.447   ( c )
The selected equations from Texas regions are listed below [23]:
Q 2 = 175.0 A 0.540   ( a ) Q 25 = 759.0 A 0.616   ( b ) Q 100 = 1175.0 A 0.638   ( c )
Q 2 = 89.9 A 0.629 S 0.13   ( a ) Q 25 = 144.0 A 0.747 S 0.386   ( b ) Q 100 = 157.0 A 0.788 S 0.469   ( c )
Q 2 = 49.8 A 0.602 ( P 4 ) 0.447   ( a ) Q 25 = 150.0 A 0.692 ( P 4 ) 0.608   ( b ) Q 100 = 216.0 A 0.725 ( P 4 ) 0.647   ( c )
where Q2, Q25, and Q100 are peak discharges for 2-, 25-, and 100-year return period, respectively, ft3/s; A is the catchment areas, mile2; E is the mean catchment elevation in thousands of feet; P is the mean annual precipitation, inches; and S is slope of main channel of watershed, feet/mile. The values of A, E, and S were obtained from Table 1 while the values of P were obtained from Table 2. All calculated discharges were converted to m3/s.

2.4. Data Analysis

The Ministry of Water Resources in Iraq provided observed flow rates of three streams in this study. They are Tursaq, Galal Badra, and al-Chabbab. No sufficient observed data were provided for the other streams and watersheds. The observed flow data are for the period of March 2001 to December 2018. The maximum flow rate of 2050 m3/s was recorded in the Galal Badra stream in November of 2018. There are several probability distributions to describe the observed data for annual peak flow estimations such as long-normal, Pearson Type III, Gumbel’s extreme values, normal probability plots, and others. The normal probability distribution was selected because it gave reasonable fit to the observed flow data. The statistical analyses implemented in this paper are similar to the analyses used by the USGS to examine streamflow for several gagging stations on the Euphrates and Tigris rivers [24]. Due to limited spatial and temporal availability of observed flow rate data for the streams of the study area, the streamflow formulas were not derived for Tursaq, GalaBadra, and al-Chabbab streams.
The computed statistical differences in regression equations adopted by USGS for Arizona and Texas regions are also investigated using the analysis of variance (ANOVA) technique within SigmaPlot 12.5 Software (Systat Software Inc., San Jose, CA, USA). The Software includes several statistical analyses to treat the groups of data such as; descriptive statistics, one-way ANOVA, two-way ANOVA, three-way ANOVA, and others. A one-way ANOVA is recommended by SigmaPlot 12.5 Software to describe and compare the data with basic statistics for data with more than two groups. Therefore, a one-way ANOVA reported the mean and median in this study for Equations (1a) through (6c). The pairwise comparison of t-tests in SigmaPlot 12.5 Software has several tests such as; Tukey test, student–Newman–Keuls, Dunnett test, Bonferroni test, and others. The software recommended both Tukey test method and student–Newman–Keuls method to test all pairwise comparisons of the mean responses to different treatment groups. Thus, in this study, pairwise comparisons of t-tests are calculated for both observed and predicted flow rates using the Tukey test method and student–Newman–Keuls method, which revealed a significant difference compared to ANOVA with a significance level of α = 0.05 [25].
Water harvesting is the collection of runoff for productive purposes. Instead of runoff being left to cause erosion, the water could be harvested and utilized. Of course, in a year of severe drought there may be no runoff to collect, but an efficient water harvesting system will improve plant growth in the majority of years [5]. Water harvesting may be divided into two broad categories; roof-top rainwater harvesting and sheet flow (or flood) water harvesting. In this study, the suitable water harvesting technique is the flood harvesting technique. The study area is known for its sheet flow and valley flow. The collected water from Mandali, Qazania, Tursaq, Mirzabad, and Galal Badra streams should be diverted to al-Shiwiaja Marsh for future use in populated areas, such as the towns of Badra, Mandli, and Jassan. It is suggested that the details and designs of the water harvesting scheme are performed for each site independent of other areas or projects. The cultural and population needs are important factors to be considered by the planners and designers.

3. Results

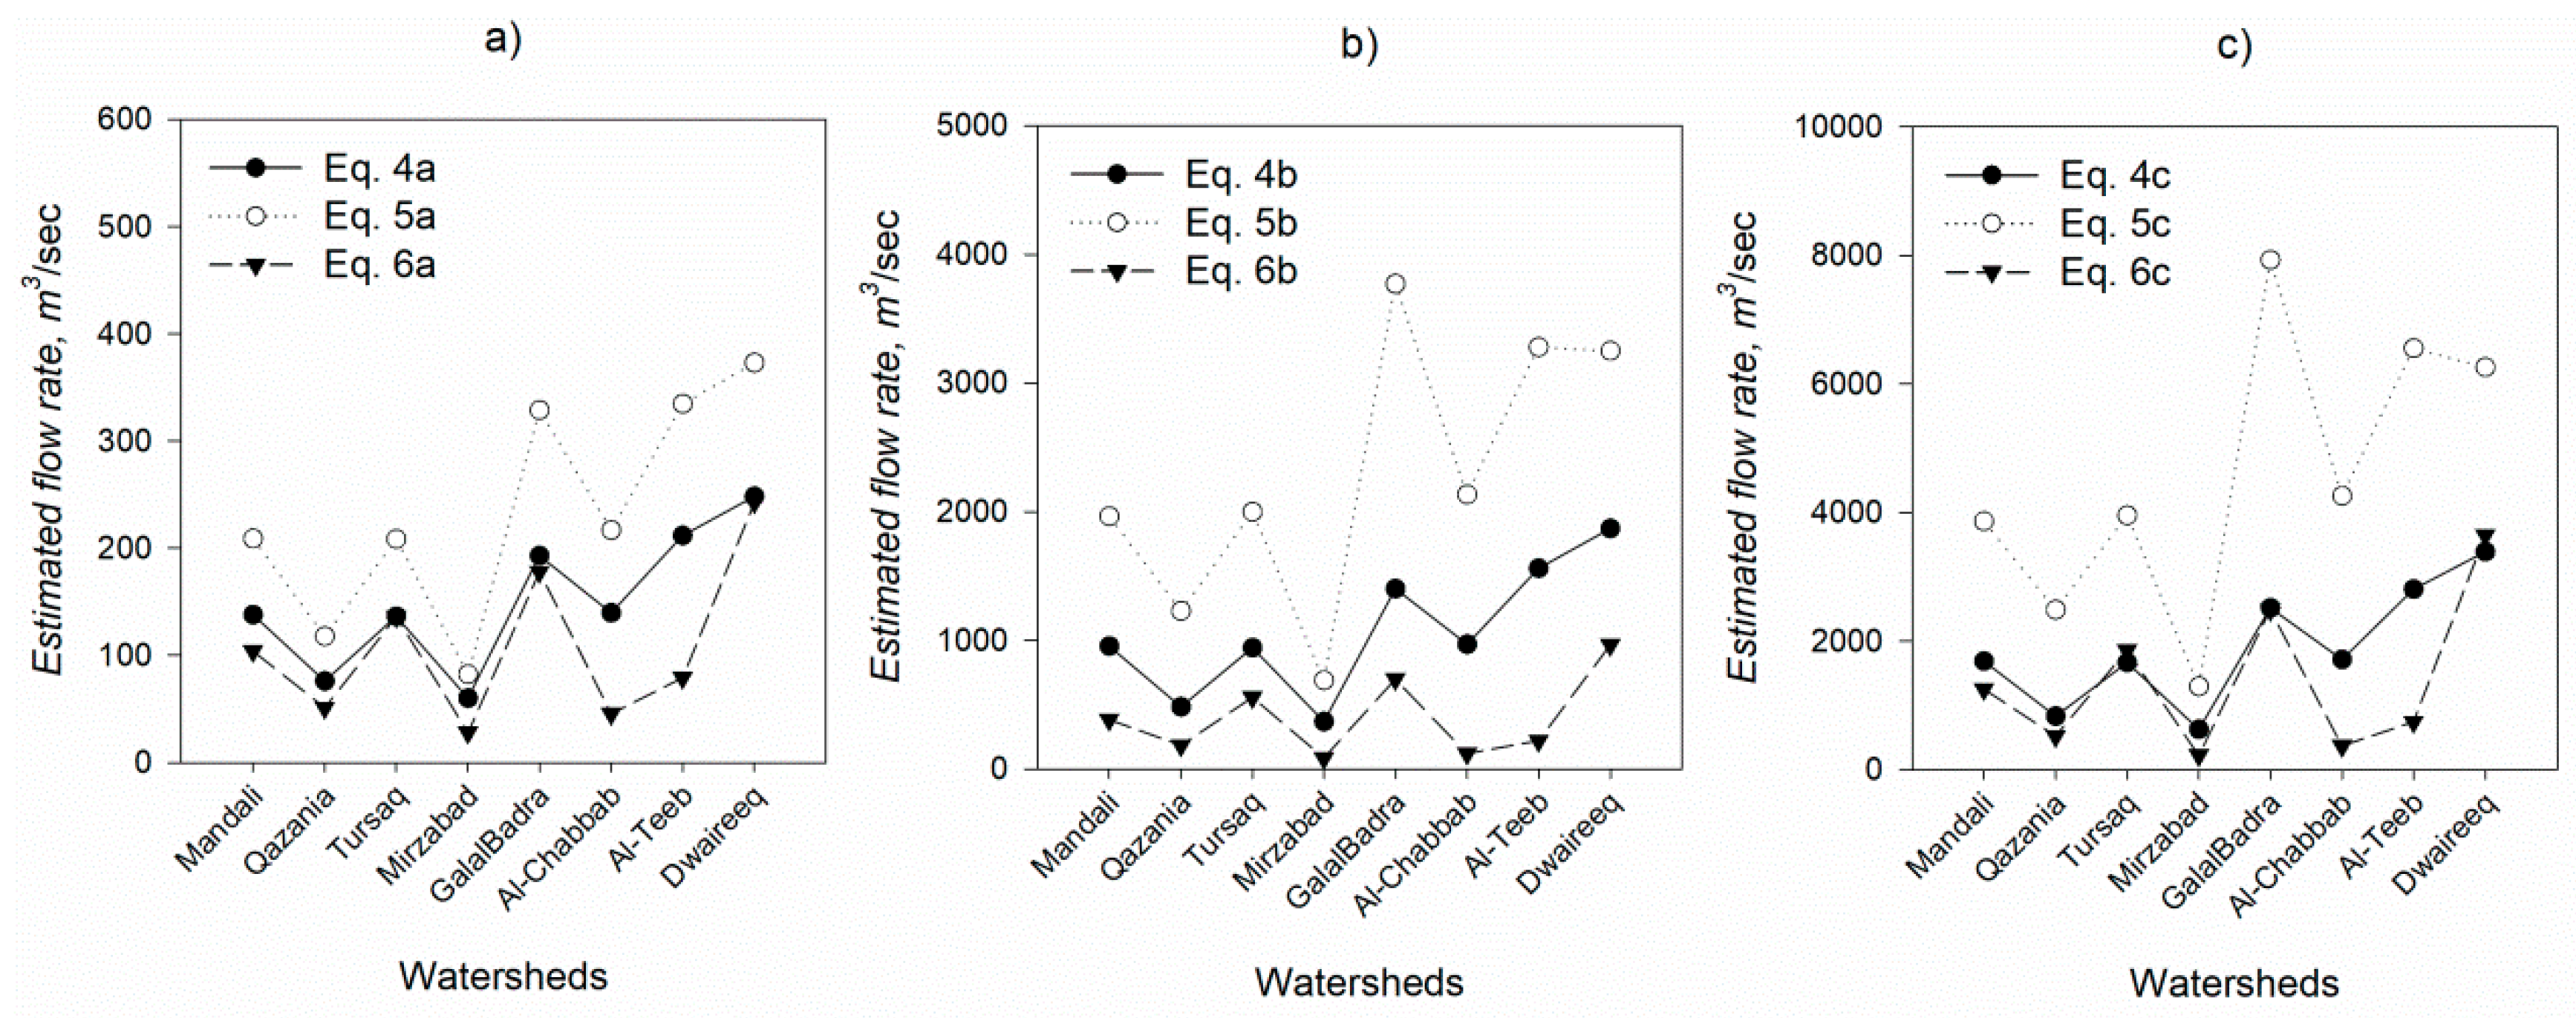
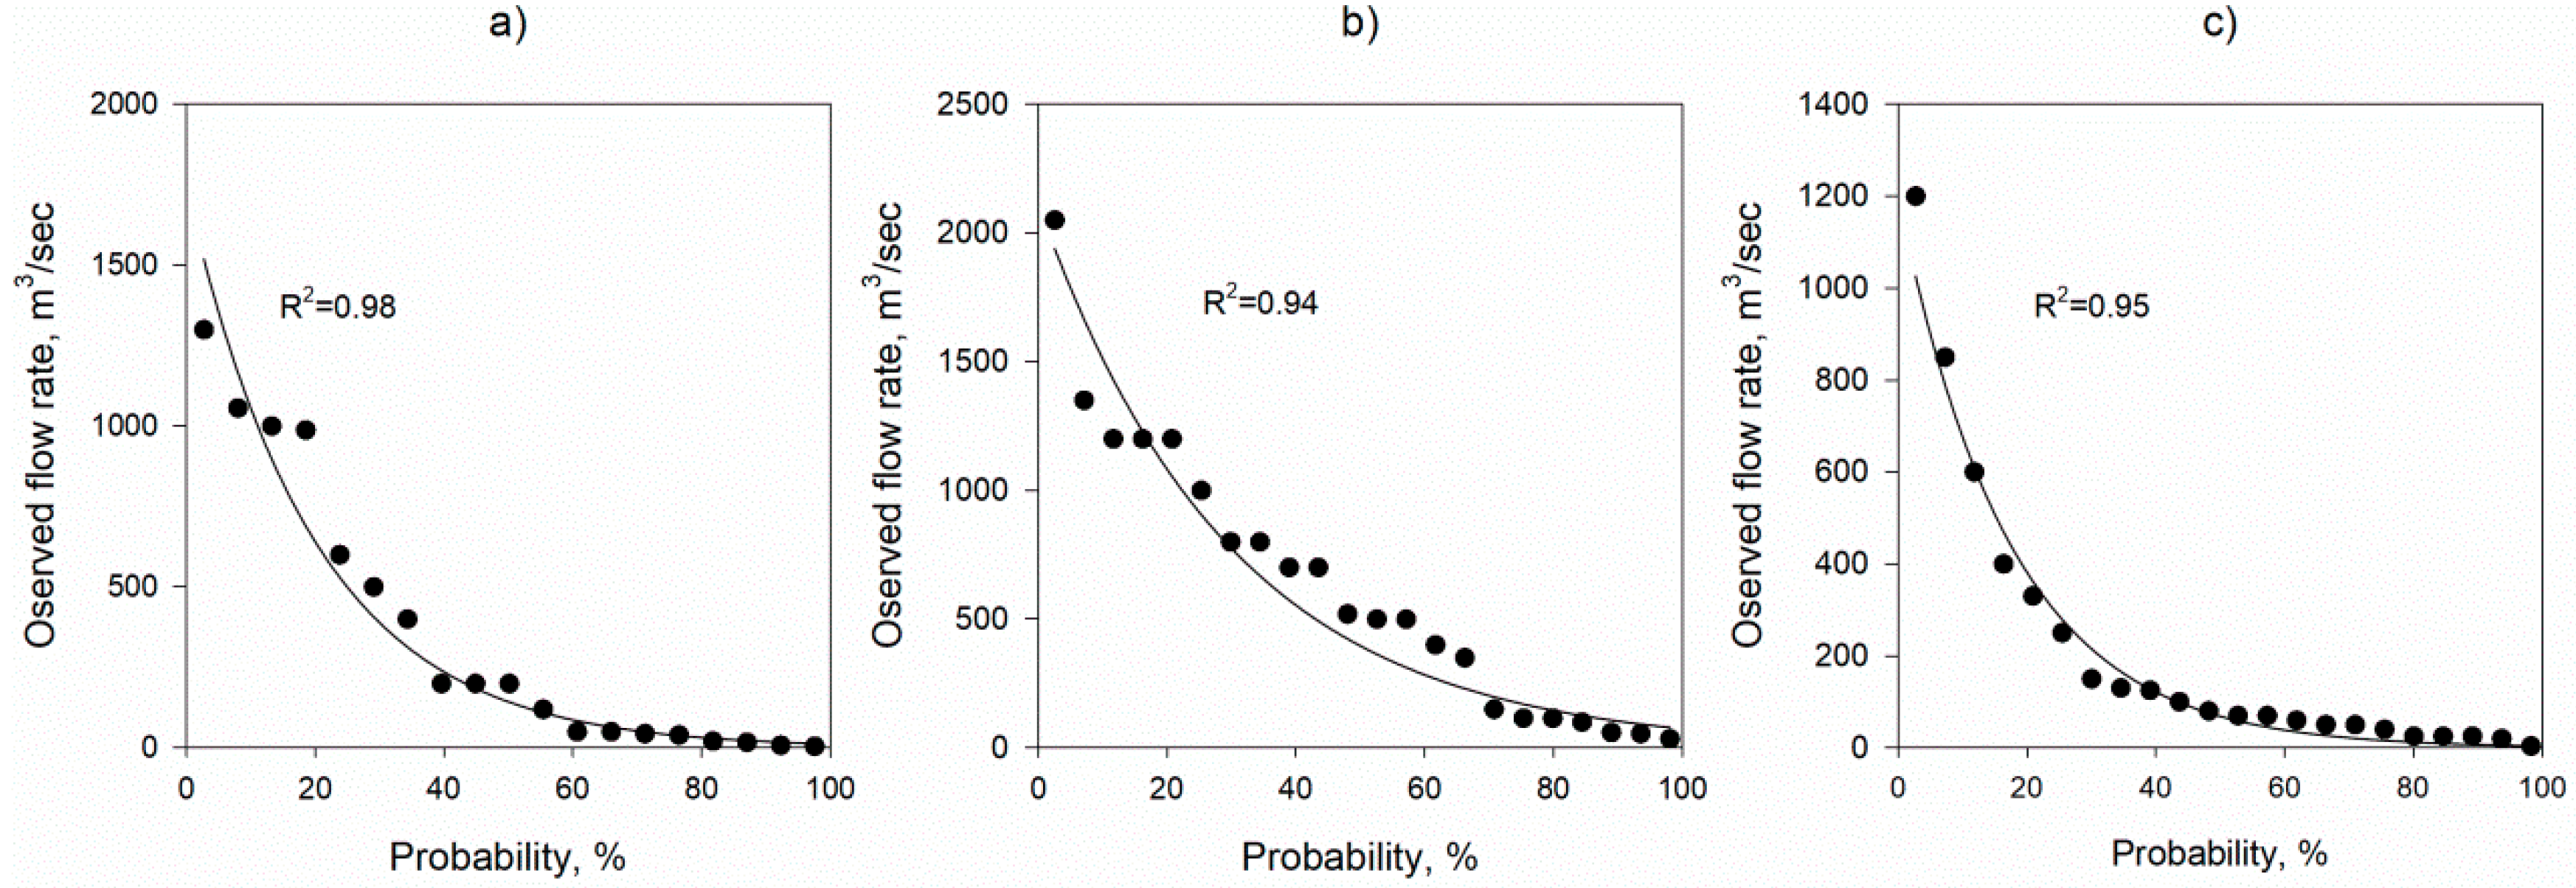
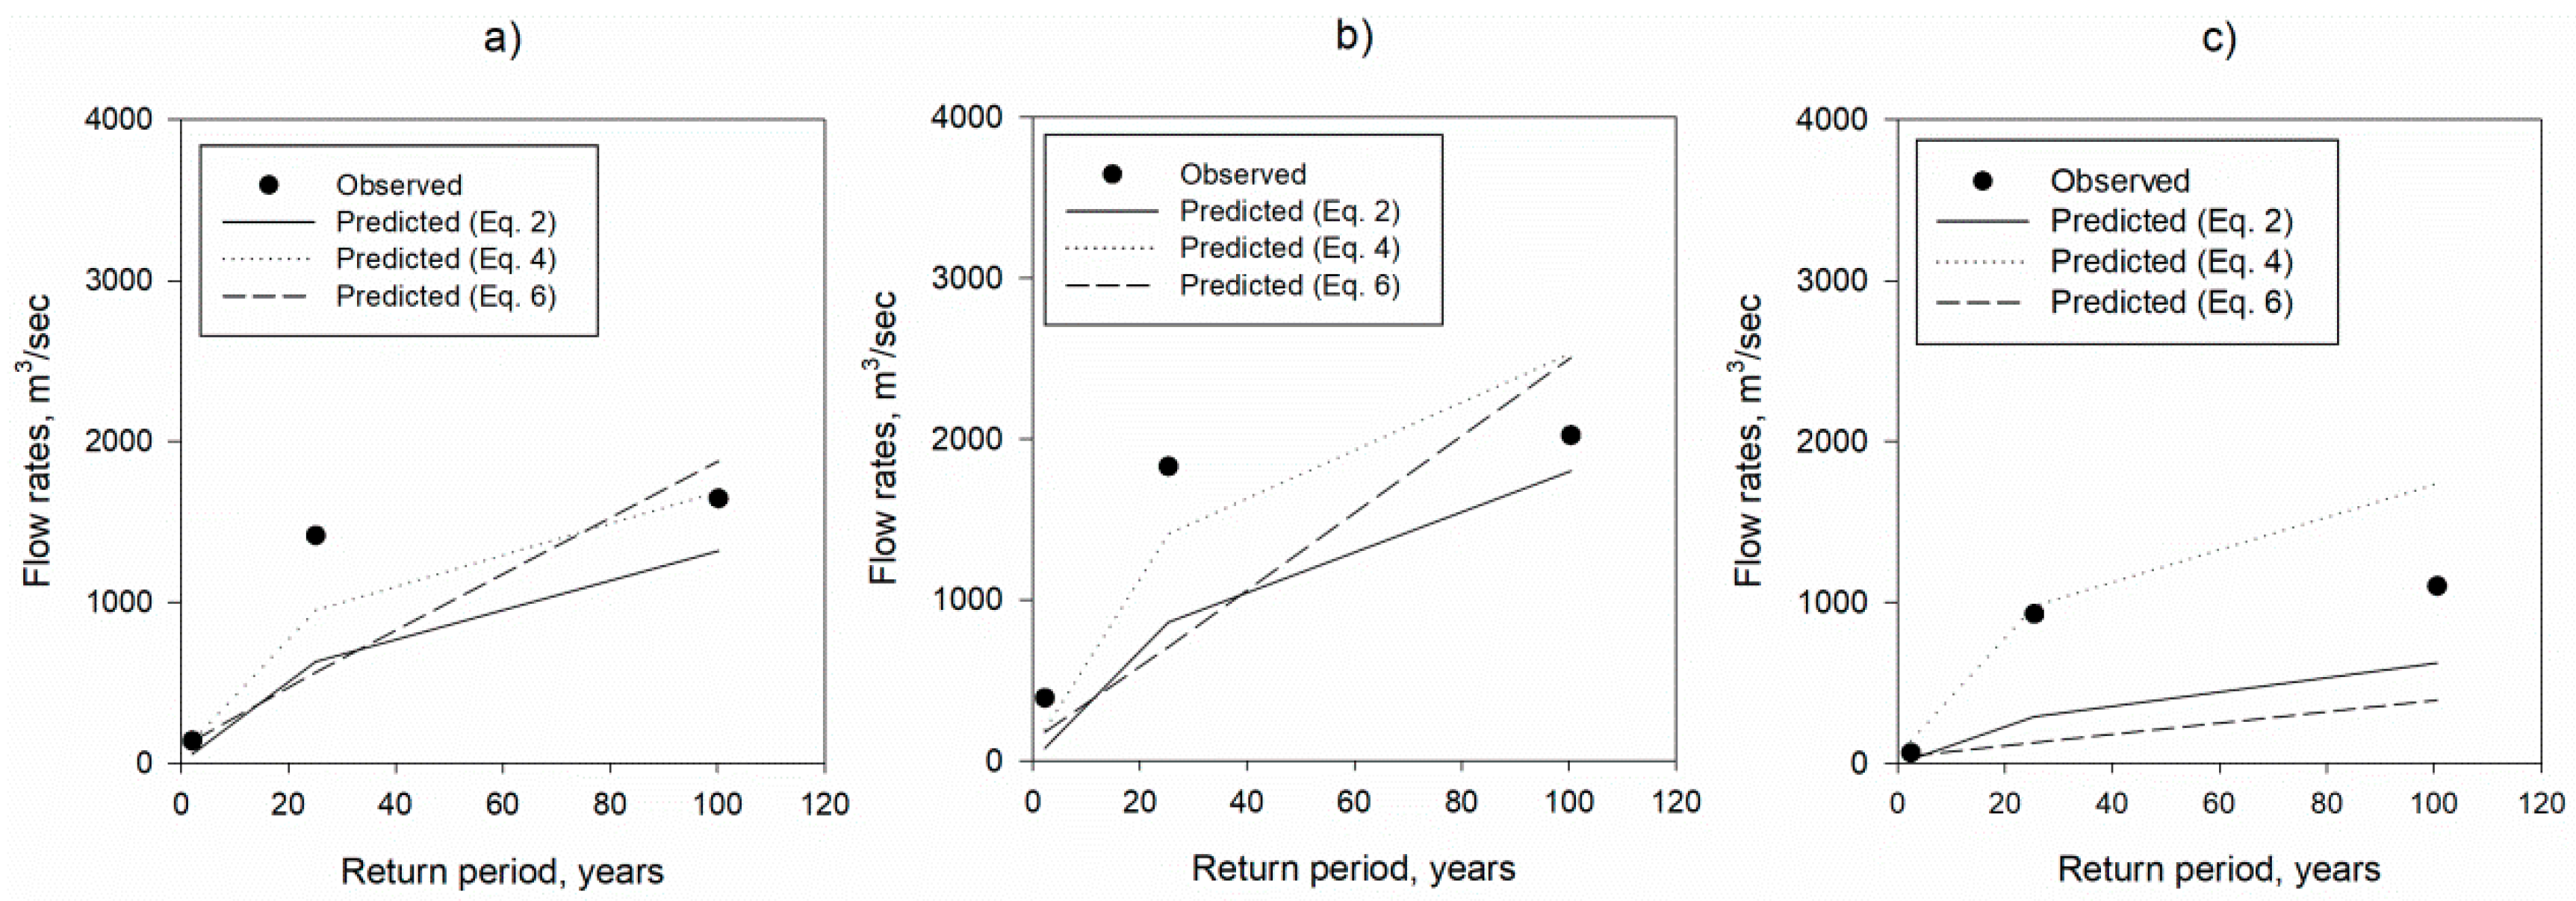
3.1. Predicted Versus Observed Runoffs

Based on Equations (1a) through (3c), Figure 5 shows a comparison of estimated peak runoffs of eight watersheds for the return period of 2, 25, and 100 years. For the two-year return period, the mean values of estimated runoffs are 37.74, 58.60, and 92.23 m3/s for Equations (1a), (2a), and (3a), respectively. A one-way ANOVA test for analysis of variance between Equations (1a), (2a), and (3a) shows that there is a statistically significant difference between Equations (3a) versus (1a) and (2a) (with p-value < 0.001) (Figure 5a). Meanwhile, there was no significant differences between Equations (1a) versus (2a) with a p-value equal to 0.257. For the 25-year return period, the median values of estimated runoffs were 337.80, 497.93, and 357.65 m3/s for Equations (1b), (2b), and (3b), respectively. There is a statistically significant difference between Equations (1b) versus (2b) and (3b) (with p-value < 0.001) for estimated runoffs (Figure 5b). No statistically significant differences were observed between estimated runoffs of Equations (2b) versus (3b). There is a statistically significant difference between estimated runoffs using Equations (1c), (2c), and (3c) with a p-value less than 0.001, for the 100-year return period. The median values of estimated runoffs were 682.96, 1062.07, and 553.57 m3/s for Equations (1c), (2c), and (3c), respectively (Figure 5c).
Figure 6 shows a comparison of estimated runoffs of eight watersheds based on Equations (4a) through (6c) that selected from taxes regions for the peak runoffs of the 2-, 25-, and 100-year return periods. The mean values of estimated runoffs were 151.57, 234.91, and 109.31 m3/s for Equations (4a), (5a), and (6a), respectively, for the two-year return period. ANOVA test for analysis of variance shows that there is a statistically significant difference between Equations (5a) versus (4a) and (6a) (with p-value < 0.001) (Figure 6a). Meanwhile, there were no significant differences between Equations (4a) versus (6a) with a p-value equal to 0.094. For the 25-year return period, there is a statistically significant difference between Equations (4b), (5b), and (6b) (with p-value less than 0.001) (Figure 6b). The median values of estimated runoffs of the 25-year return period were 971.99, 2073.25, and 311.36 m3/s for Equations (4b), (5b), and (6b), respectively. There is not a statistically significant difference between Equations (4c) versus (6c) of the 100-year return period with a p-value equal to 0.545. The median values of estimated runoffs of the 100-year return period were 1926.64, 4592.45, and 1410.51 m3/s for Equations (4c), (5c), and (6c), respectively (Figure 6c). In general, the results from Figure 5 and Figure 6 show that the set of equations with the parameters average DEM (E), catchment area (A), and average annual precipitation (P), reasonably predicted the flow rates of eight watersheds (such as the set of Equations (2), (4), and (6)) for different return periods. Meanwhile, the set of equations (such as set of Equation (5)) that included the parameter slope of the main stream (S) did not reasonably predict the flow rates of studied watersheds for different return periods.
Based on regression analysis using normal probability plots for observed flow rates, Figure 7 reports the observed flow rates at different probability of Tursaq, Galal Badra, and al-Chabbab streams. The regression analysis produced p-values of 0.687, 0.666, and 0.904 for Tursaq, Galal Badra, and al-Chabbab streams, respectively. Based on normal probability plots of Figure 7, the return periods for the 2-, 25-, and 100-year of observed runoffs were 142.2, 1418.2, and 1647.7 m3/s for Tursaq stream, 392.1, 1830.8, and 2024.3 m3/s for Galal Badra stream, and 66.9, 929.7, and 1103.8 m3/s for al-Chabbab stream, respectively. The selected regression set of Equations (4) that adopted by USGS to estimate runoffs reasonably predicted the observed flow rates for the three streams (Tursaq, Galal Badra, and al-Chabbab) at the 2-, 25-, and 100-year return periods (Figure 8). The observed and predicted flow rates of set of Equations (4) were equivalent at the 2- and 100-year return periods for Tursaq stream (Figure 8a), at the 2-year return period for Galal Badra stream (Figure 8b), and at the 2- and 25-year return periods for al-Chabbab stream (Figure 8c). The predicted flow rates of equations 2 and 6 were equivalent to observed flow rates at the 2-year return period for Tursaq and al-Chabbab streams (Figure 8a,c).
A one-way ANOVA test for analysis of variance between observed and predicted runoffs of Tursaq water course shows that the mean flow rates were 1069.33, 671.44, 925.73, and 860.71 m3/s for observed runoff, estimated runoff from the set of Equation (2), estimated runoff from set of Equation (4), and estimated runoff from set of equations 6, respectively. For Galal Badra stream, the mean flow rates were 1415.71, 914.32, 1379.64, and 1131.58 m3/s for observed flow rates, estimated runoff from Equation (2), estimated runoff from Equation (4), and estimated runoff from Equation (6), respectively. While, the mean flow rates values of al-Chabbab stream were 700.14, 313.96, 952.18, and 190.10 m3/s for observed flow rates, estimated runoff from Equation (2), estimated runoff from Equation (4), and estimated runoff from Equation (6), respectively. The results of statistical analysis confirmed that the set of Equation (4) are the best option to represent the observed flow rates. However, ANOVA test for analysis of variance shows that there is no statistically significant difference between observed runoff and empirical set Equations of (2), (4), and (6) with p-values of 0.353, 0.354, and 0.063 for Tursaq, Galal Badra, and al-Chabbab streams, respectively.

3.2. Water Harvesting Techniques and Proposed Reservoir

The watersheds of Mandali, Qazania, Tursaq, Mirzabad, and Galal Badra discharge through several natural streams into northern and southern parts of al-Shiwiaja Marsh (Figure 9). The southern part of al-Shiwiaja Marsh is a large shallow natural depression located 20 km northeast of Kut City. The marsh is very saline, most of times, and not suitable for agriculture or municipal usages. Its main function is to accommodate flood water and rout it to the Tigris River, through Um al-Jerri channel. The northern part of al-Shiwiaja Marsh is located further north (not showing in the map) and is being used as a natural collection point for runoffs from nearby streams (Mandali, Qazania, and Tursaq). The northern part is shallow and not fit to as a reservoir. The southern part of al-Shiwiaja Marsh has lowest elevation of 13 m (a.m.s.l). While, the level of 17 m (a.m.s.l) runs parallel to the protective dyke located on southern part of al-Shiwiaja Marsh. The southern al-Shiwiaja Marsh has a surface area of 250 km2 as delineated by this study. The estimated capacity of southern part of al-Shiwiaja as existed is about 1000 Mm3.
Models of flood water harvesting estimates and river trainings using GIS tools are applied to this research to determine the proposed reservoir. The water harvesting techniques are site- and cultural-specific. The choice of a given technique depends on the type of water harvesting, the goal of the harvesting, and the economic considerations among other factors. The flood water harvesting technique is used to store the flood flows from Mandali, Qazania, Tursaq, Mirzabad, and Galal Badra watersheds to the proposed reservoir (Figure 9). According to this proposal, river trainings using GIS tools are performed to determine the natural water courses (natural proposed channels) (dark blue lines of Figure 9). The DEM of the study area is subdivided into three levels: Less than 13 m (a.m.s.l), 13–18 m (a.m.s.l), and above 18 m (a.m.s.l).The proposed reservoir (light purple area in Figure 9) encompasses the contour line 18 m as the highest storage level and the contour line 13 m as the lowest storage level. The surrounding dykes should be constructed along line 18 m to accommodate the highest water level as well as the required free board. The proposed reservoir includes the present southern part of al-Shiwiaja Marsh. Total surface area of the proposed reservoir is 590 km2 corresponding to a storage capacity of 3000 Mm3. The total volume of inflow as estimated by this study is 4700 Mm3, which is higher than the available storage capacity. The flood of 2018–2019 in the study area has confirmed this finding. The outflow to the Tigris River is through the existing Um al-Jerri and al-Nishama Outlets (the current combined discharge of both outlets is 75 m3/s). Al-Chabbab stream directly discharges into the Tigris River, downstream of Um al-Jerri channel. Future study is planned to present design details of the proposed reservoir as well as the water harvesting scheme for al-Teeb and Dwaireeg watershed regions. Currently, these two streams discharge into the Iraqi southern marshes (such as al-Hawizeh Marshes).

4. Discussion

Six sets of regression equations adopted from the USGS based on hydrological and meteorological similarities between the streams of the study area and the ones in the USA were used to predict the runoffs of the eight watersheds. Outflow rates from each watershed were determined using all selected sets and for return periods of 2, 25, and 100 years. A one-way ANOVA test for analysis of variance between regression equations was conducted to find out about statistical differences. The results from Figure 5 and Figure 6 showed that the set of Equations (2) (derived for a hydrological region in Arizona), Equations (4), and (6) (both derived for regions in Texas) demonstrated the most reliable results for the three return periods. These regression equations were based on parameters of the average DEM, the catchment area, and the average annual precipitation. Meanwhile, the set of Equation (5) that were based on the parameter slope of the main stream did not reasonably predict the flow rates of the study area. The statistical analysis between observed and predicted runoffs (using sets of Equations (2), (4), and (6)) for Tursaq, Galal Badra, and al-Chabbab streams showed that there is no statistically significant difference between observed runoff and generated flows. The set of Equation (4) based on the parameter catchment area only produced the best option to represent the observed flow rates. Other models and methods to estimate outflow such us the hydrograph or numerical models were not applied because all the studied watersheds fall within Iran; the geopolitics prevailed in the region make these watersheds not accessible for more detailed examinations.
A reservoir is proposed to be constructed in a location topography situated to serve five of the eight watersheds (Mandali, Qazania, Tursaq, Mirzabad, and Galal Badra). The reservoir is designated to collect harvested water (generated flow) during the wet seasons and release to the Tigris River during dry seasons. The new reservoir is an expansion of the existed al-Shiwiaja Marsh depression to accommodate about 3000 Mm3; a little less than the generated flow of the five streams. The designated outlets to the Tigris River are Um al-Jerri and al-Nishama with combined disgorge of about 75 m3/s. Al Chabbab stream is already connected to the Tigris River and the study proposed no further improvement for its outlet. More studies are required to address the outflow from al-Teeb and Dwaireeg watersheds.

5. Conclusions

Results of this study demonstrate the promising potential of eastern Iraqi area for water resources and harvesting projects. The study area includes eight watersheds: Mandali, Qazania, Tursaq, Mirzabad, Galal Badra, al-Chabbab, al-Teeb, and Dwaireeg. The watersheds are delineated using GIS techniques. The hydrological characteristics, catchment areas, average terrain elevation, average annual precipitation, and slope of main stream of eight watersheds are described in details. The observed flow rates of Tursaq, Galal Badra, and al-Chabbab streams are compared with runoff rates calculated by regression models of the USGS. The results show that the set of equations based on average DEM, catchment area, and average precipitation reasonably predicted the flow rates of eight watersheds for 2-, 25-, and 100-year return periods. The statistical analysis of variance shows that there are no statistically significant differences between the observed and predicted runoff by the regression models for Tursaq, Galal Badra, and al-Chabbab streams based on catchment areas for different return periods. A proposed reservoir located within al-Shiwiaja Marsh could store up to three times the water compared to the current capacity of the marsh. The expected inflow is higher than the capacity of the proposed reservoir. In this study, one major limitation factor is that all of watersheds are located in another country (Iran). They are not accessible to the researchers for necessary examinations. The other limitation is the lack of observed data for most of the studied streams. Due to the complex hydrological nature of the study area, not all the expected inflow was accommodated or accounted for. Future studies are required to provide more details and designs about the proposed reservoir as well as a robust scheme to utilize the waters of al-Teeb and Dwaireeg watersheds.

Author Contributions

The performing data analysis, providing required materials, ideas, formulation of overarching research aims, editing of the text, and data/evidence collection have been performed by K.A.R. and A.T.A. The formulation of overarching research aims, reviewing similar studies, and editing of the text have been performed by S.N.A.

Funding

This research received no external funding.

Acknowledgments

The authors acknowledge the Ministry of Water Resources in Iraq for collaboration and providing some flow and rainfall data. The authors also acknowledge Mustansiriyah University (www.uomustansiriyah.edu.iq) for the support and encouragement throughout the course of this research.

Conflicts of Interest

The authors declare no conflict of interest.

References

  1. Population and Water Resources. Available online: https://www.un.org/popin/fao/water.html (accessed on 8 June 2019).
  2. Rahi, K.A.; Halihan, T. Changes in the salinity of the Euphrates River system in Iraq. Reg. Environ. Chang. 2010, 10, 27–35. [Google Scholar] [CrossRef]
  3. Rahi, K.A.; Halihan, T. Salinity evolution of the Tigris River. Reg. Environ. Chang. 2018, 18, 2117–2127. [Google Scholar] [CrossRef]
  4. Rahi, K.A. Salinity management in the Shatt Al-Arab River. Int. J. Eng. Technol. (Uae) 2018, 7, 128–133. [Google Scholar] [CrossRef]
  5. Critchley, W.; Siegert, K. Water Harvesting, 2nd ed.; Food and Agriculture Organization of the United Nations: Rome, Italy, 1991. [Google Scholar]
  6. Malik, M.I.; AL-Shammary, S.H.; AL-Hamzawy, H.M. Morphometric analysis of al-Chabab river basin east of Iraq using Remote Sensing and GIS techniques. Int. J. Sci. Eng. Res. 2014, 4, 2347–3878. [Google Scholar]
  7. Al-Hussaini, S.N.; Al-Obaidy, A.M.; Al-Mashhady, A.A. Environmental assessment of heavy metal pollution of Diyala River within Baghdad City. Appl. Water Sci. 2018, 8, 1–6. [Google Scholar] [CrossRef]
  8. Al-Sudani, H.Z. Study of morphometric properties and water balance using Thornthwaite method in Khanaqin basin, east of Iraq. J. Univ. Babylon Eng. Sci. 2018, 26, 165–175. [Google Scholar]
  9. Iraq meteorological organization and seismology. Available online: http://www.meteoseism.gov.iq (accessed on 20 March 2019).
  10. Jawad, T.K.; Al-Taai, O.T.; Al-timimi, Y.K. Evaluation of drought characteristics in Iraq using SC-PDSI. Sci. J. Univ. Zakho 2018, 6, 94–99. [Google Scholar] [CrossRef]
  11. Zakaria, S.; Al-Ansari, N.; Kuntsson, S.; Ezz-Aldeen, M. Rain water harvesting and supplemental irrigation at northern Sinjar mountain, Iraq. J. PurityUtil. React. Environ. 2012, 6, 121–141. [Google Scholar]
  12. Hassan, M.A.; Selman, A.A.; Ghani, A.A. Morphometric properties of Bulkana (NaftKhanah) north-east Iraq from topographic maps. Int. J. Curr. Eng. Technol. 2014, 4, 45–51. [Google Scholar]
  13. Ali, R.; Ismael, A.; Heryansyah, A.; Nawazakaria, N. Long term historic changes in the flow of lesser Zab River, Iraq. Hydrology 2019, 6, 22. [Google Scholar] [CrossRef]
  14. Al-Mukhtar, M.; Al-Yaseenli, F. Modeling water quality parameters using data-driven models, a case study Abu-Ziriq marsh in south of Iraq. Hydrology 2019, 6, 24. [Google Scholar] [CrossRef]
  15. Awchi, T.A.; Kalyana, M.M. Meteorological drought analysis in northern Iraq using SPI and GIS. Sustain. Water Resour. Manag. 2017, 3, 451–463. [Google Scholar] [CrossRef]
  16. Ali, K.A. Geospatial hydrological analysis in GIS environment for selecting potential water harvest sites: The case of Badrah –Wasit. J. Univ. Babylon 2018, 26, 328–337. [Google Scholar] [CrossRef]
  17. Ibrahim, G.F.; Azad, A.R.; Hamid, A.A.; Ali, Z.F.; Dewana, A.A. Suitable site selection for rainwater harvesting and storage case study using Dohuk Governorate. Water 2019, 11, 864. [Google Scholar] [CrossRef]
  18. Ali, M.H. Transboundary waterways and streams along the Iraq-Iran border line the reality and the future. Master’s Thesis, University of Baghdad, Baghdad, Iraq, 2012. [Google Scholar]
  19. Al-Salihi, A.M.; Al-lami, A.M.; Altimimi, Y.K. Spatiotemporal analysis of annual and seasonal rainfall trends for Iraq. Al-Mustansiriyah J. Sci. 2014, 25, 153–168. [Google Scholar]
  20. Al-Madhhachi, A.T.; Al-Mussawy, H.A.; Basheer, M.I.; Abdul-Sahib, A.A. Quantifying Tigris riverbanks stability of southeast Baghdad city using BSTEM. Int. J. Hydrol. Sci. Technol. (In press). [CrossRef]
  21. Al-Shamaa, I.M.; Ali, B.M. Estimation of groundwater recharge in Badra-Jassan Basin using annual water surplus method. Iraqi J. Sci. 2012, 53, 107–112. [Google Scholar]
  22. World Weather Online. Available online: https://www.worldweatheronline.com (accessed on 20 March 2019).
  23. Jennings, M.E.; Thomas, W.O.; Riggs, H.C. Nationwide summary of U.S. Geological Survey Regional Regression Equations for Estimating Magnitude and Frequency of Floods for Ungaged Sites; USGS Water-Resources Investigations Report: Washington, VA, USA, 1994.
  24. Saleh, D.K. Stream Gage Descriptions and Streamflow Statistics for Sites in the Tigris River and Euphrates River Basins, Iraq; US Geological Survey: Reston, VA, USA, 2010. [Google Scholar]
  25. Hasan, M.B.; Al-Madhhachi, A.T. The Influence of Crude Oil on Mechanistic Detachment Rate Parameters. Geosciences 2018, 8, 332. [Google Scholar] [CrossRef]
Figure 1. Location map of the study area of eight watersheds in eastern Iraq.
Hydrology 06 00057 g001
Figure 2. Characteristics of terrain elevation, main stream, and terrain slope of Mandali, Qazania, and Tursaq watersheds.
Hydrology 06 00057 g002
Figure 3. Characteristics of terrain elevation, main stream, and terrain slope of Mirzabad, Galal Badra, and al-Chabbab watersheds.
Hydrology 06 00057 g003
Figure 4. Characteristics of terrain elevation, main stream, and terrain slope of al-Teeb and Dwaireeg watersheds.
Hydrology 06 00057 g004
Figure 5. Comparison of estimated runoffs using empirical equations of Arizona regions adopted by United States Geological Survey (USGS) for the eight watersheds of: (a) 2-year return period, (b) 25-year return period, and (c) 100-year return period.
Hydrology 06 00057 g005
Figure 6. Comparison of estimated runoffs using empirical equations of Taxes regions adopted by USGS for the eight watersheds of: (a) 2-year return period, (b) 25-year return period, and (c) 100-year return period.
Hydrology 06 00057 g006
Figure 7. Statically analyzed using normal probability plots of observed flow rates for the three streams: (a) Tursaq, (b) Galal Badra, and (c) al-Chabbab.
Hydrology 06 00057 g007
Figure 8. Comparison between observed and predicted flow rates at the 2-, 25-, and 100-year return periods for the three streams: (a) Tursaq, (b) Galal Badra, and (c) al-Chabbab.
Hydrology 06 00057 g008
Figure 9. Proposed reservoir of flood water harvesting techniques for Mandali, Qazania, Tursaq, Mirzabad, and Galal Badra watersheds.
Hydrology 06 00057 g009
Table 1. Hydrological characteristics of eight watersheds proposed in this study.
Watershed NamesDrainage Outlet Coordinates, DMSAverage Terrain Slope, DegreeCatchment Area (A), km2Weighted Average of Terrain Elevation (E), mLength of Main Stream, kmMain Stream Average slope (S), %
Mandali45°35′38″ E
33°46′52″ N
12.561246.101101.26106.980.011
Qazania45°43′34″ E
33°34′26″ N
13.77419.75746.7142.510.027
Tursaq45°51′18″ E
33°29′13″N
12.501218.89980.0867.150.012
Mirzabad46°01′59″ E
33°24′25″ N
9.24274.28722.4630.440.014
Galal Badra46°05′56″ E
33°07′19″ N
11.702306.09929.0195.320.018
Al-Chabbab46°26′10″ E
32°55′34″ N
13.381275.02959.4788.520.013
Al-Teeb47°10′19″ E
32°25′48″ N
11.252738.28800.96142.520.009
Dwaireeg47°28′44″ E
32°7′34″ N
6.363666.90420.08206.600.005
Table 2. The annual average rainfall (mm) for some metrological stations within the eight watersheds in eastern Iraq, on the Iraqi–Iranian border [9,21,22].
Watershed NamesMandaliQazaniaTursaqMirzabadGalal BadraAl-ChabbabAl-TeebDwaireeg
Annual Precipitation for different years, mm1995----345.0109.0198.0-
1996----218.4124.1220.0-
1997----217.483.4183.2-
1998----269.3103.9105.8-
1999----243.1130.6130.0-
2000----179.1090.8096.1-
2001----245.6093.1100.3-
2002----233.3091.3134.6-
2003----160.1124.4--
2004----175.4125.1--
2005----151.3092.4--
2006----234.7188.4--
2007----124.0040.1--
2008----195.7109.0--
2009106.8035.9159.4035.2112.1051.4035.2191.9
2010251.4125.4232.3040.7108.0084.0040.7262.5
2011096.1095.2262.8054.2128.6094.2054.2270.3
2012090.6090.6201.3043.3158.4056.6043.4206.0
2013149.6181.7213.8240.9290.4156.1188.6284.3
2014166.2174.2182.2190.2198.2130.2053.7260.8
2015066.8084.6102.5110.3138.1110.2060.3071.0
2016104.4147.9191.4224.9278.4160.9079.7095.4
2017111.4115.1138.7152.3165.9073.3062.8159.4
2018138.8138.7265.7039.5265.3074.9037.6121.2
2019894.4894.21142.1451.71139.9423.5451.7809.8
Average precipitation (P), mm197.9189.4281.1143.9239.0116.8119.8248.4

