1. Introduction
Phytoplankton form the base of the food web for oceanic ecosystems in coastal southern Alaska, an area with highly productive fisheries [
1]. Phytoplankton ecology in the Gulf of Alaska is largely seasonal in nature, with a characteristic spring phytoplankton bloom [
1,
2]. Phytoplankton blooms on the southern Alaskan coast typically propagate close to shore and can extend across the continental shelf in April–May. This occurs after upwelling when wind-driven deep vertical mixing slows, the water column stratifies, and light limitation is relieved due to longer day length [
1,
2]. This seasonal cycle gives rise to a predictable succession pattern within the plankton community that begins with a diatom bloom in spring. Zooplankton grazers then increase in abundance, consuming the diatoms and modulating their growth [
2]. Following the decrease in diatom abundance, dinoflagellates begin to increase in abundance, but then decline until the end of the summer, as nutrients are depleted. The cycle completes in the fall when the water column returns to mixed, light-limited conditions [
2].
Common diatom genera in the spring bloom include
Pseudo-nitzschia,
Chaetoceros, and
Leptocylindrus, each of which comprise 2% to 30% of the spring bloom and summer phytoplankton communities [
3].
Pseudo-nitzschia spp. and
Chaetoceros spp. are chain-forming diatoms, whereas
Leptocylindrus spp. is unicellular. Although important contributors to the base of the food web in the Gulf, these genera can have harmful effects on the Gulf ecosystem as well. For example,
Chaetoceros spp. have spinule-containing setae that can become lodged in fish gills [
4] and
Pseudo-nitzschia spp. can bloom and produce the neurotoxin domoic acid under stressful conditions, such as silica or phosphorous limitation [
5].
Although upwelling and deep mixing are major sources of nutrients to the Gulf of Alaska, these processes occur beyond the shelf break [
6], and other terrestrial nutrient sources are therefore more important closer to shore. River water transports nutrients to the coastal Gulf, where it causes a freshening of the surface ocean during summer [
2,
6,
7]. The source of river water in this area is precipitation and glacial melt within the watersheds [
8,
9]. Rivers in glacial watersheds of this region tend to become nitrogen depleted over the course of the melt season (summer), making them a better source of nitrogen to the Gulf at the beginning of summer than towards the end [
8,
9]. Septic, waste water discharge, and other anthropogenic sources have not been identified as major terrestrial nutrient sources to the Gulf, especially due to the low population and abundant pristine conditions surrounding the Gulf. Submarine groundwater discharge (SGD) has also been shown to transport nutrients to the coastal waters of the Gulf, where scaling analyses have shown that it may be a greater source of nitrate and silicate than rivers [
10]. SGD can manifest as fresh groundwater discharge, a brackish mixture of fresh groundwater and seawater, or seawater that has circulated through the coastal aquifer [
11,
12,
13]. Most SGD in this region is predicted to be brackish, in which sea water mixes in the coastal aquifer with high nutrient fresh groundwater before discharging to the ocean [
10,
14]. The dominant forcing of SGD in this area includes tidal pumping from the large tidal range (<8 m), as well as the large hydraulic gradient resulting from high precipitation (>870 mm) and steep topography [
14,
15].
Diverse effects of SGD on phytoplankton ecology are well documented. In many studies, it was shown that SGD-enriched seawater is associated with higher chlorophyll concentrations [
16,
17,
18]. Additionally, SGD has been shown to induce phytoplankton growth in coastal environments where SGD increases temporarily in response to increased precipitation [
16,
19]. A shift towards an increasing relative abundance of diatoms when compared to other phytoplankton during additions of SGD in bioassay experiments has also been observed [
20,
21]. These increases in diatom abundance are due to the relief of nutrient limitation by SGD (e.g., addition of nitrogen, silica, and phosphorous) or shifts towards nutrient ratios that are favorable to diatoms [
16,
18,
21]. However, increases in diatom abundance can, through cascading effects, result in conditions that favor dinoflagellate growth, resulting in harmful dinoflagellate red tides [
18,
22]. Additionally, comparisons of SGD-impacted and river-impacted coastal ocean sites found a shift towards diatom abundance in the SGD-impacted sites relative to the river-impacted areas [
16,
19]. Laboratory and field studies have demonstrated that SGD can increase
Pseudo-nitzschia spp. abundance, and it has been suggested that SGD can be preferable to riverine sources of nutrients for species in this genus, as SGD provides high nutrient loadings without lowering salinity [
19,
21]. Research of the impacts of SGD on other diatom genera is lacking. This study sought to build upon previous research studies, by (1) documenting the response of multiple diatom genera (specifically
Pseudo-nitzschia,
Chaetoceros, and
Leptocylindrus) to brackish groundwater additions that simulate SGD, (2) comparing the response of these genera to groundwater, river water, and a mixture of groundwater and river water, and (3) determining the cause of differences in response of Gulf of Alaska diatom genera to groundwater and river water.
2. Materials and Methods
2.1. Experimental Design
To determine the response of phytoplankton to nutrient input from groundwater and river water, a three day bioassay incubation experiment was conducted at the National Oceanic and Atmospheric Administration (NOAA) Kasitsna Bay Laboratory on the Kenai Peninsula in June 2015, following previously established methods [
21]. The average water temperature during June in this area is 7.8 °C (
https://www.nodc.noaa.gov/dsdt/cwtg/all_meanT.html). Local seawater from Kasitsna Bay (59.48° N, 151.56° W) was collected in acid cleaned, seawater rinsed carboys after being pre-filtered to remove grazers (mesh = 105 μm), and distributed into acid cleaned 500 mL incubation bottles. The mesh size was selected to remove zooplankton grazers, which can mask the effects of nutrient enrichment in bottle experiments by consuming phytoplankton as they grow. However, a tradeoff of pre-filtering is that the size range of some diatom species (particularly chain-forming species) overlaps with zooplankton. Hence, this step may have altered the phytoplankton community composition by removing larger phytoplankton cells or aggregates of cells. Despite this limitation, the removal of grazers permitted the detection of clear responses of several dominant genera in the Gulf of Alaska.
Local river water was collected from a stream that discharges into Kasitsna Bay adjacent to the laboratory. The water was collected 5 m upstream of the area of tidal influence, as indicated by a shift in the surrounding plant communities from halotolerant to freshwater-requiring species. Water was pumped through a 0.2 μm cartridge filter into an acid-cleaned carboy. Local groundwater was collected from a temporary well that screened at 0.5 m depth located above the high tide line during low tide. The groundwater and river water were assumed to be representative of the region with respect to salinity and nutrient concentrations, and a previous study at that site showed that river water and groundwater to fall within the range of nutrient concentrations that is common to that region [
15,
23]. The salinity of the river water was also within the representative range for the region [
15,
23]. The groundwater was pumped through a 0.2 μm cartridge filter into an acid cleaned carboy. In the laboratory, seawater was dispensed into the incubation bottles, and nutrients, river water, or groundwater additions were administered as follows. Treatments included nitrate (30 μM), silicate (30 μM), nitrate + silicate (30 μM + 30 μM), 0.2 μm filtered local groundwater (at 5% and 10% by volume), 0.2 μm filtered river water (at 5% and 10% by volume), 0.2 μm filtered groundwater +0.2 μm filtered river water (5% of each by volume), and a no-addition control. The nitrate and silicate treatments were intended to increase the concentrations of these nutrients approximately ten-fold over typical natural levels in Kasitsna Bay for this time of year, with the intention of inducing strong growth responses similar to those that are induced by river and groundwater additions. These treatments allowed for parsing the individual and combined effects of nitrate and silicate on different members of the phytoplankton community, and to determine which of these nutrients elicited the responses observed in the river and groundwater treatments. The nitrate and silicate concentrations fall in the range of concentrations known to be ecologically relevant to stimulate blooms of native taxa [
5,
21]. A phosphorous treatment was not conducted as it was determined that river water and groundwater are not important sources of this nutrient to the Gulf of Alaska, and phosphorous did not elicit a response in these taxa in a similar prior experiment [
10,
21].
Three replicate bottles were prepared for each time point of the experiment (0 h, 24 h, 48 h, and 72 h), for a total of 12 bottles per treatment. Bottles were incubated in a flow-through incubation tank with running seawater at ambient ocean temperature for three days on the pier of the Kasitsna Bay Laboratory. A neutral density screen was used to attenuate natural irradiance levels by 50% to simulate light attenuation within the surface mixed layer. At each time point, three bottles were sacrificed for each treatment, and samples were collected for nutrient (nitrate, phosphate, silicate, nitrite, and ammonium) concentrations, chlorophyll a, and phytoplankton community composition (absolute and relative abundance of genera). Samples were also collected for analysis of nutrient concentrations in the groundwater, river water, and seawater used in the experiment. Samples for nutrient concentrations, chlorophyll a, and phytoplankton community compositions were collected, stored, and analyzed using established methods, as described below.
2.2. Analytical Methods
Salinity of the groundwater, river water, and seawater was measured with a YSI 85 multiprobe. As dipping the probe into the incubation bottles would have contaminated the bottles, the salinity of the treatment groups was calculated based on the salinity of the three water types and the proportions of those water types in each treatment group. Nutrient samples were syringe filtered (0.2 μm) into acid cleaned, sample rinsed plastic tubes (50 mL), and stored frozen until analysis via colorimetric methods [
24] on a flow injection autoanalyzer (FIA, Lachat Instruments Model QuickChem 8000). Analytical error of this method was less than 3% and the detection limit was 0.01 uM. Chlorophyll
a samples were collected by filtering 200 mL of sample water onto GF/F filters (Whatman) under gentle vacuum. The filters were stored frozen at −80 °C until analysis. Chlorophyll
a was extracted from the filters for 24 h in 90% acetone at 4 °C, and the fluorescence of the extract was measured on a Turner Fluorometer (Turner Designs TF700).
Phytoplankton community composition (absolute and relative abundance) were determined from cell counts on samples that were preserved with 4% formalin and stored in the dark at 4 °C until analysis. Cells were settled from 50 mL aliquots in Utermöhl settling chambers, and phytoplankton genera were enumerated using an Olympus XI 70 inverted microscope. A minimum of 500 cells per sample were counted at 200× magnification. Uncertainty was estimated in two ways. First, the same fields were counted by two investigators and the results were compared; and second, different fields within the same settled sample were counted, and the results were compared. Both of the methods indicated error of 3–7%.
2.3. Statistical Analyses
To determine the significance of differences among treatments, four statistical techniques were utilized. In the case of comparing initial to final values within a treatment group, a student’s t-test (p < 0.05) was utilized. When significance was determined across the treatment groups, analysis of variance (ANOVA) was conducted to determine if at least one treatment group was different from the others, followed by Tukey-Kramer (p < 0.05) to identify the statistically different treatment group(s). When regressions were performed, significance of the slope was determined using a t-test. To determine the differences in phytoplankton community composition, a Bray-Curtis dissimilarity test was used on abundance data that was averaged for each treatment group from the final time point.
To determine the effects of different water types and nutrient combinations on Pseudo-nitzschia spp., Chaetoceros spp., and Leptocylindrus spp., a Euclidian distance-based principal component analysis (PCA) on treatments groups that responded was employed. As the experiment was conducted in triplicate, there were three data points for each treatment group in the analysis. The variables that were used in the analysis were chlorophyll a concentration (μg/L) at the 72 h time point, change in nitrate, silicate, and phosphate concentrations (μM) from the beginning of the experiment to the 72 h time point, and abundance of Pseudo-nitzschia spp., Chaetoceros spp., and Leptocylindrus spp. at the 72 h time point (cells/mL). Change in nutrient concentrations were used instead of absolute nutrient concentrations, as the large differences in nutrient concentrations between treatments would generate a poorly scaled matrix. Furthermore, as the change in nutrient concentrations was attributed to uptake by phytoplankton, change in nutrient concentration was deemed a better indicator of how the phytoplankton interacted with the nutrients than absolute concentration, which was controlled by the experimenters.
3. Results
Nutrient concentrations and salinity in the groundwater, river water, and seawater that were used in the experiments are shown in
Table 1, along with the results of an analysis of variance (ANOVA, Tukey-Kramer,
p < 0.05). The river water was fresh (salinity 0.4), whereas the groundwater was brackish (salinity 16.9). Nitrate and silicate concentrations were higher in groundwater and river water than in seawater. N:P and N:Si ratios were also higher in groundwater and river water than seawater (
Table 1).
Calculated salinities are shown in
Table 2. The treatments comprised of seawater and nutrient additions (control, nitrate, etc.) had the highest salinity, while the 10% river water treatment had the lowest salinity. Other mixtures of seawater, groundwater, and/or river water had salinities ranging between 28.2 and 29.7.
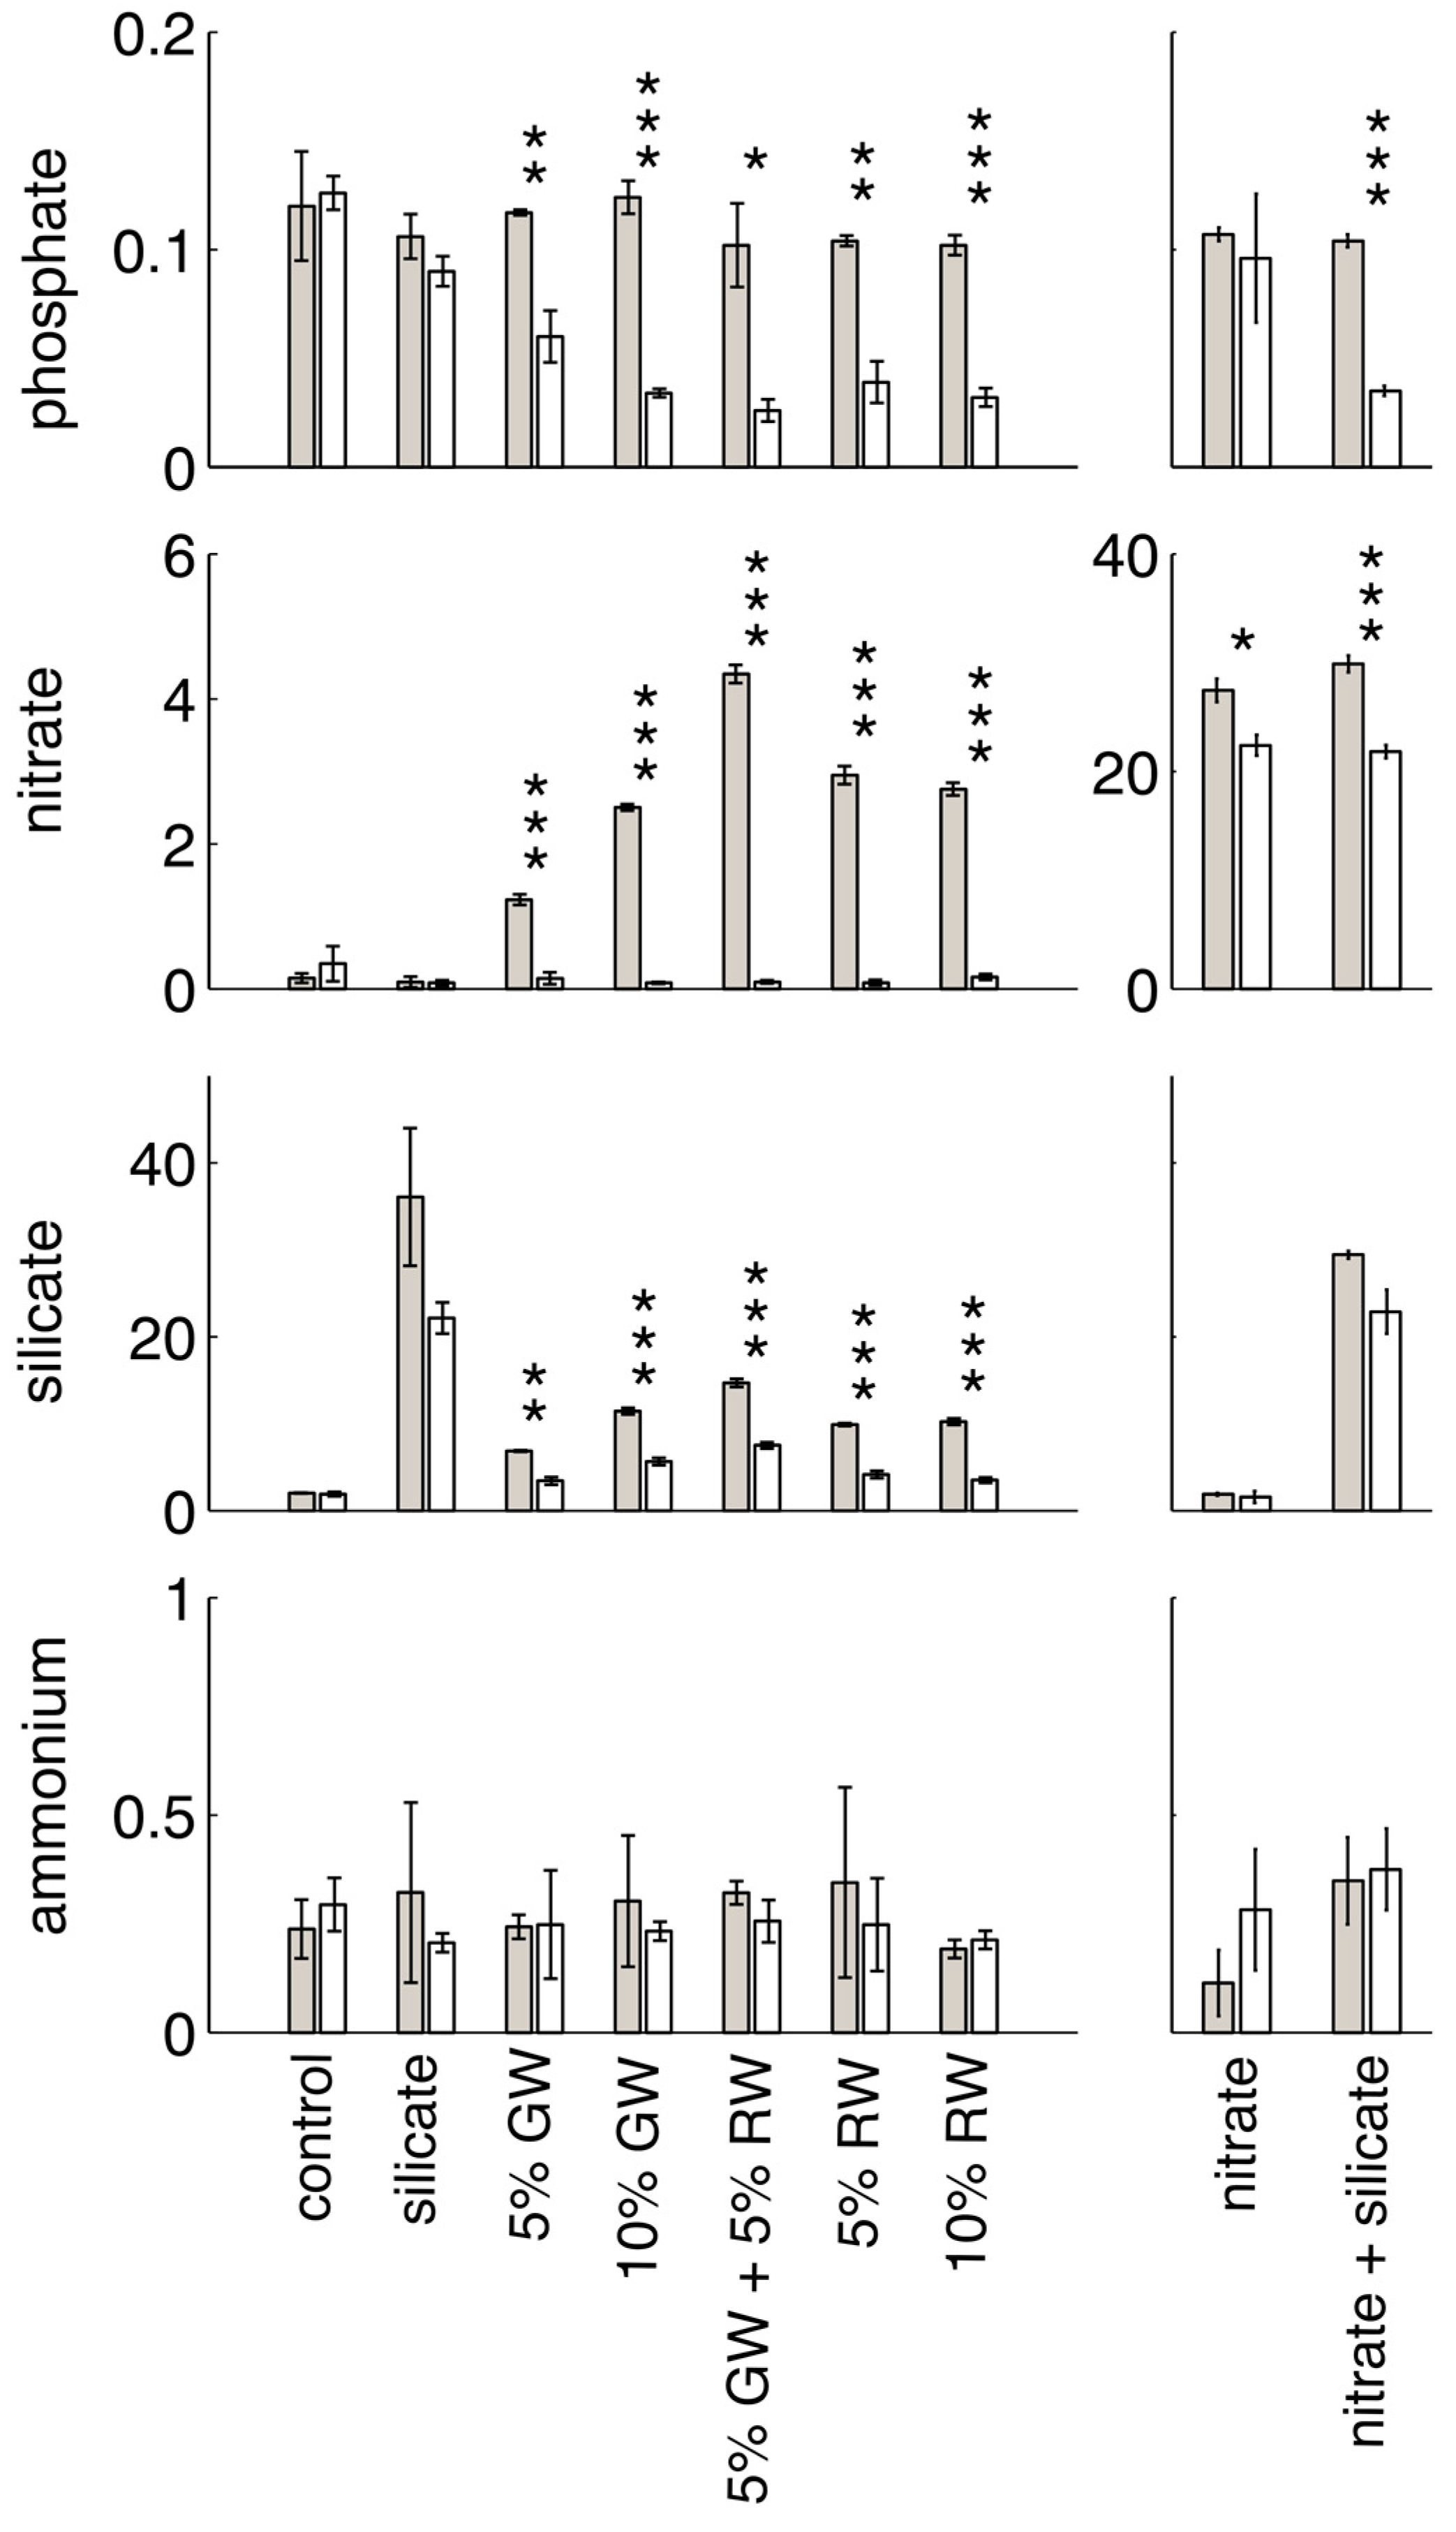
Initial and final nutrient concentrations, and significance between time points within each treatment group (
t-test,
p < 0.05) are shown in
Figure 1. Nitrite concentrations are not shown, as groundwater and river water nitrite levels were low and only slightly elevated when compared to seawater (
Table 1). All of the treatments in which nitrate was elevated relative to background seawater levels (i.e., the nitrate, nitrate + silicate, groundwater, river water, and groundwater + river water treatments) showed significant decreases in nitrate concentrations over time. The most significant change was in the nitrate and silicate-containing treatments (nitrate + silicate, groundwater, river water, and groundwater + river water). Groundwater and river water treatments were deplete in nitrate by the end of the experiment, due to the lower initial nitrate concentrations in these treatments. The groundwater and river water treatments were also the only treatments with a significant decrease in silicate concentrations (the nitrate + silicate treatment decrease of ~10 μM was not significant at
p < 0.05). Significant decreases in phosphate only occurred in the treatments containing both elevated nitrate and silicate, and ammonium did not significantly change in concentration between the initial and final time points for any treatment.
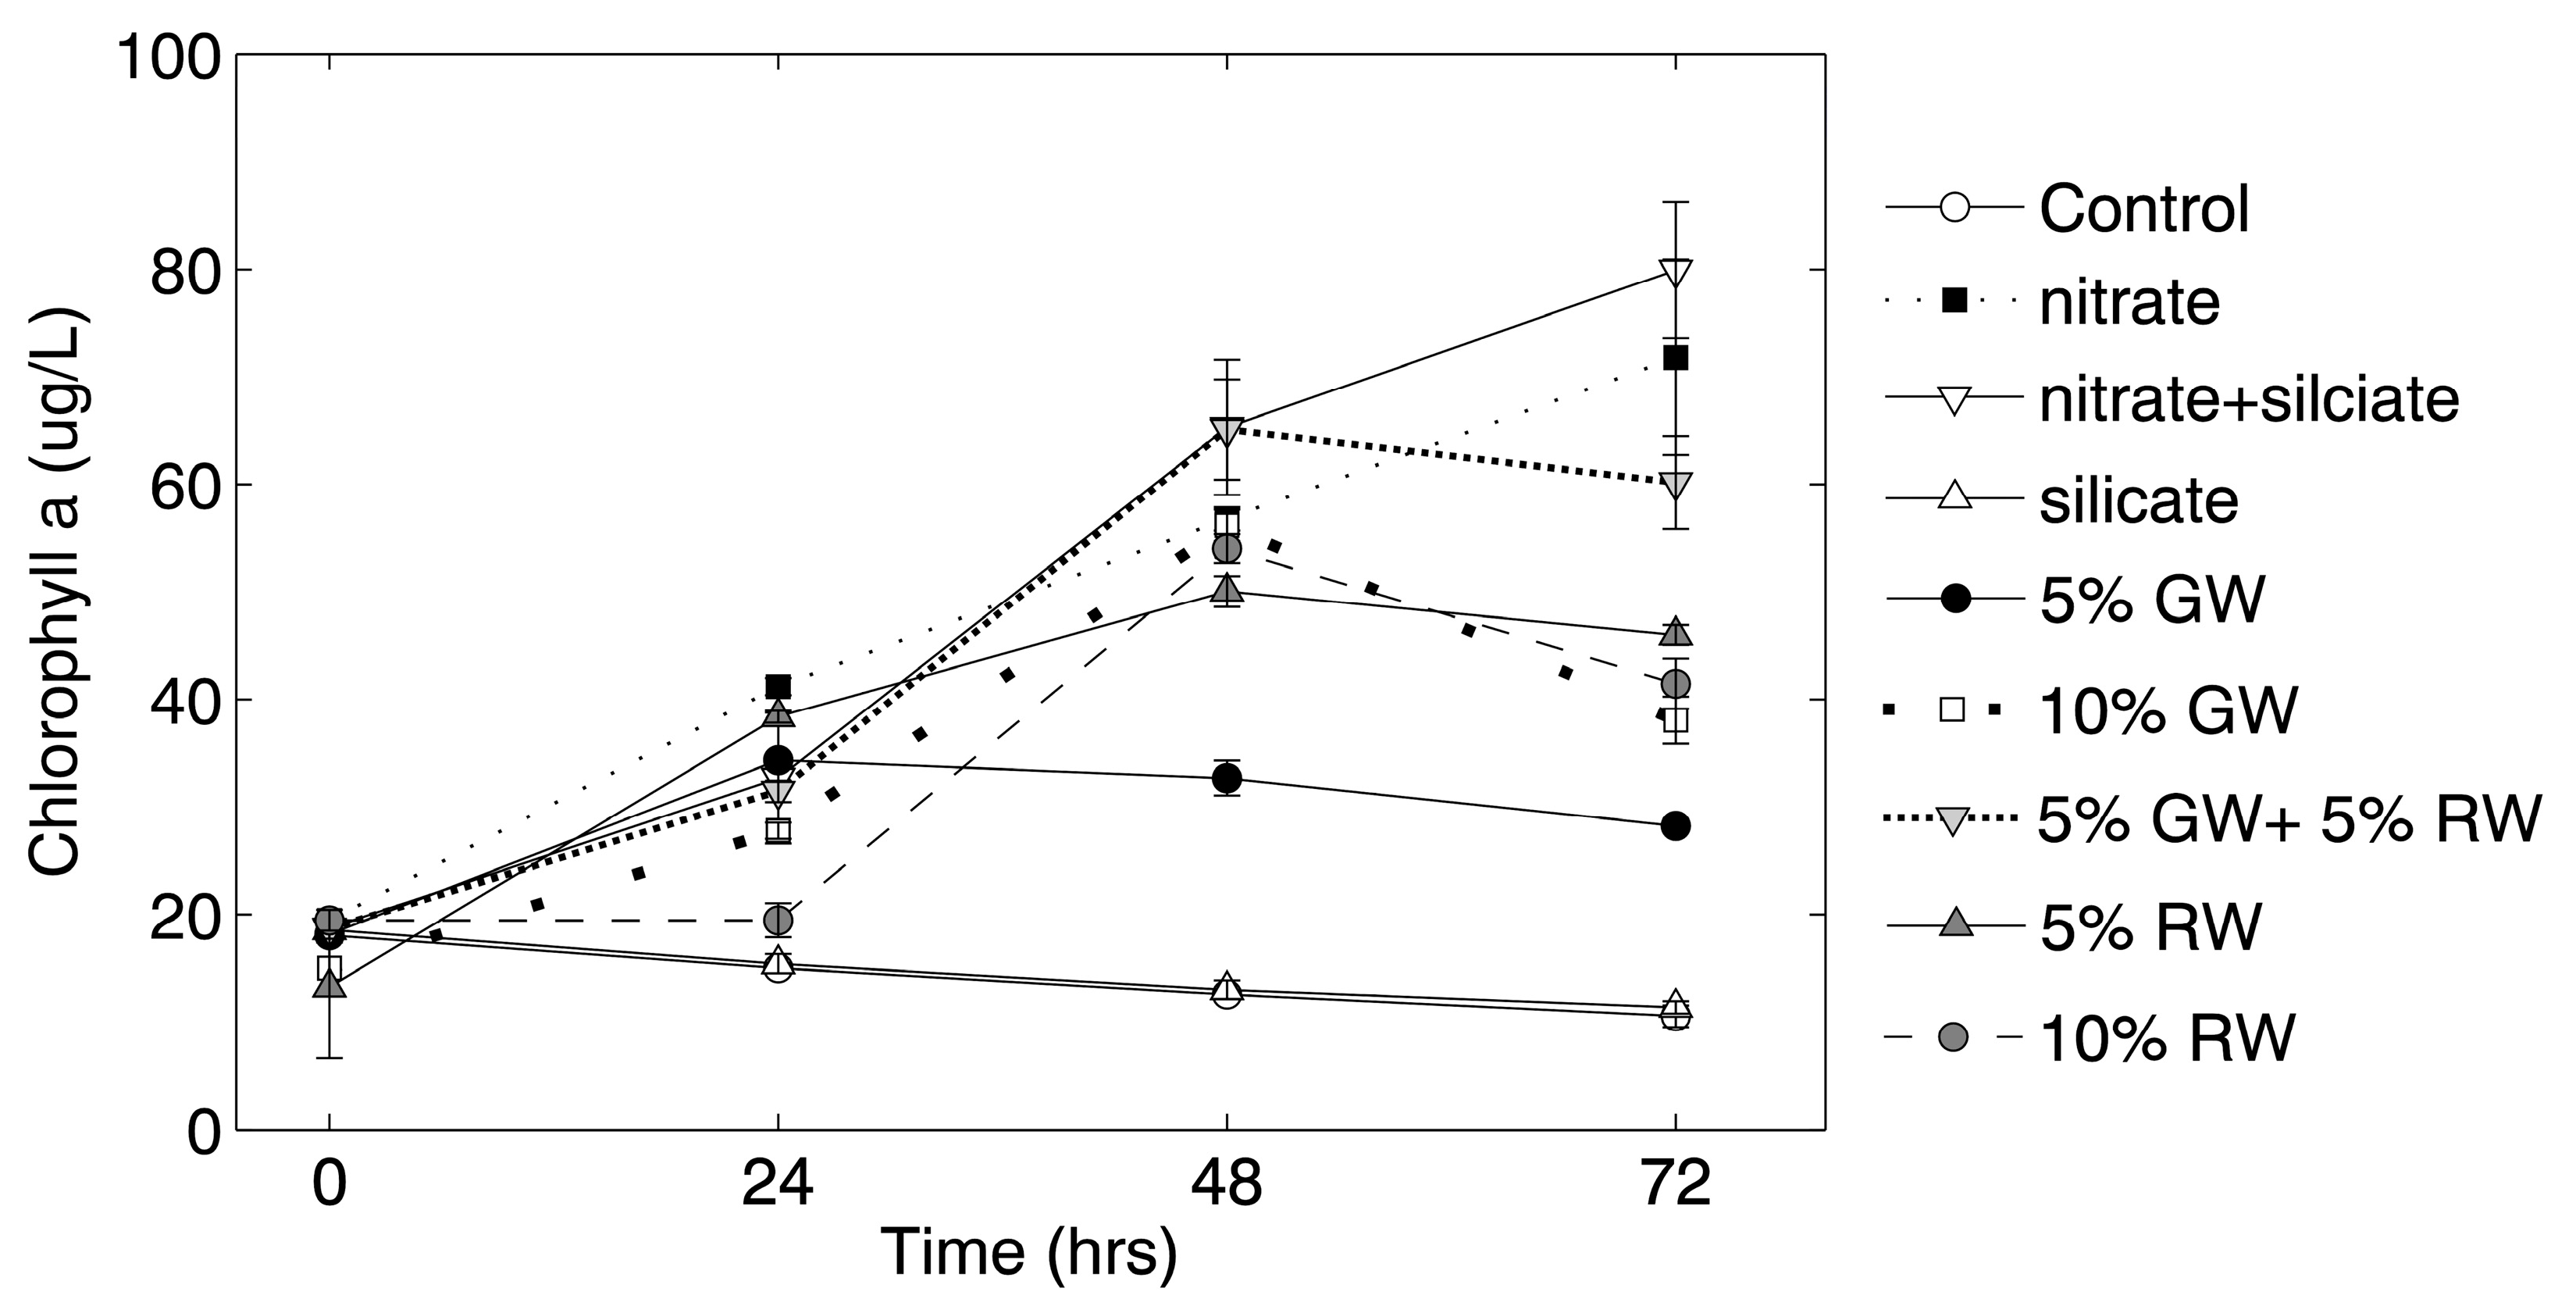
Chlorophyll
a concentrations in the nitrate and nitrate + silicate treatments continued to increase throughout the 72 h experiment, whereas chlorophyll
a concentrations in all other treatments (except for the control and silicate treatment) only increased through the 48 h time point (
Figure 2). Significance (ANOVA and Tukey-Kramer,
p ≤ 0.05) was tested against the control at the 72-h time point, and all of the treatment groups except for the silicate and 5% groundwater were significantly higher in chlorophyll
a than the control.
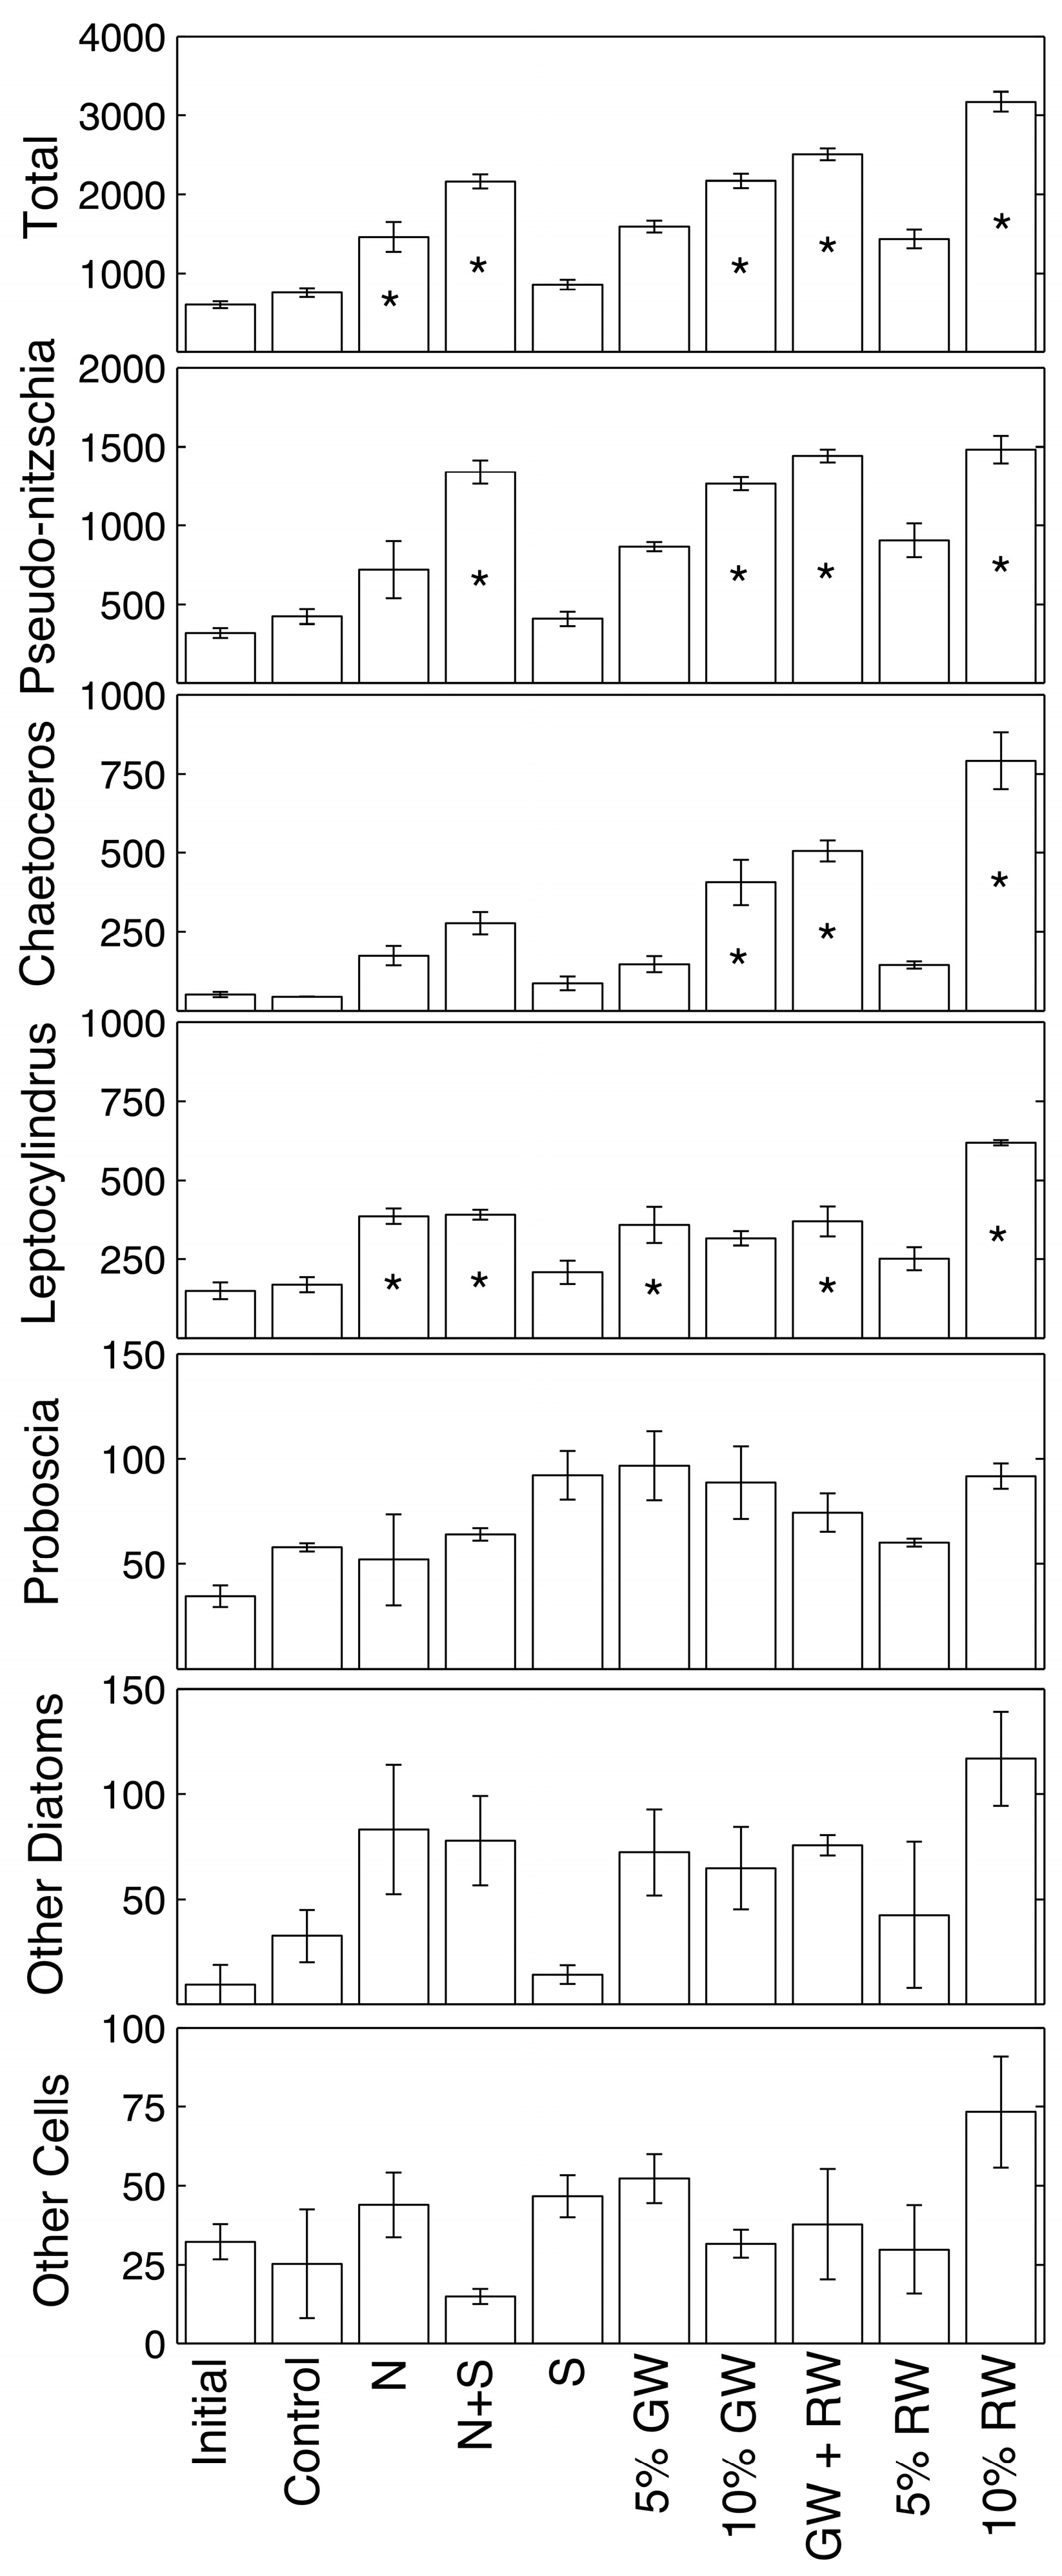
Phytoplankton cell counts and statistical difference from the control are shown in
Figure 3 for samples collected at the 72 h time point (ANOVA and Tukey-Kramer,
p ≤ 0.05). Overall, total absolute cell abundances of all the genera combined were significantly higher than the control in the nitrate, nitrate + silicate, 10% groundwater, 5% groundwater + 5% river water, and 10% river water treatments. The most abundant genera were
Pseudo-nitzschia,
Chaetoceros,
Leptocylindrus, and
Proboscia.
Pseudo-nitzschia spp. was only significantly more abundant relative to the control in treatments that included a high amount of both nitrate and silicate (nitrate + silicate, 10% groundwater, 5% groundwater + 5% river water, and 10% river water).
Chaetoceros spp. showed fewer statistically significant increases, where only the treatments receiving at least 10% ground/river water increased significantly.
Leptocylindrus spp. significantly increased beyond the control in the nitrate, nitrate + silicate, 5% groundwater, 5% groundwater + 5% river water, and 10% river water treatments. The diatom genus
Proboscia, along with other less abundant genera, showed no significant differences in absolute abundance when compared to the control.
Results of the Bray-Curtis dissimilarity test are shown in
Table 3. The Bray-Curtis results support the trends shown in
Figure 3, as all of the nitrate and nitrate + silicate containing treatments had a dissimilarity score of <0.2500. The most similar treatments within this group were the nitrate + silicate, 10% groundwater, and 5% groundwater + 5% river water treatments, which all had a dissimilarity score of <0.1000. The control and silicate treatments were similar, with a dissimilarity score of 0.1056. The most dissimilar treatment from the control was the 10% river water treatment, with a score of 0.6171.
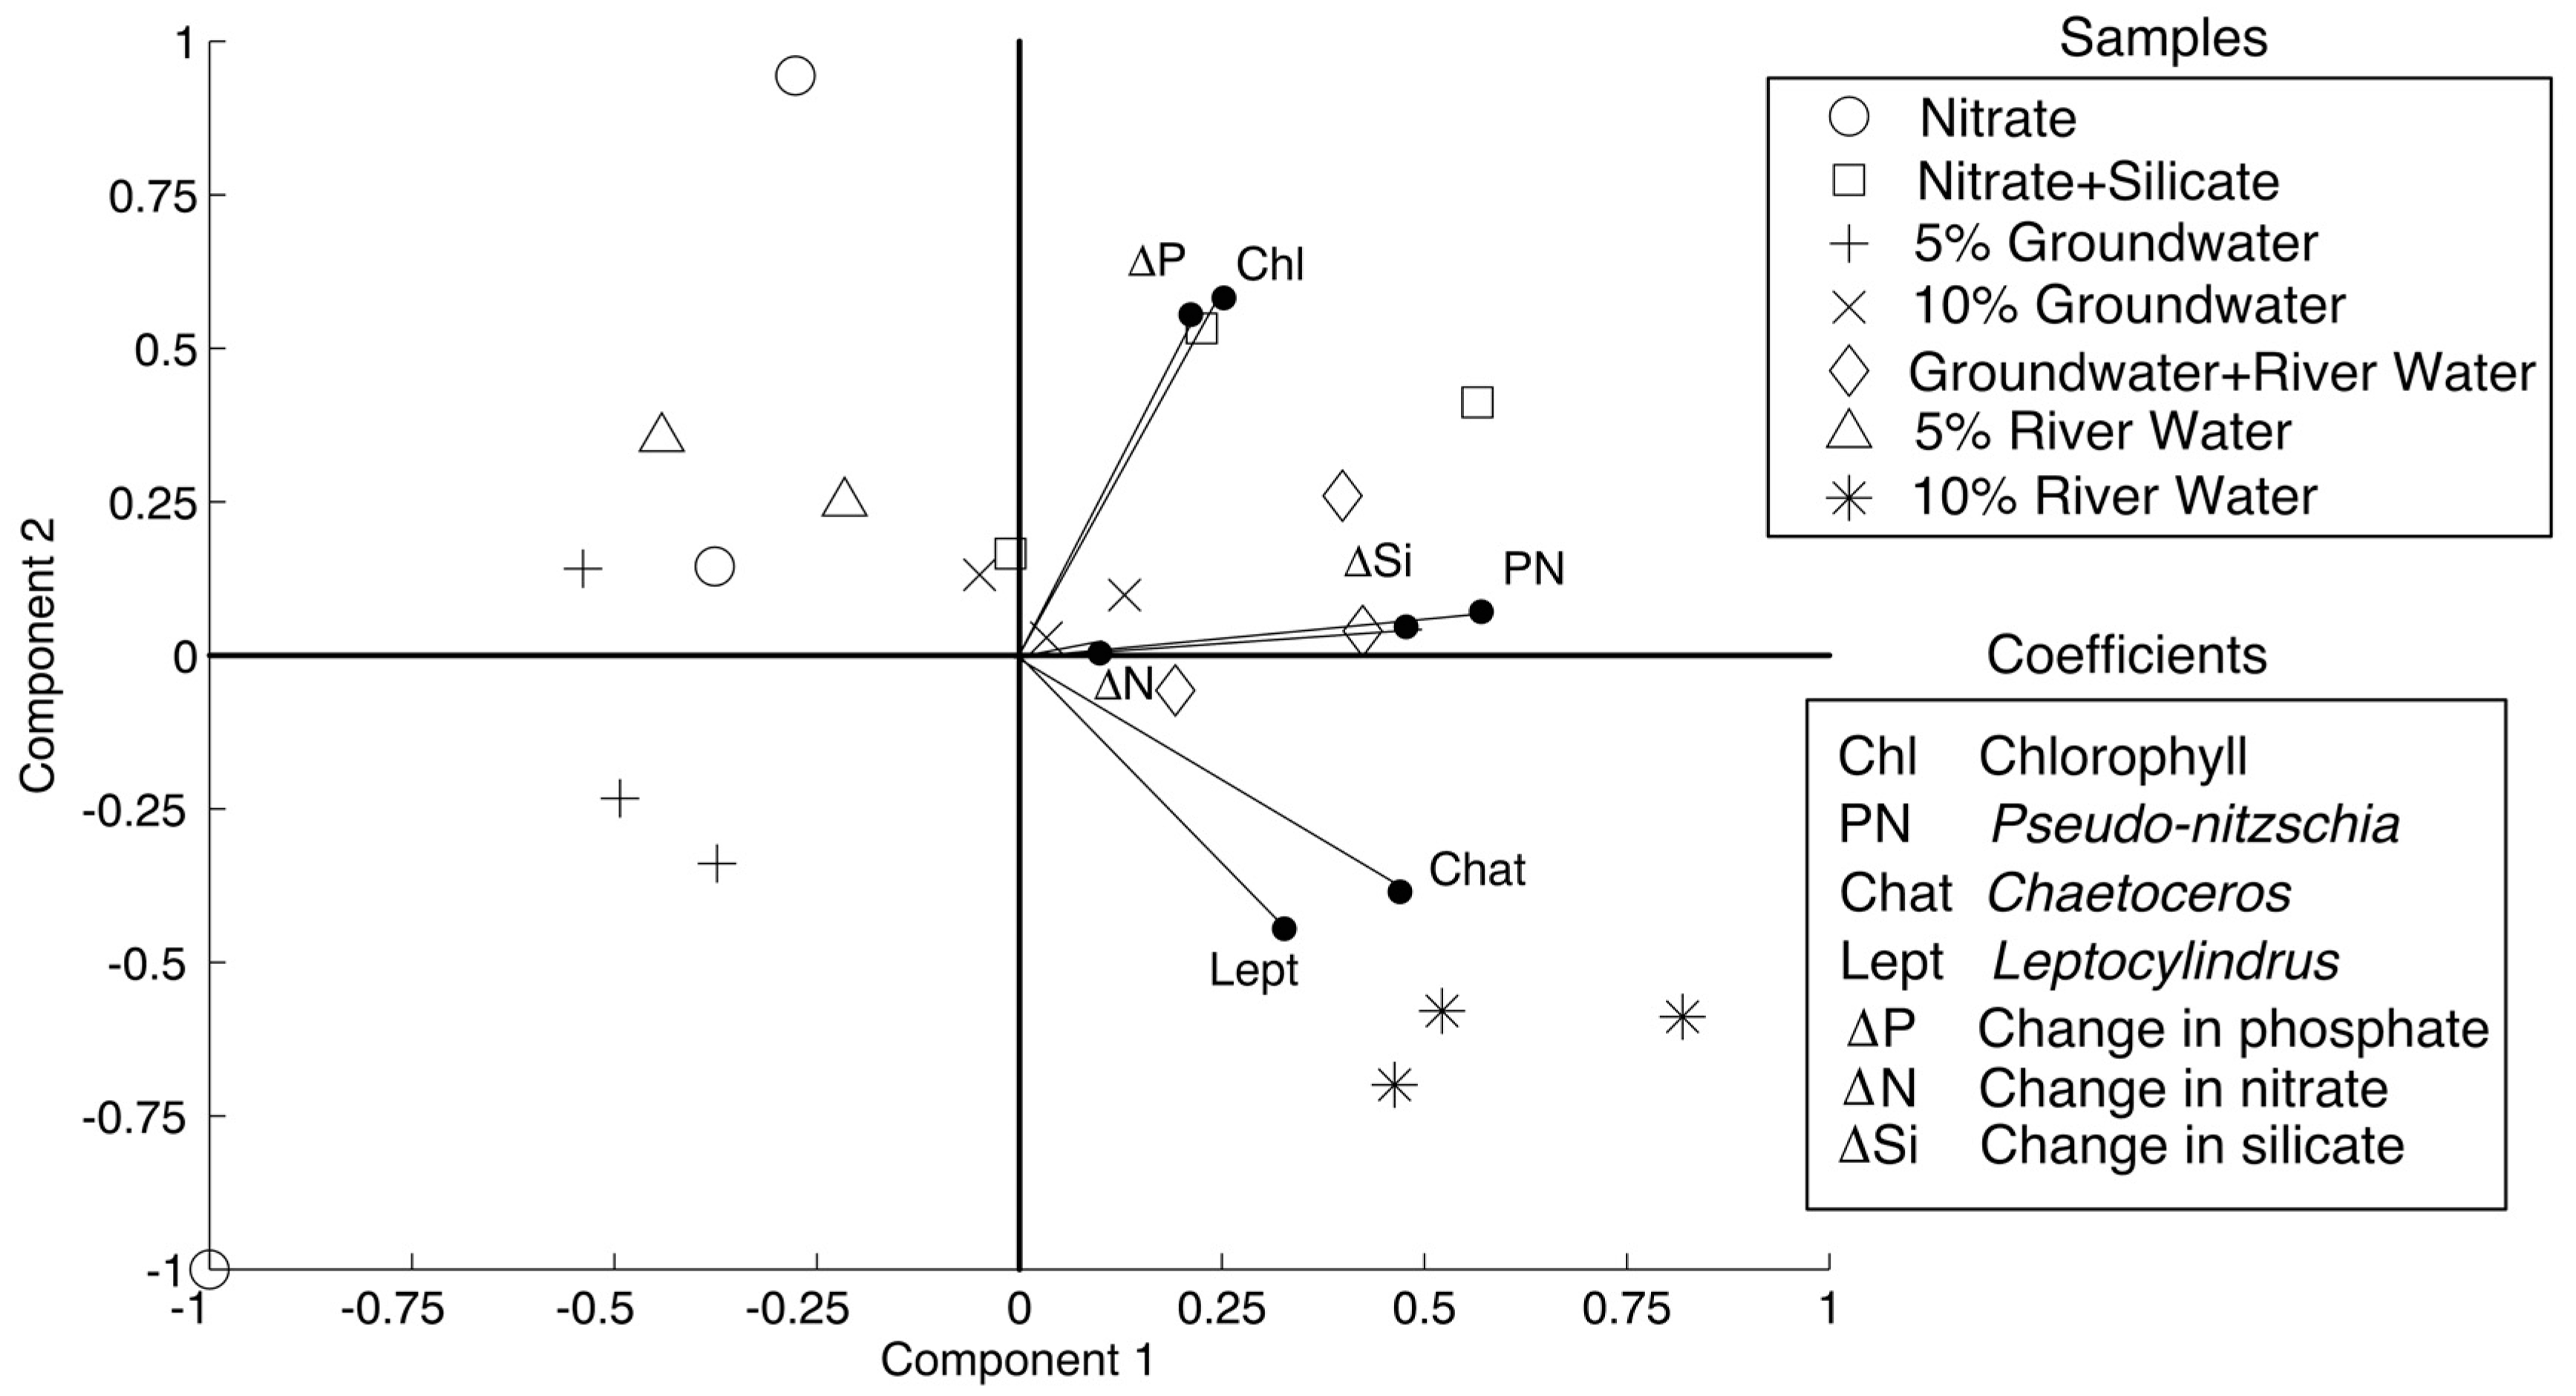
PCA results are shown in
Figure 4, with components 1 and 2 accounting for 41% and 23% of the variability. The treatments that are considered in the PCA (treatments that showed statistically different responses in phytoplankton than the control) were nitrate, nitrate + silicate, 5% groundwater, 10% groundwater, 5% groundwater + 5% river water, 5% river water, and 10% river water. As per the methods, the variable coefficients that were used were change in nitrate, silicate, and phosphate concentrations, chlorophyll
a concentrations, and absolute abundance of the diatoms
Pseudo-nitzschia spp.,
Chaetoceros spp., and
Leptocylindrus spp. All of the variable coefficients were positively correlated with component one. The variables that most strongly correlated were abundance of
Pseudo-nitzschia spp.,
Chaetoceros spp., and
Leptocylindrus spp., and change in silicate concentration with coefficients of 0.57, 0.47, 0.32, and 0.47, respectively. The data diverged with respect to component 2, with change in nutrient concentrations, chlorophyll
a concentration, and
Pseudo-nitzschia spp. abundance positively correlating with component 2, similar to the nitrate + silicate, 10% groundwater, and 5% groundwater + 5% river water treatment data. The
Chaetoceros spp. and
Leptocylindrus spp. variables negatively correlated with component 2, similar to the 10% river water data. The variables that positively correlated most strongly with component 2 were chlorophyll
a and change in phosphate (coefficients of 0.58 and 0.55, respectively), while the variables that strongly negatively correlated were
Chaetoceros spp. and
Leptocylindrus spp. (coefficients of −0.39 and −0.45, respectively).
Pseudo-nitzschia spp. correlated most strongly with the change in silicate concentrations, while
Chaetoceros spp. and
Leptocylindrus spp. correlated most strongly with each other. That is larger changes in silicate concentrations corresponded with higher abundances of
Pseudo-nitzschia spp. and higher abundances of
Chaetoceros spp. corresponded with higher abundances of
Leptocylindrus spp.
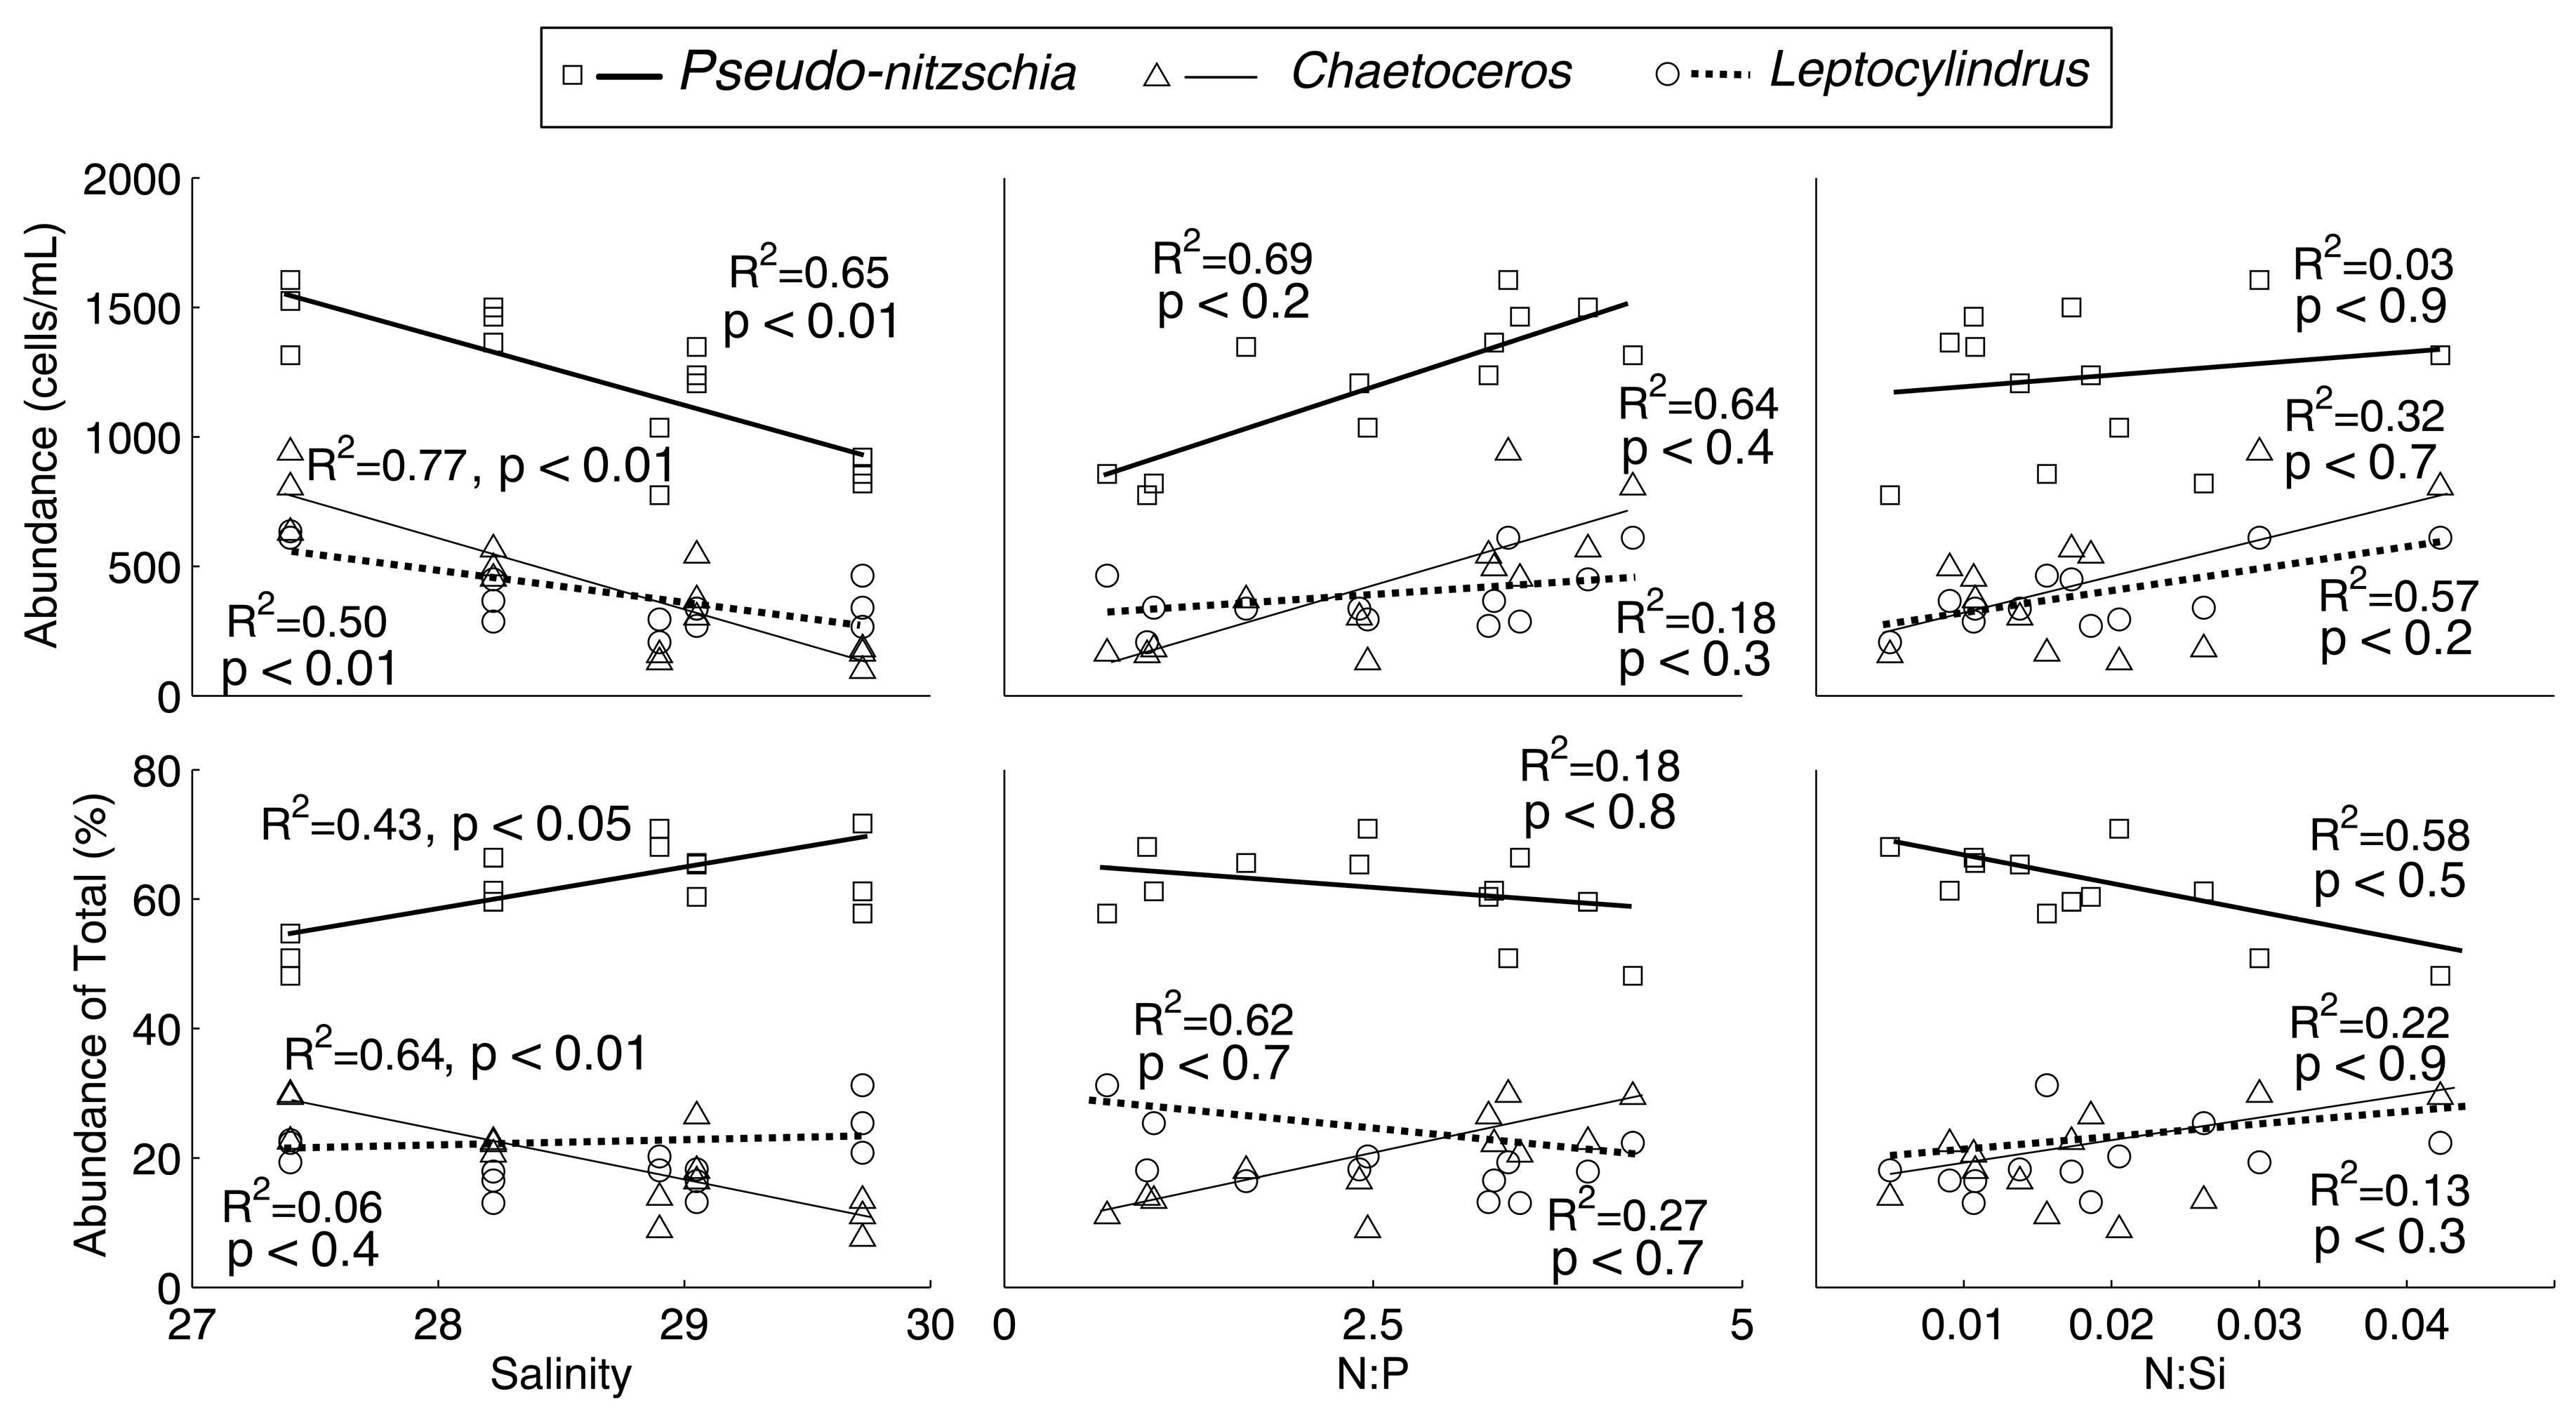
To determine the effect of salinity and nutrient ratios on relative and absolute abundances of
Pseudo-nitzschia spp.,
Chaetoceros spp., and
Leptocylindrus spp., linear regressions and
t-tests for statistical significance of slope were performed (
Figure 5). While there were trends with increasing or decreasing absolute and relative abundance of the species with respect to salinity and nutrient ratios, the only significant results were with respect to salinity.
Pseudo-nitzschia spp.,
Chaetoceros spp., and
Leptocylindrus spp. absolute abundances all significantly increased with decreasing salinity (
p < 0.01). With respect to relative abundance,
Pseudo-nitzschia spp. was negatively correlated with decreasing salinity (
p < 0.05), and
Chaetoceros spp. was positively correlated with decreasing salinity (
p < 0.01).
4. Discussion
The results of this bioassay experiment with waters from coastal Alaska showed that significant increases in chlorophyll
a and diatom abundances only occurred when nitrate or nitrate + silicate containing treatments were added (this included groundwater and river water). Such an increase in chlorophyll
a and diatom abundance with the addition of nitrate and silicate-containing groundwater is consistent with other incubation [
20,
21] and field studies [
16,
19] at other coastal settings. The growth was so rapid that in many of the natural water (groundwater and river) treatments, nitrate was practically depleted by the end of the experiment, as indicated by the reduction in the rate of chlorophyll
a increase between the 48 h and 72 h time points (
Figure 2) and corresponding low final nitrate concentrations in these treatments (
Figure 1). This growth and nutrient drawdown were likely driven by the extended daylight conditions during the time of the experiment (~22 h of daylight in June). This experiment supports prior observations that groundwater and river water are important sources of nutrients (specifically nitrate and silicate) to phytoplankton in the Gulf of Alaska [
10]. Many sources of nutrients to the Gulf of Alaska have been proposed to support the initial spring diatom bloom, which occurs following stratification. However, this study demonstrates that nutrients that are supplied by groundwater and river water are also able to support phytoplankton growth in this region.
Despite the overall similarities in the response of the phytoplankton in all the nitrate and nitrate + silicate containing treatments (significant increases in chlorophyll
a, and significant decreases in nitrate, phosphate, and usually silicate), the growth responses of individual diatom genera were nevertheless variable across these treatments (
Figure 3,
Table 3). This is reflected in the results of the PCA as well (
Figure 4). Chlorophyll
a concentration and abundances of
Pseudo-nitzschia spp.,
Chaetoceros spp., and
Leptocylindrus spp. and decreases in nitrate, phosphate, and silicate concentrations all correlated with respect to component 1 (
Figure 4), indicating the increase in biomass was driven by consumption of these nutrients. The variables that most strongly correlated with component 1 were abundances of the three diatom genera and a decrease in silicate concentration. This correlation is a result of the significant increases in abundance of
Pseudo-nitzschia spp.,
Chaetoceros spp., and
Leptocylindrus spp., as these diatoms require silicate to synthesize their frustules.
The responses of these genera diverged with respect to component 2 (
Figure 4). Changes in nutrient concentration, chlorophyll
a concentration, and
Pseudo-nitzschia spp. positively correlated with component 2, while the
Chaetoceros spp. and
Leptocylindrus spp. negatively correlated with component 2. This suggests that most of the drawdown of nutrients and increase in biomass was attributed to increased
Pseudo-nitzschia spp. abundance. Indeed, treatments with a significant increase in
Pseudo-nitzschia spp. (nitrate + silicate, 10% groundwater, and 5% groundwater + 5% river water) generally had significant (
p < 0.01) decreases in nitrate, silicate, and phosphate, and had very small dissimilarity scores with respect to community composition (<0.1000).
Chaetoceros spp. and
Leptocylindrus spp. abundances increased most in the 10% river water treatment group (
Figure 3), despite the relatively modest increase in chlorophyll
a in that treatment group (
Figure 2). These genera correlated more strongly with each other than with
Pseudo-nitzschia spp. abundances (
Figure 4). Clearly, an unidentified factor drove these two genera to respond differently than
Pseudo-nitzschia spp. to the treatments (
Figure 4). While based on our experiment alone we cannot exclude lower growth rates of the other genera when compared to
Pseudo-nitzschia spp., we suggest that salinity differences were important, as salinity varied between the water types, and has previously been shown to influence diatom abundance, especially for
Pseudo-nitzschia spp. [
5,
16,
19]. Seasonal fluctuation in salinity is a known driver of phytoplankton community succession in estuaries and coastal waters [
25], and accordingly, salinity is plotted against absolute and percent abundance of each genus in
Figure 5 for the treatments containing a river water or groundwater addition to determine the effect.
All of the diatom species considered here increased significantly in abundance at lower salinities (
p < 0.01;
Figure 5). However, when considering relative abundances,
Chaetoceros spp. was the only genus to significantly increase with a decreasing salinity. Conversely,
Pseudo-nitzschia spp. relative abundances decreased with decreasing salinity (
p < 0.05). This could suggest that
Chaetoceros spp. can better compete with
Pseudo-nitzschia spp. in less saline environments, as
Pseudo-nitzschia spp. prefer higher salinities [
5,
26]. Indeed, the 10% river water treatment (lowest salinity treatment) had the largest increase in
Chaetoceros spp. abundance (
Figure 3). The decreasing relative abundance of
Pseudo-nitzschia spp. is consistent with previous field studies of
Pseudo-nitzschia spp. that found reduced relative abundance of
Pseudo-nitzschia spp. in ocean water impacted by rivers, especially when compared to ocean water that is only impacted by SGD [
19,
27].
Nutrient ratios likely did not contribute to the differences in absolute and relative abundances across treatements, as suggested by the lack of significant slopes (
Figure 5), although all of the diatoms considered here became more abundant under higher
N:
P and
N:
Si ratios. Previous research found a shift toward
Pseudo-nitzschia spp. abundance [
28,
29], and higher domoic acid content in coastal ocean water with lower
N:
P [
27], but that effect was not observed here. This was indicated by the insignificant results, with respect to
Pseudo-nitzschia spp. absolute and relative abundance and nutrient ratios (
p > 0.1). Thus, the divergence with respect to component 2 in the PCA of the different genera must be due to the lower salinity of river water containing treatments.
What can be inferred from the PCA in general is that higher nutrient concentrations had the greatest effect on diatom abundance and chlorophyll
a (41% from component 1), while salinity exerted the second largest effect (23% from component 2), also impacting relative abundance among the diatoms. Specifically, the lower salinity of river water contributed to a lower percent abundance of
Pseudo-nitzschia spp. when compared to other diatom genera. This suggests that, with all other factors being equal, areas of the Gulf of Alaska more dominated by SGD (which is typically brackish) will have a higher relative abundance of
Pseudo-nitzschia spp., whereas areas that are dominated by rivers (low salinity) will have higher relative abundances of
Chaetoceros spp. and
Leptocylindrus spp. This suggestion warrants further study in the future. A similar hypothesis with respect to
Pseudo-nitzschia spp. has been proposed for the Gulf of Mexico [
19], lending credibility to our suggestion.
The implications of this study for the Gulf of Alaska are that while the Gulf is nitrate limited, diatom genera become co-limited by nitrate and silicate as they grow and rapidly deplete both nutrients. Both of these findings are consistent with previous studies that showed a decrease in nitrate and silicate in coastal Alaskan waters after the initial spring bloom [
2]. Groundwater and river water are both sources of nitrate and silicate, with similar concentrations at our study site (
Table 1), and as calculated in previous studies [
7,
10,
23,
30]. A previous study using scaling analysis argued that groundwater may be a greater source of these nutrients to the Gulf of Alaska than river water [
10], thus increasing the likelihood for high occurrences of
Pseudo-nitzschia spp. Further measurement of SGD and river fluxes into the Gulf are needed to determine their relative nutrient contributions, taking into account the heterogeneity of submarine groundwater discharge, and how river water discharge could change in the future due to climate warming.
This study also highlights that the effect of river water and groundwater on diatoms in the Gulf of Alaska, and likely elsewhere, is not solely based on nutrient loading. Other factors that are different between groundwater and river water (especially salinity) also affect their growth, a finding that is consistent with studies at other sites that compared diatom response in SGD-impacted and river impacted ocean sites [
16,
19]. This study was the first to document and compare the effects of groundwater and river water on multiple diatom genera. The lower salinity of river water supported a greater relative abundance of
Chaetoceros spp. and
Leptocylindrus spp., while the higher salinity of groundwater (relative to river water) supported a community that is dominated by
Pseudo-nitzschia spp. These chemical differences between groundwater and river water suggest mechanisms by which the two water types could have differing effects on diatom populations in coastal areas, despite both water types being a source of the nutrients nitrate and silicate.
The effect of river water on diatom genera may increase throughout the summer. In the summer, the upper water column becomes fresher due to river discharge to the Gulf [
8,
9]. Indeed, a freshening of up to four salinity units is typical of this area due to strong stratification and steady river discharge [
31]. As freshening increases over summer, results of this experiment suggest that conditions that favor
Pseudo-nitzschia spp. decrease as summer progresses. Moreover, river discharge to the Gulf of Alaska is predicted to increase in the future as climate warming increases glacial melt and the amount of rainfall increases [
32]. Indeed, the surface layer of the Gulf of Alaska has been freshening for several decades [
33]. The sensitivity of these common diatom genera to salinity suggests that future changes in phytoplankton community composition could occur, which would affect food webs and biogeochemical cycles in the Gulf.


