
Flood Risk Analysis in Lower Part of Markham River Based on Multi-Criteria Decision Approach (MCDA)


Abstract
:
1. Introduction
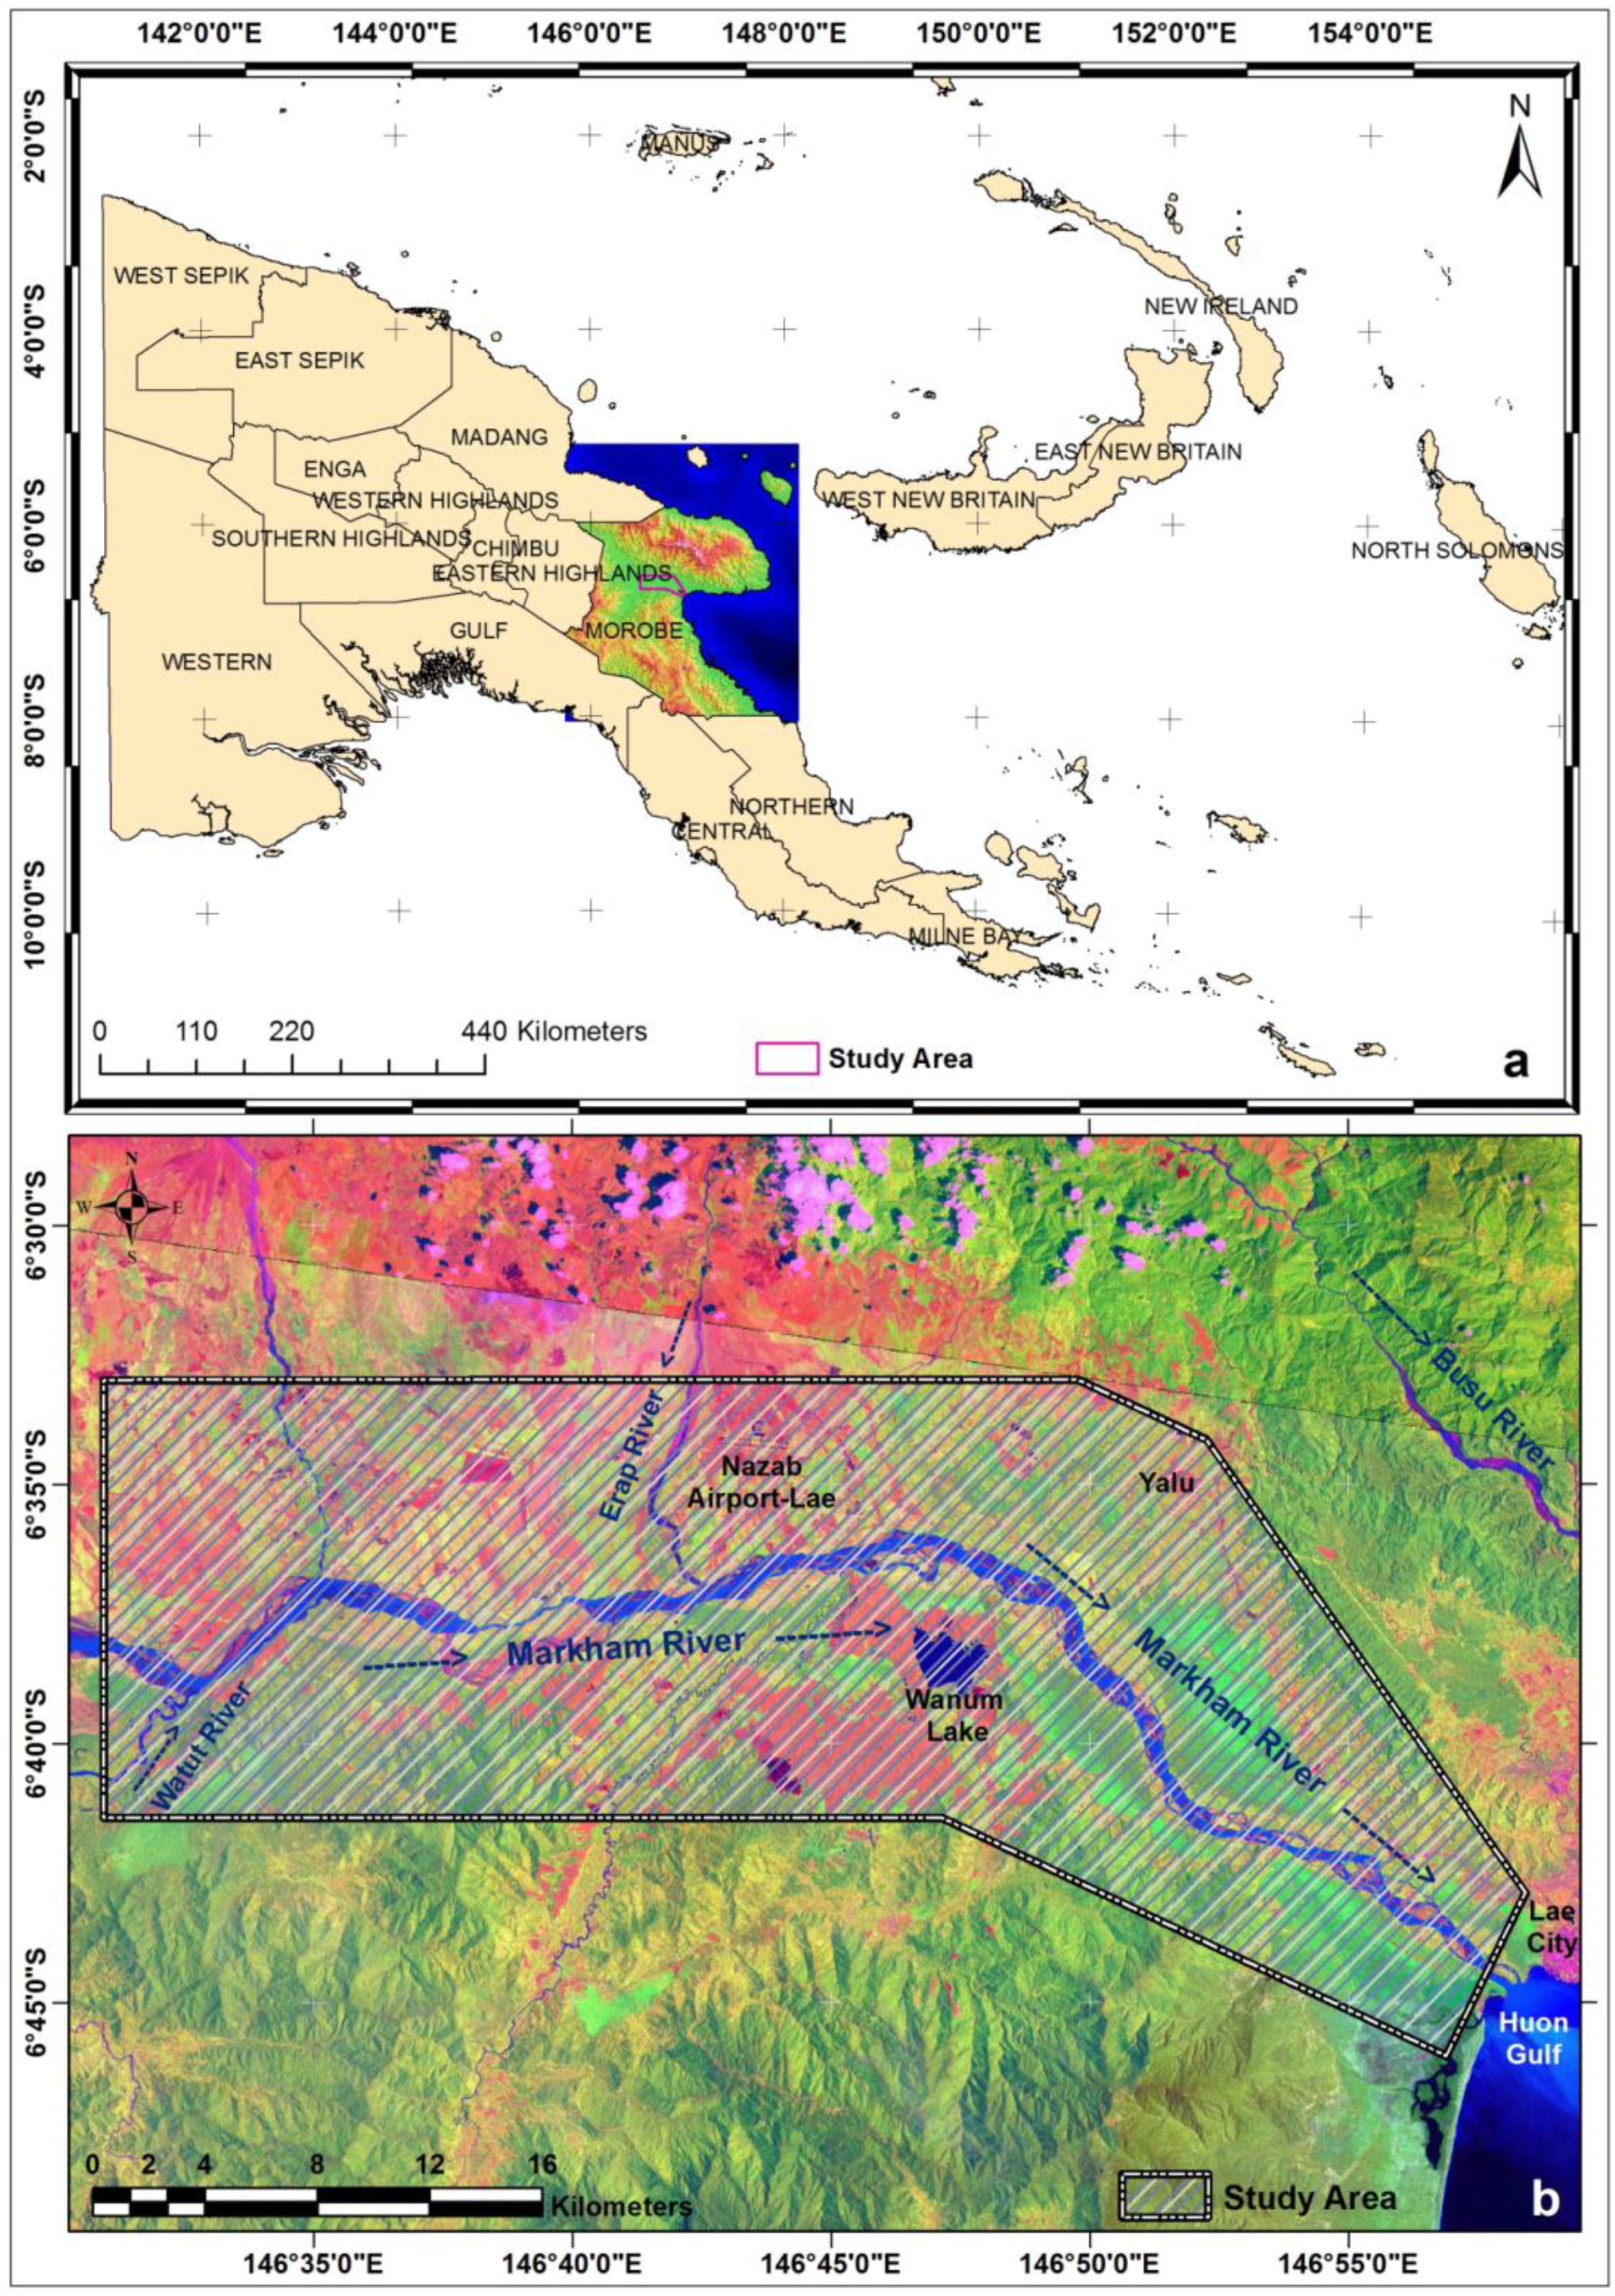
2. Study Area and Materials Used
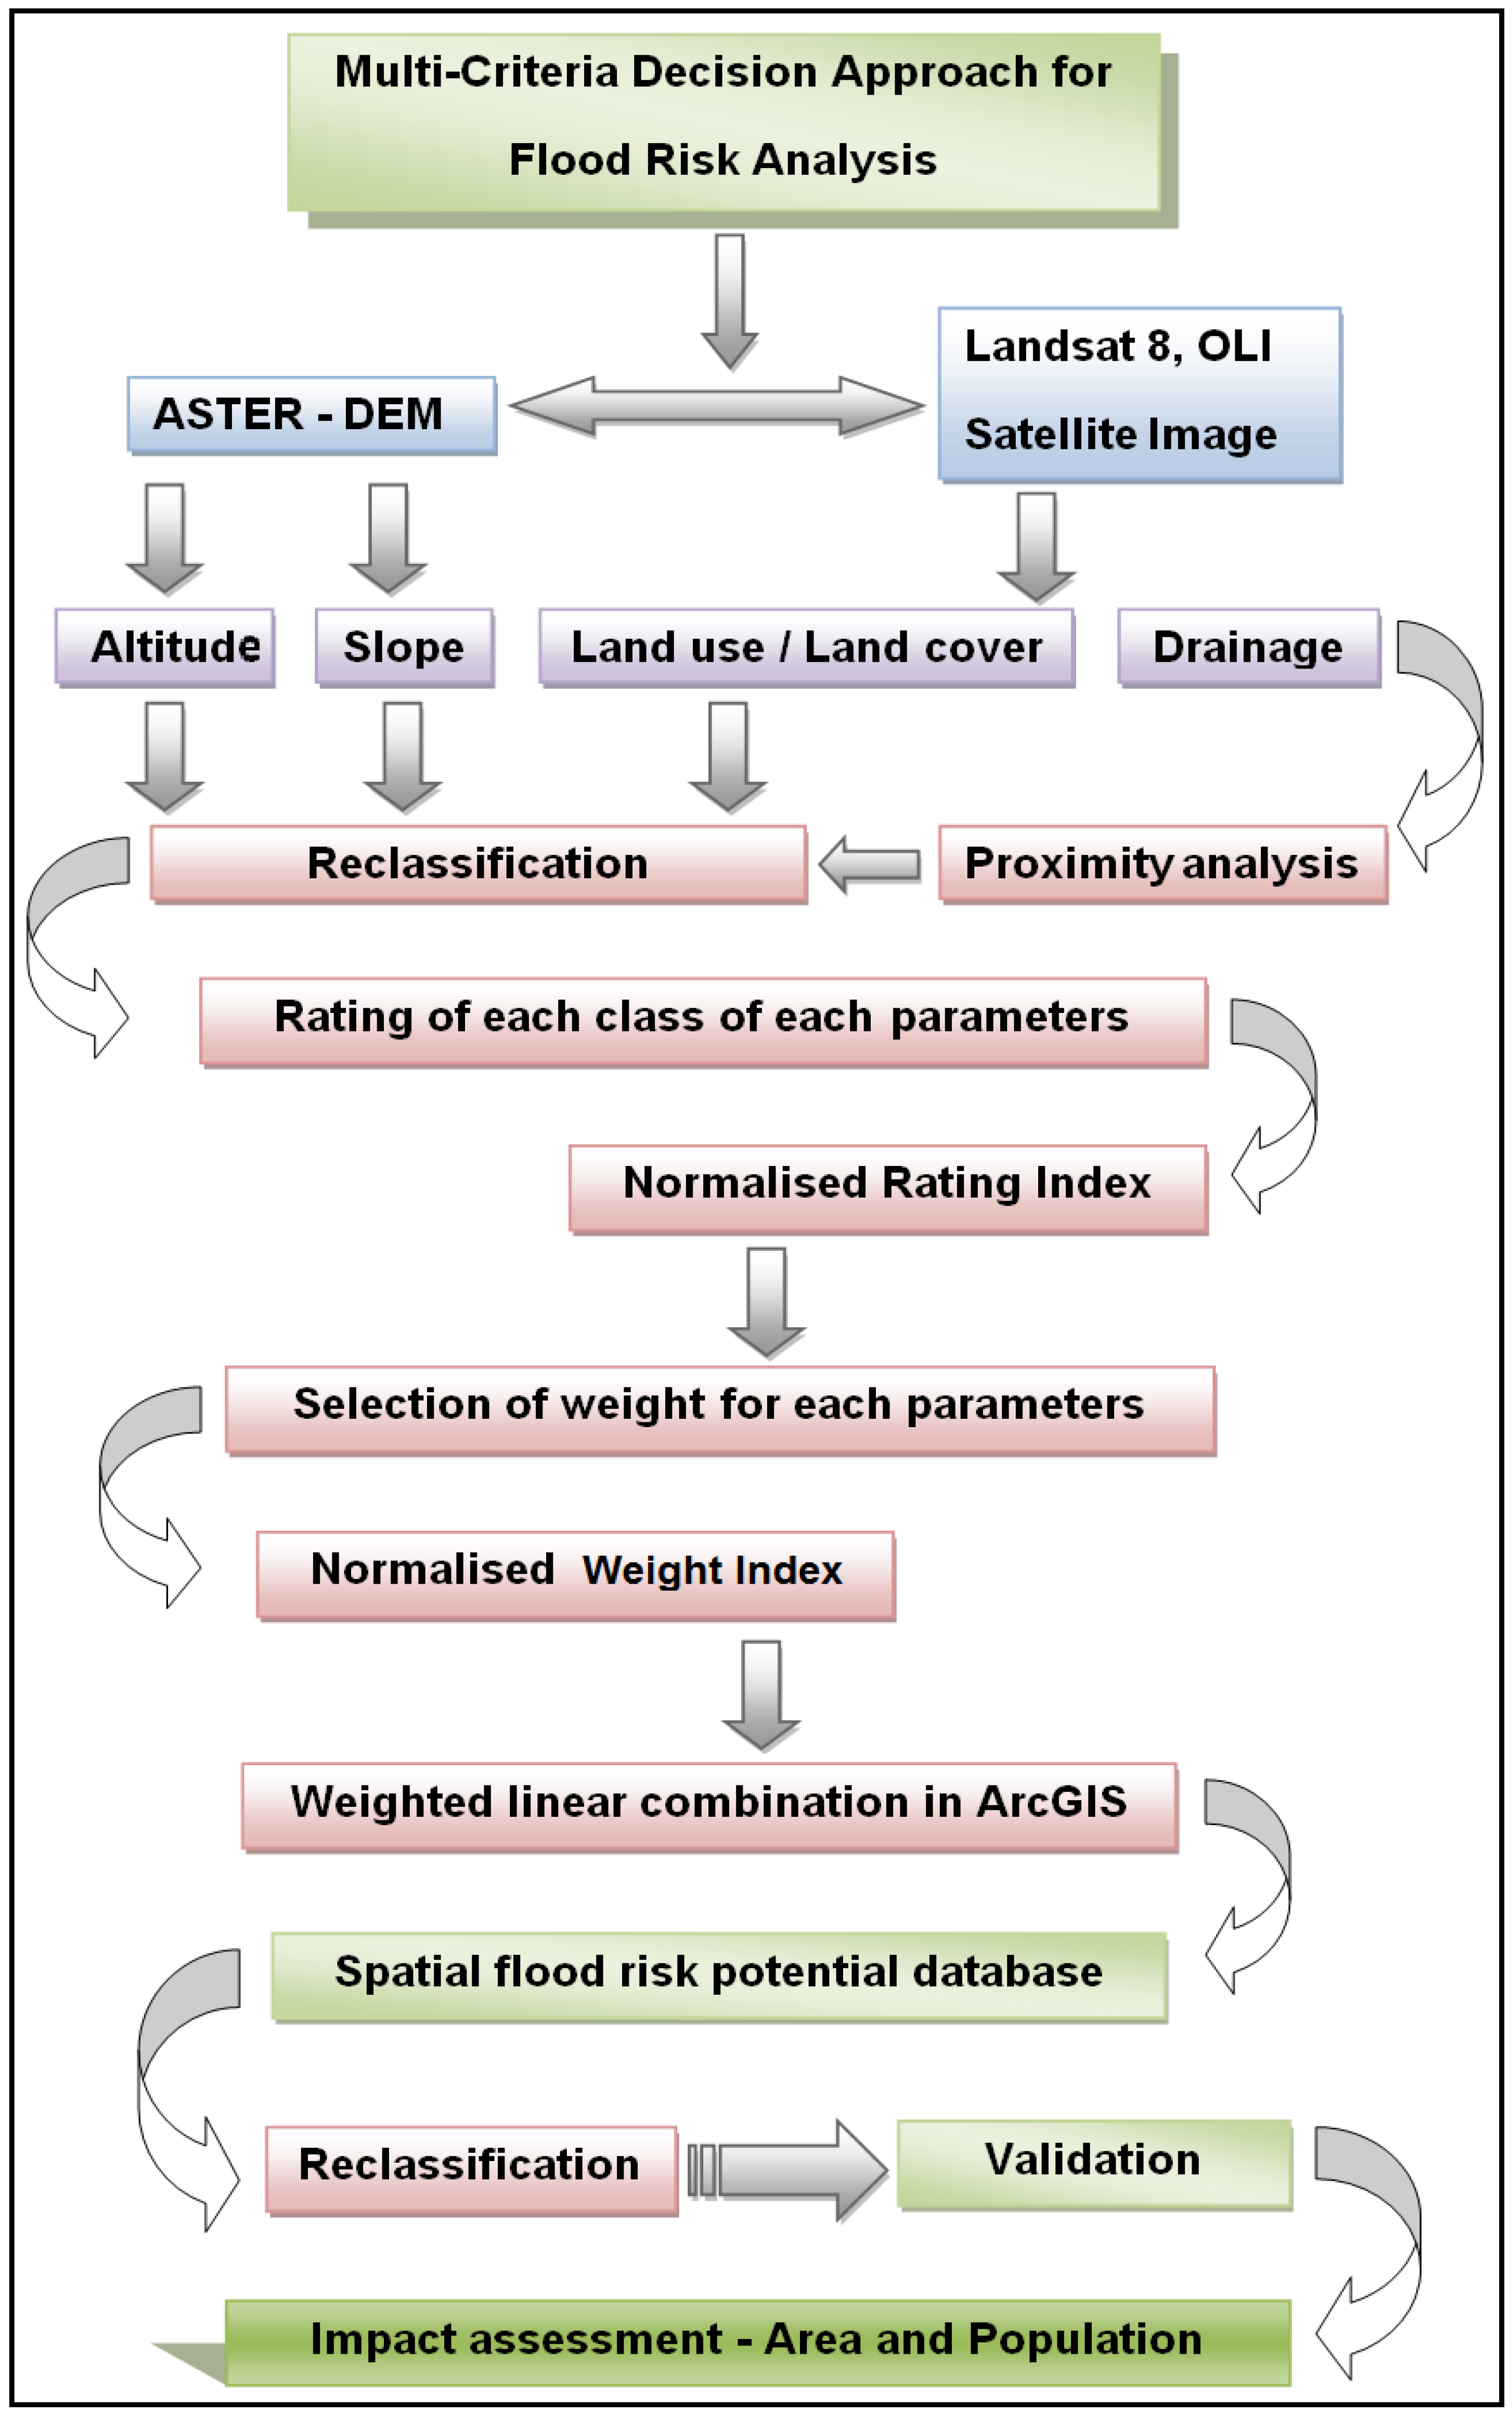
3. Methodology
4. Result and Discussions
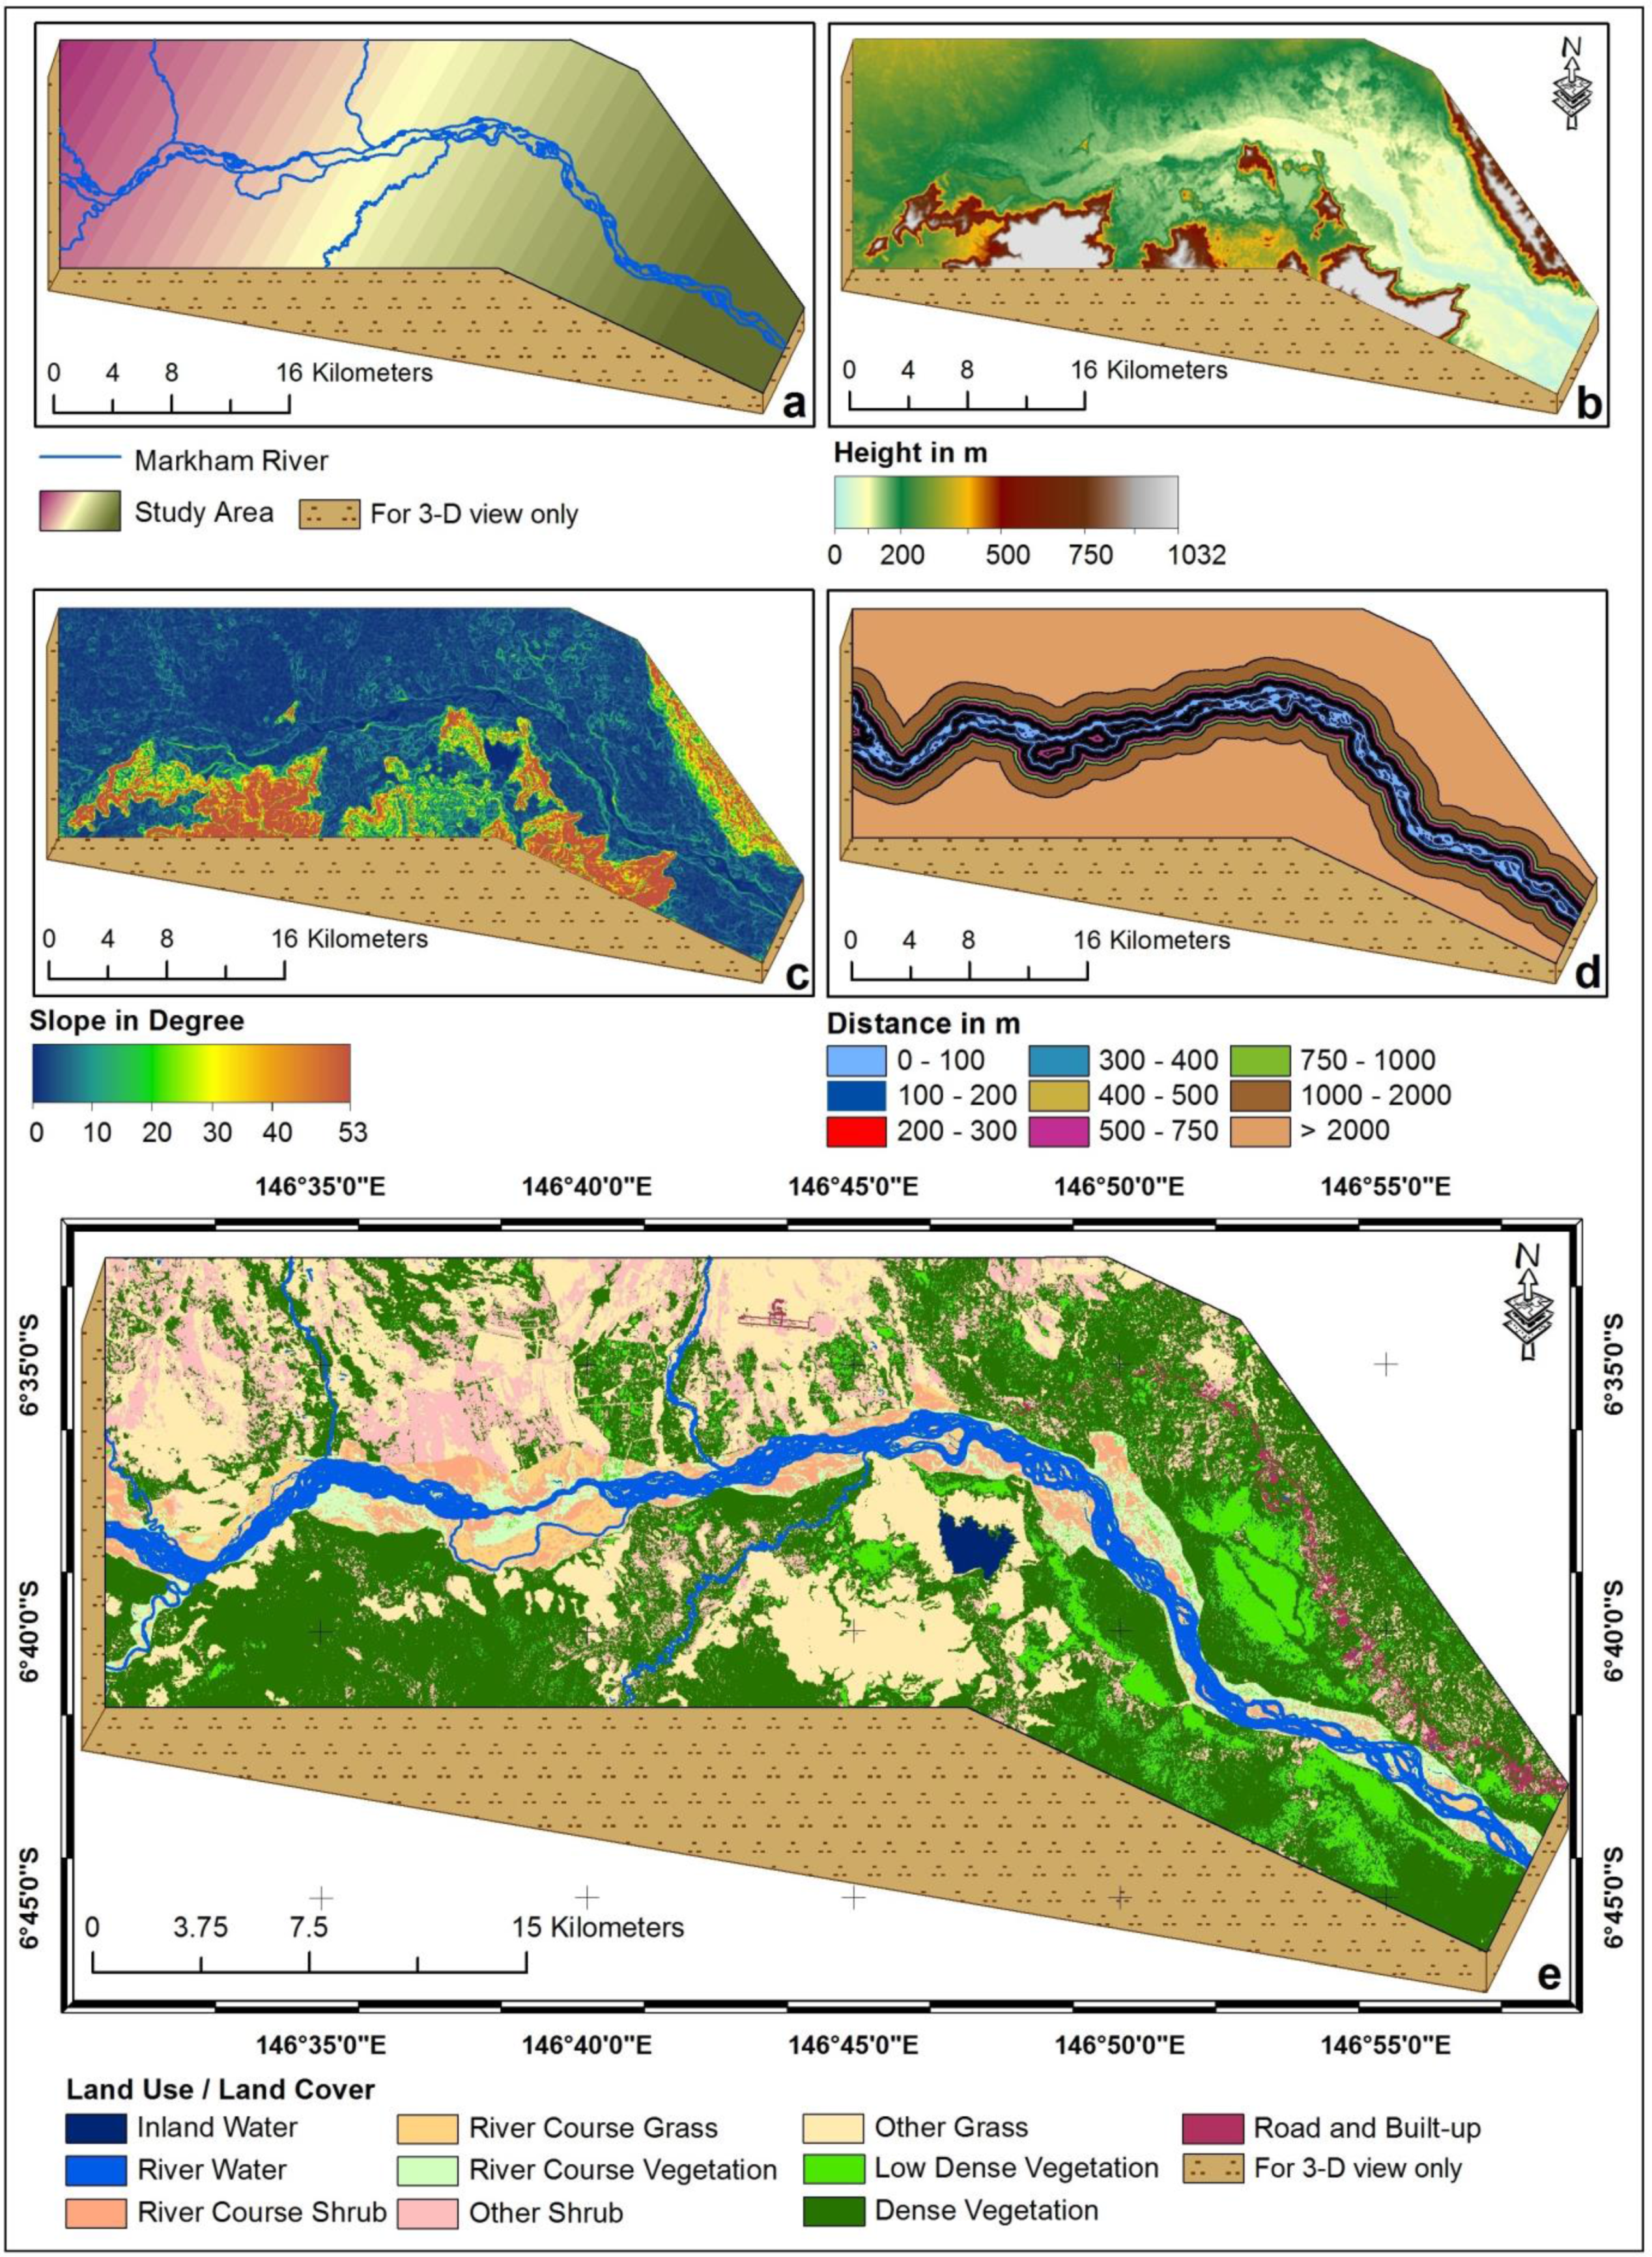
4.1. Land Use/Land Cover
4.2. Elevation and Slope
5. Conclusion
Acknowledgments
Author Contributions
Conflict of Interest
References
- Merz, B.; Kreibich, H.; Schwarze, R.; Thieken, A. Assessment of economic flood damage. Nat. Hazard Earth Syst. Sci. 2010, 10, 1697–1724. [Google Scholar] [CrossRef]
- Hudson, P.; Botzen, W.J.W.; Kreibich, H.; Bubeck, P.; Aerts, J.C.J.H. Evaluating the effectiveness of flood damage mitigation measures by the application of propensity score matching. Nat. Hazards Earth Syst. Sci. 2014, 14, 1731–1747. [Google Scholar] [CrossRef]
- WHO-World Health Organization. Disaster Data-key Trends and Statistics in World Disasters Report; WHO: Geneva, Switzerland, 2003; Available online: http://www.ifrc.org/PageFiles/89755/2003/43800-WDR2003_En.pdf (accessed on 5 April 2016).
- Huang, X.; Tan, H.; Zhou, J.; Yang, T.; Benjamin, A.; Wen, S.W.; Li, S.; Liu, A.; Li, X.; Fen, S.; Li, X. Flood hazard in Hunan province of China: An economic loss analysis. Nat. Hazards 2008, 47, 65–73. [Google Scholar] [CrossRef]
- Markantonis, V.; Meyer, V.; Lienhoop, N. Evaluation of the environmental impacts of extreme floods in the Evros River basin using Contingent Valuation Method. Nat. Hazards 2013, 69, 1535–1549. [Google Scholar] [CrossRef]
- Samanta, S.; Koloa, C. Modelling Coastal Flood Hazard Using ArcGIS Spatial Analysis tools and Satellite Image. Int. J. Sci. Res. 2014, 3, 961–967. [Google Scholar]
- Xu, C.; Chen, Y.; Chen, Y.; Zhao, R.; Ding, H. Responses of surface runoff to climate change and human activities in the arid region of Central Asia: A case study in the Tarim River Basin, China. Environ. Manag. 2013, 51, 926–938. [Google Scholar] [CrossRef] [PubMed]
- Poussin, J.K.; Botzen, W.J.W.; Aerts, J.C.J.H. Factors of influence on flood damage mitigation behavior by households. Environ. Sci. Policy 2014, 40, 69–77. [Google Scholar] [CrossRef]
- Patel, D.P.; Srivastava, P.K. Flood hazards mitigation analysis using remote sensing and GIS: Correspondence with town planning scheme. Water Resour. Manag. 2013, 27, 2353–2368. [Google Scholar] [CrossRef]
- Moel, H.D.; Vliet, M.V.; Aerts, J.C.J.H. Evaluating the effect of flood damage-reducing measures: A case study of the unembanked area of Rotterdam, the Netherlands. Reg. Environ. Change 2014, 14, 895–908. [Google Scholar]
- Althuwaynee, O.F.; Pradhan, B.; Park, H.J.; Lee, J.H. A novel ensemble bivariate statistical evidential belief function with knowledge-based analytical hierarchy process and multivariate statistical logistic regression for landslide susceptibility mapping. Catena 2014, 114, 21–36. [Google Scholar] [CrossRef]
- Van, W.C.J.; Rengers, N.; Soeters, R. Use of geomorphological information in indirect landslide susceptibility assessment. Nat. Hazards 2003, 30, 399–419. [Google Scholar]
- Lee, M.J.; Kang, J.E.; Jeon, S. Application of frequency ratio model and validation for predictive flooded area susceptibility mapping using GIS. In Proceedings of the Geoscience and Remote Sensing Symposium (IGARSS), Munich, Germany, 22–27 July 2012; pp. 895–898.
- Tehrany, M.S.; Pradhan, B.; Mansor, S.; Ahmad, N. Flood susceptibility assessment using GIS-based support vector machine model with different kernel types. Catena 2015, 125, 91–101. [Google Scholar] [CrossRef]
- Stefanidis, S.; Stathis, D. Assessment of flood hazard based on natural and anthropogenic factors using analytic hierarchy process (AHP). Nat. Hazards 2013, 68, 569–585. [Google Scholar] [CrossRef]
- Pradhan, B. Use of GIS-based fuzzy logic relations and its cross application to produce landslide susceptibility maps in three test areas in Malaysia. Environ. Earth Sci. 2011, 63, 329–349. [Google Scholar] [CrossRef]
- Pradhan, B. Flood susceptible mapping and risk area delineation using logistic regression, GIS and remote sensing. J. Spat. Hydrol. 2010, 9, 1–18. [Google Scholar]
- Samanta, S.; Pal, D.K.; Lohar, D.; Pal, B. Interpolation of climate variables and temperature modeling. Theor. Appl. Climatol. 2012, 107, 35–45. [Google Scholar] [CrossRef]
- Kia, M.B.; Pirasteh, S.; Pradhan, B.; Rodzi, M.A.; Sulaiman, W.N.A.; Moradi, A. An artificial neural network model for flood simulation using GIS: Johor River Basin, Malaysia. Environ. Earth Sci. 2012, 67, 251–264. [Google Scholar] [CrossRef]
- Lohani, A.K.; Goel, N.K.; Bhatia, K.K.S. Improving real time flood forecasting using fuzzy inference system. J. Hydrol. 2014, 509, 25–41. [Google Scholar] [CrossRef]
- Tehrany, M.S.; Pradhan, B.; Jebur, M.N. Flood susceptibility mapping using a novel ensemble weights-of-evidence and support vector machine models in GIS. J. Hydrol. 2014, 512, 332–343. [Google Scholar] [CrossRef]
- Koloa, C.; Samanta, S. Development Impact Assessment Along Merkham River through Remote Sensing and GIS Technology. Int. J. Asian Acad. Res. Ass. 2013, 5, 26–41. [Google Scholar]
- Malczewski, J. GIS-based multicriteria decision analysis: A survey of the literature. Int. J. Geogr. Inf. Sci. 2006, 20, 703–726. [Google Scholar] [CrossRef]
- Scheuer, S.; Haase, D.; Meyer, V. Exploring multicriteria flood vulnerability by integrating economic, social and ecological dimensions of flood risk and coping capacity: From a starting point view towards an end point view of vulnerability. Nat. Hazards 2011, 58, 731–751. [Google Scholar] [CrossRef]
- Solin, L. Spatial variability in the flood vulnerability of urban areas in the headwater basins of Slovakia. Flood Risk Manag. 2012, 5, 303–320. [Google Scholar] [CrossRef]
- Pal, B.; Samanta, S.; Pal, D.K. Morphometric and Hydrological analysis and mapping for Watut watershed using Remote Sensing and GIS techniques. Int. J. Adv. Eng. Technol. 2012, 2, 357–368. [Google Scholar]
- Tilley, J.R.; Kell, R.A.M.; Haro, A. Protecting the Markham Bridge, Morobe Province, PNG. In Proceedings of the 9th International River Symposium, Brisbane, Australia, 4–7 September 2006.
- Manandhar, B. Flood Plain Analysis and Risk Assessment of Lothar Khola. M.Sc. Thesis, Tribhuvan University, Phokara, Nepal, 2010; p. 64. [Google Scholar]
- Tehrany, M.S.; Lee, M.J.; Pradhan, B.; Jebur, M.N.; Lee, S. Flood susceptibility mapping using integrated bivariate and multivariate statistical models. Environ. Earth Sci. 2014, 72, 4001–4015. [Google Scholar] [CrossRef]
- Stieglitz, M.; Rind, D.; Famiglietti, J.; Rosenzweig, C. An efficient approach to modeling the topographic control of surface hydrology for regional and global climate modeling. J. Clim. 1997, 10, 118–137. [Google Scholar] [CrossRef]
- Youssef, A.M.; Pradhan, B.; Hassan, A.M. Flash flood risk estimation along the St. Katherine road, southern Sinai, Egypt using GIS based morphometry and satellite imagery. Environ. Earth Sci. 2011, 62, 611–623. [Google Scholar] [CrossRef]
- Fernandez, D.S.; Lutz, M.A. Urban flood hazard zoning in Tucumán Province, Argentina, using GIS and multicriteria decision analysis. Eng. Geol. 2010, 111, 90–98. [Google Scholar] [CrossRef]
- Norman, L.M.; Huth, H.; Levick, L.; Burns, I.S.; Phillip, G.D.; Lara-Valencia, F.; Semmens, D. Flood hazard awareness and hydrologic modelling at Ambos Nogales, United states-Mexico border. Flood Risk Manag. 2010, 3, 151–165. [Google Scholar] [CrossRef]
- Samanta, S.; Pal, D.K. Change Detection of Land Use and Land Cover over a Period of 20 Years in Papua New Guinea. Nat. Sci. 2016, 8, 138–151. [Google Scholar] [CrossRef]
- Elizabeth, A.; Samanta, S. Landslide vulnerability mapping (LVM) using weighted linear combination (WLC) model through remote sensing and GIS techniques. J. Model. Earth Syst. Environ. 2016, 2, 1–14. [Google Scholar]
- Saaty, T.L. The Analytic Hierarchy Process: Planning, Priority Setting, Resource Allocation; McGraw-Hill: New York, NY, USA, 1980. [Google Scholar]
- Geobook. Provincial GIS-based Planning Tools; The Remote Sensing Centre of University of Papua New Guinea: Port Moresby, Papua New Guinea, 2009. [Google Scholar]
- PNGRIS-Papua New Guinea Resource Information System. The Land-Use Section, Science and Technology Branch, Department of Agriculture and Livestock, 3rd ed.; University of Papua New Guinea: Boroko, Papua New Guinea, 2009. [Google Scholar]
- Kugler, Z.; Groeve, T.D. The Global Flood Detection system; EUR 23303 EN; Office for Official Publications of the European Communities: Ispra, Italy, 2007; pp. 1–45. [Google Scholar]


| Sl No | Data Type | Resolution | Year | Source |
|---|---|---|---|---|
| 1 | LANDSAT-8, OLI | 15 m Pan-Sharpen | 2013 | Department of Surveying and Land Studies, The PNG University of Technology |
| 2 | ASTER-DEM | 30 m | 2001 | |
| 3 | Village locations and population data sets of Morobe | Point and statistics | 2009 | Geobook, PNGRIS |
| 4 | Historical flood magnitude | Point location | 2002 to 2006 | GFDS, Version 2 http://www.gdacs.org/ |
| Value | Land Use/Land Cover Classes | Area (km2) | % Area |
|---|---|---|---|
| 1 | Inland Water | 3.55 | 0.47 |
| 2 | River Water | 35.82 | 4.72 |
| 3 | River Course Shrub | 25.10 | 3.31 |
| 4 | River Course Grass | 20.81 | 2.74 |
| 5 | River Course Vegetation | 33.73 | 4.45 |
| 6 | Other Shrub | 91.49 | 12.07 |
| 7 | Other Grass | 152.86 | 20.16 |
| 8 | Low Dense Vegetation | 48.33 | 6.37 |
| 9 | Dense Vegetation | 340.75 | 44.94 |
| 10 | Road and Built-up | 5.86 | 0.77 |
| Parameters | Category/Class | Rate (R) | Normalized Rating Index (NRI) [Individual/Total] | Weight (W) | Normalized Weight Index (NWI) |
|---|---|---|---|---|---|
| Elevation (in m) | <20 | 9 | 0.20 | 2 | 0.2 |
| 20–40 | 8 | 0.18 | |||
| 40–60 | 7 | 0.16 | |||
| 60–80 | 6 | 0.13 | |||
| 80–100 | 5 | 0.11 | |||
| 100–200 | 4 | 0.09 | |||
| 200–300 | 3 | 0.07 | |||
| 300–500 | 2 | 0.04 | |||
| More than 500 | 1 | 0.02 | |||
| Total | 45 | 1.00 | |||
| Slope (in Degree) | <1 | 9 | 0.20 | 3 | 0.3 |
| 1 to 2 | 8 | 0.18 | |||
| 2 to 3 | 7 | 0.16 | |||
| 3 to 4 | 6 | 0.13 | |||
| 4 to 5 | 5 | 0.11 | |||
| 5 to 10 | 4 | 0.09 | |||
| 10 to 15 | 3 | 0.07 | |||
| 15 to 20 | 2 | 0.04 | |||
| More than 20 | 1 | 0.02 | |||
| Total | 45 | 1.00 | |||
| Distance from River (in m) | <100 | 9 | 0.20 | 4 | 0.4 |
| 100–200 | 8 | 0.18 | |||
| 200–300 | 7 | 0.16 | |||
| 300–400 | 6 | 0.13 | |||
| 400–500 | 5 | 0.11 | |||
| 500–750 | 4 | 0.09 | |||
| 750–1000 | 3 | 0.07 | |||
| 1000–2000 | 2 | 0.04 | |||
| More than 2000 | 1 | 0.02 | |||
| Total | 45 | 1.00 | |||
| Land Use/Land Cover | Inland Water | N/A | N/A | 1 | 0.1 |
| River Water | 9 | 0.20 | |||
| River Course Shrub | 8 | 0.18 | |||
| River Course Grass | 7 | 0.16 | |||
| River Course Vegetation | 6 | 0.13 | |||
| Road and Built-up | 5 | 0.11 | |||
| Other Shrub | 4 | 0.09 | |||
| Other Grass | 3 | 0.07 | |||
| Low Dense Vegetation | 2 | 0.04 | |||
| Dense Vegetation | 1 | 0.02 | |||
| Total | 45 | 1.00 |
| Elevation (m) | Area (km2) | Percentage | Slope (degree) | Area (km2) | Percentage |
|---|---|---|---|---|---|
| <20 | 16.67 | 2.20 | < 1 | 53.26 | 7.02 |
| 20–40 | 26.08 | 3.44 | 1 to 2 | 34.87 | 4.60 |
| 40–60 | 38.89 | 5.13 | 2 to 3 | 40.5 | 5.34 |
| 60–80 | 78.58 | 10.36 | 3 to 4 | 62.58 | 8.25 |
| 80–100 | 91.4 | 12.05 | 4 to 5 | 27.56 | 3.63 |
| 100–200 | 170.65 | 22.50 | 5 to 10 | 49.01 | 6.46 |
| 200–300 | 171.52 | 22.62 | 10 to 15 | 100.45 | 13.25 |
| 300–500 | 123.88 | 16.34 | 15 to 20 | 203.94 | 26.89 |
| More than 500 | 40.63 | 5.36 | More than 20 | 186.13 | 24.55 |
| Total | 758.3 | 100.00 | Total | 758.3 | 100.00 |
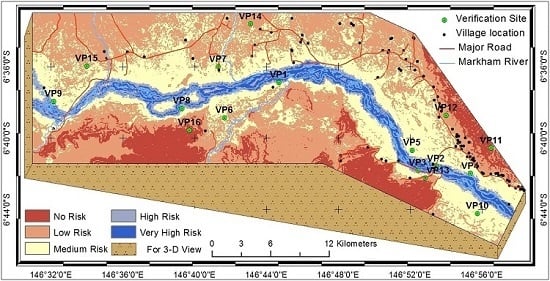
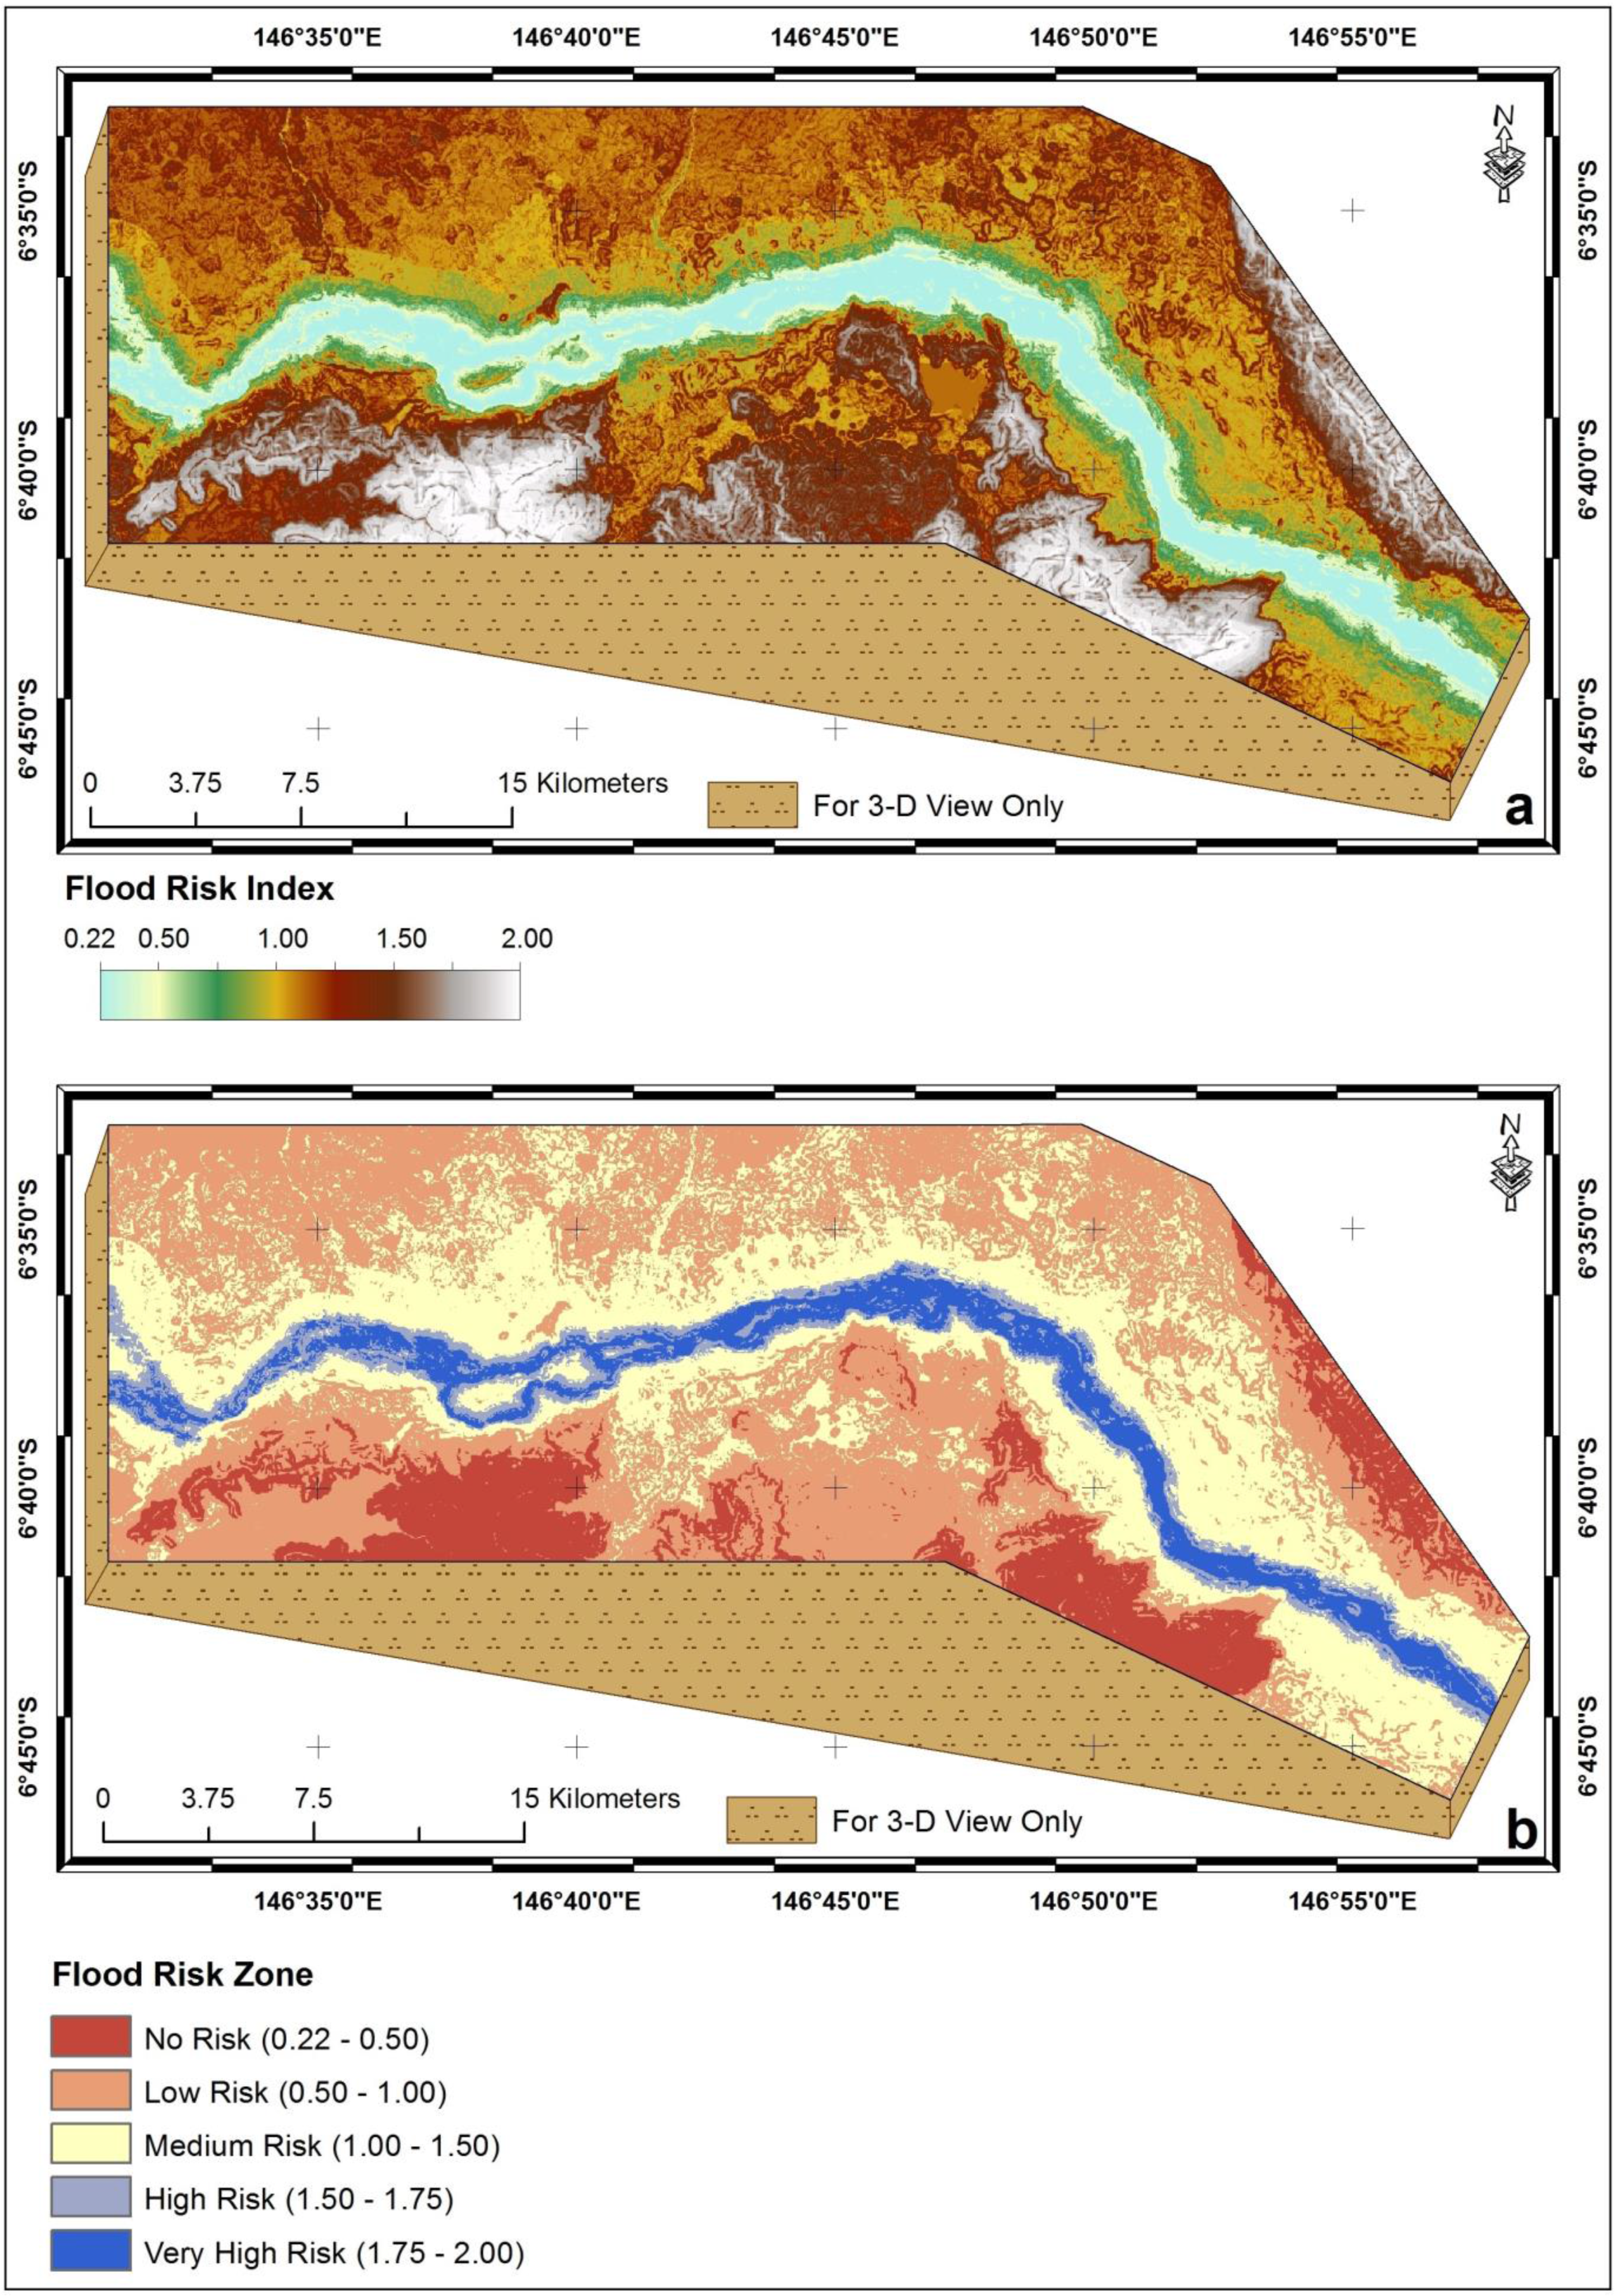
| Value | Flood Risk | Flood Risk Index Value | Area (km2) | Area (%) | No of Village | Population | Length of Road (km) |
|---|---|---|---|---|---|---|---|
| 1 | No Risk | 0.22–0.50 | 90.97 | 12.00 | NA | NA | 2.28 |
| 2 | Low Risk | 0.50–1.00 | 329.72 | 43.48 | 60 | 23282 | 89.66 |
| 3 | Medium Risk | 1.00–1.50 | 249.17 | 32.86 | 35 | 16584 | 58.88 |
| 4 | High Risk | 1.50–1.75 | 40.98 | 5.40 | 3 | 1328 | 6.55 |
| 5 | Very High Risk | 1.75–2.00 | 47.46 | 6.26 | 1 | 162 | 1.95 |
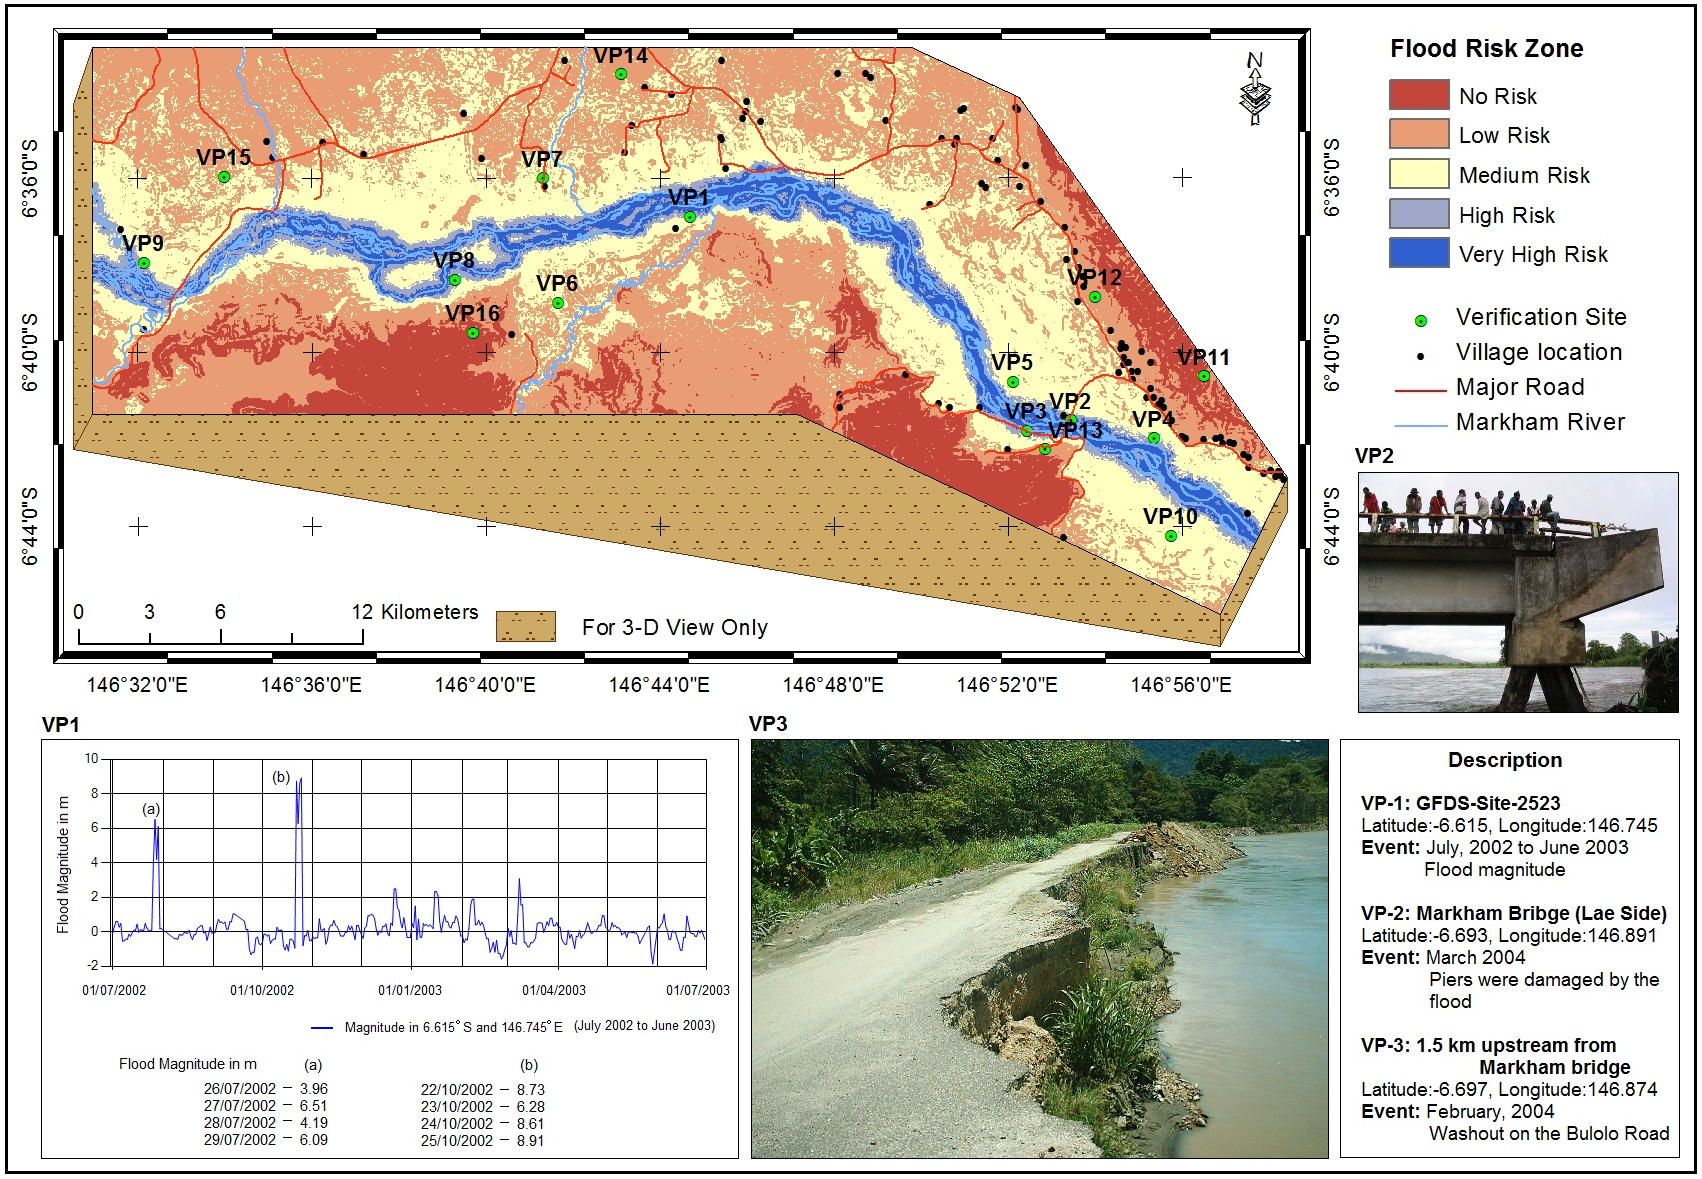
| Validation Point (VP) | Ground Observation/Existing Data Base | Flood Risk Analysis |
|---|---|---|
| VP1 | Flood, 2012 | High |
| VP2 | Flood, 2004 | Very high |
| VP3 | Flood, 2004 | Very high |
| VP4 | Periodic flooding [38] | High |
| VP5 | Moderate | |
| VP6 | Moderate | |
| VP7 | Moderate | |
| VP8 | High | |
| VP9 | High | |
| VP10 | Moderate | |
| VP11 | No flooding or inundation [38] | No risk |
| VP12 | Low risk | |
| VP13 | Low risk | |
| VP14 | Low risk | |
| VP15 | Low risk | |
| VP16 | No risk |
© 2016 by the authors; licensee MDPI, Basel, Switzerland. This article is an open access article distributed under the terms and conditions of the Creative Commons Attribution (CC-BY) license (http://creativecommons.org/licenses/by/4.0/).
Share and Cite
Samanta, S.; Koloa, C.; Kumar Pal, D.; Palsamanta, B. Flood Risk Analysis in Lower Part of Markham River Based on Multi-Criteria Decision Approach (MCDA). Hydrology 2016, 3, 29. https://doi.org/10.3390/hydrology3030029
Samanta S, Koloa C, Kumar Pal D, Palsamanta B. Flood Risk Analysis in Lower Part of Markham River Based on Multi-Criteria Decision Approach (MCDA). Hydrology. 2016; 3(3):29. https://doi.org/10.3390/hydrology3030029
Chicago/Turabian StyleSamanta, Sailesh, Cathy Koloa, Dilip Kumar Pal, and Babita Palsamanta. 2016. "Flood Risk Analysis in Lower Part of Markham River Based on Multi-Criteria Decision Approach (MCDA)" Hydrology 3, no. 3: 29. https://doi.org/10.3390/hydrology3030029
APA StyleSamanta, S., Koloa, C., Kumar Pal, D., & Palsamanta, B. (2016). Flood Risk Analysis in Lower Part of Markham River Based on Multi-Criteria Decision Approach (MCDA). Hydrology, 3(3), 29. https://doi.org/10.3390/hydrology3030029