Next Article in Journal
The Contribution of Natural Isotopes in Understanding Groundwater Circulation: Case Studies in Carbonate Aquifers of Central Apennines
Previous Article in Journal
Sediment Yield Assessment and Erosion Risk Analysis Using the SWAT Model in the Amman–Zarqa Basin, Jordan
Previous Article in Special Issue
Seasonal Inflow Shifts and Increasing Hot–Dry Stress for Eagle Mountain Lake Reservoir, Texas: SWAT Modeling with Downscaled CMIP6 Daily Climate and Observed Operations
 
 
hydrology-logo
Article Menu

Article Menu

Article

Evapotranspiration and Crop Coefficient of Economically Important Fruit Trees in the Eastern Amazon


by
Matheus Lima Rua
1,*,
Gabriel Siqueira Tavares Fernandes
1,
Tayssa Menezes Franco
1,
Miguel Gabriel Moraes Santos
1,
Maryelle Kleyce Machado Nery
1,
Andressa Julia Santos Vasconcelos
1,
Leandro Monteiro Navarro
1,
Juliane Samara da Costa Dias
1,
Joshuan Bessa da Conceição
1,
Israel Alves de Oliveira
1,
Marcus José Alves de Lima
2,
Vivian Dielly da Silva Farias
3,
Hildo Giuseppe Garcia Caldas Nunes
4,
Adriano Marlisom Leão de Sousa
1,
Everaldo Barreiros de Souza
5,
Glauco de Souza Rolim
6,
Mirta Teresinha Petry
7,
Samuel Orlando Ortega-Farias
8 and
Paulo Jorge de Oliveira Ponte de Souza
1
1
Soil-Plant-Atmosphere Interaction in Amazonia Research Group, Socio-Environmental and Water Resources Institute, Belém Campus, Federal Rural University of Amazonia—UFRA, Belém 66077-830, PA, Brazil
2
Capitão Poço Campus, Federal Rural University of Amazonia—UFRA, Capitão Poço 68650-000, PA, Brazil
3
Faculty of Agronomic Engineering, Altamira Campus, Federal University of Pará—UFPA, Altamira 68371-040, PA, Brazil
4
Secretariat for the Environment, Climate and Sustainability—SEMAS—PA, Belém 66093-671, PA, Brazil
5
Institute of Geosciences, Belém Campus, Federal University of Pará—UFPA, Belém 66075-110, PA, Brazil
6
Department of Exact Sciences, São Paulo State University Júlio de Mesquita Filho—UNESP, Jaboticabal 14884-900, SP, Brazil
7
Department of Rural Engineering, Center for Rural Sciences, Federal University of Santa Maria—UFSM, Santa Maria 97105-900, RS, Brazil
8
Centro de Investigación y Transferencia en Riego y Agroclimatología (CITRA), Universidad de Talca, Talca 3460000, Chile
*
Author to whom correspondence should be addressed.
Hydrology 2026, 13(4), 108; https://doi.org/10.3390/hydrology13040108

Submission received: 6 February 2026 / Revised: 17 March 2026 / Accepted: 27 March 2026 / Published: 10 April 2026

Abstract

This study aimed to determine the actual crop evapotranspiration (ETc act) and the crop coefficient (Kc) of economically important fruit crops in the Amazon, under both irrigated and non-irrigated conditions. The ETc act was determined using the soil water balance method, while Kc was determined using the ratio of ETc act to reference evapotranspiration (ETo). The treatments were evaluated during the rainy period (RP) and the less rainy period (LRP). During the RP, ETc act showed no significant differences between treatments, ranging from 2.26 to 3.03 mm day−1. During the LRP, the irrigated treatment (2.91 to 4.02 mm day−1) showed higher ETc act compared to the non-irrigated treatment (1.53 to 2.87 mm day−1). For the non-irrigated treatment, only the dwarf green coconut and the acid lime had a higher ETc act in the LRP than the RP, while the açaí palm and the cocoa showed lower values during the LRP. In general, ETc act remained below ETo, with Kc values ranging from 0.81 to 0.85 during the RP and increasing to 0.89–0.93 during the LRP. Irrigation provided water support to the studied fruit crops during periods of lower rainfall, meeting the higher atmospheric demand during the less rainy period.

1. Introduction

Brazilian fruit production has emerged in recent years, occupying prominent positions in the global ranking for several species. According to data from the Food and Agriculture Organization of the United Nations (FAO), Brazil is the fourth largest producer of coconut (2,744,418 t), accounting for approximately 4% of global production. In the production of lemons and acid limes, Brazil ranks sixth worldwide (1,632,109 t), representing about 7% of global output. Regarding cocoa production, Brazil occupies seventh place (273,873 t of beans), corresponding to 5% of worldwide output [1]. Another fruit of major importance to Brazil is açaí; however, it should be noted that the FAO website does not yet provide global production data for this crop.
In recent years, the state of Pará has distinguished itself as the main national producer of açaí, accounting for approximately 93% of the country’s production (1,576,302 t). In addition, it ranks second in cocoa bean production (138,471 t), representing about 48% of national output. The state also ranks as the fourth largest producer of coconut and lemon, contributing 9% (172,251,000 fruits) and 4% (67,275 t), respectively [2]. This scenario highlights the socioeconomic relevance of these crops in the Amazon region and reinforces the trend toward the adoption of technologies aimed at modernizing these production systems. Among such technologies, irrigation is an essential practice for agricultural intensification, contributing to increased productivity and yield stability in regions characterized by irregular rainfall distribution [3].
Agriculture in Pará occurs within a climatic context characterized by high annual precipitation totals; however, rainfall distribution exhibits seasonal variations throughout the year [4]. The total irrigated area in Pará is 103,303 hectares [5], with a strong expansion trend, especially in the Northeast Pará mesoregion, where agricultural activities are more intense [6]. Studies conducted in commercial irrigated plantations of açaí palm, coconut, ‘Tahiti’ acid lime, and cocoa have shown that irrigation positively affects productivity and climate resilience, outperforming conventional non-irrigated systems [3,7,8,9].
In irrigated agricultural systems, it is crucial to have accurate information on crop water requirements, commonly expressed as evapotranspiration, which is fundamental for quantifying and monitoring water use over different periods [8]. Crop evapotranspiration (ETc) represents the amount of water consumed by a crop throughout its development cycle and serves as an indicator of the amount of water that must be replenished in the soil, equivalent to the quantity evapotranspired by the plant under optimal water availability conditions [10,11].
Among the methodologies used to estimate evapotranspiration, the soil water balance (SWB) stands out due to its applicability and its ability to represent water fluxes within the cropping system [12]. The ETc can be calculated based on the direct measurement of the SWB components within the soil volume explored by roots, where monitoring soil moisture is the central variable in this process [13,14]. Water dynamics in the soil–plant–atmosphere continuum are influenced by factors such as soil water availability, soil physical-hydraulic properties, atmospheric evaporative demand, and the crop’s capacity to extract water from the soil [15], which vary according to edaphoclimatic conditions and the management practices adopted.
Due to the operational complexity and the limitations inherent in the direct measurement of ETc, the FAO recommends estimating it through the product of reference evapotranspiration (ETo) and the crop coefficient (Kc) [15]. The Kc is determined by the ratio between ETc and ETo, acting as an empirical parameter that incorporates the biophysical characteristics of the crop, including the duration of phenological stages, as well as the climatic conditions of the study area [16]. However, the determination of Kc must be carried out for each specific region and crop, as its universal application is inappropriate due to climatic and crop-specific differences that influence the values of this coefficient [17].
Accurate estimation of crop evapotranspiration (ETc), as well as its Kc, is crucial for rational irrigation management, since crop water consumption varies according to phenological characteristics, local climatic conditions, atmospheric demand, and soil water availability [3,18]. Thus, quantifying the water requirement of a crop throughout its development cycle enables improved irrigation planning and management. This optimizes water management, avoiding deficits that compromise productivity or excess water that results in waste, thereby promoting the efficient and sustainable management of water resources in agriculture.
The objective of this study was to determine the actual crop evapotranspiration (ETc act) and the crop coefficient (Kc) of fruit crops of economic importance in the Amazon under irrigated and non-irrigated conditions.

2. Materials and Methods

2.1. Study Areas

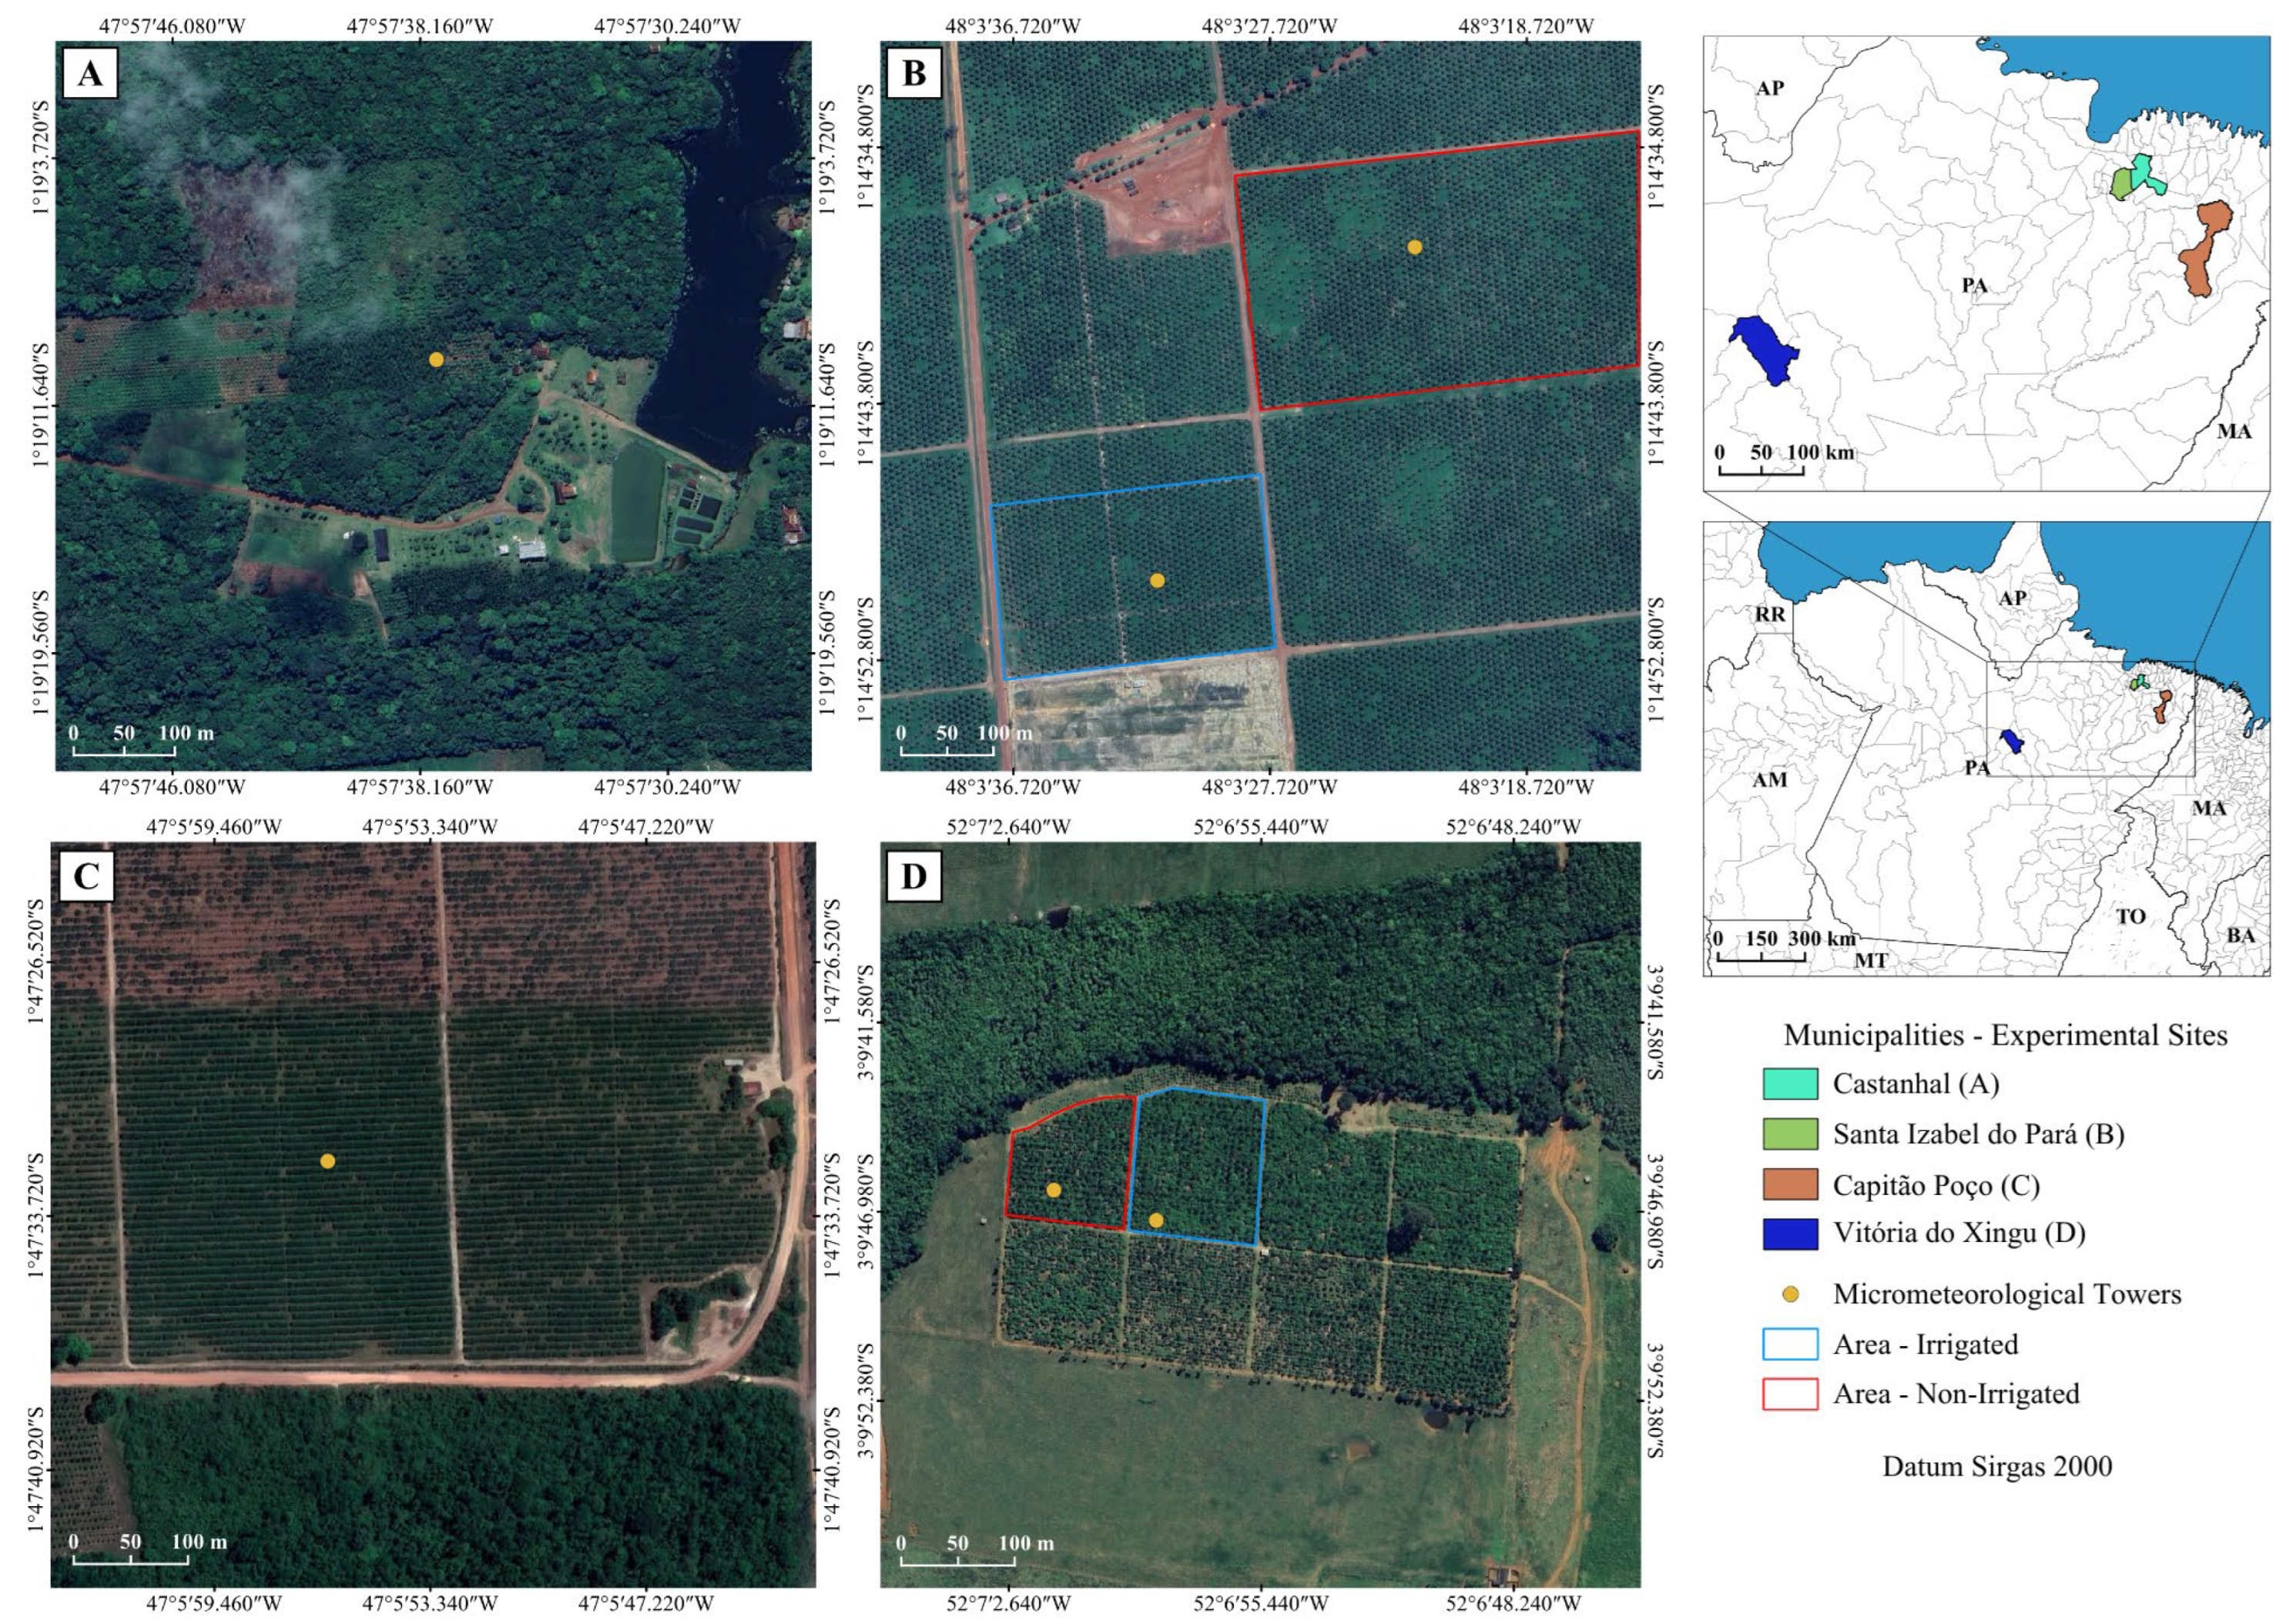
The study was conducted in commercial plantations of açaí palm (Euterpe oleracea Mart.), cultivar BRS–Pará; dwarf green coconut (Cocos nucifera L.), cultivar Anão-Verde-do-Brasil-de-Jiqui (AVeBrJ); acid lime (Citrus latifolia T.), cultivar Tahiti; and seed-propagated cocoa (Theobroma cacao L.). These plantations are distributed across four municipalities in the state of Pará, as described in Table 1 along with their respective experimental periods, and illustrated in Figure 1.
It is noteworthy that the dimensions of the experimental areas fully met the minimum fetch requirements, as verified in previous micrometeorological studies conducted at the same sites using the Bowen Ratio method. This ensures that measurements were taken within the surface boundary layer, where fluxes are constant and representative of the specific crop canopy.
The açaí palm crop occupied an area of 0.3 hectares, managed with three stems per clump, at a spacing of 4 m × 4 m. At the end of the study period, the plants were 8 years old with an average height of 12 m. In the acid lime experiment, Tahiti acid lime trees were grafted onto Citrumelo Swingle (X Citroncirus spp.) rootstocks. The cultivated area comprised 100 hectares at a spacing of 3 m × 5 m; at the beginning of the study, the plants were 14 years old with an average height of 4 m. The cocoa crop occupied 10 hectares with a 3 m × 3 m spacing; the plants were 5 years old with an average height of 3.84 m at the start of the study.
The dwarf green coconut cultivation was divided into two areas within the same soil class: an irrigated area of 7 hectares (10-year-old plants) and a non-irrigated area covering 19.47 hectares (12-year-old plants), with an average height of 7.3 m. Both areas feature a triangular spacing arrangement of 7.5 m × 7.5 m × 7.5 m and were intercropped with tropical kudzu (Pueraria phaseoloides (Roxb.) Benth.), a perennial herbaceous legume used for ground cover.
According to the Köppen classification, the climatic type of the experimental sites is Am, characterized by marked seasonality in rainfall distribution. At all study sites, the mean annual temperature is approximately 26 °C. In the crops located in Castanhal and Santa Izabel do Pará, the mean annual rainfall exceeds 2000 mm, whereas in Capitão Poço and Vitória do Xingu the mean annual values reach 1848 and 1914 mm, respectively [19]. At the açaí palm, acid lime, and cocoa experimental sites, the rainy season is concentrated between December and May, while the less rainy season extends from June to November. For dwarf green coconut, a longer rainy period is observed from December to July, followed by the lower rainfall period from August to November [20].
The soils of the experimental areas are classified as Yellow Latosol with sandy loam texture (açaí palm), Dystrophic Yellow Latosol with argillic characteristics for the coconut and acid lime crops, and clay loam Argisol for cocoa [21,22]. The corresponding classifications according to the international systems World Reference Base for Soil Resources (WRB) [23] and USDA Soil Taxonomy [24] are detailed in Table A1 (Appendix A). At all sites, undisturbed soil samples were collected at depths of 0.0–0.2 m and 0.2–0.4 m for particle-size distribution and physical-hydraulic analysis. The physical-hydraulic attributes for the coconut, acid lime, and cocoa areas were estimated based on soil particle-size data, adapted from the methodology proposed by Assad et al. [25]. The soil texture and physical-hydraulic attributes are presented in Table 2.

2.2. Treatments and Irrigation

The treatments were defined based on soil water availability, differentiating between irrigated and non-irrigated plants. The irrigation depth was determined using reference evapotranspiration (ETo), estimated by the Penman–Monteith method standardized in FAO Bulletin 56 [15]. The açaí palm and cocoa crops were irrigated daily, applying 100% of the ETo from the previous day. In the coconut and acid lime crops, irrigation followed the company’s operational schedule, occurring from Monday to Saturday.
For coconut, the irrigation depth was calculated as the product of ETo and a Kc of 1.06, corresponding to the productive cycle as determined by Carvalho et al. [3]. In the acid lime crop, the applied irrigation depth (3.57 mm plant−1) was defined based on the study by Pinto et al. [9], who identified that this depth is sufficient to raise soil water content to field capacity in the region, considering 100% of ETo.
Irrigation systems and their operational characteristics varied according to the crop. In the açaí palm and coconut crops, both were irrigated by microsprinklers with flow rates of 34 L h−1 (operating pressure of 5.5 m water column) and 96 L h−1, respectively, using one emitter per plant. The emitters were positioned 0.4 m from the açaí trunk and 1.0 m from the coconut trunk.
The acid lime crop was irrigated by drip irrigation, with six emitters per plant, each providing a flow rate of 3 L h−1. For cocoa, a microsprinkler (microjet) system was used with one emitter per plant (flow rate of 10 L h−1 at 10 m water column), installed on an irrigation line located 3 m from the planting row. System efficiencies were 94%, 86%, 85%, and 86% for açaí palm, dwarf green coconut, acid lime, and cocoa crops, respectively.
For açaí palm, dwarf green coconut, and acid lime, irrigation was conducted during the less rainy period, whereas for cocoa, irrigation was carried out throughout the year as needed to maintain soil moisture close to field capacity, thereby ensuring adequate conditions for physiological processes and crop development.
It is noteworthy that, as these were commercial plantations, irrigation management followed the operational schedule of the farm. Nevertheless, continuous monitoring of soil volumetric water content ensured that moisture levels in the irrigated treatments consistently remained within the range of readily available water (RAW). Since soil moisture did not reach the critical moisture threshold in the irrigated treatment, actual evapotranspiration corresponded to crop evapotranspiration under non-limiting conditions [15], thereby validating the obtained parameters, regardless of the rigidity of the farm’s irrigation schedule.

2.3. Meteorological Data Acquisition

Meteorological data were obtained from micrometeorological towers installed at each experimental site, enabling continuous monitoring of the variables relevant to estimating crop evapotranspiration. For the açaí palm and acid lime crops, a single tower was used for all treatments, with heights of 17 m and 10 m, respectively. In the dwarf green coconut and cocoa crops, independent towers were installed for each treatment, with heights of 12 m and 6 m, respectively. The sensors and instruments equipped on the towers, including their technical specifications, operating principles, and monitored variables, are detailed in Table 3.
Soil volumetric water content (θ) was monitored using Time Domain Reflectometry (TDR) sensors installed at strategic locations to represent the root zone. TDR sensors were installed 1.0 m from the trunk and positioned horizontally at depths of 0.1, 0.3, and 0.5 m, allowing vertical sampling of the soil water profile. In the açaí palm experiment, due to technical limitations in instrumentation during the period, the configuration was adapted: in the irrigated treatment, the sensors were positioned horizontally at depths of 0.2 and 0.4 m, whereas in the non-irrigated treatment, vertical installation was used, integrating the 0.0–0.3 m soil layer.
Although the sampling configuration varied between treatments, this arrangement strategically focused on the soil layers with the highest effective root density. By capturing water dynamics within this active root zone, a representative estimate of ETc act was ensured, mitigating uncertainties associated with the different sensor layouts. Thus, the adopted procedures tend to provide a representative estimate of soil water dynamics and crop evapotranspiration, reducing uncertainties associated with the calculation of ETc act.
To ensure greater accuracy in soil water monitoring estimates, the sensors were subjected to site-specific calibration. Their technical specifications are detailed in Table A2 (Appendix A). The calibration equations used to convert the apparent dielectric constant (ka) into soil volumetric water content for each experimental site and treatment are presented in Table A3 (Appendix A).
All sensors were connected to a data acquisition and storage system (dataloggers). The CR10X model (Campbell Scientific, Inc., Logan, UT, USA) was employed in the dwarf green coconut crop, whereas the CR1000 model (Campbell Scientific, Inc., Logan, UT, USA) was used in the açaí palm, acid lime, and cocoa crops. The dataloggers were programmed to perform instantaneous readings every 10 s, storing averaged values at 20-min intervals to ensure high temporal resolution for characterizing soil water dynamics.

2.4. Soil Water Balance

Actual crop evapotranspiration (ETc act) was calculated using the soil water balance method proposed by Libardi [13] (Equation (1)).
E T c   a c t = h P I D A C ,
where: ETc act is the actual crop evapotranspiration (mm day−1); Δh is the change in soil water storage (mm); P is rainfall (mm); I is the irrigation depth (mm); D is internal drainage (mm); and AC is capillary rise (mm).
Soil water storage (h) was determined using the Trapezoidal Rule [13], based on volumetric soil water content (θ) measurements obtained from TDR sensors at the monitored depths. The variation in soil water storage (Δh) was calculated as the difference between h values at the initial and final times of the monitored period. Internal drainage (D) within the soil profile was estimated using the Darcy–Buckingham equation (Equation (2)), which allows the quantification of vertical water flow based on the hydraulic potential gradient and the unsaturated hydraulic conductivity under the moisture conditions observed at each sensor:
q z = K θ ϕ t ,
where: qz is the soil water flux density at depth Z (mm day−1); ∇ϕt is the total hydraulic potential gradient (cm cm−1); and K(θ) is the unsaturated hydraulic conductivity of the soil (mm), obtained using the equation proposed by Van Genuchten [26] (Equation (3)), where m = 1 − 1/n [27]:
K θ = K 0 ω l 1 1 ω 1 m m 2 ,
where ω is the effective soil moisture (Equation (3)):
ω = θ θ r θ s θ r ,
where: K(θ) is the unsaturated hydraulic conductivity of the soil (mm day−1); K0 is the saturated hydraulic conductivity of the soil (mm); ω is the effective soil moisture; ℓ is an empirical parameter estimated by Mualem [27] as approximately equal to 0.5 for most soils; θ is the current soil water content (cm3 cm−3); θs is the saturated soil water content (cm3 cm−3); and θr is the residual soil water content (cm3 cm−3).
To obtain the total vertical potential gradient (∇ϕt), tensiometers were installed near the monitored plant at the following depths: 0.4 and 0.5 m in the açaí palm crop; 0.3 and 0.6 m in the coconut crop; and 0.2 and 0.4 m in the acid lime and cocoa crops. Tensiometer installation was carried out using an auger drill (20 mm diameter) to ensure proper sensor–soil contact and minimize soil profile disturbance. Readings of soil water tension (matric potential) were taken daily using a digital tensiometer, enabling the determination of the matric potential gradient required for calculating soil water flux.
Saturated hydraulic conductivity (K0) was estimated through infiltration tests using a double ring infiltrometer at each experimental site, adjacent to the plant monitored with TDR sensors and in an area devoid of vegetation cover. The procedures followed the methodology proposed by Brandão et al. [28]. After obtaining the infiltration rates, the values were applied to the equation proposed by Soto and Kiang [29] (Equation (5)).
K 0 =   Z W l n   H 1 H 2 t ,
where: K0 is the saturated soil hydraulic conductivity; Zw is the depth of the wetting front (m); H1 and H2 are the water depths in the ring at the start and end of the interval, respectively; and t is the time between two readings.

2.5. Reference Evapotranspiration (ETo)

Reference evapotranspiration (ETo) was estimated using the Penman-Monteith method (FAO 56) [15]. The data required to estimate ETo were obtained from automatic weather stations belonging to the National Institute of Meteorology (INMET), located in the same municipality as each experiment. An exception was made for the dwarf green coconut crop, where data were obtained from an automated surface weather station located at the Sococo company headquarters, approximately 2 km from the experimental area.

2.6. Crop Coefficient (Kc) and Soil Water Stress Coefficient (Ks)

The crop coefficient (Kc) was determined for the reproductive stage of the crops and was calculated as the ratio between the ETc act of the irrigated treatment and ETo, according to Equation (6).
K c = E T c   a c t E T o
Meanwhile, the soil water stress coefficient (Ks) was determined by the ratio of ETc act from the non-irrigated treatment to ETc act from the irrigated treatment, according to Equation (7).
K s = E T c   a c t   n o n i r r i g a t e d E T c   a c t   i r r i g a t e d
where: Kc is the crop coefficient; Ks is the soil water stress coefficient; ETc act is the actual crop evapotranspiration for each treatment; and ETo is the reference evapotranspiration.

2.7. Experimental Design and Statistical Analysis

The experimental design was completely randomized (CRD), arranged in a split-plot scheme, consisting of treatments (irrigated and non-irrigated) and two monitoring periods (rainy and less rainy). For each treatment, one representative plant was selected for monitoring, where TDR sensors were installed to determine the soil water balance. The replicates consisted of monthly point-based observations of ETc act. Data normality and homogeneity of variances were assessed using the Shapiro–Wilk (p < 0.05) and Levene (p < 0.05) tests, respectively. Data that met these assumptions were subjected to analysis of variance (ANOVA), followed by Tukey’s test (p < 0.05) for mean comparisons. When the assumptions of ANOVA were not satisfied, the Kruskal–Wallis and Wilcoxon–Mann–Whitney tests (p < 0.05) were applied, as recommended for nonparametric data. Statistical analyses were performed using the Python (version 3.10.9) software package [30].

3. Results

3.1. Açaí Palm

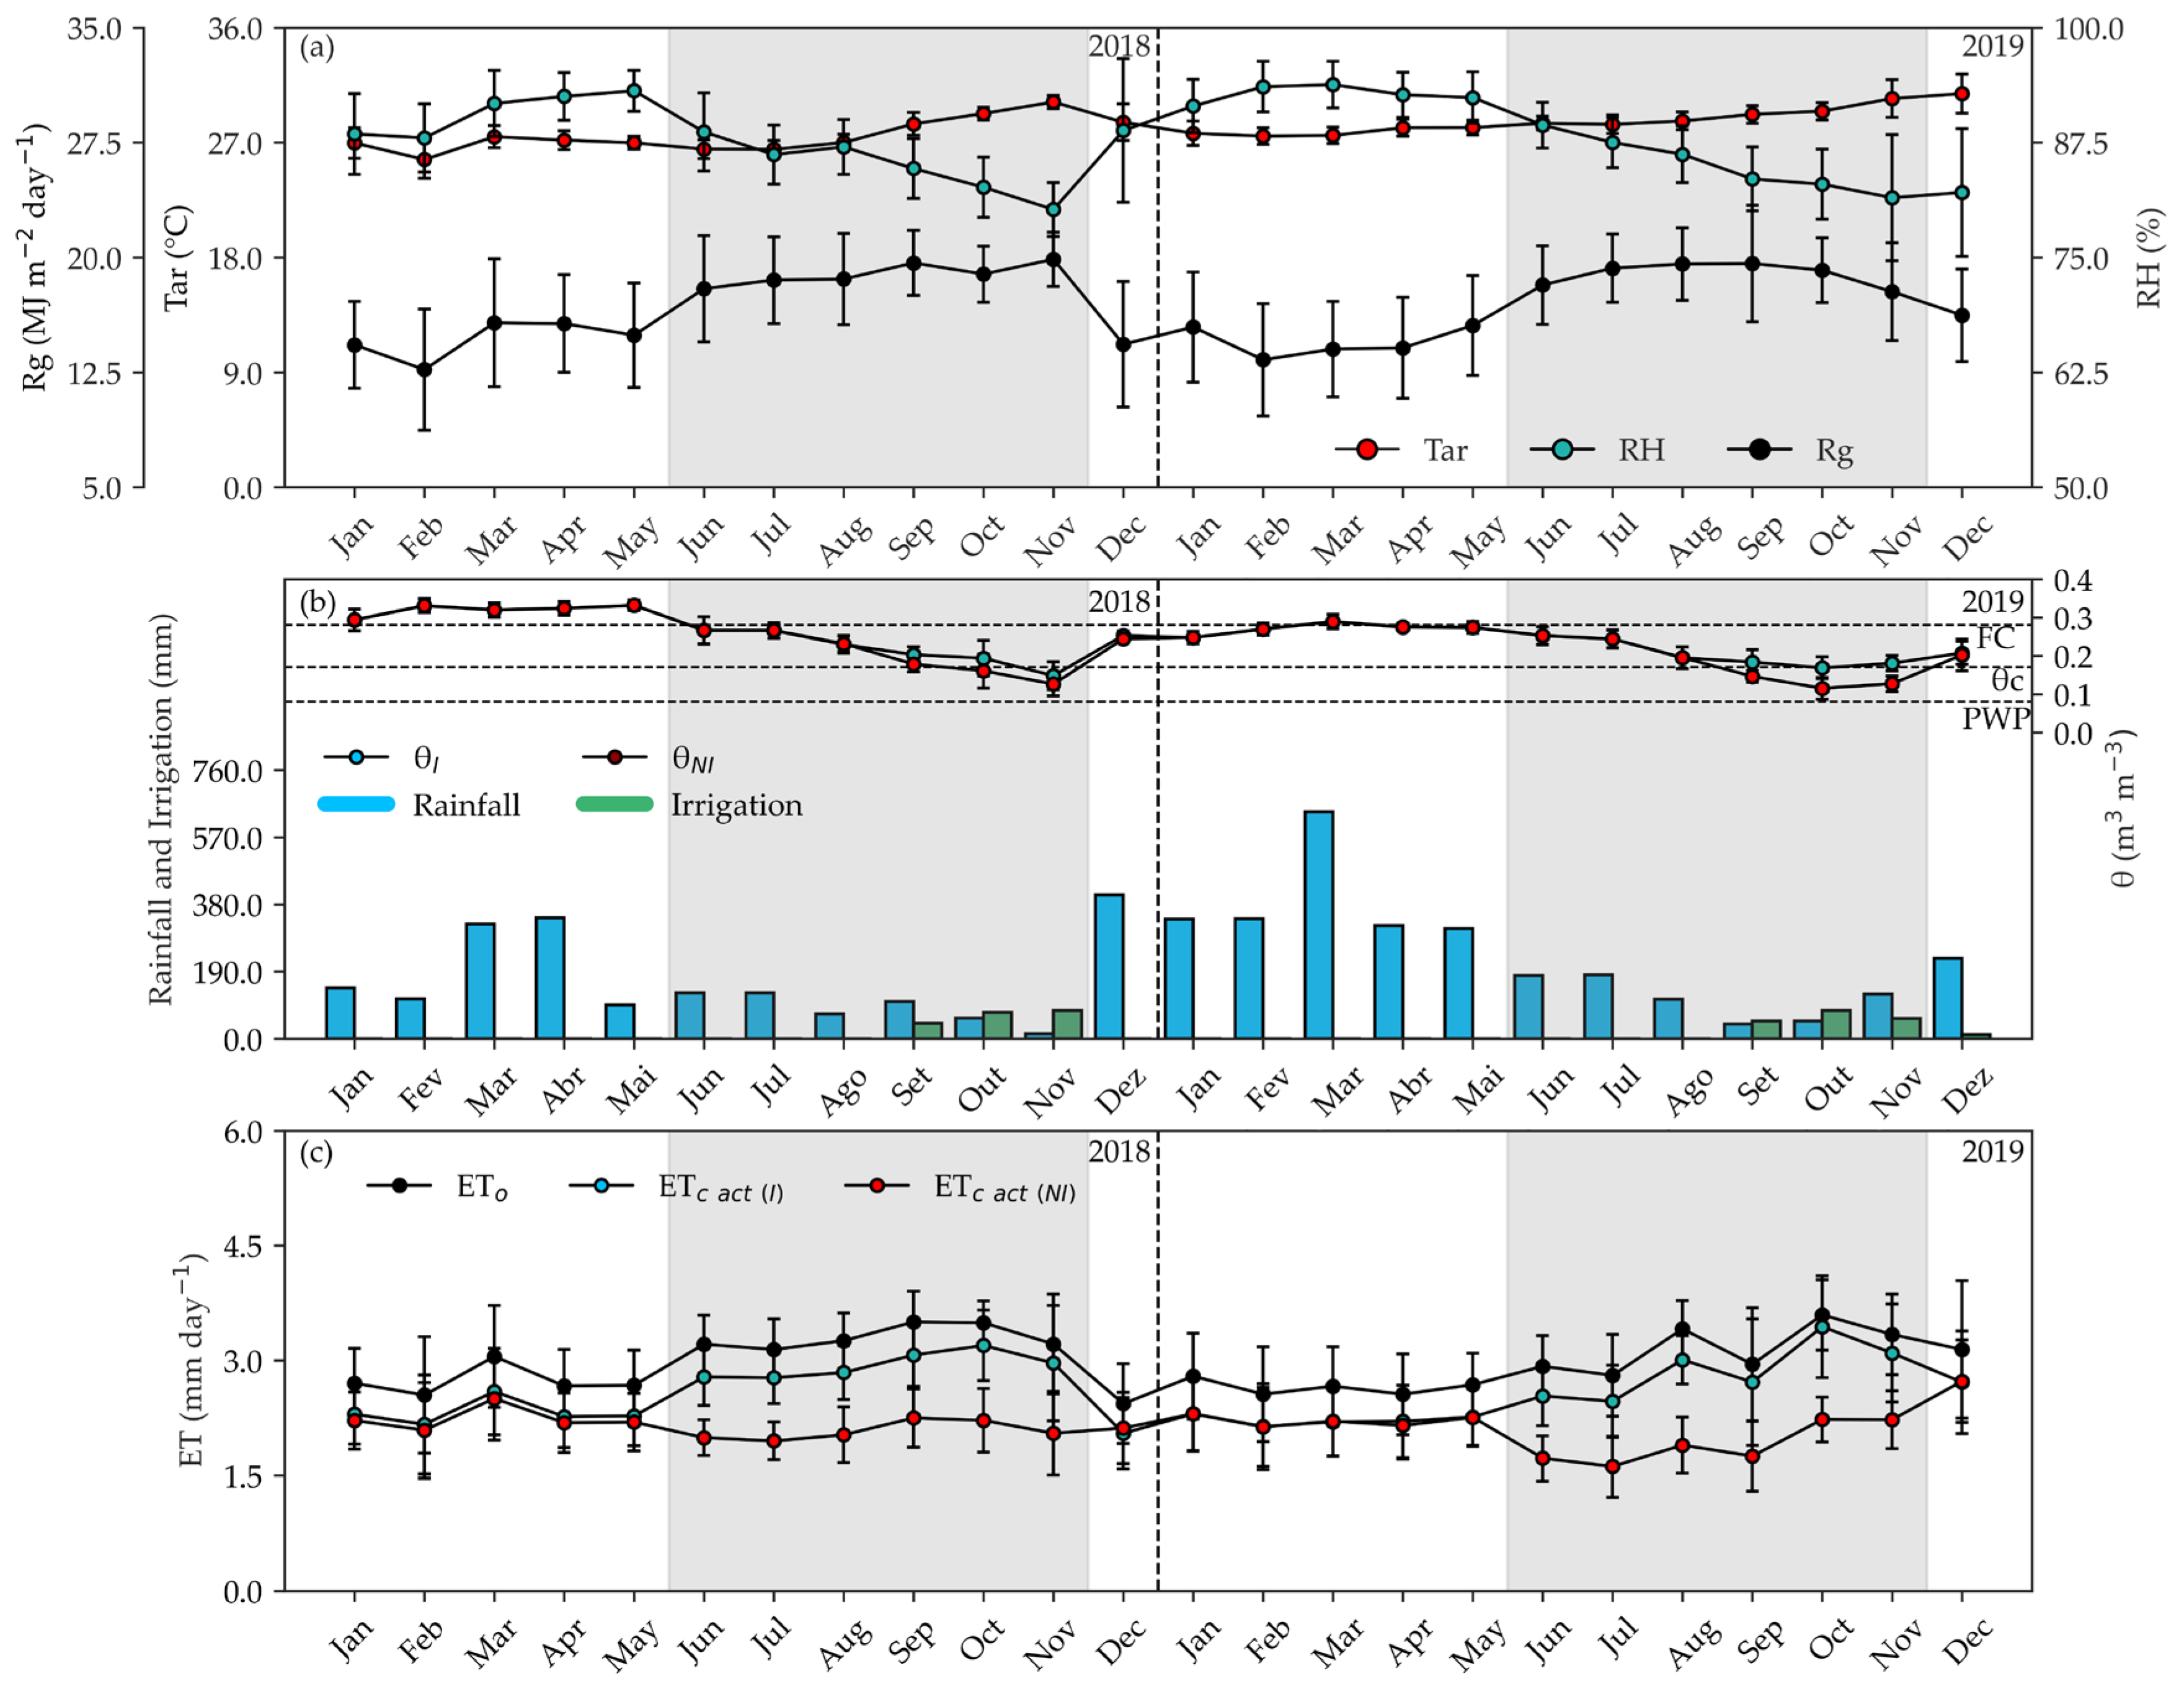
During the study period at the açaí palm experimental site, the average air temperature (Tar), relative humidity (RH), and global solar radiation (Rg) were 28.2 °C (±1.6), 87.9% (±5.7), and 16.8 MJ m−2 day−1 (±2.3), respectively (Figure 2a). During the less rainy period (LRP), the averages of Tar and Rg were 3.0% and 28.9% higher than those observed during the rainy period (RP). In contrast, mean RH values during the LRP were 6.3% lower than those recorded during the RP (Figure 2a).
The experiment conducted with açaí palm was influenced by climatic variability associated with the El Niño-Southern Oscillation (ENSO). Between January and March 2018, the atmospheric-oceanic system was in its cold phase (La Niña). Subsequently, neutral ENSO conditions were observed from April to August 2018, with the transition to the warm phase (El Niño) beginning in September 2018 and persisting until July 2019 [31]. Neutral conditions prevailed thereafter until the end of the experiment in December 2019.
During the study period, the total rainfall recorded in the açaí palm plantation was 1857 mm in 2018 and 2867 mm in 2019. On average, 74.3% of the annual rainfall occurred during the rainy period (RP), while 25.7% was observed during the less rainy period (LRP), representing a mean reduction of 65.4% in rainfall volume during the LRP compared to the RP (Figure 2b). This marked seasonality of the water regime, intensified by the influence of ENSO phases, significantly affected the water balance and ecophysiological processes throughout the experiment.
During the LRP, the total irrigation depth applied to the irrigated treatment was 198 mm in 2018 and 200 mm in 2019 (Figure 2b). The volumetric soil water content (θ) in the 0.0–0.3 m layer averaged 0.28 m3 m−3 (±0.04) during the RP and 0.21 m3 m−3 (±0.04) during the LRP, corresponding to a 25.0% reduction. In the non-irrigated treatment, the average θ in the 0.0–0.3 m layer was 0.28 m3 m−3 (±0.04) in the RP and 0.19 m3 m−3 (±0.06) in the LRP, representing a 32.1% reduction (Figure 2b).
Reference evapotranspiration (ETo) averaged 2.71 mm day−1 (±0.21) during the RP and 3.24 mm day−1 (±0.25) during the LRP, representing a 19.6% increase during the LRP (Figure 2c). The actual crop evapotranspiration (ETc act) of the irrigated açaí palm showed accumulated annual averages of 417 mm in the RP and 532 mm in the LRP. In the non-irrigated treatment, the average accumulated annual ETc act was 411 mm during the RP and 365 mm during the LRP, considering the 2018 and 2019 period (Figure 2c).
Regarding the ETc act results for the irrigated açaí palm, the averages were 2.29 mm day−1 (±0.19) (36.65 L plant−1 day−1) during the RP and 2.91 mm day−1 (±0.28) (46.53 L plant−1 day−1) during the LRP (Figure 2c). For the ETc act in the non-irrigated treatment, the averages were 2.26 mm day−1 (±0.14) (36.15 L plant−1 day−1) during the RP and 1.99 mm day−1 (±0.22) (31.89 L plant−1 day−1) during the LRP (Figure 2c).

3.2. Dwarf Green Coconut

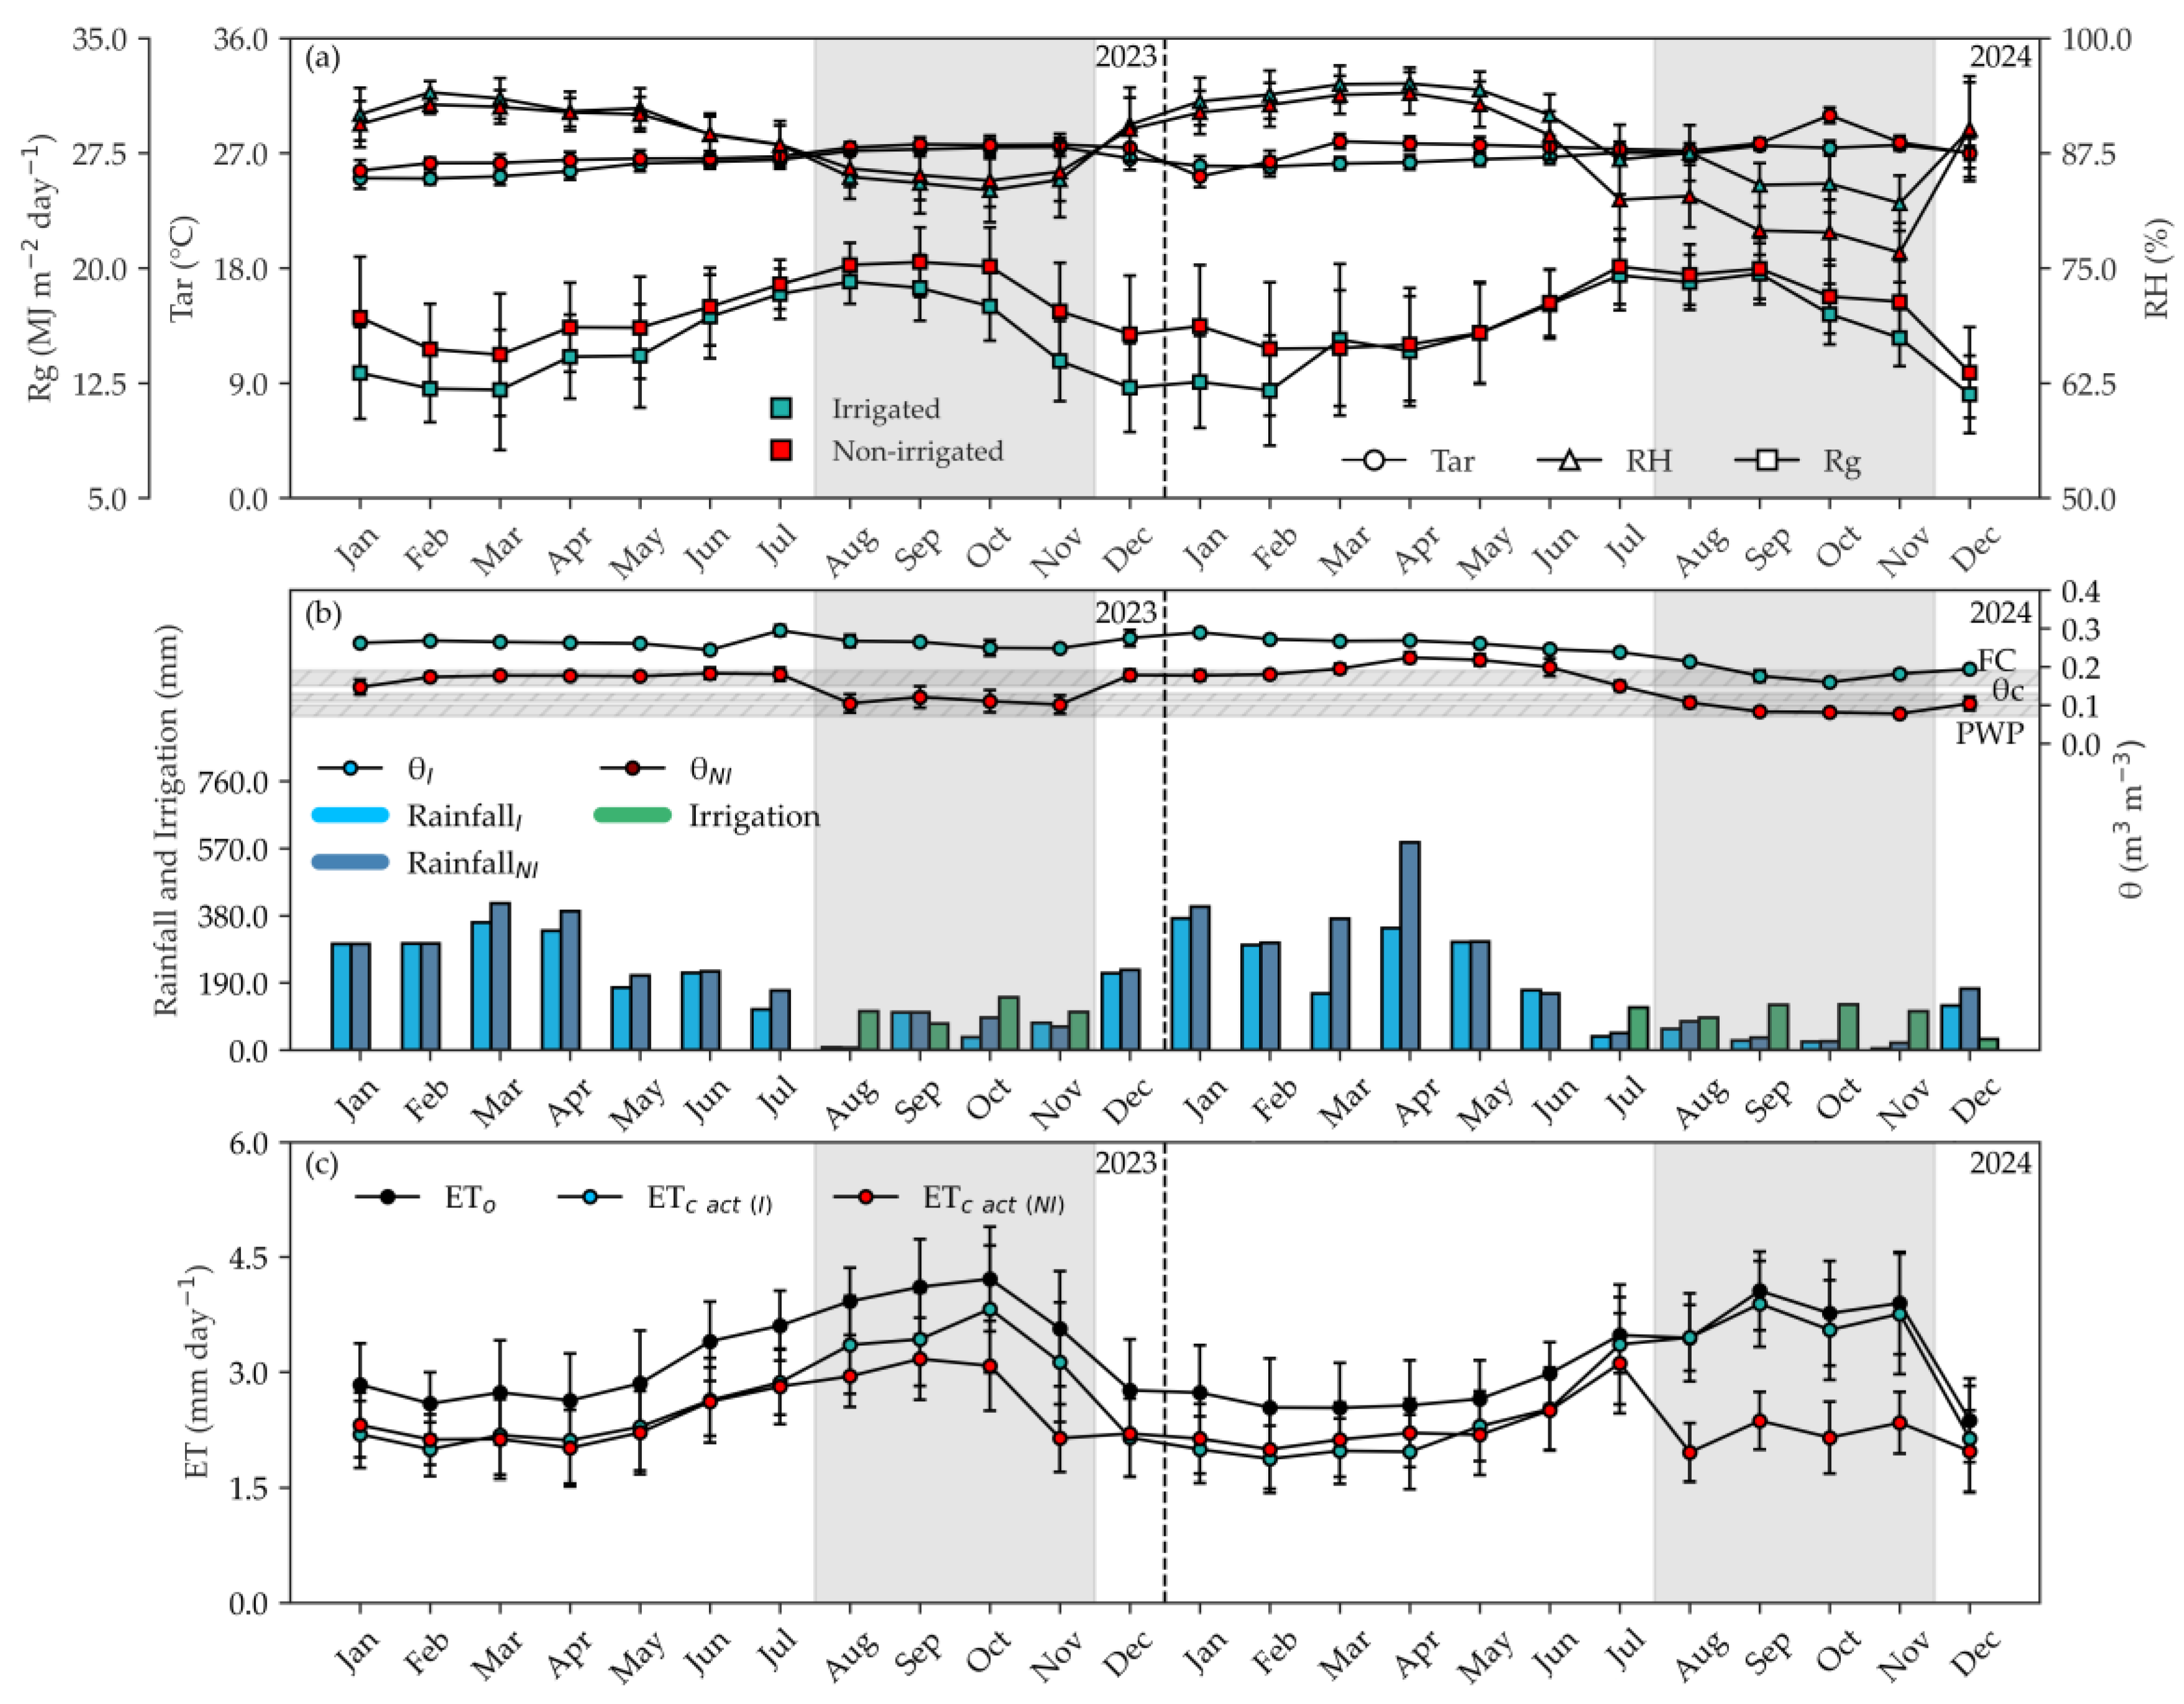
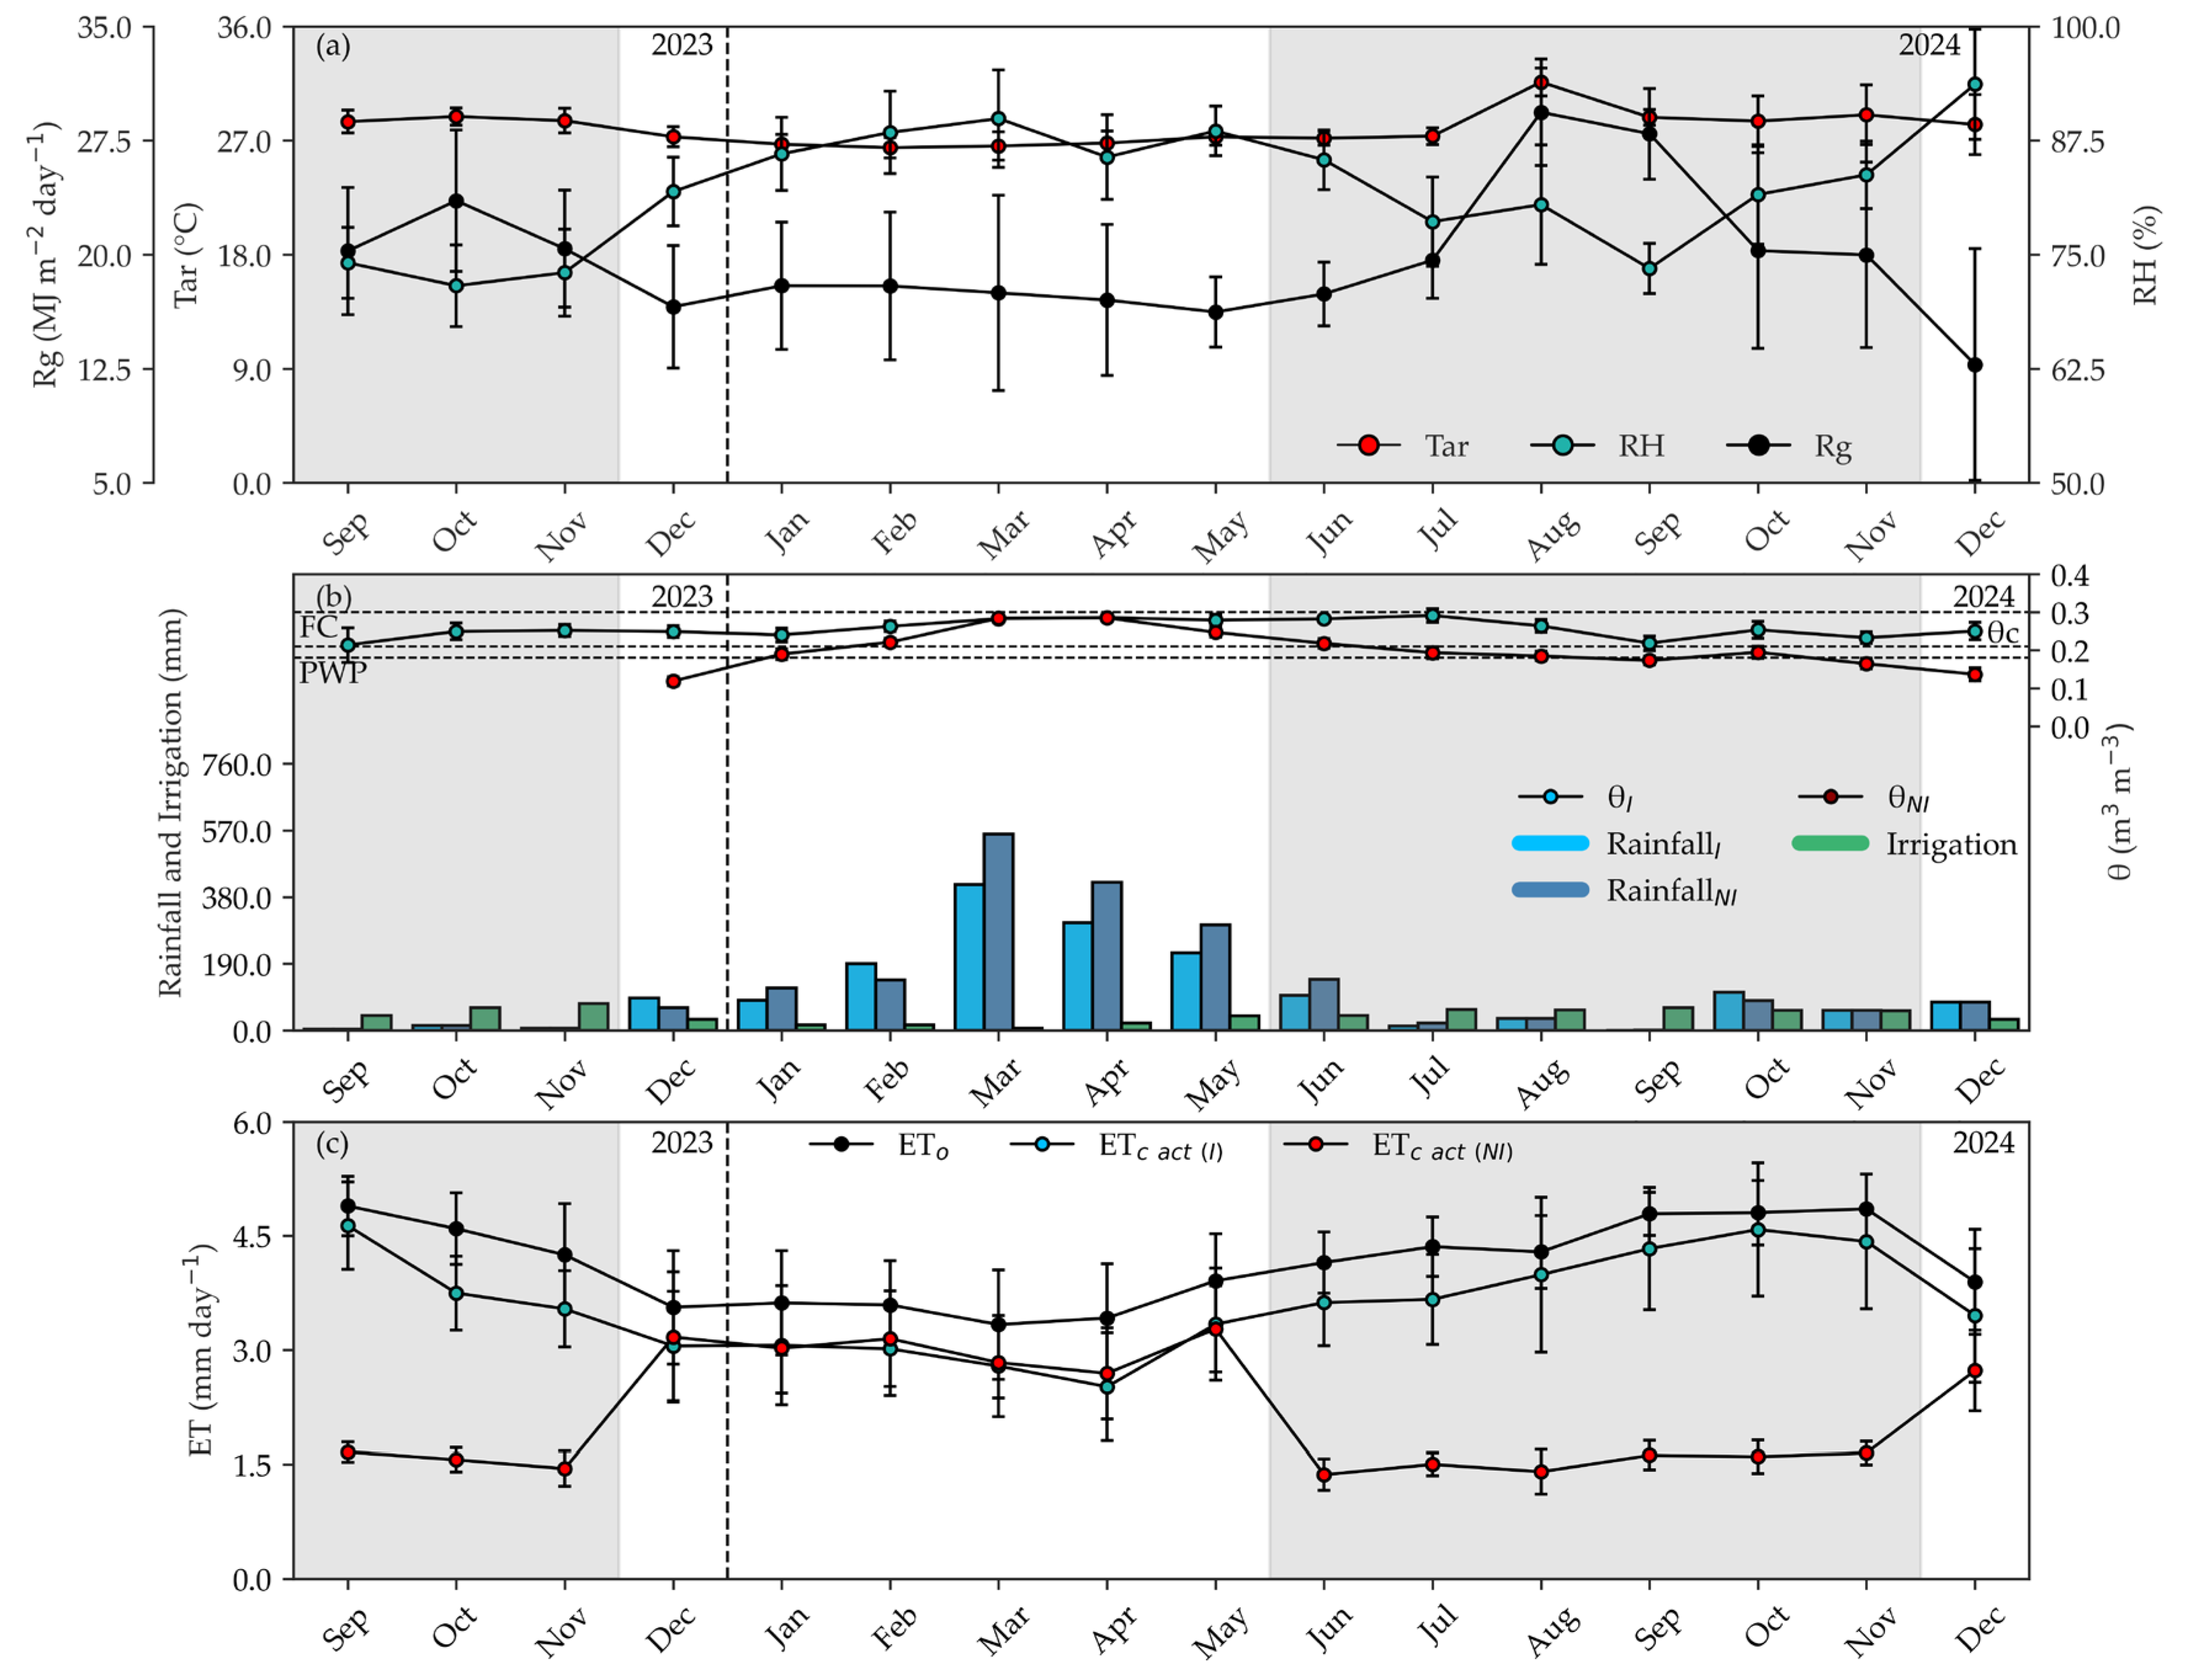
At the dwarf green coconut experimental site, the average Tar and RH were 26.5 °C (±1.0) and 89.5% (±4.3), respectively, in the irrigated treatment, while in the non-irrigated treatment, they were 27.1 °C (±0.9) and 88.1% (±5.1) (Figure 3a). The average Rg values were 15.5 MJ m−2 day−1 (±2.5) in the irrigated treatment and 17.1 MJ m−2 day−1 (±2.2) in the non-irrigated treatment. This difference may be related to localized spatial variability in atmospheric conditions, such as differences in cloud cover, given that the treatments were located in distinct plots (Figure 3a).
When comparing periods, Tar increases were observed during the LRP, with increments of 4.8% in the irrigated treatment and 5.5% in the non-irrigated treatment relative to the RP. Conversely, RH showed reductions of 8.2% and 9.5%, respectively. Global radiation was more intense, with increments of 20.9% in the irrigated treatment and 19% in the non-irrigated treatment, highlighting the increased atmospheric demand during the transition from the RP to the LRP (Figure 3a).
Between 2023 and 2024, the experimental areas of coconut, acid lime, and cocoa were influenced by the El Niño phenomenon, which was active from June 2023 to April 2024; following this period, the ENSO system returned to a neutral phase that persisted until December 2024 [31]. In the irrigated coconut crop, annual rainfall totaled 2251 mm in 2023 and 1923 mm in 2024. In the non-irrigated treatment, annual totals were 2504 mm in 2023 and 2536 mm in 2024 (Figure 3b). On average, 91.7% of the annual rainfall volume was concentrated in the RP, while only 8.3% occurred in the LRP, resulting in a mean reduction of 90.9% in precipitation volume compared to the RP (Figure 3b).
In the irrigated area, the total irrigation depth applied during the LRP was 440 mm in 2023 and 609 mm in 2024. The average volumetric soil water content (θ), considering the three monitored depths (Table 2), was 0.26 m3 m−3 (±0.02) in the RP and 0.22 m3 m−3 (±0.04) in the LRP, indicating a 15.38% reduction (Figure 3b). In the non-irrigated treatment, the mean θ across depths was 0.18 m3 m−3 (±0.03) in the RP and 0.10 m3 m−3 (±0.02) in the LRP, corresponding to a 44.44% reduction in soil moisture between periods. It is noteworthy that the variation in θ among treatments during the rainy season may be associated with the cover crop. In the irrigated treatment, the estimated leaf area index was 3.09 m2 m−2, whereas in the non-irrigated treatment it was 2.64 m2 m−2, which likely favored greater soil water conservation in the irrigated area (Figure 3b).
ETo was 2.83 mm day−1 (±0.36) in the RP and 3.87 mm day−1 (±0.27) in the LRP, corresponding to a 36.8% increase (Figure 3c). During the RP, the annual accumulated ETc act reached 556 mm, while in the LRP it totaled 433 mm (Figure 3c). In the non-irrigated treatment, the accumulated ETc act was 557 mm in the RP and 307 mm in the LRP (Figure 3c).
In the irrigated treatment, the mean daily ETc act for the coconut palm was 2.28 mm day−1 (±0.65) (111.40 L plant−1 day−1) during the RP and 3.55 mm day−1 (±0.73) (173.08 L plant−1 day−1) in the LRP (Figure 3c). In the non-irrigated treatment, the mean ETc act was 2.29 mm day−1 (±0.58) (111.69 L plant−1 day−1) during the RP and 2.52 mm day−1 (±0.64) (122.80 L plant−1 day−1) in the LRP (Figure 3c).

3.3. Acid Lime

For the acid lime study, averages were 27.3 °C (±0.8) for Tar, 80.1% (±9.1) for RH, and 15.5 MJ m−2 day−1 (±3.9) for Rg (Figure 4a). During the less rainy period (LRP), increments of 2.9% in Tar and 17.9% in Rg were observed compared to the rainy period (RP). Conversely, RH showed a 15.0% reduction during the LRP, indicating a higher atmospheric evaporative demand relative to the RP (Figure 4a).
Between July and December 2023, rainfall totaled 531 mm. In 2024, the annual rainfall volume was 2344 mm (Figure 4b). Of this total, 90.4% occurred during the rainy period (RP), while only 9.6% was recorded during the less rainy period (LRP), characterizing an 89.4% reduction compared to the RP (Figure 4b). This significant reduction resulted in a higher demand for supplemental irrigation during the LRP, especially for the adequate maintenance of soil moisture.
In the irrigated treatment, the total irrigation depth applied during the 2023 LRP was 492 mm, while in 2024 it totaled 482 mm (Figure 4b). The volumetric soil water content (θ), considering the average across the monitored depths in the irrigated treatment, was 0.25 m3 m−3 (±0.04) in the RP and 0.22 m3 m−3 (±0.04) in the LRP, representing a 12.0% reduction (Figure 4b). In the non-irrigated treatment, the average θ was 0.22 m3 m−3 (±0.04) during the RP and 0.15 m3 m−3 (±0.06) during the LRP, indicating a 31.8% decrease (Figure 4b).
The ETo for the municipality of the acid lime study averaged 3.25 mm day−1 (±0.62) in the RP and 3.91 mm day−1 (±0.47) in the LRP, representing a 20.31% increase (Figure 4c). The accumulated ETc act in December 2023—a month characterized as RP—was 85 mm in the irrigated treatment and 82 mm in the non-irrigated treatment. During the LRP of the same year (July to November 2023), the ETc act was 542 mm in the irrigated treatment and 452 mm in the non-irrigated treatment. For 2024, in the irrigated treatment, the accumulated ETc act for the acid lime was 472 mm in the RP and 679.10 mm in the LRP. In the non-irrigated treatment, the accumulated values were 484 mm in the RP and 511 mm in the LRP (Figure 4c).
The average daily ETc act for the acid lime in the irrigated treatment was 2.61 mm day−1 (±0.49) (39.10 L plant−1 day−1) in the RP and 3.67 mm day−1 (±0.76) (54.54 L plant−1 day−1) in the LRP (Figure 4c). In the non-irrigated treatment, the averages were 2.65 mm day−1 (±0.62) (39.70 L plant−1 day−1) in the RP and 2.87 mm day−1 (±0.61) (43.01 L plant−1 day−1) in the LRP (Figure 4c).

3.4. Cocoa Tree

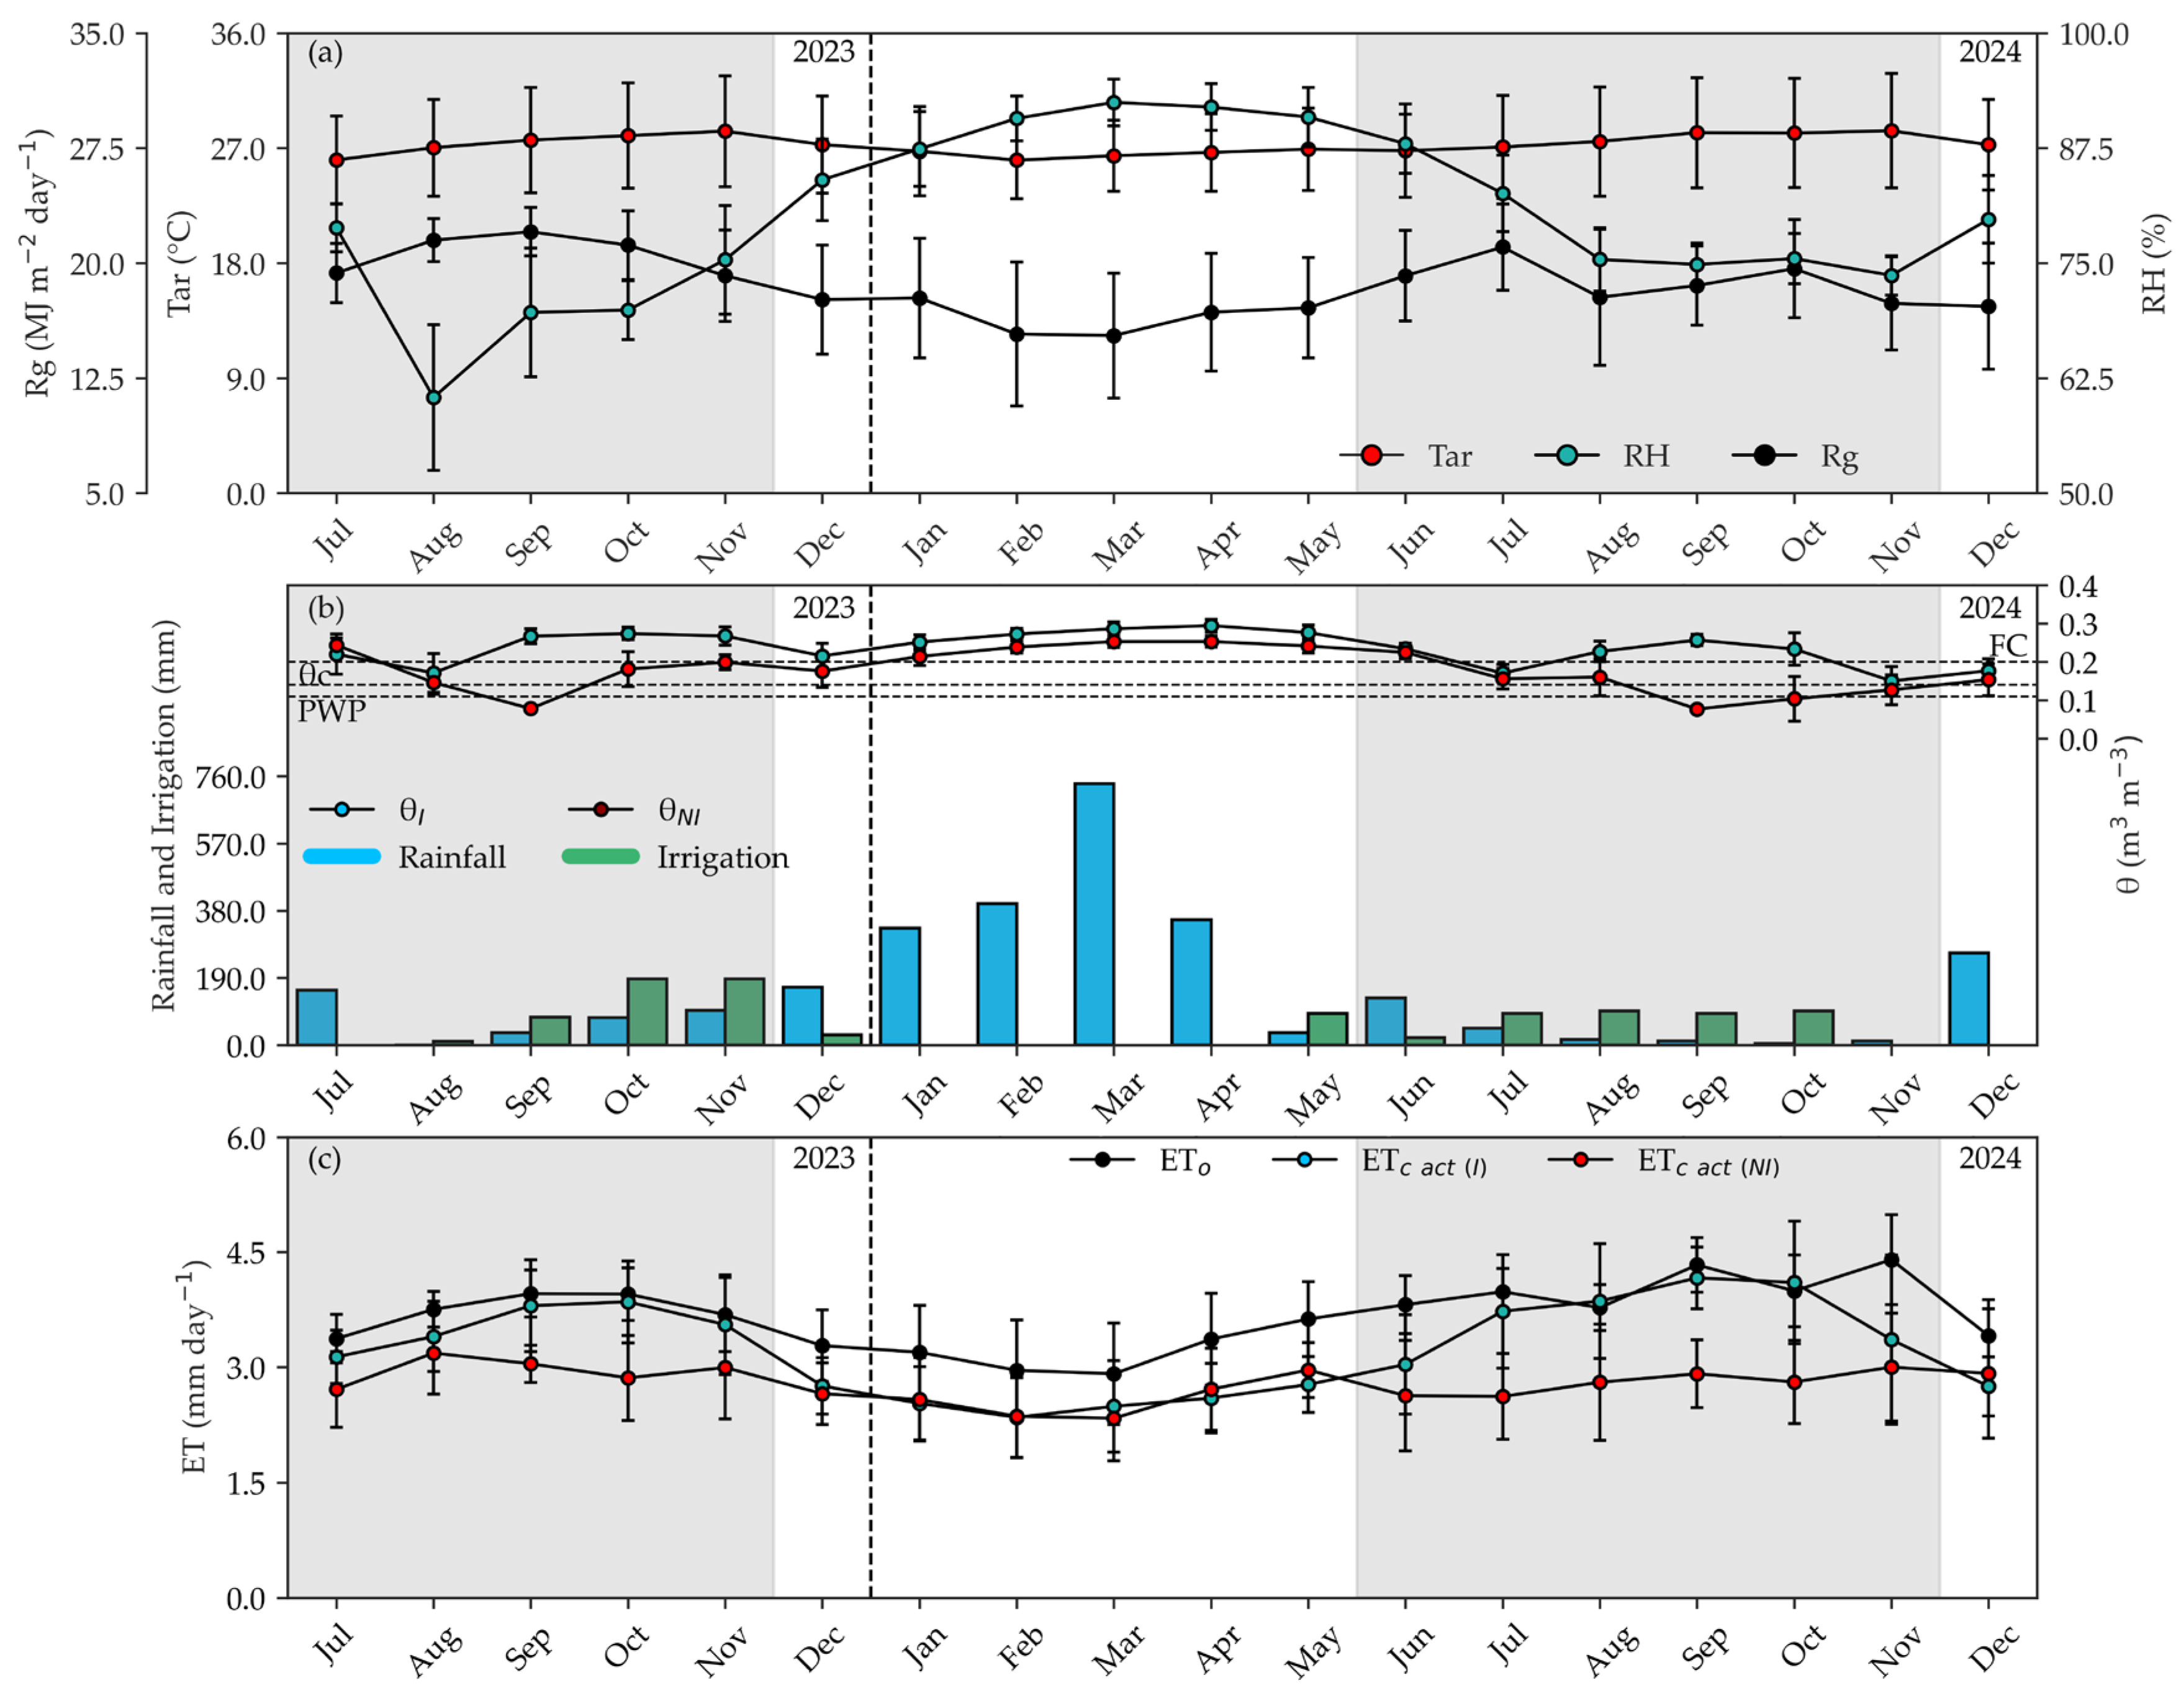
At the cocoa experimental site, the average Tar was 27.9 °C (±1.3), the average RH was 82.3% (±6.7), and the average Rg was 18.6 MJ m−2 day−1 (±2.0) (Figure 5a). During the less rainy period (LRP), increments of 6.2% in Tar and 33.3% in Rg were observed compared to the rainy period (RP). Conversely, RH showed an 11.1% reduction during the LRP relative to the RP (Figure 5a).
Between September and December 2023, rainfall in the irrigated treatment totaled 115 mm, while in the non-irrigated treatment, it was 87 mm. In 2024, the total PP volume was 1614 mm in the irrigated treatment and 1973 mm in the non-irrigated treatment (Figure 5b). Of this 2024 annual total, 81.6% occurred during the RP and 18.4% during the LRP, representing a 77.4% reduction in rainfall volume compared to the rainy period (Figure 5b). The total irrigation depth applied between September and December 2023 was 216 mm, while in 2024, the total irrigated depth was 472 mm.
In the irrigated treatment, the average volumetric soil water content (θ) was 0.26 m3 m−3 (±0.02) during the RP and 0.25 m3 m−3 (±0.03) during the LRP across all depths, corresponding to a 3.8% reduction (Figure 5b). In the non-irrigated treatment, monitoring began in December 2023 with the installation of TDR sensors, indicating an average of 0.21 m3 m−3 (±0.07) across layers in the RP and 0.19 m3 m−3 (±0.02) in the LRP, representing a 9.5% reduction (Figure 5b).
ETo was 3.62 mm day−1 (±0.71) in the RP and 4.53 mm day−1 (±0.53) in the LRP, indicating a 25.14% increment. The accumulated ETc act in December 2023—corresponding to the RP—reached 95 mm in the irrigated treatment and 98 mm in the non-irrigated treatment. Between September and November 2023 (LRP), the accumulated ETc act was 301 mm in the irrigated treatment and 120 mm in the non-irrigated treatment. In 2024, the accumulated ETc act for cocoa in the irrigated treatment was 555 mm during the RP and 749 mm during the LRP, while in the non-irrigated treatment, accumulated values were 540 mm in the RP and 279 mm in the LRP (Figure 5c).
Average daily ETc act for the irrigated treatment was 3.03 mm day−1 (±0.79) (27.31 L plant−1 day−1) in the RP and 4.02 mm day−1 (±0.84) (36.22 L plant−1 day−1) in the LRP. In the non-irrigated treatment, the average ETc act was 2.98 mm day−1 (±0.71) (26.83 L plant−1 day−1) in the RP and 1.53 mm day−1 (±0.23) (13.75 L plant−1 day−1) in the LRP (Figure 5c).

3.5. Crop Coefficient (Kc)

Based on the ratio between ETc act of the irrigated treatment and ETo, the crop coefficient (Kc) values were estimated for the conditions observed in the experimental crops during their reproductive stages. The irrigated treatment was used for this determination to ensure that soil moisture remained above the critical moisture level, thereby avoiding physiological constraints.
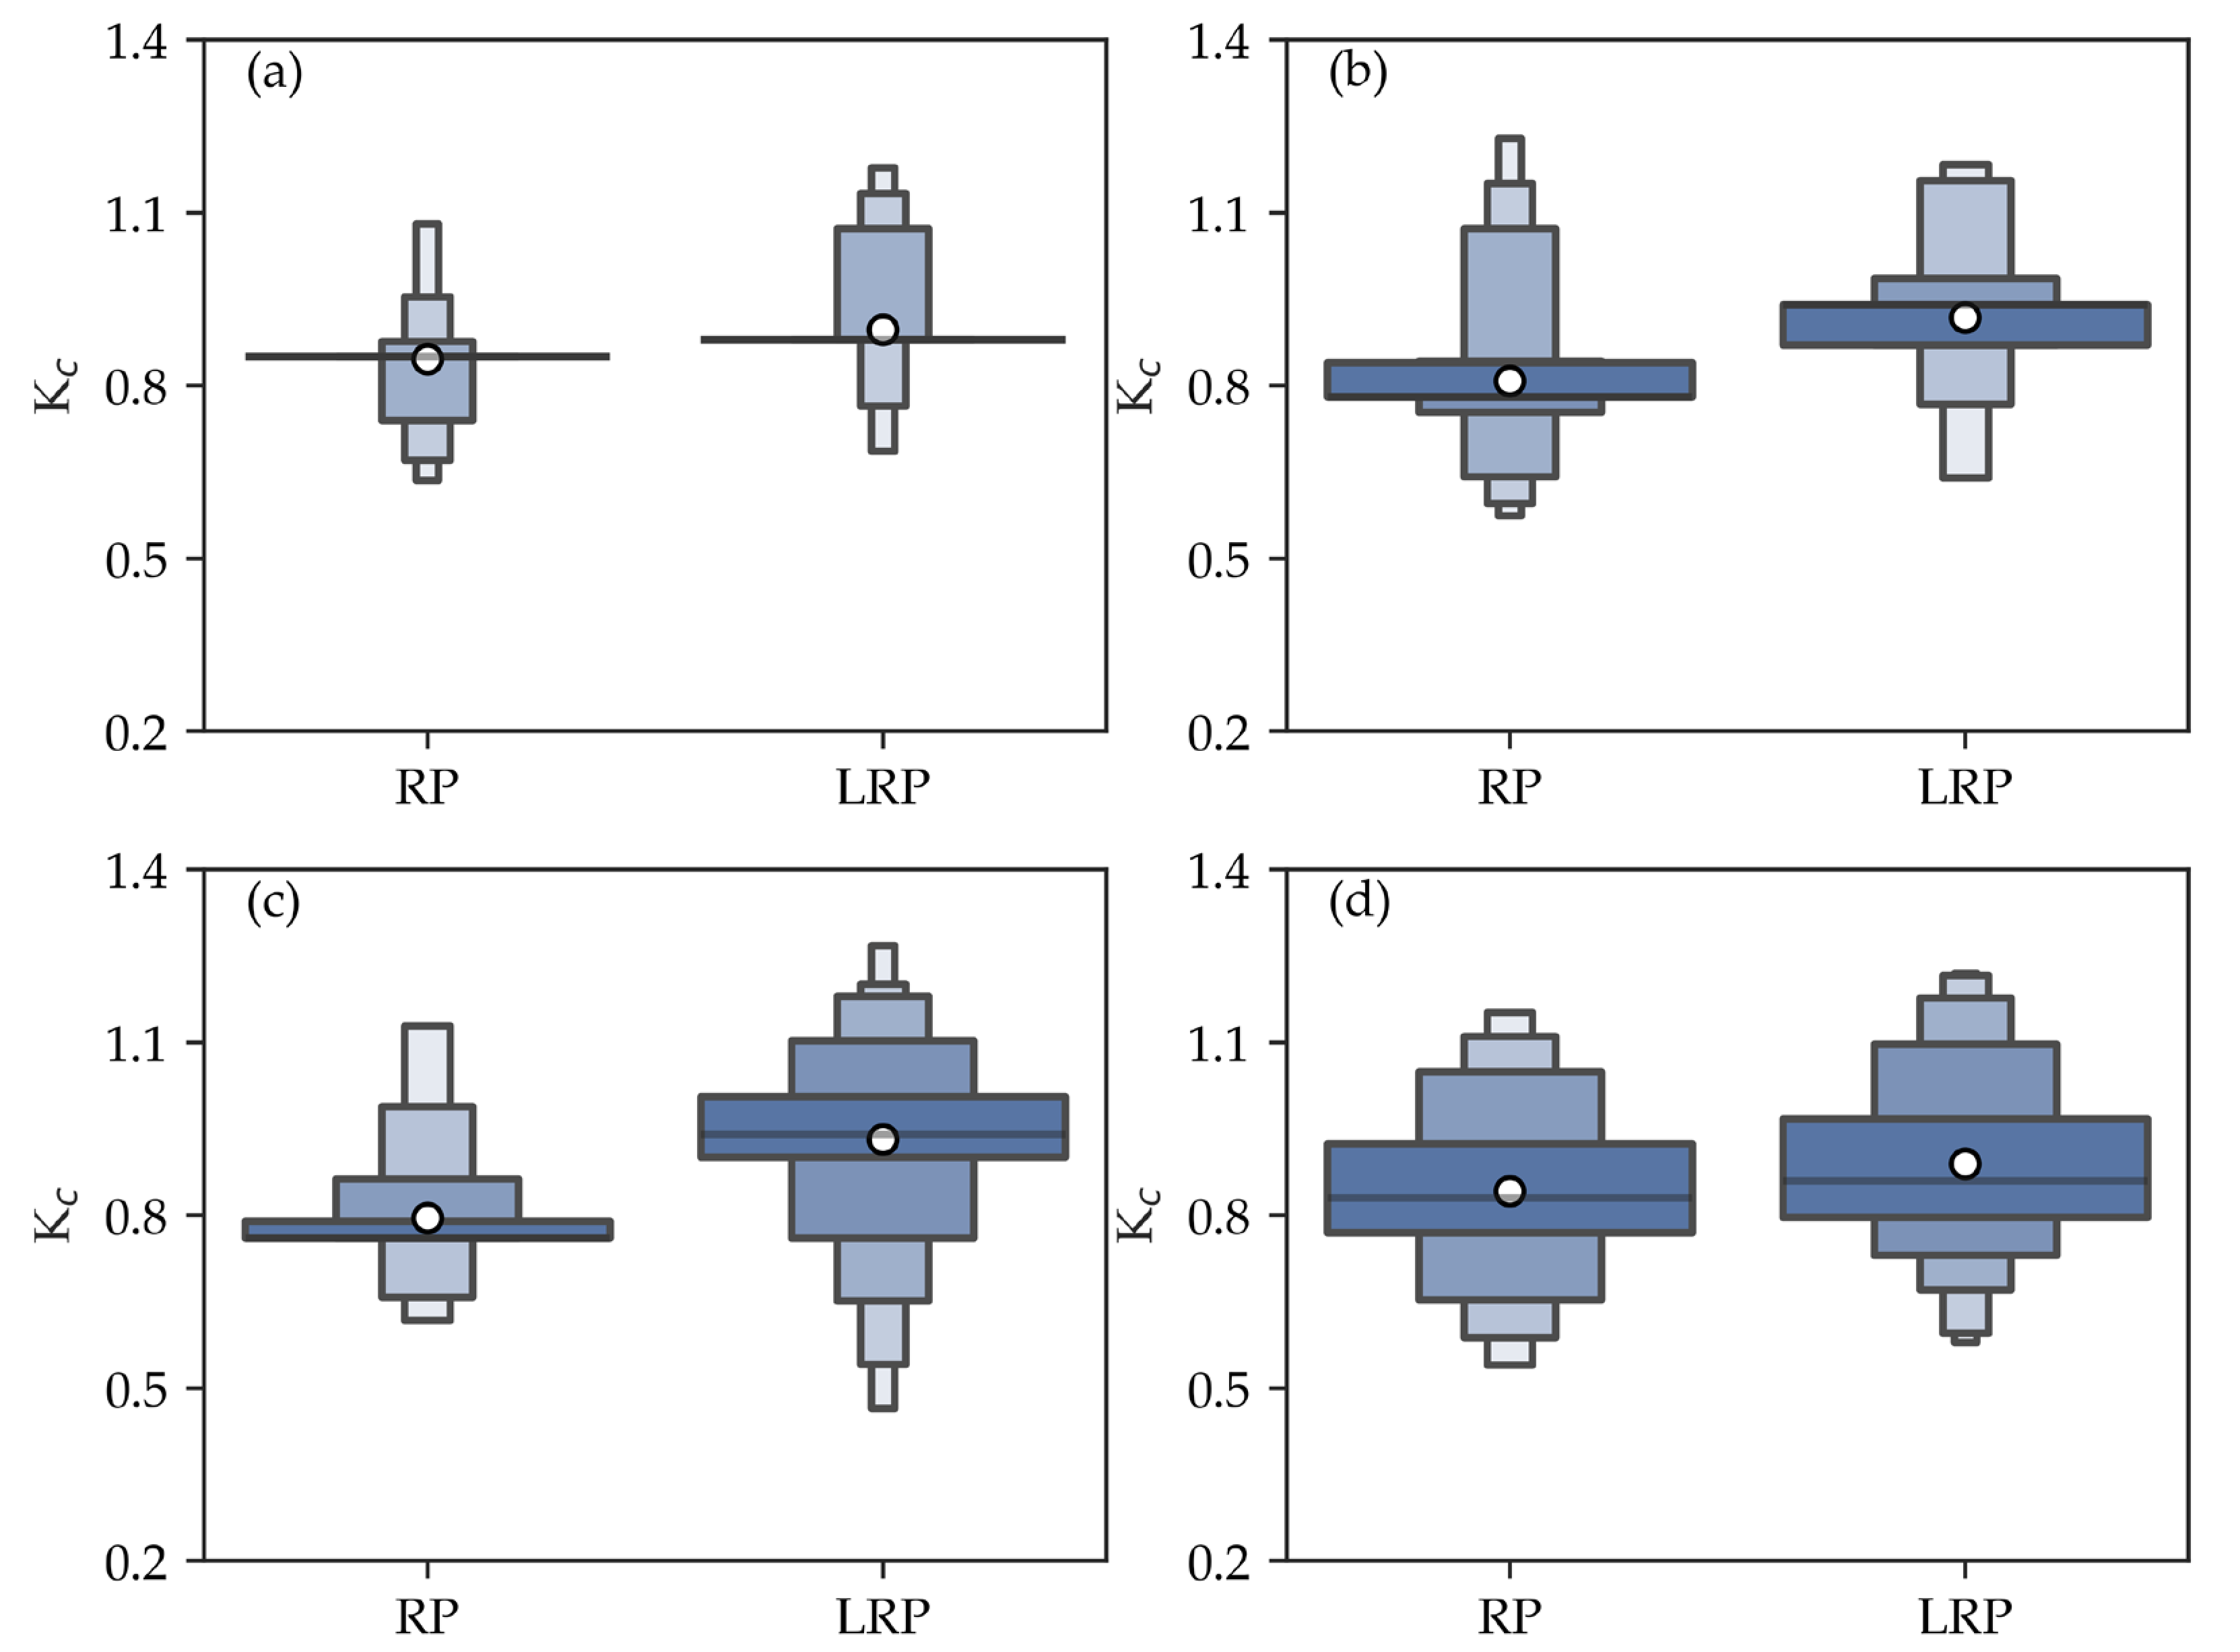
The mean Kc values and their respective confidence intervals for the rainy period (RP) and the less rainy period (LRP) are summarized in Table 4. At the açaí palm experimental site, the irrigated treatment showed average Kc values of 0.85 in the RP and 0.90 in the LRP, respectively. In the irrigated dwarf green coconut crop, average Kc values varied from 0.81 in the RP to 0.92 in the LR, while in the irrigated acid lime, the average Kc was 0.81 during the RP and 0.93 in the LRP. For the irrigated cocoa crop, mean Kc values were 0.84 in the RP and 0.89 in the LRP.
The variations in Kc values are illustrated in Figure 6, which presents the data distribution through letter-value box plots. In this diagram, the central horizontal line represents the median, the white dot indicates the arithmetic mean, and the progressively smaller boxes represent the distribution of the data quantiles, allowing a detailed visualization of Kc variability under the observed climatic conditions.
The determination of a mean Kc for the reproductive phase of the evaluated crops, without segmentation by specific phenological stages, is justified by the behavior of perennial crops in tropical regions. Under these conditions, processes such as flowering, fruiting, and vegetative growth occur simultaneously within the same plant. Therefore, the consolidated Kc values for the production phase (Figure 6) provide a practical and operational tool for regional irrigation management, reflecting the integrated water demand of the crop at its stage of greatest physiological requirement.

3.6. Soil Water Stress Coefficient (Ks)

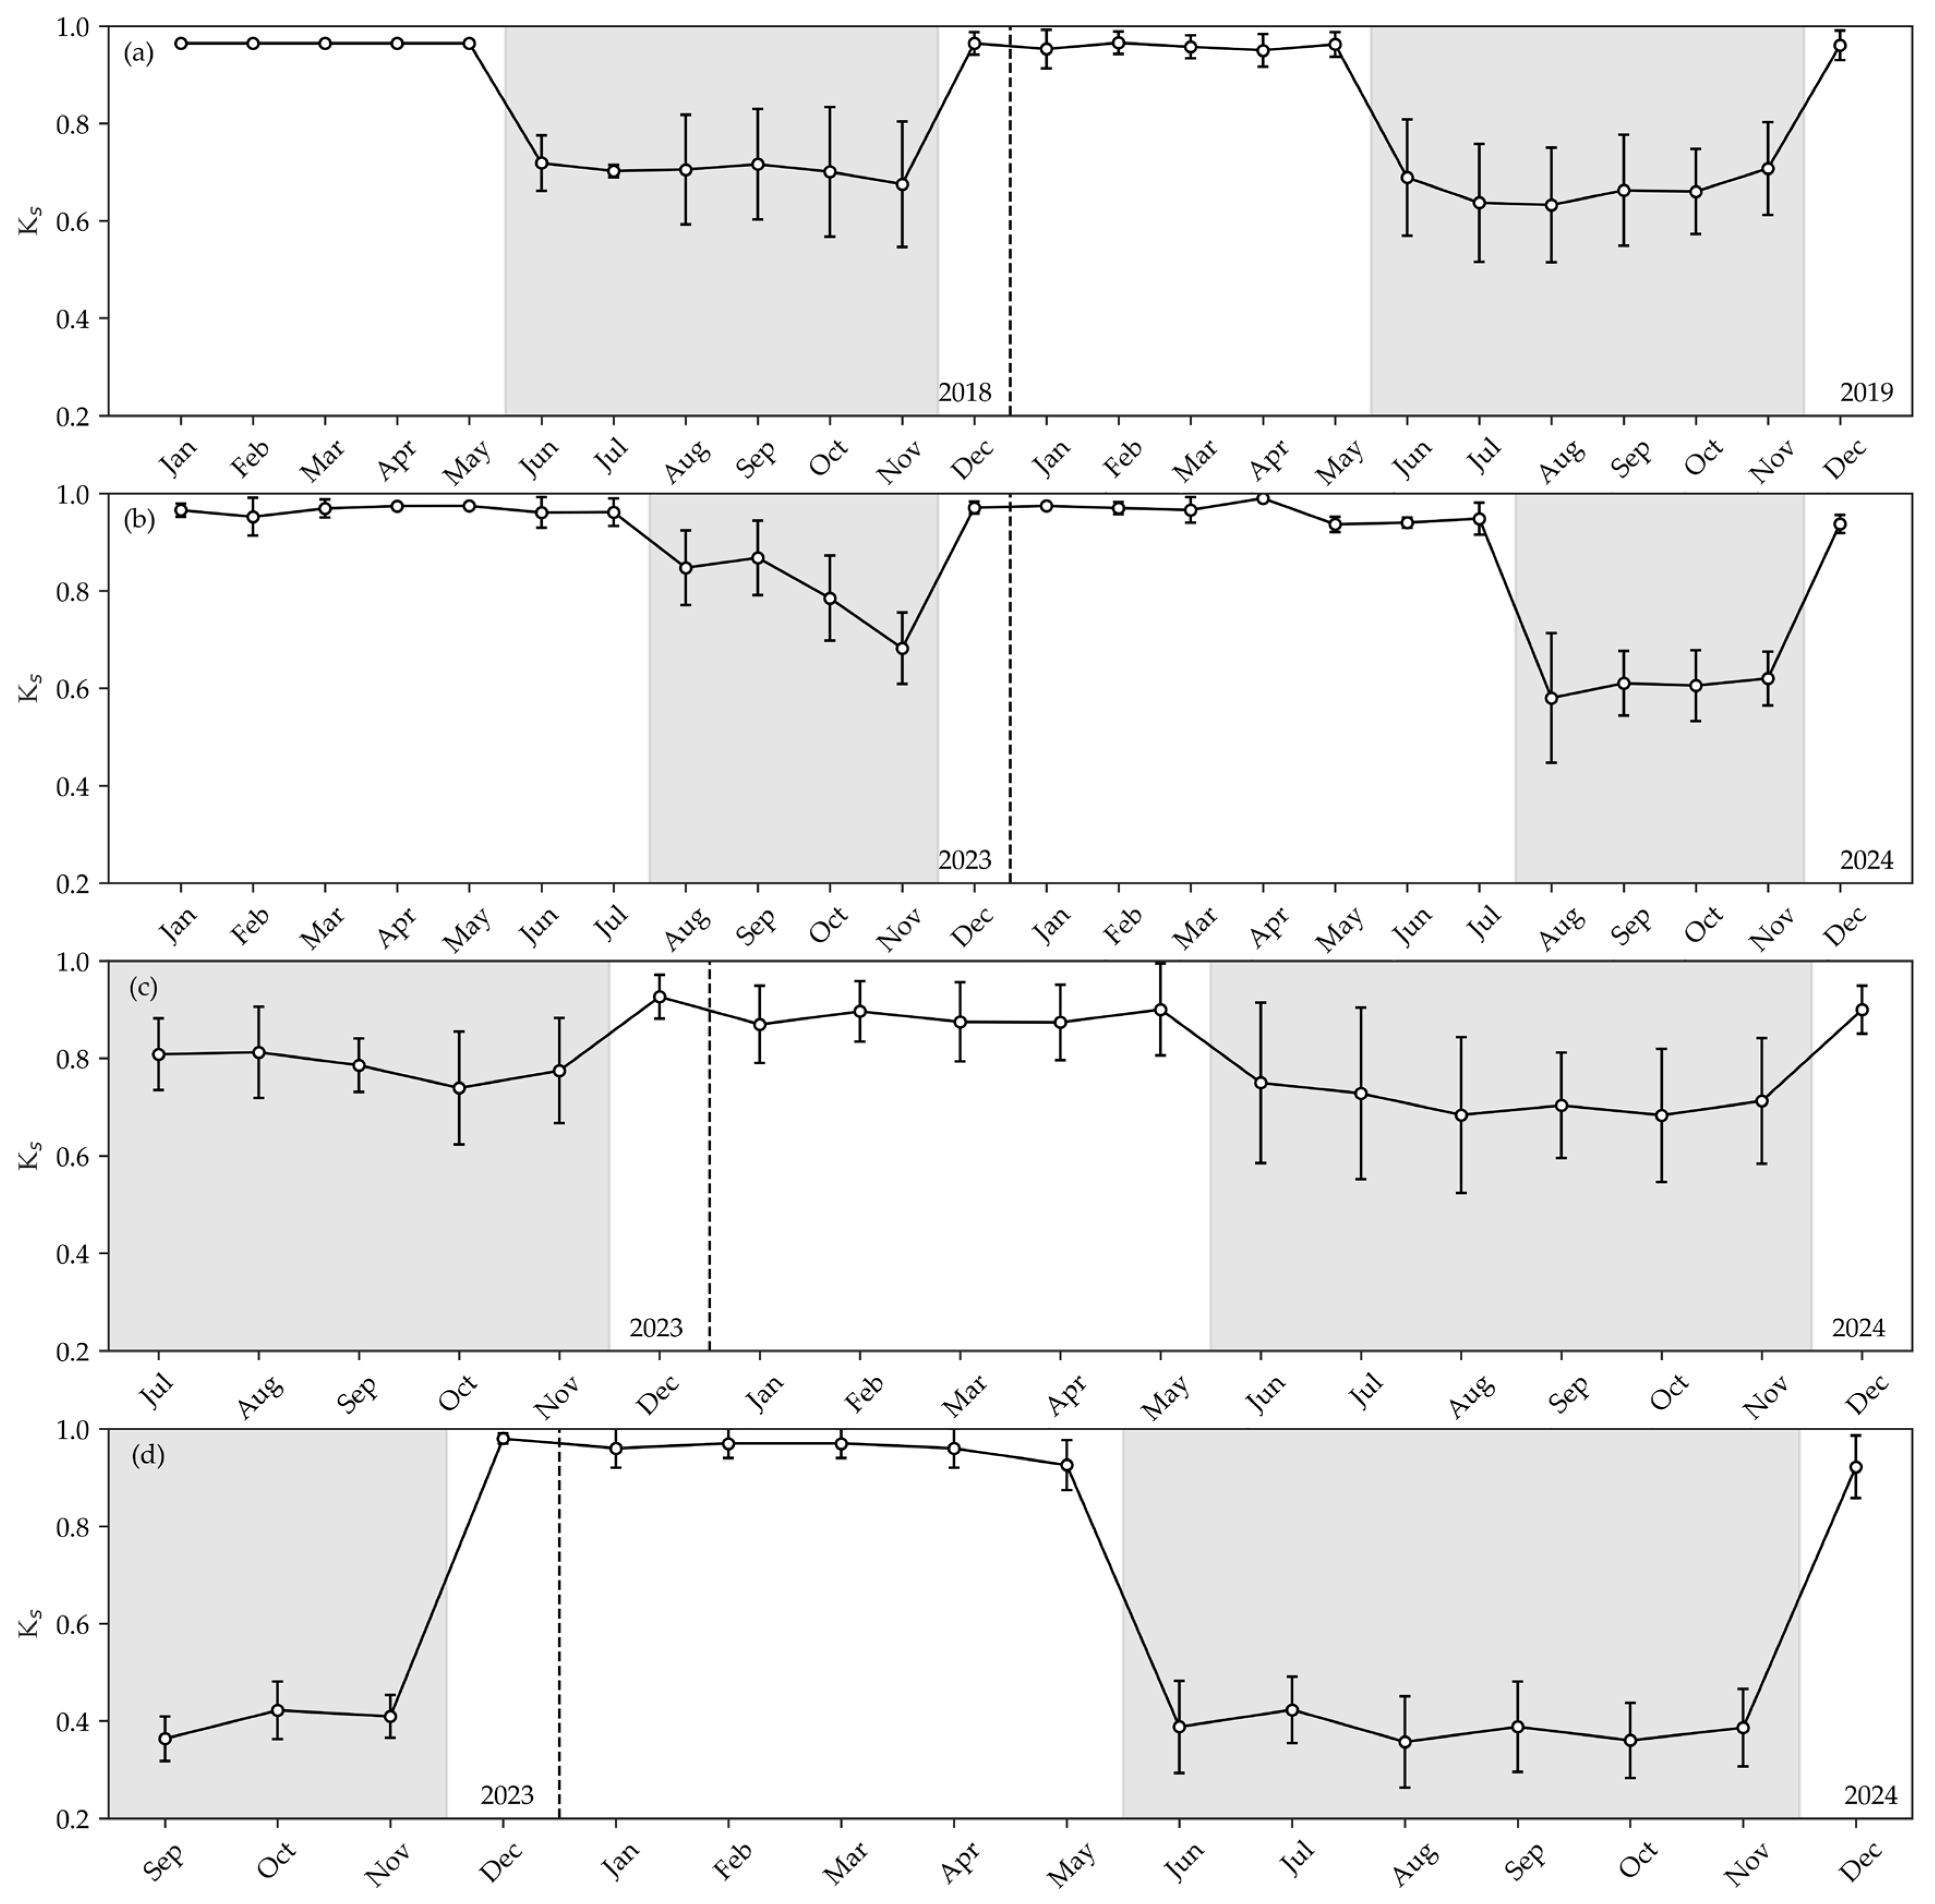
During the rainy period, no influence of soil water limitation on crop evapotranspiration was observed. This is corroborated by the average values of the soil water stress coefficient (Ks), which remained equal to 1 for all evaluated fruit trees (Figure 7), indicating an absence of water restriction and adequate conditions for crop development during this period. This result is consistent with the high soil moisture recorded throughout the rainy phase, which ensured satisfactory levels of soil water supply to the evaluated crops.
During the less rainy period, a reduction in the average values of the soil water stress coefficient (Ks) was observed for all evaluated fruit trees. The estimated averages were 0.7 for the açaí palm and dwarf green coconut, 0.8 for the acid lime, and 0.4 for the cocoa tree (Figure 7). The decrease in Ks reflects the lower soil water availability during this interval, conditioned both by the reduction in rainfall input and the water-holding capacity of each soil type. These results highlight the impact of seasonality on the soil water balance, resulting in different levels of water stress among the evaluated crops.

4. Discussion

The ETc act values obtained for the irrigated açaí palm in this study were lower than those reported by Sousa et al. [8], who obtained an average of 3.49 mm day−1, equivalent to a water consumption of 83.76 L plant−1 day−1, over two monitored seasons in an experiment with 8-year-old açaí palms in northeastern Pará, using the Bowen Ratio method. It is important to highlight that this methodology generalizes sensible and latent heat fluxes at the agroecosystem scale, incorporating the contribution of both the crop row and the inter-row to the crop evapotranspiration.
Under these conditions, the higher evapotranspiration observed by Sousa et al. [8] can be largely attributed to the evaporative contribution of the inter-row. Considering the average Kcb value reported by the authors and the average ETo for the period, an approximate transpiration of 2.72 mm day−1 is estimated—a value close to the ETc act averages obtained in the present study when the evaporative fraction is disregarded. Thus, the soil water balance method, by measuring water fluxes in a localized manner around the root system, substantially reduces the influence of the inter-row, resulting in greater precision for determining the main crop’s evapotranspiration, which justifies the results presented in this work [3,32].
In general, for the dwarf green coconut, the evapotranspiration values obtained in this study ranged between 2.28 and 3.55 mm day−1. In northeastern Brazil, using localized determination methods (such as weighing lysimeters), Sousa et al. [33] estimated an average ETc act of 3.90 mm day−1, corresponding to a water consumption of approximately 122.19 L plant−1 day−1 in the state of Sergipe. Similarly, Miranda et al. [34], in Ceará, obtained an average of 3.86 mm day−1 with a consumption of 188.00 L plant−1 day−1 using the soil water balance method.
The ET act values in the study for dwarf green coconut are lower than those reported in other studies. These differences can be attributed to various experimental factors, such as plant age, management practices, soil characteristics, and specific weather conditions. While Sousa et al. [33] recorded an average ETo of 4.2 mm, Miranda et al. [34] reported an average temperature of 27 °C and global radiation of 20.9 MJ m−2 day−1. These values are higher than those observed in this study, indicating a greater atmospheric evaporative demand. This set of conditions favors higher ETc act rates, justifying the higher ETc values reported by these authors compared to the results of the present study.
For the “Tahiti” acid lime, the average ETc act values in both irrigated and non-irrigated treatments during the RP were higher than those reported by Marin et al. [35], who observed an average ETc of 0.90 mm day−1 under low atmospheric demand conditions (ETo of 2.8 mm day−1). This value is 13.9% lower than the average ETo observed in the present study for the RP, which helps explain the discrepancies between the results, in addition to inherent experimental differences such as plant age, soil type, and evapotranspiration method.
In the period of highest atmospheric demand, Marin et al. [35] reported an average ETc of 2.8 mm day−1 under an ETo of 4.4 mm day−1, a value similar to that observed in this study for the non-irrigated treatment (2.87 mm day−1). However, since the plants evaluated by Marin et al. [35] were irrigated, a discrepancy arises when comparing their results to the irrigated treatment analyzed here, which showed an average ETc of 3.67 mm day−1. This difference may be related to the high atmospheric demand in the study by Marin et al. [35] (ETo ranging between 3 and 7 mm day−1), which may have induced internal resistance to water flow and stomatal closure, reducing transpiration and keeping ETc below 4 mm day−1. The authors highlight that ETc tended to reach its maximum values only when ETo exceeded 4 mm day−1, a behavior consistent with the values observed in the present study under irrigation during the LRP.
The evapotranspiration of irrigated cocoa in this study showed higher values than those found by Almeida et al. [36], who estimated an ETc of 2.20 mm and a daily consumption of 20.2 L plant−1 day−1 in 12-year-old cocoa trees in Bahia using the Thornthwaite & Mather method. This value only approaches that obtained in the non-irrigated treatment of the present study. The discrepancies relative to the other results are mainly attributed to methodological differences in ETc determination and the experimental conditions described by the authors—especially the absence of irrigation combined with irregular rainfall at the beginning of the experiment—which resulted in periods of soil water depletion and a sharp reduction in water storage, factors that limited crop evapotranspiration.
Conversely, the average ETc act values found in the present study for cocoa are close to those found in the literature. Hafif [37], in Indonesia, recorded values ranging between 2.3 and 5.2 mm. Similarly, Kaimuddin et al. [38], also in Indonesia, observed an average ETc of 3.43 mm, and López-López [39], in Mexico, found average values of 3.52 mm day−1. The proximity between these results and those obtained in the present study reinforces the understanding of cocoa water demand under various climatic conditions and production systems, contributing to the robustness and applicability of the generated data.
The daily evapotranspiration data of the evaluated fruit trees did not meet the assumptions of normality and homogeneity of variance required for ANOVA. Thus, non-parametric Kruskal-Wallis and Wilcoxon-Mann-Whitney tests (p < 0.05) were performed to verify the significance of the differences observed between periods and treatments. During the RP, no significant statistical differences were observed between irrigated and non-irrigated treatments. However, in the LRP, ETc act was significantly higher in the irrigated treatment compared to the non-irrigated one (p < 0.05), highlighting the crops’ response to water availability during this interval of higher atmospheric evaporative demand. The interaction within each treatment with the analyzed periods indicated that, under both conditions, ETc act was significantly higher in the LRP compared to the RP, with the exception of the non-irrigated açaí palm and cocoa crops, for which ETc act was higher during the RP than the LRP—a behavior associated with the greater water restriction verified in the less rainy period (Appendix A, Table A4).
The lower evapotranspiration values observed in irrigated fruit trees during the RP, compared to the LRP, are associated with the lower atmospheric demand during this period. Although the high rainfall volume maintains soil moisture above the threshold required to fully meet crop water demand, the atmospheric conditions prevailing in the RP restricted evapotranspiration rates. This occurs due to the reduction in global radiation (Rg) and air temperature (Tar), combined with the increase in relative humidity (RH), variables that exert a strong influence on the evapotranspiration process (Figure 2a, Figure 3a, Figure 4a, and Figure 5a) [15]. Under such conditions, even in the absence of a water deficit, plants tend to exhibit limitations in gas exchange, resulting in lower ETc act values [8].
For non-irrigated plants, on the other hand, evapotranspiration is expected to be reduced during the period of greatest water restriction, even in the face of higher atmospheric demand for water vapor [40]. This behavior was observed for the açaí palm and cocoa tree in the non-irrigated treatment, which showed higher average evapotranspiration during the RP, a period when the water supply from rainfall was higher. In the LRP, the sharp reduction in rainfall volume and the absence of irrigation resulted in lower soil water availability, physiologically limiting plant transpiration and, consequently, reducing the average ETc in these crops (Figure 2b and Figure 5b). Thus, the lower evapotranspiration observed in the LRP is related to low soil water availability, as well as high atmospheric evaporative demand, resulting in a soil water deficit.
Additionally, the soil of the açaí palm experimental area is characterized as sandy loam, with high sand content (Table 2), showing high permeability, which favors greater water infiltration but results in low water-holding capacity [41]. During prolonged periods without rainfall, a sharp drop in volumetric soil water content was observed (Figure 2b). Although water application in the irrigated treatment met the plants’ water demand, the supply provided was not sufficient to significantly raise soil moisture, possibly due to the physical-hydric characteristics of this soil, marked by rapid drainage and low water retention (Figure 2b).
In this context, it was observed that, although active irrigation was initiated only in September (Figure 2), significant differences in ETc act values between treatments were already evident from June to August, even in the absence of irrigation. This behavior may be associated with the distribution of the açaí palm root system under different water regimes. A study conducted at the same experimental site demonstrated that irrigated plants develop a total root density approximately 31% greater than that of non-irrigated plants, with about 80% of this concentration located within the first 0.2 m of soil depth [42].
This greater root development may have been established during previous irrigation cycles, enabling more efficient use of water stored in the soil during the rainy period. Thus, even before the onset of irrigation in September, the higher root density may have facilitated greater water uptake, allowing plants in the irrigated treatment to better meet atmospheric demand compared with those in the non-irrigated treatment.
The açaí palm is a species with high water requirements [8], a characteristic that makes it particularly sensitive to soil moisture reduction. As shown in Figure 2b, a reduction of over 30% in volumetric soil water content occurred during the LRP. On several occasions, the volumetric water content fell below the critical soil moisture threshold, which may have resulted in a lower water supply for the non-irrigated açaí palms. Under this condition, part of the atmospheric demand imposed during the LRP remains unmet, restricting the transpiration process. In prolonged water deficit situations, studies demonstrate that the açaí palm reduces gas exchange efficiency, compromising physiological performance [43].
In the cocoa crop, the irrigated treatment did not show a major reduction in soil water content between the RP and LRP (Figure 5b), maintaining moisture levels between field capacity and the permanent wilting point. This stability is associated with the high clay content in the soil (Table 2), an attribute that favors greater soil water retention [44]. In the non-irrigated treatment, however, a greater loss of soil moisture was observed (Figure 5b), with values close to the permanent wilting point. Although the soil maintained adequate water storage at the beginning of the LRP, the prolonged absence of rainfall—especially from October onwards—resulted in a sharp reduction in volumetric soil water content (Figure 5b).
Under these conditions, the lower performance observed in the cocoa tree during the LRP may be related to leaf senescence in response to reduced soil water availability. Field observations indicated that irrigated cocoa plants had an average canopy area of approximately 6 m2, whereas non-irrigated plants exhibited more open canopies with an average area of 4 m2. This morphophysiological response constitutes an acclimation mechanism of the species to water deficit, as well as to conditions of higher air temperature and vapor pressure deficit observed in this experiment (Figure 5a) [45]. According to these authors [40], this adaptive strategy stems from the high sensitivity of the cocoa root system, which is capable of identifying and rapidly responding to changes in soil physical-chemical parameters, especially water limitation.
The higher ETc act values observed in all irrigated crops during the LRP compared to the RP can be explained by the increment in atmospheric water vapor demand characteristic of this period (Figure 2a, Figure 3a, Figure 4a, and Figure 5a), a condition that favors increased evapotranspiration [3]. Furthermore, the continued water availability in the irrigated treatment allowed plants to express their maximum evapotranspirative potential under more demanding atmospheric conditions, justifying the higher values recorded in the LRP.
The higher evapotranspiration values obtained during the LRP for non-irrigated coconut and acid lime crops—a behavior opposite to that identified for açaí and cocoa—seem to be associated with the soil water regime and the vertical dynamics of moisture along the soil profile. Despite the lack of irrigation, the water content present in the soil proved sufficient to meet part of the atmospheric demand in the LRP, as indicated by the θ values observed at both experimental sites (Figure 3b, and Figure 4b).
In the coconut crop, even with a 44.4% reduction in θ between the RP and LRP, moisture remained close to the critical soil content during the 2023 LRP and only approached the permanent wilting point in 2024 (Figure 3b). Additionally, the cover crop may have contributed to reducing water losses by decreasing soil evaporation. Although insufficient to compensate for the absence of irrigation, this vegetative cover may have prevented an even more pronounced decline toward the permanent wilting point. For the acid lime, the 31.82% reduction in θ also did not result in moisture below the critical soil content in most months, except for September 2023 and September and October 2024, when it fell below the permanent wilting point (Figure 4b).
It is important to highlight that the values presented in Figure 2b, Figure 3b, Figure 4b, and Figure 5b represent averages of the three monitored depths (0.1, 0.3, and 0.5 m). Evaluating the data in a stratified manner, it was observed that the 0.1 m and 0.3 m layers showed reductions close to 0.05 m3 m−3, likely influenced by evaporation water losses in the topsoil and, therefore, below the averages of the three depths. In contrast, the 0.5 m layer recorded higher averages (0.16 m3 m−3), maintaining moisture above the critical threshold in this layer and possibly ensuring adequate hydration levels for these crops. Thus, the maintenance of high moisture at depth may have been decisive for the higher evapotranspiration values observed during the LRP.
Another factor corroborating the evapotranspiration results obtained for this non-irrigated treatment refers to the soil characteristics at both experimental sites, classified as Latossolo Amarelo Distrófico Argissólico (Dystrophic Yellow Latosol/Oxisol). Soils with a textural B horizon, which present a sandy loam or finer texture and an increase in clay content relative to the A or E horizons, tend to exhibit higher water-holding capacity [21]. The presence of this more clayey horizon favors water retention at depth, providing more stable moisture even under superficial water deficit conditions.
Furthermore, it is observed that the coconut tree concentrates most of its root system within the first 0.6 m of depth [46], while the acid lime, starting from its fifth year of development, can present roots down to 1.10 m [47], allowing for the exploration of deeper and wetter zones. These morphophysiological characteristics help explain the high evapotranspiration values observed even without irrigation, as the plants are able to access water reserves in deeper layers of the profile and respond to the high atmospheric evaporative demand.
In the case of the açaí palm, Sousa et al. [8] found a Kc of 1.08 for the Amazon region. However, it is noteworthy that the higher ETc values obtained by those authors may have overestimated the Kc due to the method used to determine ETc and the specificities of the adopted water balance. This indication is reinforced by the similarity between the reference evapotranspiration (ETo) recorded in the cited study (3.24 mm day−1) and in the present study, which was 3.18 mm day−1 during the experimental period.
For the dwarf green coconut, Carvalho et al. [3] found a Kc of 1.06 under the same conditions as this study, using the Bowen Ratio Energy Balance (BREB) method. Miranda et al. [34] and Teixeira et al. [48] reported Kc values ranging between 0.63 and 1.02 in the coastal region of Ceará, slightly above the value recommended by the FAO, which is 1.0 [10]. As discussed by Araújo et al. [49], adopting a Kc close to 1.0 may result in excessive water application during certain periods of the year. This behavior was also evidenced in the present study, in which the use of the Kc of 1.06 [3] resulted in soil moisture above field capacity during the irrigated period (Figure 3b). Thus, establishing a regional average Kc for irrigated coconut equal to 0.84 (RP = 0.81 and LRP = 0.92) proves crucial for irrigation management, allowing for a reduction in the applied depth by up to 20.8% without compromising crop performance.
The lower Kc values observed in this study for the dwarf green coconut, compared to those used by Carvalho et al. [3], can be attributed to differences between the methods used. The soil water balance directly considers the volume of water available in the plant’s root zone under localized irrigation, while the BREB integrates energy and mass fluxes over a wider area. In the present case, although the irrigation system used micro-sprinklers, the wetting of the inter-row favored soil evaporation, which was captured by the BREB method and reflected in higher ETc and, consequently, Kc values.
For the acid lime, the Kc values found were similar to those obtained by Pinto et al. [40], who obtained Kc between 0.74 and 0.84 for the “Tahiti” cultivar in Capitão Poço—PA, a region close to the area of the present study. Marin et al. [35] found Kc between 0.68 and 0.74 for the same crop in the state of São Paulo. In a broader context for the Citrus genus, studies conducted by Jamshidi et al. [50] and Maestre-Valero et al. [51] reported Kc between 0.40 and 1.15. The Kc values obtained in this work are also close to those recommended by the FAO [15] for citrus orchards with active ground cover, situated between 0.70 and 1.0.
The Kc values obtained in this study for irrigated cocoa in both periods, fall within the range reported by Paredes et al. [52], who synthesized research results from hot-dry and hot-humid tropical climates. In those studies, the evaluated cocoa trees were between 4 and 10 years old with an average height of 3 m, and coefficients were determined through soil water balance and the use of Cropwat 8.0 software. Kc values ranged between 0.70 and 1.04, reflecting the different phenological stages of the crop. The similarity between the results can be attributed to the resemblance of agronomic conditions and the approaches adopted.
Similar results were observed in Indonesia; Hafif [37] estimated Kc values from 0.83 to 0.93 for cocoa in the productive phase and approximately 3 m in height. The experiment was conducted in soil with a predominantly clayey texture and under atmospheric conditions comparable to those of this study, especially regarding temperature patterns and relative humidity. The convergence of these values reinforces the consistency of the Kc estimates obtained under conditions of adequate water supply.
The Kc values obtained for cocoa are generally lower than the FAO recommendations (1.0 to 1.05). This is important because this divergence may reflect local soil climatic specificities, variations in plant architecture, canopy density, or water constraints that influence transpiration capacity.
It was found that the crop coefficient for all irrigated fruit trees was higher during the less rainy period compared to the rainy period. For the açaí palm, the increment was 6%. This result is corroborated by Sousa et al. [8], who, investigating the açaí palm in the Amazon region, recorded a 14% increase in average Kc during the fruiting phase, which largely coincided with the period of lower rainfall.
Additionally, Pires [53], in a study conducted in the same region and during the same experimental year, found that the highest percentage of mature bunches occurs between September and December, the period corresponding to the less rainy season. Thus, the increase in Kc observed in the present study during the LRP can be attributed to the fruit maturation phase, characterized by high physiological activity resulting from complex metabolic and biochemical processes that demand high energy expenditure [54].
Similarly, irrigated coconut also showed an increase in Kc during the less rainy period. This response can be explained by the species’ reproductive phenology, as this period coincides with an increase in the production of female flowers and the average number of fruits in bunches 11 and 14 [55]. The intensification of the reproductive load tends to elevate plant metabolism, both through the higher consumption of photoassimilates and the increased photosynthetic activity of reproductive organs and developing fruits [56].
For the acid lime crop, the increase in Kc during the less rainy period may likewise be associated with the intensification of the plant’s physiological activities during the fruit maturation phase, which demands high energy expenditure [54]. This interpretation is corroborated by the results of Pinto et al. [9], who, evaluating the same crop in the same location, observed a harvest peak at the beginning of the rainy period. The authors attributed this high quantity of harvested fruits to the use of irrigation during the less rainy period, which favored fruit filling, development, and final quality, indicating that the crop has high physiological requirements during this seasonal interval.
In the case of the cocoa tree, the higher Kc value observed during the less rainy period compared to the rainy period may be related to the intensification of the plant’s physiological activity, especially the flowering and fruiting processes stimulated by irrigation. Literature highlights that during the dry season, supplemental water supply promotes greater production of young fruits and can increase cocoa flowering [57,58], which translates into higher water demand and, therefore, an increase in Kc.
For all studied fruit trees, it was observed that Kc values in the non-irrigated treatments were lower than those obtained in the irrigated treatments during the less rainy period. This difference directly reflects the reduction in soil water content in the treatments without irrigation (Figure 2b, Figure 3b, Figure 4b, and Figure 5b), which imposed a water stress condition on the plants. This condition is expressed by the stress coefficient (Kc) (Figure 7), which, when lower than 1.0, acts as a reduction factor for evapotranspiration, resulting in lower Kc values. Conversely, during the rainy period, soil moisture remained close to field capacity (Figure 2b, Figure 3b, Figure 4b, and Figure 5b), maintaining Kc close to 1.0 and indicating the absence of water restriction for the plants [15].
In summary, the results demonstrate that water management strategies in the Amazon region should be based on the specific requirements of each crop, atmospheric demand, the rainfall regime, and the soil’s physical–hydraulic properties. As observed, crops such as açaí palm and cocoa exhibited root systems that were more sensitive to seasonality; therefore, management should prioritize maintaining soil water storage in order to prevent water deficit. In contrast, coconut and acid lime showed greater resilience during the transition to the less rainy period.
In addition, irrigation practices can be optimized through real-time monitoring of soil water content using Time Domain Reflectometry (TDR) sensors, as well as through the application of irrigation depths based on the locally determined Kc values obtained in this study. The integration of these strategies makes it possible to effectively mitigate the impacts of seasonality, thereby ensuring greater production stability and climate resilience in regional fruit production systems.

5. Conclusions

During the less rainy period, irrigation ensured adequate water support for all evaluated fruit trees, enabling them to meet the higher atmospheric demand and ensuring high ETc levels under conditions of adequate water availability.
When non-irrigated, the açaí palm and the cocoa tree showed a significant reduction in ETc values during the less rainy period, highlighting their greater sensitivity to water deficit periods and emphasizing the importance of soil water availability for maintaining their physiological activities.
Conversely, the coconut tree and acid lime, even without irrigation, maintained relatively high evapotranspiration values, indicating a greater capacity to explore deeper and wetter soil layers and higher resilience to seasonal water deficits.
In comparison with the reference evapotranspiration (ETo), all fruit trees presented Kc values lower than 1.0 in both irrigated and non-irrigated environments. These results reinforce the importance of local determination of crop coefficients, especially in humid-dry tropical environments, to ensure greater precision in irrigation management and water resource planning.

Author Contributions

Conceptualization, M.L.R., G.S.T.F. and P.J.d.O.P.d.S.; methodology, M.L.R., G.S.T.F. and P.J.d.O.P.d.S.; software, M.L.R., G.S.T.F., M.G.M.S. and M.K.M.N.; validation, M.L.R., G.S.T.F., M.T.P. and P.J.d.O.P.d.S.; formal analysis, M.L.R., G.S.T.F., T.M.F., M.G.M.S., M.K.M.N., M.J.A.d.L., V.D.d.S.F., H.G.G.C.N., A.M.L.d.S., E.B.d.S., G.d.S.R., S.O.O.-F. and P.J.d.O.P.d.S.; investigation, M.L.R., G.S.T.F., T.M.F., M.G.M.S., M.K.M.N., A.J.S.V., L.M.N., J.S.d.C.D., J.B.d.C., I.A.d.O., M.J.A.d.L., V.D.d.S.F. and P.J.d.O.P.d.S.; resources, T.M.F., M.J.A.d.L., V.D.d.S.F., A.M.L.d.S. and P.J.d.O.P.d.S.; data curation, M.L.R., G.S.T.F., T.M.F., M.G.M.S., A.J.S.V., H.G.G.C.N. and P.J.d.O.P.d.S.; writing—original draft preparation, M.L.R., G.S.T.F., M.T.P. and P.J.d.O.P.d.S.; writing—review editing, M.L.R., G.S.T.F., M.T.P. and P.J.d.O.P.d.S.; visualization, P.J.d.O.P.d.S.; supervision, P.J.d.O.P.d.S.; project administration, P.J.d.O.P.d.S.; funding acquisition, P.J.d.O.P.d.S. All authors have read and agreed to the published version of the manuscript.

Funding

This research was funded by Conselho Nacional de Desenvolvimento Científico e Tecnológico (CNPq)—Granting a doctoral scholarship to the author Fernandes, G. S. T. (Edital n° 12/2020, process 154794/2021-0); Productivity grant for the author Souza, P. J. de O. P. de (Edital n° 09/2022, process 311681/2022-0). Research funding through the Universal project (process 403902/2021-5). Fundação Amazônia de Amparo a Estudos e Pesquisas (FAPESPA/CNPq)—(Call project 008/2022, process 2023/158057) and Sococo Agroindústria da Amazônia S/A.

Data Availability Statement

The data presented in this study are available upon request from the corresponding author.

Acknowledgments

We thank the Coordenação de aperfeiçoamento de pessoal de nível superior (CAPES) for the support granted through the scholarship to the first author. We also thank the ISPAAm research group and the Postgraduate Program in Agronomy (PGAgro) at the Universidade Federal Rural da Amazônia (UFRA), whose support was fundamental to the completion of this study.

Conflicts of Interest

The authors declare no conflicts of interest.

Appendix A

Table A1. Taxonomic classification of soils at the experimental sites according to the Brazilian Soil Classification System (SiBCS), World Reference Base for Soil Resources (WRB), and USDA Soil Taxonomy (USDA).
CropsSibicsWRBUSDA
Açaí palmYellow Latosol with sandy loam textureXanthic Ferralsol (Arenic, Dystric)Typic Hapludox, coarse-loamy
Dwarf green coconutDystrophic Yellow Latosol with argillicXanthic Ferralsol (Argic, Dystric)Typic Kandiudox
Acid lime
Cocoa treeClay loam ArgisolHaplic Acrisol (Clayic)Typic Paleudult, fine-loamy
Table A2. Technical specifications and accuracy of the CS615 and CS616 water content reflectometers (Campbell Scientific Inc.) used at the experimental sites.
Soil Water Content ReflectometerAccuracyRod
Spacing
Rod
Diameter
Rod Length
CS615
(Açaí palm)
±3% (typical)
±2% (with soil-specific calibration)
32 mm (1.26 in.)3.2 mm (0.126 in.)300 mm (11.81 in.)
CS616
(Other crops)
±2.5% VWC using standard calibration with bulk electrical conductivity.
≤0.5 dS/m and bulk density ≤ 1.55 g/cm3 in measurement range 0% to 50% VWC.
Table A3. Calibration equations for each TDR sensor model across the different experimental sites and treatments.
CropsSoil Water Content ReflectometerTreatmentsCalibration
Açaí palmCS615Irrigated θ = 0.038 k a 0.7182
Non-irrigated
Dwarf green coconutCS616Irrigated θ = 0.00161 k a 2 + 0.110201 k a 1.51983
Non-irrigated θ = 0.00029 k a 2 + 0.03617 k a 0.53238
Acid limeIrrigated θ = 0.00310 k a 2 + 0.18650 k a 2.48270
Non-irrigated θ = 0.00120 k a 2 + 0.09420 k a 1.34260
CocoaIrrigated θ = 0.0007 k a 2 0.0063 k a 0.0665
Non-irrigated
θ—soil volumetric water content (m3 m−3) and ka is the apparent dielectric constant.
Table A4. Statistical results using the Kruskal-Wallis and Wilcoxon-Mann-Whitney tests (p < 0.05) for the interactions between treatments and periods analyzed for crop evapotranspiration at the experimental sites.
Actual Crop Evapotranspiration (mm day−1)
CropsPeriodsTreatments
IrrigatedNon-Irrigated
Açaí palmRainy2.29 (±0.49) Ab2.26 (±0.46) Aa
Less rainy2.91 (±0.50) Aa1.99 (±0.36) Bb
Dwarf green coconutRainy2.28 (±0.51) Ab2.29 (±0.50) Ab
Less rainy3.55 (±0.68) Aa2.52 (±0.45) Ba
Acid limeRainy2.61 (±0.45) Ab2.65 (±0.54) Ab
Less rainy3.67 (±0.64) Aa2.87 (±0.57) Ba
CocoaRainy3.03 (±0.73) Ab2.98 (±0.61) Aa
Less rainy4.02 (±0.70) Aa1.53 (±0.19) Bb
Means followed by the same uppercase letter in the row and lowercase letter in the column do not differ significantly according to the Wilcoxon-Mann-Whitney test (p < 0.05).

References

  1. FAOSTAT. Food and Agriculture Organization of the United Nations (FAO). FAOSTAT Database. Available online: https://www.fao.org/faostat/en/#data/QCL (accessed on 21 November 2024).
  2. IBGE—Instituto Brasileiro de Geografia e Estatística. Produção Agrícola Municipal. 2024. Available online: https://sidra.ibge.gov.br/tabela/5457#resultado (accessed on 10 January 2025).
  3. de Carvalho, E.D.O.T.; Fernandes, G.S.T.; Rua, M.L.; Monteiro, A.C.; da Luz, D.B.; Lisboa, S.P.P.; da Silva, J.V.F.; Pinto, J.V.D.N.; de Miranda, F.R.; Lins, P.M.P.; et al. Net Radiation Partitioning, Evapotranspiration, and Crop Coefficients of the Green Dwarf Coconut in Santa Izabel do Pará, Brazilian Amazon. Bragantia 2024, 83, e20230160. [Google Scholar] [CrossRef]
  4. Ferreira Filho, D.F.; Lima, B.R.P.; Crispim, D.L.; Pessoa, F.C.L.; Fernandes, L.L. Análise pluviométrica no estado do Pará: Comparação entre dados obtidos de estações pluviométricas e do satélite GPCC. Rev. Bras. Climatol. 2021, 26, 541–560. [Google Scholar] [CrossRef]
  5. IBGE—Instituto Brasileiro de Geografia e Estatística. Censo Agropecuário 2017: Séries Temporais; IBGE: Rio de Janeiro, Brazil, 2017. Available online: https://sidra.ibge.gov.br/pesquisa/censo-agropecuario/series-temporais (accessed on 10 March 2026).
  6. Levien, S.L.A.; Figueirêdo, V.B.; De Arruda, L.E.V. Panorama da Atual Área de Agricultura Irrigada no Brasil; Editora Pantanal: Nova Xavantina, Brazil, 2021. [Google Scholar]
  7. Lahive, F.; Hadley, P.; Daymond, A.J. The physiological responses of cacao to the environment and the implications for climate change resilience. A review. Agron. Sustain. Dev. 2019, 39, 5. [Google Scholar] [CrossRef]
  8. Sousa, D.D.P.; Fernandes, T.F.S.; Tavares, L.B.; Farias, V.D.D.S.; de Lima, M.J.A.; Nunes, H.G.G.C.; Costa, D.L.P.; Ortega-Farias, S.; Souza, P.J.D.O.P. Estimation of Evapotranspiration and Single and Dual Crop Coefficients of Acai Palm in the Eastern Amazon (Brazil) Using the Bowen Ratio System. Irrig. Sci. 2021, 39, 5–22. [Google Scholar] [CrossRef]
  9. Pinto, J.V.D.N.; Costa, D.L.; Costa, A.P.D.S.; Pires, M.P.; Rolim, G.D.S.; de Sousa, A.M.; Ortega-Farias, S.; Souza, P.J. Fruit Yield and Gas Exchange of Tahiti Lime at Different Irrigation Depths in the Amazon. Rev. Bras. Eng. Agric. Ambient. 2023, 27, 463–471. [Google Scholar] [CrossRef]
  10. Doorenbos, J.; Pruitt, W.O. Guidelines for Predicting Crop Water Requirements. FAO Irrig. Drain. Pap. 1977, 24, 144. [Google Scholar]
  11. Pereira, A.R.; Sedyma, G.C.; Villa Nova, N.A. Evapotranspiração; FUNDAG: Campinas, Brazil, 2013. [Google Scholar]
  12. Srivastava, R.K.; Panda, R.K.; Chakraborty, A.; Halder, D. Comparison of Actual Evapotranspiration of Irrigated Maize in a Sub-Humid Region Using Four Different Canopy Resistance Based Approaches. Agric. Water Manag. 2018, 202, 156–165. [Google Scholar] [CrossRef]
  13. Libardi, P.L. Dinâmica da Água No Solo, 3rd ed.; Edusp: São Paulo, Brazil, 2005. [Google Scholar]
  14. Silva, A.J.P.D.; Coelho, E.F.; Filho, M.A.C. Water Extraction Variability in the Banana Root Zone Affects the Reliability of Water Balance. Sci. Agric. 2015, 72, 1–10. [Google Scholar] [CrossRef][Green Version]
  15. Allen, R.G.; Pereira, L.S.; Raes, D.; Smith, M. Crop Evapotranspiration-Guidelines for Computing Crop Water Requirements—FAO Irrigation and Drainage Paper 56. Fao Rome 1998, 300, D05109. [Google Scholar]
  16. Schwenck, V.A.X.; Queiroz, L.D.S.; Garcia, A.D.B.; de Jesus Leite, K.; Arndt, S.; de Oliveira, E.M. Coeficiente de Cultura por Lisímetria da Variedade de Sorgo Forrageiro SF—15 (Sorghum bicolor L. Moench). Rev. Bras. Agric. Irrig. 2020, 14, 3960–3967. [Google Scholar] [CrossRef]
  17. da Silva Alves, E.; Lima, D.F.; Barreto, J.A.S.; dos Santos, D.P.; dos Santos, M.A.L. Determinação do Coeficiente de Cultivo para a Cultura do Rabanete Através de Lisimetria de Drenagem. Irriga 2017, 22, 194–203. [Google Scholar] [CrossRef]
  18. Srivastava, R.K.; Panda, R.K.; Halder, D. Effective Crop Evapotranspiration Measurement Using Time-Domain Reflectometry Technique in a Sub-Humid Region. Theor. Appl. Climatol. 2016, 129, 1211–1225. [Google Scholar] [CrossRef]
  19. Alvares, C.A.; Stape, J.L.; Sentelhas, P.C.; de Moraes Gonçalves, J.L.; Sparovek, G. Köppen’s Climate Classification Map for Brazil. Meteorol. Z. 2013, 22, 711–728. [Google Scholar] [CrossRef]
  20. De Souza, E.B.; da Silva Ferreira, D.B.; Guimarães, J.T.F.; dos Santos Franco, V.; de Azevedo, F.T.M. Padrões Climatológicos e Tendências da Precipitação nos Regimes Chuvoso e Seco da Amazônia Oriental. Rev. Bras. Climatol. 2017, 21, 81–93. [Google Scholar] [CrossRef]
  21. EMBRAPA—EmpresaBrasileira de Pesquisa Agropecuária. Sistema Brasileiro de Classificação de Solos, 5th ed.; Embrapa: Rio de Janeiro, Brazil, 2018; 356p. [Google Scholar]
  22. IBGE—Instituto Brasileiro de Geografia e Estatística. Pedologia. Available online: https://www.ibge.gov.br/geociencias/informacoes-ambientais/pedologia/10871-pedologia.html (accessed on 5 February 2025).
  23. USDA—United States Department of Agriculture. Soil Survey Staff. In Keys to Soil Taxonomy, 12th ed.; USDA-NRCS: Washington, DC, USA, 2014. [Google Scholar]
  24. IUSS Working Group WRB. World Reference Base for Soil Resources: International Soil Classification System for Naming Soils and Creating Legends for Soil Maps, 4th ed.; IUSS: Vienna, Austria, 2022. [Google Scholar]
  25. Assad, M.L.L.; Sans, L.M.A.; Assad, E.D.; Zullo, J., Jr. Relação Entre Água Retida e Conteúdo de Areia Total em Solos Brasileiros. Rev. Bras. Agrometeorol. 2001, 9, 588–596. [Google Scholar]
  26. Van- Genuchten, V.M. A Closed-Form Equation for Predicting the Hydraulic Conductivity of Unsaturated Soils. Soil Sci. Soc. Am. J. 1980, 44, 892–898. [Google Scholar] [CrossRef]
  27. Mualem, Y. A New Model for Predicting the Hydraulic Conductivity of Unsaturated Porous Media. Water Resour. Res. 1976, 12, 513–522. [Google Scholar] [CrossRef]
  28. Brandão, V.D.S.; Cecilio, R.A.; Pruski, F.F.; da Silva, D.D. Infiltração da Água no Solo, 3rd ed.; Editora UFV: São Paulo, Brazil, 2006. [Google Scholar]
  29. Soto, M.A.A.; Kiang, C.H. Avaliação da Condutividade Hidráulica em Dois Usos do Solo na Região Central do Brasil. Rev. Bras. Ciências Ambient. 2018, 47, 1–11. [Google Scholar] [CrossRef]
  30. Python Software Foundation. Python Language Reference. Available online: https://www.python.org/downloads/ (accessed on 27 March 2023).
  31. NOAA—National Oceanic and Atmospheric Administration. El Niño and La Niña: Related Resources. Available online: https://origin.cpc.ncep.noaa.gov/products/analysis_monitoring/ensostuff/ONI_v5.php (accessed on 29 January 2025).
  32. de Azevedo, P.V.; de Sousa, I.F.; da Silva, B.B.; da Silva, V.D.P.R. Water-Use Efficiency of Dwarf-Green Coconut (Cocos nucifera L.) Orchards in Northeast Brazil. Agric. Water Manag. 2006, 84, 259–264. [Google Scholar] [CrossRef]
  33. Sousa, I.F.; Netto, A.O.A.; Campeche, L.F.M.S.; Barros, A.C.; da Silva, V.d.P.R.; de Azevedo, P.V. Lisímetro de Pesagem de Grande Porte.Parte II: Consumo hídrico do coqueiro anão verde irrigado. Rev. Bras. Eng. Agric. Ambient. 2011, 15, 526–532. [Google Scholar] [CrossRef]
  34. Miranda, F.R.D.; Gomes, A.R.M.; de Oliveira, C.H.C.; Montenegro, A.A.T.; Bezerra, F.M.L. Evapotranspiração e Coeficientes de Cultivo do Coqueiro Anão-Verde na Região Litorânea do Ceará. Cienc. Agron. 2007, 38, 129–135. [Google Scholar]
  35. Marin, F.R.; Angelocci, L.R.; Nassif, D.S.P.; Costa, L.G.; Vianna, M.S.; Carvalho, K.S. Crop Coefficient Changes with Reference Evapotranspiration for Highly Canopy-Atmosphere Coupled Crops. Agric. Water Manag. 2016, 163, 139–145. [Google Scholar] [CrossRef]
  36. Almeida, H.A.; Vila Nova, N.A.; Klar, A.E. Estimativa da Demanda Hídrica do Cacaueiro (Theobroma cacao L.). Rev. Bras. Frutic. 2004, 22, 402–406. [Google Scholar]
  37. Hafif, B. Analysis of Agroecology and The Requirement of Supplemental Irrigation on Cacao Plants in Lampung. J. Tanam. Ind. Penyegar 2017, 4, 1–12. [Google Scholar] [CrossRef]
  38. Kaimuddin; Mustari, K.; Khairunnisa, A.; Zul, F.; Bahrun, A.H.; Ridwan, I.; Widiayani, N. Water Requirement for Cocoa (Theobroma cacao L.) Plant and the Effect of Climate Factors on the Distribution of the Cocoa Pod Borer Attacks (Conopomorpha Cramerella Snellen) in North Luwu Regency Using Cropwat 8.0. IOP Conf. Ser. Earth Environ. Sci. 2020, 575, 012116. [Google Scholar] [CrossRef]
  39. López-López, R.; Ojeda-Bustamante, W.; López Andrade, A.P.; Catalán-Valencia, E.A. Método de Pulso de Calor y Flujo de Savia Para Medir La Transpiración En El Cultivo de Cacao. Rev. Chapingo Ser. Zon. Áridas 2013, 12, 85–96. [Google Scholar] [CrossRef]
  40. Pinto, J.V.D.N.; Costa, D.L.P.; Nunes, H.G.G.C.; Silva Junior, A.C.D.; Sousa, A.M.L.D.; Souza, P.J.D.O.P.D.; Ortega-Farias, S. Radiation Balance and Partitioning of Latent and Sensible Heat Fluxes Over a Lime Orchard in Eastern Amazon. Rev. Bras. Meteorol. 2022, 37, 491–502. [Google Scholar] [CrossRef]
  41. Khanh, P.T.; Pramanik, S.; Ngoc, T.T.H. Soil Permeability of Sandy Loam and Clay Loam Soil in the Paddy Fields in An Giang Province in Vietnam. Environ. Chall. 2024, 15, 100907. [Google Scholar] [CrossRef]
  42. Rua, M.L.; Costa, D.L.P.; Martins, C.G.D.; Pinto, J.V.N.; Velame, M.L.A.; Lisboa, S.P.P.; Monteiro, A.C.; Carvalho, E.O.T.; Vieira, I.C.O.; Luz, D.B.; et al. Densidade vertical de raiz de Euterpe oleracea Mart. sob diferentes lâminas de irrigação em monocultivo e consórcio, Leste da Amazônia Brasileira. In Ciências Agrárias: Conhecimento e Difusão de Tecnologias; Atena: Ponta Grossa, Brazil, 2022; pp. 116–129. [Google Scholar] [CrossRef]
  43. Navegantes, P.C.A.; Lopes Filho, W.R.L.; Rodrigues, F.H.S.; Monteiro, G.G.T.N.; Chaves, R.P.F.; Oliveira Neto, C.F.; Cunha, R.L.; Pinheiro, H.A. Leaf Gas Exchange and Water Relations in Two Assai Cultivars Submitted to Water-Deficit. Rev. Bras. Frutic. 2024, 46, e-716. [Google Scholar] [CrossRef]
  44. Araújo Neto, R.A.D.; Magalhães, I.D.; Lyra, G.B.; Maia, S.M.F.; Lyra, G.B. Physical and Hydrological Characteristics and Modelling of the Soil Water Retention Curve in the Brazilian Semi-Arid Region. Biosci. J. 2022, 38, e38031. [Google Scholar] [CrossRef]
  45. Fraga Junior, L.S.; Vellame, L.M.; de Oliveira, A.S.; da Silva Paz, V.P. Transpiration of Young Cocoa Trees under Soil Water Restriction. Sci. Agric. 2020, 78, e20190093. [Google Scholar] [CrossRef]
  46. Benassi, A.C.; Cesar, J.F.; de Santana, E.N. O Cultivo do Coqueiro-Anão-Verde: Tecnologias de Produção; Incaper: Vitória, Brazil, 2013; Volume 227.
  47. Bastos, D.C.; Pinto, J.M.; Yuri, J.E.; Calgaro, M.; Araújo, J.L.P. Recomendações Para a Produção Da Lima Ácida “Tahiti” em Áreas de Agricultura de Base Familiar; Embrapa Semiárido: Petrolina, Brazil, 2022. [Google Scholar]
  48. Teixeira, A.H.d.C.; de Miranda, F.R.; Leivas, J.F.; Pacheco, E.P.; Garçon, E.A.M. Water Productivity Assessments for Dwarf Coconut by Using Landsat 8 Images and Agrometeorological Data. ISPRS J. Photogramm. Remote Sens. 2019, 155, 150–158. [Google Scholar] [CrossRef]
  49. Araújo, B.D.A.; Miranda, F.R.D.; Bezerra, M.A.; Rodrigues, A.J.O.; Calvet, A.S.F.; Silva, E.S.D.; Lima, G.D.C.M.; Santos, M.M.S. Sustained Deficit Irrigation on Yield and Fruit Water Quality of Dwarf Green Coconut. Cienc. Rural 2022, 52, e20200674. [Google Scholar] [CrossRef]
  50. Jamshidi, S.; Zand-Parsa, S.; Kamgar-Haghighi, A.A.; Shahsavar, A.R.; Niyogi, D. Evapotranspiration, Crop Coefficients, and Physiological Responses of Citrus Trees in Semi-Arid Climatic Conditions. Agric. Water Manag. 2020, 227, 105838. [Google Scholar] [CrossRef]
  51. Maestre-Valero, J.F.; Testi, L.; Jiménez-Bello, M.A.; Castel, J.R.; Intrigliolo, D.S. Evapotranspiration and Carbon Exchange in a Citrus Orchard Using Eddy Covariance. Irrig. Sci. 2017, 35, 397–408. [Google Scholar] [CrossRef]
  52. Paredes, P.; Petry, M.T.; Oliveira, C.M.; Montoya, F.; López-Urrea, R.; Pereira, L.S. Single and Basal Crop Coefficients for Estimation of Water Requirements of Subtropical and Tropical Orchards and Plantations with Consideration of Fraction of Ground Cover, Height, and Training System. Irrig. Sci. 2024, 42, 1059–1097. [Google Scholar] [CrossRef]
  53. Costa, D.L.P. Produção e Viabilidade Econômica de Açaizeiro (Euterpe Oleracea Mart.) Irrigado em Monocultivo e Consorciado com Cupuaçuzeiro sob Diferentes Disponibilidades Hídricas em Castanhal-PA, Leste da Amazônia Brasileira; RIUFRA: Pará, Brazil, 2021. [Google Scholar]
  54. Andrade, M.T.; Neto, D.F.M.; Nascimento, J.R.S.; Soares, E.L.; Coutinho, Í.C.; Velásquez, E.; Domont, G.B.; Nogueira, F.C.S.; Campos, F.A.P. Proteome Dynamics of the Developing Açaí Berry Pericarp (Euterpe Oleracea Mart.). J. Proteome Res. 2019, 19, 437–445. [Google Scholar] [CrossRef]
  55. Fernandes, G.S.T.; Ribeiro, L.R.D.T.; Rua, M.L.; Vieira, W.G.M.; Pinto, J.V.D.N.; Souza, P.J.D.O.P.D. Meteorological Conditions Afect the Seasonal Development and Yield of Green Dwarf Coconut. Pesqui. Agropecu. Trop. 2024, 54, e77037. [Google Scholar] [CrossRef]
  56. Brazel, A.J.; Ó’Maoileídigh, D.S. Photosynthetic Activity of Reproductive Organs. J. Exp. Bot. 2019, 70, 1737–1753. [Google Scholar] [CrossRef]
  57. Adet, L.; Rozendaal, D.M.A.; Tapi, A.; Zuidema, P.A.; Vaast, P.; Anten, N.P.R. Negative Effects of Water Deficit on Cocoa Tree Yield Are Partially Mitigated by Irrigation and Potassium Application. Agric. Water Manag. 2024, 296, 108789. [Google Scholar] [CrossRef]
  58. Samuel, A.; Friday, C.; Babadele, F. Cacao Water Use, Canopy Characteristics and Yield as Affected by Irrigation and Shade in a Rainforest Zone of Nigeria. Int. J. Environ. Clim. Change 2024, 14, 958–978. [Google Scholar] [CrossRef]
Figure 1. Location of the experimental sites in the state of Pará: (A) Açaí palm plantation in Castanhal; (B) Dwarf green coconut plantation in Santa Izabel do Pará; (C) Acid lime plantation in Capitão Poço; and (D) Cocoa plantation in Vitória do Xingu. The yellow dots indicate the micrometeorological towers, while blue and red outlines represent irrigated and non-irrigated areas, respectively.
Hydrology 13 00108 g001
Figure 2. Micrometeorological variables and components of the water balance for açaí palm cultivation during 2018 and 2019: (a) Air temperature (Tar, °C), global solar radiation (Rg, MJ m−2 day−1), and relative humidity (RH, %); (b) rainfall (blue bars, mm), irrigation (green bars, mm), and soil volumetric water content (θ, m3 m−3) for the irrigated (θI) and non-irrigated (θNI) treatments; (c) reference evapotranspiration (ETo, mm day−1) and actual crop evapotranspiration (ETc act, mm day−1) in the irrigated (I) and non-irrigated (NI) treatments. The shaded areas represent the less rainy period. In panel (b), the horizontal dashed lines indicate field capacity (FC), critical moisture (θc), and the permanent wilting point (PWP). Error bars represent the standard deviation.
Hydrology 13 00108 g002
Figure 3. Micrometeorological variables and components of the water balance for dwarf green coconut cultivation during 2023 and 2024: (a) Air temperature (Tar, °C), global solar radiation (Rg, MJ m−2 day−1), and relative humidity (RH, %); (b) rainfall (blue bars, mm), irrigation (green bars, mm), and soil volumetric water content (θ, m3 m−3) for the irrigated (θI) and non-irrigated (θNI) treatments; (c) reference evapotranspiration (ETo, mm day−1) and actual crop evapotranspiration (ETc act, mm day−1) in the irrigated (I) and non-irrigated (NI) treatments. The shaded areas represent the less rainy period. In panel (b), the horizontal dashed lines indicate field capacity (FC), critical moisture (θc), and the permanent wilting point (PWP). Error bars represent the standard deviation.
Hydrology 13 00108 g003
Figure 4. Micrometeorological variables and components of the water balance for acid lime cultivation during 2023 and 2024: (a) Air temperature (Tar, °C), global solar radiation (Rg, MJ m−2 day−1), and relative humidity (RH, %); (b) rainfall (blue bars, mm), irrigation (green bars, mm), and soil volumetric water content (θ, m3 m−3) for the irrigated (θI) and non-irrigated (θNI) treatments; (c) reference evapotranspiration (ETo, mm day−1) and actual crop evapotranspiration (ETc act, mm day−1) in the irrigated (I) and non-irrigated (NI) treatments. The shaded areas represent the less rainy period. In panel (b), the horizontal dashed lines indicate field capacity (FC), critical moisture (θc), and the permanent wilting point (PWP). Error bars represent the standard deviation.
Hydrology 13 00108 g004
Figure 5. Micrometeorological variables and components of the water balance for cocoa cultivation during 2023 and 2024: (a) Air temperature (Tar, °C), global solar radiation (Rg, MJ m−2 day−1), and relative humidity (RH, %); (b) rainfall (blue bars, mm), irrigation (green bars, mm), and soil volumetric water content (θ, m3 m−3) for the irrigated (θI) and non-irrigated (θNI) treatments; (c) reference evapotranspiration (ETo, mm day−1) and actual crop evapotranspiration (ETc act, mm day−1) in the irrigated (I) and non-irrigated (NI) treatments. The shaded areas represent the less rainy period. In panel (b), the horizontal dashed lines indicate field capacity (FC), critical moisture (θc), and the permanent wilting point (PWP). Error bars represent the standard deviation.
Hydrology 13 00108 g005
Figure 6. Crop coefficient (Kc) at the fruit tree experimental sites: açaí palm (a), dwarf green coconut (b), acid lime (c), and cocoa (d), during the rainy periods (RPs) and less rainy periods (LRPs), considering the irrigated treatments.
Hydrology 13 00108 g006
Figure 7. Soil water stress coefficient (Ks) at the fruit tree experimental sites: açaí palm (a), dwarf green coconut (b), acid lime (c), and cocoa (d). The shaded area represents the less rainy period.
Hydrology 13 00108 g007
Table 1. Description of the location of the crops and their respective experimental periods.
CropMunicipalityCoordinatesExperimental Period
Açaí palmCastanhal1° 19′ 24.48″ S and 47° 57′ 38.20″ W2018–2019
Dwarf green coconutSanta Izabel do Pará1° 13′ 40.35″ S and 48° 02′ 56.23″ W2023–2024
Acid limeCapitão Poço1° 46′ 55″ S and 47° 06′ 31″ WJul/2023–Dec/2024
Cocoa treeVitoria do Xingu03° 09′ 47.22″ S and 52° 06′ 58.46″ WSep/2023–Dec/2024
Table 2. Soil particle-size, physical, and hydraulic attributes of the study areas.
Physical and Water AttributesAçaí PalmDwarf Green CoconutAcid LimeCocoa Tree
IrrigatedNon-Irrigated
0–0.4 m0–0.4 m0–0.4 m0–0.4 m0–0.4 m
Sand (%)8168756840
Silt (%)101917117
Clay (%)9 1382153
Soil density (g cm−3)1.59 1.591.431.581.58
θPC 1 (cm3 cm−3)0.280.190.150.200.30
θ PWP 2 (cm3 cm−3)0.080.100.070.110.18
θ critical 3 (cm3 cm−3)0.170.130.110.140.21
1 Moisture content at field capacity, 2 Moisture content at permanent wilting point, 3 Critical soil moisture content: moisture level at which the plant begins to experience water stress, triggering a reduction in the crop’s potential evapotranspiration.
Table 3. Sensors installed on the micrometeorological towers at the experimental sites.
Meteorological VariableInstrument/Manufacturer/ModelSensor Position (m)
Air temperature (Tar) and relative humidity (RH)Thermohygrometer (HMP155A, Campbell Scientific Instrument, Logan, UT, USA)2.1 above the canopy
Global solar radiation (Rg)Pyranometer (CMP6, Campbell Scientifc Instrument, Logan, UT, USA)2.1 above the canopy
RainfallRain gauge (TB4, Campbell Scientifc Instrument, Logan, UT, USA)2.1 above the canopy
Volumetric soil water content (θ)—Açaí palmSoil water content reflectometer (CS616, Campbell Scientifc Instrument, Logan, UT, USA)Irrigated: −0.2 and −0.4 (horizontally)
Non-irrigated: −0–0.3 (vertically)
Volumetric soil water content (θ)—Other cropsSoil water content reflectometer (CS615, Campbell Scientifc Instrument, Logan, UT, USA)−0.1, −0.3 and −0.5 (horizontally)
Table 4. Mean values of the crop coefficient (Kc) for açaí palm, dwarf green coconut, acid lime, and cocoa, determined for the irrigated treatment during the rainy (RPs) and less rainy periods (LRPs).
CropsPeriods
RainyLess Rainy
Açaí palm0.85 ± 0.070.90 ± 0.08
Dwarf green coconut0.81 ± 0.120.92 ± 0.12
Acid lime0.81 ± 0.110.93 ± 0.16
Cocoa tree0.84 ± 0.160.89 ± 0.16
Disclaimer/Publisher’s Note: The statements, opinions and data contained in all publications are solely those of the individual author(s) and contributor(s) and not of MDPI and/or the editor(s). MDPI and/or the editor(s) disclaim responsibility for any injury to people or property resulting from any ideas, methods, instructions or products referred to in the content.