Article

Assessing Stream Temperature Interactions with Physical and Environmental Variables Along the Longitudinal Profile of a First- to Fourth-Order Perennial Stream in a Multi-Land Use Watershed in Western Oregon, USA

by
Derek C. Godwin
1 and
Carlos G. Ochoa
2,*
1
Biological & Ecological Engineering, Oregon State University, Corvallis, OR 97331, USA
2
Ecohydrology Lab., College of Agricultural Sciences, Oregon State University, Corvallis, OR 97331, USA
*
Author to whom correspondence should be addressed.
Hydrology 2025, 12(9), 230; https://doi.org/10.3390/hydrology12090230
Submission received: 11 July 2025 / Revised: 27 August 2025 / Accepted: 29 August 2025 / Published: 1 September 2025

Abstract

Stream temperatures are expected to increase with warming air temperatures, yet the extent and aquatic health impacts vary significantly across heterogeneous landscapes. This study was conducted in a 3360-ha multi-land-use watershed in the Pacific Northwest region of the USA to assess and compare the driving factors for stream temperature heating, cooling, and cool-water refugia along a 12-km mainstem stream longitudinal profile. Study objectives were to (1) determine yearlong stream temperature variability along the entire stream longitudinal profile, and (2) assess stream-environment relationships influencing stream temperature dynamics across forest, agriculture, and urban landscapes within the watershed. Stream and riparian air temperatures, solar radiation, shade, and related stream-riparian characteristics were measured over six years at 21 stations to determine changes, along the longitudinal profile, of thermal sensitivity, maximum and minimum stream temperatures, and correlation between solar radiation and temperature increases, and potential causal factors associated with these changes. Solar radiation was a primary heating factor for an exposed agricultural land use reach with 57% effective shade, while southern stream aspects and incoming tributary conditions were primary factors for forested reaches with greater than 84% effective shade. Potential primary cooling factors were streambank height, groundwater inflows, and hyporheic exchange in an urban reach with moderate effective shade (79%) and forest riparian width (16 m). Combining watershed-scale analysis with on-site stream-environmental data collection helps assess primary temperature heating factors, such as solar radiation and shade, and potential cooling factors, such as groundwater and cool tributary inflows, as conditions change along the longitudinal profile.

1. Introduction

Stream temperature, a crucial parameter in determining aquatic ecosystem health, affects stream productivity and metabolism, distribution, abundance, and interactions of organisms [1,2]. Elevated stream temperatures in watersheds with limited cool-water refugia can be detrimental to cool- and cold-water fish species by increasing microbial activity and limiting dissolved oxygen, as well as their competitive ability, disease resistance, and overall habitat quality [3] (pp. 94–103) [4]. Salmon and trout, cold-water fish native to the Pacific Northwest (PNW) region of the United States and Canada, provide significant economic value to the area by supporting commercial and recreational fishing, tourism, cultural significance to tribal communities, habitat restoration jobs, and non-use values, such as ecosystem functions. For example, the 2017 annual values of Columbia River salmon and trout commercial and recreational fishing were estimated at 153 million dollars [5]. Climate forecasts predict increased annual air temperature regimes in the PNW region with the greatest increases in summer [6,7]. However, complex environmental–stream interactions across diverse landscapes increase uncertainty for predicting how climate change drivers will influence stream temperatures, temperature spatial patterns, native salmonid species, and aquatic health in the PNW [8,9].
Stream temperature relationships with environmental variables and physical landscape characteristics are complex and vary in time and space, yet exhibit some commonalities across landscapes. Mechanistic studies measuring site-specific hydrology, stream geomorphology, topography, and meteorology, and calculating energy exchange processes at stream-air and stream-bed interfaces indicate net solar radiation input to streams as the most significant heating factor and controlling mechanism for stream temperature [10,11,12]. Similarly, studies measuring on-site stream-landscape characteristics that affect net solar input (e.g., aspect, shade, width, depth, streambed geology, flow, and velocity) identify one or more of these characteristics as contributing heat factors affecting stream temperature [11,13,14,15,16].
Mechanistic and statistical studies measuring environmental conditions and stream-landscape characteristics at local and regional watershed scales have identified several factors that help decrease heating rates and temperatures, including longwave radiation emission, evaporative cooling, groundwater inputs, hyporheic exchange, and streams with a high baseflow index [13,17,18,19,20,21,22]. While typically viewed as mitigating, these factors can also be primary stream temperature controls or provide critical thermal refugia in certain locations, adding complexity to predictions based solely on solar heating, air temperatures, and shade factors [8,9]. Additionally, stream heating–cooling relationships in mixed-use watersheds may be more dependent on land management practices and localized climate interactions, such as cold or warm inputs from wastewater effluent, urban stormwater surface runoff, and reservoir releases of thermal-stratified water [10,23,24], signifying understanding of anthropogenic factors on temperature as critical to predicting future conditions.
Increasing stream temperatures and thermal sensitivity to air along the longitudinal profile, as channel residence time, solar input, air temperature, and stream size increase, followed by a flattening downstream (i.e., an asymptotic relationship), is a commonality that has recently been questioned in the PNW [25]. Remote sensing summer river temperatures along the longitudinal profile of 53 PNW rivers yielded asymptotic relationships for 47% of streams, while remaining streams had linear, uniform, parabolic, or complex (not fitting any classes) relationships due to diverse thermal patterns. Cooling in the downstream direction has been observed when streams travel from exposed, upland conditions to increased riparian forest in lowlands, receive cool reservoir releases and groundwater inflows in mid-valleys, or experience cool, coastal conditions at the downstream end compared to upstream, inland conditions [19,20,25,26].
Assessing spatial relationships and heterogeneity at the reach and watershed scales is critical for estimating the loss of thermally suitable habitat for salmonids due to climate change [4,27,28]. Combining site-specific measurements of factors influencing the stream energy exchange process with statistical analyses of larger-scale trends along the longitudinal profile helps assess causal factors and clarify climate-landscape relationships [25,29,30], while informing management actions to create thermal refugia across different land uses in watersheds [31]. However, only a few empirical studies have examined the factors driving these relationships [32,33]. Furthermore, most of these studies have been conducted at the reach scale or are focused on the summer season, missing an opportunity to fully understand the effects of seasonal variability on stream temperature along the stream profile. There is a need for an improved understanding of the multiple biotic and abiotic factor interactions, such as land cover and land use, that influence stream temperature along the entire stream during the cool and warm parts of the year.
The goal of this case study, conducted in a 3360-ha multi-land-use watershed in the Pacific Northwest region of the USA, was to assess and compare the driving factors for stream temperature heating, cooling, and cool-water refugia along a 12-km mainstem stream longitudinal profile. The study objectives were to (1) determine yearlong stream temperature variability along the entire stream longitudinal profile, and (2) assess stream-environment relationships influencing stream temperature dynamics across forest, agriculture, and urban landscapes within the watershed. Expected results would help improve riparian area management and inform policy related to stream temperature, land use, and environmental relationships in cool water environments.

2. Materials and Methods

2.1. Study Site

This study was conducted in the Oak Creek watershed (44.58° latitude; −123.33° longitude), situated within the Lower Marys River 12-digit Hydrologic Unit (USGS HUC 170900030511) of the Willamette River Basin in western Oregon, USA. A network of stream temperature, air temperature, and weather sensors was installed along the longitudinal profile of Oak Creek, spanning various land use and land cover features within the 3360-hectare watershed area (Figure 1).
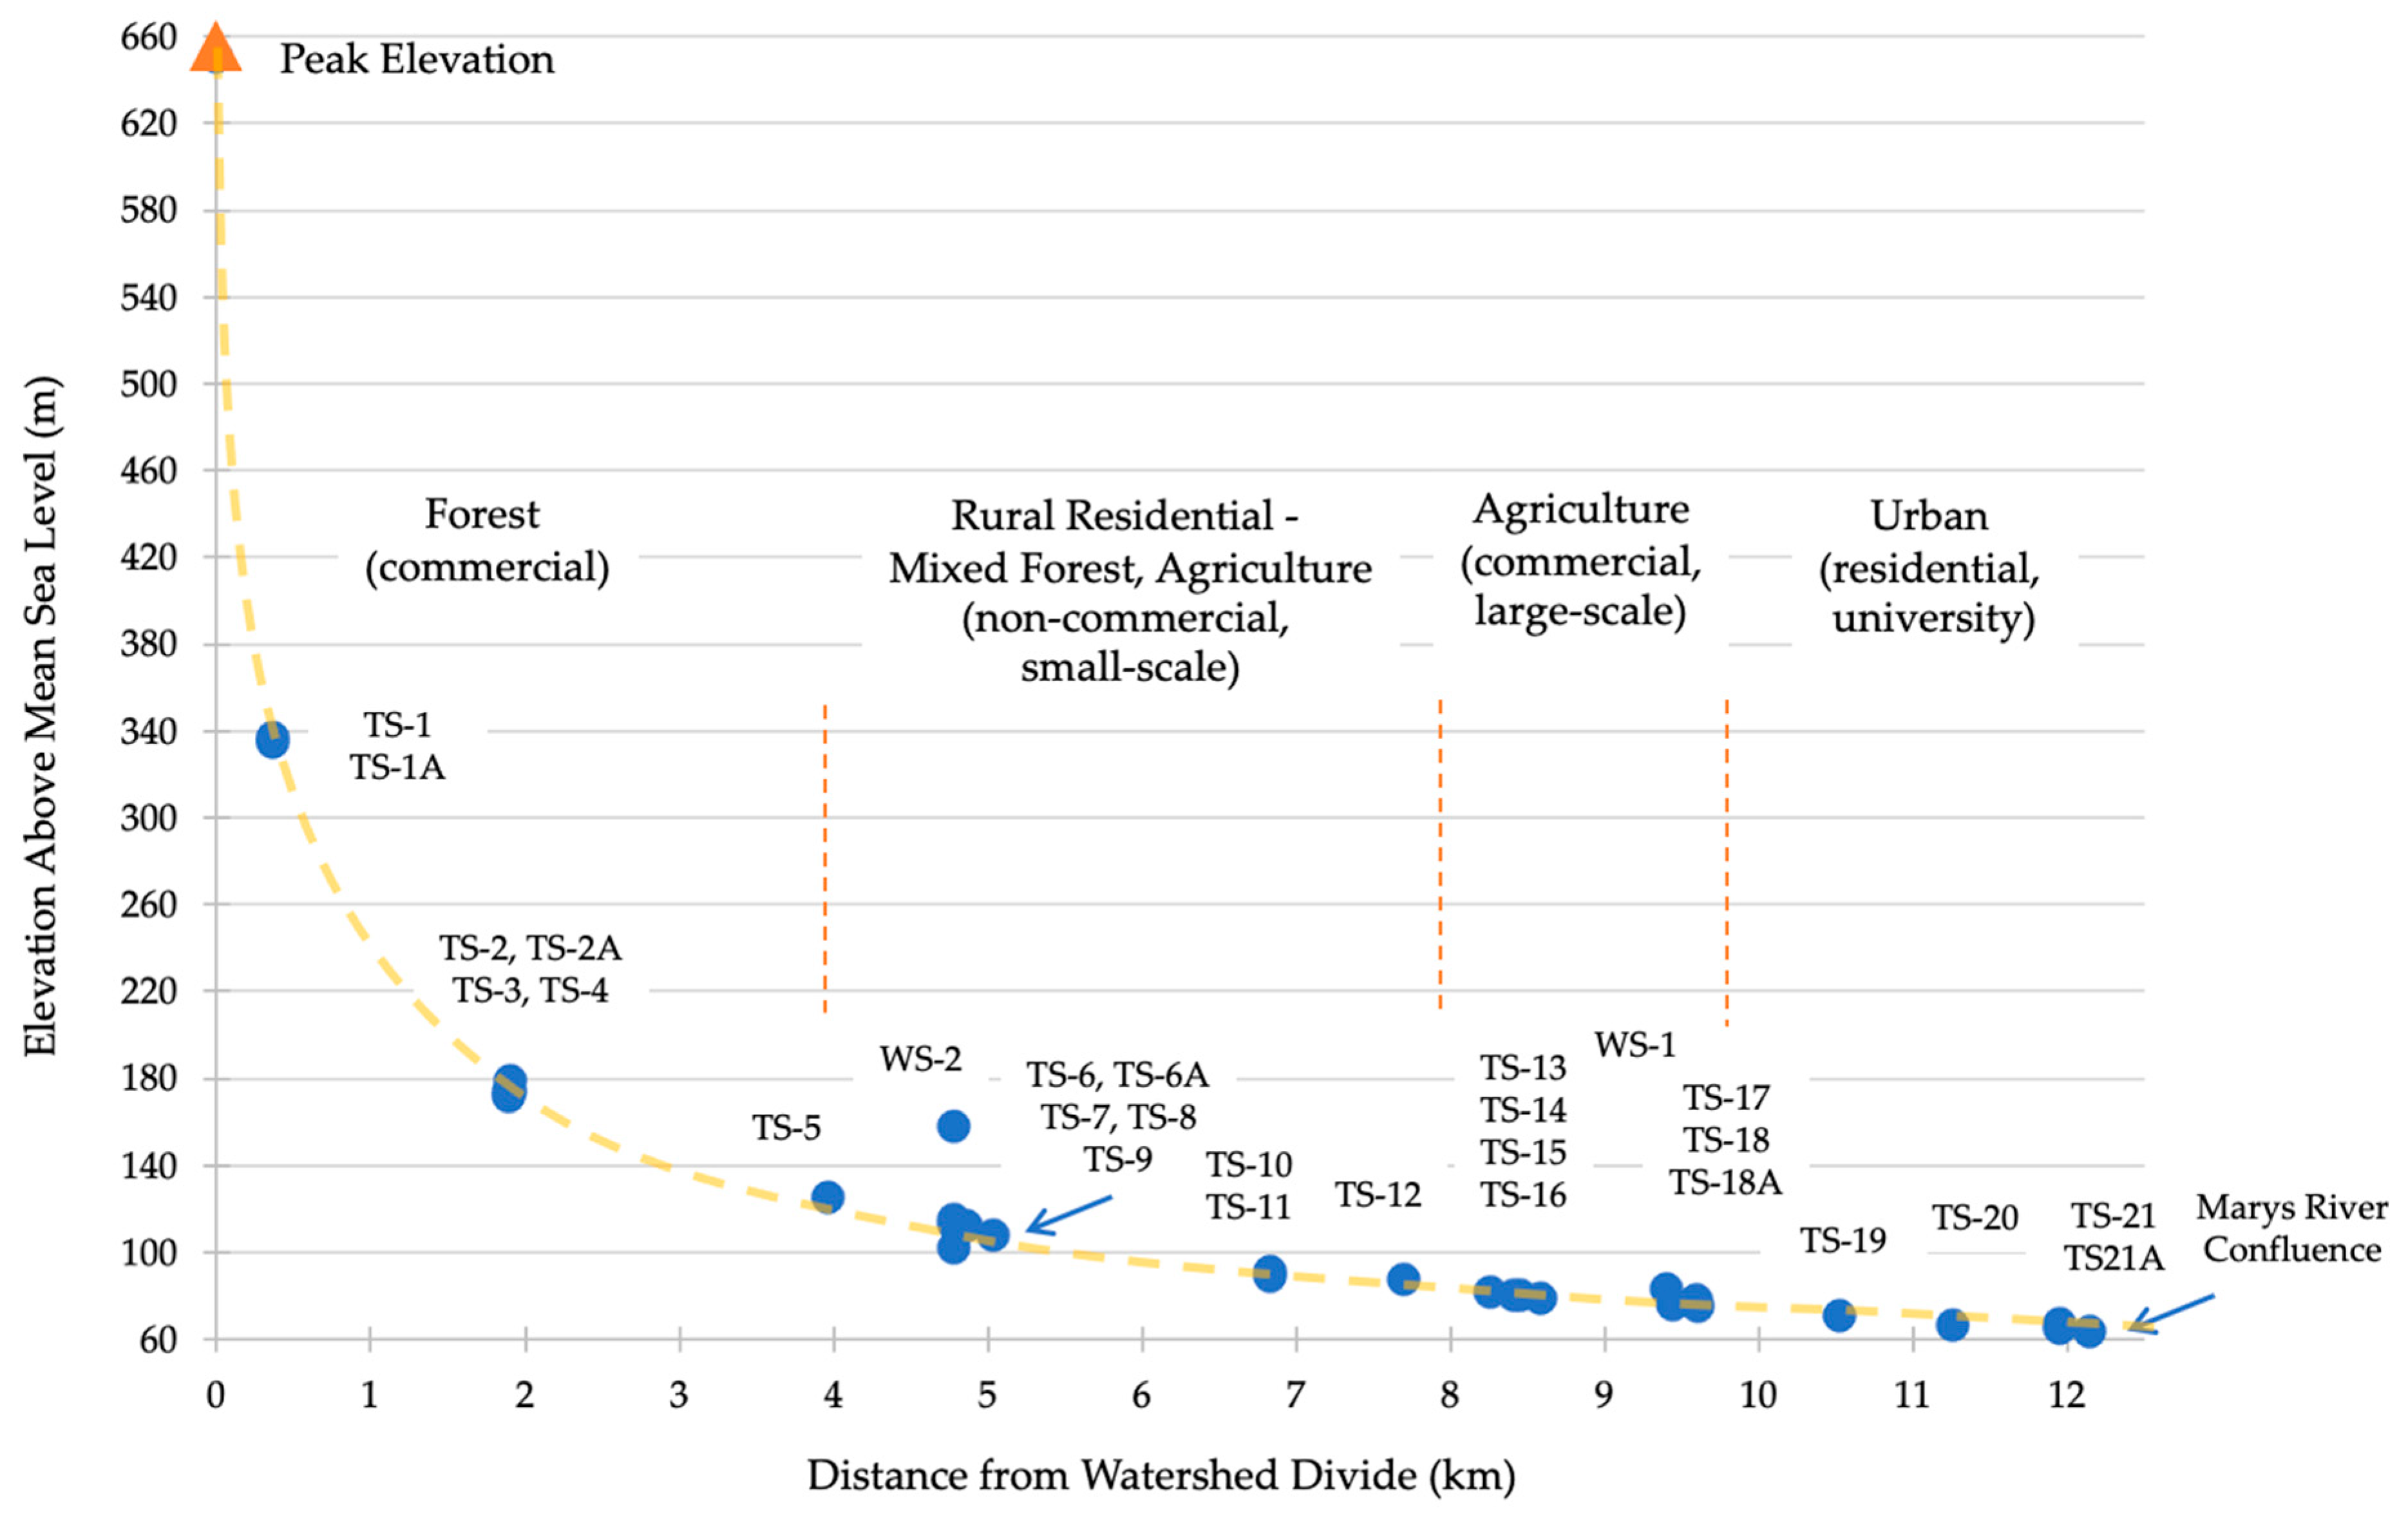
Oak Creek’s headwaters originate in the eastern, leeward side of the Coastal Mountain Range, with a peak elevation of 657 m above mean sea level (AMSL) at McCulloch Peak and 651 m where the mainstem channel extends to the ridge. Oak Creek’s mainstem generally flows in a south direction from the headwaters for approximately 5.5 km before turning and flowing in a southeast direction to the outlet at Marys River at an elevation of 64 m and 12.15 km distance from the watershed divide (Figure 2).
The Oak Creek watershed comprises two distinct geologic areas with opposing hydrogeologic conditions, separated by the Corvallis Fault, which crosses approximately 8.5 km from the watershed divide [34]. The Siletz River Volcanics formation dominates the upper portion, characterized by nearly non-porous basalts and fractures, which result in high permeability and generally lead to a stream-gaining condition from groundwater. Quaternary alluvial deposits, which overlay sedimentary rock formations with interlayers of porous, graded sandstones, siltstones, and shales, dominate the flat areas in the lower watershed. This results in low permeability, characterized by layers of clay, mudstone, and silt, with occasional layers of sand and gravel. The depth to the water table in winter ranges from 0 to 0.5 m throughout the watershed, while summer depths vary from 1 to 5 m in the upper portion to over 5 m in the lower, flat areas, depending on the depth to bedrock and permeability.
A Mediterranean climate influences Oak Creek’s weather patterns, characterized by warm, dry summers and cool, wet winters with rain-dominated precipitation, occasionally accompanied by rain-on-snow events in high elevations [34]. Mean annual precipitation ranges from 0.95 m in the lowest elevations to 2.5 m in the upper elevations, with 95% or more precipitation occurring October–May. Oak Creek is a Strahler [35] fourth order stream with summer base flows approximating 0.03 m3s−1, average winter flows of 0.25 m3s−1, and flood discharges up to 6 m3s−1 [34]. Oak Creek becomes a second order stream approximately 0.6 km from the watershed divide, third order around 2.3 km, and fourth order around 4.8 km. Oregon State University (OSU) has the largest summer surface water rights on Oak Creek, with the point of diversion located just downstream of the Corvallis Fault (8.5 km from the divide).
Even-aged, commercial forest stands of Douglas-fir (Pseudotsuga menziesii) conifer tree species, with small patches of mixed conifer and deciduous trees, dominate the overstory in the upper one-third of the Oak Creek watershed. Rural residential (0.8 to 2 hectares) neighborhoods, adjacent to patches of commercial conifer stands, non-commercial white oak woodlands, and small-scale, non-commercial agriculture (pastures, ornamental trees) land uses comprise the middle one-third of the watershed. Flat areas of the lower watershed are dominated by large-scale, commercial agriculture (livestock and buildings, pasture, and field crops), followed by mixed urban land use (i.e., residential housing, OSU campus, transportation infrastructure) that joins Oak Creek, Marys River, and Willamette River. Small patches of oak woodlands, mixed conifer forests, open prairies, and residential neighborhoods are scattered throughout the uplands in the lower watershed. OSU’s forest is in the Oak Creek headwaters, while OSU’s livestock pastures and facilities are in the middle and lower watershed sections along Oak Creek and tributaries.
Oregon ash (Fraxinus latifolia), white alder (Alnus rhombifolia), bigleaf maple (Acer macrophyllum), and mixed willow (Salix spp.) trees dominate riparian overstory vegetation throughout the watershed, while understory shrubs and vegetation exhibit considerable variation. Pockets of non-native weed species, such as Himalayan blackberries (Rubus armeniacus), reed canary grass (Phalaris arundinacea), and English ivy (Hedera helix), dominate riparian vegetation in disturbed and unmaintained areas of the middle and lower watershed. Forested riparian vegetation buffers, defined as having tree heights greater than 5 m, along perennial streams vary in width from greater than 25 m in upland forests, to 5 m to 20 m in rural residential, agricultural, and urban land uses, with isolated pockets greater than 20 m along the lower mainstem of OSU’s agriculture and urban campus facilities. Oak Creek’s watershed provides habitat for native salmon, trout, and lamprey. However, elevated summer stream temperatures are a concern for water quality in the Oak Creek system [36].

2.2. Temperature, Weather, and Stream Stage-Flow Monitoring

Stream and ambient riparian air temperature data were collected hourly from 26 sites (21 stream, 5 air) along Oak Creek’s longitudinal profile for 2017–2022 water years using Onset data loggers (Hobo Tidbit +/−0.2 °C and Pendant +/−0.5 °C, Onset Computer Corp., Bourne, MA, USA) attached inside perforated PVC pipe/casings in shaded locations (see Figure 1). All stream temperature loggers (TS-1 through TS-21) were secured to the streambed, using 0.76 m long rebar stakes, in locations of well-mixed flow. Five riparian air temperature loggers (TS-1A, TS-2A, TS-6A, TS-18A, TS-21A) were suspended approximately 1.6 m above ground level in shade trees within 1 to 3 m of the stream. Weather data, including air temperature, were collected from two weather stations (WS-1 and WS-2) installed in livestock pastures adjacent to Oak Creek’s mainstem.
Stream water height was recorded hourly for 2017–2023 water years (Hobo Water Level Data Logger, U20L-01, Onset Computer Corp., Bourne, MA, USA) at a gaging station installed on Oak Creek’s mainstem near the OSU Dairy Center (between TS-17 and TS-18), with a duplicate water level logger to fill data gaps, as needed. Discrete discharge measurements were taken thirteen times at the gaging station and fourteen times at other watershed sites during the study period. Measurements followed the United States Geologic Survey (USGS) wading method [37], using a measured cross-section and a current velocity meter (Swoffer 3000, Swoffer Instruments, Inc., Sumner, WA, USA) when stream depth was adequate for accurate measurements. Otherwise, measurements were obtained using S-M flumes [38] with established equations and salt slug tracers [39] with lab-derived concentration equations. Stream flows were measured at selected locations in March 2019 and August 2023 to assess changes in flow during winter and summer along the longitudinal profile. Average stream velocity measurements during summer low-flow conditions were used to estimate stream reach distances necessary to experience 12-h daily heating cycles (12-h DHC; 1.0 to 3.5 km) and 24-h heating-cooling cycles (24-h HCC; 3.5 to 6 km). The average residence time for water to flow from the headwaters to the mouth was estimated to be two days in winter and three days in summer.
Continuous discharge measurements were obtained hourly along the mainstem, using S-M flumes equipped with Hobo Water Level Data Loggers (U20L-01), between reach TS-5 to TS-6 and between reach TS-13 to TS-18 to assess changes in flow for selected summer weeks of 2019, 2020, and 2022. OSU manages livestock pastures adjacent to both stream reaches. The upstream reach is not irrigated, while the downstream reach includes an instream summer irrigation reservoir, beginning between TS-13 to TS-14, a flashboard dam just downstream of TS-15, and irrigated pastures from TS-16 to just upstream of TS-18. Summer irrigation water diversions were measured at the OSU Dairy Center using two pipeflow meters (DuraMag Flow Meter, McCrometer, Inc., Hemet, CA, USA) for pipes with diameters of 0.15 m and 0.2 m. Previous studies have shown that, on average, the total irrigation water applied to a pasture field was 249 mm from 24 July to 16 September 2020 and 381 mm from 10 June to 17 September 2021 [40]. It was assumed that these total summer rates represent water applications in the other remaining fields.

2.3. Stream and Riparian Characteristics

Physical stream-riparian characteristics were measured during summer low-flow conditions (early August) at stream temperature monitoring locations and every 10 m upstream for variable distances to determine average reach conditions. Upstream measurement distances were 50 m for all tributary stations, 50 m for the upper forested mainstem reaches (TS-1 to TS-5), 100 m for rural residential (TS-10 to TS-13) and urban reaches (TS-19–21), and 100% of distances (i.e., 250 m to 1250 m) between OSU’s agriculture stations in the middle (TS-5 to TS-9) and lower (TS-15 to TS-18) parts of the watershed. Wetted width (WW), wetted maximum depth (WD), streambank heights (SBH) from water surface to top of bank, forested riparian buffer widths (FRW), and aspect, were measured every 10 m and averaged for the reach. SBH and FRW intercepting sun solar angles (i.e., not north-side streambanks) were measured and averaged.
Percent stream cover (%SC) measurements were taken every 10 m using a CI-110 Plant Canopy Imager (CID Bio-Science, Inc., Camas, WA, USA) with a hemispherical photo lens, aligned to magnetic North, and held 0.5 to 0.6 m above the water surface in the middle of the wetted width. The imager digitally measures and separates stream cover caused by objects (i.e., vegetation, debris, topography, bridges) from open sky, using a grid superimposed over the photo with user-adjusted blue, green, and red filters, and angle (up to 180°).
Percent effective stream shade (%ES), used by the Oregon Department of Environmental Quality (DEQ), is defined as total daily solar radiation blocked by vegetation and topography, divided by total incoming solar radiation. DEQ calculates %ES every 200 m along the mainstem and tributaries using a remote sensing analysis and modeling process, as described in [35]. This process utilizes aerial photos for stream location, stream width, and vegetation density, as well as light detection and ranging (LiDAR) for tree heights and topographic elevation. It also incorporates weekly data from the nearest weather station for incoming solar radiation and a shade model for estimating the incoming solar radiation blocked by the stream. DEQ used 2013 aerial photos and solar radiation measurements from August 2013 to determine %ES for the Oak Creek watershed.
Both %SC measured with the canopy imager and %ES estimated from the DEQ method were included due to complementary variation in results. Due to the canopy imager camera’s proximity to the stream and line of sight, the canopy imager may be more sensitive to vegetation and objects near the stream, while remote measurements may be more sensitive to overstory canopy conditions. Using %ES based on 2013 data causes uncertainty in representing conditions related to stream temperature data collected for this study, conducted from 2017 through 2022 water years. To address this issue, the authors gathered on-site data from all monitoring stations and significant portions of stream reaches. In addition, no visible indications of recent mechanical or weather-induced riparian tree canopy removal or alteration were apparent along the longitudinal profile of the Oak Creek mainstem. Therefore, it was assumed that overall riparian area conditions were similar in 2013 and during the period of this study (2017–2022).

2.4. Data Analysis

Stream and air temperature, solar radiation, vapor pressure, stream stage, and stream flow data were screened for normality by calculating the coefficients of skew (using the adjusted Fisher–Pearson equation in Microsoft® Excel, 16.99.2, 2025) and kurtosis (also in Microsoft® Excel, 16.99.2, 2025), as measures of asymmetry and the peakedness or flatness of the distribution compared to the normal distribution. The final skew and kurtosis values were within +/−1, indicating sufficient normality for parametric tests.
Descriptive statistical analyses (Microsoft® Excel, 16.99.2, 2025) were used to determine the magnitude of daily maximum, minimum, and mean stream and air temperatures, and 7-day moving average of daily maximum (7-DADMax), minimum (7-DADMin), and calendar weekly average of daily maximum and minimum (calendar 7-DADMax, calendar 7-DADMin). The timing of when the annual daily maximum and minimum values, as well as the annual calendar 7-DADMax and 7-DADMin values, occurred was compared for solar radiation, stream temperature, and air temperature at all stations. Stations missing hourly temperature data occurring during maximum and minimum daily time periods caused daily values to be removed from all analyses. Calendar weekly and 7-DADMax-Min calculations were performed for weeks with all seven days of data. Stations missing daily values occurring during potential maximum and minimum weekly and 7-day time periods were not included for that water year. Mean values were calculated using daily values not excluded due to missing data. Seasonal Mann–Kendall (SMK) tests (using XLSTAT Cloud 5.0.1, Addinsoft, Paris, France, 2022) were conducted for six water years of data from TS-2, TS-8, and TS-20 stream temperature stations, a nearby weather station (WS-3, CRVO, 44.63° latitude, −123.19° longitude, 70.1 m AMSL, U.S. Bureau of Reclamation) for air temperature, solar radiation, and vapor pressure, Oak Creek stream gauge for water height, and nearby gauge station for Marys River streamflow (Marys River near Philomath, Oregon, No. 14171000, 44.53° latitude, −123.33° longitude, 68.28 m AMSL, USGS). SMK tests for monotonic trends were conducted using the winter (1 October to 31 March) 7-DADMin and summer (1 April to 30 September) 7-DADMax for each parameter. These stations had no missing daily values during the six water years.
Stream thermal sensitivity (TS), defined as the maximum slope of the relationship between air and stream temperatures [18], was calculated using linear regression analysis (Microsoft® Excel, 16.99.2, 2025) of the calendar 7-DADMean riparian air temperatures (independent variable) and the closest stream temperatures (dependent variable). The change in TS (ΔTS) was calculated from upstream to downstream stations, with reach lengths approximating 12-h DHC (i.e., 1 to 3 km) and 24-h HCC (i.e., 4 to 6 km) stream travel times and then divided by the reach length to normalize the values per kilometer. Calculations were not included if daily values were missing for any of the stations.
The average change in daily summer maximum (ΔTmax) and minimum stream temperatures (ΔTmin) along the longitudinal profile was calculated as the linear regression slope from upstream (independent variable) to downstream (dependent variable) stations using daily data from 1 June to 30 September. Daily summer ΔTmax was compared between stations of 12-h DHC reach lengths, while daily summer ΔTmin of the upstream station was compared to those of the following day for the downstream station for 24-h HCC reach lengths. Summer daily mean increases (DMI) in stream temperatures were calculated as the mean difference from upstream daily minimums to downstream daily maximums between stations for 12-h DHC reaches, and as the mean difference from upstream daily minimums to downstream daily minimums of the following day for 24-h HCC reaches. All three parameters (ΔTmax, ΔTmin, and DMI) were divided by reach length to normalize values per km.
Stream-riparian characteristic measurements, averaged for each 12-h DHC and 24-h HCC reach, and total daily solar radiation were determined to be primary contributing factors to warming and cooling trends using three interrelated methods. First, Pearson Correlation (r) values were calculated for total daily solar radiation input, measured at the closest field weather station, to the daily increase in stream temperatures between stations for the summer (1 June to 30 September). Daily increases in stream temperatures were calculated as the difference from upstream daily minimums to downstream daily maximums, for 12-h DHC reaches, and to downstream daily minimums of the following day for 24-h HCC reaches. Pearson correlations (i.e., correlation of solar radiation to increasing temperature along each reach) were considered very strong for absolute r values of 0.90 to 1.0, strong for 0.70 to 0.89, moderate for 0.40 to 0.69, weak for 0.1 to 0.39, and negligible for 0.1 to 0 [41].
Stream-riparian and Pearson correlation (r) values were matched to corresponding reaches with warming and cooling trends in the downstream direction (i.e., greater or less than the average overall mainstem trend). Increasing ΔTS, ΔTmax, ΔTmin, and high DMI values in the downstream direction represented warming conditions, while decreasing or flat values represented cooling conditions. Using the methodology described in [42], a sensitivity analysis was conducted to identify stream-riparian and solar radiation (SR) values having the greatest influence on summer warming conditions across all 12-h DHC reaches combined. Summer mean total daily SR and stream-riparian characteristics (aspect, %SC, %ES, FRW, WW, WD, SBH) for 12-h DHC reaches were input parameters in the sensitivity analysis, while the daily mean increase (DMI) from upstream minimum to downstream maximum temperatures for 12-h DHC reaches were output parameters. The 24-h HCC reaches were too few (i.e., three) to be included.

3. Results

3.1. Stream Temperature Seasonal Variability and Trend Analysis

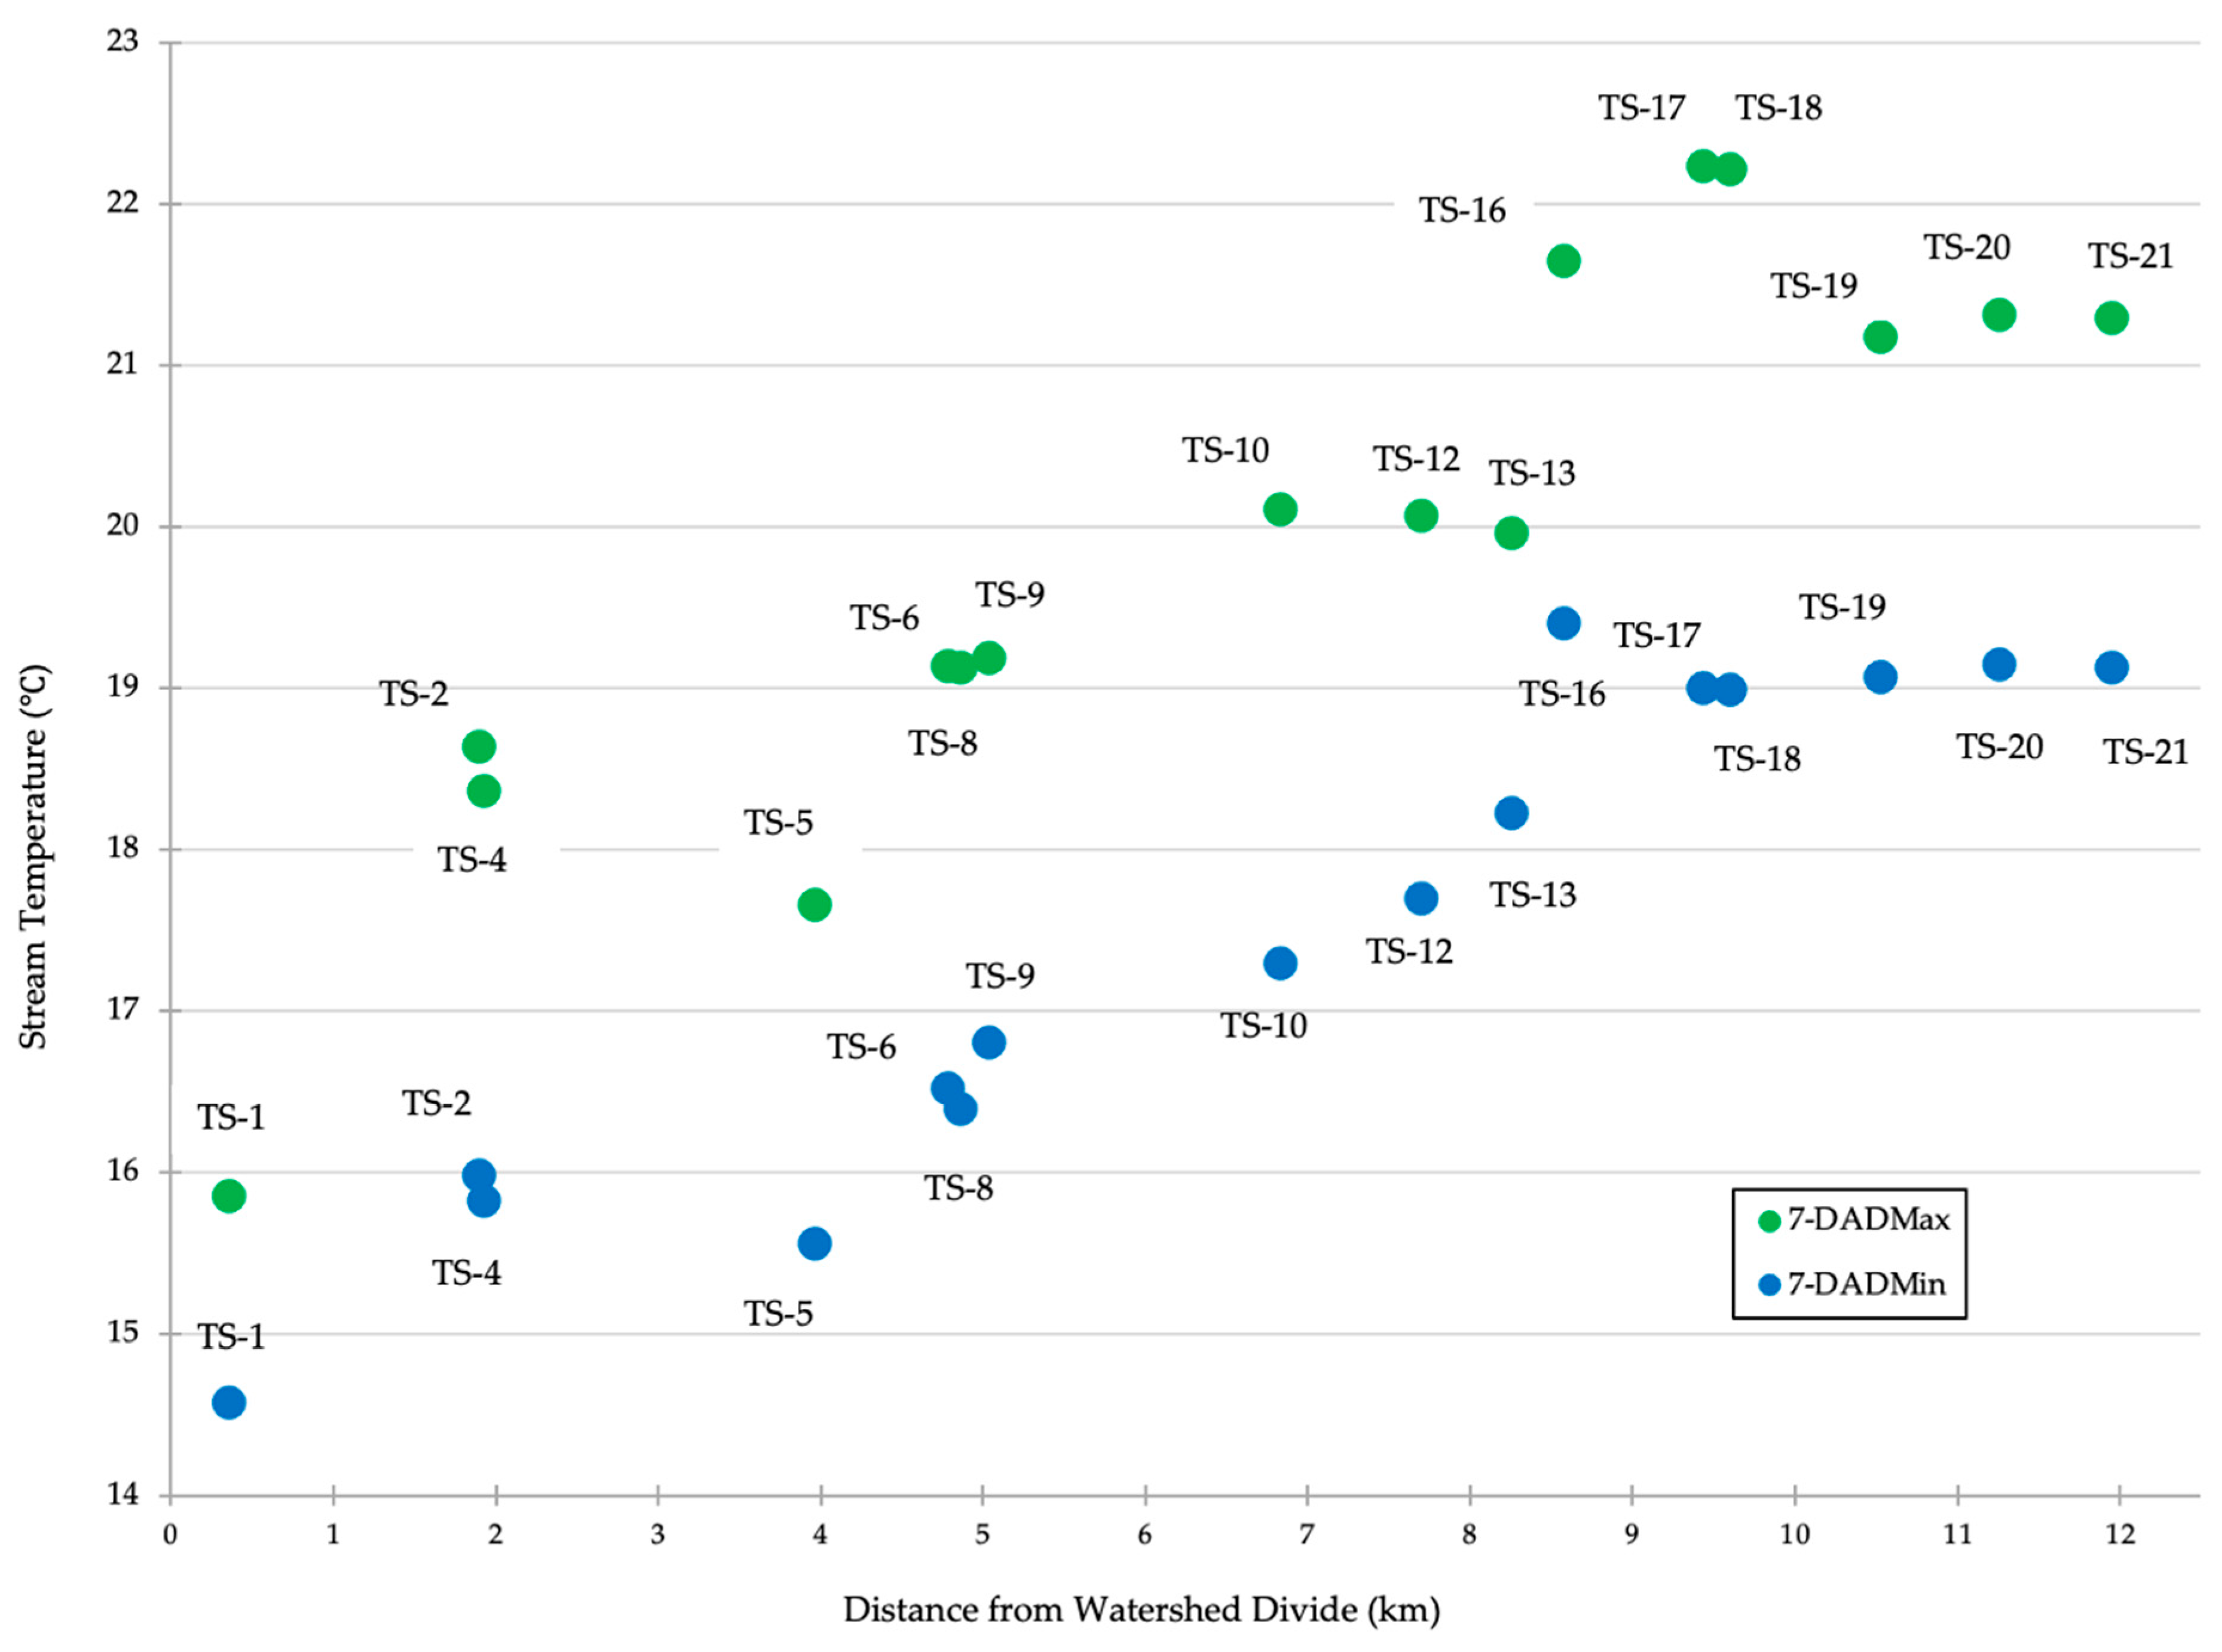
Daily summer maximum stream temperatures for the mainstem, using the 7-DADMax calcuation, averaged a low of 15.9 °C at TS-1 in the forested headwaters near (0.36 km) the watershed divide, and generally warmed in the downstream direction to a high of 22.2 °C at TS-17 in the commercial agriculture land use (9.4 km from divide), before decreasing slightly to 21.3 °C after traveling through the urban land use to TS-21 near Oak Creek’s outlet to Marys River (Figure 3, Table A1). Temperatures exceeded state water quality standards (18.0 °C for the 7-DADMax) [35] in the mainstem between the first two monitoring stations in the forested headwaters, cooled below the criteria in the next forest reach, and then exceeded the standard from the first rural residential reach to the outlet. Summer mainstem temperatures increased the most from TS-13 to TS-16 as Oak Creek became an instream irrigation reservoir (200 m long, 5.5 m wide, 2 m maximum depth) with warm surface water flowing over a flashboard dam toward TS-16. Summer temperatures decreased the most as Oak Creek flows into the urban land use section, from TS-18 to TS-19, and remained steady through the last three stations (TS-19 to TS-21). Summer stream temperature amplitude, calculated as the difference between the 7-DADMax and associated 7-DADMin, increased from 1.3 °C at TS-1 in the headwaters to a maximum of 3.2 °C at TS-17, before decreasing to 2.2 °C at TS-21.
Oak Creek’s 7-DADMax temperatures exhibit three cycles of increased heating and cooling compared to the overall average trend along the longitudinal profile. Steepest warming trends occurred in the lower commercial agriculture, first half of rural residential, and first half of forest land uses over 1.07 km to 1.57 km stream lengths, while steepest cooling trends occurred in the urban, second half of rural residential, and second half of the forested land uses over 2.04 km to 2.35 km stream lengths.
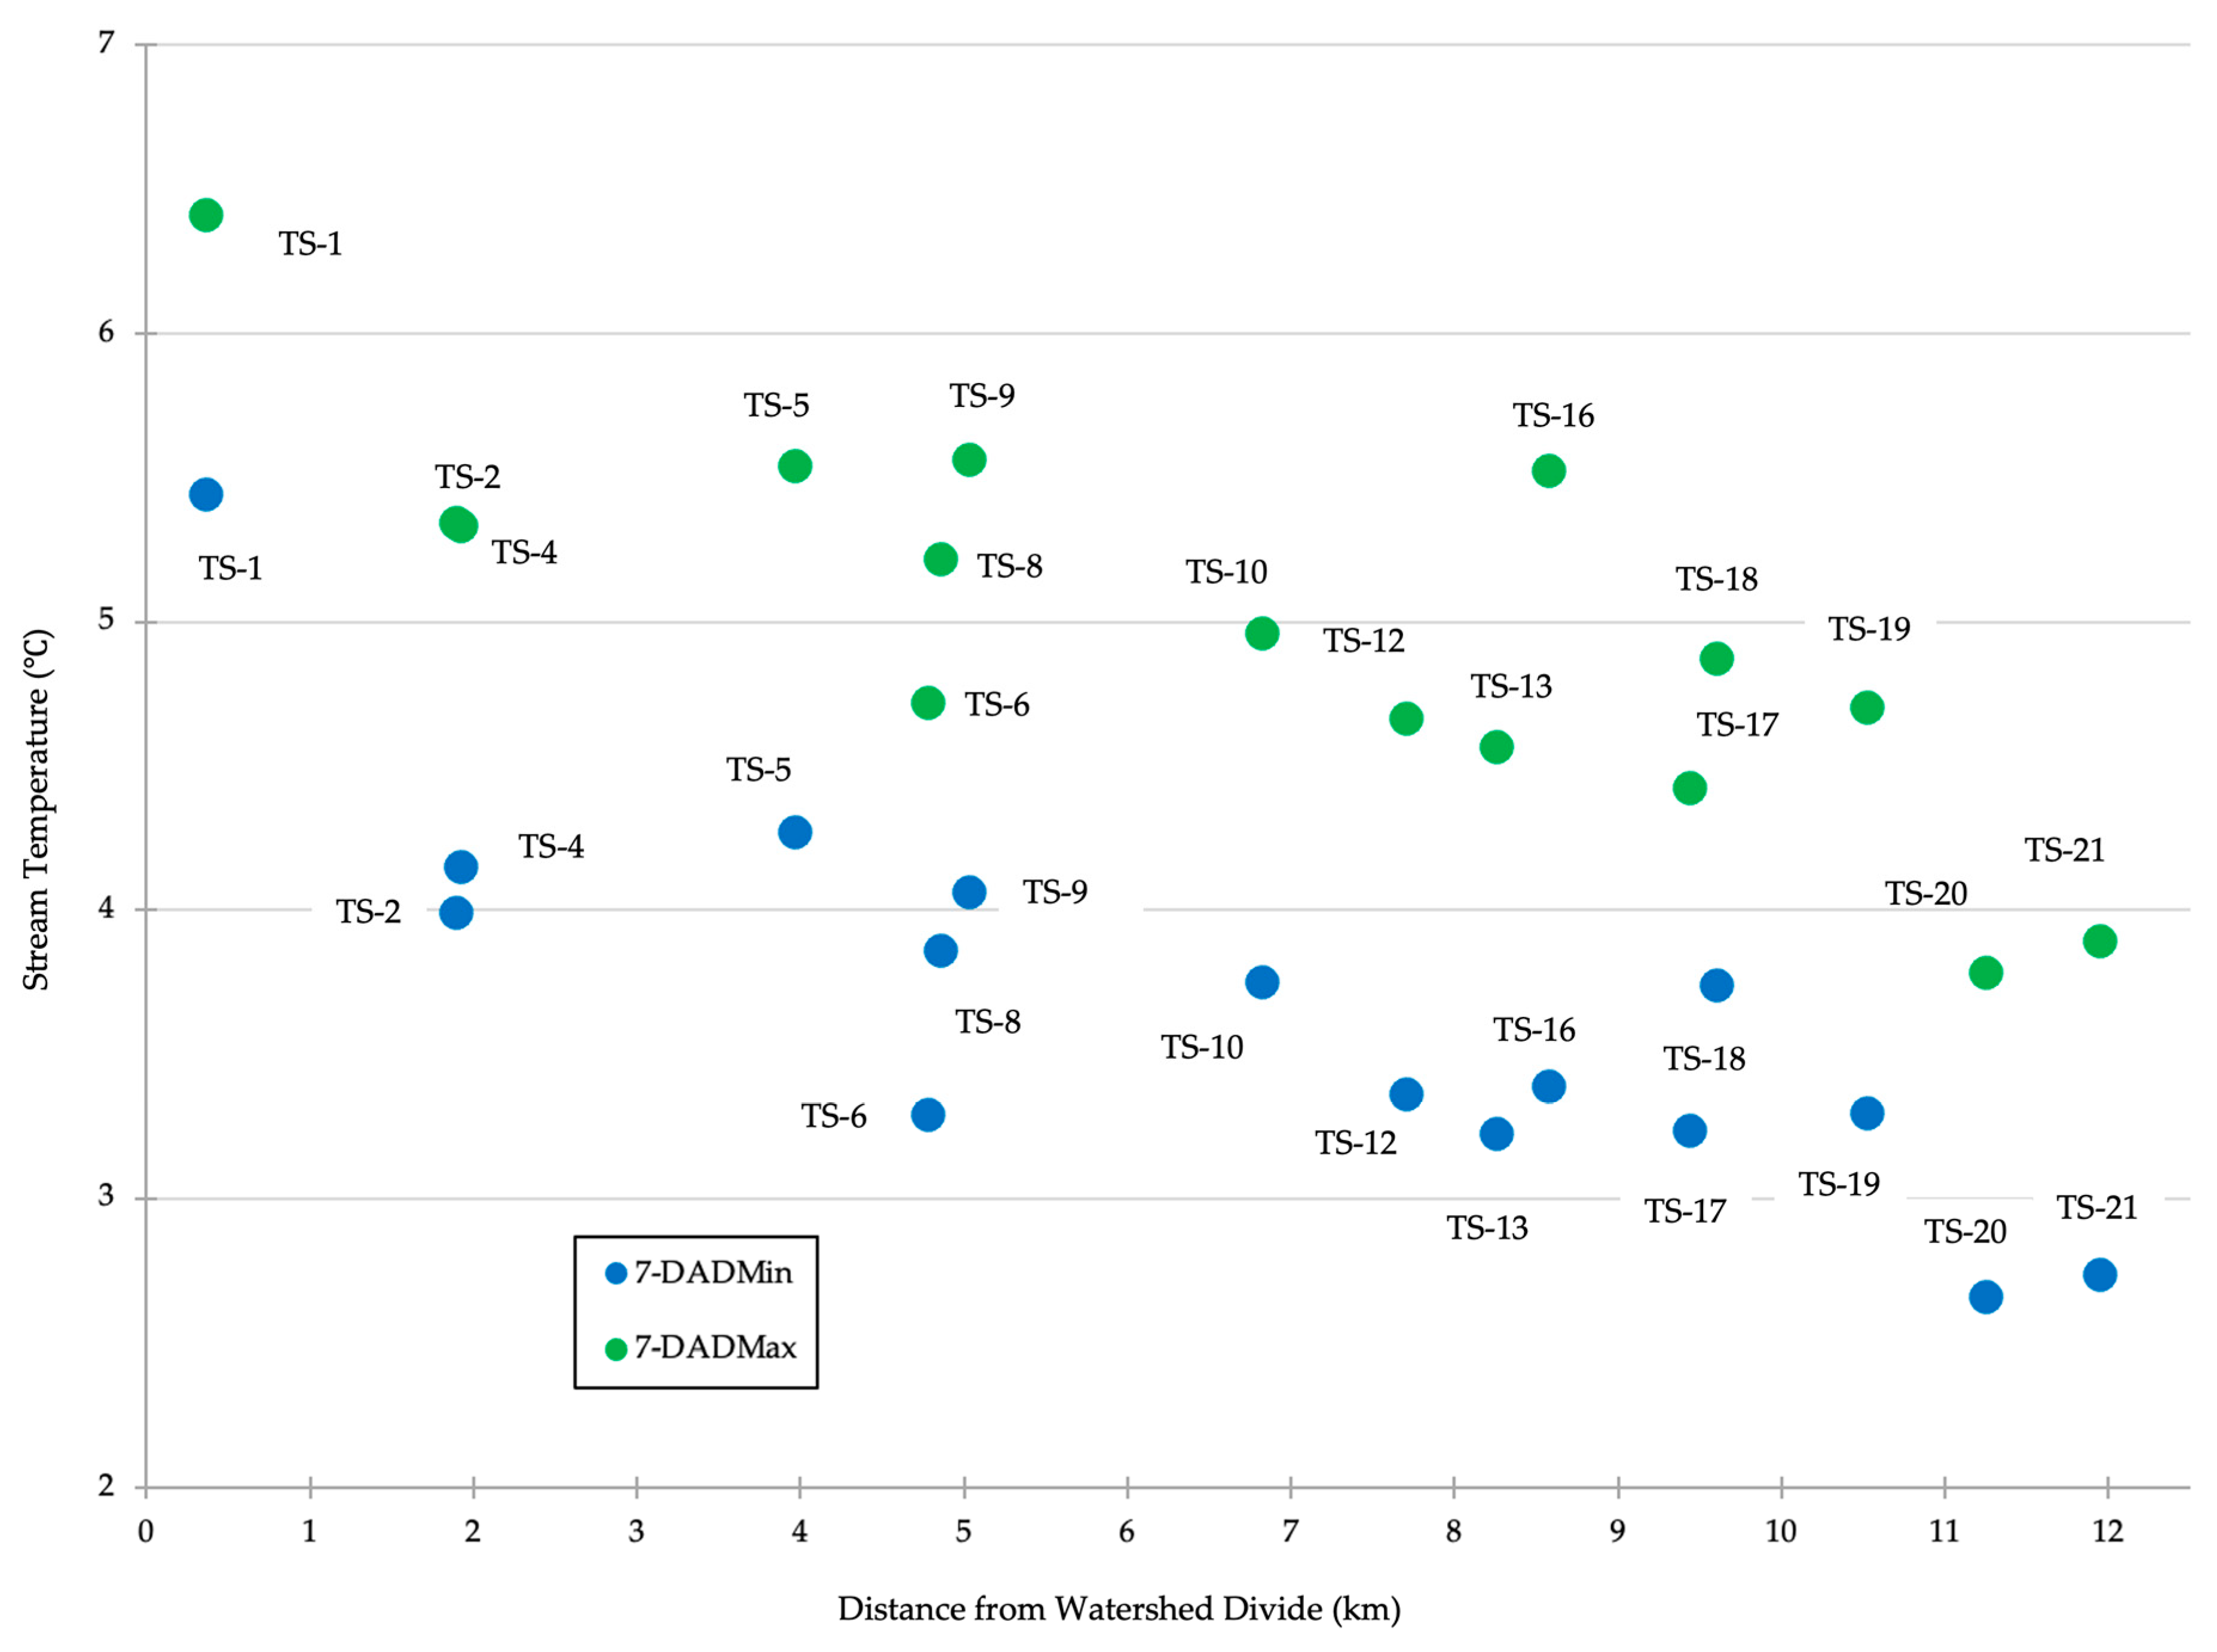
Daily winter minimum stream temperatures along the mainstem, using the 7-DADMin calculation, averaged highs of 5.4 °C at TS-1 in the forested headwaters near the watershed divide, and generally cooled in the downstream direction to lows of 2.7 °C at TS-20 in the urban section (Figure 4, Table A2). The amplitude, calculated as the difference between the 7-DADMin and associated 7-DADMax temperatures, increased from the lowest of 1.0 °C at TS-1 in the headwaters to the greatest difference of 2.1 °C at TS-16, and decreased to 1.2 °C at the last station (TS-21) near the outlet. General decreasing temperature trends in the downstream direction follow the increasing amount of surface stormwater runoff and shallow groundwater contributing to winter streamflows. Oak Creek’s 7-DADMin decreased significantly in the first forest and rural residential land use reaches and increased in the commercial agriculture land use reach compared to the average longitudinal trend. Cold snowmelt and air temperatures from multiple headwater tributaries, entering the mainstem between TS-1 to TS-2, and cold surface runoff from a neighborhood stormwater pipe, entering between TS-5 and TS-6, could contribute to significant temperature decreases, while two tributaries and groundwater from multiple subsurface tile drain outlets could contribute to warming temperatures between TS-13 and TS-16 and between TS-17 and TS-18, respectively. Insufficient tributary, stormwater, and tile drain temperature monitoring data are available to definitively conclude the presence of cold or warm water sources during winter.
The timing of the annual calendar 7-DADMax and 7-DADMin of total daily solar radiation, riparian and weather station air temperatures, and stream temperatures was relatively consistent across station types and locations over the data record. Almost all stream temperature stations (20 out of 21) had calendar 7-DADMax stream temperatures occur the week of 30 July to 5 August, while most (7 out of 8) air temperature stations occurred one week earlier (23 to 29 July), and solar radiation (WS-1 and WS-2) occurred four weeks earlier (25 June to 1 July) following the summer solstice. The timing of the annual calendar 7-DADMin stream and air temperatures occurred from 1 to 7 January for the majority of stations (15 stream, 7 air), while solar radiation values occurred two calendar weeks earlier, at the winter solstice (17 to 23 December). The remaining calendar 7-DADmin temperatures (5 stream, 1 air) occurred four weeks later, from 19 to 25 February. SMK tests resulted in accepting the null hypothesis that there are no monotonic trends over the six water years for 7-DADMin winter and 7-DADMax summer stream temperature, air temperature, Oak Creek water height, Marys River stream flow, solar radiation, and vapor pressure, using a significance level (alpha) of 0.05. Results for the 7-DADMin tests had SMK values ranging from 9 to 11 for stream and air temperature, respectively, and from −2 (solar radiation) to −9 (water height) for other parameters, p values ranging from 0.06 (stream temperature) to 0.85 (solar radiation), and Sen’s Slope ranging from 0.77 (air temperature) to −2.22 (stream flow). Results for the 7-DADMax tests had SMK values ranging from 3 (stream temperature) to 5 (air temperature, solar radiation), and −1 (stream flow) to −5 (water height) for other parameters, p values ranging from 1.0 (stream flow) to 0.45 (air temperature), and Sen’s Slope ranging from 9.0 (solar radiation) to −0.57 (stream flow).

3.2. Stream Temperature, Environment, and Landscape Feature Relationships

3.2.1. Water Height and Streamflow

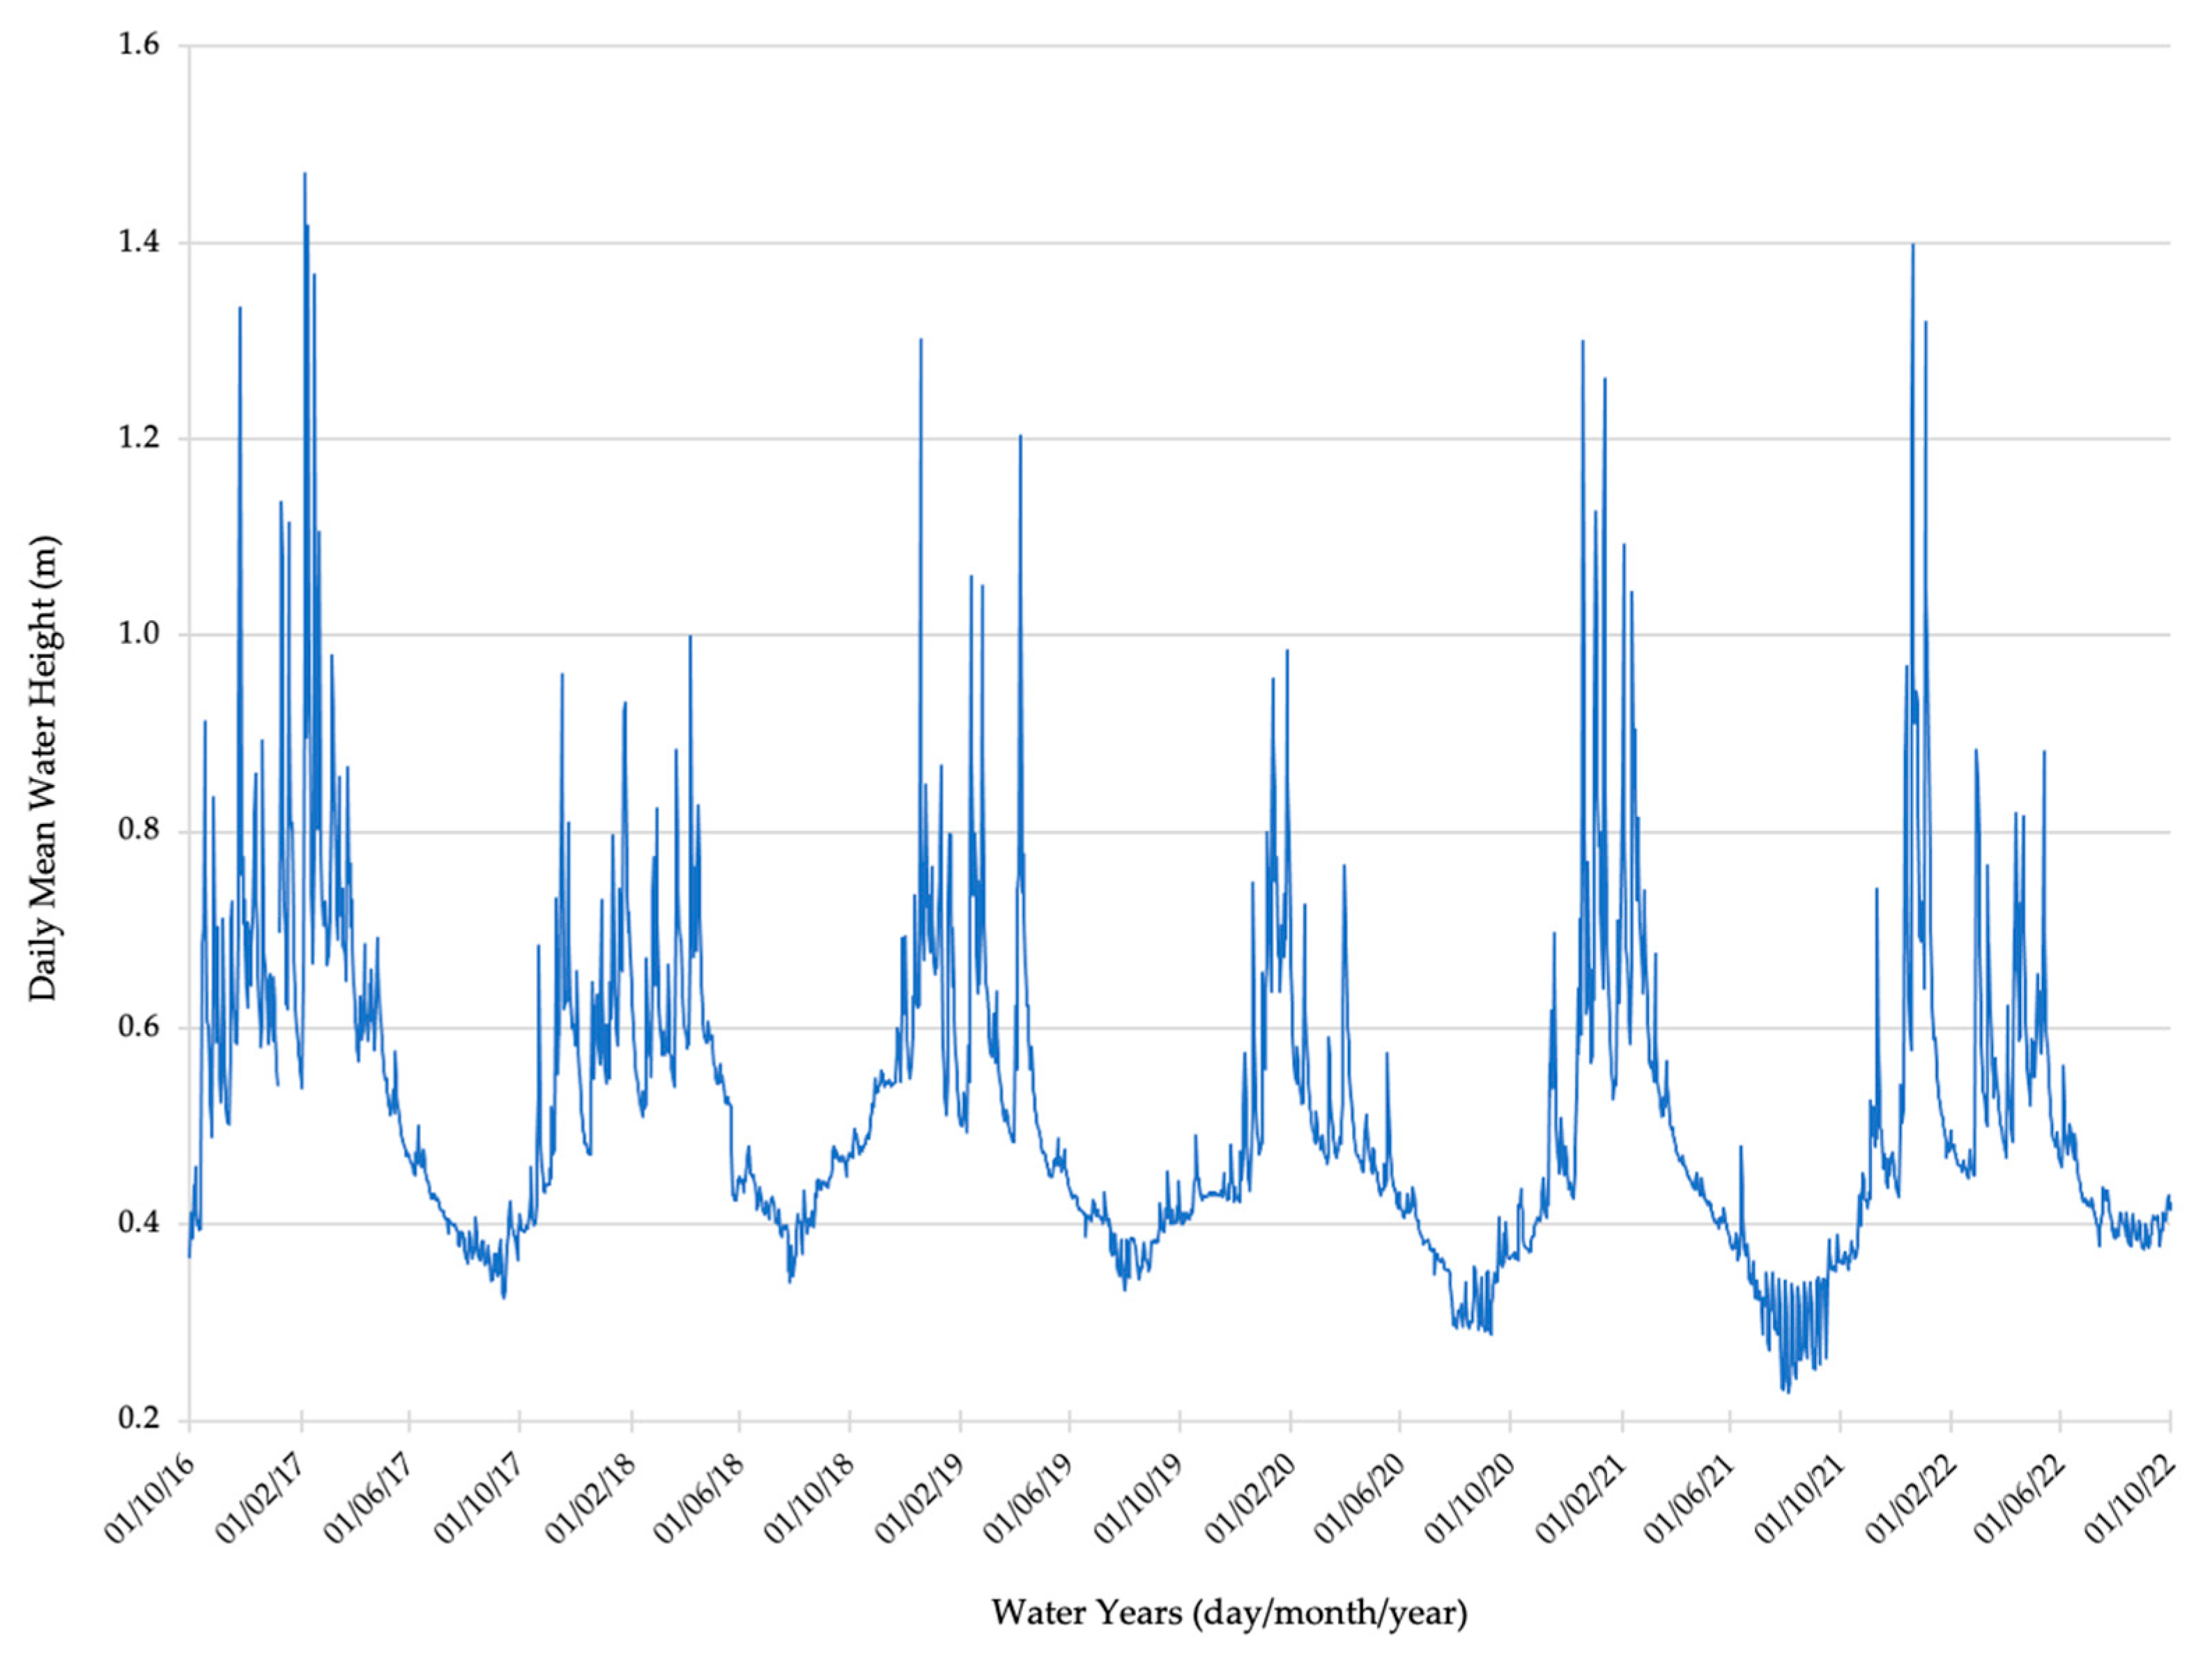
Oak Creek water height was highly variable during the period of record, with the highest levels occurring during winter precipitation months of February 2017 and December 2021, and the lowest water levels occurring during irrigation in the summer month of August 2021 (Figure 5). Discrete streamflow measurements, obtained at the gauge station on 26 February and 9 April 2019, captured two high-flow events of 1.8 m3s−1 and 2.4 m3s−1 corresponding to 1.05 m and 1.20 m water heights, respectively. Four winter streamflow measurements, obtained on 20 March, 2019 from TS-9 to TS-21 along the longitudinal profile (i.e., 5 km to 11.9 km from the watershed divide), captured an increase from 0.20 m3s−1 to 0.49 m3s−1, respectively (Table 1). These streamflow measurements indicate winter flows, between storm events, may increase linearly along the longitudinal profile as distance from the watershed divide increases.
Seven summer stream flow measurements, obtained on 10 and 11 August, 2023 from TS-1 to TS-8 along the longitudinal profile (i.e., 0.4 km to 4.9 km from the watershed divide), captured an increase from 1.1 Ls−1 to 28 Ls−1, respectively. Two additional streamflow measurements, obtained on 4 August, 2023 from the stream gauge to TS-21 (9.5 km to 11.9 km from the watershed divide), captured flows increasing slightly from 14 Ls−1 to 19 Ls−1, respectively, during irrigation. A streamflow measurement of 33 Ls−1 was obtained on 7 September, 2023 at the gauge station when no irrigation was occurring. Summer measurements indicate most flow accumulation occurs in the first half of the watershed (i.e., TS-1 to TS-8) as eight tributaries join the mainstem and Oak Creek changes from a first to fourth order stream. Streamflow increases a comparatively lesser amount from TS-8 to the outlet, as four perennial first order tributaries enter the mainstem between TS-9 to TS-15. Total streamflow may decrease from TS-16 to the outlet during irrigation.
Continuous streamflow measurements, gathered from 24 July to 17 September 2020 in the mainstem from TS-5 and TS-6, indicated an average increase in streamflow from 3 Ls−1 to 9 Ls−1. Due to the lack of incoming surface water sources, the increase is attributed to groundwater inflow from an intermittent tributary and wetland areas in the adjacent unirrigated livestock pasture. Continuous streamflow measurements from upstream of the irrigation reservoir, between TS-13 to TS-14, through the lower commercial agriculture reach to the stream gauge, between TS-17 to TS-18, indicate variable flows during the irrigation season. For example, summer 2020 measurements indicate average flows increased from 20 Ls−1 to 27 Ls−1 when not irrigating and decreased from 20 Ls−1 to 6 Ls−1 during irrigation, while summer 2022 measurements indicated average flows increased from 64 Ls−1 to 69 Ls−1 when not irrigating and decreased from 64 Ls−1 to 54 Ls−1 during irrigation. Water withdrawal rates, for irrigating pastures adjacent to Oak Creek during 2020 to 2023 summers, had a maximum daily flow rate of 26 Ls−1 and a range of instantaneous flow rates from 14 to 40 Ls−1. Irrigation typically occurred continuously during weekdays, for two to three months, between mid-June and mid-September. Total summer water withdrawals were measured as 7.34 ha-m in 2020, 11.49 ha-m in 2021, 4.92 ha-m in 2022, and 6.32 ha-m in 2023.

3.2.2. Stream Temperature Variability Along the Longitudinal Profile

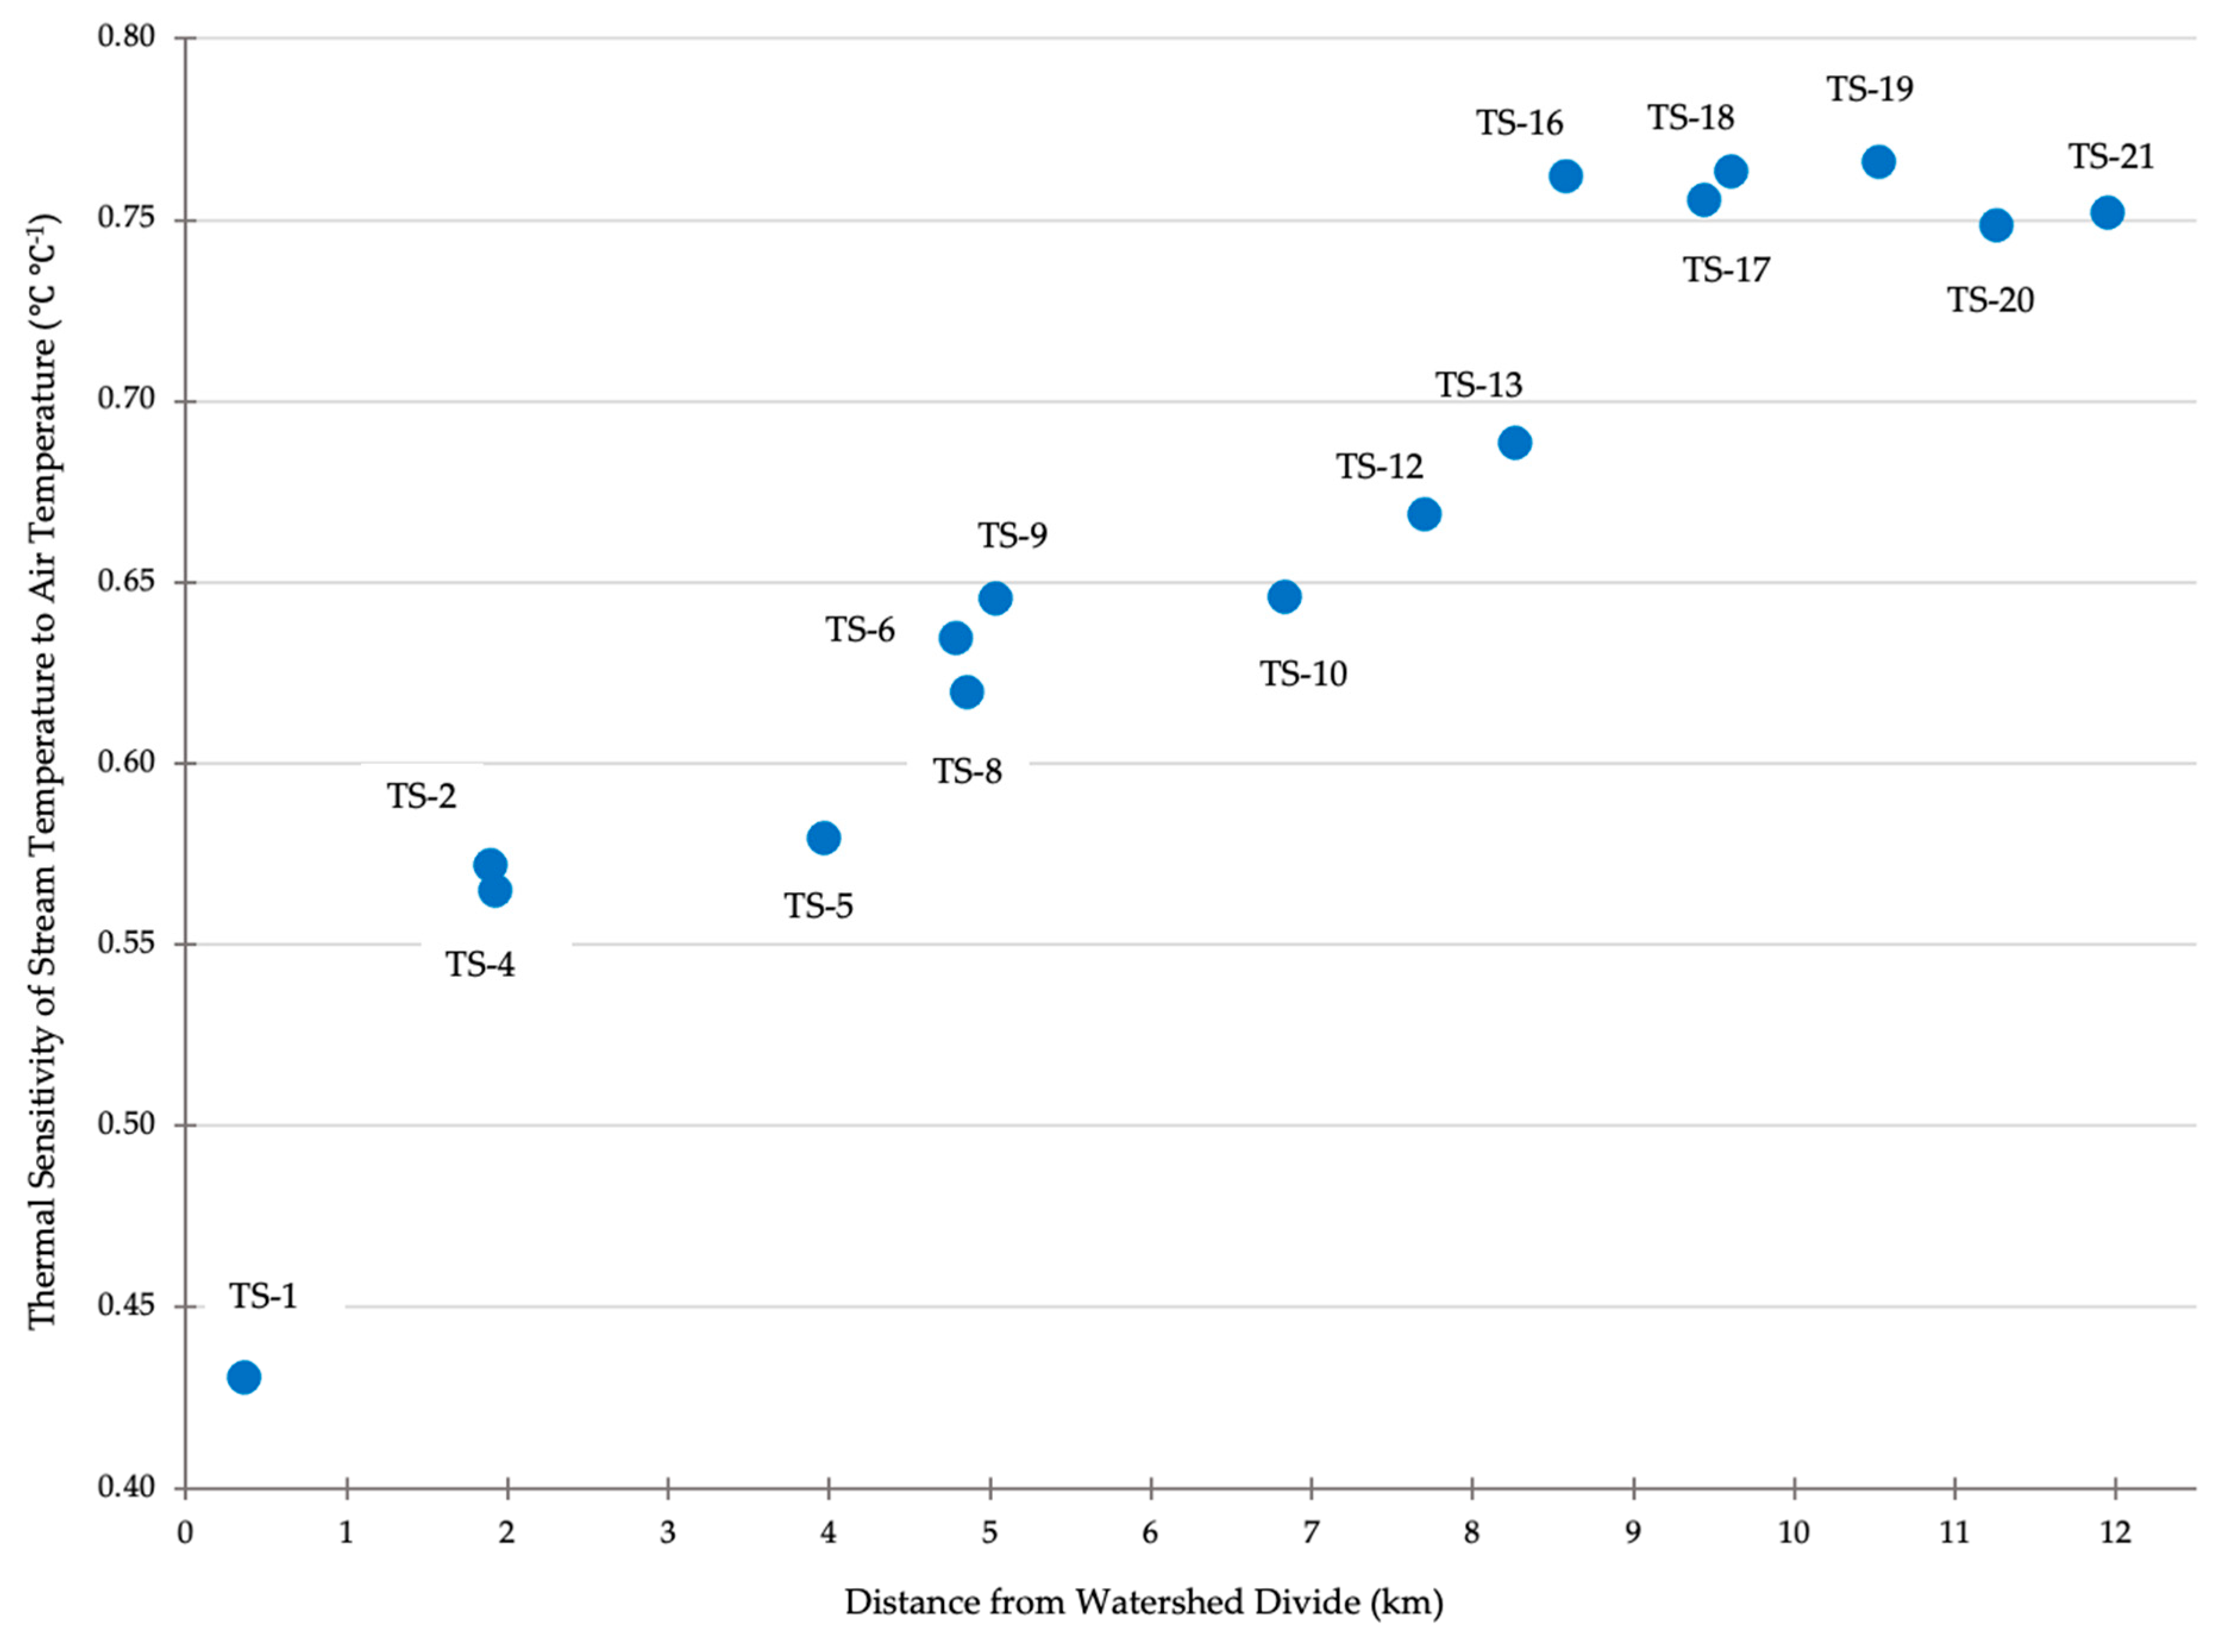
Stream thermal sensitivity (TS) generally trended upward in the downstream direction, with values ranging from 0.43 to 0.77, an average coefficient of determination (R2) of 0.96, and a standard deviation of 0.02 (Figure 6). While the longitudinal trend is positive, TS remained flat or slightly decreased between stations TS-2 to TS-5, TS-9 to TS-10, and TS-16 to TS-21. Using 12-h DHC reach lengths, greatest increases in ΔTS and ΔTS-km−1 occurred between TS-1 to TS-2 and TS-1 to TS-4 in the upland forest, TS-5 to TS-9 in the rural residential, and TS-13 to TS-17 and TS-13 to TS-18 in the agriculture land use, while both values were flat or slightly decreased between TS-18 to TS-20 and TS-18 to TS-21 in the urban land use. (Table 2).
The greatest change in summer (1 June to 30 September) daily maximum stream temperatures between stations (ΔTmax) occurred between the first two stations in the forest (TS-1 to TS-2) and three stations (TS-13 to TS-17, TS-13 to TS-18) in the agricultural land use (Table 2). However, the greatest ΔTmax km−1 occurred in the agriculture land use and first reach (TS-5 to TS-9) in the rural residential land use. Greatest decreases in ΔTmax and ΔTmax km−1 occurred from TS-18 to TS-21 in the urban section and from TS-4 to TS-5 in the forest. In contrast, ΔTmin over 24-h HCC reach lengths increased the most from TS-1 to TS-5 in the forest and decreased slightly from TS-13 to TS-21 through the agricultural and urban land uses.
The greatest daily mean increases per kilometer stream reach (DMI km−1), from upstream minimum to downstream maximum temperatures, occurred in the agriculture land use reach (TS-13 to TS-17, TS-13 to TS-18) and first portion of the rural residential land use (TS-5 to TS-9), while the lowest increases occurred in the urban land use (TS-18 to TS-21) and second portion of the forest land use (TS-4 to TS-5; Table 2). The greatest daily mean increases per kilometer 24-h HCC stream reach (DMI km−1), from upstream minimum to downstream minimum temperatures, occurred in the rural residential land use (TS-5 to TS-13).

3.2.3. Stream-Riparian Features and Solar Radiation Correlations to Stream Temperature

The agricultural reach (TS-13 to TS-18), which experienced the greatest warming conditions, had stream-riparian characteristics of low %SC, %ES, and FRW, high WW and WD, moderate SBH, an eastern aspect (88°), and the greatest r values (0.87 to 0.88) for solar radiation to temperature increases (Table 3). Confounding factors for this reach include an instream summer irrigation dam, located between TS-13 and TS-16, where water is removed (pumped) for irrigation, and the warmest surface water flows over a flashboard dam before reaching TS-16. Additionally, two small tributaries (unnamed and TS-14) contribute streamflow to the reservoir and two intermittent tributaries join the mainstem between TS-16 to TS-17. However, stream temperature data did not detect these tributaries as influencing mainstem temperatures due to minimal flow and similar temperature conditions. It appears exposed conditions (i.e., low %SC, %ES, FRW, strong r solar radiation correlation), warm surface water from the reservoir, and decreased streamflows during irrigation outweigh the cooling advantages of high WD, moderate SBH, eastern aspect, and potential cool groundwater inflows.
The first rural residential land use reach (TS-5 to TS-9), with the second-highest warming conditions, had a southeastern aspect (150°), moderate %SC, FRW, WW, WD, and SBH, low %ES, and strong r (0.77). Confounding factors include a third-order tributary (TS-7), with slightly cooler summer stream temperatures, and groundwater inflows from two intermittent streams (between TS-5 and TS-6, and TS-8 to TS-9) and adjacent wetland areas that potentially moderate overall reach temperature increases. The first forest land use reach (TS-1 to TS-2), with the third highest warming conditions, had a southeastern aspect (118°), low WD and SBH, and strong r correlation (0.70) of solar radiation to temperature increase, yet high %SC, %ES, FRW, and low WW that are typically associated with cooling conditions. Confounding factors that may contribute to warming conditions include three perennial tributaries that enter the mainstem between stations, have similar characteristics to the mainstem, and increase streamflow by approximately six times the flow of TS-1.
The urban land use stream reach (TS-18 to TS-21) had cooling conditions with the lowest ΔTS, ΔTS km−1, ΔTmax, ΔTmax km−1, and DMI km−1 values. Stream-riparian characteristics supporting cooling conditions include an east aspect, moderate to high %SC, %ES, FRW, and WD, high SBH, and moderate r (0.56). No perennial tributaries enter the mainstem between stations. While streamflows are reduced in both the agriculture and urban reaches during irrigation, measured streamflows increased through the urban reach, indicating potential groundwater inflows from irrigating adjacent residential, campus, and OSU agriculture lands may be a confounding factor affecting cooling conditions.
The most downstream forest (TS-4 to TS-5) and middle rural residential (TS-9 to TS-12) reaches had cooling conditions, yet stream-riparian characteristics support both warming and cooling conditions. The forested reach has a high %ES and FRW, moderate WW and WD, low %SC and SBH, southeastern aspect, and strong r, while the middle reach has moderate %SC, %ES, WW, WD, and SBH, low FRW, southeastern aspect, and strong r. Four tributaries, with similar characteristics as the mainstem, enter between the forest stations and approximately double the streamflow while increasing stream order from two to three. The middle rural residential reach has one second-order tributary that flows through a large beaver pond-wetland complex and enters the mainstem as two first-order tributaries (unnamed and TS-11) slightly upstream and downstream of TS-10. While these two tributaries increase mainstem streamflow, tributary temperature at TS-11 was warmer than at TS-10 in the summer. However, these tributaries may moderate mainstem temperature through groundwater inputs.
The three longer 24-h HCC stream reaches have low to moderate rates of ΔTS-km−1, low ΔTmin km−1 compared to ΔTmax km−1, and low DMI km−1 traveling through the forest (TS-1 to TS-5), rural residential (TS-5 to TS-13), and a combination of agricultural and urban land uses (TS-13 to TS-18). All three stream reaches begin with high rates of warming, followed by decreased warming rates in the forest and rural residential land uses, and by cooling temperatures in the urban reach. Stream characteristics exhibit a mix of conditions that support both heating and cooling. Similarly, r values were positive and moderate, with values ranging from r = 0.40 in the forest (TS-1 to TS-5), and r = 0.41 in the agriculture-urban land uses (TS-13 to TS-21), to r = 0.56 in the rural residential reach (TS-5 to TS-13).
The strongest positive Pearson Correlation r values corresponded to the agriculture reach with the highest warming conditions (i.e., high ΔTS, ΔTmax, DMI), while the moderate r values corresponded to the urban land use with cooling conditions (i.e., low ΔTS, ΔTmax, DMI) and for the change in daily minimum temperatures over the longer 24-h HCC reaches. However, r values did not change proportionately in relation to heating-cooling variability of reaches within the same strong or moderate classes. These results indicate r values predict correlation strength consistent with heating and cooling conditions, but the range in values within ratings may not correspond with variable conditions of TS, Tmax, Tmin, and DMI.
The stream reach sensitivity (S) analysis across all reaches indicated strong positive statistics for daily solar radiation (SR) to MDI km−1, strong negative or inverse S for effective shade (%ES), and moderate negative or inverse S for forested riparian width (%FRW) and streambank height (SBH). The %ES parameter had the greatest influence with an S value of −0.92, followed by SR (S = 0.63) and FRW (S = −0.55) (Table 4).

4. Discussion

This study identified reach-specific stream temperature warming and cooling conditions that exceeded average trends along the longitudinal profile in a mixed land use watershed. Matching temperature conditions with their corresponding reach correlation strength for solar radiation and daily temperature increases, along with reach-specific stream-riparian characteristics, helped identify the factors most likely influencing these conditions as changes occur along the longitudinal profile. Study results provide foundational data and a repeatable process for tracking changes in stream temperatures, physical and environmental characteristics, and associated relationships over time, as well as for comparing results with those from other ecosystems.
Results from this study indicate that summer headwater temperatures and longitudinal heating patterns observed in Oak Creek are comparable to those of other Willamette River tributaries in the Oregon Coast Range mountains, which have limited snow accumulation, no federally managed reservoirs, and minimal deep groundwater inflows, as described in [36]. However, stream temperature increases to above Oregon’s TMDL water quality standards (i.e., 7-DADMax 18 °C) in forested headwaters, with high effective shade and buffer widths have not been reported in the Willamette Valley. Studies analyzing the effects of forest riparian buffer harvests on temperature have noted short-term increases followed by temperature recovery associated with increased shade [16,43]. Results from this study support other studies that document small streams as being more vulnerable to exposure, with stream temperatures warming as the distance from the Pacific Coast increases and stream order increases [20,26]. Additionally, inland Oregon streams are found to have warmer temperatures than streams with winter snowpack and high groundwater inflows [36].
Factors influencing the warming conditions of Oak Creek’s lower, commercial agriculture reach, which include low stream cover, effective shade, and forested buffer width, southern aspect, solar radiation, and an instream irrigation reservoir with warm surface water overflows, have been well documented [9,10,11]. In contrast, few inland PNW fourth-order streams with cooling summer maximum stream temperatures in the downstream reaches have been documented [36]. Study results of cooling in the downstream direction are similar to other studies documenting small- to medium-sized streams cooling after flowing from exposed upstream conditions through downstream reaches with increased riparian vegetation [16,43,44], and through downstream reaches with groundwater inflow from irrigation [21] and cool tributary influences [45]. Increasing stream thermal sensitivity along the longitudinal profile with increasing stream size, air temperature, and distance from headwaters, and stabilizing thermal sensitivity when mean stream temperatures reach or exceed 20 °C, are typical for first- to fourth-order streams without significant cooling from groundwater inputs, reservoir releases, or coastal influences [8,20,24,25].
Oak Creek’s winter minimum 7-DADMin stream temperatures decrease along the longitudinal profile as streams are more exposed to cold surrounding air and cold surface runoff increasingly contributes to storm flows. This cooling pattern is similar to that of other PNW rain-dominated streams west of the Cascade Mountain Range, where mean daily air temperatures in winter are above 0 °C, groundwater accounts for a lower percentage of winter flows, and warm anthropogenic inputs are limited, as described in [36].
Seasonal trend analysis did not detect increasing or decreasing trends in annual maximum or minimum stream and air temperatures for the 6-year data period. However, this 6-year period was hotter in terms of Oregon’s measured annual mean temperatures, number of days warmer than 32.2 °C, and nights warmer than 18.3 °C compared to the 1970 to 1999 baseline, and 2021 and 2022 were among the hottest years on record as the number of days above 32.2 °C [46]. Protecting and enhancing cool water refugia will become increasingly important for aquatic health, considering predictions that Oregon’s annual temperatures are expected to increase by at least 2.8 °C by 2074 and 4.2 °C by 2100, with the greatest seasonal increases occurring in summer [46]. The timing of the annual maximum and minimum air and stream temperatures is consistent with Oregon’s historic records and causes of extreme weather conditions, such as midlatitude jet streams and soil moisture feedback influencing heatwaves and cold Arctic air from the northeast influencing cold air outbreaks. For example, the June 2021 heat dome followed the driest spring in Oregon’s recorded history, indicating potential soil-moisture feedback from the relative lack of evaporative cooling to the surface.
This study provided critical insights into the relationships between stream temperatures and environmental factors in warm-climate riparian systems, which could assist in prioritizing potential land management adjustments to help improve or sustain temperature conditions and stream-riparian characteristics that support aquatic health. For example, first- and second-order streams in the forested land use (i.e., TS-1 to TS-5) were dominated by southern stream aspects, shallow stream depths, and low bank heights, while having high effective overstory shade and forested buffer widths. Land management changes could involve adding large woody material and installing beaver dam analogs, or allowing beaver dams to establish, to increase stream depths, hyporheic exchange, and stream cover. Additionally, establishing more shade-tolerant shrubs and trees can enhance understory stream cover, as described in [33,47]. Stream heating of a third to fourth order stream (i.e., TS-6 to TS-13) flowing through the rural residential reach appeared dominated by lower effective shade, forest riparian buffer widths, and water depths. Conditions could be improved by removing competing invasive and native vegetation (e.g., reed canary grass, Himalayan blackberry, native grasses) and establishing more native shade trees (e.g., big leaf maple, white alder) to improve stream shade [13,16], and adding large woody material to improve stream cover, pool depths, and hyporheic exchange where cool refugia could be supported, such as at the intersection of intermittent tributaries [45,48].
The largest increase in stream temperature occurs at the exposed instream irrigation reservoir (i.e., TS-13 to TS-16), where significant stream flow is removed during irrigation and warm surface water flows over the flashboards. These conditions could be improved by establishing riparian trees and shrubs for overstory shade and understory cover, and by implementing an alternative overflow system using cooler reservoir water for downstream flow [24]. The remaining portion of the agriculture reach has low stream cover, moderate effective shade and forested riparian width, and reduced streamflow due to irrigation withdrawals, but moderate to high stream depths and livestock fencing of riparian areas beyond 30 m. This area could be improved through removing existing competing invasive and native vegetation, establishing more shade-tolerant trees and shrubs, and adding large woody material to provide more cover, shade, forested width, and hyporheic exchange in stream gravels, as mentioned previously.
The most downstream reach through urban land use (TS-18 to TS-21) provides cooler summer temperature conditions with moderate effective shade, forested buffer widths, wetted widths, depths, and bank heights, despite its southeastern aspects and the lack of high shade and forest buffer widths. More site-specific temperature and flow measurements would help determine if groundwater inputs and hyporheic exchange are significant cooling factors. This reach has limited potential for modifying stream-riparian characteristics due to urban transportation infrastructure limiting buffer width expansion and large woody material inputs that may increase flooding. However, some riparian conditions could be improved through removing competing invasive and native vegetation and establishing more shade trees.
Results from this study enhance the state of knowledge regarding stream temperature, land cover, and land use interactions in the PNW region, and help prioritize reaches for maintaining cooling strongholds, as identified in [18], and for improving stream-riparian characteristics if changes will provide significant ecosystem benefits at a reasonable cost [49]. Incorporating both remote sensing and in situ stream-riparian data provided an improved understanding of how stream temperatures vary seasonally and interannually along the longitudinal profile. Primary study limitations included data loss due to equipment malfunction and floating debris dislodging loggers during high flows, which reduced the amount of data for analyzing seasonal variability at some sites. Secondarily, the accuracy of stream flow measurements in the forest and urban reaches, as well as during low flows, was reduced due to the limited number of measurements and the use of multiple methods. However, the range and accuracy of measured flows were adequate for estimating general changes in magnitude along the longitudinal profile.
While project results align with expectations that solar radiation is the dominant heating source and a controlling factor of stream temperature in low stream shade and cover conditions, study results for stream reaches with moderate to high shade and cover are mixed, highlighting how variable factor combinations may have greater influence over temperature conditions. Results indicate that tributaries that significantly increase mainstem flow and land management practices in multi-land-use watersheds have the potential to override stream conditions and temperature relationships. Project results are relevant to other temperate climate ecosystems worldwide and highlight the variability of stream temperatures in relation to distance from the divide, physical factors influencing solar radiation input, stream size and shape, groundwater input, aspect, and seasonality.
Future stream temperature–environmental relationships research should involve snowmelt and deeper groundwater-dominated stream flow conditions in both mesic and drier ecosystems of the PNW region for comparison. Measuring solar radiation at stream surfaces and potential cooling factors, such as groundwater inflows from irrigation and intermittent tributaries, and evaporative and longwave radiation cooling, would help clarify primary heating and cooling factors in moderate to high shade and cover conditions where temperature heating and cooling patterns are contrary to expected results (i.e., high shade and warming, moderate shade and cooling). Furthermore, stream temperature studies in areas where the 7-DADMax air temperatures exceed 37 °C would improve understanding of stream-air temperature relationships and predictions of stream temperature changes with increasing air temperatures.

Author Contributions

Conceptualization, D.C.G. and C.G.O.; Methodology, D.C.G. and C.G.O.; Formal analysis, D.C.G. and C.G.O.; Investigation, D.C.G. and C.G.O.; Resources, D.C.G. and C.G.O.; Data curation, D.C.G. and C.G.O.; Writing—original draft, D.C.G. and C.G.O.; Writing—review & editing, D.C.G. and C.G.O.; Visualization, D.C.G. and C.G.O.; Supervision, D.C.G. and C.G.O.; Project administration, D.C.G. and C.G.O.; Funding acquisition, D.C.G. and C.G.O. All authors have read and agreed to the published version of the manuscript.

Funding

This research received no external funding.

Data Availability Statement

Most of the data presented in this study are available in the article. Additional information is available upon request.

Conflicts of Interest

The authors declare no conflicts of interest.

Appendix A

Table A1. Data show the mean, standard error (SE), and range of values for the summer annual maximum 7-DADMax stream temperatures, and the associated 7-DADMin, for 2017 to 2022 water years. It also shows the difference between 7-DADMax and 7-DADMin and water years (n) of data. All temperature units are in degrees Celsius.
7-DADMax7-DADMin7-DADMax -
StationMean (SE)RangeMean (SE)Range7-DADMinn
TS-115.85 (0.77)15.08–16.6214.58 (0.70)13.88–15.281.272
TS-218.63 (0.32)17.51–19.4315.98 (0.35)15.04–16.962.666
TS-418.37 (0.25)17.46–19.0915.83 (0.31)15.03–16.692.546
TS-517.66 (0.35)17.07–18.2715.55 (0.05)15.50–15.662.113
TS-619.14 (0.41)18.00–20.8816.52 (0.40)15.70–18.092.626
TS-819.13 (0.42)17.94–20.5116.40 (0.45)15.39–17.732.735
TS-919.19 (0.50)17.97–20.1516.81 (0.47)15.63–17.662.393
TS-1020.11 (0.27)20.05–20.9317.29 (0.41)16.37–18.752.825
TS-1220.07 (0.35)19.17–21.5617.69 (0.33)16.88–19.192.386
TS-1319.96 (0.51)18.58–21.4918.22 (0.38)17.41–19.531.735
TS-1621.65 (NA)21.6519.40 (NA)19.42.251
TS-1722.24 (0.48)20.90–23.1119.01 (0.53)18.03–20.333.244
TS-1822.22 (0.25)21.79–22.8018.99 (0.37)18.19–19.893.235
TS-1921.18 (0.45)19.93–21.9519.07 (0.49)18.06–21.952.124
TS-2021.32 (0.35)20.08–22.3119.15 (0.31)18.32–20.282.176
TS-2121.30 (0.29)20.44–21.6419.12 (0.36)18.06–19.552.184
TS-15*19.84 (0.77)18.71–21.9717.88 (0.28)17.29–18.461.964
Tributaries
TS-316.93 (0.46)15.64–18.2715.06 (0.37)14.05–16.291.875
TS-718.56 (0.33)17.71–19.9615.75 (0.34)14.94–17.032.816
TS-1121.13 (0.72)18.73–23.0818.52 (0.33)17.11–19.432.616
TS-1420.92 (0.58)19.47–22.6218.69 (0.39)17.91–19.732.235
TS-15* is in a reach of Oak Creek that becomes an in-stream reservoir during summer. NA is not applicable.
Table A2. Data show the mean, standard error (SE), and range of values for the winter annual minimum 7-DADMin stream temperatures, and the associated 7-DADMax, for 2017 to 2022 water years. It also shows the difference between 7-DADMax and 7-DADMin and water years (n) of data. All temperature units are in degrees Celsius.
7-DADMin7-DADMax7-DADMax -
StationMean (SE)RangeMean (SE)Range7-DADMinn
TS-15.44 (0.58)4.82–6.606.41 (0.54)5.65–7.460.973
TS-23.99 (0.51)2.96–5.785.34 (0.47)4.27–6.981.355
TS-44.15 (0.57)2.96–5.635.33 (0.55)4.27–6.811.194
TS-54.27 (0.63)3.59–5.525.54 (0.61)4.75–6.741.273
TS-63.29 (0.18)2.93–3.464.72 (0.30)4.15–5.471.434
TS-83.86 (0.45)2.50–5.575.22 (0.46)3.79–6.901.365
TS-94.06 (0.61)3.26–5.255.56 (0.50)4.99–6.561.513
TS-103.75 (0.46)2.94–5.004.96 (0.53)3.79–6.331.214
TS-123.36 (0.45)2.22–5.004.66 (0.47)3.42–6.311.305
TS-133.22 (0.64)1.20–5.174.56 (0.62)2.61–6.381.345
TS-163.39 (NA)3.395.53 (NA)5.532.141
TS-173.23 (0.47)1.85–4.704.42 (0.50)2.94–5.941.195
TS-183.74 (0.38)3.24–4.864.87 (0.42)4.21–6.101.145
TS-193.29 (0.23)2.84–3.594.70 (0.42)3.92–5.351.413
TS-202.66 (0.39)1.99–3.353.78 (0.48)2.98–4.921.133
TS-212.74 (0.50)1.86–3.593.89 (0.57)2.95–4.921.153
TS-15*2.76 (1.09)1.15–4.833.66 (1.24)1.92–6.070.913
Tributaries
TS-34.00 (0.63)2.30–6.135.07 (0.67)3.00–7.041.065
TS-73.53 (0.17)2.95–3.965.00 (0.17)4.37–5.321.474
TS-112.48 (0.68)0.95–4.013.51 (0.80)1.73–5.351.034
TS-143.07 (0.26)2.25–4.124.25 (0.24)3.66–5.331.186
TS-15* is in a reach of Oak Creek that becomes an in-stream reservoir during summer. NA is not applicable.

References

  1. Bonacina, L.; Fasano, F.; Mezzanotte, V.; Fornaroli, R. Effects of Water Temperature on Freshwater Macroinvertebrates: A Systematic Review. Biol. Rev. 2023, 98, 191–221. [Google Scholar] [CrossRef]
  2. Caissie, D. The Thermal Regime of Rivers: A Review. Freshw. Biol. 2006, 51, 1389–1406. [Google Scholar] [CrossRef]
  3. Allan, J.D.; Castillo, M.M. Stream Ecology; Springer: Dordrecht, The Netherlands, 2007; pp. 75–103. [Google Scholar] [CrossRef]
  4. Armstrong, J.B.; Schindler, D.E.; Ruff, C.P.; Brooks, G.T.; Bentley, K.E.; Torgersen, C.E. Diel Horizontal Migration in Streams: Juvenile Fish Exploit Spatial Heterogeneity in Thermal and Trophic Resources. Ecology 2013, 94, 2066–2075. [Google Scholar] [CrossRef]
  5. Flores, L.; Mojica, J.; Fletcher, A.; Casey, P.; Christin, Z.; Armistead, C.; Batker, D. The Value of Natural Capital in the Columbia River Basin: A Comprehensive Analysis; Earth Economics: Tacoma, WA, USA, 2017; Report version 1.5; Available online: https://ucut.org/wp-content/uploads/2017/12/ValueNaturalCapitalColumbiaRiverBasinDec2017.pdf (accessed on 18 August 2025).
  6. Elsner, M.M.; CUO, L.; Voisin, N.; Deems, J.S.; Hamlet, A.F.; Vano, J.F.; Mickelson, K.E.B.; Lee, S.Y.; Lettenmaier, D.P. Implications of 21st Century Climate Change for the Hydrology of Washington State: Washington State Climate Change Impacts Assessment. Clim. Change 2010, 102, 225–260. [Google Scholar] [CrossRef]
  7. Isaak, D.J.; Wenger, S.J.; Peterson, E.E.; Ver Hoef, J.M.; Nagel, D.E.; Luce, C.H.; Hostetler, S.W. The NorWeST Summer Stream Temperature Model and Scenarios for the Western U.S.: A Crowd-Sourced Database and New Geospatial Tools Foster a User Community and Predict Broad Climate Warming of Rivers and Streams. Water Resour. Res. 2017, 53, 9181–9205. [Google Scholar] [CrossRef]
  8. Webb, B.W.; Hannah, D.M.; Moore, R.D.; Brown, L.E.; Nobilis, F. Recent Advances in Stream and River Temperature Research. Hydrol. Process. 2008, 22, 902–918. [Google Scholar] [CrossRef]
  9. Arismendi, I.; Safeeq, M.; Dunham, J.B.; Johnson, S.L. Can Air Temperature Be Used to Project Influences of Climate Change on Stream Temperature? Environ. Res. Lett. 2014, 9, 084015. [Google Scholar] [CrossRef]
  10. Poole, G.C.; Berman, C.H. An Ecological Perspective on In-Stream Temperature: Natural Heat Dynamics and Mechanisms of Human-Caused Thermal Degradation. Environ. Manag. 2001, 27, 787–802. [Google Scholar] [CrossRef] [PubMed]
  11. Moore, R.; Spittlehouse, D.L.; Story, A. Riparian Microclimate and Stream Temperature Response to Forest Harvesting: A Review1. JAWRA J. Am. Water Resour. Assoc. 2005, 41, 813–834. [Google Scholar] [CrossRef]
  12. Wondzell, S.M.; Diabat, M.; Haggerty, R. What Matters Most: Are Future Stream Temperatures More Sensitive to Changing Air Temperatures, Discharge, or Riparian Vegetation? JAWRA J. Am. Water Resour. Assoc. 2019, 55, 116–132. [Google Scholar] [CrossRef]
  13. Johnson, S.L. Factors Influencing Stream Temperatures in Small Streams: Substrate Effects and a Shading Experiment. Can. J. Fish. Aquat. Sci. 2004, 61, 913–923. [Google Scholar] [CrossRef]
  14. Benyahya, L.; Caissie, D.; El-Jabi, N.; Satish, M.G. Comparison of Microclimate vs. Remote Meteorological Data and Results Applied to a Water Temperature Model (Miramichi River, Canada). J. Hydrol. 2010, 380, 247–259. [Google Scholar] [CrossRef]
  15. Diabat, M.; Haggerty, R.; Wondzell, S.M. Diurnal Timing of Warmer Air under Climate Change Affects Magnitude, Timing and Duration of Stream Temperature Change. Hydrol. Process. 2013, 27, 2367–2378. [Google Scholar] [CrossRef]
  16. Arismendi, I.; Groom, J.D. A Novel Approach for Examining Downstream Thermal Responses of Streams to Contemporary Forestry. Sci. Total Environ. 2019, 651, 736–748. [Google Scholar] [CrossRef] [PubMed]
  17. Bogan, T.; Mohseni, O.; Stefan, H.G. Stream Temperature-Equilibrium Temperature Relationship. Water Resour. Res. 2003, 39, 9. [Google Scholar] [CrossRef]
  18. Burkholder, B.K.; Grant, G.E.; Haggerty, R.; Khangaonkar, T.; Wampler, P.J. Influence of Hyporheic Flow and Geomorphology on Temperature of a Large, Gravel-Bed River, Clackamas River, Oregon, USA. Hydrol. Process. 2008, 22, 941–953. [Google Scholar] [CrossRef]
  19. Kelleher, C.; Wagener, T.; Gooseff, M.; McGlynn, B.; McGuire, K.; Marshall, L. Investigating Controls on the Thermal Sensitivity of Pennsylvania Streams. Hydrol. Process. 2012, 26, 771–785. [Google Scholar] [CrossRef]
  20. Chang, H.; Psaris, M. Local Landscape Predictors of Maximum Stream Temperature and Thermal Sensitivity in the Columbia River Basin, USA. Sci. Total Environ. 2013, 461–462, 587–600. [Google Scholar] [CrossRef]
  21. Essaid, H.I.; Caldwell, R.R. Evaluating the Impact of Irrigation on Surface WaterGroundwater Interaction and Stream Temperature in an Agricultural Watershed. Sci. Total Environ. 2017, 599–600, 581–596. [Google Scholar] [CrossRef] [PubMed]
  22. Johnson, Z.C.; Johnson, B.G.; Briggs, M.A.; Devine, W.D.; Snyder, C.D.; Hitt, N.P.; Hare, D.K.; Minkova, T.V. Paired Air-Water Annual Temperature Patterns Reveal Hydrogeological Controls on Stream Thermal Regimes at Watershed to Continental Scales. J. Hydrol. 2020, 587, 124929. [Google Scholar] [CrossRef]
  23. Risley, J.C.; Constantz, J.; Essaid, H.; Rounds, S. Effects of Upstream Dams versus Groundwater Pumping on Stream Temperature under Varying Climate Conditions. Water Resour. Res. 2010, 46, 6. [Google Scholar] [CrossRef]
  24. Hester, E.T.; Doyle, M.W. Human Impacts to River Temperature and Their Effects on Biological Processes: A Quantitative Synthesis. JAWRA J. Am. Water Resour. Assoc. 2011, 47, 571–587. [Google Scholar] [CrossRef]
  25. Fullerton, A.H.; Torgersen, C.E.; Lawler, J.J.; Faux, R.N.; Steel, E.A.; Beechie, T.J.; Ebersole, J.L.; Leibowitz, S.G. Rethinking the Longitudinal Stream Temperature Paradigm: Region-Wide Comparison of Thermal Infrared Imagery Reveals Unexpected Complexity of River Temperatures. Hydrol. Process. 2015, 29, 4719–4737. [Google Scholar] [CrossRef]
  26. Hrachowitz, M.; Soulsby, C.; Imholt, C.; Malcolm, I.A.; Tetzlaff, D. Thermal Regimes in a Large Upland Salmon River: A Simple Model to Identify the Influence of Landscape Controls and Climate Change on Maximum Temperatures. Hydrol. Process. 2010, 24, 3374–3391. [Google Scholar] [CrossRef]
  27. Tonolla, D.; Acuña, V.; Uehlinger, U.; Frank, T.; Tockner, K. Thermal Heterogeneity in River Floodplains. Ecosystems 2010, 13, 727–740. [Google Scholar] [CrossRef]
  28. Monk, W.A.; Wilbur, N.M.; Curry, R.A.; Gagnon, R.; Faux, R.N. Linking Landscape Variables to Cold Water Refugia in Rivers. J. Environ. Manag. 2013, 118, 170–176. [Google Scholar] [CrossRef]
  29. Durfee, N.; Ochoa, C.G.; Jones, G. Stream Temperature and Environment Relationships in a Semiarid Riparian Corridor. Land 2021, 10, 519. [Google Scholar] [CrossRef]
  30. Huang, F.; Qian, B.; Ochoa, C.G. Long-Term River Water Temperature Reconstruction and Investigation: A Case Study of the Dongting Lake Basin, China. J. Hydrol. 2023, 616, 128857. [Google Scholar] [CrossRef]
  31. Beechie, T.; Imaki, H.; Greene, J.; Wade, A.; Wu, H.; Pess, G.; Roni, P. Restoring Salmon Habitat for a Changing Climate. River Res. Appl. 2013, 29, 939–960. [Google Scholar] [CrossRef]
  32. Deitchman, R.; Loheide, S.P., II. Sensitivity of Thermal Habitat of a Trout Stream to Potential Climate Change, Wisconsin, United States. J. Am. Water Resour. Assoc. 2012, 48, 1091–1103. [Google Scholar] [CrossRef]
  33. Dugdale, S.J.; Bergeron, N.E.; St-Hilaire, A. Spatial Distribution of Thermal Refuges Analysed in Relation to Riverscape Hydromorphology Using Airborne Thermal Infrared Imagery. Remote Sens. Environ. 2015, 160, 43–55. [Google Scholar] [CrossRef]
  34. Ochoa, C.G.; Jarvis, W.T.; Hall, J. A Hydrogeologic Framework for Understanding Surface Water and Groundwater Interactions in a Watershed System in the Willamette Basin in Western Oregon, USA. Geosciences 2022, 12, 109. [Google Scholar] [CrossRef]
  35. Strahler, A. Dynamic Basis of Geomorphology. Geol. Soc. Am. Bull. 1952, 63, 923–938. [Google Scholar] [CrossRef]
  36. Michie, R.; Costello, E.; Grund, Y.; Talbot, B.; Bloom, J. Total Maximum Daily Loads for the Willamette Subbasins: Technical Support Document Temperature. State of Oregon Department of Environmental Quality. 2024. Available online: https://ormswd2.synergydcs.com/HPRMWebDrawer/Record/6905977 (accessed on 31 August 2025).
  37. Turnipseed, D.P.; Sauer, V.B. Discharge Measurements at Gaging Stations. In Techniques and Methods 3-A8; US Geological Survey: Reston, VA, USA, 2010. [Google Scholar] [CrossRef]
  38. Samani, Z.; Magallanez, H. Simple Flume for Flow Measurement in Open Channel. J. Irrig. Drain. Eng. 2000, 126, 127–129. [Google Scholar] [CrossRef]
  39. Moore, R.D. Introduction to Salt Dilution Gauging for Streamflow Measurement: Part I. Streamline Watershed Manag. Bull. 2004, 7, 20–23. [Google Scholar]
  40. Gómez, D.G.; Ochoa, C.G.; Godwin, D.; Tomasek, A.A.; Zamora Re, M.L. Soil Water Balance and Shallow Aquifer Recharge in an Irrigated Pasture Field with Clay Soils in the Willamette Valley, Oregon, USA. Hydrology 2022, 9, 60. [Google Scholar] [CrossRef]
  41. Schober, P.; Boer, C.; Schwarte, L.A. Correlation Coefficients: Appropriate Use and Interpretation. Anesth. Analg. 2018, 126, 1763–1768. [Google Scholar] [CrossRef]
  42. Walker, S.E.; Mitchell, J.K.; Hirschi, M.C.; Johnsen, K.E. Sensitivity Analysis of the Root Zone Water Quality Model. Trans. ASAE 2000, 43, 841–846. [Google Scholar] [CrossRef]
  43. Dent, L.; Vick, D.; Abraham, K.; Schoenholtz, S.; Johnson, S. Summer Temperature Patterns in Headwater Streams of the Oregon Coast Range. JAWRA J. Am. Water Resour. Assoc. 2008, 44, 803–813. [Google Scholar] [CrossRef]
  44. Gomi, T.; Moore, R.D.; Dhakal, A.S. Headwater Stream Temperature Response to Clear-Cut Harvesting with Different Riparian Treatments, Coastal British Columbia, Canada. Water Resour. Res. 2006, 42, W08437. [Google Scholar] [CrossRef]
  45. Ebersole, J.L.; Wigington, P.J.; Leibowitz, S.G.; Comeleo, R.L.; Van Sickle, J. Predicting the Occurrence of Cold-Water Patches at Intermittent and Ephemeral Tributary Confluences with Warm Rivers. Freshw. Sci. 2015, 34, 111–124. [Google Scholar] [CrossRef]
  46. Fleishman, E. (Ed.) The Seventh Oregon Climate Assessment. Oregon Climate Change Research Institute; Oregon State University: Corvallis, OR, USA, 2025. [Google Scholar] [CrossRef]
  47. Hester, E.T.; Doyle, M.W. In-Stream Geomorphic Structures as Drivers of Hyporheic Exchange. Water Resour. Res. 2008, 44, 1–17. [Google Scholar] [CrossRef]
  48. Mayer, T.D. Controls of Summer Stream Temperature in the Pacific Northwest. J. Hydrol. 2012, 475, 323–335. [Google Scholar] [CrossRef]
  49. Beechie, T.J.; Sear, D.A.; Olden, J.D.; Pess, G.R.; Buffington, J.M.; Moir, H.; Roni, P.; Pollock, M.M. Process-Based Principles for Restoring River Ecosystems. BioScience 2010, 60, 209–222. [Google Scholar] [CrossRef]
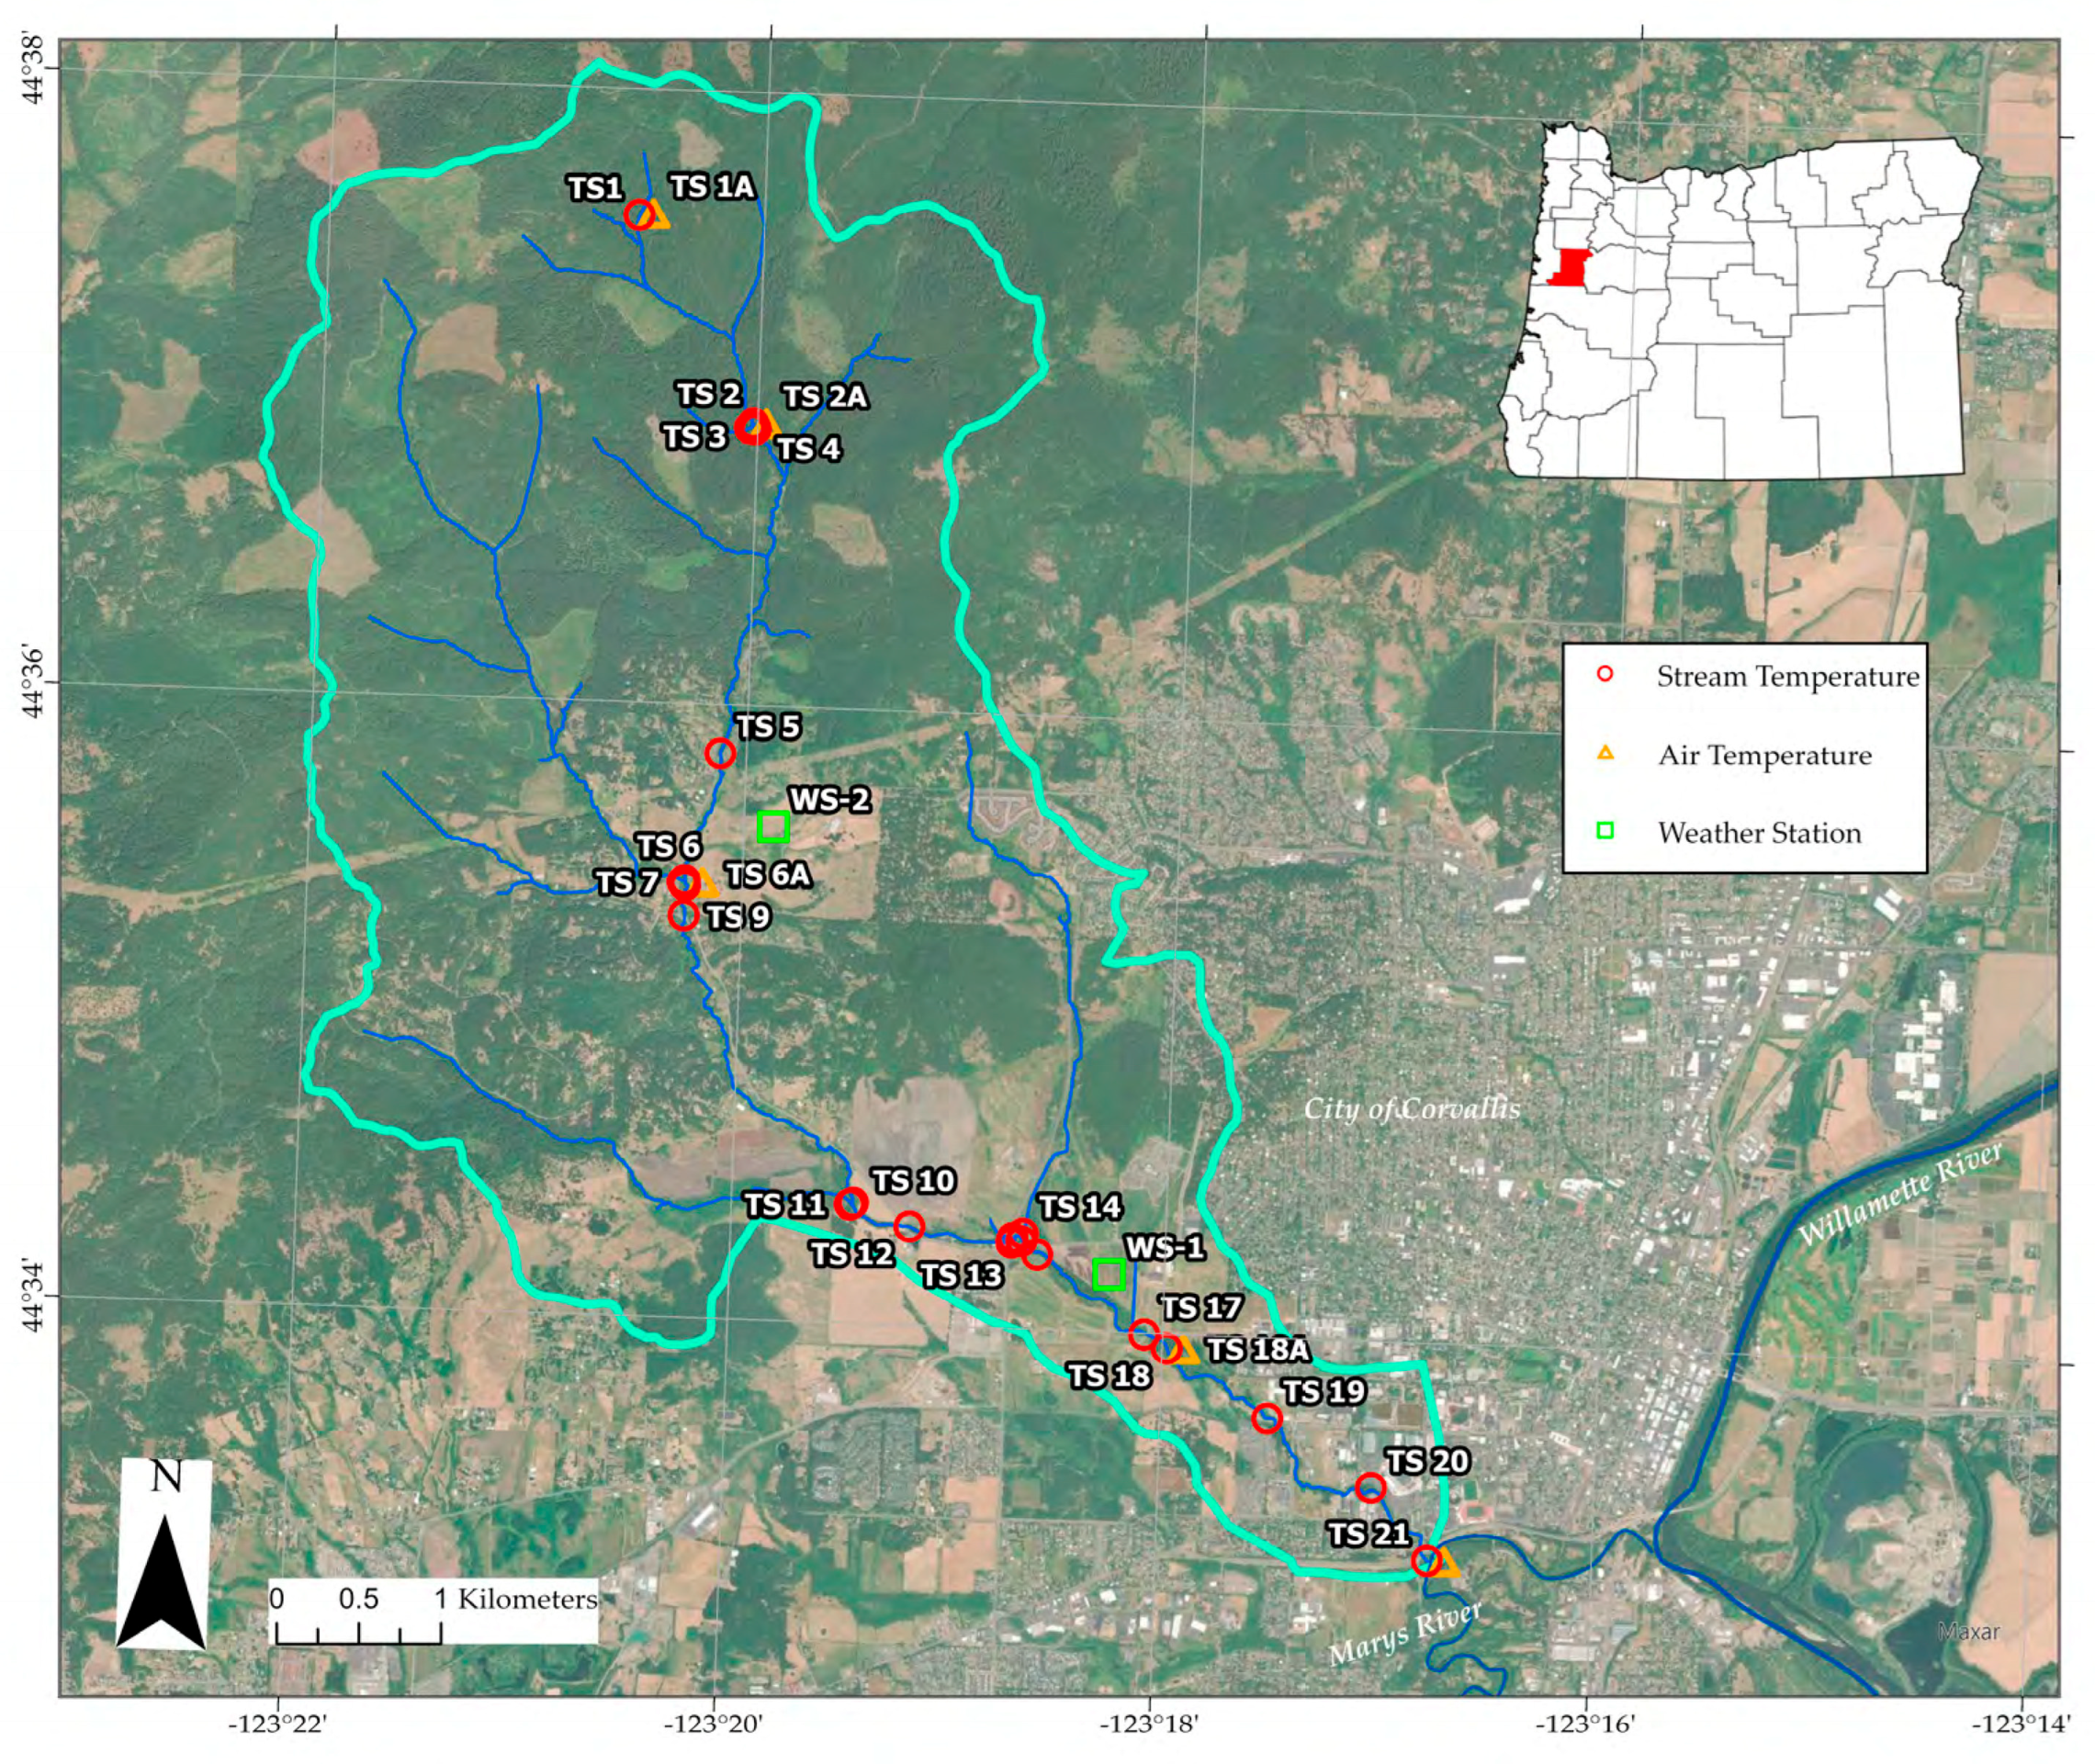
Figure 1. Map of the Oak Creek watershed in Benton County, OR, USA showing locations of stream temperature (TS-1 to TS-21), riparian air temperature (TS-1A, 2A, 6A, 18A, 21A), and open-field weather (WS-1, WS-2) monitoring stations. The state of Oregon outline map shows the location of Benton County (red) on the western side of the state. Map created using ArcGIS Pro 3.5.2, Esri, Copyright © 1995–2025.
Hydrology 12 00230 g001
Figure 2. Oak Creek stream temperature (TS-1 to TS-21), riparian air temperature (TS-1A, 2A, 6A, 18A, 21A), and open-field weather (WS-1, WS-2) monitoring stations are located and graphed by elevation and distance from watershed divide, with surrounding land use identified.
Hydrology 12 00230 g002
Figure 3. Six-Year mean of the annual maximum 7-DADMax stream temperatures, and the associated 7-DADMin, for each mainstem monitoring location for Water Years 2017 to 2022.
Hydrology 12 00230 g003
Figure 4. Six-Year mean of the annual minimum 7-DADMin stream temperatures, and the associated 7-DADMax, for each mainstem monitoring location for Water Years 2017 to 2022.
Hydrology 12 00230 g004
Figure 5. Oak Creek mainstem water height, for water years 2017 through 2022, measured at the stream gauge located between monitoring stations TS-17 to TS-18.
Hydrology 12 00230 g005
Figure 6. Stream thermal sensitivity (i.e., slope of linear regression) of calendar 7-DADmean stream temperatures (dependent variable) to riparian air temperatures (independent variable) for Water Years 2017 to 2022.
Hydrology 12 00230 g006
Table 1. Streamflow increase, along Oak Creek’s mainstem longitudinal profile, as measured 20 March 2019 (winter) and 4, 10, and 11 August 2023 (summer), with distance from watershed divide for each station and Strahler stream order for the mainstem. Stations TS-1 and TS-4 were measured on 10 August 2023, stations TS-2, TS-3, TS-6, TS-7, and TS-8 were measured on 11 August 2023, and the gauge station and TS-21 were measured on 4 August 2023. Water was withdrawn from an instream reservoir, located between TS-13 and TS-16, for irrigation on 4 August 2023, measurements.
Station, TributaryDistance from Divide kmWinter Streamflow L s−1Summer Streamflow L s−1Mainstem Stream Order
TS-10.4-1.11
TS-21.9-6.62
Trib TS-31.9-0.62
TS-41.9-7.12
TS-64.8-153
Trib TS-74.8-144
TS-84.9-284
TS-95.0198-4
Between TS-9 to TS-106.0247-4
Gauge Station
(between TS-17 and TS-18)
9.5298144
TS-2111.9490194
Table 2. Change from upstream to downstream of stream thermal sensitivity (ΔTS and ΔTS km−1), summer (1 June to 30 September) daily maximum stream temperature (ΔTmax, ΔTmax km−1) and summer daily minimum stream temperature (ΔTmin, ΔTmin km−1). Summer daily mean increase (DMI) in temperature from upstream minimum to downstream maximum, for 12-h Daily Heating Cycle (DHC), and upstream minimum to next-day downstream minimum for 24-h Heating-Cooling Cycle (HCC) reach lengths. Values are divided by reach length to normalize per km. Land uses adjacent to stream reaches are noted. All temperature values are in degrees Celsius.
Reach StationsLength kmΔTSΔTS km−1ΔTmaxΔTmax km−1DMIDMI km−1
12-h DHC Forest (commercial)
Divide to TS-10.36
TS-1 to TS-21.530.140.091.200.782.891.89
TS-1 to TS-41.570.130.091.040.672.751.75
TS-4 to TS-52.040.010.010.900.442.191.07
Rural Residential—Mixed Forest and Agriculture (non-commercial)
TS-5 to TS-91.070.070.061.050.982.462.30
TS-9 to TS-101.790.000.001.040.582.951.65
TS-9 to TS-122.670.020.011.110.423.141.18
TS-10 to TS-131.430.040.030.940.662.751.92
Agriculture (commercial, large-scale)
TS-13 to TS-171.180.070.061.191.013.122.64
TS-13 to TS-181.340.070.061.170.872.942.19
Urban (residential, university campus)
TS-18 to TS-201.65−0.01−0.010.910.552.421.47
TS-18 to TS-212.35−0.010.000.870.372.361.00
24-h HCC ΔTminΔTmin km−1
TS-1 to TS-53.610.150.041.160.320.930.26
TS-5 to TS-134.290.110.031.130.261.440.34
TS-13 to TS-213.690.060.020.970.261.050.28
Table 3. Stream-riparian characteristics measured during summer low-flow conditions (August) and averaged between reach stations. Stream aspect, percent stream cover (%SC), percent effective shade (%ES), forested riparian width (FRW), wetted width (WW), wetted maximum depth (WD), and streambank height above water (SBH) were measured. Pearson Correlation (r) of total daily solar radiation to summer daily stream temperature increase between stations, with temperature increase calculated as the difference between upstream daily minimum to downstream maximum for 12-h Daily Heating Cycle (DHC), and upstream daily minimum to next-day downstream minimum for 24-h Heating–Cooling Cycle (HCC) reach lengths. Land uses adjacent to stream reaches are also noted. NA is not applicable.
Reach StationsAspect Degrees%SC%ESFRW mWW mWD mSBH mr
12-h DHC Forest (commercial)
Divide to TS-11557797300.860.051NA
TS-1 to TS-21186896301.450.0910.70
TS-1 to TS-41256596301.700.1210.70
TS-4 to TS-51535984252.430.1510.83
Rural Residential—Mixed Forest and Agriculture (non-commercial)
TS-5 to TS-91506861173.330.2620.77
TS-9 to TS-101437075184.830.4120.75
TS-9 to TS-121207076154.360.4520.83
TS-10 to TS-131096884154.380.4720.81
Agriculture (commercial, large-scale)
TS-13 to TS-17836253126.270.7720.87
TS-13 to TS-18886157165.700.6720.88
Urban (residential, university campus)
TS-18 to TS-20936583184.200.3330.73
TS-18 to TS-21996579164.550.3430.56
24-h HCC
TS-1 to TS-51356290271.940.1210.40
TS-5 to TS-131276873163.780.3520.56
TS-13 to TS-21916370145.410.5530.41
Table 4. Stream reach sensitivity (S) analysis statistics of summer (1 June to 30 September) mean total daily solar radiation (SR) and stream-riparian characteristics (aspect, %SC, %ES, FRW, WW, WD, SBH) to the mean daily increase (MDI km−1), from upstream minimum to downstream maximum temperature. S is nondimensional and calculated as defined by [42]. Stream reach lengths based on 12-h DHC.
Input ParametersS Values of Output Parameters
MDI km−1
Aspect−0.34
%SC0.38
%ES−0.92
FRW−0.55
WW0.42
WD0.24
SBH−0.49
SR0.63
Disclaimer/Publisher’s Note: The statements, opinions and data contained in all publications are solely those of the individual author(s) and contributor(s) and not of MDPI and/or the editor(s). MDPI and/or the editor(s) disclaim responsibility for any injury to people or property resulting from any ideas, methods, instructions or products referred to in the content.