Abstract
This study aims to analyse the effect of partially clogged inlets on the behaviour of urban drainage systems at the city scale, particularly regarding intercepted volumes and flood depths. The main challenges were to represent the inlet network in detail at a rather large scale and to avoid the effect of sewer network surcharging on the draining capacity of inlets. This goal has been achieved through a 1D/2D coupled hydraulic model of the whole urban drainage system in La Almunia de Doña Godina (Zaragoza, Spain). The model focuses on the interaction between grated drain inlets and the sewer network under partial clogging conditions. The model is fed with data obtained on field surveys. These surveys identified 948 inlets, classified into 43 types based on geometry and grouped into 7 categories for modelling purposes. Clogging patterns were derived from field observations or estimated using progressive clogging trends. The hydrological model combines a semi-distributed approach for micro-catchments (buildings and courtyards) and a distributed “rain-on-grid” approach for public spaces (streets, squares). The model assesses the impact of inlet clogging on network performance and surface flooding during four rainfall scenarios. Results include inlet interception volumes, flooded surface areas, and flow hydrographs intercepted by single inlets. Specifically, the reduction in intercepted volume ranged from approximately 7% under a mild inlet clogging condition to nearly 50% under severe clogging conditions. Also, the model results show the significant influence of the 2D mesh detail on flood depths. For instance, a mesh with high resolution and break lines representing streets curbs showed a 38% increase in urban areas with flood depths above 1 cm compared to a scenario with a lower-resolution 2D mesh and no curbs. The findings highlight how inlet clogging significantly affects the efficiency of urban drainage systems and increases the surface flood hazard. Further novelties of this work are the extent of the analysis (city scale) and the approach to improve the 2D mesh to assess flood depth.
1. Introduction
Urban flooding caused by intense rainfall, also known as pluvial flooding, has become an increasing concern in many cities due to climate change, land use transformations, and aging drainage infrastructure [1,2,3]. Among the key elements influencing flood risk in urban areas are the surface drainage components—especially grated inlets—that serve as the first point of entry for stormwater into the sewer system [4,5,6]. The efficiency of these inlets can be severely compromised by clogging due to debris, sediment, or vegetation, which limits water drainage and contributes to surface flooding [7,8,9,10,11,12,13].
Recent studies have emphasized the need for accurate hydraulic modelling that accounts for inlet performance under partial blockage conditions [14,15,16]. However, there remains a lack of consensus on how best to represent inlet clogging within numerical models. While some approaches rely on empirical reduction factors [17], others integrate detailed inlet geometries and clogging patterns observed in the field. These differences reflect a broader debate in the modelling community regarding the trade-offs between model complexity and reliability.
In this context, this study aims to assess the impact of grated inlet clogging on urban drainage system performance and pluvial flooding using a detailed 1D/2D (one-dimensional sewer flow model/two-dimensional overland flow model) coupled hydraulic model that covers the full extent of a town. The main challenges of the work were to represent the inlet network in detail at the city scale and to avoid the effect of sewer network surcharging on the draining capacity of inlets due to the reduced capacity of sewer pipes.
The findings underline the critical role of inlet condition in the response and the performance of the sewer network and the overland flood hazard assessment.
The drainage system studied is located in La Almunia de Doña Godina, a town of almost 8000 inhabitants (2024) in Zaragoza, Spain. The model was developed to examine the performance of grated inlets under varying degrees and patterns of clogging.
The hydraulic model includes the physical infrastructure of the sewer system (including drainage inlets and their connections to the sewers) and simulations of its behaviour under different rainfall scenarios. Infoworks ICM (Integrated Catchment Model) software (version v. 38.1.14) was used for the analysis, enabling interaction between the 1D sewer network and the 2D surface domain. This allows simulation of overland flow when water exits through manholes and inlets, while also accounting for rainfall applied directly to the surface (rain-on-grid approach), enabling detailed representation of the existing urban drainage system.
Various methodologies exist to assess inlet efficiency based on grate geometry, street layout, and flow conditions. In this work, the approach developed by the Flumen Research Institute (Universitat Politècnica de Catalunya), and included in Infoworks ICM, was used to estimate inlet efficiency and its reduction due to clogging. The model’s sensitivity to storm intensity was also assessed by comparing its response to four synthetic rainfall events.
The originality of this work resides in the extent of the analysis (city scale) and the approach to improve the 2D mesh to assess flood depth.
2. Materials and Methods
2.1. Hydraulic Model
Comprehensive physical data related to the sewer system—manholes, pipes, weirs, and pumps from both the primary and secondary networks—were supplied by FACSA (Zaragoza, Spain), the utility company responsible for managing La Almunia de Doña Godina’s sewer infrastructure. These datasets were verified and incorporated into the hydraulic model. The final network consists of 1869 nodes, 1879 pipes, and 2 pumping stations. Pipe diameters range from 100 mm to 2700 mm, with a total network length of 45.9 km. The pipes are constructed primarily from concrete and PVC. The general view of the system is shown in Figure 1.
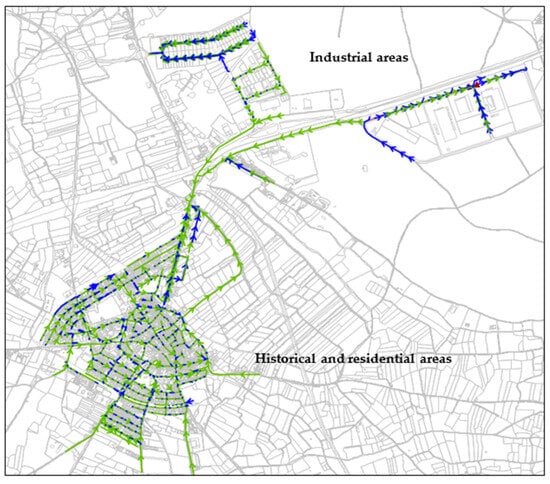
Figure 1.
Overview of the sewer network. Total area is 97.6 ha. The system comprises an urban area with historic and residential zones and two industrial sectors located at the north-west part of the study area. Blue indicates storm water system and green indicates combined system. The arrows represent pipe slope/direction of flow.
In this study, a coupled 1D/2D hydraulic model was developed, where the underground drainage system is represented using a one-dimensional flow model and surface runoff is simulated through a two-dimensional model that accurately captures the topography of the urban environment. This dual approach is essential for realistic simulation of complex surface flow dynamics in urban areas.
A hybrid methodology was employed for rainfall–runoff modelling. A semi-distributed model was used for micro-catchments such as buildings and courtyards, which are typically connected directly to the sewer system. For the broader urban surface—including streets, sidewalks and squares—a fully distributed “rain-on-grid” approach was applied, generating flow directly within the 2D mesh. In the model, buildings and courtyards were treated as voids, and a digital terrain model (DTM) was used to generate an unstructured mesh over the remaining surface.
Thiessen polygons were used to partition the subcatchments, with each subcatchment enclosing only one node [18]. The model of the drainage system under study resulted in 526 subcatchments. An extract representation of the subcatchments in the residential area is shown below (Figure 2).
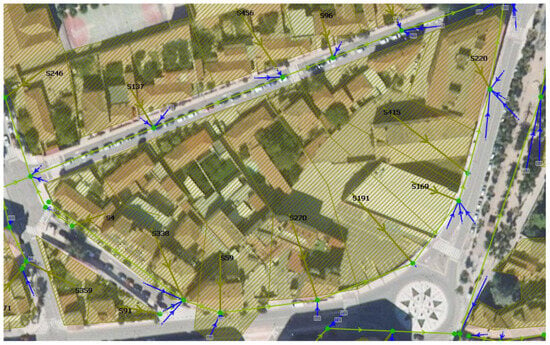
Figure 2.
Extract of subcatchments in the residential area (light brown hatched polygons) and the connections to the nearest manhole (green nodes). Light brown arrows represent the connexion of subcatchments to manholes and blue arrows represent the connexions of inlets to manholes.
For each subcatchment, three runoff surface types were considered: (1) pervious surfaces, (2) impervious surfaces with retention capacity, and (3) impervious surfaces without retention. This classification reflects different surface materials and behaviours, such as the compacted soils found in green areas and hard pavements, such as asphalt and concrete streets and sidewalks. The characteristics of the runoff surfaces introduced in the model are presented on Table 1. These values were used by the FACSA company for the 1D sewer model used to elaborate the first drainage master plan of the town in 2018.

Table 1.
Subcatchments’ runoff surface types.
Runoff was simulated using a non-linear reservoir approach based on the SWMM routing model [19]. The runoff response in each zone depends on factors such as roughness, area, slope, and width of the subcatchment.
Infiltration of pervious or semi-pervious surfaces has been directly modelled using the Horton equation, through Equation (1), expressing cumulative infiltration:
where
f0 = initial infiltration rate (mm/h)
fc = final (limiting) infiltration rate (mm/h)
k = coefficient of the exponential term (1/h)
t = time (h)
HortonSWMM uses the method implemented in the SWMM (Storm Water Management Model developed for the U.S. Environment Protection Agency). Instead of updating soil moisture storage, these versions of the Horton equation find the point on the infiltration curve by comparing actual cumulative infiltration with Equation (1). The values in Table 2 are mandatory to run the model. Also, these values were used within the 1D sewer model used to elaborate the first drainage master plan of La Almunia.

Table 2.
HortonSWMM values in Infoworks.
To finalise the configuration, land uses have been assigned to the subcatchments to represent the different types of surfaces (streets, sidewalks, parks, green areas, etc.). As the buildings and roofs were treated as voids, they were not included in the land use distribution within the subcatchment. Table 3 presents the distribution of land uses as a percentage of area of the three surface types shown in Table 1.

Table 3.
Distribution of land uses assigned to subcatchments.
Regarding the terrain, impermeable surfaces (streets, sidewalks, parking lots) and permeable surfaces (green areas and parks) are treated in the model as a 2D zone. The 2D zone is represented as a polygon that contains the urbanised area served by the sewer network and where the subcatchments are contained.
A 2D mesh has been created inside the perimeter of the 2D zone by means of a DTM with a resolution of 2.0 × 2.0 m. The source of the data is the Spanish National Geographic Information Centre (CNIG).
As previously mentioned, the model considers that the rainfall over the buildings is collected and introduced directly into the pipes through the manholes. In terms of 2D mesh generation, this means the polygons representing the buildings are treated as voids (Figure 3). On the other hand, rainfall is applied directly on the 2D zone (2D mesh), and runoff generated by rainfall and spills from the network is circulated within the 2D zone formed by streets, sidewalks, and squares.
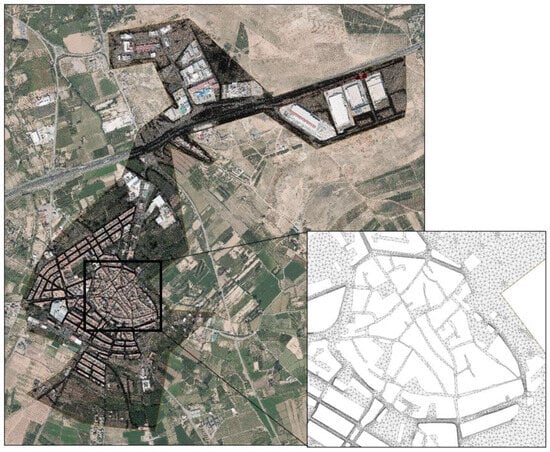
Figure 3.
The 2D zone and detail of voids representing buildings on the 2D mesh.
2.2. Rainfall Scenarios
To assess the impact of inlet clogging on the ability to capture surface runoff and transfer it to the sewer system, the authors selected rainfall scenarios that were moderate in intensity. This ensured that the sewer network could handle the flows without significant overflow through the manholes.
Based on this criterion, four synthetic rainfall events were simulated in the model. The first was a hyetograph corresponding to a 2-year return period (T2), generated using the alternate block method (Figure 4). The other three events had fixed durations of 20 min, with constant rainfall intensities of 25 mm/h (matching the T2 value from the Intensity–Duration–Frequency (IDF) curve), 20 mm/h, and 10 mm/h.
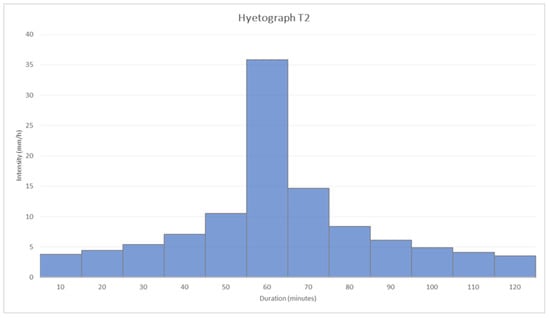
Figure 4.
Hyetograph of synthetic rainfall event: return period of 2 years; 120 min of duration; resolution of 10 min, and 18.15 mm of total volume.
Considering the sewer network under study presents reduced pipe sections (76% of the network has a pipe size between 200 and 400 mm), the rainfall intensities selected were deliberately medium and low to avoid the effect of sewer network surcharging on the draining performance of inlets. The aim of the analysis was that the runoff generated could be conveyed by the network, minimizing pipe and manhole surcharging. Furthermore, data about real extreme rainfall events with good temporal resolution (time-steps) are not available, so synthetic events were used for the simulations.
It is worth mentioning that the hydrological parameters (rainfall, roughness coefficients, Horton values) applied to build the hydraulic model for this analysis were obtained from the model previously developed for the Drainage Master Plan of the town of La Almunia de Doña Godina by FACSA (Zaragoza, Spain).
Model validation was conducted through expert knowledge provided by local professionals from FACSA, given the unavailability of sensor data and historical records to perform rigorous calibration.
The outputs of the model were used to perform a sensitivity analysis of inlet clogging patterns. It was not the objective of this work to assess the capacity of the sewers or network design, or to perform a comprehensive flood risk analysis.
2.3. Drain Inlet Characteristics
After validating and successfully running the model, the inlets were integrated into the drainage network and linked to the closest manholes. To maintain numerical model stability, no more than three inlets were connected to a single manhole (Figure 5). In Infoworks ICM, each inlet was assigned the node type “Inlet 2D”, allowing for the bidirectional exchange of flow between the sewer system and the 2D surface domain. Ground elevations for the inlets were derived automatically from the digital terrain model (DTM).
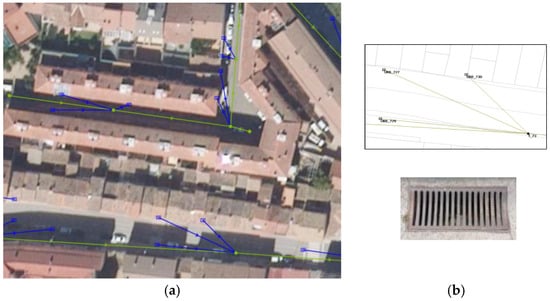
Figure 5.
Partial view of sewer network with drain inlets (a); detail of inlets connections to a manhole and type of inlet grate (b). The arrows represent pipe slope/direction of flow.
To assess the hydraulic performance of the inlets and evaluate the influence of partial clogging, the inlets were classified as “UPC grates” within the software. This setting enables the use of a method developed by the Flumen Research Institute at the Technical University of Catalonia (UPC), which estimates the efficiency of grated inlets according to grate type, street geometry, and flow conditions [20,21].
Infoworks ICM requires several input parameters to calculate the flow intercepted by each inlet, including street slope and width, total dimensions of the grate (length and width), number and orientation of bars (transversal, longitudinal, diagonal), minimum area containing voids, and total void area.
Field surveys identified a total of 948 inlets in the town, which were categorized into 43 distinct types [22]. For modelling purposes, these were consolidated into 7 groups based on geometry and grate design.
The 7 types of grates and their characteristics are shown in Figure 6.
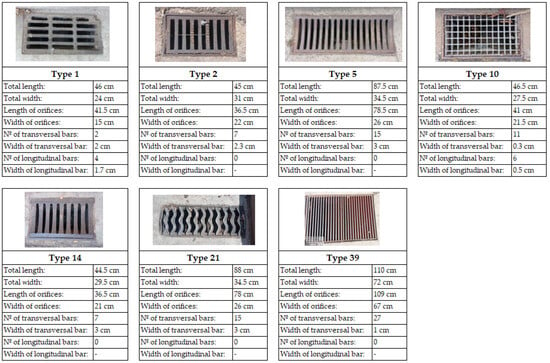
Figure 6.
Inlet types introduced in the model and their geometric characteristics.
2.4. Hydraulic Efficiency and Clogging Patterns of Inlets
The approach for assessing the efficiency of a grated inlet was introduced by Gómez and Russo (2011) [20] and later expanded to account for partially clogged grates. Specifically, inlet efficiency—described as the ratio of the flow captured by the inlet to the total approaching flow—is determined using the following formula:
where
Q = flow rate (l/s) approaching the inlet
y = the water depth (mm) immediately upstream the inlet
A, B = adjustment coefficients specific to each inlet in its different degrees of clogging
Parameters A and B can be obtained experimentally or from the grate geometry according to the following expressions:
where
Ag = smallest rectangular area (in m2) that includes grate orifices
p = proportion (in %) of open surface relative to the total grate area
L = length (in cm) of the rectangle containing the orifices
W = width (in cm) of the rectangle containing the orifices
nt, nl, and nd = number of transverse, longitudinal, and diagonal bars, respectively.
As said, the previous coefficients A and B can be estimated for partially clogged inlets through Equations (3) and (4), adapting the required geometric parameters to the clogging patterns.
For this study, five observed patterns were considered. Table 4 presents the classification of these patterns and the number of cases observed in the field.

Table 4.
Ranges of clogging patterns considered.
Clogging patterns were obtained from field observations [23] or estimated using progressive clogging trends in case a pattern range was not observed for a specific grate.
The C0 pattern represents a ‘clean’ inlet grate. As said, to simulate varying degrees of clogging (C1, C2, and C3), parameters A and B are adjusted based on the geometry of each grate and the clogging patterns observed across the seven inlet types. C4 was disregarded after a sensitivity analysis—as will be discussed later in this article—because of the low occurrence in field observations. An example of the physical representation of these patterns is shown in Figure 7.

Figure 7.
Clogging patterns for inlet grate Type 2.
3. Results
3.1. Impact on Efficiency of Drain Inlets
The reduction in the available void areas of inlets clearly leads to a decrease in hydraulic efficiency, which is calculated with Equation (2) and plotted below for the seven grated inlet types (Figure 8).
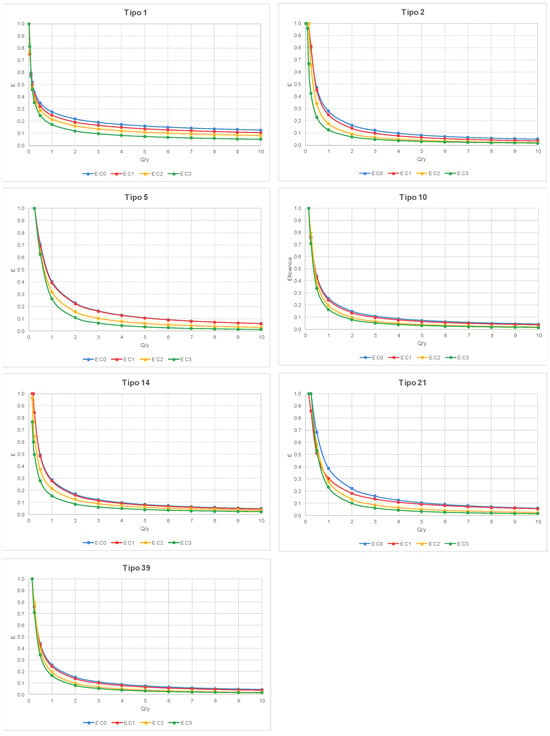
Figure 8.
Hydraulic efficiency of inlets according to Equation (2) for 4 clogging patterns.
Also, the values of parameters A and B resulting from applying Equations (3) and (4) are presented in Table 5.

Table 5.
A and B values for all grate types and clogging patterns: C0, C1, C2, and C3.
Clogging pattern C4 (>80% of clogged void area) was discarded because the rectangular area that includes the voids (Ag) is too small and parameters A and B could not be easily deduced. Furthermore, their values were out of the range of validity of the equations that were previously experimentally validated, and the occurrence of this pattern in the field was only 1%, so the impact on the overall results can be disregarded.
3.2. Impact on Runoff Volume Drainage
The output from the model indicates a significant decrease in the amount of runoff drained by the inlets as the clogging coefficients increase. Table 6 presents the runoff volumes entering the sewer system through the inlets according to the degree of clogging (C0, C1, C2, and C3).

Table 6.
Volume (in m3) collected by drain inlets from the 2D zone for four rainfall events and four clogging patterns. The values in parenthesis represent the reduction in volume with respect to the previous clogging pattern (in %).
The values are graphed below (Figure 9), where it is possible to observe the relevant impact of inlet clogging on surface runoff drainage (with reduction up to 50% for the clogging pattern C3 and the rainfall scenario T2).
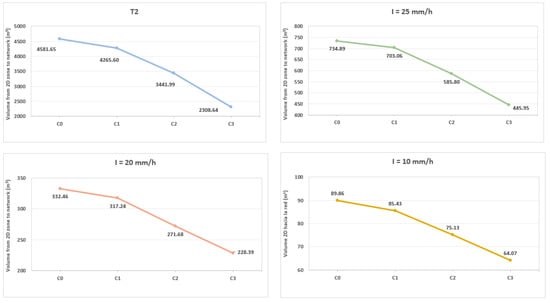
Figure 9.
Runoff volume from 2D zone drained by inlets for four rainfall events and ranges of inlet clogging.
3.3. Flood Depths in the 2D Zone
The model allows for the analysis of the distribution and extent of water depths across a two-dimensional (2D) computational mesh and the impact of inlet clogging on surface runoff dynamics. The mesh represented the study area with sufficient spatial resolution to capture local variations in water accumulation. For each combination of rainfall intensity and clogging coefficient used to simulate varying degrees of inlet obstruction—the simulation results were examined to identify and visualize regions where the surface water depths exceeded 1 cm. These areas, indicative of localized flooding or inefficient drainage, were extracted and displayed using thematic maps, enabling a clear spatial comparison across different clogging scenarios.
To provide a concrete visual representation of these effects, Figure 10 focuses on a representative street segment within the study area. In this figure, it is possible to observe how the extent of surface flooding increases progressively as the level of inlet clogging intensifies. The increase in the number of 2D mesh cells showing water depths above the threshold of 1 cm clearly demonstrates the reduced capacity of the drainage system to evacuate surface water under obstructed conditions.

Figure 10.
Increase in flood extend with inlet clogging patterns C1, C2, and C3. Mesh elements in blue represent flood depth above 1 cm for clogging scenario C1; orange and brown represent the increasing of flood extent (mesh elements) for clogging scenarios C2 and C3, respectively.
The comprehensive analysis of the study area shows a minor effect of inlet clogging on flood extensions (considering a minimum flood depth value of 1 cm). Expressed in flooded area, for the storm with a return period of 2 years, the total areas of the surface with flood depths above 1 cm are 11,01, 11,03, 11,12, and 11,21 ha for clogging patterns C0, C1, C2, and C3, respectively.
3.4. Discharge Hydrogram
An illustrative method for representing the reduction in the drainage capacity of stormwater inlets under varying degrees of clogging is through the comparative analysis of discharge hydrographs introduced into the sewer systems by the inlets. These hydrographs, which display the temporal evolution of the outflow through a drainage inlet during a rainfall event, allow for a direct and quantitative assessment of how inlet performance deteriorates as clogging becomes more severe. By comparing the hydrographs corresponding to different clogging coefficients—ranging from fully functional to partially or heavily obstructed—it is possible to clearly visualize the overall reduction in total volume drained and the diminished responsiveness of the system.
For the purposes of this study, a representative inlet within the urban drainage network was selected to serve as a case example. This inlet was chosen based on its location, hydraulic significance, and sensitivity to surface runoff dynamics. The resulting discharge hydrographs for the various clogging scenarios are presented in Figure 11. The figure illustrates the progressive decline in discharge capacity, highlighting how increased obstruction leads to lower peak discharges.
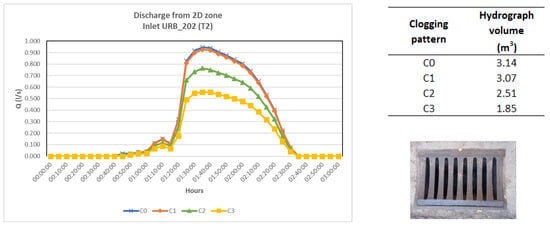
Figure 11.
Discharge hydrograph for inlet URB_202 (grate type 14); rainfall with return period (T) of 2 years; clogging patterns C0, C1, C2, C3.
3.5. Effects of the 2D Mesh Refinement
The results indicate a relevant effect of inlet clogging on runoff volume introduced into the sewer system. This value is strongly influenced by the inlet clogging degree. Nevertheless, the impact of inlet clogging is not so evident in terms of surface flood extension and flood depth, which are key parameters in the field of pluvial hazard assessment.
Considering the rather low response of the 2D model regarding flood depths, further simulations were carried out considering a more detailed 2D mesh to assess the sensitivity of the model with respect to the meshing characteristics. With this purpose, the new surface model considered the use of break lines to generate the 2D mesh to enforce mesh element edges along these lines. In this case, the aim was to concentrate the stormwater flow to the street’s boundaries (curbs), which better represents the dynamics of street runoff. Break lines are fully permeable features.
Additionally, while in the first set of simulations a minimum area for the mesh elements was fixed to 25 m2, the second round of simulations considered a minimum area for the mesh element of 5 m2 (average street width) in an attempt to achieve a more realistic simulation of gutter flow. In both cases, mesh elements with a size less than the minimum area specified are aggregated with adjoining mesh zone elements until the minimum area is met. This is done for the purpose of calculating results and to improve simulation stability and run time.
Figure 12 shows a comparison of the 2D mesh before and after the model improvements.
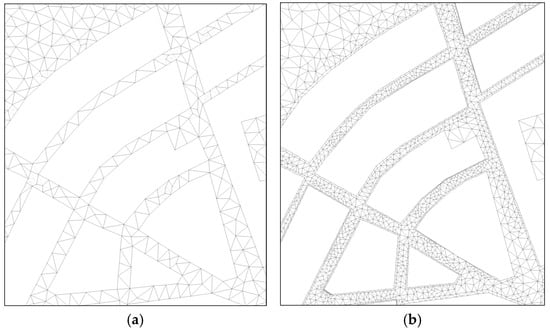
Figure 12.
Detail of the 2D mesh without break lines and minimum element size of 25 m2 (a); detail of the 2D mesh with break lines and minimum element size of 5 m2 (b).
The results of the simulations with the detailed 2D mesh and the same clogging and rainfall scenarios show the greater influence of the more detailed 2D mesh on the runoff volume from the 2D zone to the network.
Figure 13 shows the plotted values for all rainfall events with break lines and without break lines. As expected, in all cases, volumes are higher on the more detailed mesh, as the runoff is more confined to the street limits.
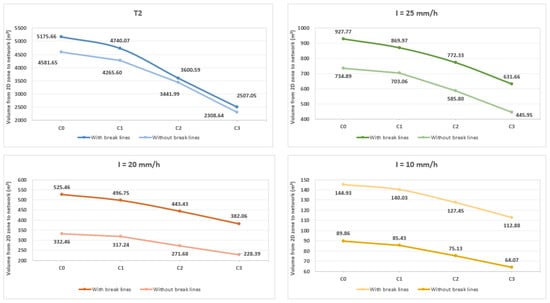
Figure 13.
Plotted values of total volume from the 2D zone to the network for all rainfall events—comparison of the refined 2D mesh with break lines and initial 2D mesh without break lines.
The values of the previous graphs are shown in Table 7.

Table 7.
Volume (in m3) collected by drain inlets from the 2D zone for four rainfall events and four clogging patterns (improved 2D mesh). The values in parenthesis represent the reduction of volume with respect to the previous clogging pattern (in %).
Comparatively, the increase in volume captured from the 2D zone to the network for the two models was especially significant for lower rainfall intensities (Table 8).

Table 8.
Increase in volume captured from the 2D zone to the network for all rainfall events and clogging patterns (in %) due to the 2D mesh tuning.
Concerning flood extension and flow depth maps, the results of the new simulations indicate the major sensitivity of clogging with respect to these parameters. For example, for rainfall with an intensity of 10 mm/h, the flooded area with > 1cm flood depth went from 2.88 ha to 3.99 ha (38% increase) (Table 9).

Table 9.
Increase in urban area (in ha) with a flood depth above 1 cm for all rainfall events and clogging patterns for a 2D mesh with break lines and without break lines.
A further analysis on flood extension and depth can be conducted by increasing the resolution of the DTM, which will impact the 2D mesh generation and possibly improve the representation of street geometry. This task was not performed in the present work.
4. Conclusions
In this study, the authors developed a coupled 1D/2D hydraulic model using Infoworks ICM software (version 38.1.14) to simulate and assess the effects of inlet clogging on an existing urban drainage system. The model integrates a detailed representation of both the subsurface (1D) drainage infrastructure and the surface (2D) flow dynamics, allowing for a comprehensive analysis of interactions between inlet capacity, runoff volumes, and surface urban flood during rainfall events.
In general, this case study, including the whole sewer network of a town, offers tangible insights into how even a partial blockage of drainage inlets can lead to significant changes in terms of the hydraulic response of an urban drainage system.
One of the key findings of the study is the high sensitivity of the volume of surface runoff intercepted by the inlet system to varying degrees of clogging. For a rainfall event with a return period of two years (T2), the volume of runoff successfully captured by the drainage inlets decreased significantly as clogging increased. Specifically, the reduction in intercepted volume ranged from approximately 7% under a mild clogging condition (represented by clogging coefficient C1) to nearly 50% under severe clogging (C3). These results underscore the substantial impact that inlet maintenance and obstruction can have on the hydraulic performance of urban drainage systems.
To evaluate the implications of inlet clogging on surface flooding, water depths at street level were simulated using the 2D component of the model. These results were visualized on thematic maps based on a computational mesh that represents the urbanised area. The spatial distribution of surface water depths was analysed for each clogging scenario. Interestingly, the study revealed the relatively limited influence of inlet clogging on the extent and severity of water accumulation at the surface. Specifically, the number of mesh cells exhibiting water depths greater than 1 cm did not show a significant increase across the different clogging conditions. This suggests that, at the scale and resolution used in this study, the overall flood hazard at street level may not be strongly affected by inlet clogging alone.
However, the authors acknowledge that the model resolution limits the accuracy of flood hazard representation. Therefore, they implemented further refinement of the 2D mesh, particularly in areas surrounding grated inlets. Enhancing the mesh with increased resolution and the inclusion of break lines—such as those following street curbs and gutters—improved the model’s ability to capture detailed flow patterns and more accurately delineate flood extents along urban streets. These refinements resulted in an increased volume captured from the 2D zone to the network, with an increase of up to 13% with respect to the mesh with less detail for the rainfall event with a return period of 2 years. For rainfall events with lower intensity and total volume, the increase in volume reached 76%. This indicates that detailed surface meshes and DTMs have crucial roles in urban flood 1D/2D coupled models for producing more realistic hazard maps and informing urban flood risk mitigation strategies. For further studies, a refinement of the DTM can be explored to assess its effect on flood depth and extension.
Finally, a comparative analysis of discharge hydrographs provided additional insight into the hydraulic consequences of inlet clogging. The hydrographs clearly demonstrated a progressive reduction in drained runoff volume with increasing clogging coefficients. This evidence reinforces the need for proactive inlet maintenance programs and highlights the importance of integrating clogging scenarios into urban flood modelling to support more resilient stormwater management practices. With respect to operational guidance for inlet maintenance, this work indicates that major efforts should be focused in areas where inlets present higher clogging patterns with a significant or non-negligible frequency (i.e., C1 with a clogged area from 10% to 25% and a frequency of 17% or C2 with a clogged area from 25% to 60% and a frequency of 4%).
Author Contributions
Conceptualization, B.R. and V.B.; methodology, B.R., A.A. and V.B.; software, V.B.; validation, B.R., V.B. and P.L.L.-J.; formal analysis, A.A.; investigation, P.L.L.-J. and V.B.; resources, B.R.; data curation, A.A.; writing—original draft preparation, V.B.; writing—review and editing, B.R.; visualization, V.B.; supervision, B.R.; project administration, B.R.; funding acquisition, B.R. All authors have read and agreed to the published version of the manuscript.
Funding
This research was funded by the Agencia Estatal de Investigación (AEI) of the Spanish Ministry of Science and Innovation through the national research project TED2021-132098B-C22 (“Better understanding of stormwater interception and clogging dynamics of surface drainage systems”, CLOGGING—INLETS), within the call for projects focused on the ecological transition and the digital transition of the State Plan for Scientific, Technical, and Innovation Research 2021–2023.
Data Availability Statement
Results are available for other researchers. Physical data concerning the model and the sewer networks cannot be shared due to previous agreement with the company managing the network in the selected case study.
Acknowledgments
The authors acknowledge the company FACSA (Sociedad de Fomento Agrícola Castellonense, S.A.) for providing the topographic information of the network that was used to build the model.
Conflicts of Interest
The authors declare no conflicts of interest. This article is a revised and expanded version of a paper entitled Effect of clogging inlet phenomenon on pluvial flood in urban areas, which was accepted to be presented at the 46th Italian Conference on Integrated River Basin Management (ICIRBM—2025).
Correction Statement
This article has been republished with a minor correction to the Data Availability Statement. This change does not affect the scientific content of the article.
Abbreviations
The following abbreviations are used in this manuscript:
| DTM | Digital Terrain Model |
| GIS | Geographic Information System |
| ICM | Integrated Catchment Model |
| 1D/2D | One Dimensional/Two Dimensional |
| T2 | Return Period of 2 Years |
| SWMM | Storm Water Management Model |
| CNIG | National Geographic Information Center |
| IDF | Intensity–Duration–Frequency |
References
- Russo, B.; Gómez, M.; Macchione, M. Pedestrian hazard criteria for flooded urban areas. Nat. Hazards 2013, 69, 251–265. [Google Scholar] [CrossRef]
- Cea, L.; Costabile, P. Flood Risk in Urban Areas: Modelling, Management and Adaptation to Climate Change. A Review. Hydrology 2022, 9, 50. [Google Scholar] [CrossRef]
- Martínez-Gomariz, E.; Locatelli, L.; Guerrero, M.; Russo, B.; Martínez, M. Socio-Economic Potential Impacts Due to Urban Pluvial Floods in Badalona (Spain) in a Context of Climate Change. Water 2019, 11, 2658. [Google Scholar] [CrossRef]
- Palla, A.; Colli, M.; Candela, A.; Aronica, G.T.; Lanza, L.G. Pluvial flooding in urban areas: The role of surface drainage efficiency. J. Flood Risk Manag. 2018, 11, S663–S676. [Google Scholar] [CrossRef]
- Russo, B.; Valentín, M.G.; Tellez-Álvarez, J. The Relevance of Grated Inlets within Surface Drainage Systems in the Field of Urban Flood Resilience. A Review of Several Experimental and Numerical Simulation Approaches. Sustainability 2021, 13, 7189. [Google Scholar] [CrossRef]
- Ucler, N.; Kibar, A. Numerical Investigation of Hydraulic Efficiency of the Grate Inlet. J. Irrig. Drain. Eng. 2023, 149, 8. [Google Scholar] [CrossRef]
- Gómez, M.; Parés, J.; Russo, B.; Martínez, E. Methodology to quantify clogging coefficients for grated inlets. Application to SANT MARTI catchment (Barcelona). J. Flood Risk Manag. 2019, 12, e12479. [Google Scholar] [CrossRef]
- Leitão, J.P.; Simões, N.E.; Pina, R.D.; Ochoa-Rodriguez, S.; Onof, C.; Marques, A.S. Stochastic evaluation of the impact of sewer inlets’ hydraulic capacity on urban pluvial flooding. Stoch. Environ. Res. Risk Assess. 2017, 31, 1907–1922. [Google Scholar] [CrossRef]
- Guo, C.Y.J.; MacKenzie, K. Hydraulic Efficiency of Grate and Curb-Opening Inlets Under Clogging Effect; University of Colorado Denver and Urban Drainage and Flood Control District: Denver, CO, USA, 2012. [Google Scholar]
- Veerappan, R.; Le, J. Hydraulic efficiency of road drainage inlets for storm drainage system under clogging effect. In Proceedings of the 5th International Conference on Flood Risk Management and Response (FRIAR 2016), Venice, Italy, 29 June–1 July 2016. [Google Scholar]
- Despotovic, J.; Plavsic, J.; Stefanovic, N.; Pavlovic, D. Inefficiency of storm water inlets as a source of urban floods. Water Sci. Technol. 2005, 51, 139–154. [Google Scholar] [CrossRef] [PubMed]
- Wakif, S.A.M.; Sabtu, N. Comparison of Different Methodologies for Determining the Efficiency of Gully Inlets. In Lecture Notes in Civil Engineering; Mohamed Nazri, F., Ed.; Springer: Cham, Switzerland, 2020; Volume 53. [Google Scholar] [CrossRef]
- Hao, X.; Mu, J.; Shi, H. Experimental Study on the Inlet Discharge Capacity under Different Clogging Conditions. Water 2021, 13, 826. [Google Scholar] [CrossRef]
- Russo, B.; Velasco, M.; Locatelli, L.; Sunyer, D.; Yubero, D.; Monjo, R.; Martínez-Gomariz, M.; Forero-Ortiz, E.; Sánchez-Muñoz, D.; Evans, B.; et al. Assessment of Urban Flood Resilience in Barcelona for Current and Future Scenarios. The RESCCUE Project. Sustainability 2020, 12, 5638. [Google Scholar] [CrossRef]
- Wang, X.; Xia, J.; Feng, J.; Dong, B. Numerical modelling of the impact of drainage system clogging on urban flood processes. J. Environ. Manag. 2025, 388, 125969. [Google Scholar] [CrossRef] [PubMed]
- Sanz-Ramos, M.; Sañudo, E.; López-Gómez, D.; García-Feal, O.; Bladé, E.; Cea, L. Evolución de la modelización numérica bidimensional del flujo en lámina libre a través del software Iber. Ing. Del. Agua 2025, 29, 114–131. [Google Scholar] [CrossRef]
- Gómez, M.; Hidalgo, G.; Russo, B. Experimental campaign to determine grated inlet clogging factors in an urban catchment of Barcelona. Urban Water J. 2013, 10, 50–61. [Google Scholar] [CrossRef]
- Dong, Z.; Bain, D.J.; Akcakaya, M.; Ng, C.A. Evaluating the Thiessen polygon approach for efficient parametrization of urban stormwater models. Environ. Sci. Pollut. Res. 2023, 30, 30295–30307. [Google Scholar] [CrossRef] [PubMed]
- Rossman, L.A.; Simon, M.A. Storm Water Management Model User’s Manual Version 5.2; EPA US Environmental Protection Agency, Office of Research and Development: Washington, DC, USA, 2022. Available online: www.epa.gov (accessed on 1 September 2025).
- Gómez, M.; Russo, B. Methodology to estimate hydraulic efficiency of drain inlets. In Proceedings of the Institution of Civil Engineers-Water Management; Thomas Telford Ltd.: London, UK, 2011; Volume 164, pp. 81–90. [Google Scholar] [CrossRef]
- Russo, B.; Gómez, M. Diseño De Sistemas De Sumideros En Medio Urbano; School of Civil Engineering (UPC BarcelonaTech): Barcelona, Spain, 2014. [Google Scholar]
- Russo, B.; Acero, A.; Arvia, M.; Lopez-Julian, P. Estimación de la pérdida de eficiencia hidráulica de imbornales por efecto de la colmatación superficial de sus rejillas. In Dyna Ingeniería e Industria; Dyna Publihers, Ltd.: London, UK, 2025; Volume 100, pp. 30–37, 11440. [Google Scholar] [CrossRef]
- Russo, B.; Beiró, V.; Lopez-Julian, P.L.; Acero, A. Effect of clogging inlet phenomenon on pluvial flood in urban areas. In Proceedings of the 46th Italian Conference on Integrated River Basin Management (ICIRBM—2025), Arcavacata, Italy, 18–19 September 2025. [Google Scholar]
Disclaimer/Publisher’s Note: The statements, opinions and data contained in all publications are solely those of the individual author(s) and contributor(s) and not of MDPI and/or the editor(s). MDPI and/or the editor(s) disclaim responsibility for any injury to people or property resulting from any ideas, methods, instructions or products referred to in the content. |
© 2025 by the authors. Licensee MDPI, Basel, Switzerland. This article is an open access article distributed under the terms and conditions of the Creative Commons Attribution (CC BY) license (https://creativecommons.org/licenses/by/4.0/).