

Hydrogeochemical Characterization and Water Quality Index-Based Evaluation of Groundwater for Drinking, Livestock, and Irrigation Use in the Arid Ewaso Ng’iro–Lagh Dera Basin, Kenya

 and
and
Abstract
1. Introduction
2. Materials and Methods
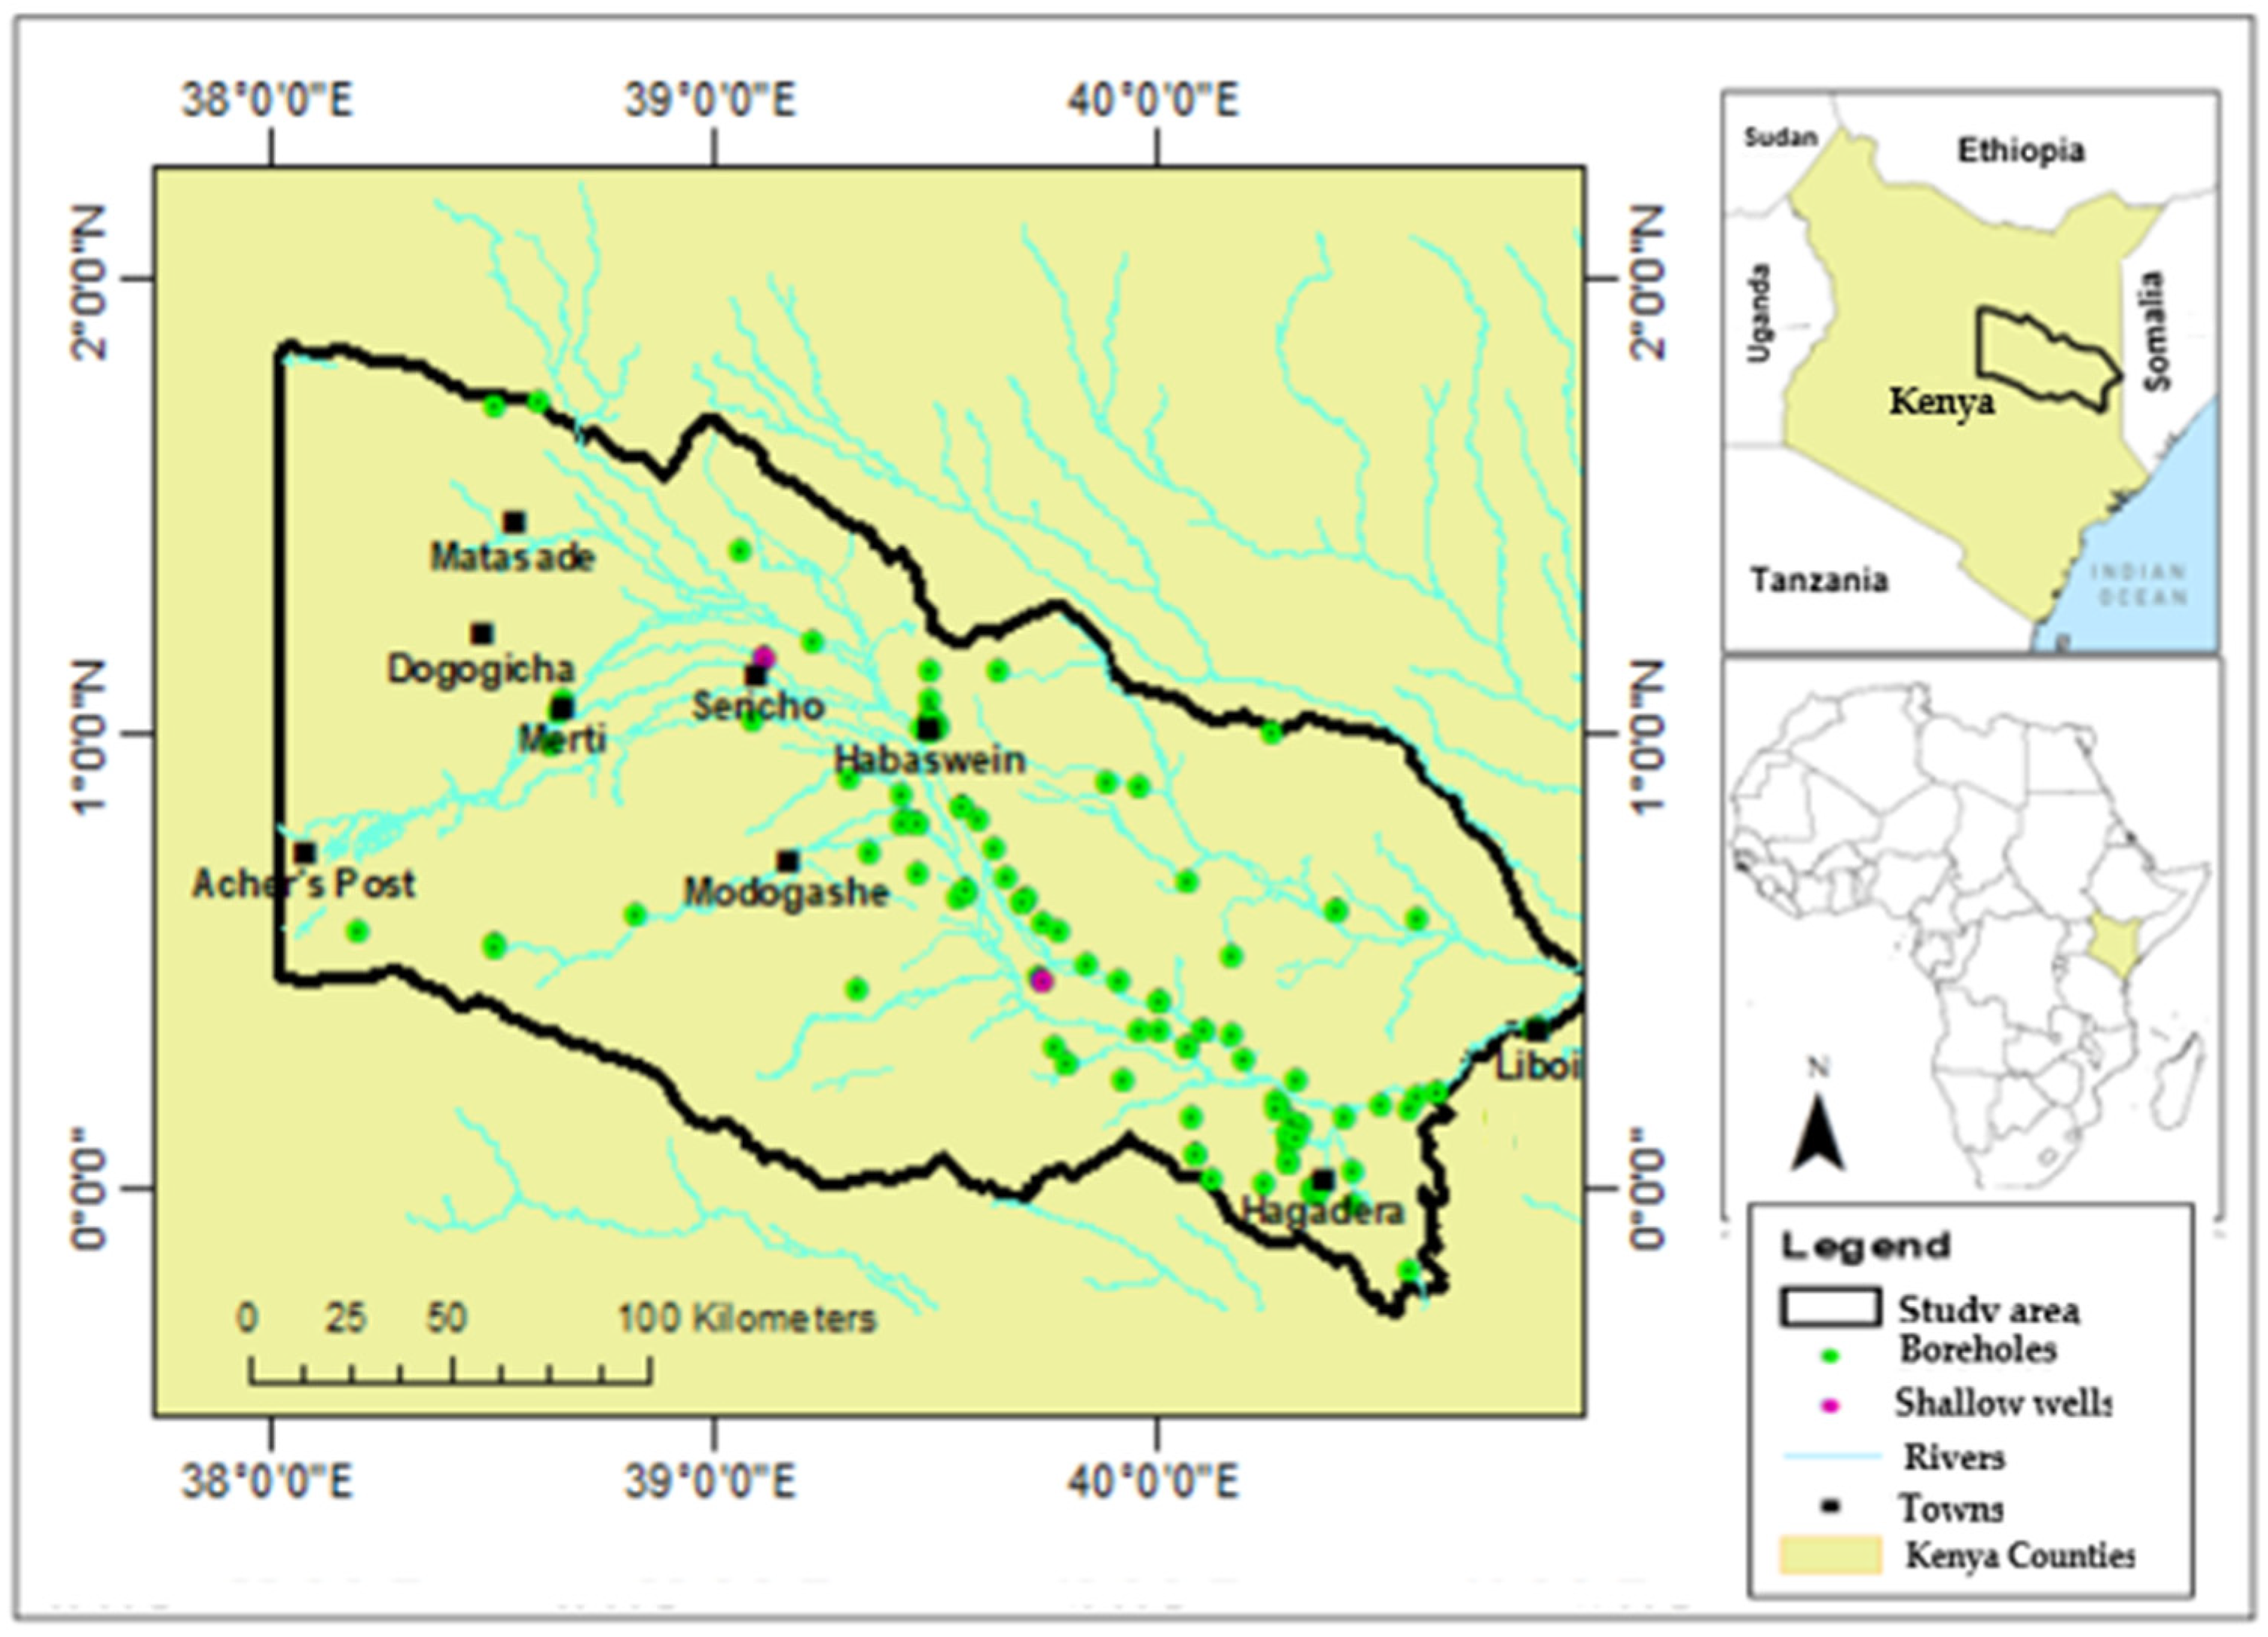
2.1. The Study Area
2.2. Geological and Structural Setting
2.3. Hydrogeology

2.4. Sampling and Analysis
- Selection of the parameters. In this study, all the analysed parameters were used; these are EC, TDS, pH, TH, Na+, Ca2+, Mg2+, K+, HCO3−, Cl−, SO42−, and NO3−;
- Assigning weights to the parameters (Wi). The assigning of the weight took into consideration the influence of the parameter on water quality and the weight rating of the studies carried out in similar settings [95,96]. The weighting ranged from 2 to 5. The highest weight of 5 was awarded TDS, and NO3−. EC, pH, and SO42− were awarded a weight of 4. HCO3− and Cl− were awarded a weight of 3, whereas Na+, Ca2+, Mg2+, K+, and TH were awarded a weight of 2. Relative weights (wi) for the ith parameter and n number of parameters were then calculated using the formulae (Equation (3)).
- 3.
- Calculate the quality rating (Qi) of each of the parameters using the formulae (Equation (4)).
- 4.
- Calculate the overall water quality index using Equation (5).
3. Results
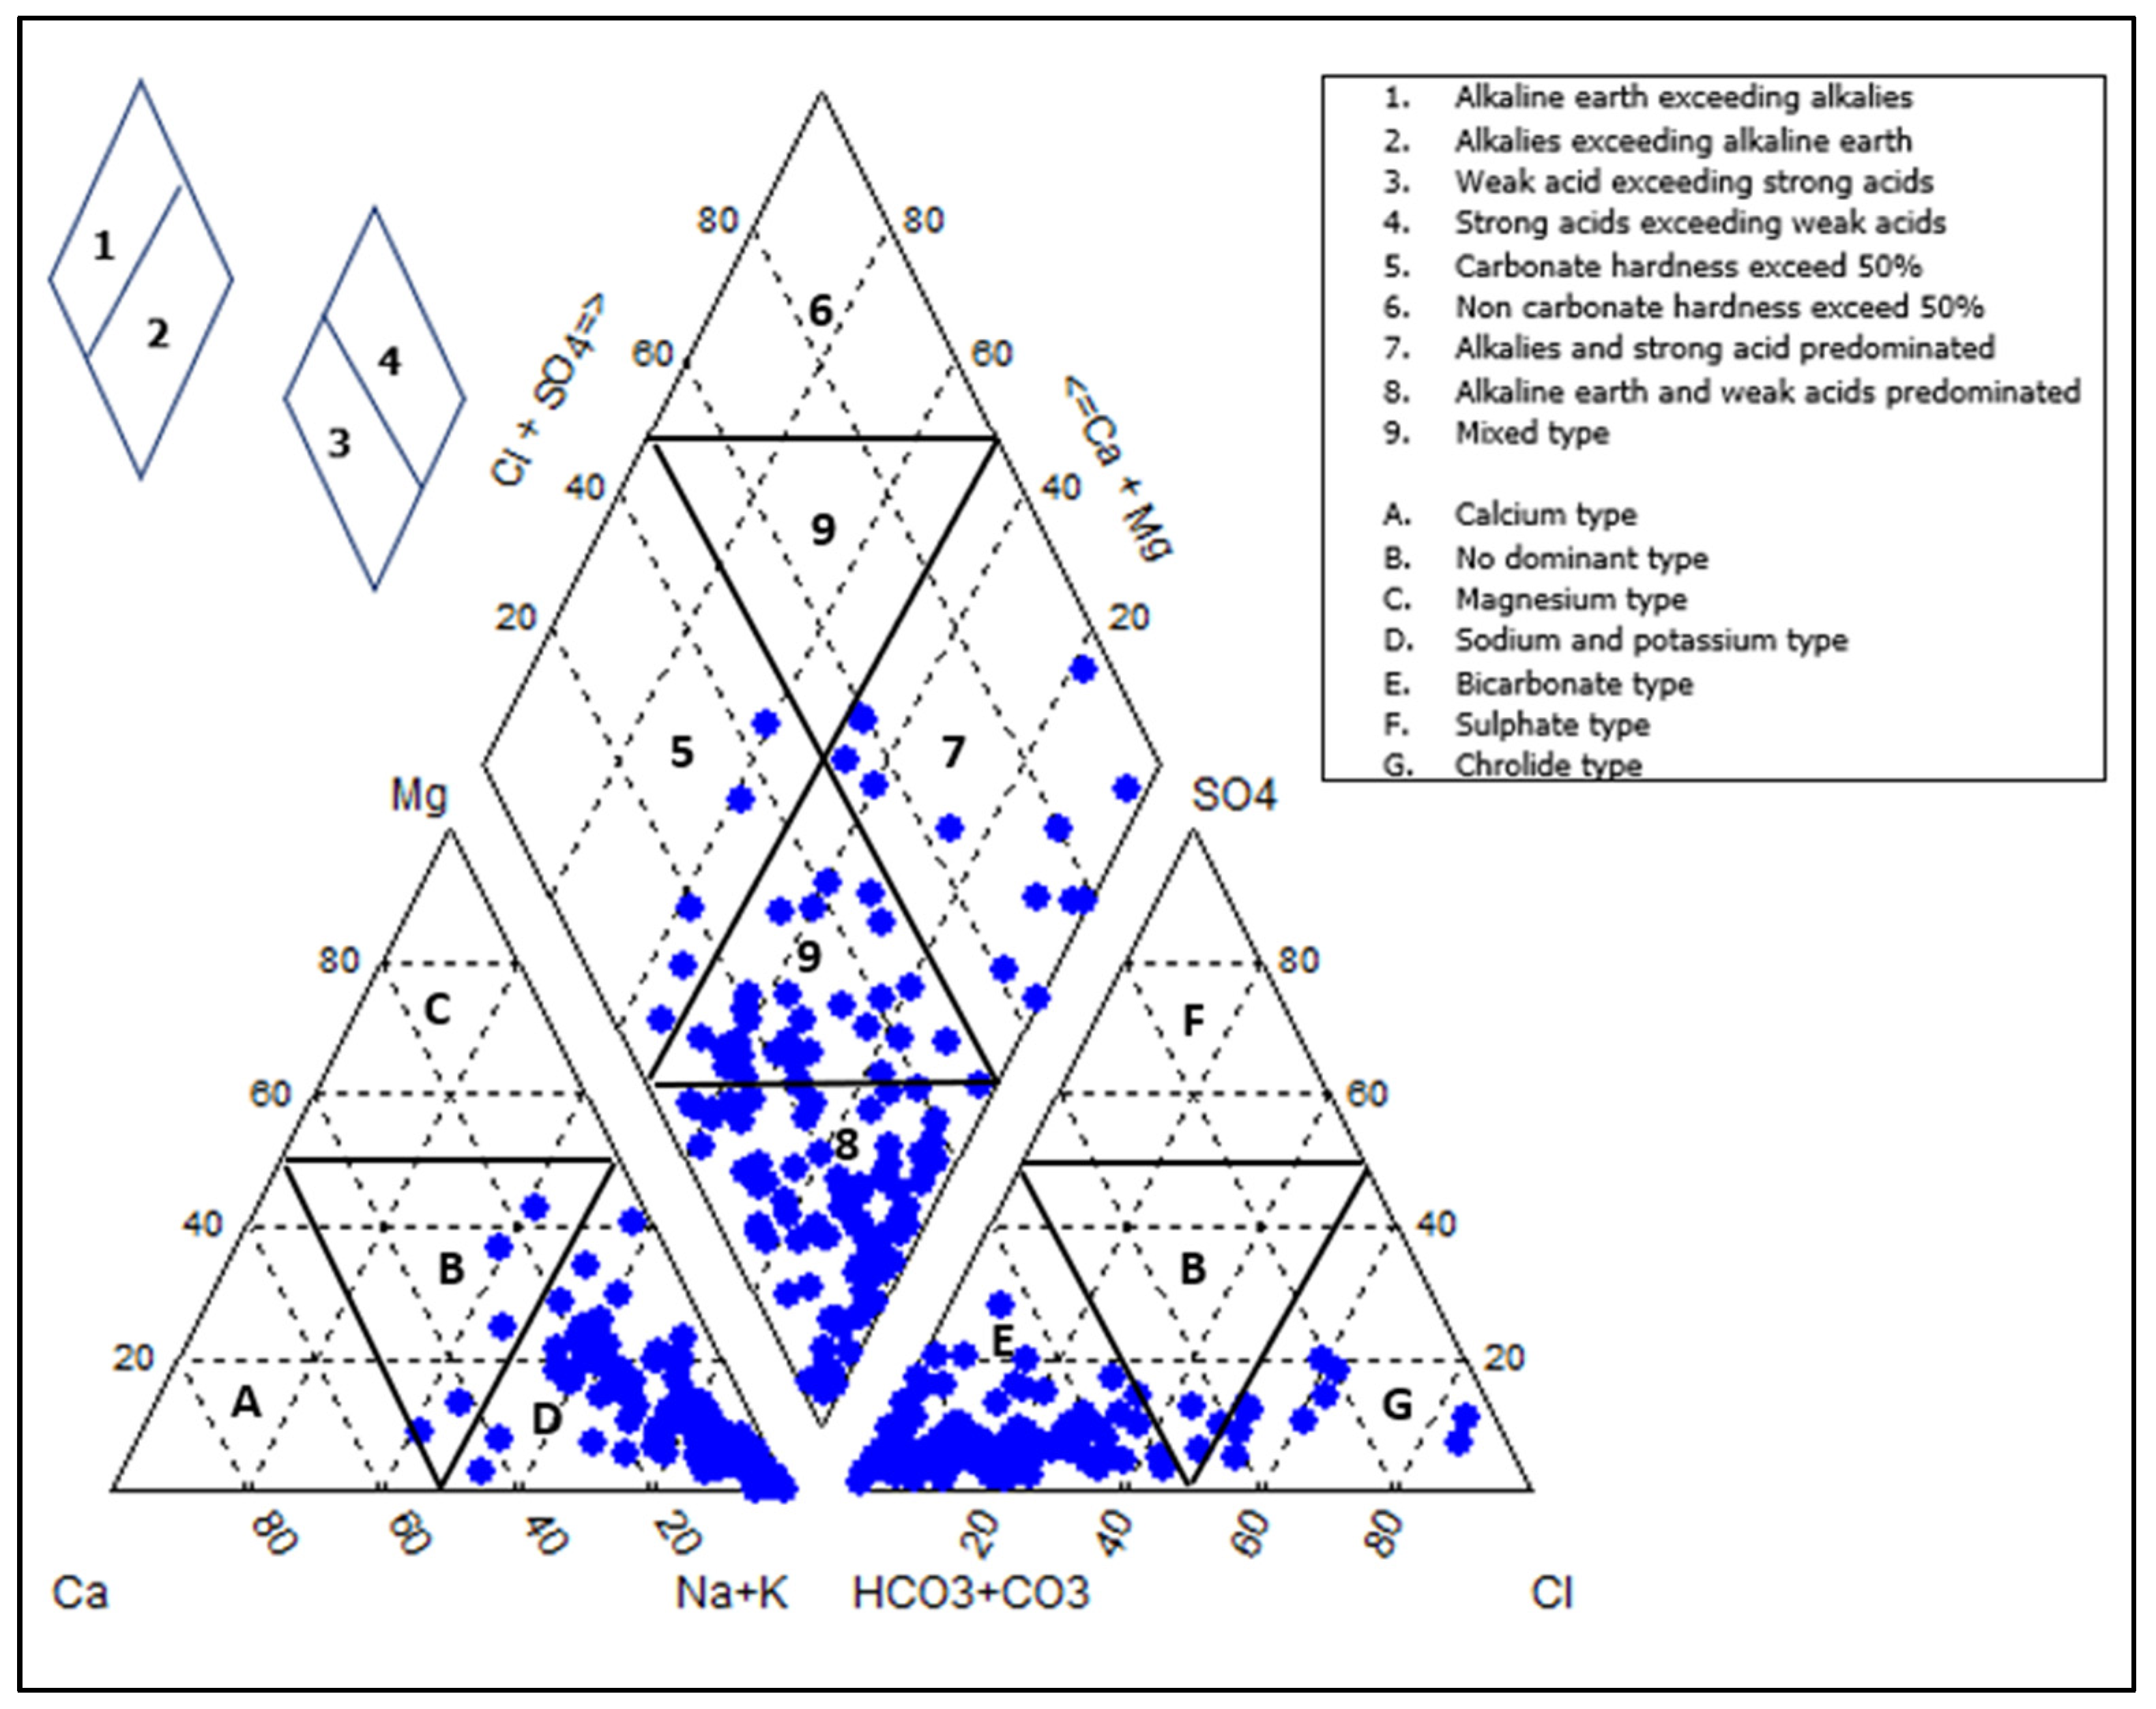
3.1. Evaluation of Geochemistry
3.2. Processes Controlling the Groundwater Chemistry
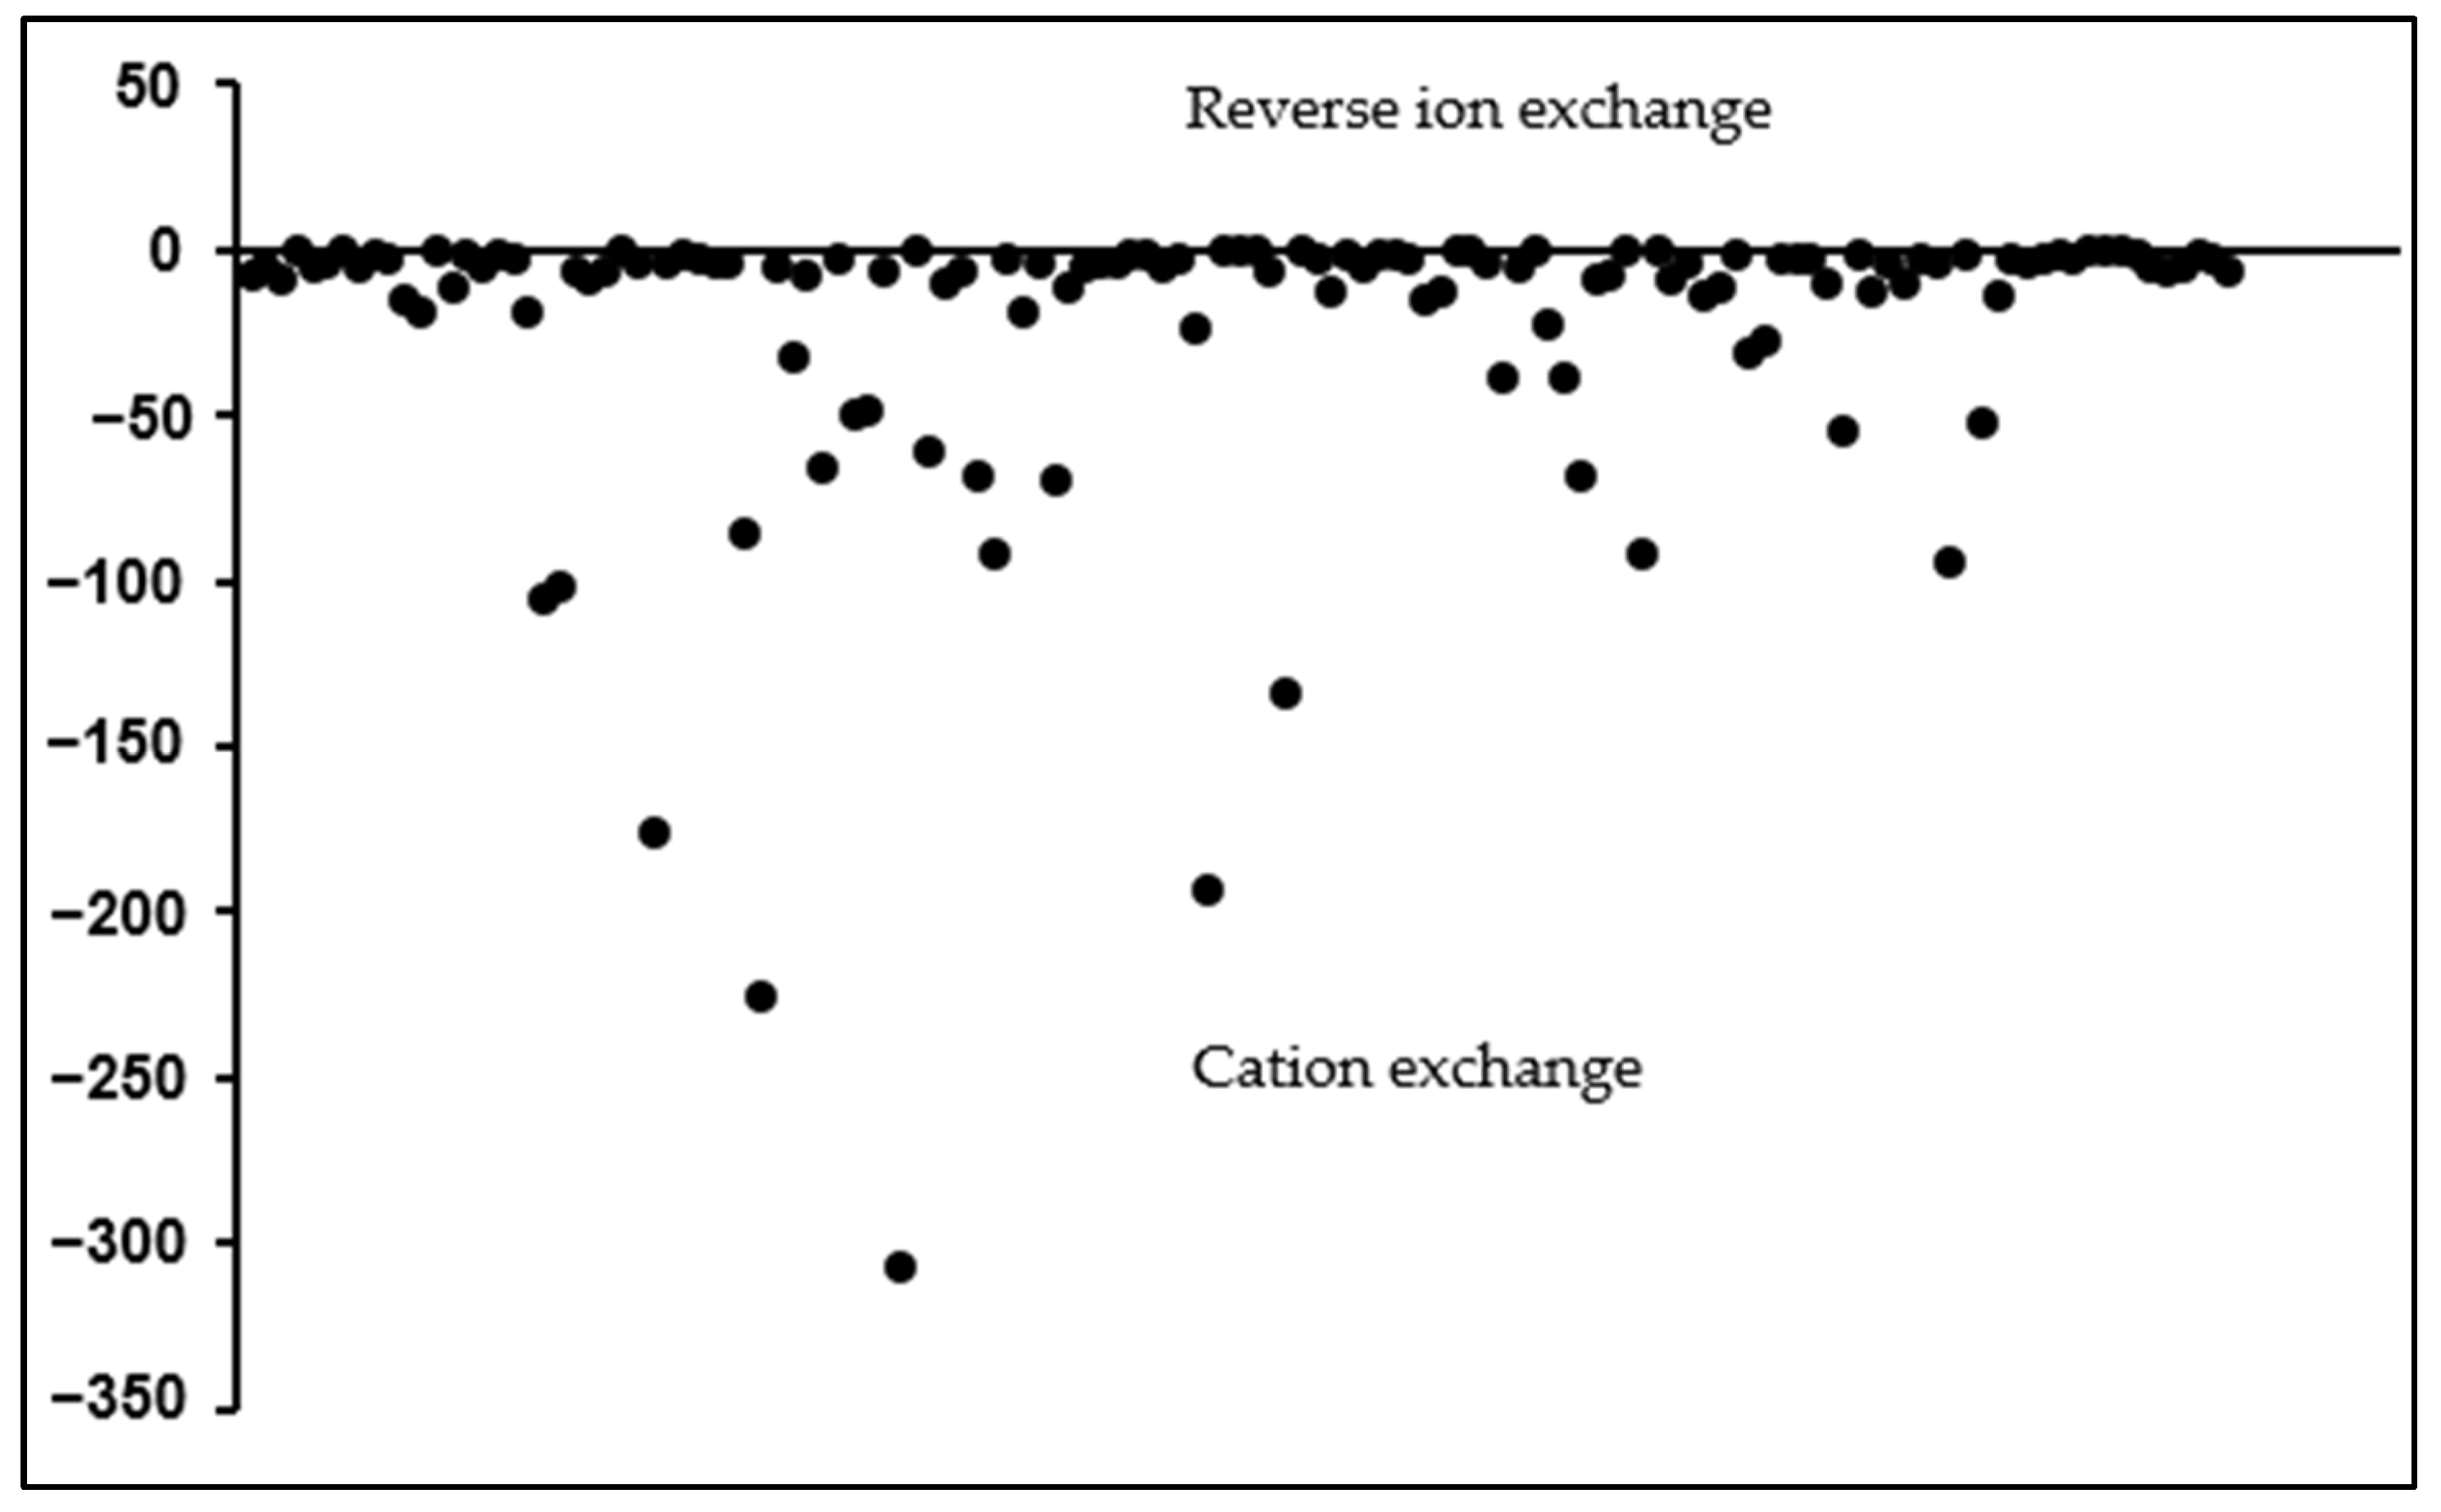
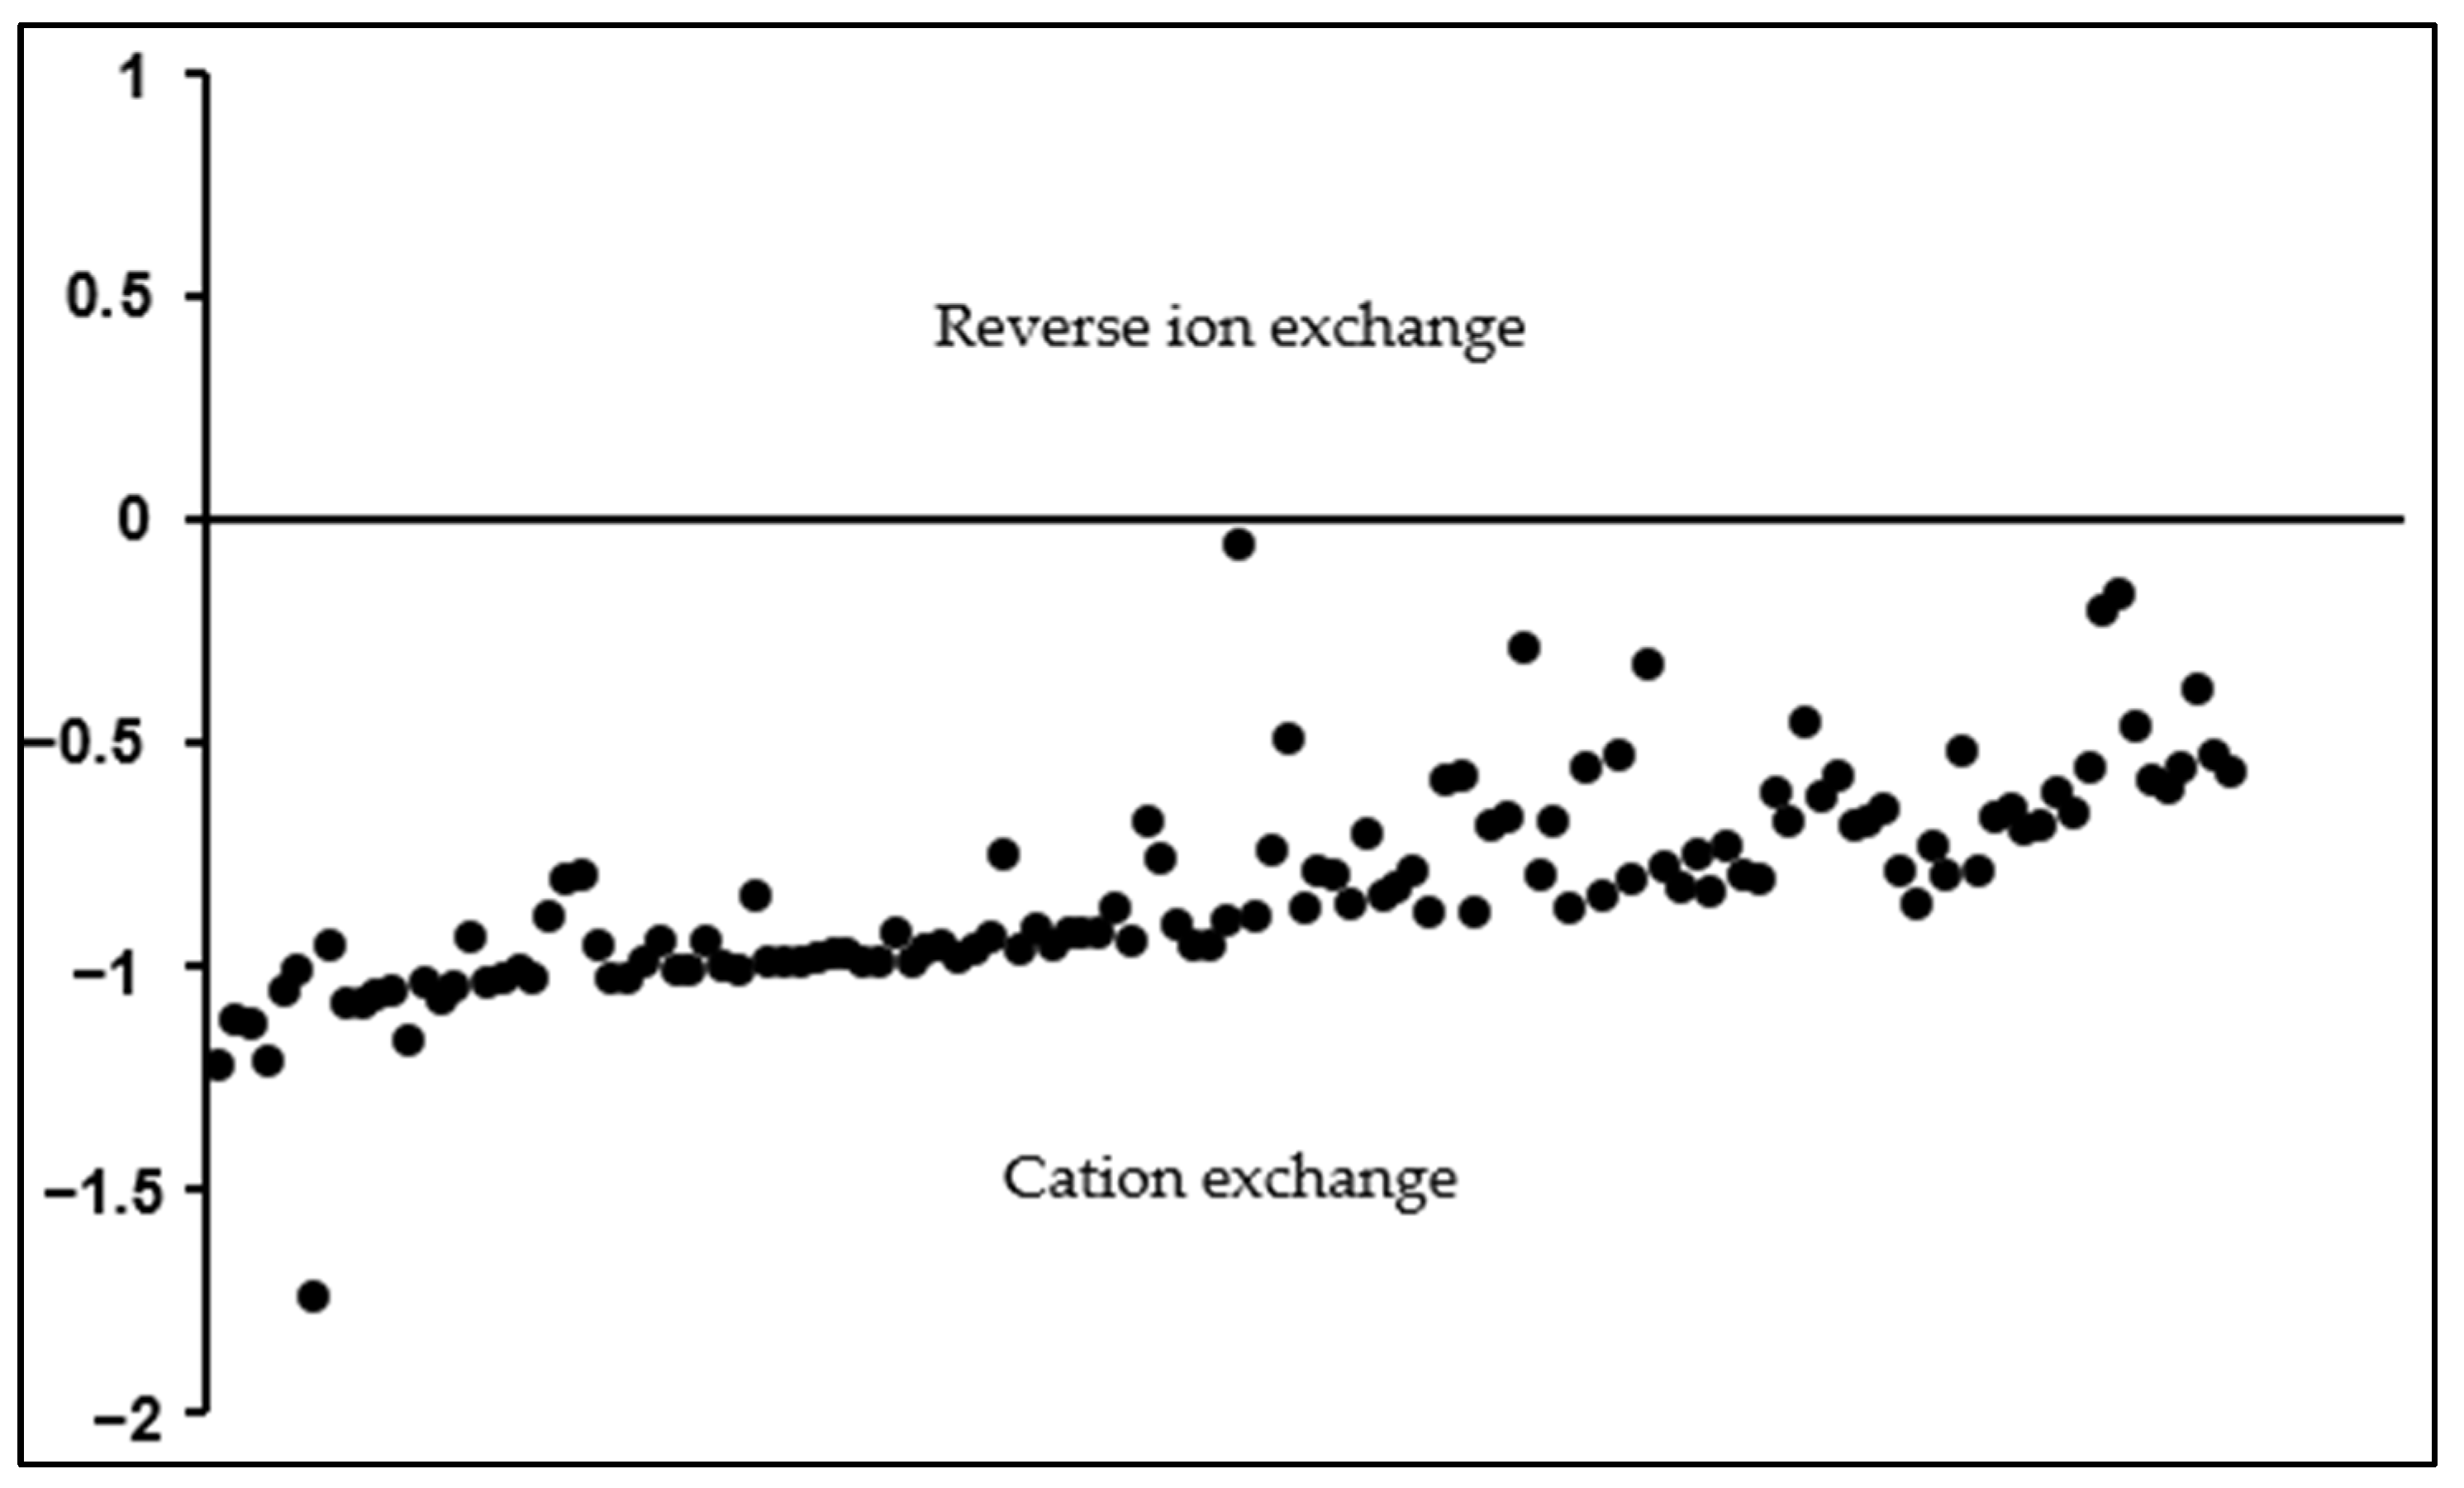
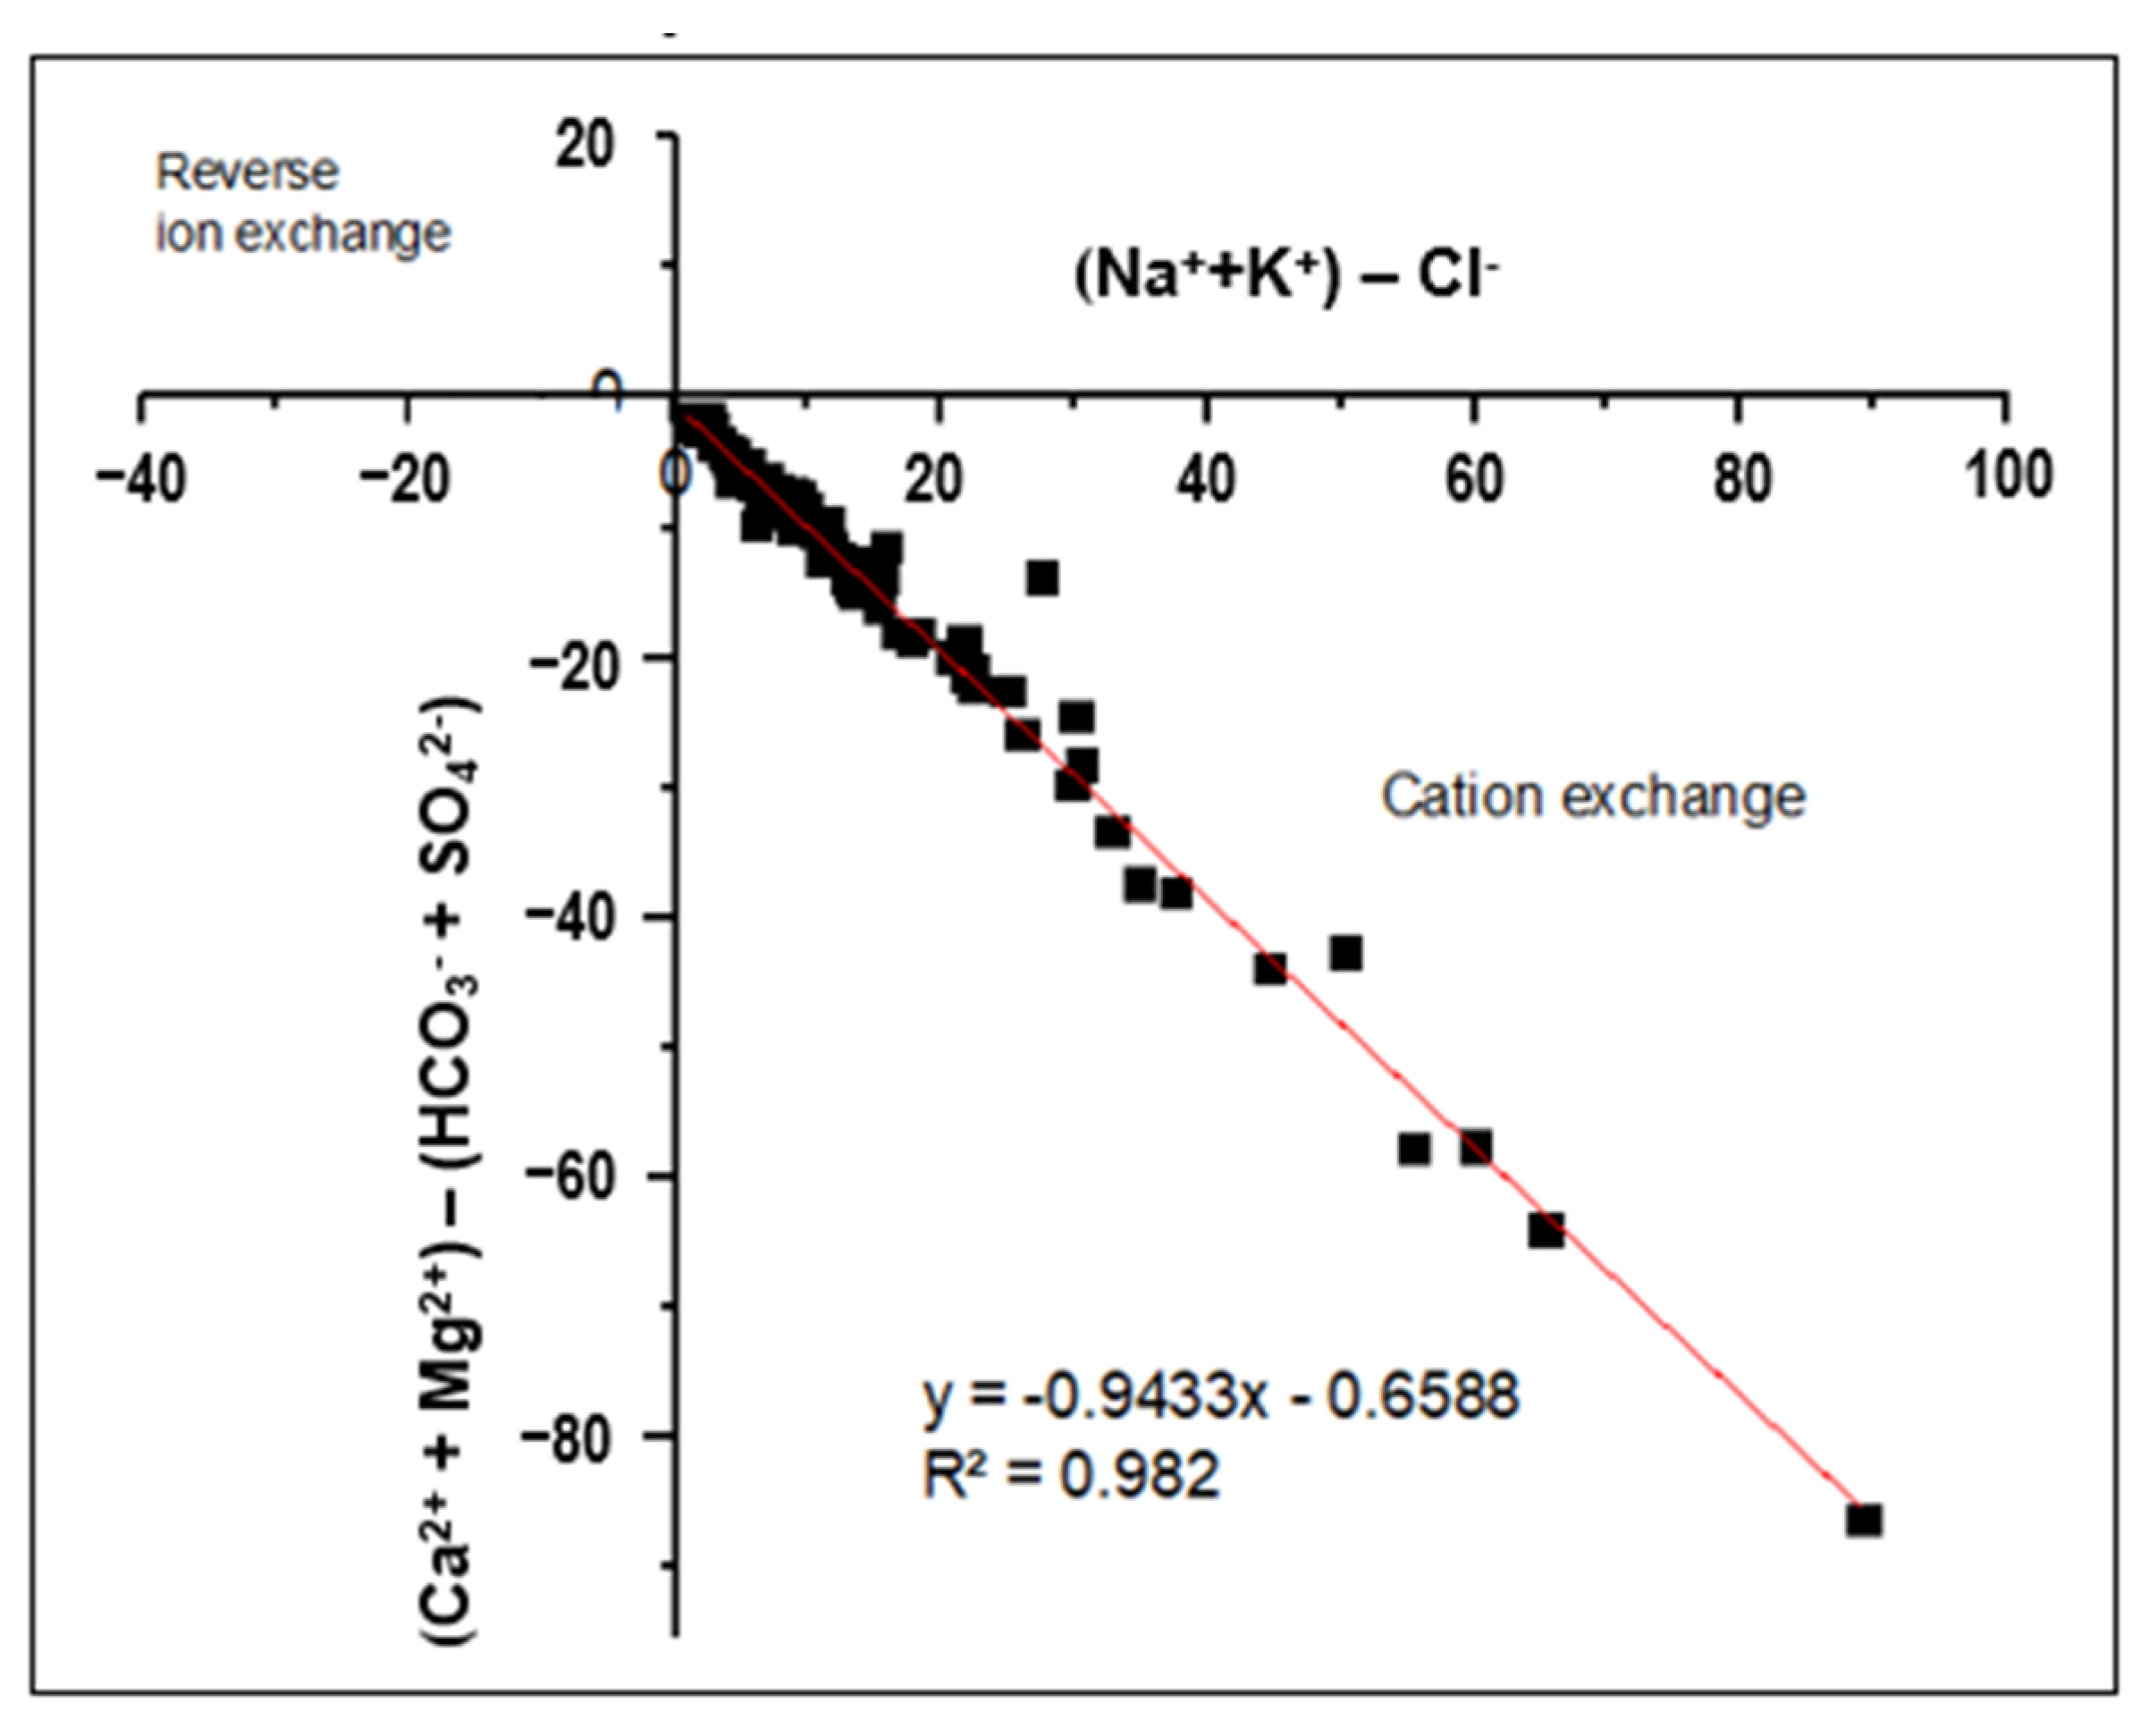
3.2.1. Ion Exchange
3.2.2. Silicate Weathering
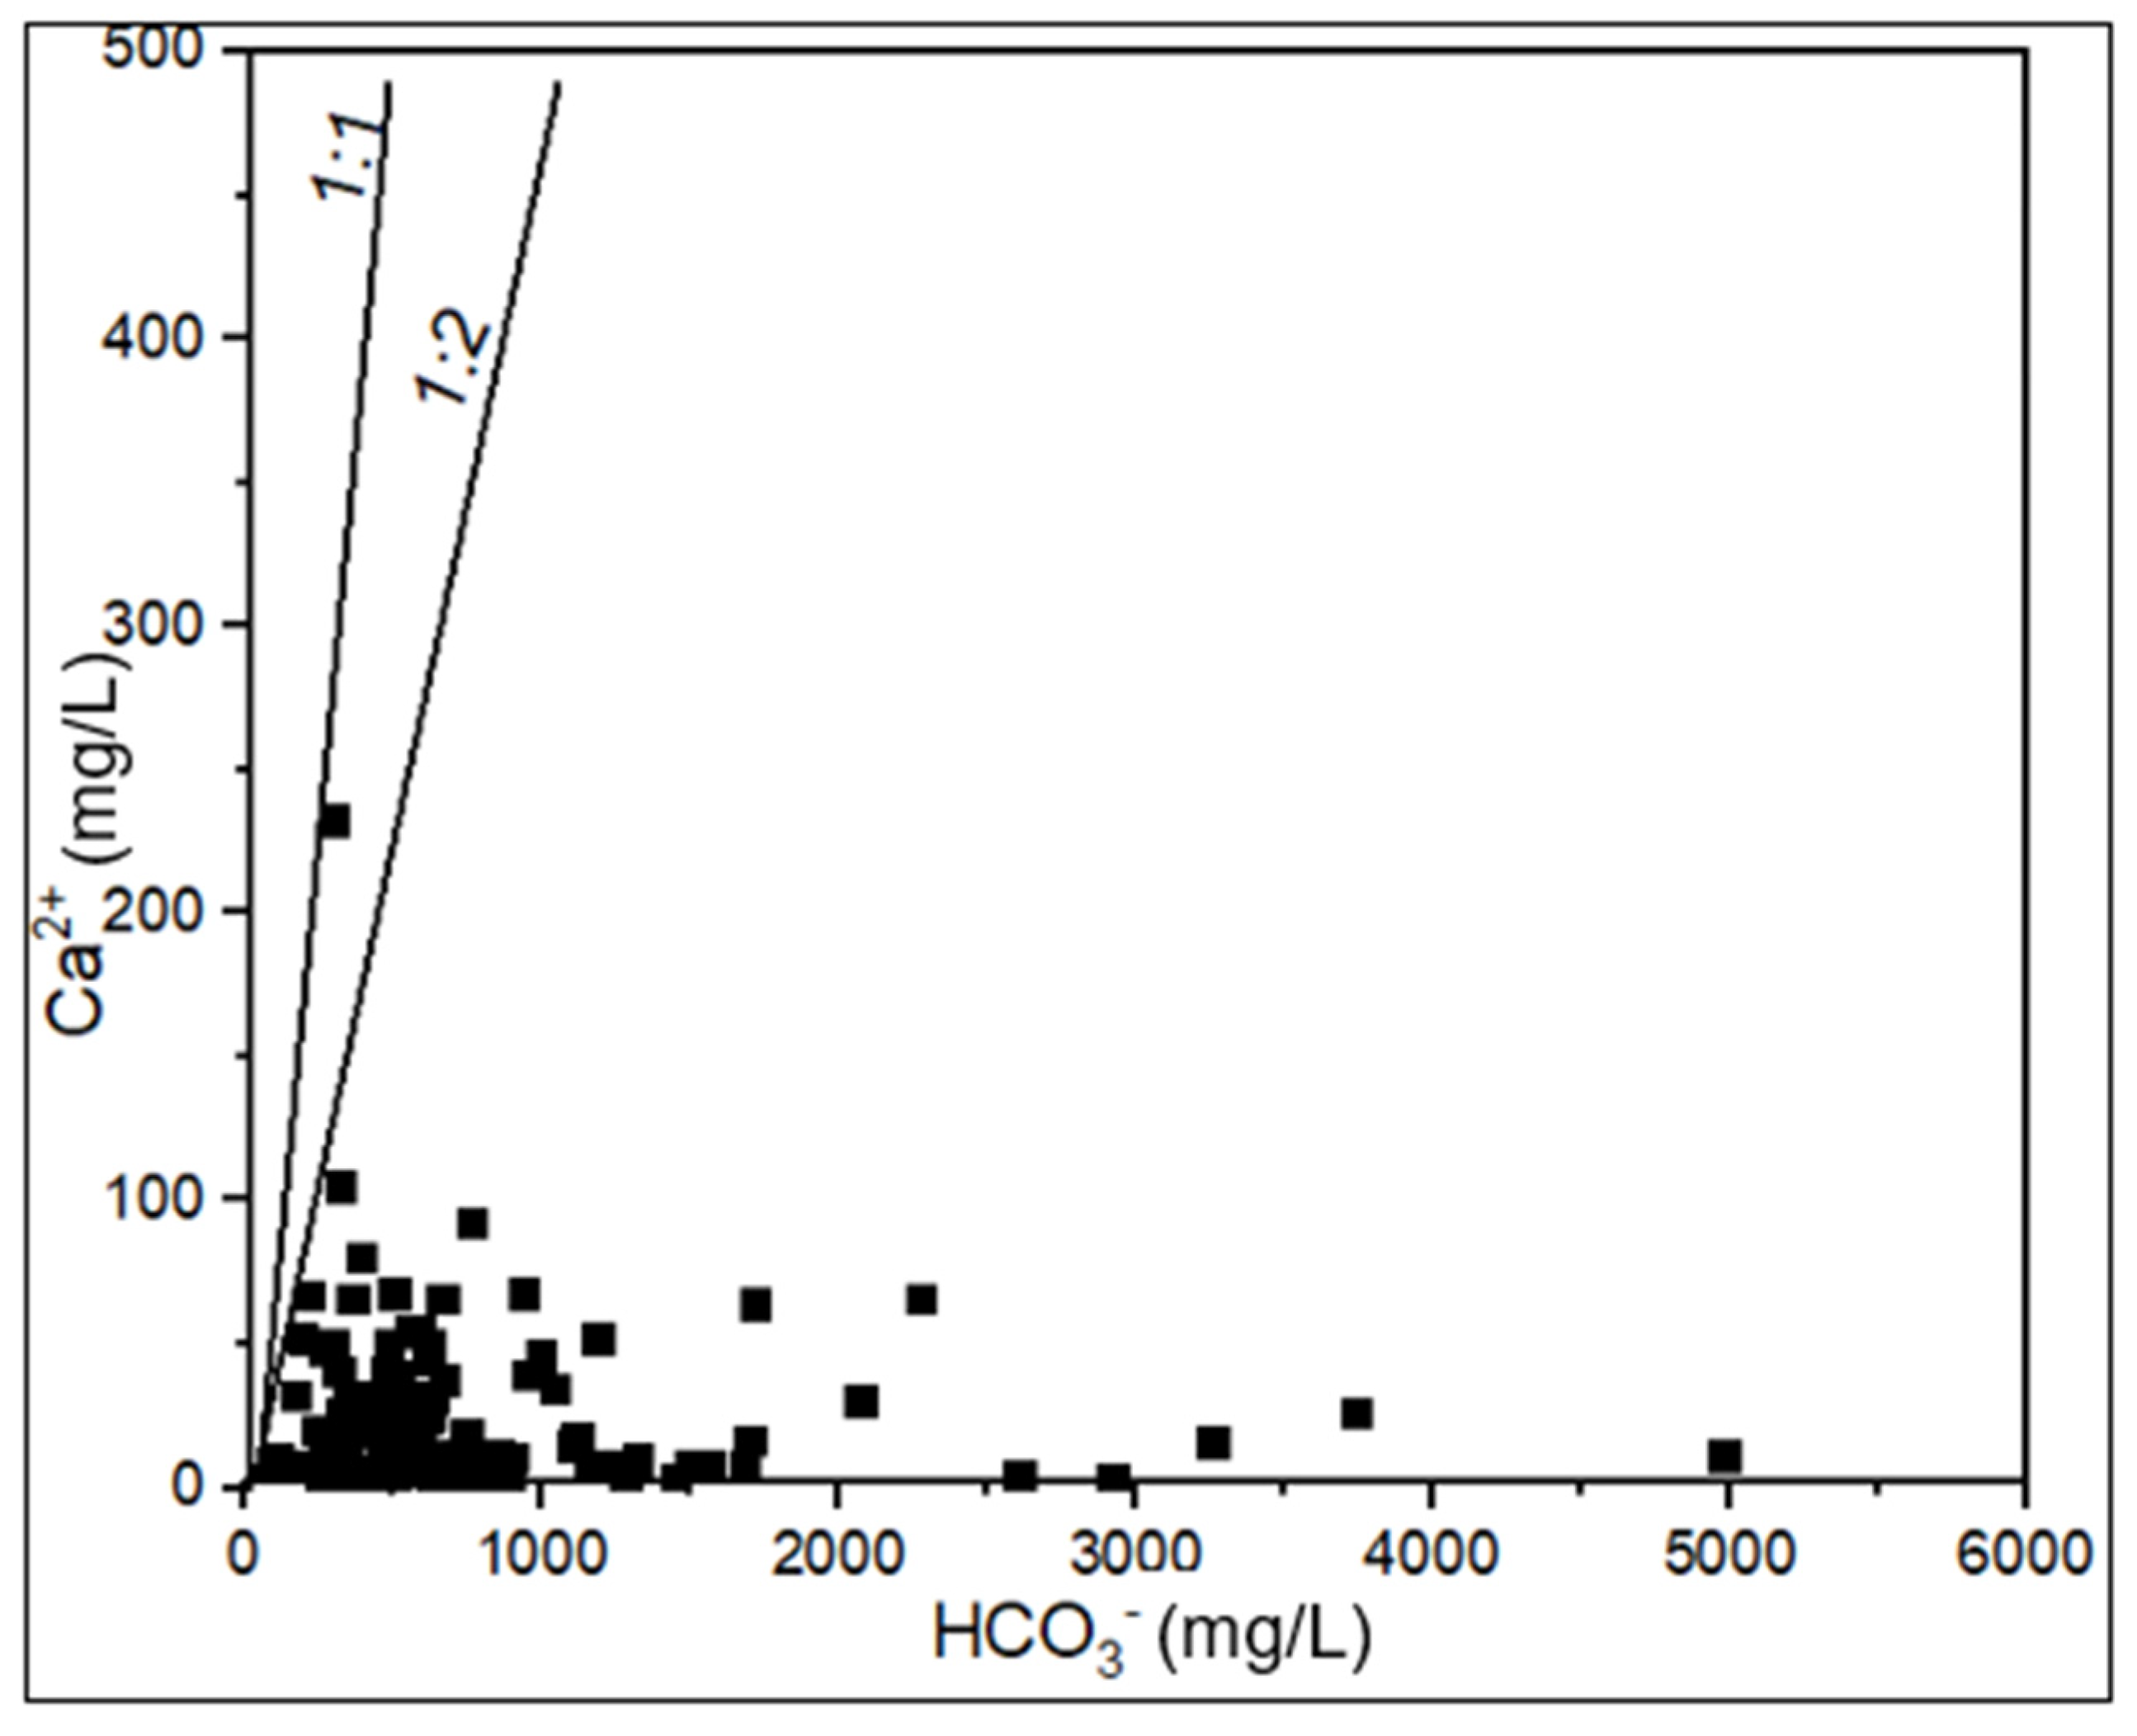
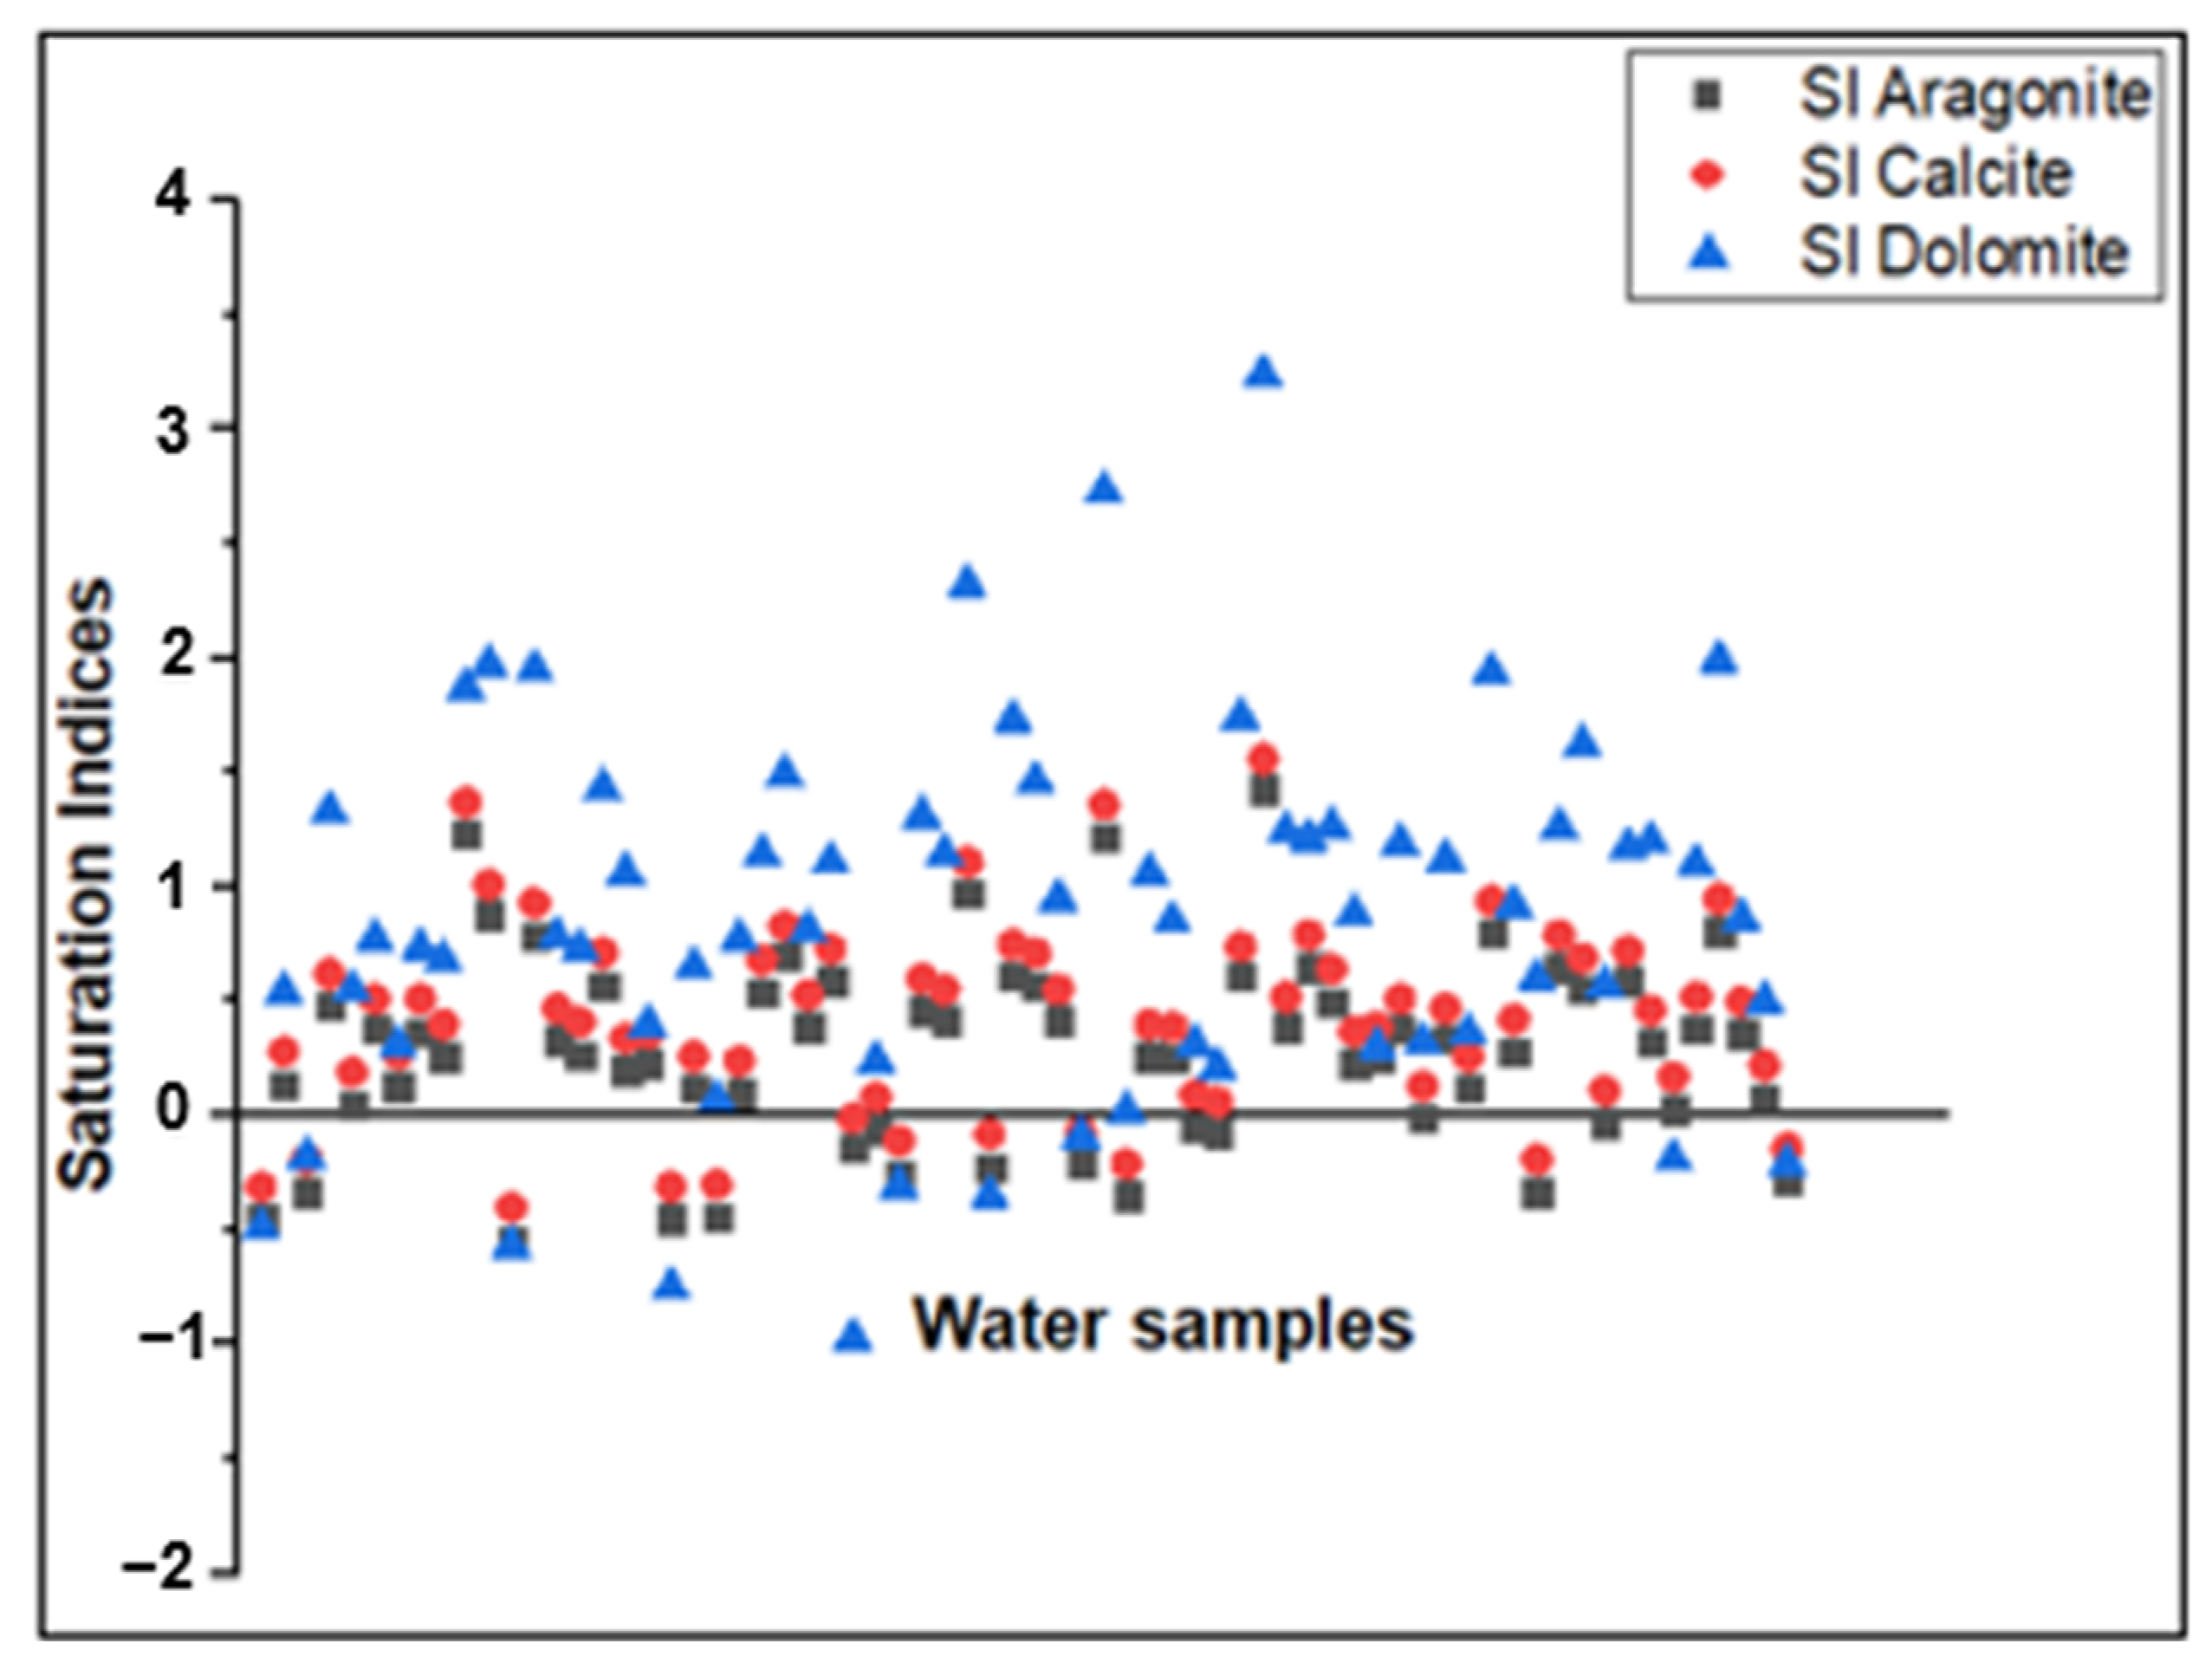
3.2.3. Carbonate Precipitation and Dissolution
3.2.4. Fresh–Saline Water Mixing
3.3. Principal Component Analysis (PCA)
3.4. Drinking Water Quality
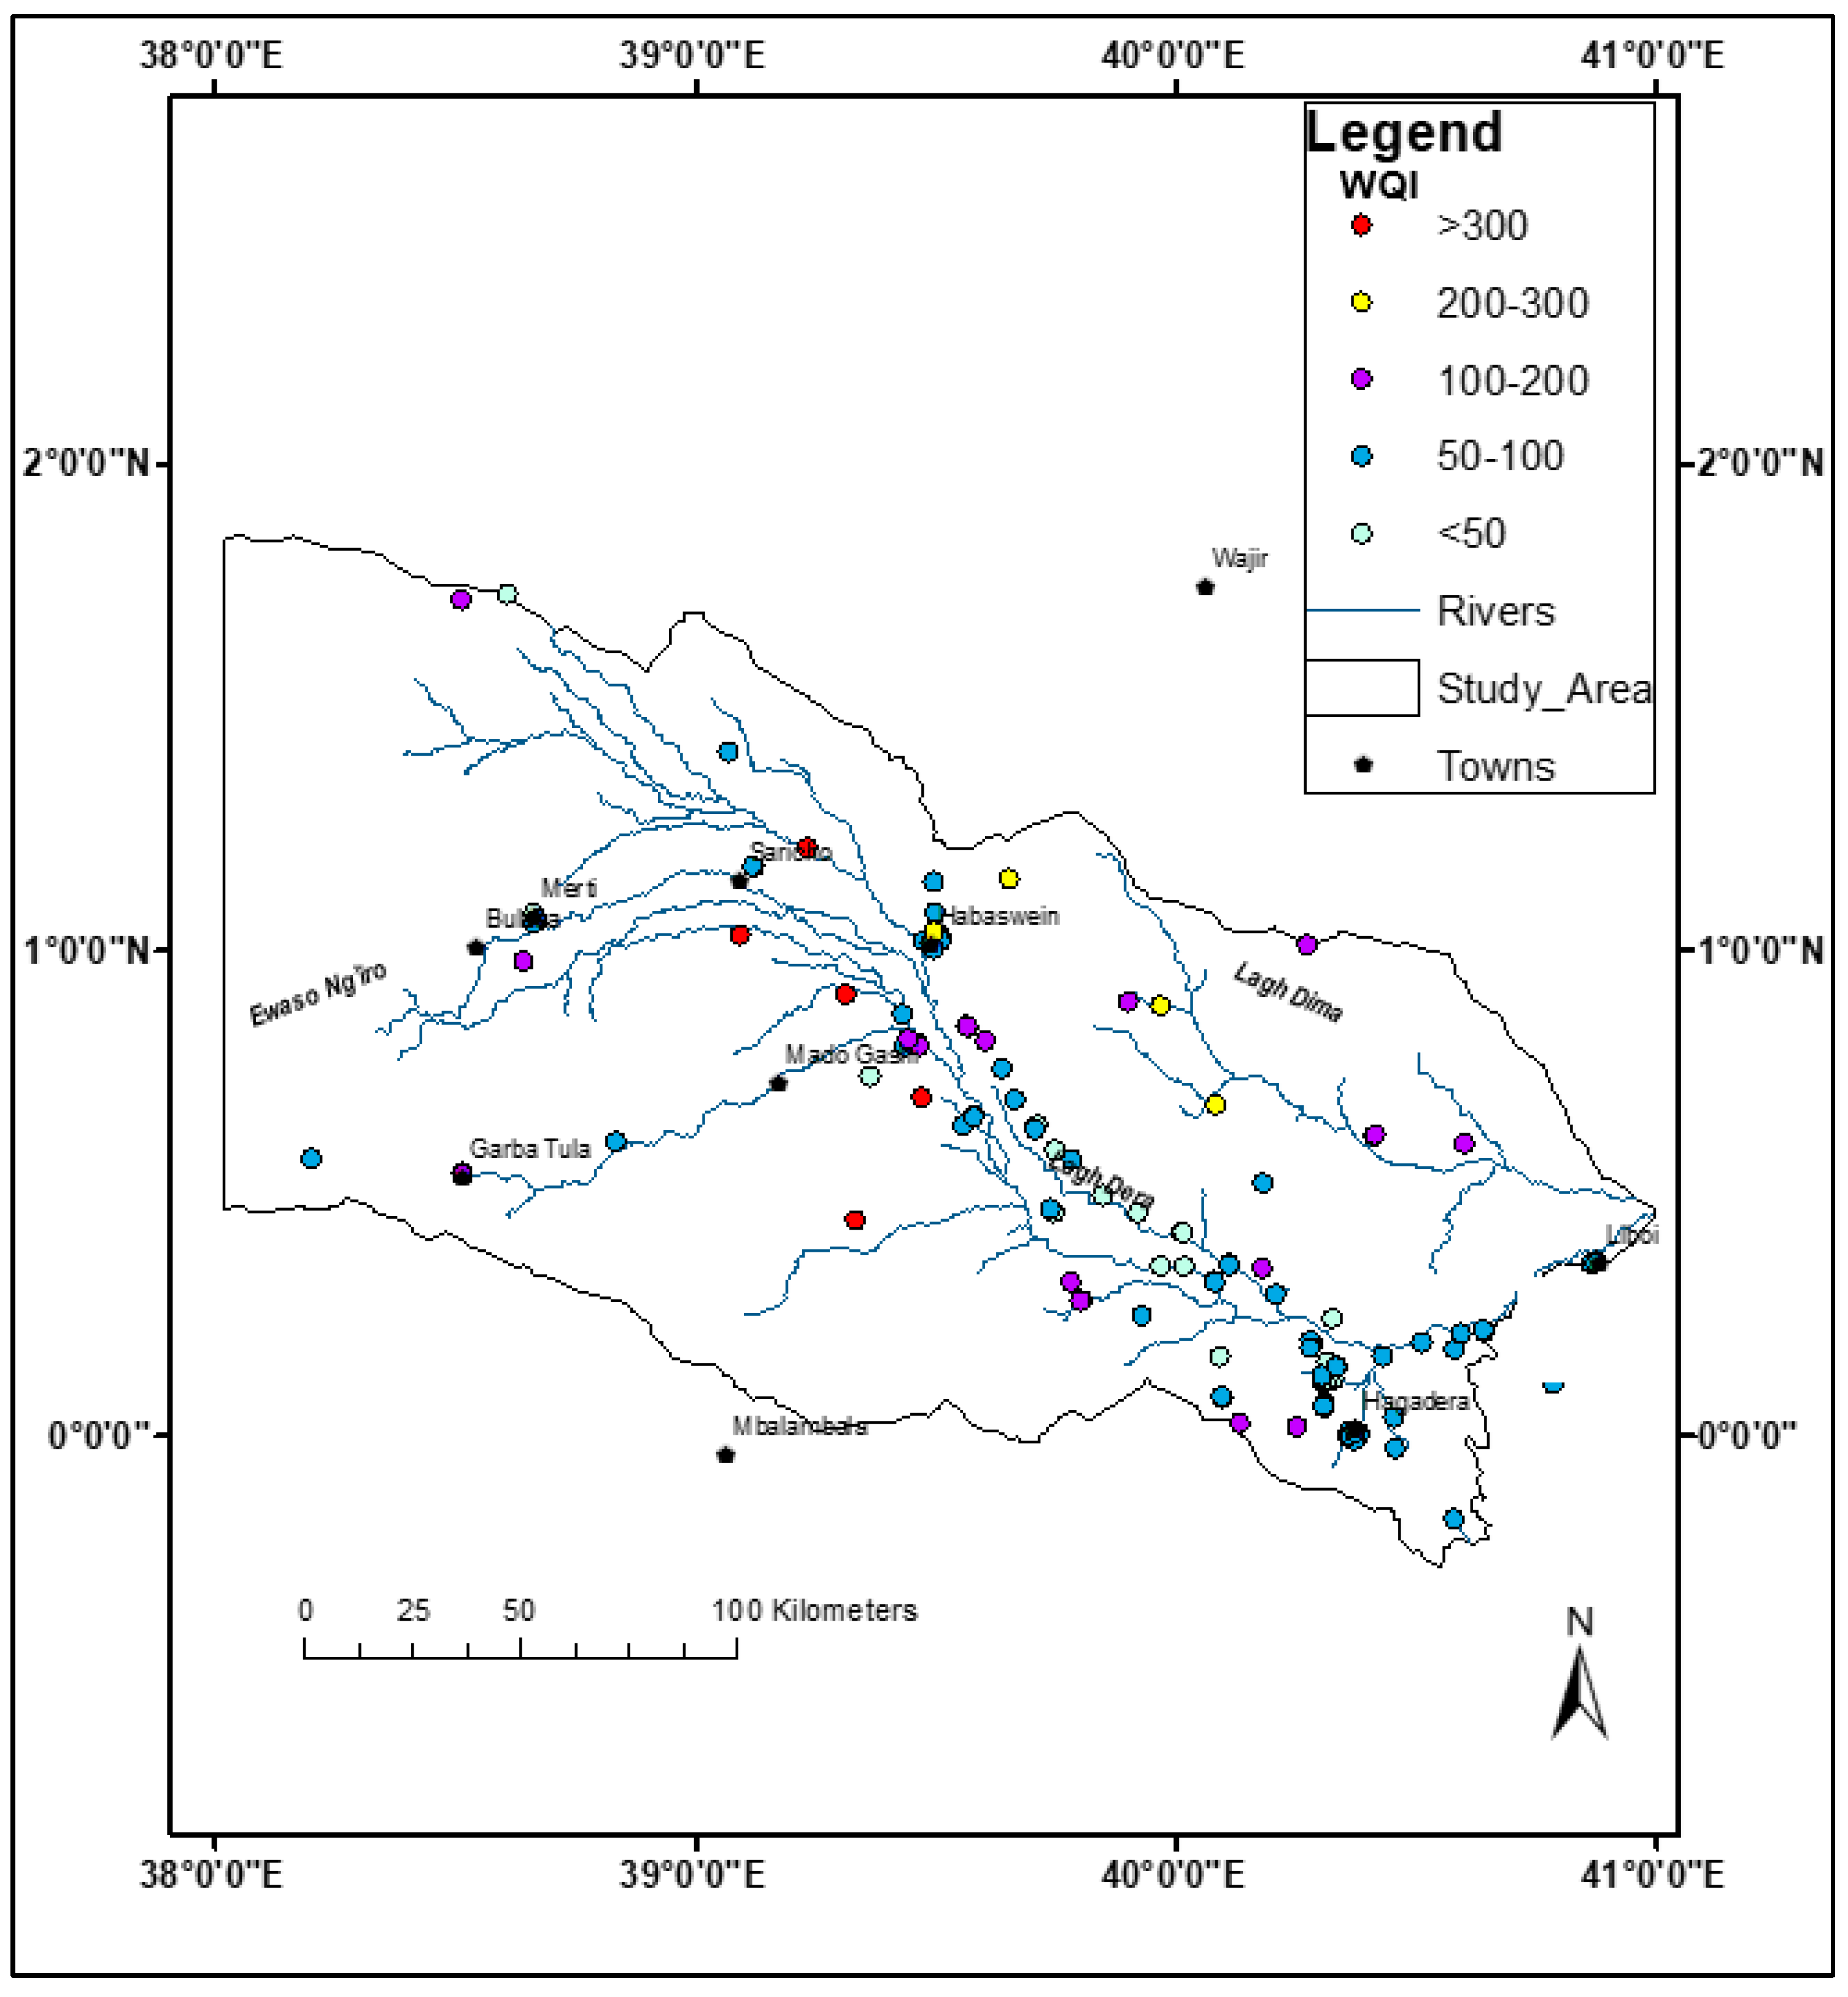
- Water Quality Index (WQI)
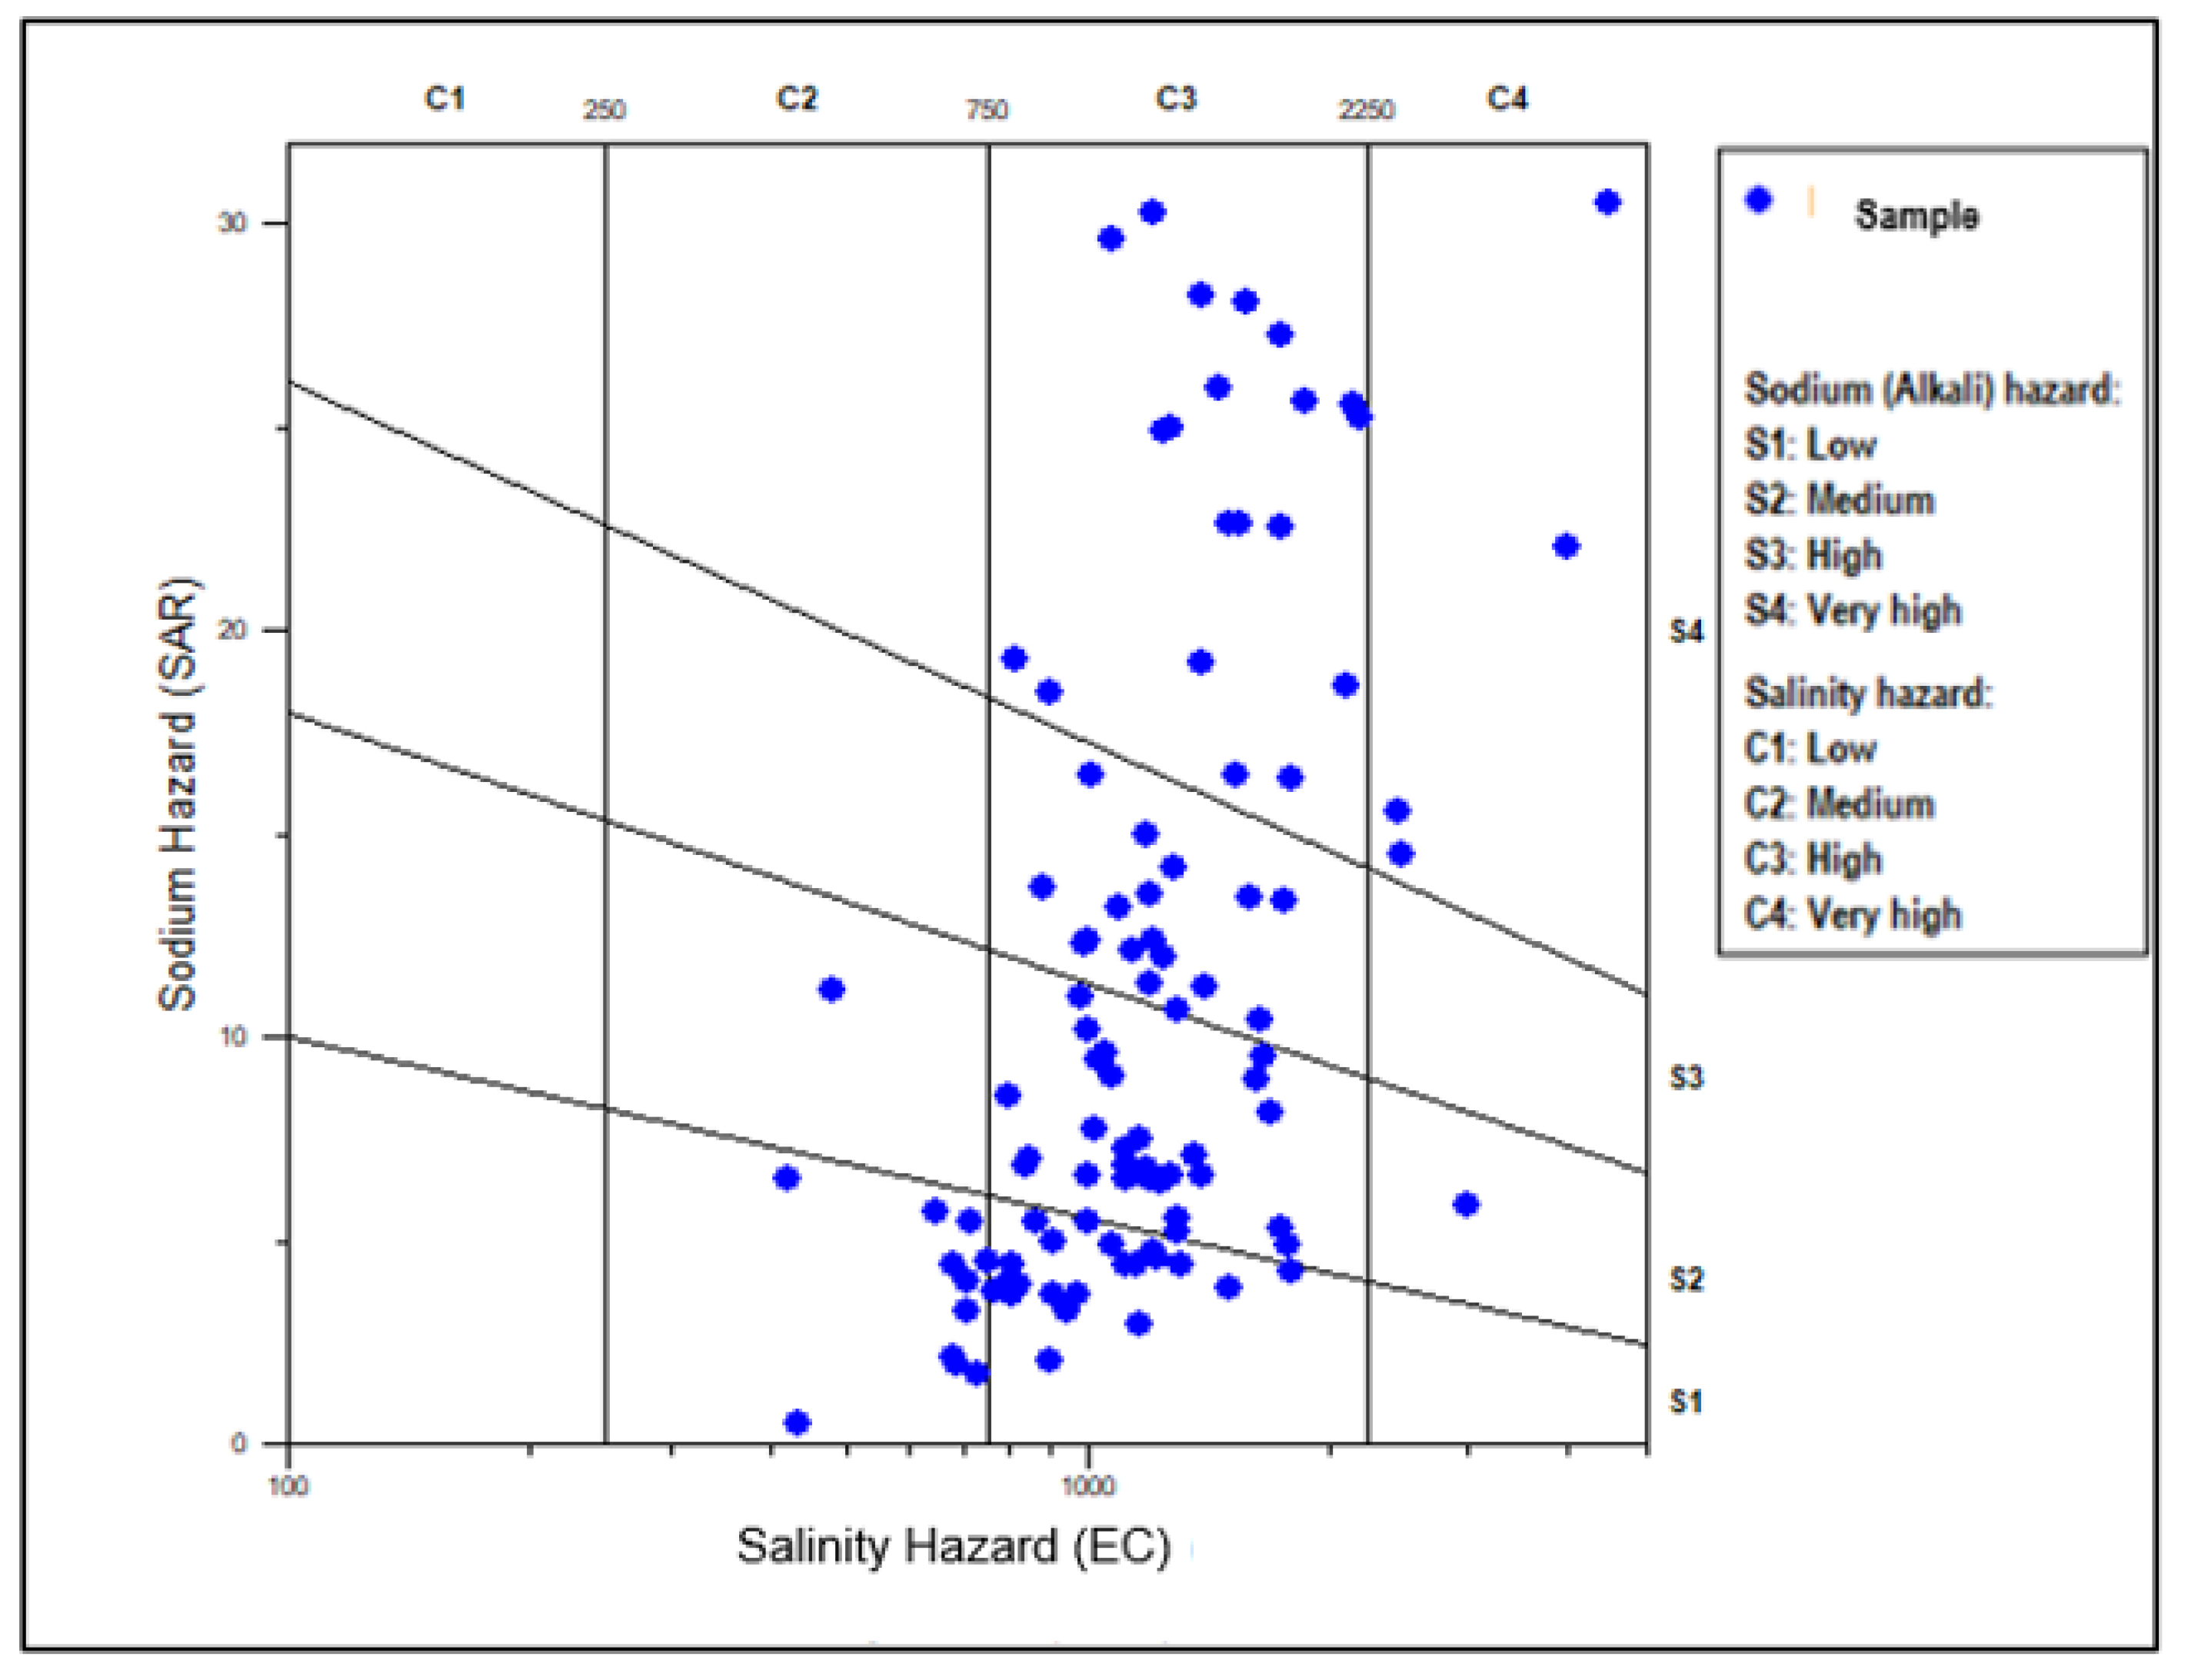
3.5. Irrigation Water Quality
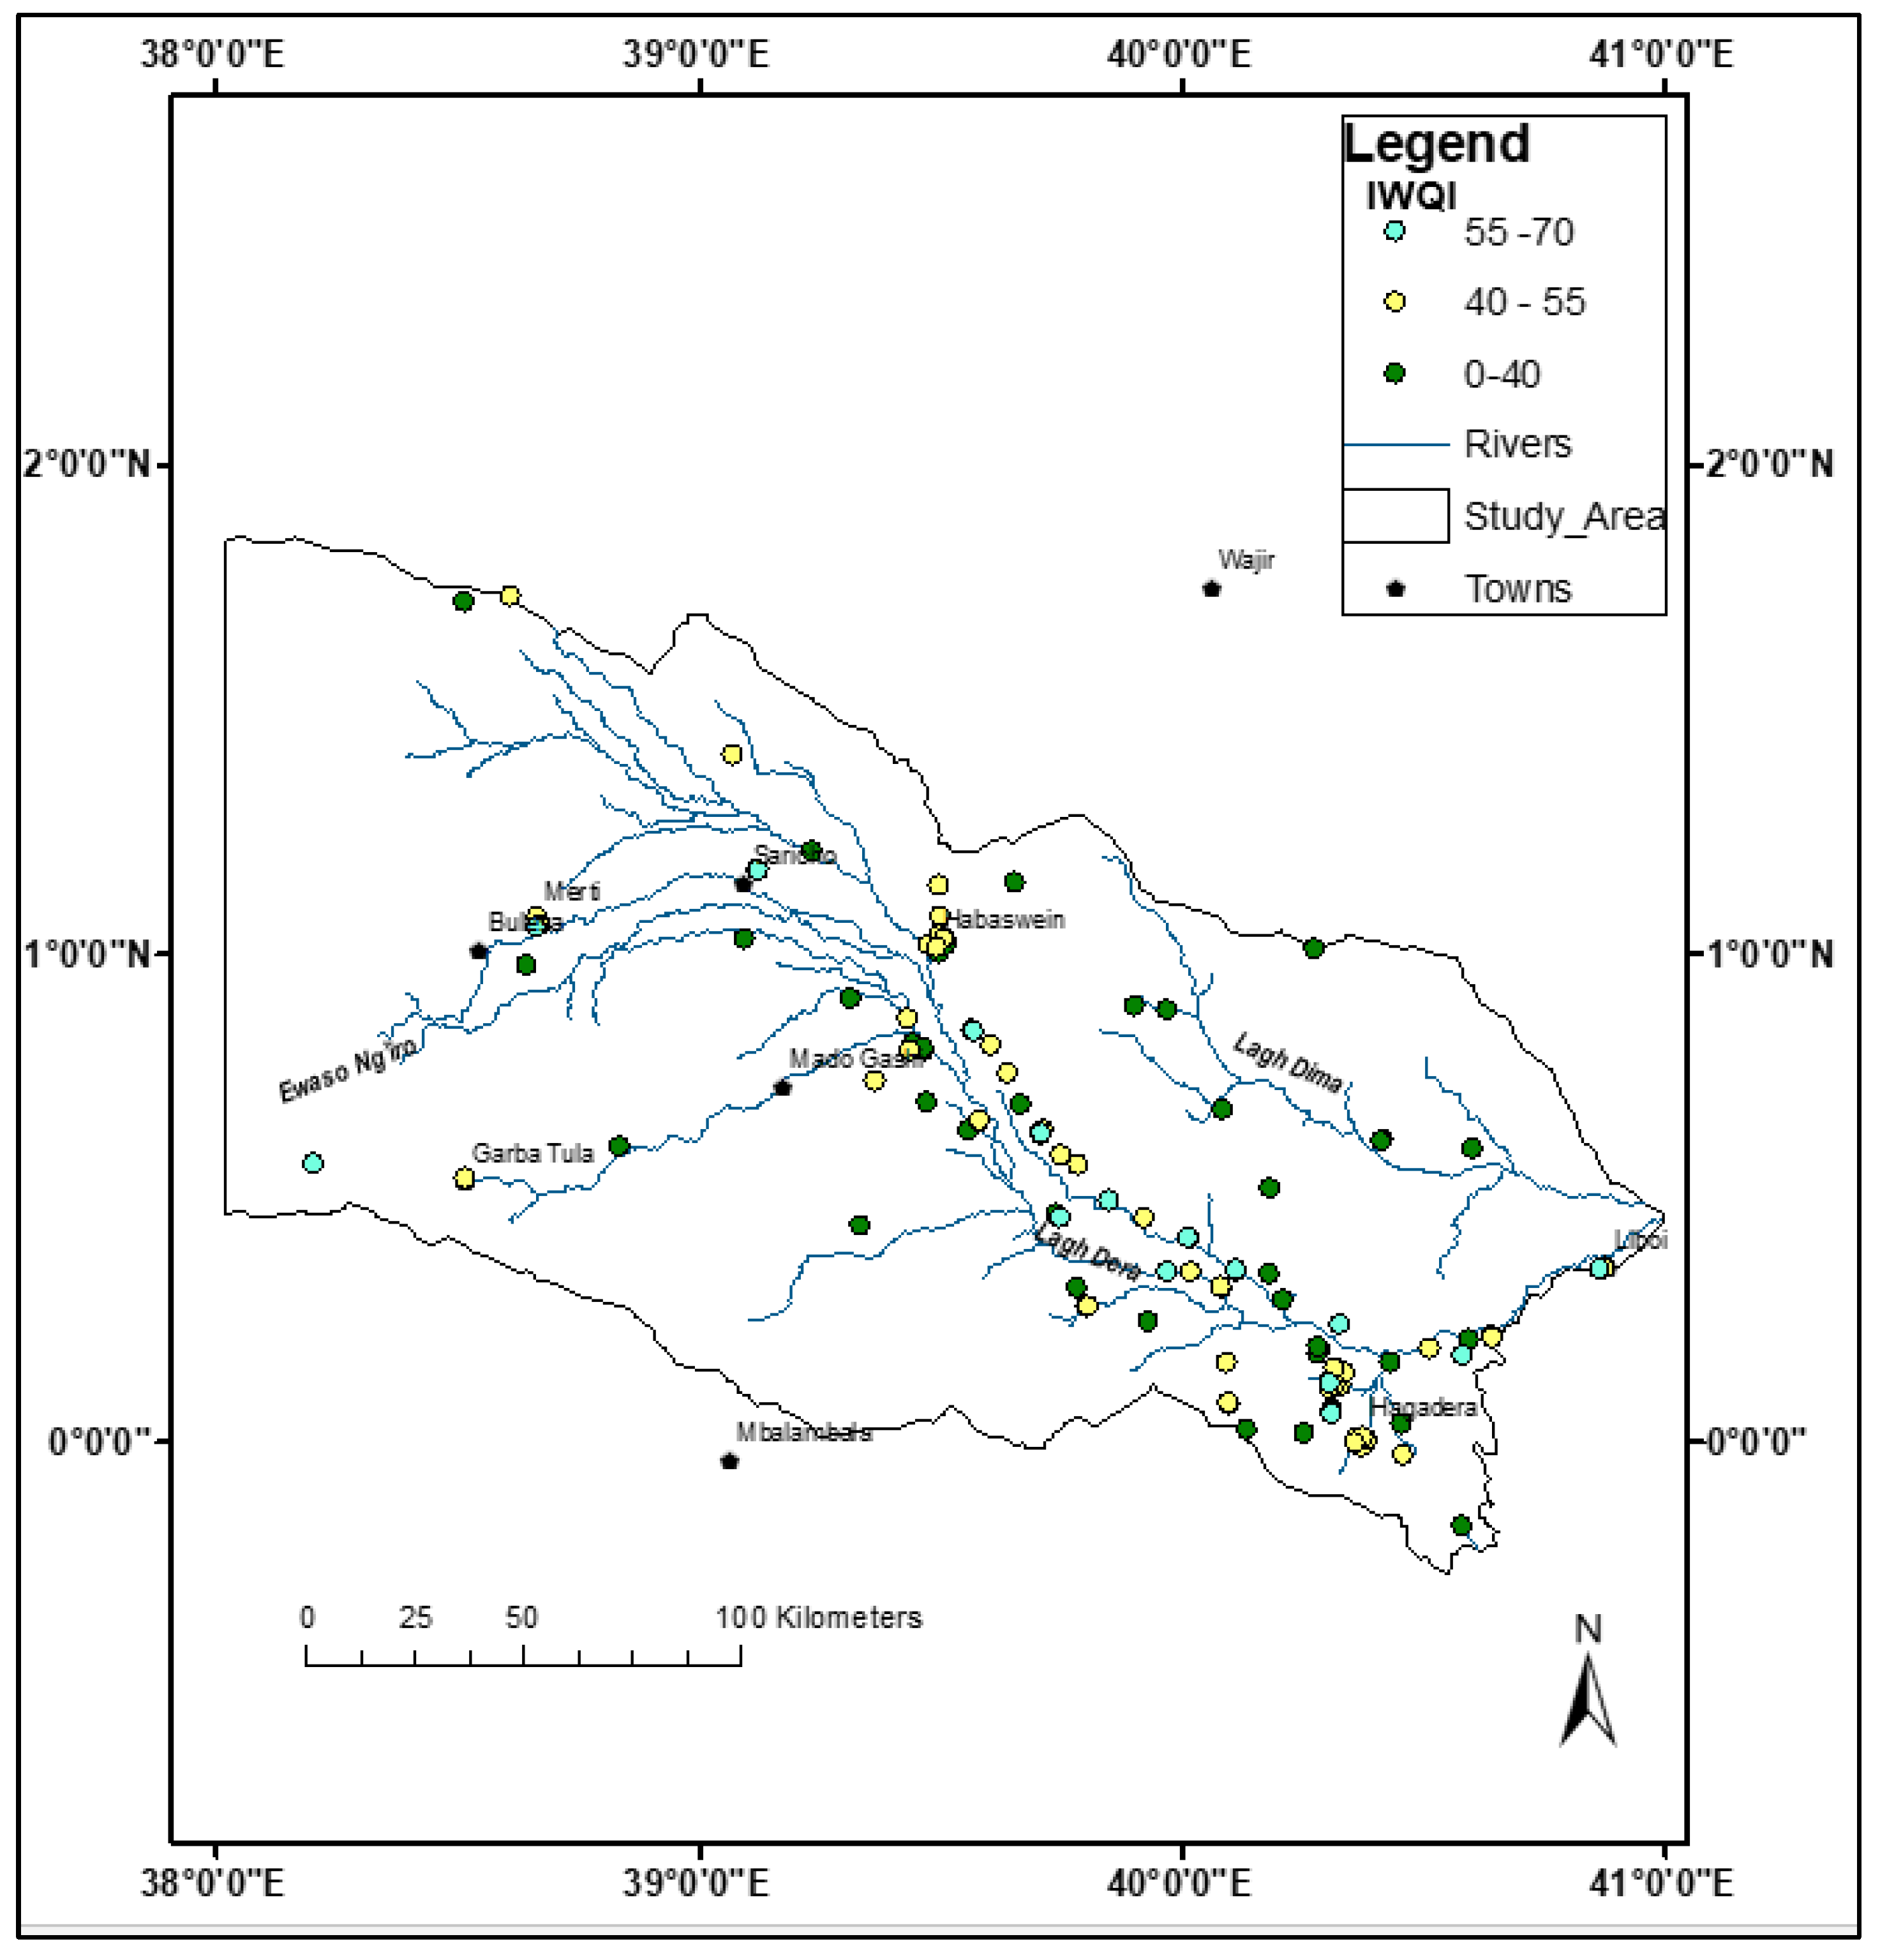
- Irrigation Water Quality Index (IWQI)
4. Discussion
5. Conclusions
Author Contributions
Funding
Data Availability Statement
Acknowledgments
Conflicts of Interest
Abbreviations
| EC | Electrical Conductivity |
| TDS | Total Dissolved Solids |
| WQI | Water Quality Index |
| IWQI | Irrigation Water Quality Index |
| PCA | Principal Component Analysis |
| FAO | Food and Agriculture Organization |
| WHO | World Health Organization |
| WASREB | Water Services Regulatory Board |
| NOCK | National Oil Corporation Kenya |
References
- Shiklomanov, I. World fresh water resources. In Water in Crisis: A Guide to the World’s Fresh Water Resources; Gleick, P.H., Ed.; Oxford University Press: New York, NY, USA, 1993. [Google Scholar]
- Edmunds, W.M. Hydrogeochemical processes in arid and semi-arid regions—Focus on North Africa. In Understanding Water in a Dry Environment; CRC Press: London, UK, 2003; pp. 267–304. [Google Scholar] [CrossRef]
- Coetsiers, M.; Walraevens, K. Chemical characterization of the Neogene Aquifer, Belgium. Hydrogeol. J. 2006, 14, 1556–1568. [Google Scholar] [CrossRef]
- Kumar, M.; Kumari, K.; Singh, U.K.; Ramanathan, A.L. Hydrogeochemical processes in the groundwater environment of Muktsar, Punjab: Conventional graphical and multivariate statistical approach. Environ. Geol. 2009, 57, 873–884. [Google Scholar] [CrossRef]
- Chenini, I.; Farhat, B.; Ben Mammou, A. Identification of major sources controlling groundwater chemistry from a multilayered aquifer system. Chem. Speciat. Bioavailab. 2010, 22, 183–189. [Google Scholar] [CrossRef]
- Rajesh, R.; Brindha, K.; Murugan, R.; Elango, L. Influence of hydrogeochemical processes on temporal changes in groundwater quality in a part of Nalgonda district, Andhra Pradesh, India. Environ. Earth Sci. 2012, 65, 1203–1213. [Google Scholar] [CrossRef]
- Freeze, R.A.; Cherry, J.A. Groundwater; Prentice-Hall: Englewood Cliffs, NJ, USA, 1979. [Google Scholar]
- Etikala, B.; Adimalla, N.; Madhav, S.; Somagouni, S.G.; Keshava Kiran Kumar, P.L. Salinity problems in groundwater and management strategies in arid and semi-arid regions. In Groundwater Geochemistry: Pollution and Remediation Methods; John Wiley & Sons Ltd.: Hoboken, NJ, USA, 2021; pp. 42–56. [Google Scholar] [CrossRef]
- Hailu, H.; Haftu, S. Hydrogeochemical studies of groundwater in semi-arid areas of northern Ethiopia using geospatial methods and multivariate statistical analysis techniques. Appl. Water Sci. 2023, 13, 86. [Google Scholar] [CrossRef]
- Laghrib, F.; Bahaj, T.; El Kasmi, S.; Hilali, M.; Kacimi, I.; Nouayti, N.; Dakak, H.; Bouzekraoui, M.; El Fatni, O.; Hammani, O. Hydrogeochemical study of groundwater in arid and semi-arid regions of the Infracenomanian aquifers (Cretaceous Errachidia basin, Southeastern Morocco). Using hydrochemical modeling and multivariate statistical analysis. J. Afr. Earth Sci. 2024, 209, 105132. [Google Scholar] [CrossRef]
- Toth, J. The role of regional gravity flow in the chemical and thermal evolution of ground water. In Proceedings of the First Canadian/American Conference on Hydrogeology, Practical Applications of Ground Water Geochemistry, Worthington, OH, USA, 22–26 June 1984; pp. 3–39. [Google Scholar]
- Lakshmanan, E.; Kannan, R.; Kumar, M.S. Major ion chemistry and identification of hydrogeochemical processes of ground water in a part of Kancheepuram district, Tamil Nadu, India. Environ. Geosci. 2003, 10, 157–166. [Google Scholar] [CrossRef]
- Maas, B.; Peterson, E.W.; Honings, J.; Oberhelman, A.; Oware, P.; Rusthoven, I.; Watson, A. Differentiation of Surface Water and Groundwater in a Karst System Using Anthropogenic Signatures. Geosciences 2019, 9, 148. [Google Scholar] [CrossRef]
- De Filippi, F.M.; Iacurto, S.; Grelle, G.; Sappa, G. Magnesium as Environmental Tracer for Karst Spring Baseflow/Overflow Assessment—A Case Study of the Pertuso Karst Spring (Latium Region, Italy). Water 2021, 13, 93. [Google Scholar] [CrossRef]
- Tizro, A.T.; Voudouris, K.S. Groundwater quality in the semi-arid region of the Chahardouly basin, West Iran. Hydrol. Process. 2008, 22, 3066–3078. [Google Scholar] [CrossRef]
- Chenini, I.; Mammou, A.B.; Turki, M.M. Groundwater resources of a multilayered aquiferous system in arid area: Data analysis and water budgeting. Int. J. Environ. Sci. Technol. 2008, 5, 361–374. [Google Scholar] [CrossRef]
- Prasanna, M.V.; Chidambaram, S.; Srinivasamoorthy, K. Statistical analysis of the hydrogeochemical evolution of groundwater in hard and sedimentary aquifers system of Gadilam river basin, South India. J. King Saud Univ.—Sci. 2010, 22, 133–145. [Google Scholar] [CrossRef]
- Zaidi, F.K.; Nazzal, Y.; Jafri, M.K.; Naeem, M.; Ahmed, I. Reverse ion exchange as a major process controlling the groundwater chemistry in an arid environment: A case study from northwestern Saudi Arabia. Environ. Monit. Assess. 2015, 187, 607. [Google Scholar] [CrossRef]
- Sajil Kumar, P.J.; James, E.J. Identification of hydrogeochemical processes in the Coimbatore district, Tamil Nadu, India. Hydrol. Sci. J. 2016, 61, 719–731. [Google Scholar] [CrossRef]
- Hamma, B.; Alodah, A.; Bouaicha, F.; Bekkouche, M.F.; Barkat, A.; Hussein, E.E. Hydrochemical assessment of groundwater using multivariate statistical methods and water quality indices (WQIs). Appl. Water Sci. 2024, 14, 33. [Google Scholar] [CrossRef]
- Kura, N.U.; Ramli, M.F.; Sulaiman, W.N.A.; Ibrahim, S.; Aris, A.Z.; Mustapha, A. Evaluation of factors influencing the groundwater chemistry in a small tropical island of Malaysia. Int. J. Environ. Res. Public Health 2023, 10, 1861–1881. [Google Scholar] [CrossRef]
- Ravikumar, P.; Somashekar, R.K. Principal component analysis and hydrochemical facies characterization to evaluate groundwater quality in Varahi river basin, Karnataka state, India. Appl. Water Sci. 2017, 7, 745–755. [Google Scholar] [CrossRef]
- Liu, F.; Zhang, J.; Wang, S.; Zou, J.; Zhen, P. Multivariate statistical analysis of chemical and stable isotopic data as indicative of groundwater evolution with reduced exploitation. Geosci. Front. 2023, 14, 101476. [Google Scholar] [CrossRef]
- Wenning, R.J.; Erickson, G.A. Interpretation and analysis of complex environmental data using chemometric methods. Trends Anal. Chem. 1994, 13, 446–457. [Google Scholar] [CrossRef]
- Helena, B.; Pardo, R.; Vega, M.; Barrado, E.; Fernandez, J.M.; Fernandez, L. Temporal evolution of groundwater composition in an alluvial aquifer (Pisuerga River, Spain) by principal component analysis. Water Res. 2000, 34, 807–816. [Google Scholar] [CrossRef]
- Alassane, A.; Trabelsi, R.; Dovonon, L.F.; Odeloui, D.J.; Boukari, M.; Zouari, K.; Mama, D. Chemical evolution of the continental terminal shallow aquifer in the south of coastal sedimentary basin of Benin (West-Africa) using multivariate factor analysis. J. Water Resour. Prot. 2015, 7, 496–515. [Google Scholar] [CrossRef]
- Okiongbo, K.S.; Douglas, R.K. Evaluation of major factors influencing the geochemistry of groundwater using graphical and multivariate statistical methods in Yenagoa city, Southern Nigeria. Appl. Water Sci. 2015, 5, 27–37. [Google Scholar] [CrossRef]
- Jackson, J.E. A User’s User’s Guide to Principal Components; Wiley: New York, NY, USA, 1991. [Google Scholar]
- Meglen, R.R. Examining large databases: A chemometric approach using principal component analysis. Mar. Chem. 1992, 39, 217–237. [Google Scholar] [CrossRef]
- Jalali, M. Application of Multivariate analysis to study water chemistry of groundwater in a semi-arid aquifer, Malayer, Western Iran. Desalination Water Treat. 2010, 19, 307–317. [Google Scholar] [CrossRef]
- Alfarrah, N.; Walraevens, K. Groundwater Overexploitation and Seawater Intrusion in Coastal Areas of Arid and Semi-Arid Regions. Water 2018, 10, 143. [Google Scholar] [CrossRef]
- Singhal, A.; Gupta, R.; Singh, A.N.; Shrinivas, A. Assessment and monitoring of groundwater quality in semi–arid region. Groundw. Sustain. Dev. 2020, 11, 100381. [Google Scholar] [CrossRef]
- Horton, R.K. An index number system for rating water quality. J. Water Pollut. Control Fed. 1965, 37, 300–306. [Google Scholar]
- Brown, R.M.; McClelland, N.I.; Deininger, R.A.; Tozer, R.G. A water quality index-do we dare. Water Sew. Work. 1970, 117, 10. [Google Scholar]
- Ott, W.R. Water Quality Indices: A Survey of Indices Used in the United States; Environmental Protection Agency, Office of Research and Development, Office of Monitoring and Technical Support: Washington, DC, USA, 1978.
- Boah, D.K.; Twum, S.B.; Pelig-Ba, K.B. Mathematical computation of water quality index of Vea dam in upper east region of Ghana. Environ. Sci. 2015, 3, 11–16. [Google Scholar] [CrossRef]
- Adimalla, N.; Li, P.; Venkatayogi, S. Hydrogeochemical Evaluation of Groundwater Quality for Drinking and Irrigation Purposes and Integrated Interpretation with Water Quality Index Studies. Environ. Process. 2018, 5, 363–383. [Google Scholar] [CrossRef]
- Batarseh, M.; Imreizeeq, E.; Tilev, S.; Al Alaween, M.; Suleiman, W.; Al Remeithi, A.M.; Al Tamimi, M.K.; Al Alawneh, M. Assessment of groundwater quality for irrigation in the arid regions using irrigation water quality index (IWQI) and GIS-Zoning maps: Case study from Abu Dhabi Emirate, UAE. Groundw. Sustain. Dev. 2021, 14, 100611. [Google Scholar] [CrossRef]
- M’nassri, S.; El Amri, A.; Nasri, N.; Majdoub, R. Estimation of irrigation water quality index in a semi-arid environment using data-driven approach. Water Supply 2022, 22, 5161–5175. [Google Scholar] [CrossRef]
- Gad, M.; Saleh, A.H.; Hussein, H.; Elsayed, S.; Farouk, M. Water quality evaluation and prediction using irrigation indices, artificial neural networks, and partial least square regression models for the Nile River, Egypt. Water 2023, 15, 2244. [Google Scholar] [CrossRef]
- Anyango, G.W.; Bhowmick, G.D.; Bhattacharya, N.S. A Critical Review of Irrigation Water Quality Index and Water Quality Management Practices in Micro-Irrigation for Efficient Policy Making. Desalination Water Treat. 2024, 318, 100304. [Google Scholar] [CrossRef]
- Meireles, A.C.M.; Andrade, E.M.D.; Chaves, L.C.G.; Frischkorn, H.; Crisostomo, L.A. A new proposal of the classification of irrigation water. Rev. Cienc. Agron. 2010, 41, 349–357. [Google Scholar] [CrossRef]
- Ayers, R.S.; Westcot, D.W. Water Quality for Agriculture; Food and Agriculture Organization of the United Nation: Rome, Italy, 1985; Volume 29. [Google Scholar]
- Cotruvo, J.A. WHO guidelines for drinking water quality: First addendum to the fourth edition. J. Am. Water Work. Assoc. 2017, 109, 44–51. [Google Scholar] [CrossRef]
- Singaraja, C.; Chidambaram, S.; Anandhan, P.; Thivya, C.; Thilagavathi, R.; Sarathidasan, J. Hydrochemistry of groundwater in a coastal region and its repercussion on quality, a case study—Thoothukudi district, Tamil Nadu, India. Arab. J. Geosci. 2014, 7, 939–950. [Google Scholar] [CrossRef]
- Siddique, J.; Menggui, J.; Shah, M.H.; Shahab, A.; Rehman, F.; Rasool, U. Integrated approach to hydrogeochemical appraisal and quality assessment of groundwater from Sargodha District, Pakistan. Geofluids 2020, 1, 6621038. [Google Scholar] [CrossRef]
- Water Services Regulatory Board. Drinking Water Quality and Effluent Monitoring Guideline; Water Services Regulatory Board: Nairobi, Kenya, 2016; Available online: https://wasreb.go.ke/wp-content/uploads/2023/08/Drinking-Water-Guidelines-gwqem_Edited.pdf (accessed on 8 February 2025).
- Drechsel, P.; Marjani Zadeh, S.; Pedrero, F. Water Quality in Agriculture: Risks and Risk Mitigation; FAO & IWMI: Italy, Rome, 2023. [Google Scholar] [CrossRef]
- Olago, D.O. Constraints and solutions for groundwater development, supply and governance in urban areas in Kenya. Hydrogeol. J. 2019, 27, 1031–1050. [Google Scholar] [CrossRef]
- Kenya National Bureau of Statistics. 2019 Kenya Population and Housing Census: Analytical Report on Population Projections (Volume XVI); National Bureau of Statistics: Nairobi, Kenya, 2022. Available online: https://www.knbs.or.ke/wp-content/uploads/2023/09/2019-Kenya-population-and-Housing-Census-Analytical-Report-on-Population-Projections.pdf (accessed on 10 March 2025).
- Osman, A.D. Groundwater Quality in Wajir (Kenya) Shallow Aquifer: An Examination of the Association Between Water Quality and Water-Borne Diseases in Children. Ph. D. Thesis, La Trobe University, Melbourne, Australia, 2012. Available online: https://opal.latrobe.edu.au/articles/thesis/Groundwater_quality_in_Wajir_Kenya_shallow_aquifer_an_examination_of_the_association_between_water_quality_and_water-borne_diseases_in_children/21845703?file=38768880 (accessed on 12 May 2024).
- Okello, C.; Tomasello, B.; Greggio, N.; Wambiji, N.; Antonellini, M. Impact of Population Growth and Climate Change on the Freshwater Resources of Lamu Island, Kenya. Water 2015, 7, 1264–1290. [Google Scholar] [CrossRef]
- Li, P.; Wu, J.; Qian, H. Hydrochemical appraisal of groundwater quality for drinking and irrigation purposes and the major influencing factors: A case study in and around Hua County, China. Arab. J. Geosci. 2016, 9, 15. [Google Scholar] [CrossRef]
- Nyoro, J.K. Agriculture and Rural Growth in Kenya; Tegemeo Institute: Nairobi, Kenya, 2019. [Google Scholar]
- D’Alessandro, S.; Caballero, J.; Simpkin, S.; Lichte, J. Kenya Agricultural Risk Assessment; World Bank Group: Washington, DC, USA, 2015; Available online: https://bit.ly/2RnCyhP (accessed on 4 March 2024).
- Ericksen, P.J.; Said, M.Y.; Leeuw, J.D.; Silvestri, S.; Zaibet, L.; Kifugo, S.C.; Sijmons, K.; Kinoti, J.; Ng’ang’a, L.; Landsberg, F.; et al. Mapping and Valuing Ecosystem Services in the EWASO Ng’iro Ng’iro Watershed; ILRI: Nairobi, Kenya, 2011; Available online: https://hdl.handle.net/10568/12483 (accessed on 12 June 2020).
- Rakotoarisoa, M.; Massawe, S.C.; Mude, A.G.; Ouma, R.; Freeman, H.A.; Bahiigwa, G.; Karugia, J.T. Investment Opportunities for Livestock in the North Eastern Province of Kenya: A Synthesis of Existing Knowledge; IFPRI: Washington, DC, USA, 2008; Available online: https://hdl.handle.net/10568/187 (accessed on 4 March 2024).
- Muya, E.M.; Obanyi, S.; Ngutu, M.; Sijali, I.V.; Okoti, M.; Maingi, P.M.; Bulle, H. The Physical and Chemical Characteristics of Soils of Northern Kenya Aridlands: Opportunity for Sustainable Agricultural Production. J. Soil Sci. Environ. Manag. 2011, 2, 1–8. Available online: http://www.academicjournals.org/JSSEM (accessed on 4 March 2024).
- Turman-Bryant, N.; Nagel, C.; Stover, L.; Muragijimana, C.; Thomas, E.A. Improved Drought Resilience Through Continuous Water Service Monitoring and Specialized Institutions—A Longitudinal Analysis of Water Service Delivery Across Motorized Boreholes in Northern Kenya. Sustainability 2019, 11, 3046. [Google Scholar] [CrossRef]
- Thomas, E.A.; Needoba, J.; Kaberia, D.; Butterworth, J.; Adams, E.C.; Oduor, P.; Macharia, D.; Mitheu, F.; Mugo, R.; Nagel, C. Quantifying increased groundwater demand from prolonged drought in the East African Rift Valley. Sci. Total Environ. 2019, 666, 1265–1272. [Google Scholar] [CrossRef] [PubMed]
- Aghazadeh, N.; Chitsazan, M.; Golestan, Y. Hydrochemistry and quality assessment of groundwater in the Ardabil area, Iran. Appl. Water Sci. 2017, 7, 3599–3616. [Google Scholar] [CrossRef]
- Swarzenski, W.V.; Mundorff, M.J. Geohydrology of North Eastern Province, Kenya; USGS Water Supply Paper, 1757-N; USGS Publications Warehouse: Reston, VA, USA, 1977; p. 73. [Google Scholar]
- Mwango, F.K.; Muhangú, B.C.; Juma, C.O.; Githae, I.T. Groundwater resources in Kenya. In Managing Shared Aquifer Resources in Africa; ISARM-AFRICA: Tripoli, Libya, 2002; pp. 93–100. [Google Scholar]
- GIBB (Eastern Africa) Ltd. Study of the Merti Aquifer; Technical Report Issue 2.0; UNICEF Kenya Country Office: Nairobi, Kenya, 2004; p. 143. [Google Scholar]
- Mumma, A.; Lane, M.; Kairu, E.; Tuinhof, A.; Hirji, R. Kenya Groundwater Governance; Case Study Report; World Bank: Washington, DC, USA, 2011. [Google Scholar]
- Kuria, D.N.; Kamunge, H.N. Merti Aquifer Recharge Zones Determination Using Geospatial Technologies; Dedan Kimathi University of Technology: Nyeri, Kenya, 2013. [Google Scholar]
- Earth Water Ltd. Phase 1—Aquifer Monitoring. Merti Aquifer Study; EarthWater Ltd.: Nairobi, Kenya, 2012. [Google Scholar]
- IGAD Design and Development of a Data System for the Application of Managed Aquifer Recharge (MAR) in the Merti Aquifer. Technical Report Inland Water Resources Management Programme. 2015. Available online: https://www.un-igrac.org/special-project/igad-mar (accessed on 16 May 2022).
- Blandenier, L. Recharge Quantification and Continental Freshwater Lens Dynamics in Arid Regions: Application to the Merti aquifer (Eastern Kenya). Ph.D. Thesis, University of Neuchâtel, Neuchâtel, Switzerland, 2015. [Google Scholar]
- Krhoda, G.; Amimo, M.O. Groundwater quality prediction using logistic regression model for Garissa county. Afr. J. Phys. Sci. 2019, 3, 13–27. [Google Scholar]
- Luedeling, E.; Arjen, L.O.; Boniface, K.; Sarah, O.; Maimbo, M.; Keith, D.S. Fresh groundwater for Wajir—Ex-ante assessment of uncertain benefits for multiple stakeholders in a water supply project in Northern Kenya. Front. Environ. Sci. 2015, 3, 18. [Google Scholar] [CrossRef]
- Githinji, T.W.; Dindi, E.W.; Kuria, Z.N.; Olago, D.O. Application of analytical hierarchy process and integrated fuzzy-analytical hierarchy process for mapping potential groundwater recharge zone using GIS in the arid areas of Ewaso Ng’iro–Lagh Dera Basin, Kenya. HydroResearch 2022, 5, 22–34. [Google Scholar] [CrossRef]
- Sklash, M.G.; Mwangi, M.P. An Isotopic Study of Groundwater Supplies in the Eastern Province of Kenya. J. Hydrol. 1991, 128, 257–275. [Google Scholar] [CrossRef]
- Lane, I.M. A Preliminary Assessment of the Hydrogeology and Hydrochemistry of the Merti Aquifer (North Eastern Province, Kenya: And Lower Juba. Somalia. Unpublished Thesis, University College London, London, UK, 1995. [Google Scholar]
- Gachanja, A.; Tole, M. Management of Ground Water Resources of The MertiAquifer Preliminary Report; Ministry of Environment and Natural resources, Department of Water: Nairobi, Kenya, 2002.
- Reeves, C.V.; Karanja, F.M.; MacLeod, I.N. Geophysical evidence for a failed Jurassic rift and triple junction in Kenya. Earth Planet. Sci. Lett. 1987, 81, 299–311. [Google Scholar] [CrossRef]
- Greene, L.C.; Richards, D.R.; Johnson, R.A. Crustal structure and tectonic evolution of the Anza rift, northern Kenya. Tectonophysics 1991, 197, 203–211. [Google Scholar] [CrossRef]
- Bosworth, W. Mesozoic and early tertiary rift tectonics in East Africa. Seismology and relate sciences in East Africa. Tectonophysics 1992, 209, 115–137. [Google Scholar] [CrossRef]
- Bosworth, W.; Morley, C.K. Structural and stratigraphic evolution of the Anza rift, Kenya. Tectonophysics 1994, 236, 93–115. [Google Scholar] [CrossRef]
- Matheson, F.J. Geology of the Garbatula Area, (Degree Sheet 37, NE); Geological Survey of Kenya: Nairobi, Kenya, 1971. [Google Scholar]
- Dindi, E.W. Crustal structure of the Anza graben from gravity and magnetic investigations. Tectonophysics 1994, 236, 359–371. [Google Scholar] [CrossRef]
- National Oil Corporation Kenya (NOCK). Geological Map of Kenya with Bouguer Gravity Contours; Ministry of Energy and Regional Development: Nairobi, Kenya, 1987.
- APHA. Standard Methods for the Examination of Water and Wastewater, 20th ed.; APHA: Washington, DC, USA, 1998. [Google Scholar]
- ISO 11885:2007; Water Quality–Determination of Selected Elements by Inductively Coupled Plasma Optical Emission Spectrometry (ICP-OES), 2nd ed. International Organization for Standardization: Geneva, Switzerland, 2007; p. 28.
- Roy, A.; Keesari, T.; Mohokar, H.; Pant, D.; Sinha, U.K.; Mendhekar, G.N. Geochemical evolution of groundwater in hard-rock aquifers of South India using statistical and modelling techniques. Hydrol. Sci. J. 2020, 65, 951–968. [Google Scholar] [CrossRef]
- El Baba, M.; Kayastha, P.; Huysmans, M.; De Smedt, F. Evaluation of the Groundwater Quality Using the Water Quality Index and Geostatistical Analysis in the Dier al-Balah Governorate, Gaza Strip, Palestine. Water 2020, 12, 262. [Google Scholar] [CrossRef]
- Piper, A.M. A graphic procedure in the geochemical interpretation of water-analyses. Trans. Am. Geophys. Union 1944, 25, 914–928. [Google Scholar] [CrossRef]
- Abidi, H.J.; Farhat, B.; Ben Mammou, A.; Oueslati, N. Characterization of recharge mechanisms and sources of groundwater salinization in Ras Jbel coastal aquifer (Northeast Tunisia) using hydrogeochemical tools, environmental isotopes, GIS, and statistics. J. Chem. 2017, 2017, 8610894. [Google Scholar] [CrossRef]
- Tiwari, A.K.; Singh, A.K. Hydrogeochemical investigation and groundwater quality assessment of Pratapgarh district, Uttar Pradesh. J. Geol. Soc. India 2014, 83, 329–343. [Google Scholar] [CrossRef]
- Appelo, C.A.J.; Postma, D. Geochemistry, Groundwater & Pollution; Balkema: Rotterdam, The Netherlands, 1996. [Google Scholar]
- Sandilands, D. Bivariate Analysis. In Encyclopedia of Quality of Life and Well-Being Research; Michalos, A.C., Ed.; Springer: Dordrecht, The Netherlands, 2014. [Google Scholar] [CrossRef]
- Trauth, M.H. Bivariate Statistics. In MATLAB® Recipes for Earth Sciences; Springer: Berlin/Heidelberg, Germany, 2015. [Google Scholar] [CrossRef]
- Abdelshafy, M.; Saber, M.; Abdelhaleem, A.; Abdelrazek, S.M.; Seleem, E.M. Hydrogeochemical processes and evaluation of groundwater aquifer at Sohag city, Egypt. Sci. Afr. 2019, 6, e00196. [Google Scholar] [CrossRef]
- Rajmohan, N.; Senthilkumar, M.; Alqarawy, A.M. Hydrogeochemistry and its relationship with land use pattern and monsoon in hard rock aquifer. Appl. Water Sci. 2025, 15, 57. [Google Scholar] [CrossRef]
- Abdessamed, D.; Jodar-Abellan, A.; Ghoneim, S.S.M.; Almaliki, A.; Hussein, E.E.; Pardo, M.Á. Groundwater quality assessment for sustainable human consumption in arid areas based on GIS and water quality index in the watershed of Ain Sefra (SW of Algeria). Environ. Earth Sci. 2023, 82, 510. [Google Scholar] [CrossRef]
- Darwish, M.H.; Megahed, H.A.; Sayed, A.G.; Abdalla, O.; Scopa, A.; Hassan, S.H.A. Hydro-Geochemistry and Water Quality Index Assessment in the Dakhla Oasis, Egypt. Hydrology 2024, 11, 160. [Google Scholar] [CrossRef]
- Chaurasia, A.K.; Pandey, H.K.; Tiwari, S.K.; Prakash, R.; Pandey, P.; Ram, A. Groundwater quality assessment using Water Quality Index (WQI) in parts of Varanasi District, Uttar Pradesh, India. J. Geol. Soc. India 2018, 92, 76–82. [Google Scholar] [CrossRef]
- Tejashvini, A.; Subbarayappa, C.T.; Mudalagiriyappa; Chowdappa, H.D.; Ramamurthy, V. Assessment of irrigation water quality for groundwater in Semi-Arid Region, Bangalore, Karnataka. Water Sci. 2024, 38, 548–568. [Google Scholar] [CrossRef]
- Mondal, N.C.; Singh, V.S.; Rangarajan, R. Aquifer characteristics and its modeling around an industrial complex, Tuticorin, Tamil Nadu, India: A case study. J. Earth Syst. Sci. 2009, 118, 231–244. [Google Scholar] [CrossRef]
- Appelo, C.A.J.; Postma, D. Geochemistry, Groundwater and Pollution, 2nd ed.; Balkema publishers: Leiden, The Netherlands, 2005; p. 683. [Google Scholar]
- Schoeller, H. Geochemistry of groundwater. In Groundwaterstudies—An International Guide for Research and Practice; UNESCO: Paris, France, 1977; Chapter 15; pp. 1–18. [Google Scholar]
- Schoeller, H. Hydrodynamique Lans Lekarst (Ecoulemented Emmagusinement); Actes Colloques Doubronik, I, AIHS et UNESCO: Paris, France, 1965; pp. 3–20. Available online: https://digitalcommons.usf.edu/kip_articles/8272 (accessed on 14 March 2024).
- García, G.M.; Hidalgo, M.d.V.; Blesa, M.A. Geochemistry of groundwater in the alluvial plain of Tucuman province, Argentina. Hydrogeol. J. 2001, 9, 597–610. [Google Scholar] [CrossRef]
- Rogers, R.J. Geochemical comparison of groundwater in areas of New England, New York, and Pennsylvania. Groundwater 1989, 27, 690–712. [Google Scholar] [CrossRef]
- Oord, A.; Collenteur, R.; Tolk, L. Hydrogeological Assessment of the Merti Aquifer, Kenya. Technical Report. Acacia Water 2014. Available online: https://www.worldagroforestry.org/sites/default/files/TR1%20ARIGA-%20Hydrological%20Assessment%20of%20the%20Merti%20Aquifer%20Kenya.pdf (accessed on 3 August 2021).
- Chebotarev, I.I. Metamorphism of natural waters in the crust of weathering—2. Geochem. Cosmochim. Acta 1955, 8, 137–170. [Google Scholar] [CrossRef]
- Moujabber, M.E.; Samra, B.B.; Darwish, T.; Atallah, T. Comparison of different indicators for groundwater contamination by seawater intrusion on the Lebanese coast. Water Resour. Manag. 2006, 20, 161–180. [Google Scholar] [CrossRef]
- Sudaryanto and Wilda Naily. Ratio of Major Ions in Groundwater to Determine Saltwater Intrusion in Coastal Areas. IOP Conf. Ser. Earth Environ. Sci. 2018, 118, 012021. [Google Scholar] [CrossRef]
- Chidambaram, S.; Sarathidasan, J.; Srinivasamoorthy, K.; Thivya, C.; Thilagavathi, R.; Prasanna, M.V.; Singaraja, C.; Nepolian, M. Assessment of hydrogeochemical status of groundwater in a coastal region of Southeast coast of India. Appl. Water Sci. 2018, 8, 27. [Google Scholar] [CrossRef]
- Saha, S.; Reza, A.H.M.S.; Roy, M.K. Hydrochemical evaluation of groundwater quality of the Tista floodplain, Rangpur, Bangladesh. Appl. Water Sci. 2019, 9, 198. [Google Scholar] [CrossRef]
- Bhardwaj, V.; Singh, D.S. Surface and groundwater quality characterization of Deoria district, Ganga plain, India. Environ. Earth Sci. 2011, 63, 383–395. [Google Scholar] [CrossRef]
- Richards, L.A. Diagnosis and Improvement of Saline and Alkali Soils; US Government Printing Office: Philadelphia, PA, USA, 1954; Volume 78.
- Wilcox, L.V. Classification and Use of Irrigation Water (Circular 969); USDA: Washington, DC, USA, 1995; Available online: https://dn720401.ca.archive.org/0/items/classificationus969wilc/classificationus969wilc.pdf (accessed on 6 October 2024).
- Krhoda, G.O. Groundwater Assessment in Sedimentary Basins of Eastern Kenya, Africa. In Regional Characterization of Water Quality, Proceedings of the a Symposium During the Third Scientific Assembly of the International Association of Hydrological Sciences, Baltimore, MD, USA, 17–18 May 1989; International Association of Hydrological Sciences: Wallingford, UK, 1989; pp. 111–124. [Google Scholar]
- Sidibe, A.M.; Lin, X.; Koné, S. Assessing groundwater mineralization process, quality, and isotopic recharge origin in the Sahel Region in Africa. Water 2019, 11, 789. [Google Scholar] [CrossRef]
- Seibert, S.; Atteia, O.; Ursula Salmon, S.; Siade, A.; Douglas, G.; Prommer, H. Identification and quantification of redox and pH buffering processes in a heterogeneous, low carbonate aquifer during managed aquifer recharge. Water Resour. Res. 2016, 52, 4003–4025. [Google Scholar] [CrossRef]
- Raju, N.J. Hydrogeochemical parameters for assessment of groundwater quality in the upper Gunjanaeru River basin, Cuddapah District, Andhra Pradesh, South India. Environ. Geol. 2007, 52, 1067–1074. [Google Scholar] [CrossRef]
- Mohammed-Aslam, M.A.; Rizvi, S.S. Hydrogeochemical characterisation and appraisal of groundwater suitability for domestic and irrigational purposes in a semi-arid region, Karnataka state, India. Appl. Water Sci. 2020, 10, 237. [Google Scholar] [CrossRef]


| Parameter | Weight (wi) |
|---|---|
| EC | 0.211 |
| Na+ | 0.204 |
| HCO3− | 0.202 |
| Cl− | 0.194 |
| SAR | 0.189 |
| Total | 1 |
| HCO3− (meq/L) | Cl− (meq/L) | Na+ (meq/L) | SAR (meq/L) 0.5 | EC (μS/cm) | Qi |
|---|---|---|---|---|---|
| 1 ≤ HCO3− <1.5 | 1 ≤ Cl− < 4 | 2 ≤ Na+ < 3 | 2 ≤ SAR < 3 | 200 ≤ EC < 750 | 85–100 |
| 1.5 ≤ HCO3− < 4.5 | 4 ≤ Cl− < 7 | 3 ≤ Na+ < 6 | 3 ≤ SAR < 6 | 750 ≤ EC < 1500 | 60–85 |
| 4.5 ≤ HCO3− < 8.5 | 7 ≤ Cl− < 10 | 6 ≤ Na+ < 9 | 6 ≤ SAR < 12 | 1500 ≤ EC < 3000 | 35–60 |
| HCO3− < 1 or HCO3− ≥ 8.5 | 1 < Cl− ≥ 10 | Na+ < 2 or Na+ ≥ 9 | 2 < SAR ≥ 12 | EC > 200 or EC ≥ 3000 | 0–35 |
| Parameter | Units | Min | Max | Median | Average | Maximum Allowable Limit (WHO 2017) | Maximum Allowable Limit (WASREB-KENYA 2016) | Percentage Number of Samples Above the WHO Acceptable Limit |
|---|---|---|---|---|---|---|---|---|
| pH | - | 7.1 | 8.9 | 7.7 | 7.9 | 8.5 | 8.5 | 13.3 |
| EC | μS/cm | 419.8 | 18,000.0 | 1232.2 | 1937.0 | 1500 | 1500 | 36.0 |
| TDS | mg/L | 313.8 | 8366.0 | 912.0 | 1422.9 | 1000 | 1500 | 25.4 |
| HCO3− | mg/L | 109.2 | 4979.2 | 560.5 | 767.7 | 300 | 500 | 85.3 |
| Cl− | mg/L | 2.0 | 4300.0 | 60.0 | 217.1 | 600 | 250 | 5.3 |
| SO42− | mg/L | 3.0 | 1230.0 | 35.3 | 89.5 | 400 | 400 | 5.3 |
| NO3− | mg/L | 0 | 129.9 | 1.1 | 5.5 | 50 | 10 | 1.4 |
| Na+ | mg/L | 10.4 | 3410.0 | 221.0 | 416.9 | 200 | 200 | 49.3 |
| K+ | mg/L | 2.0 | 83.0 | 11.0 | 12.7 | 20 | 20 | 10.7 |
| Ca2+ | mg/L | 2.8 | 233.0 | 20.0 | 26.5 | 200 | 250 | 2.7 |
| Mg2+ | mg/L | 1.0 | 151.0 | 11.1 | 18.2 | 150 | 100 | 2.7 |
| TH | mg/L | 11.6 | 1125.4 | 11.6 | 120.7 | 500 | 500 | 1.4 |
| SI Calcite | mg/L | −0.4 | 1.6 | 0.4 | 0.4 | N/A | N/A | N/A |
| SI dolomite | mg/L | −1.0 | 3.2 | 0.9 | 0.9 | N/A | N/A | N/A |
| SI aragonite | mg/L | −0.5 | 1.4 | 0.3 | 0.3 | N/A | N/A | N/A |
| SI Anhydrite | mg/L | −3.9 | −1.8 | −2.9 | −2.9 | N/A | N/A | N/A |
| SI gypsum | mg/L | −3.7 | −1.6 | −2.7 | −2.7 | N/A | N/A | N/A |
| SI Halite | mg/L | −8.8 | −4.4 | −6.9 | −6.9 | N/A | N/A | N/A |
| Na+/Cl− ratio | 1.0 | 306.6 | 5.6 | 22.7 | N/A | N/A | N/A | |
| CAI 1 | −306.7 | −0.01 | −4.9 | −22.2 | N/A | N/A | N/A | |
| CAI 2 | −1.7 | −0.06 | −0.7 | −0.7 | N/A | N/A | N/A |
| Variables | EC | TDS | Cl− | SO4− | NO3− | HCO3− | Na+ | K+ | Ca2+ | Mg2+ | pH |
|---|---|---|---|---|---|---|---|---|---|---|---|
| EC | 1 | 0.96 | 0.76 | 0.78 | −0.05 | 0.60 | 0.93 | 0.14 | −0.05 | −0.02 | 0.14 |
| TDS | 0.96 | 1 | 0.66 | 0.83 | −0.06 | 0.77 | 0.93 | 0.143 | −0.08 | −0.06 | 0.19 |
| Cl− | 0.76 | 0.66 | 1 | 0.80 | 0.33 | 0.15 | 0.86 | 0.20 | 0.31 | 0.26 | −0.01 |
| SO42− | 0.78 | 0.83 | 0.80 | 1 | 0.17 | 0.51 | 0.90 | 0.22 | 0.11 | 0.08 | 0.09 |
| NO3− | −0.05 | −0.06 | 0.33 | 0.17 | 1 | −0.11 | 0.17 | 0.12 | 0.56 | 0.42 | −0.03 |
| HCO3− | 0.60 | 0.77 | 0.15 | 0.51 | −0.11 | 1 | 0.63 | 0.05 | −0.13 | −0.13 | 0.31 |
| Na+ | 0.93 | 0.93 | 0.86 | 0.90 | 0.17 | 0.63 | 1 | 0.13 | 0.098 | 0.06 | 0.17 |
| K+ | 0.14 | 0.14 | 0.20 | 0.22 | 0.12 | 0.05 | 0.13 | 1 | 0.41 | 0.61 | −0.20 |
| Ca2+ | −0.05 | −0.08 | 0.31 | 0.11 | 0.56 | −0.13 | 0.10 | 0.41 | 1 | 0.66 | −0.25 |
| Mg2+ | −0.02 | −0.06 | 0.26 | 0.08 | 0.42 | −0.13 | 0.06 | 0.61 | 0.66 | 1 | −0.19 |
| pH | 0.14 | 0.20 | −0.01 | 0.09 | −0.03 | 0.31 | 0.17 | −0.20 | −0.25 | −0.19 | 1 |
| Classification Scheme | Categories | Ranges | Percent of Samples |
|---|---|---|---|
| Cl−/HCO3− | good quality | <0.5 | 81.4 |
| slightly contaminated | 0.5–1.3 | 11.6 | |
| moderately contaminated | 1.3–2.8 | 5.4 | |
| highly contaminated | 2.8–6.6 | 0.7 | |
| extremely contaminated | 6.6–15.5 | 0.9 |
| Variable | Factor Loadings | ||
|---|---|---|---|
| F1 | F2 | F3 | |
| EC | 0.879 | 0.027 | 0.009 |
| TDS | 0.908 | 0.052 | 0.015 |
| Cl− | 0.683 | 0.087 | 0.032 |
| SO42− | 0.838 | 0.002 | 0.001 |
| NO3− | 0.021 | 0.410 | 0.390 |
| HCO3− | 0.434 | 0.130 | 0.018 |
| Na+ | 0.974 | 0.001 | 0.007 |
| K+ | 0.054 | 0.364 | 0.327 |
| Ca2+ | 0.014 | 0.724 | 0.017 |
| Mg2+ | 0.013 | 0.713 | 0.018 |
| pH | 0.030 | 0.171 | 0.227 |
| Eigenvalue | 4.847 | 2.682 | 1.060 |
| Variability (%) | 44.062 | 24.380 | 9.634 |
| Cumulative % | 44.062 | 68.442 | 78.077 |
| WQI | Rating Class | Percent of Samples |
|---|---|---|
| <50 | Excellent | 20.31 |
| 50–100 | Good | 60.16 |
| 100–200 | Poor | 13.27 |
| 200–300 | Very poor | 3.13 |
| >300 | Unsuitable | 3.13 |
| Classification Scheme | Categories | Ranges | Percent of Samples |
|---|---|---|---|
| SAR (Richards 1954) | Excellent | <10 | 39.54 |
| Good | 10–18 | 17.83 | |
| Doubtful | 18–26 | 9.30 | |
| Unsuitable | >26 | 33.33 |
| Water Use Restrictions | IWQI | Percent of Samples |
|---|---|---|
| No restriction (NR) | 85–100 | 0 |
| Low restriction (LR) | 70–85 | 0 |
| Moderate restriction (MR) | 55–70 | 12.4 |
| High restriction (HR) | 40–55 | 45.7 |
| Severe restriction (SR) | 0–40 | 41.9 |
Disclaimer/Publisher’s Note: The statements, opinions and data contained in all publications are solely those of the individual author(s) and contributor(s) and not of MDPI and/or the editor(s). MDPI and/or the editor(s) disclaim responsibility for any injury to people or property resulting from any ideas, methods, instructions or products referred to in the content. |
© 2025 by the authors. Licensee MDPI, Basel, Switzerland. This article is an open access article distributed under the terms and conditions of the Creative Commons Attribution (CC BY) license (https://creativecommons.org/licenses/by/4.0/).
Share and Cite
Wambui, G.T.; Wandubi, D.E.; Njuguna, K.Z.; Ochieng, O.D.; Muchori, G.C. Hydrogeochemical Characterization and Water Quality Index-Based Evaluation of Groundwater for Drinking, Livestock, and Irrigation Use in the Arid Ewaso Ng’iro–Lagh Dera Basin, Kenya. Hydrology 2025, 12, 160. https://doi.org/10.3390/hydrology12070160
Wambui GT, Wandubi DE, Njuguna KZ, Ochieng OD, Muchori GC. Hydrogeochemical Characterization and Water Quality Index-Based Evaluation of Groundwater for Drinking, Livestock, and Irrigation Use in the Arid Ewaso Ng’iro–Lagh Dera Basin, Kenya. Hydrology. 2025; 12(7):160. https://doi.org/10.3390/hydrology12070160
Chicago/Turabian StyleWambui, Githinji Tabitha, Dindi Edwin Wandubi, Kuria Zacharia Njuguna, Olago Daniel Ochieng, and Gicheruh Chrysanthus Muchori. 2025. "Hydrogeochemical Characterization and Water Quality Index-Based Evaluation of Groundwater for Drinking, Livestock, and Irrigation Use in the Arid Ewaso Ng’iro–Lagh Dera Basin, Kenya" Hydrology 12, no. 7: 160. https://doi.org/10.3390/hydrology12070160
APA StyleWambui, G. T., Wandubi, D. E., Njuguna, K. Z., Ochieng, O. D., & Muchori, G. C. (2025). Hydrogeochemical Characterization and Water Quality Index-Based Evaluation of Groundwater for Drinking, Livestock, and Irrigation Use in the Arid Ewaso Ng’iro–Lagh Dera Basin, Kenya. Hydrology, 12(7), 160. https://doi.org/10.3390/hydrology12070160