
Addressing Weather Data Gaps in Reference Crop Evapotranspiration Estimation: A Case Study in Guinea-Bissau, West Africa

 ,
,  , , ,
, , ,  ,
,  and
and 
Abstract
1. Introduction
2. Materials and Methods
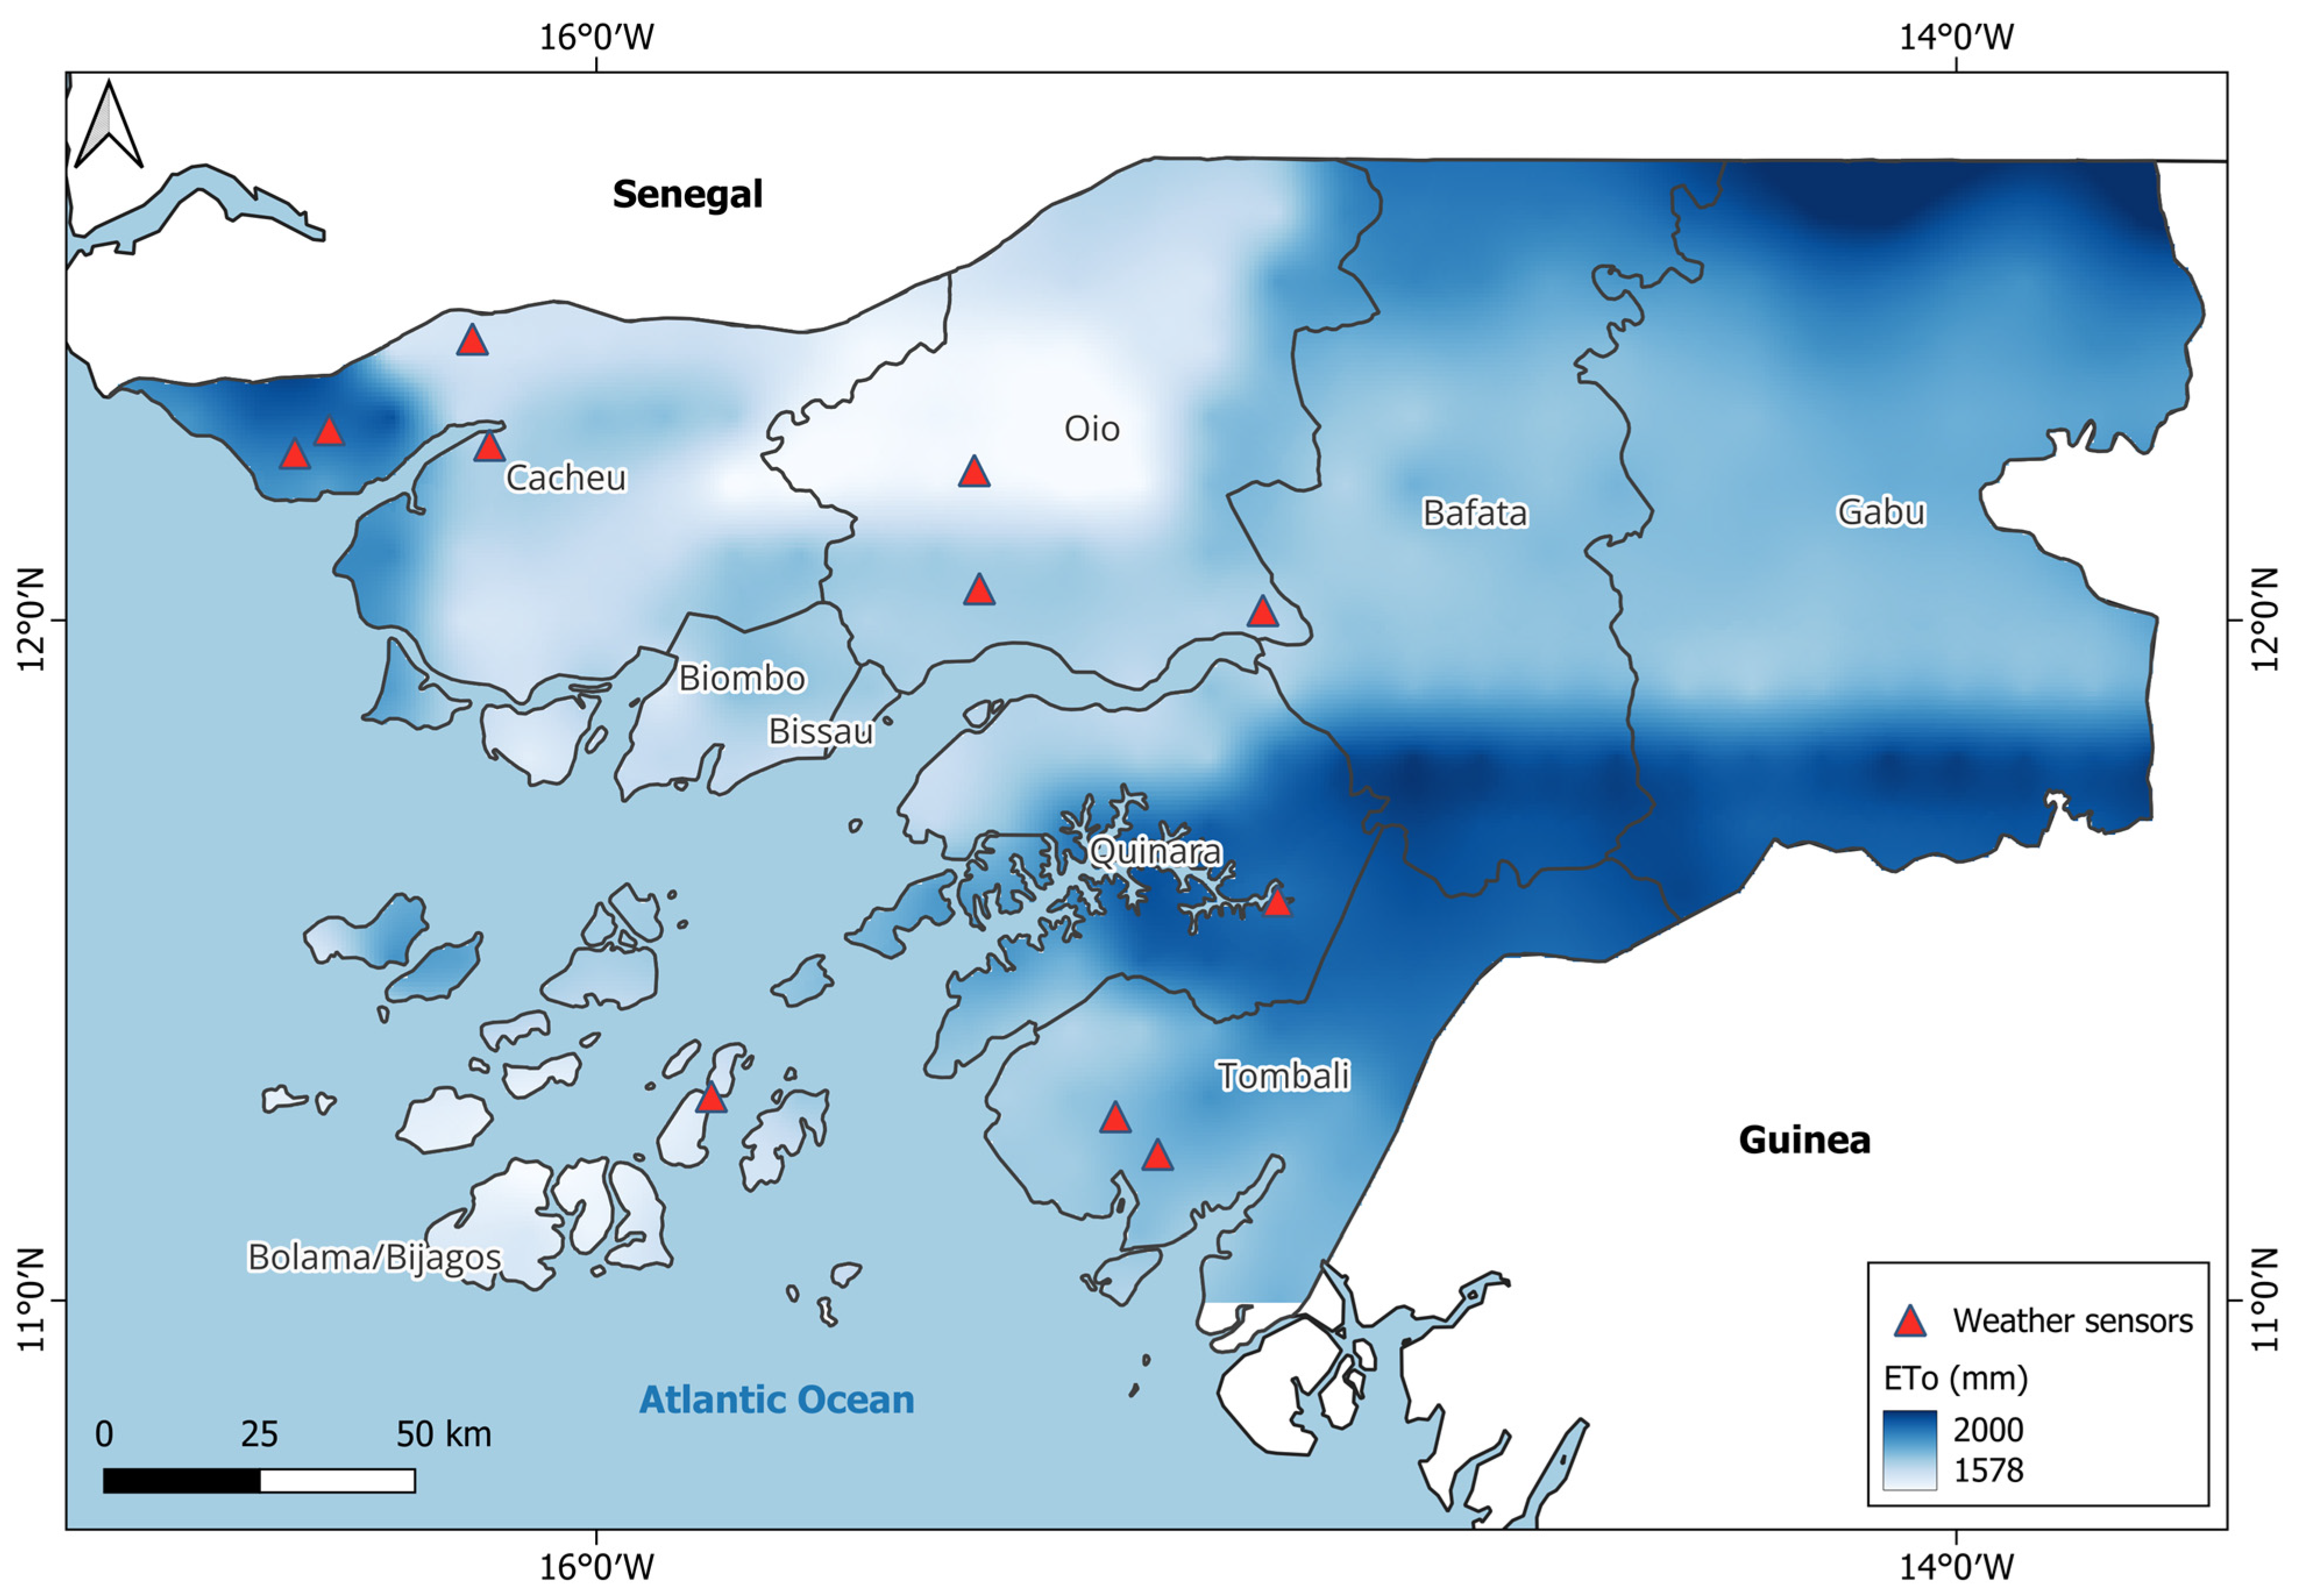
2.1. Climate
2.2. Data
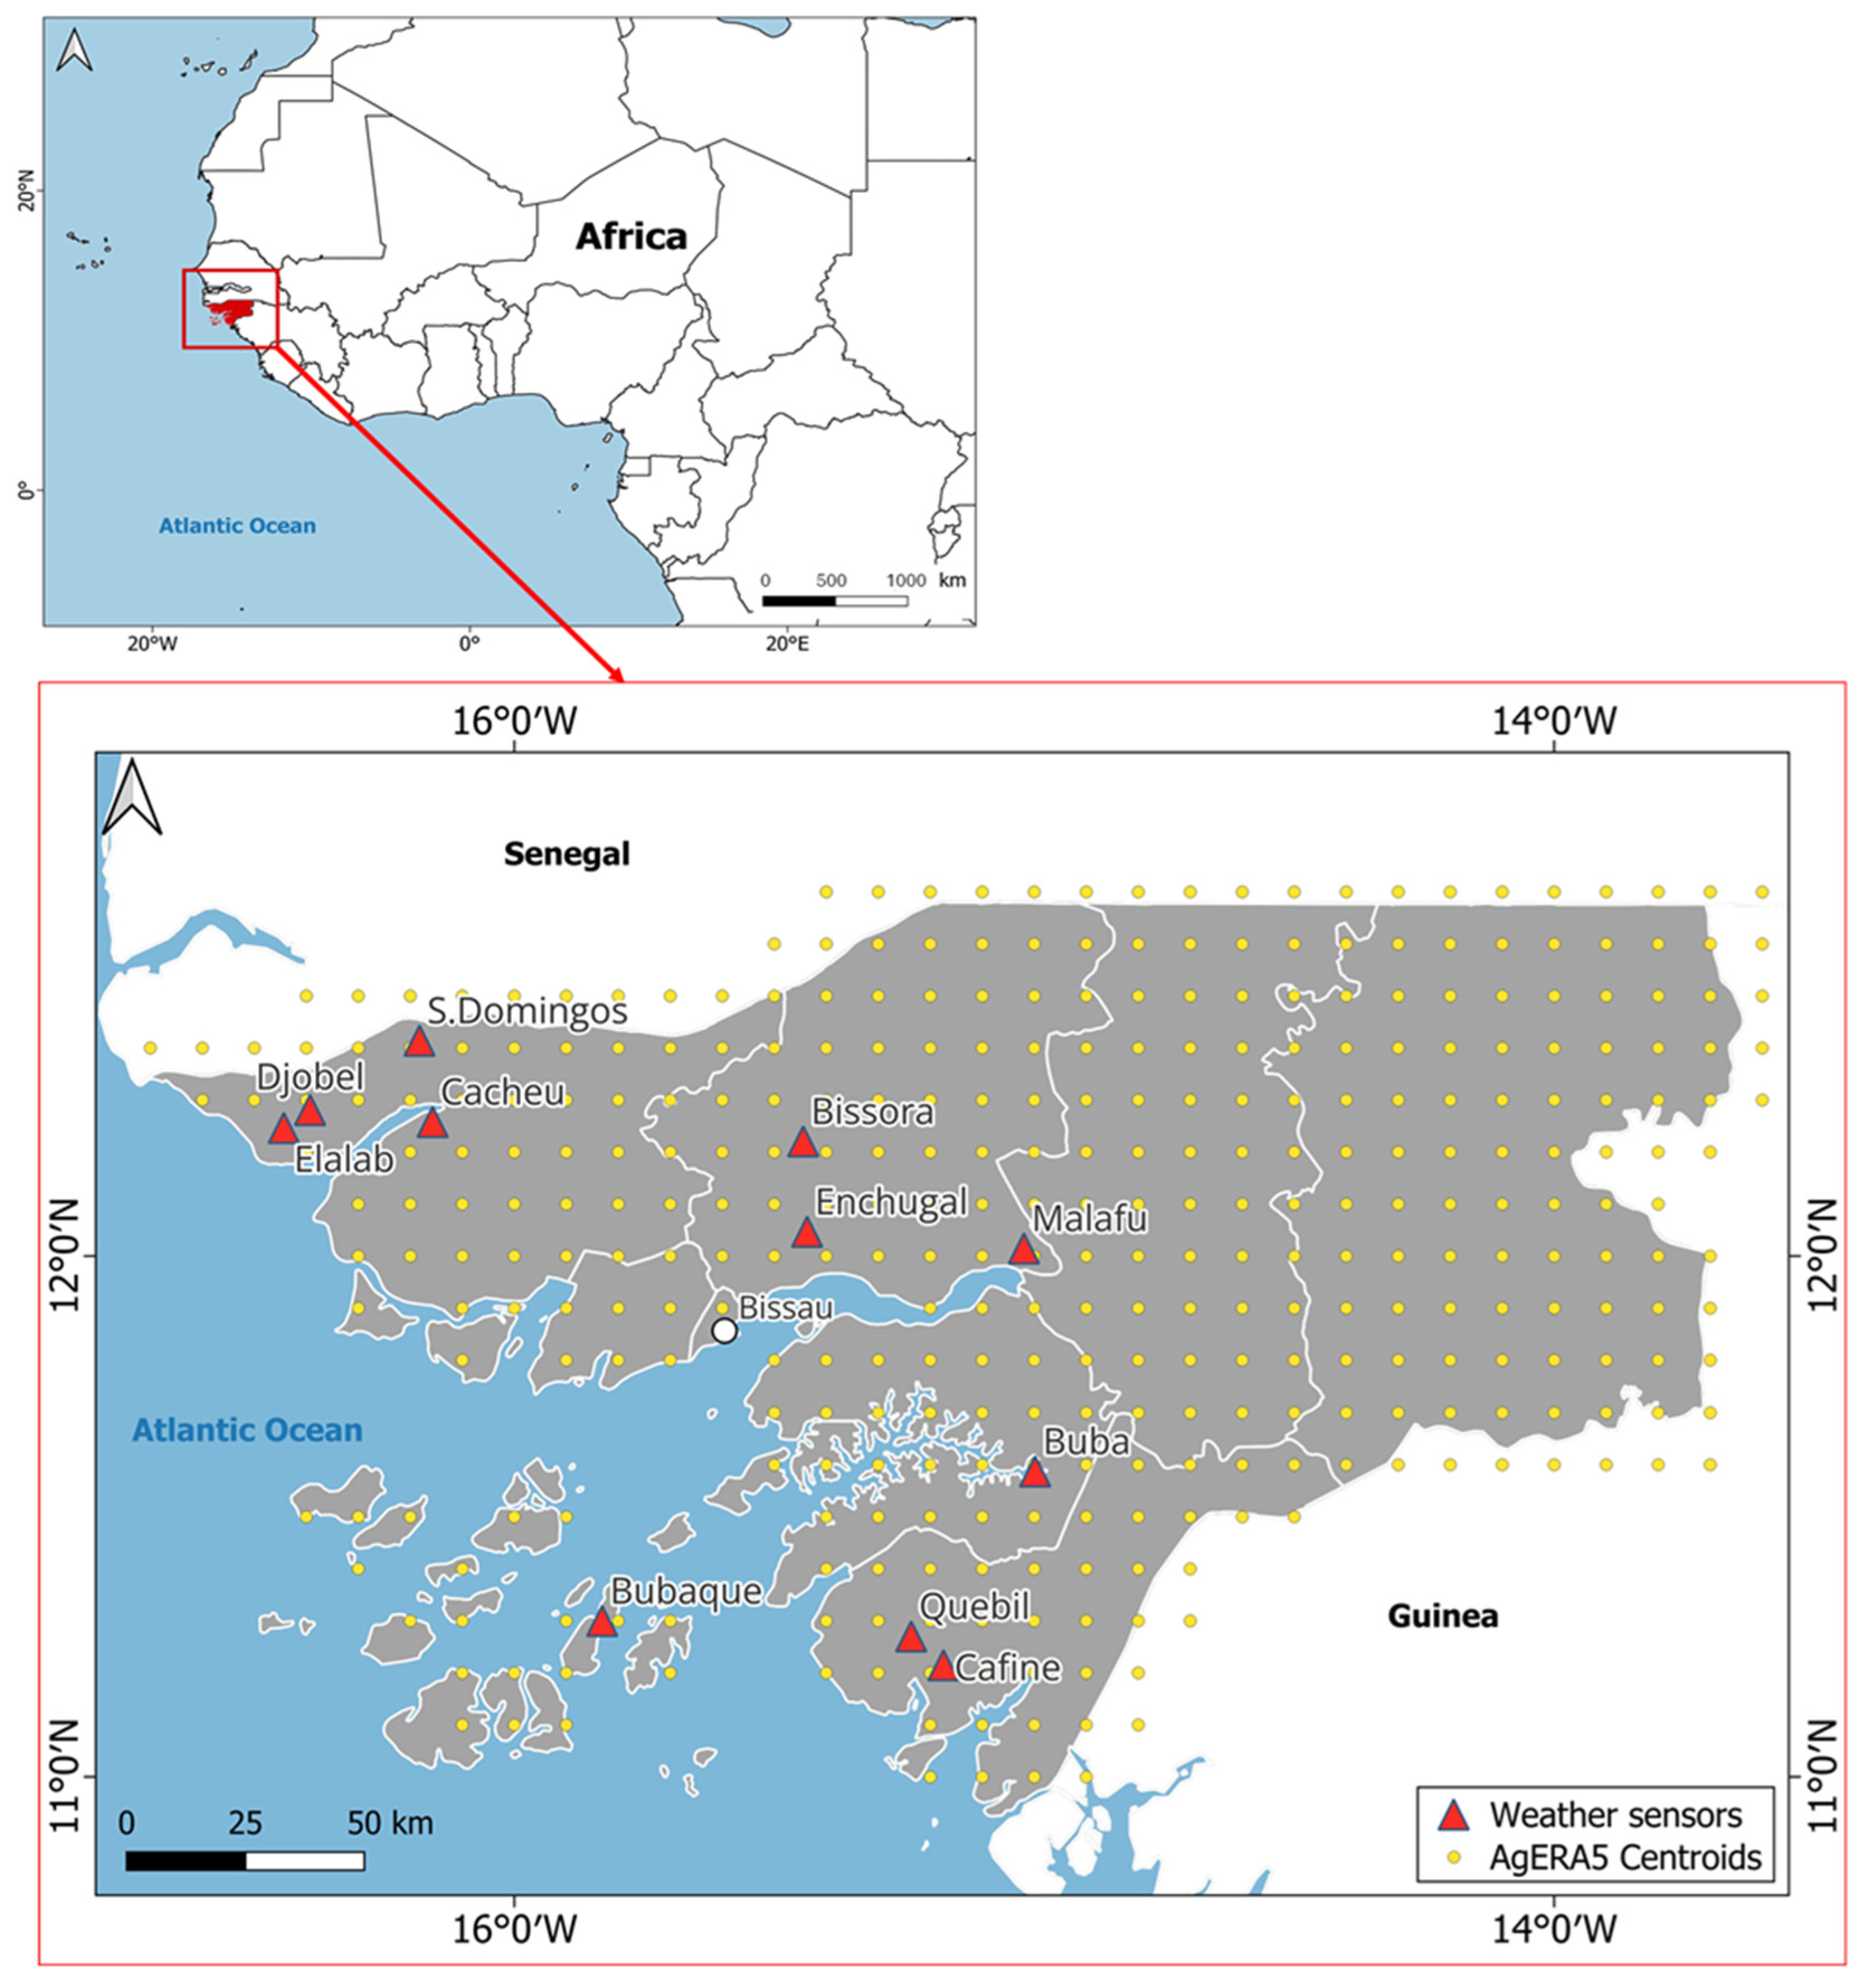
2.2.1. Ground-Truth Weather Data
2.2.2. Reanalysis Weather Data
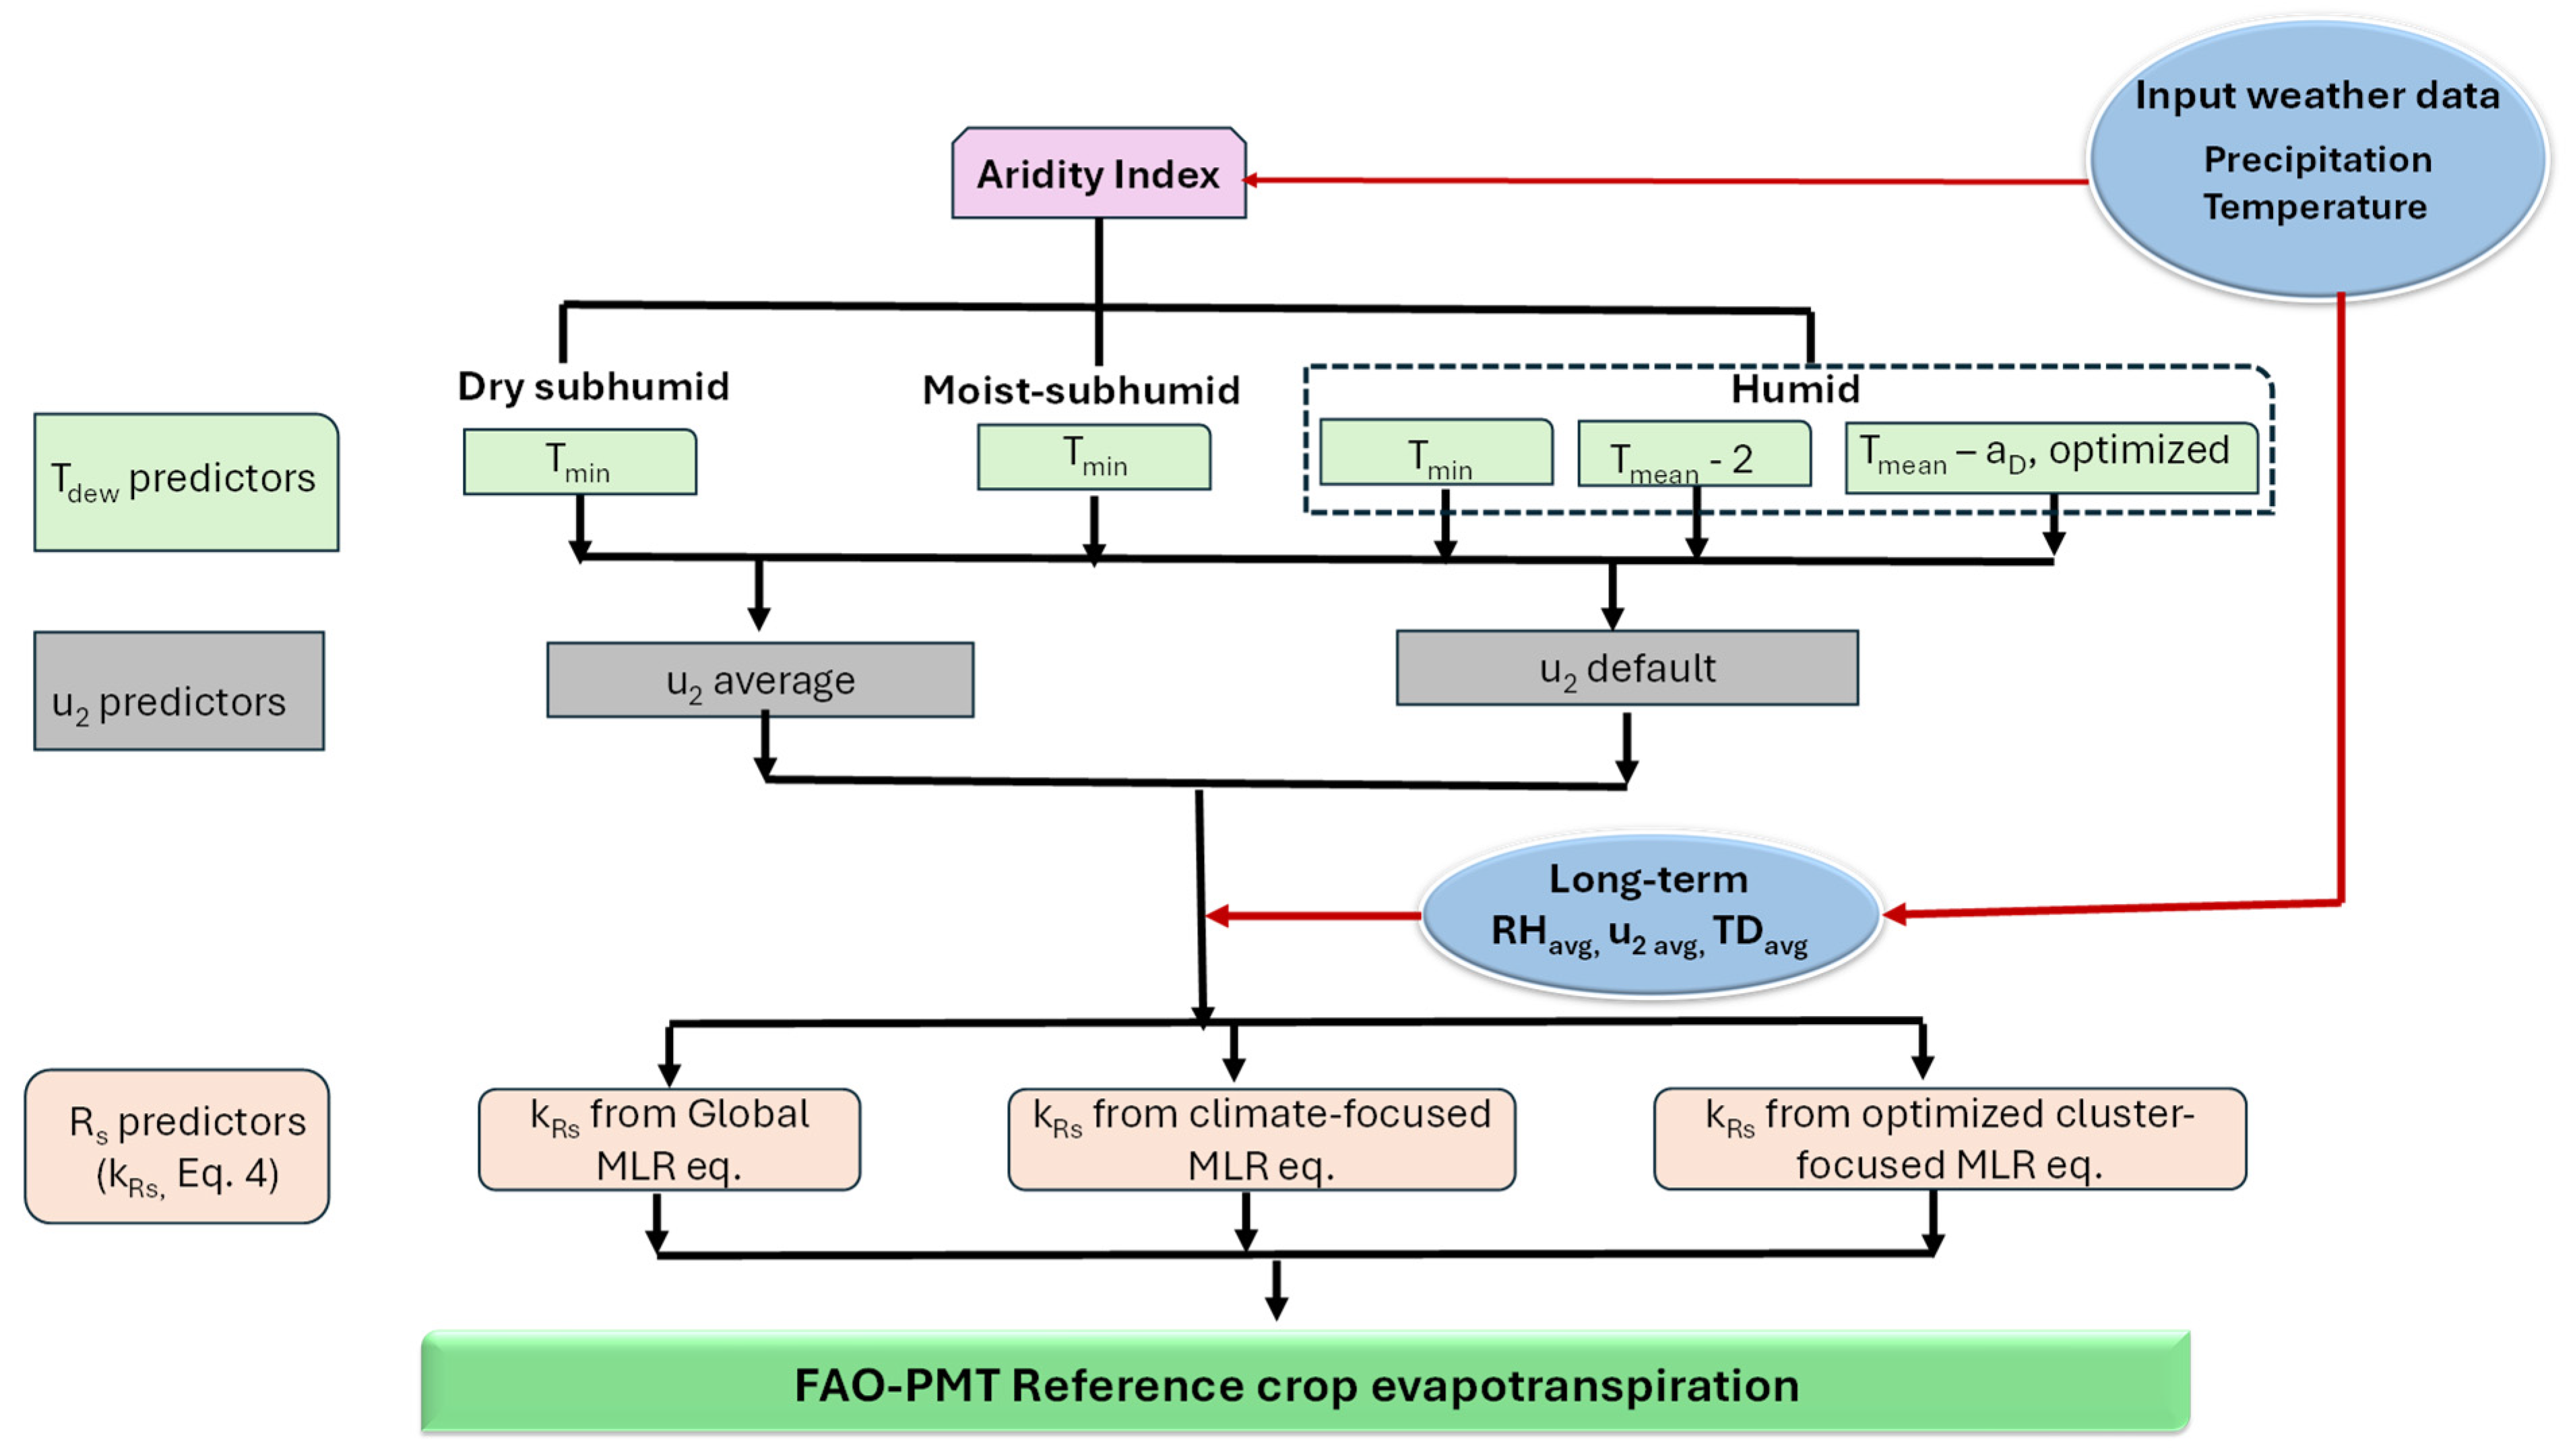
2.3. Computation of the FAO-Penman Monteith ETo
2.4. Calculation of ETo Using Only Temperature Data (FAO-PMT)
2.5. Data Quality Assurance and Quality Checking (QAQC)
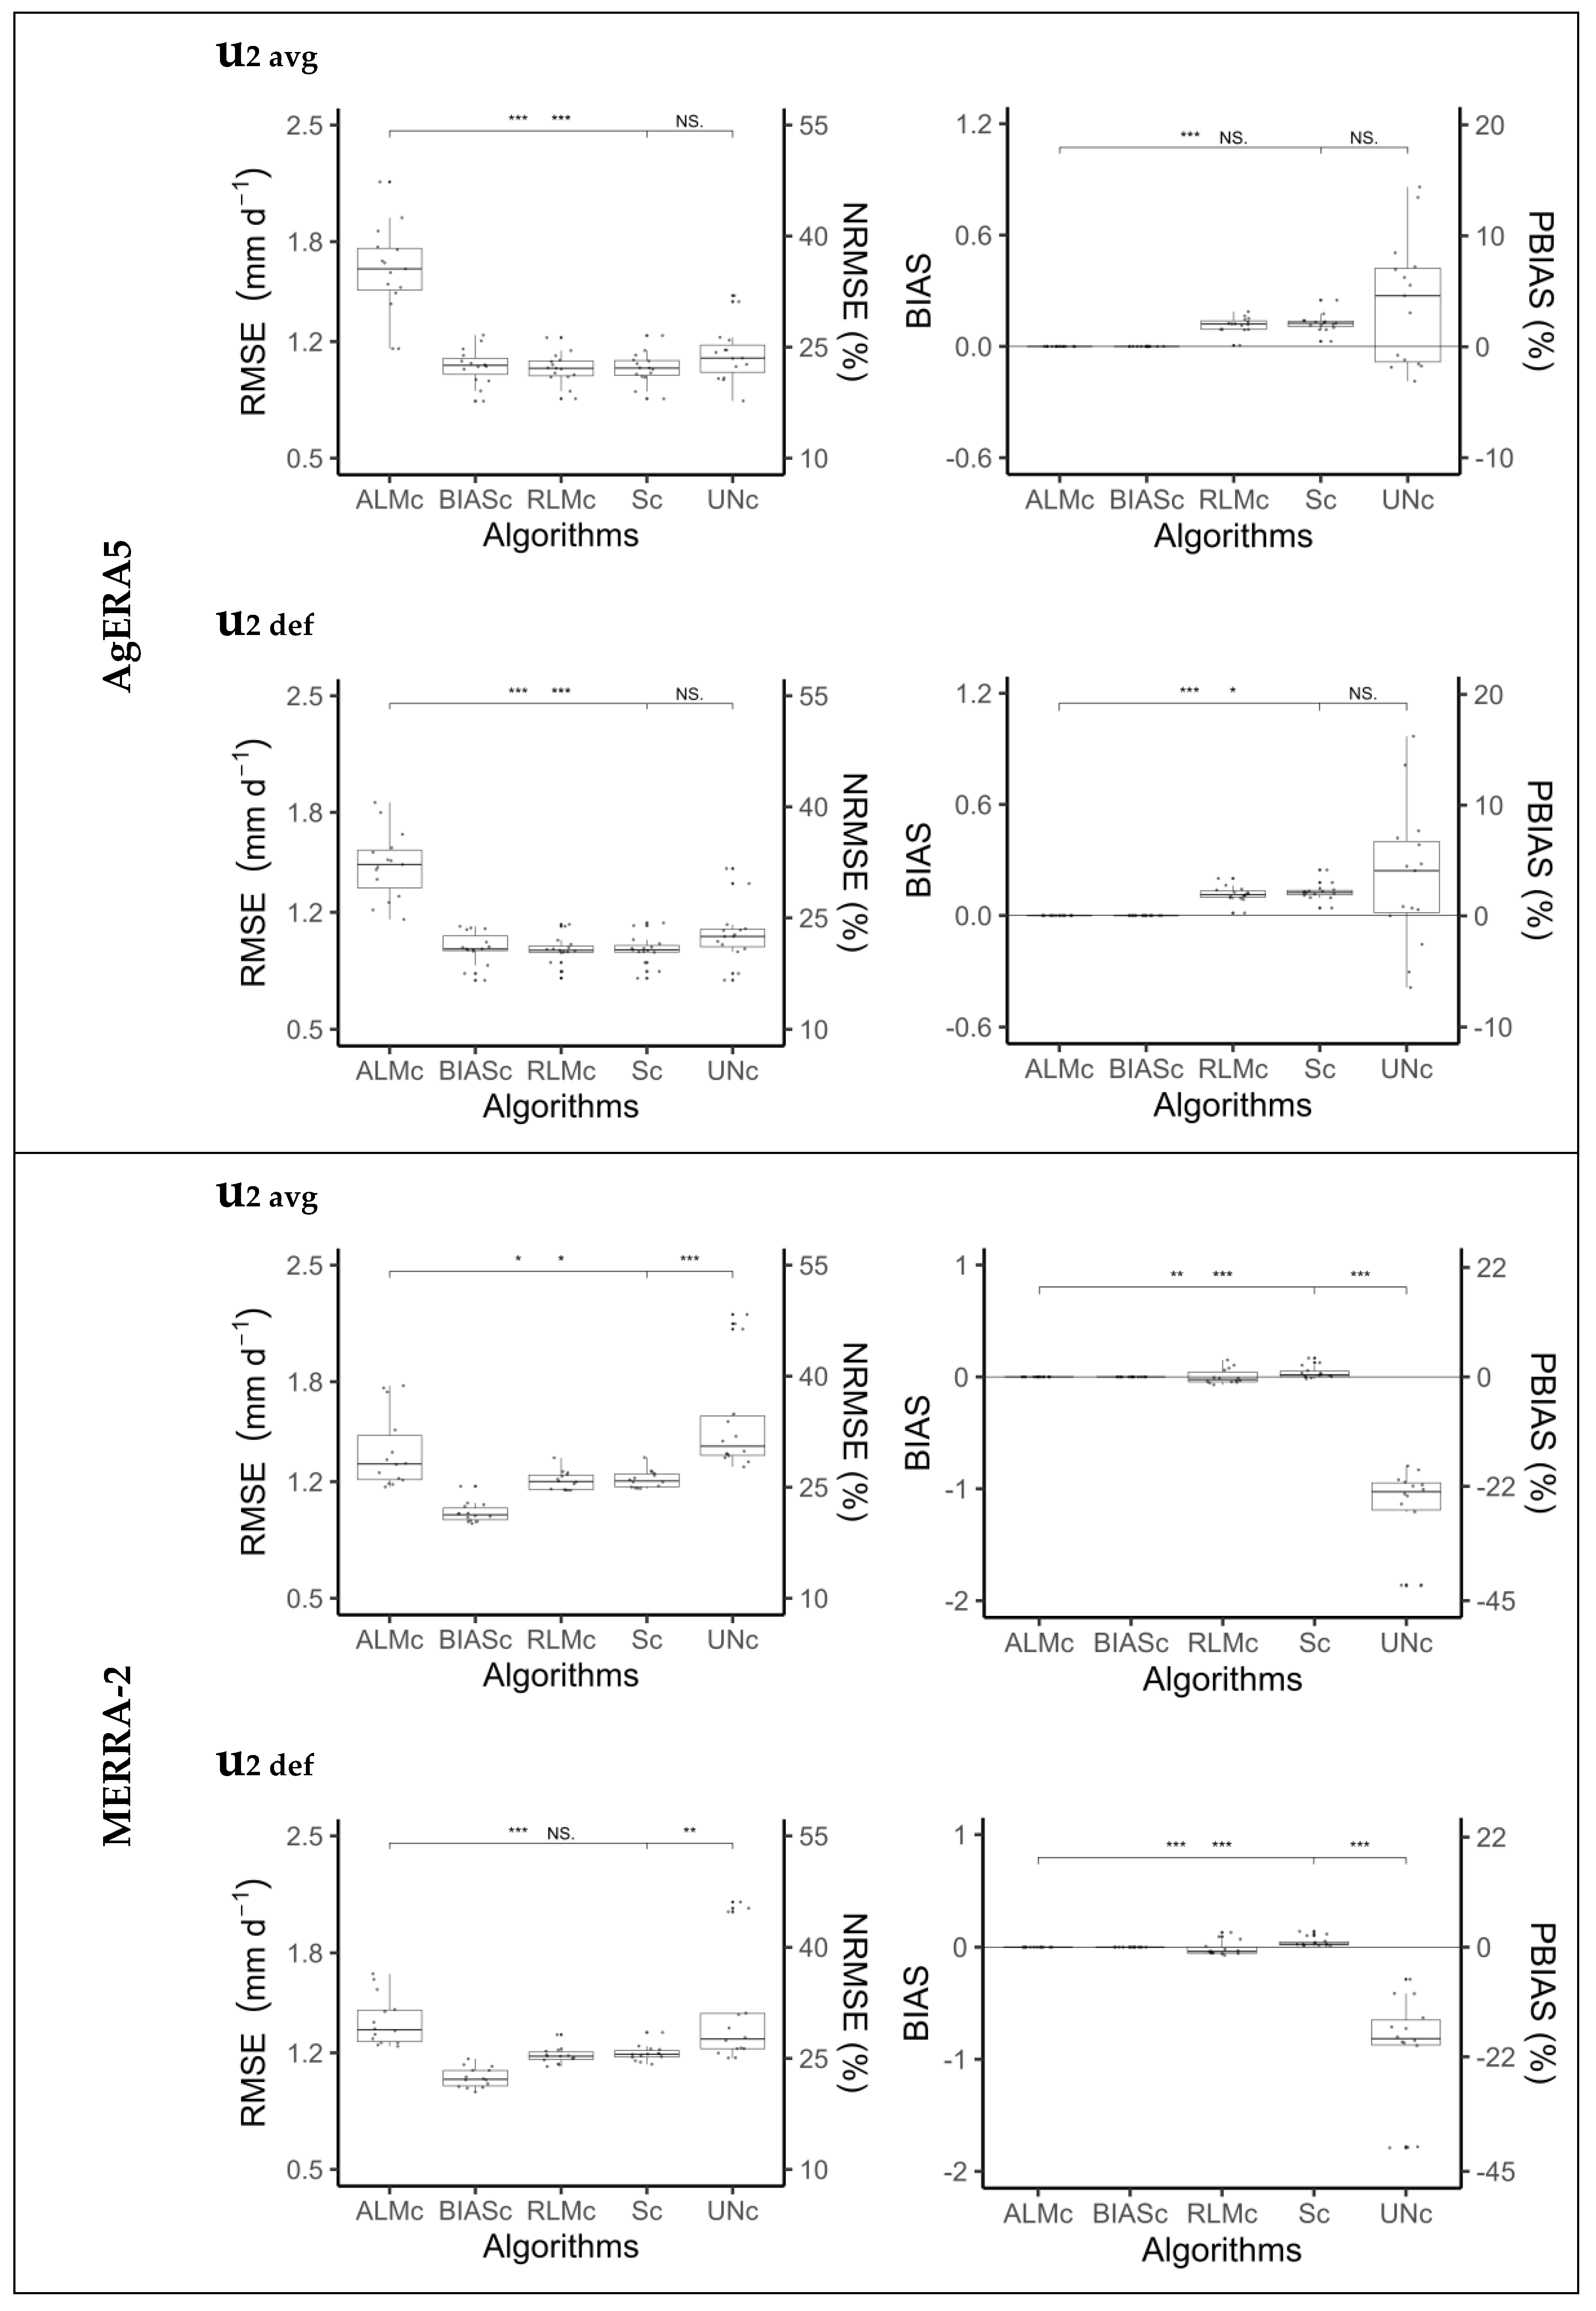
2.6. Bias Correction of Reanalysis-Based ETo Estimates
- (A)
- The adjusted linear model correction (ALMc) involved fitting a linear regression between ETo rean () and ETo obs () as follows:where β0 is the regression intercept, β1 is the slope, and represents the random error term [100].The resulting intercept and slope values were then used to adjust the ETo for each site. The ETo rean values were corrected for both systematic bias and scale error [89] by subtracting the intercept and dividing by the slope.
- (B)
- The slope correction (Sc) method involved fitting a simple linear regression (LM) model between the ETo rean and ETo obs values, with the intercept of 0 (). Once the model was fitted, the slope was calculated and applied as a correction factor. Each ETo rean value was adjusted by dividing it by the estimated slope (ETo/slope = ETo rean_adjusted) [100]. This correction was applied individually to each site and aimed to compensate for systematic bias identified in the relationship between reanalysis and observed data.
- (C)
- The robust linear model correction (RLMc) followed a similar principle to the slope correction but employed a robust linear regression instead of the ordinary least squares method. Unlike standard linear regression, which minimizes the sum of squared residuals, RLMc minimizes a loss function that is less sensitive to large deviations [100,101]. In this study, the Huber M-estimator was used, implemented through the ‘rlm’ function in the R software version 2025.05.1 +513. Fitting was carried out using integrated weighted least squares (IWLS). The Huber function addresses a convex optimization problem and provides parameter estimates that are more robust in the presence of outliers. As with the slope correction, the new (means the updated or robust slope coefficient obtained from this Huber-based fitting procedure) was used to fit ETo rean, reducing the influence of extreme values on the correction process, which are common in tropical regions. Therefore, the corrected ETo rean is estimated as follows:
- (D)
- A simplified bias correction was applied to adjust ETo rean at different sites. The simplified BIAS correction (BIASc) was calculated as follows:where n is the number of observations per site, represents the reanalysis values for the i-th observation, and is the corresponding observed value. The new estimated ETo rean_corrBIAS was calculated by subtracting BIASc from each daily ETo rean value. This correction aimed to eliminate systematic deviations inherent to the original estimates.
2.7. Accuracy Assessment
2.8. Spatial Variability of ETO in Guinea-Bissau
3. Results and Discussion
3.1. QAQC Assessment
3.2. Meteorological Characteristics of the Studied Sites
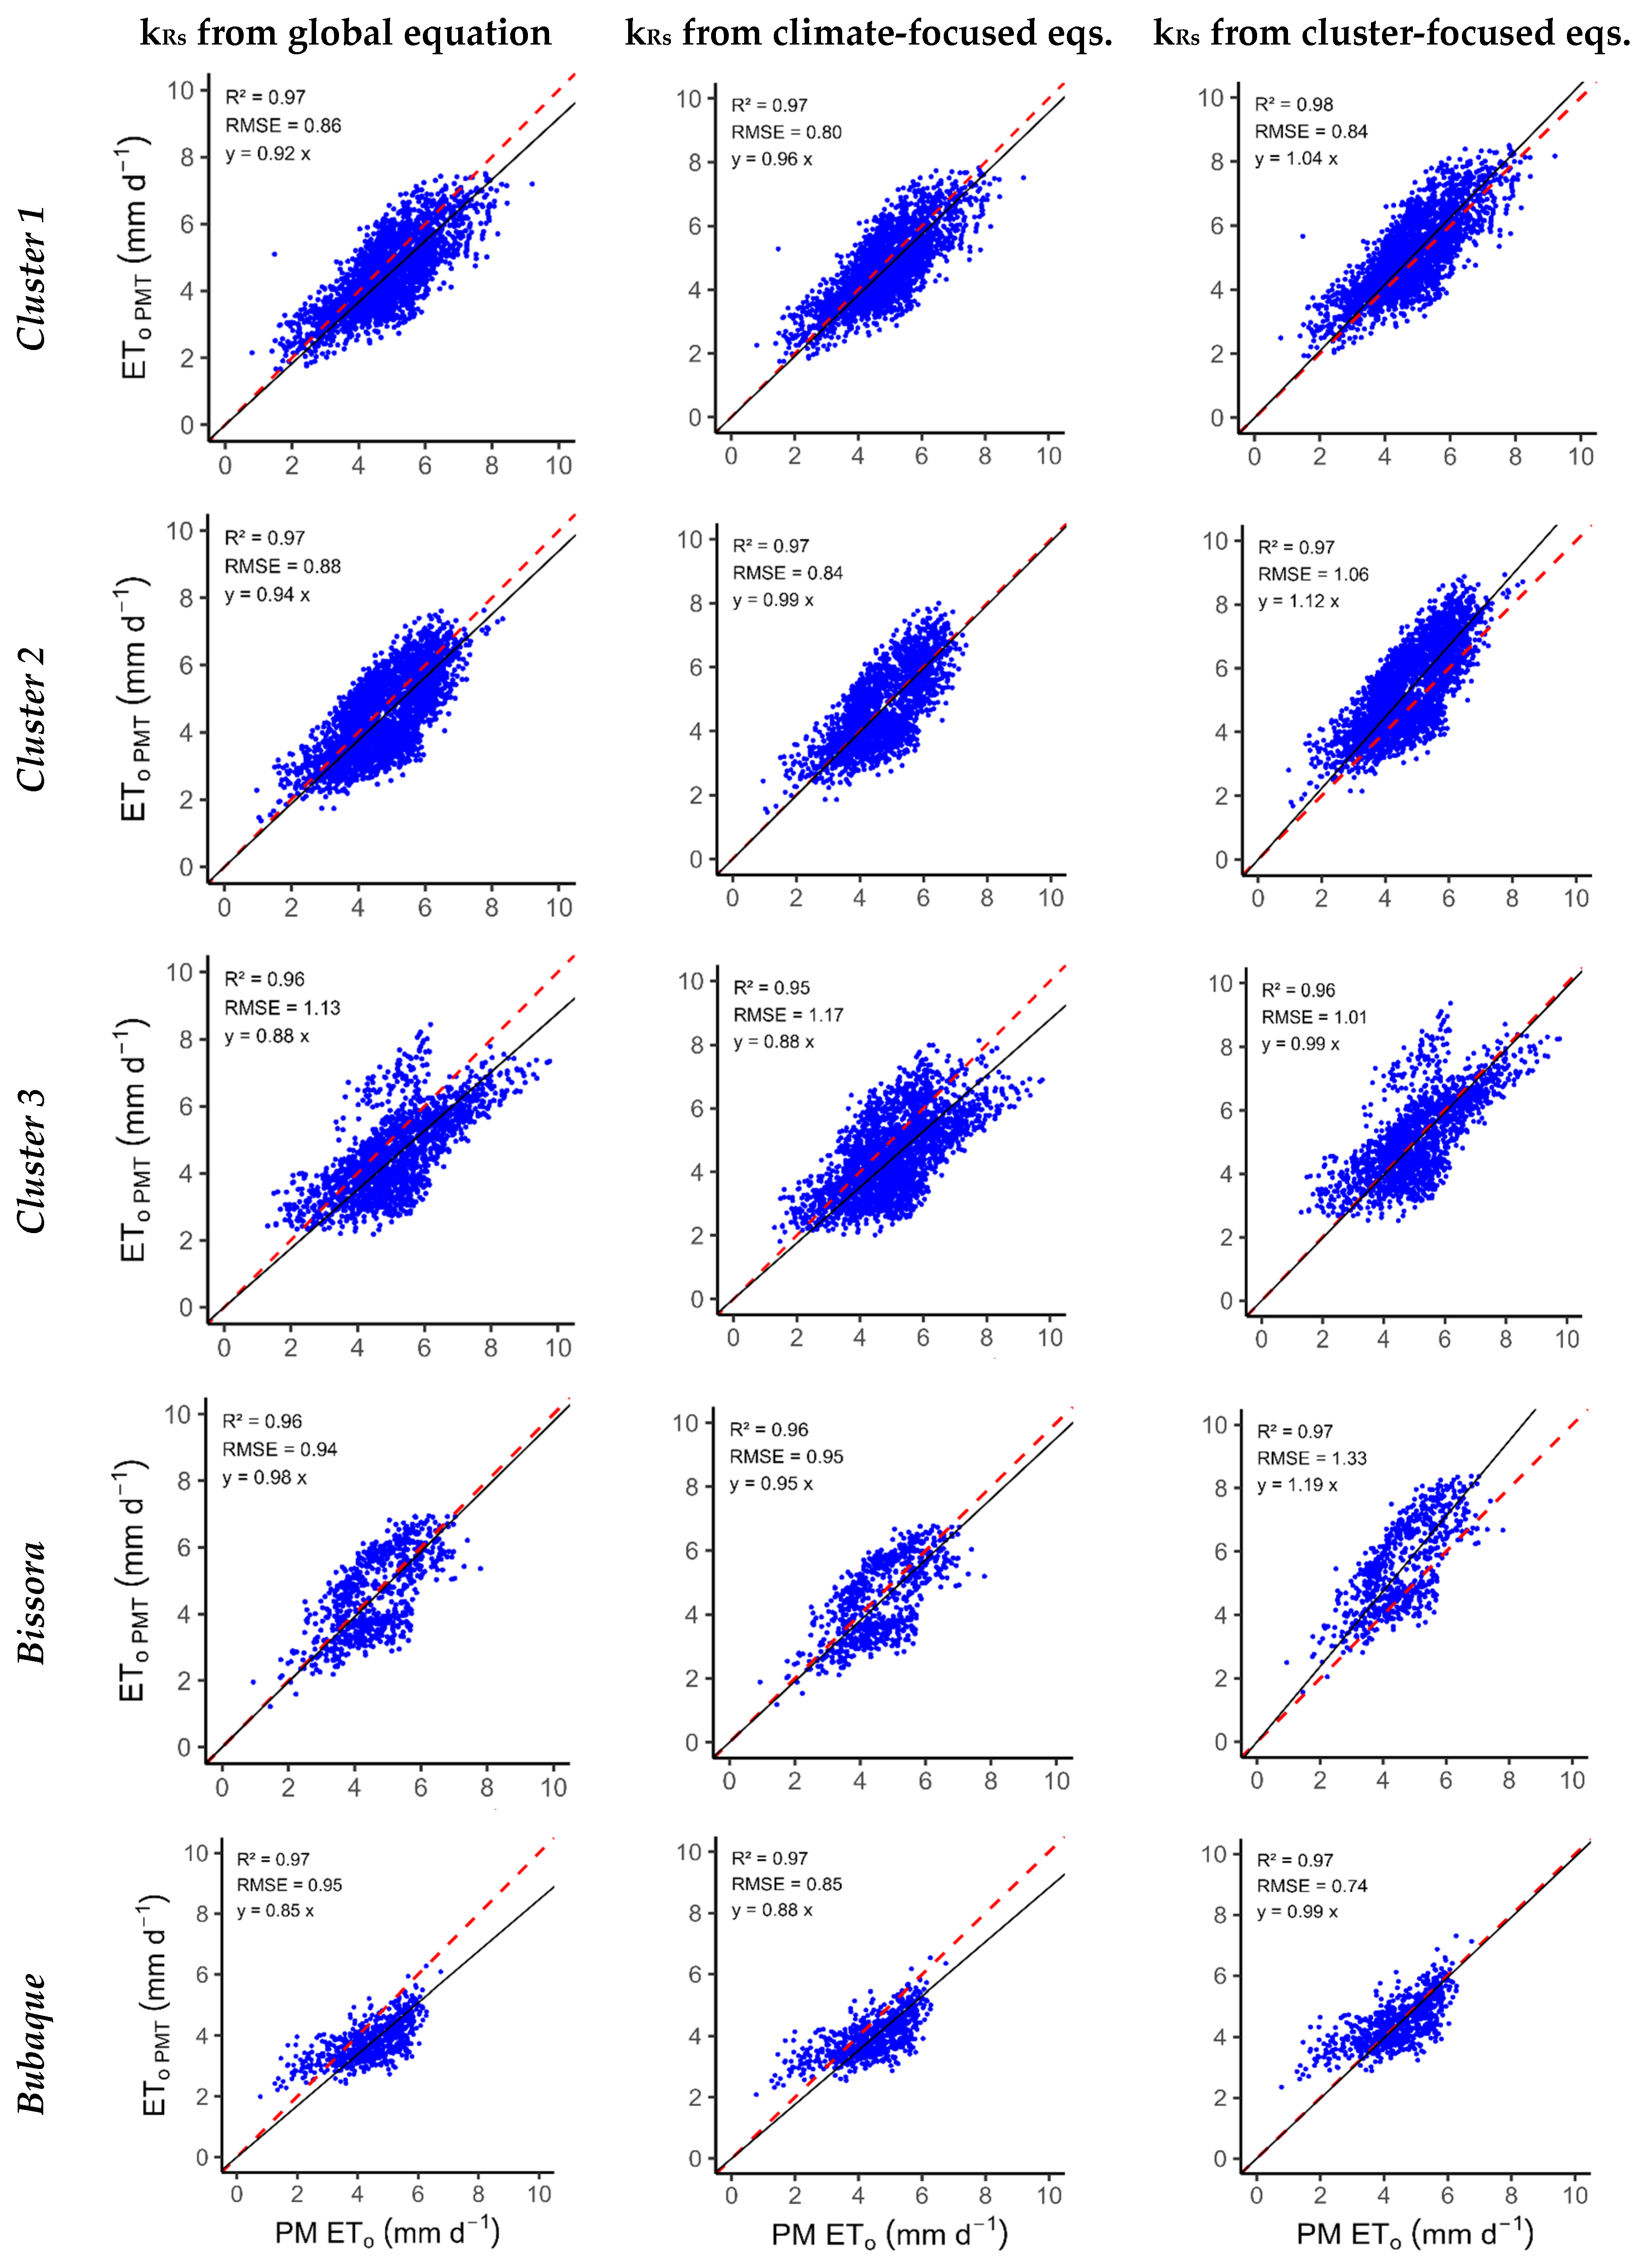
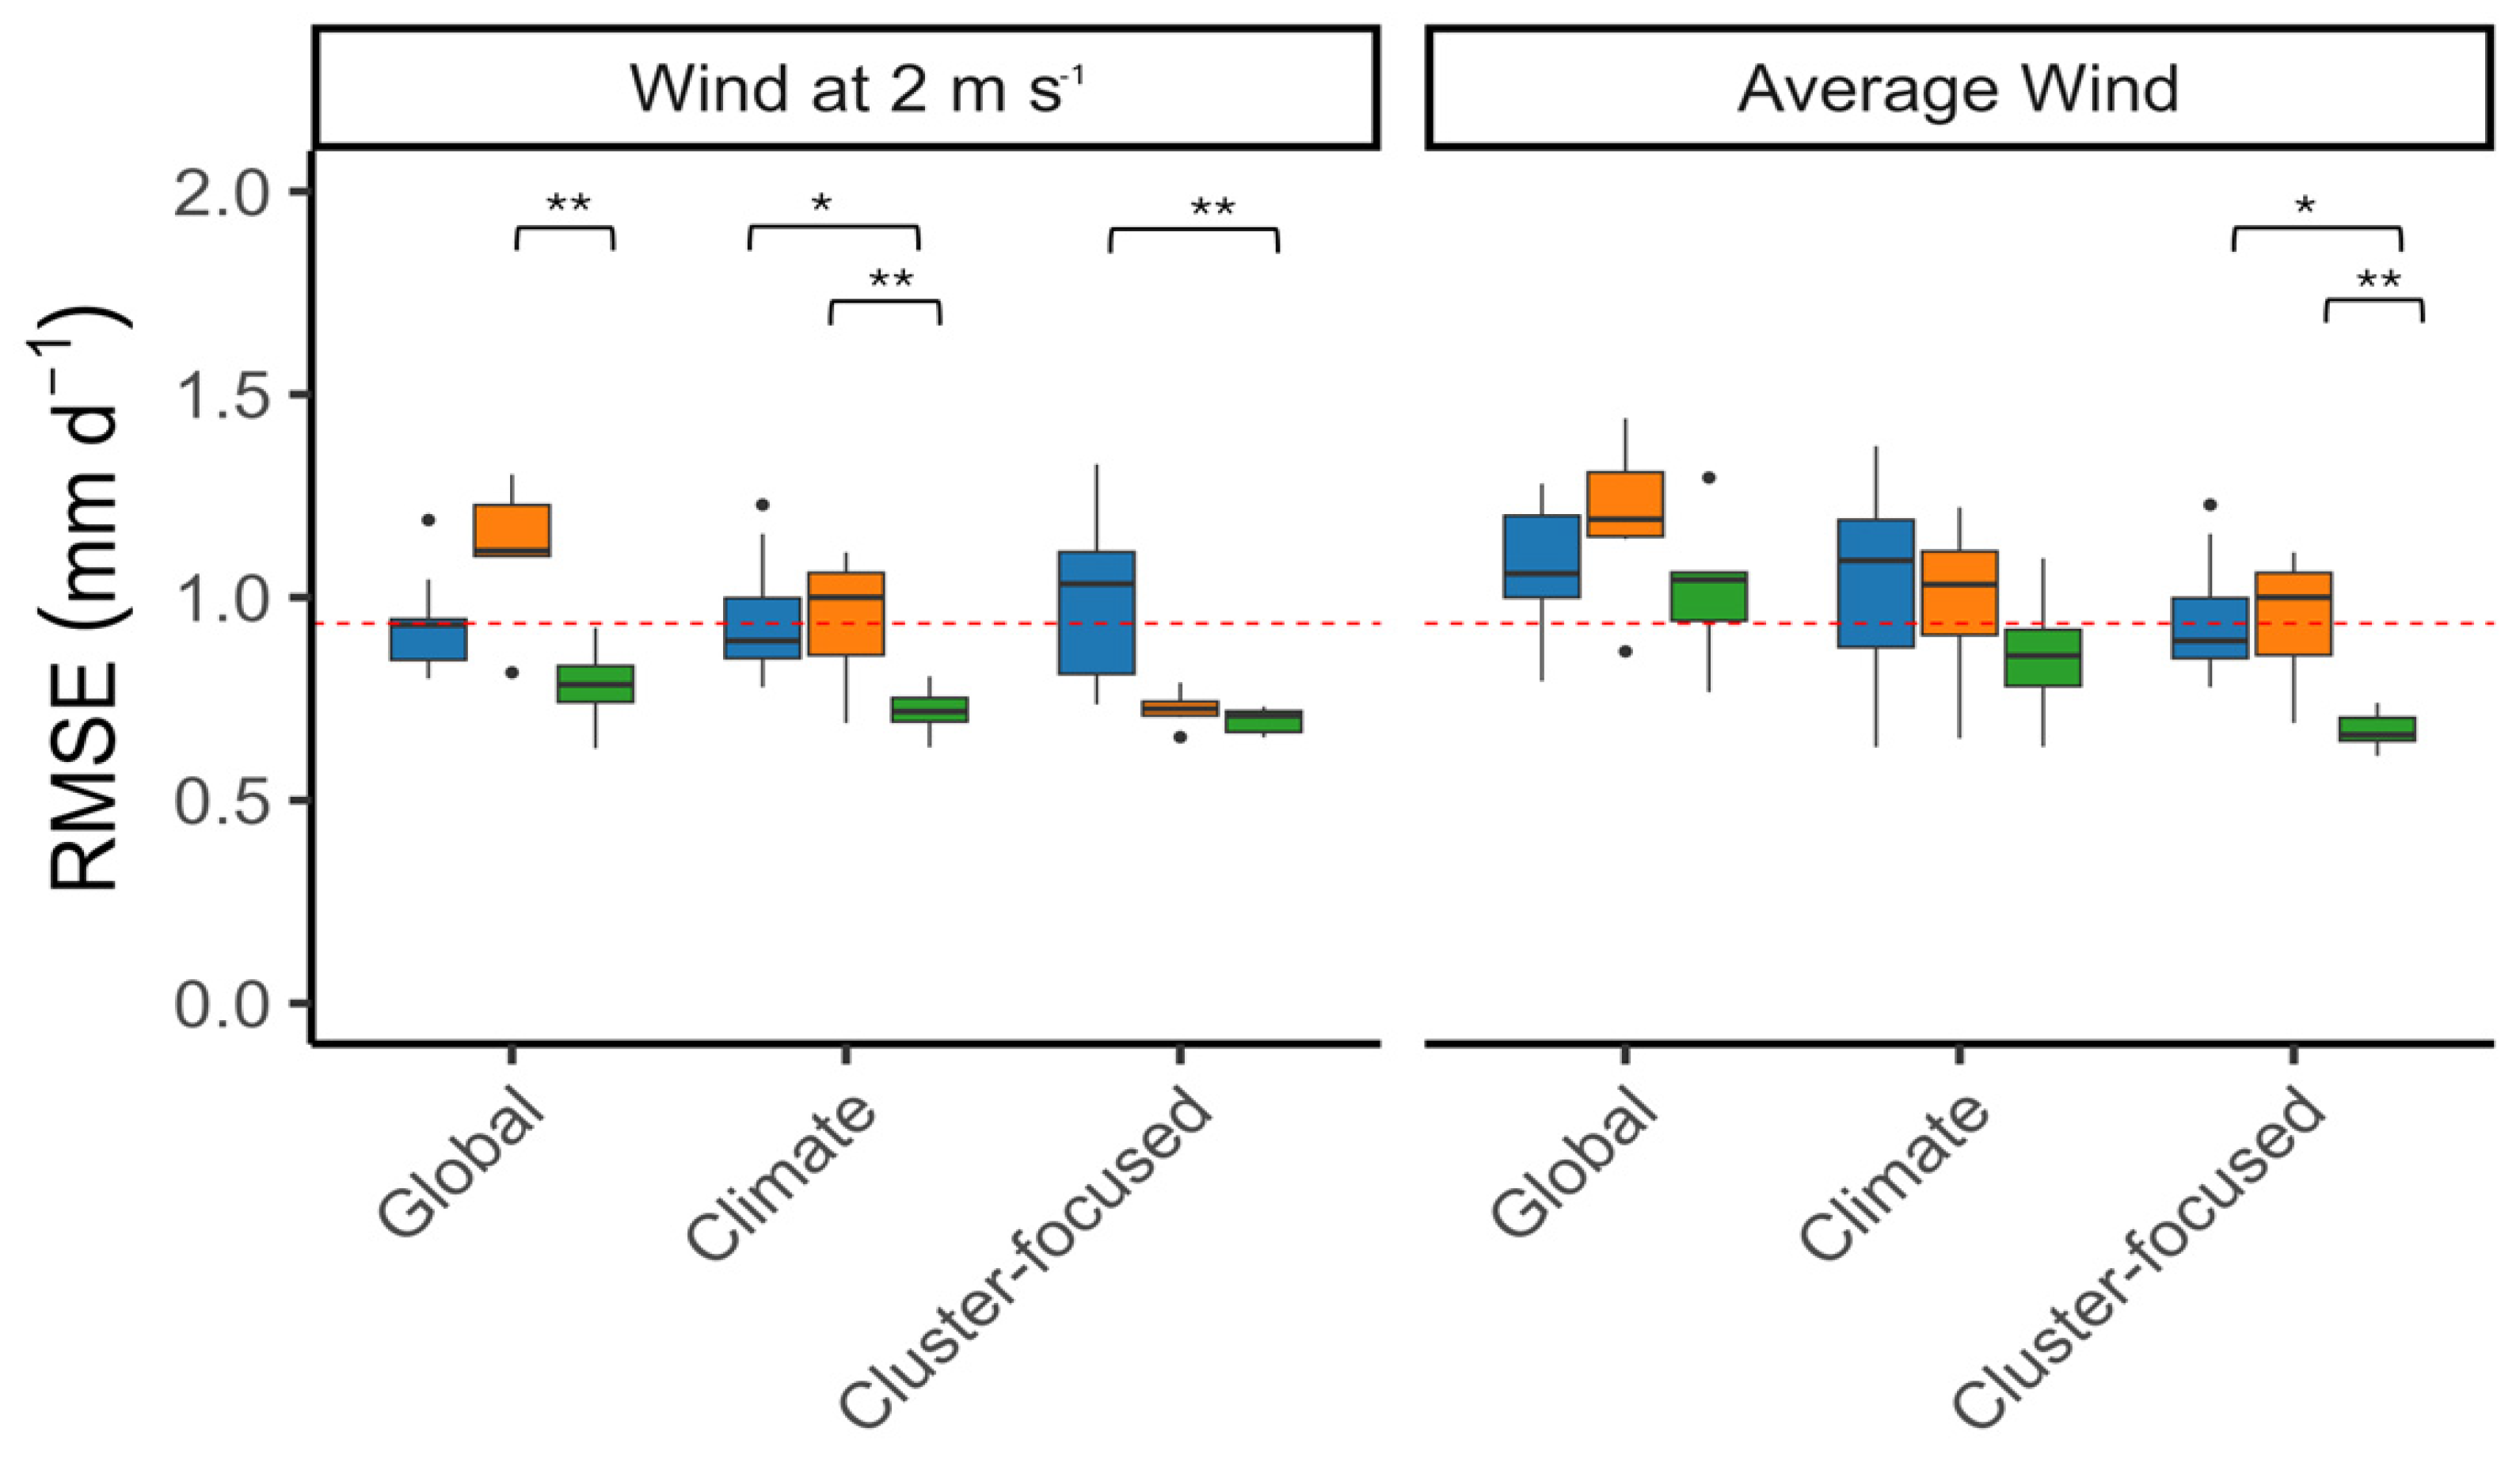
3.3. FAO-PM ETo Using Temperature Data Only
3.4. ETo Estimation Using Different Reanalysis Datasets
3.5. ETo Mapping
4. Conclusions
Supplementary Materials
Author Contributions
Funding
Data Availability Statement
Acknowledgments
Conflicts of Interest
References
- Allen, R.G.; Pereira, L.S.; Raes, D.; Smith, M. Crop Evapotranspiration. Guidelines for Computing Crop Water Requirements; FAO Irrigation and Drainage Paper 56; FAO: Rome, Italy, 1998; Available online: https://www.fao.org/4/x0490e/x0490e00.htm (accessed on 10 August 2024).
- Pereira, L.S.; Allen, R.; Paredes, P.; López-Urrea, R.; Raes, D.; Smith, M.; Kilic, A.; Salman, M. Crop Evapotranspiration. Guidelines for Computing Crop Water Requirements; FAO Irrig. Drain. Pap. 56rev; FAO: Rome, Italy, 2025; 395p. (In Press) [Google Scholar]
- Pereira, L.S.; Allen, R.G.; Smith, M.; Raes, D. Crop evapotranspiration estimation with FAO56: Past and future. Agric. Water Manag. 2015, 147, 4–20. [Google Scholar] [CrossRef]
- Pereira, L.S.; Paredes, P.; Espírito-Santo, D. Crop coefficients of natural wetlands and riparian vegetation to compute ecosystem evapotranspiration and the water balance. Irrig. Sci. 2024, 42, 1171–1197. [Google Scholar] [CrossRef]
- Rosa, R.; Ramos, T.; Pereira, L. The dual Kc approach to assess maize and sweet sorghum transpiration and soil evaporation under saline conditions: Application of the SIMDualKc model. Agric. Water Manag. 2016, 177, 77–94. [Google Scholar] [CrossRef]
- Liu, M.; Shi, H.; Paredes, P.; Ramos, T.B.; Dai, L.; Feng, Z.; Pereira, L.S. Estimating and partitioning maize evapotranspiration as affected by salinity using weighing lysimeters and the SIMDualKc model. Agric. Water Manag. 2022, 261, 107362. [Google Scholar] [CrossRef]
- Liu, M.; Paredes, P.; Shi, H.; Ramos, T.B.; Dou, X.; Dai, L.; Pereira, L.S. Impacts of a shallow saline water table on maize evapotranspiration and groundwater contribution using static water table lysimeters and the dual Kc water balance model SIMDualKc. Agric. Water Manag. 2022, 273, 107887. [Google Scholar] [CrossRef]
- Popova, Z.; Kercheva, M.; Pereira, L.S. Validation of the FAO methodology for computing ETo with limited data. Application to south Bulgaria. Irrig. Drain. 2006, 55, 201–215. [Google Scholar] [CrossRef]
- Raziei, T.; Pereira, L.S. Estimation of ETo with Hargreaves–Samani and FAO-PM temperature methods for a wide range of climates in Iran. Agric. Water Manag. 2013, 121, 1–18. [Google Scholar] [CrossRef]
- Almorox, J.; Senatore, A.; Quej, V.H.; Mendicino, G. Worldwide assessment of the Penman–Monteith temperature approach for the estimation of monthly reference evapotranspiration. Theor. Appl. Clim. 2018, 131, 693–703. [Google Scholar] [CrossRef]
- Paredes, P.; Fontes, J.C.; Azevedo, E.B.; Pereira, L.S. Daily reference crop evapotranspiration with reduced data sets in the humid environments of Azores islands using estimates of actual vapor pressure, solar radiation, and wind speed. Theor. Appl. Clim. 2018, 134, 1115–1133. [Google Scholar] [CrossRef]
- Paredes, P.; Pereira, L.; Almorox, J.; Darouich, H. Reference grass evapotranspiration with reduced data sets: Parameterization of the FAO Penman-Monteith temperature approach and the Hargeaves-Samani equation using local climatic variables. Agric. Water Manag. 2020, 240, 106210. [Google Scholar] [CrossRef]
- Djaman, K.; Tabari, H.; Balde, A.B.; Diop, L.; Futakuchi, K.; Irmak, S. Analyses, calibration and validation of evapotranspiration models to predict grass-reference evapotranspiration in the Senegal river delta. J. Hydrol. Reg. Stud. 2016, 8, 82–94. [Google Scholar] [CrossRef]
- Djaman, K.; Rudnick, D.; Mel, V.C.; Mutiibwa, D.; Diop, L.; Sall, M.; Kabenge, I.; Bodian, A.; Tabari, H.; Irmak, S. Evaluation of Valiantzas’ Simplified Forms of the FAO-56 Penman-Monteith Reference Evapotranspiration Model in a Humid Climate. J. Irrig. Drain. Eng. 2017, 143. [Google Scholar] [CrossRef]
- Koudahe, K.; Djaman, K.; Adewumi, J.K. Evaluation of the Penman–Monteith reference evapotranspiration under limited data and its sensitivity to key climatic variables under humid and semiarid conditions. Model. Earth Syst. Environ. 2018, 4, 1239–1257. [Google Scholar] [CrossRef]
- Landeras, G.; Bekoe, E.; Ampofo, J.; Logah, F.; Diop, M.; Cisse, M.; Shiri, J. New alternatives for reference evapotranspiration estimation in West Africa using limited weather data and ancillary data supply strategies. Theor. Appl. Clim. 2018, 132, 701–716. [Google Scholar] [CrossRef]
- Yonaba, R.; Tazen, F.; Cissé, M.; Mounirou, L.A.; Belemtougri, A.; Ouedraogo, V.A.; Koïta, M.; Niang, D.; Karambiri, H.; Yacouba, H. Trends, sensitivity and estimation of daily reference evapotranspiration ET0 using limited climate data: Regional focus on Burkina Faso in the West African Sahel. Theor. Appl. Clim. 2023, 153, 947–974. [Google Scholar] [CrossRef]
- Hargreaves, G.L.; Hargreaves, G.H.; Riley, J.P. Irrigation Water Requirements for Senegal River Basin. J. Irrig. Drain. Eng. 1985, 111, 265–275. [Google Scholar] [CrossRef]
- Musa, A.A.; Elagib, N.A. Extra Dimensions to the Calibration of Hargreaves-Samani Equation Under Data-Scarce Environment. Water Resour. Manag. 2025, 1–18. [Google Scholar] [CrossRef]
- Moratiel, R.; Bravo, R.; Saa, A.; Tarquis, A.M.; Almorox, J. Estimation of evapotranspiration by the Food and Agricultural Organization of the United Nations (FAO) Penman–Monteith temperature (PMT) and Hargreaves–Samani (HS) models under temporal and spatial criteria—A case study in Duero basin (Spain). Nat. Hazards Earth Syst. Sci. 2020, 20, 859–875. [Google Scholar] [CrossRef]
- Abdulsalam, M.K.; Akpootu, D.O.; Aliyu, S.; Isah, A.K. A Comparative Study for Estimating Reference Evapotranspiration Models over Kano, Nigeria. J. Energy Res. Rev. 2023, 15, 12–25. [Google Scholar] [CrossRef]
- Zhu, B.; Feng, Y.; Gong, D.; Jiang, S.; Zhao, L.; Cui, N. Hybrid particle swarm optimization with extreme learning machine for daily reference evapotranspiration prediction from limited climatic data. Comput. Electron. Agric. 2020, 173, 105430. [Google Scholar] [CrossRef]
- Zereg, S.; Belouz, K. Modeling daily reference evapotranspiration using SVR machine learning algorithm with limited meteorological data in Dar-el-Beidha, Algeria. Acta Geophys. 2023, 72, 2009–2025. [Google Scholar] [CrossRef]
- Wu, L.; Zhou, H.; Ma, X.; Fan, J.; Zhang, F. Daily reference evapotranspiration prediction based on hybridized extreme learning machine model with bio-inspired optimization algorithms: Application in contrasting climates of China. J. Hydrol. 2019, 577, 123960. [Google Scholar] [CrossRef]
- Harris, I.; Osborn, T.J.; Jones, P.; Lister, D. Version 4 of the CRU TS monthly high-resolution gridded multivariate climate dataset. Sci. Data 2020, 7, 109. [Google Scholar] [CrossRef] [PubMed]
- Hijmans, R.J.; Cameron, S.E.; Parra, J.L.; Jones, P.G.; Jarvis, A. Very high resolution interpolated climate surfaces for global land areas. Int. J. Climatol. 2005, 25, 1965–1978. [Google Scholar] [CrossRef]
- Anwar, S.A.; Malcheva, K.; Srivastava, A. Estimating the potential evapotranspiration of Bulgaria using a high-resolution regional climate model. Theor. Appl. Clim. 2023, 152, 1175–1188. [Google Scholar] [CrossRef]
- Daly, C.; Halbleib, M.; Smith, J.I.; Gibson, W.P.; Doggett, M.K.; Taylor, G.H.; Curtis, J.; Pasteris, P.P. Physiographically sensitive mapping of climatological temperature and precipitation across the conterminous United States. Int. J. Clim. 2008, 28, 2031–2064. [Google Scholar] [CrossRef]
- Herrera, S.; Cardoso, R.M.; Soares, P.M.; Espírito-Santo, F.; Viterbo, P.; Gutiérrez, J.M. Iberia01: A new gridded dataset of daily precipitation and temperatures over Iberia. Earth Syst. Sci. Data 2019, 11, 1947–1956. [Google Scholar] [CrossRef]
- Xavier, A.C.; Scanlon, B.R.; King, C.W.; Alves, A.I. New improved Brazilian daily weather gridded data (1961–2020). Int. J. Clim. 2022, 42, 8390–8404. [Google Scholar] [CrossRef]
- Trigo, I.F.; de Bruin, H.; Beyrich, F.; Bosveld, F.C.; Gavilán, P.; Groh, J.; López-Urrea, R. Validation of reference evapotranspiration from Meteosat Second Generation (MSG) observations. Agric. For. Meteorol. 2018, 259, 271–285. [Google Scholar] [CrossRef]
- Paredes, P.; Trigo, I.; de Bruin, H.; Simões, N.; Pereira, L.S. Daily grass reference evapotranspiration with Meteosat Second Generation shortwave radiation and reference ET products. Agric. Water Manag. 2021, 248, 106543. [Google Scholar] [CrossRef]
- Gebremedhin, M.A.; Lubczynski, M.W.; Maathuis, B.H.; Teka, D. Deriving potential evapotranspiration from satellite-based reference evapotranspiration, Upper Tekeze Basin, Northern Ethiopia. J. Hydrol. Reg. Stud. 2022, 41, 101059. [Google Scholar] [CrossRef]
- Demchev, D.M.; Kulakov, M.Y.; Makshtas, A.P.; Makhotina, I.A.; Fil’cHuk, K.V.; Frolov, I.E. Verification of ERA-Interim and ERA5 Reanalyses Data on Surface Air Temperature in the Arctic. Russ. Meteorol. Hydrol. 2020, 45, 771–777. [Google Scholar] [CrossRef]
- ECMWF Fact Sheet: Earth System Data Assimilation. Available online: https://www.ecmwf.int/en/about/media-centre/focus/2020/fact-sheet-earth-system-data-assimilation (accessed on 4 December 2024).
- Dee, D.P.; Uppala, S.M.; Simmons, A.J.; Berrisford, P.; Poli, P.; Kobayashi, S.; Andrae, U.; Balmaseda, M.A.; Balsamo, G.; Bauer, P.; et al. The ERA-Interim reanalysis: Configuration and performance of the data assimilation system. Q. J. R. Meteorol. Soc. 2011, 137, 553–597. [Google Scholar] [CrossRef]
- Toreti, A.; Maiorano, A.; De Sanctis, G.; Webber, H.; Ruane, A.; Fumagalli, D.; Ceglar, A.; Niemeyer, S.; Zampieri, M. Using reanalysis in crop monitoring and forecasting systems. Agric. Syst. 2019, 168, 144–153. [Google Scholar] [CrossRef]
- Xue, C.; Niu, L.; Wu, H.; Jiang, X.; Fan, D. Drought Assessment in Belt and Road Area Based on ERA5 Reanalyses. In Proceedings of the IGARSS 2019—2019 IEEE International Geoscience and Remote Sensing Symposium, Yokohama, Japan, 28 July—2 August 2019; pp. 7737–7740. [Google Scholar]
- Brown, D.; de Sousa, K.; van Etten, J. ag5Tools: An R package for downloading and extracting agrometeorological data from the AgERA5 database. SoftwareX 2023, 21, 101267. [Google Scholar] [CrossRef]
- Kruger, J.A.; Roffe, S.J.; van der Walt, A.J. AgERA5 representation of seasonal mean and extreme temperatures in the Northern Cape, South Africa. South Afr. J. Sci. 2024, 120, 1–13. [Google Scholar] [CrossRef] [PubMed]
- Rienecker, M.M.; Suarez, M.J.; Gelaro, R.; Todling, R.; Bacmeister, J.; Liu, E.; Bosilovich, M.G.; Schubert, S.D.; Takacs, L.; Kim, G.-K.; et al. MERRA: NASA’s Modern-era retrospective analysis for research and applications. J. Clim. 2011, 24, 3624–3648. [Google Scholar] [CrossRef]
- Kistler, R.; Collins, W.; Saha, S.; White, G.; Woollen, J.; Kalnay, E.; Chelliah, M.; Ebisuzaki, W.; Kanamitsu, M.; Kousky, V.; et al. The NCEP–NCAR 50–Year Reanalysis: Monthly Means CD–ROM and Documentation. Bull. Am. Meteorol. Soc. 2001, 82, 247–267. [Google Scholar] [CrossRef]
- Nouri, M.; Homaee, M. Reference crop evapotranspiration for data-sparse regions using reanalysis products. Agric. Water Manag. 2022, 262, 107319. [Google Scholar] [CrossRef]
- Xi, X.; Zhuang, Q.; Kim, S.; Gentine, P. Evaluating the Effects of Precipitation and Evapotranspiration on Soil Moisture Variability Within CMIP5 Using SMAP and ERA5 Data. Water Resour. Res. 2023, 59, e2022WR034225. [Google Scholar] [CrossRef]
- Zhang, Y.; Mao, G.; Chen, C.; Shen, L.; Xiao, B. Population Exposure to Compound Droughts and Heatwaves in the Observations and ERA5 Reanalysis Data in the Gan River Basin, China. Land 2021, 10, 1021. [Google Scholar] [CrossRef]
- Martins, D.S.; Paredes, P.; Raziei, T.; Pires, C.; Cadima, J.; Pereira, L.S. Assessing reference evapotranspiration estimation from reanalysis weather products. An application to the Iberian Peninsula. Int. J. Clim. 2017, 37, 2378–2397. [Google Scholar] [CrossRef]
- Meng, X.; Guo, H.; Cheng, J.; Yao, B. Can the ERA5 Reanalysis Product Improve the Atmospheric Correction Accuracy of Landsat Series Thermal Infrared Data? IEEE Geosci. Remote Sens. Lett. 2022, 19, 1–5. [Google Scholar] [CrossRef]
- Vicente-Serrano, S.M.; Domínguez-Castro, F.; Reig, F.; Tomas-Burguera, M.; Peña-Angulo, D.; Latorre, B.; Beguería, S.; Rabanaque, I.; Noguera, I.; Lorenzo-Lacruz, J.; et al. A global drought monitoring system and dataset based on ERA5 reanalysis: A focus on crop-growing regions. Geosci. Data J. 2023, 10, 505–518. [Google Scholar] [CrossRef]
- Paredes, P.; Martins, D.S.; Pereira, L.S.; Cadima, J.; Pires, C. Accuracy of daily estimation of grass reference evapotranspiration using ERA-Interim reanalysis products with assessment of alternative bias correction schemes. Agric. Water Manag. 2018, 210, 340–353. [Google Scholar] [CrossRef]
- Gourgouletis, N.; Gkavrou, M.; Baltas, E. Comparison of Empirical ETo Relationships with ERA5-Land and In Situ Data in Greece. Geographies 2023, 3, 499–521. [Google Scholar] [CrossRef]
- Pelosi, A.; Terribile, F.; D’urso, G.; Chirico, G.B. Comparison of ERA5-Land and UERRA MESCAN-SURFEX Reanalysis Data with Spatially Interpolated Weather Observations for the Regional Assessment of Reference Evapotranspiration. Water 2020, 12, 1669. [Google Scholar] [CrossRef]
- Pelosi, A.; Medina, H.; Bergh, J.V.D.; Vannitsem, S.; Chirico, G.B. Adaptive Kalman Filtering for Postprocessing Ensemble Numerical Weather Predictions. Mon. Weather Rev. 2017, 145, 4837–4854. [Google Scholar] [CrossRef]
- Viggiano, M.; Busetto, L.; Cimini, D.; Di Paola, F.; Geraldi, E.; Ranghetti, L.; Ricciardelli, E.; Romano, F. A new spatial modeling and interpolation approach for high-resolution temperature maps combining reanalysis data and ground measurements. Agric. For. Meteorol. 2019, 276–277, 107590. [Google Scholar] [CrossRef]
- Ferreira, P.M. GUINEA-BISSAU. Afr. Secur. Rev. 2004, 13, 44–56. [Google Scholar] [CrossRef]
- Kovsted, J.; Tarp, F. Guinea-Bissau: War, Reconstruction and Reform; UNU-WIDER: Helsinki, Finland, 1999; Available online: https://www.wider.unu.edu/sites/default/files/wp168.pdf (accessed on 10 August 2024).
- Republic of Guinea Bissau Framework Convention on Climate Change; National Communication: Bissau, Guinea Bissau, 2018; Available online: https://unfccc.int/sites/default/files/resource/TCN_Guinea_Bissau.pdf (accessed on 10 August 2024).
- Republic of Guinea Bissau Fifth National Report to the Convention on Biological Diversity; Secretary of State for Environment and Tourism: Bissau, Guinea Bissau, 2014; Available online: https://www.cbd.int/doc/world/gw/gw-nr-05-en.pdf (accessed on 10 August 2024).
- Samuel, N.; Lonatchedná, J.; Mendes, O.; Mendes, C. A Comparative Investigation of Evapotranspiration (ET) Obtained from Two Methods and Determining a Best Cultivation Period. Case of Bafata—Guinea Bissau. Int. J. Curr. Res. 2019, 11, 1468–1470. Available online: https://www.journalcra.com/article/comparative-investigation-evapotranspiration-et-obtained-two-methods-and-determining-best (accessed on 10 June 2025).
- Garbanzo, G.; Cameira, M.D.R.; Paredes, P.; Temudo, M.; Ramos, T.B. Modeling soil water and salinity dynamics in mangrove swamp rice production system of Guinea Bissau, West Africa. Agric. Water Manag. 2025, 313, 109494. [Google Scholar] [CrossRef]
- Garbanzo, G.; Céspedes, J.; Sandoval, J.; Temudo, M.; Paredes, P.; Cameira, M.D.R. Moving toward the Biophysical Characterization of the Mangrove Swamp Rice Production System in Guinea Bissau: Exploring Tools to Improve Soil- and Water-Use Efficiencies. Agronomy 2024, 14, 335. [Google Scholar] [CrossRef]
- Kottek, M.; Grieser, J.; Beck, C.; Rudolf, B.; Rubel, F. World map of the Köppen-Geiger climate classification updated. Meteorol. Z. 2006, 15, 259–263. [Google Scholar] [CrossRef] [PubMed]
- Beck, H.E.; Zimmermann, N.E.; McVicar, T.R.; Vergopolan, N.; Berg, A.; Wood, E.F. Present and future Köppen-Geiger climate classification maps at 1-km resolution. Sci. Data 2018, 5, 180214. [Google Scholar] [CrossRef]
- Harris, S.A. Comments on the Application of the Holdridge System for Classification of World Life Zones as Applied to Costa Rica. Arct. Alp. Res. 2014, 5, A187–A191. [Google Scholar] [CrossRef]
- Holdridge, L.R. Determination of World Plant Formations From Simple Climatic Data. Science 1947, 105, 367–368. [Google Scholar] [CrossRef] [PubMed]
- Middleton, N.; Thomas, D. World Atlas of Desertification; UNEP, United Nations: London, UK, 1997. [Google Scholar]
- Thornthwaite, C.W. An Approach toward a Rational Classification of Climate. Geogr. Rev. 1948, 38, 55–94. [Google Scholar] [CrossRef]
- C3S. ERA5: Fifth Generation of ECMWF Atmospheric Reanalyses of the Global Climate. Copernicus Climate Change Service Climate Data Store (CDS). Available online: https://cds.climate.copernicus.eu/cdsapp#!/home (accessed on 10 August 2024).
- Chevuru, S.; de Wit, A.; Supit, I.; Hutjes, R. Copernicus global crop productivity indicators: An evaluation based on regionally reported yields. Clim. Serv. 2023, 30, 100374. [Google Scholar] [CrossRef]
- Van Tricht, K.; Degerickx, J.; Gilliams, S.; Zanaga, D.; Battude, M.; Grosu, A.; Brombacher, J.; Lesiv, M.; Bayas, J.C.L.; Karanam, S.; et al. WorldCereal: A dynamic open-source system for global-scale, seasonal, and reproducible crop and irrigation mapping. Earth Syst. Sci. Data 2023, 15, 5491–5515. [Google Scholar] [CrossRef]
- Ruane, A.C.; Goldberg, R.; Chryssanthacopoulos, J. Climate forcing datasets for agricultural modeling: Merged products for gap-filling and historical climate series estimation. Agric. For. Meteorol. 2015, 200, 233–248. [Google Scholar] [CrossRef]
- Galmarini, S.; Solazzo, E.; Ferrise, R.; Srivastava, A.K.; Ahmed, M.; Asseng, S.; Cannon, A.; Dentener, F.; De Sanctis, G.; Gaiser, T.; et al. Assessing the impact on crop modelling of multi- and uni-variate climate model bias adjustments. Agric. Syst. 2024, 215, 103846. [Google Scholar] [CrossRef]
- Global Modeling and Assimilation Office (GMAO). MERRA-2 statD_2d_slv_Nx: 2d, Daily, Aggregated Statistics, Single-Level, Assimilation, Single-Level Diagnostics V5.12.4; Goddard Earth Sciences Data and Information Services Center (GES DISC): Greenbelt, MD, USA, 2015. Available online: https://disc.gsfc.nasa.gov/datasets/M2SDNXSLV_5.12.4/summary (accessed on 10 December 2024).
- Global Modeling and Assimilation Office (GMAO). MERRA-2 tavg1_2d_flx_Nx: 2d, 1-Hourly, Time-Averaged, Single-Level, Assimilation, Surface Flux Diagnostics V5.12.4; Goddard Earth Sciences Data and Information Services Center (GES DISC): Greenbelt, MD, USA, 2015. Available online: https://disc.gsfc.nasa.gov/datasets/M2T1NXFLX_5.12.4/summary (accessed on 10 December 2024).
- Hersbach, H.; Bell, B.; Berrisford, P.; Hirahara, S.; Horányi, A.; Muñoz-Sabater, J.; Nicolas, J.; Peubey, C.; Radu, R.; Schepers, D.; et al. The ERA5 global reanalysis. Q. J. R. Meteorol. Soc. 2020, 146, 1999–2049. [Google Scholar] [CrossRef]
- Gelaro, R.; McCarty, W.; Suárez, M.J.; Todling, R.; Molod, A.; Takacs, L.; Randles, C.A.; Darmenov, A.; Bosilovich, M.G.; Reichle, R.; et al. The Modern-Era Retrospective Analysis for Research and Applications, Version 2 (MERRA-2). J. Clim. 2017, 30, 5419–5454. [Google Scholar] [CrossRef] [PubMed]
- van Rossum, G.; Drake, F.L. Python 3 Reference Manual; CreateSpace: Scotts Valley, CA, USA, 2009; ISBN 1441412697. [Google Scholar]
- Mardia, K.V.; Kent, J.T.; Bibby, J.M. Multivariate Analysis; Academic Press: London, UK; New York, NY, USA, 1979; ISBN 0124712525. [Google Scholar]
- Soulis, K.; Dosiadis, E.; Nikitakis, E.; Charalambopoulos, I.; Kairis, O.; Katsogiannou, A.; Gravani, S.P.; Kalivas, D. Assessing AgERA5 and MERRA-2 Global Climate Datasets for Small-Scale Agricultural Applications. Atmosphere 2025, 16, 263. [Google Scholar] [CrossRef]
- Pelosi, A.; Chirico, G. Regional assessment of daily reference evapotranspiration: Can ground observations be replaced by blending ERA5-Land meteorological reanalysis and CM-SAF satellite-based radiation data? Agric. Water Manag. 2021, 258, 107169. [Google Scholar] [CrossRef]
- Vanella, D.; Longo-Minnolo, G.; Belfiore, O.R.; Ramírez-Cuesta, J.M.; Pappalardo, S.; Consoli, S.; D’urso, G.; Chirico, G.B.; Coppola, A.; Comegna, A.; et al. Comparing the use of ERA5 reanalysis dataset and ground-based agrometeorological data under different climates and topography in Italy. J. Hydrol. Reg. Stud. 2022, 42, 101182. [Google Scholar] [CrossRef]
- Pelosi, A. Performance of the Copernicus European Regional Reanalysis (CERRA) dataset as proxy of ground-based agrometeorological data. Agric. Water Manag. 2023, 289, 108556. [Google Scholar] [CrossRef]
- Todorovic, M.; Karic, B.; Pereira, L.S. Reference evapotranspiration estimate with limited weather data across a range of Mediterranean climates. J. Hydrol. 2013, 481, 166–176. [Google Scholar] [CrossRef]
- Hargreaves, G.H.; Samani, Z.A. Estimating Potential Evapotranspiration. J. Irrig. Drain. Div. 1982, 108, 225–230. [Google Scholar] [CrossRef]
- Paredes, P.; Pereira, L. Computing FAO56 reference grass evapotranspiration PM-ETo from temperature with focus on solar radiation. Agric. Water Manag. 2019, 215, 86–102. [Google Scholar] [CrossRef]
- Dodge, Y. The Concise Encyclopedia of Statistics; Springer: New York, NY, USA, 2008. [Google Scholar]
- D’Enza, A.I.; Greenacre, M. Multiple Correspondence Analysis for the Quantification and Visualization of Large Categorical Data Sets. In Advanced Statistical Methods for the Analysis of Large Data-Sets; Di Ciaccio, A., Coli, M., Angulo Ibanez, J.M., Eds.; Springer: Berlin/Heidelberg, Germany, 2012; pp. 453–463. ISBN 978-3-642-21036-5. [Google Scholar]
- Allen, R.G. Assessing Integrity of Weather Data for Reference Evapotranspiration Estimation. J. Irrig. Drain. Eng. 1996, 122, 97–106. [Google Scholar] [CrossRef]
- Levene, H. Robust Tests for the Equality of Variance. In Contributions to Probability and Statistics; Olkin, I., Ed.; Stanford University Press: Paolo Alto, CA, USA, 1960; pp. 278–292. [Google Scholar]
- Montgomery, D.C.; Runger, G.C. Applied Statistics and Probability for Engineers, 5th ed.; John Wiley & Sons, Inc.: Sedona, AZ, USA, 2011. [Google Scholar]
- Allen, R. Quality Assessment of Weather Data and Micrometeological Flux-Impacts on Evapotranspiration Calculation. J. Agric. Meteorol. 2008, 64, 191–204. [Google Scholar] [CrossRef]
- R Core Team. R: A Language and Environment for Statistical Computing; R Foundation for Statistical Computing: Vienna, Austria, 2023; Available online: https://www.R-project.org/ (accessed on 30 March 2024).
- Dunkerly, C.; Huntington, J.L.; McEvoy, D.; Morway, A.; Allen, R.G. agweather-qaqc: An Interactive Python Package for Quality Assurance and Quality Control of Daily Agricultural Weather Data and Calculation of Reference Evapotranspiration. J. Open Source Softw. 2024, 9, 6368. [Google Scholar] [CrossRef]
- Conover, W.J. Practical Nonparametric Statistics; Wiley: New York, NY, USA, 1999. [Google Scholar]
- Alvo, M.; Yu, P.L.H. A Parametric Approach to Nonparametric Statistics; Springer Series in the Data Sciences; Springer International Publishing: Cham, Switzerland, 2018; ISBN 978-3-319-94152-3. [Google Scholar]
- Kassambara, A. Multivariate Analysis. Practical Guide To Cluster Analysis in R. Unsupervised Machine Learning; Sthda: Marseille, France, 2017. [Google Scholar]
- Syakur, M.A.; Khotimah, B.K.; Rochman, E.M.S.; Satoto, B.D. Integration K-Means Clustering Method and Elbow Method For Identification of The Best Customer Profile Cluster. IOP Conf. Ser. Mater. Sci. Eng. 2018, 336, 012017. [Google Scholar] [CrossRef]
- Thorndike, R.L. Who Belongs in the Family? Psychometrika 1953, 18, 267–276. [Google Scholar] [CrossRef]
- Céspedes, J.; Garbanzo, G.; Cabral, A.; Temudo, M.; Campagnolo, M. An Approach to Monitoring Rice Development in the Mangrove Swamp Rice Production System of Guinea-Bissau. Int. J. Appl. Earth Obs. Geoinf. 2025. submitted. [Google Scholar]
- Garbanzo, G.; Céspedes, J.; Temudo, M.; Cameira, M.D.R.; Paredes, P.; Ramos, T. Advances in soil salinity diagnosis for mangrove swamp rice production in Guinea Bissau, West Africa. Sci. Remote Sens. 2025, 11, 100231. [Google Scholar] [CrossRef]
- Bapat, R.B. Linear Algebra and Linear Models, 3rd ed.; Springer: New York, NY, USA, 2012. [Google Scholar]
- Huber, P.; Ronchetti, E. Robust Statistics, 2nd ed.; Wiley: Hoboken, NJ, USA, 2009. [Google Scholar]
- Broccoli, A.J.; Manabe, S. Can existing climate models be used to study anthropogenic changes in tropical cyclone climate? Geophys. Res. Lett. 1990, 17, 1917–1920. [Google Scholar] [CrossRef]
- Hartshorn, G.S. Tropical Forest Ecosystems. In Encyclopedia of Biodiversity; Elsevier: Amsterdam, The Netherlands, 2013; pp. 269–276. [Google Scholar]
- Frank, W.M.; Young, G.S. The Interannual Variability of Tropical Cyclones. Mon. Weather Rev. 2007, 135, 3587–3598. [Google Scholar] [CrossRef]
- Linares, O.F. African rice (Oryza glaberrima): History and future potential. Proc. Natl. Acad. Sci. USA 2002, 99, 16360–16365. [Google Scholar] [CrossRef] [PubMed]
- Garbanzo, G.; Cameira, M.D.R.; Paredes, P. The Mangrove Swamp Rice Production System of Guinea Bissau: Identification of the Main Constraints Associated with Soil Salinity and Rainfall Variability. Agronomy 2024, 14, 468. [Google Scholar] [CrossRef]
- Mendes, O.; Fragoso, M. Assessment of the Record-Breaking 2020 Rainfall in Guinea-Bissau and Impacts of Associated Floods. Geosciences 2023, 13, 25. [Google Scholar] [CrossRef]
- Mendes, O.; Correia, E.; Fragoso, M. Variability and trends of the rainy season in West Africa with a special focus on Guinea-Bissau. Theor. Appl. Clim. 2025, 156, 242. [Google Scholar] [CrossRef]
- Temudo, M.P.; Cabral, A.I.R. Climate change as the last trigger in a long-lasting conflict: The production of vulnerability in northern Guinea-Bissau, West Africa. J. Peasant Stud. 2023, 50, 315–338. [Google Scholar] [CrossRef]
- Qiu, R.; Li, L.; Kang, S.; Liu, C.; Wang, Z.; Cajucom, E.P.; Zhang, B.; Agathokleous, E. An improved method to estimate actual vapor pressure without relative humidity data. Agric. For. Meteorol. 2021, 298–299, 108306. [Google Scholar] [CrossRef]
- Trajkovic, S.; Gocic, M.; Pongracz, R.; Bartholy, J.; Milanovic, M. Assessment of Reference Evapotranspiration by Regionally Calibrated Temperature-Based Equations. KSCE J. Civ. Eng. 2020, 24, 1020–1027. [Google Scholar] [CrossRef]
- Ramos, T.B.; Gonçalves, M.C.; van Genuchten, M.T. Soil salinization in Portugal: An in-depth exploration of impact, advancements, and future considerations. Vadose Zone J. 2024, 23, e20314. [Google Scholar] [CrossRef]
- Tiruye, A.; Ditthakit, P.; Linh, N.T.T.; Wipulanusat, W.; Weesakul, U.; Thongkao, S. Comparing WaPOR and ERA5-Land: Innovative Estimations of Precipitation and Evapotranspiration in the Tana Basin, Ethiopia. Earth Syst. Environ. 2024, 8, 1225–1246. [Google Scholar] [CrossRef]
- Lopez-Guerrero, A.; Cabello-Leblic, A.; Fereres, E.; Vallee, D.; Steduto, P.; Jomaa, I.; Owaneh, O.; Alaya, I.; Bsharat, M.; Ibrahim, A.; et al. Developing a Regional Network for the Assessment of Evapotranspiration. Agronomy 2023, 13, 2756. [Google Scholar] [CrossRef]
- Ippolito, M.; De Caro, D.; Cannarozzo, M.; Provenzano, G.; Ciraolo, G. Evaluation of daily crop reference evapotranspiration and sensitivity analysis of FAO Penman-Monteith equation using ERA5-Land reanalysis database in Sicily, Italy. Agric. Water Manag. 2024, 295, 108732. [Google Scholar] [CrossRef]
- Mendes, O.; Fragoso, M. Recent changes in climate extremes in Guinea-Bissau. Afr. Geogr. Rev. 2024, 44, 166–184. [Google Scholar] [CrossRef]


| Region | Weather Station | Latitude (°N) | Longitude (°W) | Elevation (m) | Start of Data Collection | End of Data Collection | Number of 30 min Records |
|---|---|---|---|---|---|---|---|
| South | Cafine | 11.214919 | −15.174659 | 6.0 | 8 April 2021 | 1 June 2024 | 45,563 |
| Quebil | 11.270221 | −15.236727 | 8.4 | 10 March 2021 | 30 May 2024 | 16,378 | |
| Buba | 11.587290 | −14.998417 | 10.9 | 22 August 2021 | 30 May 2024 | 45,193 | |
| Central | Malafu | 12.014828 | −15.020001 | 24.9 | 10 April 2021 | 30 May 2024 | 48,388 |
| Enchugal | 12.046918 | −15.436894 | 16.6 | 11 April 2021 | 29 May 2024 | 43,768 | |
| Bissora | 12.220728 | −15.444387 | 15.1 | 11 January 2022 | 3 June 2024 | 41,951 | |
| Cacheu | 12.258014 | −16.157159 | 21.2 | 12 January 2022 | 11 June 2024 | 42,280 | |
| North | S. Domingos | 12.414232 | −16.182400 | 12.5 | 12 April 2021 | 4 June 2024 | 45,132 |
| Djobel | 12.280922 | −16.392913 | 10.0 | 12 July 2022 | 5 June 2024 | 49,978 | |
| Elalab | 12.246547 | −16.443420 | 10.8 | 12 April 2021 | 4 June 2024 | 45,176 | |
| Island | Bubaque | 11.299951 | −15.831088 | 29.8 | 9 January 2022 | 31 December 2023 | 34,634 |
| Variable | Mann–Kendall Test | Wilcoxon Rank Test | Levene’s Test | |||
|---|---|---|---|---|---|---|
| Z-Value | p-Value | Rank–W | p-Value | F-Value | p-Value | |
| RHAvg | 0.09 | 0.47 | 124.70 | 0.43 | 1.56 | 0.27 |
| RHMax | 1.22 | 0.25 | 96.30 | 0.27 | 3.51 | 0.30 |
| RHMin | 0.07 | 0.55 | 141.10 | 0.52 | 3.14 | 0.34 |
| Tavg | 1.02 | 0.44 | 97.40 | 0.37 | 0.58 | 0.54 |
| Tmax | 1.57 | 0.21 | 77.05 | 0.14 | 1.39 | 0.47 |
| Tmin | −0.07 | 0.56 | 133.90 | 0.62 | 1.17 | 0.44 |
| Wind speed | 1.64 | 0.11 | 68.10 | 0.07 | 2.94 | 0.23 |
| Site | Tmin | Tmax | TDavg | RHmax | RHmin | RHavg | u2 avg |
|---|---|---|---|---|---|---|---|
| °C | °C | °C | % | % | % | m s−1 | |
| Cafine | 22.9 b | 31.7 d | 9.5 bc | 99.1 a | 68.9 a | 78.8 a | 1.3 c |
| Malafu | 21.5 f | 33.3 bc | 13.3 ab | 98.6 b | 62.2 bc | 75.2 b | 0.8 f |
| Djobel | 22.5 bcd | 32.7 c | 10.8 b | 98.8 b | 59.8 cd | 77.7 a | 2.1 a |
| Enchugal | 21.8 de | 33.1 bc | 12.1 ab | 93.7 c | 57.8 de | 70.5 c | 0.9 e |
| Buba | 22.6 cde | 33.3 ab | 12.1 ab | 99.2 ab | 55.8 e | 75.0 b | 1.6 c |
| Elalab | 22.6 bc | 31.9 d | 10.5 b | 92.9 cd | 56.1 e | 71.3 c | 1.7 b |
| Cacheu | 21.5 ef | 33.4 ab | 13.2 a | 92.7 d | 55.5 e | 70.1 c | 1.1 d |
| Bubaque | 24.3 a | 30.8 e | 6.8 c | 92.3 d | 67.5 ab | 76.8 ab | 0.8 f |
| Bissora | 20.3 f | 34.2 a | 14.8 a | 89.4 e | 49.9 f | 67.3 c | 0.7 g |
| S. Domingo | 19.8 f | 33.7 a | 13.9 a | 94.8 c | 49.3 f | 71.9 c | 0.8 f |
| Quebil | 22.2 cd | 33.2 ab | 11.0 b | 88.7 e | 40.4 g | 64.6 d | 0.8 f |
| Shp_wilk | <0.01 | <0.01 | <0.01 | <0.01 | <0.01 | < 0.01 | <0.01 |
| n | 492 | 492 | 492 | 492 | 492 | 492 | 492 |
| α | <0.01 | <0.01 | <0.01 | <0.01 | <0.01 | <0.01 | <0.01 |
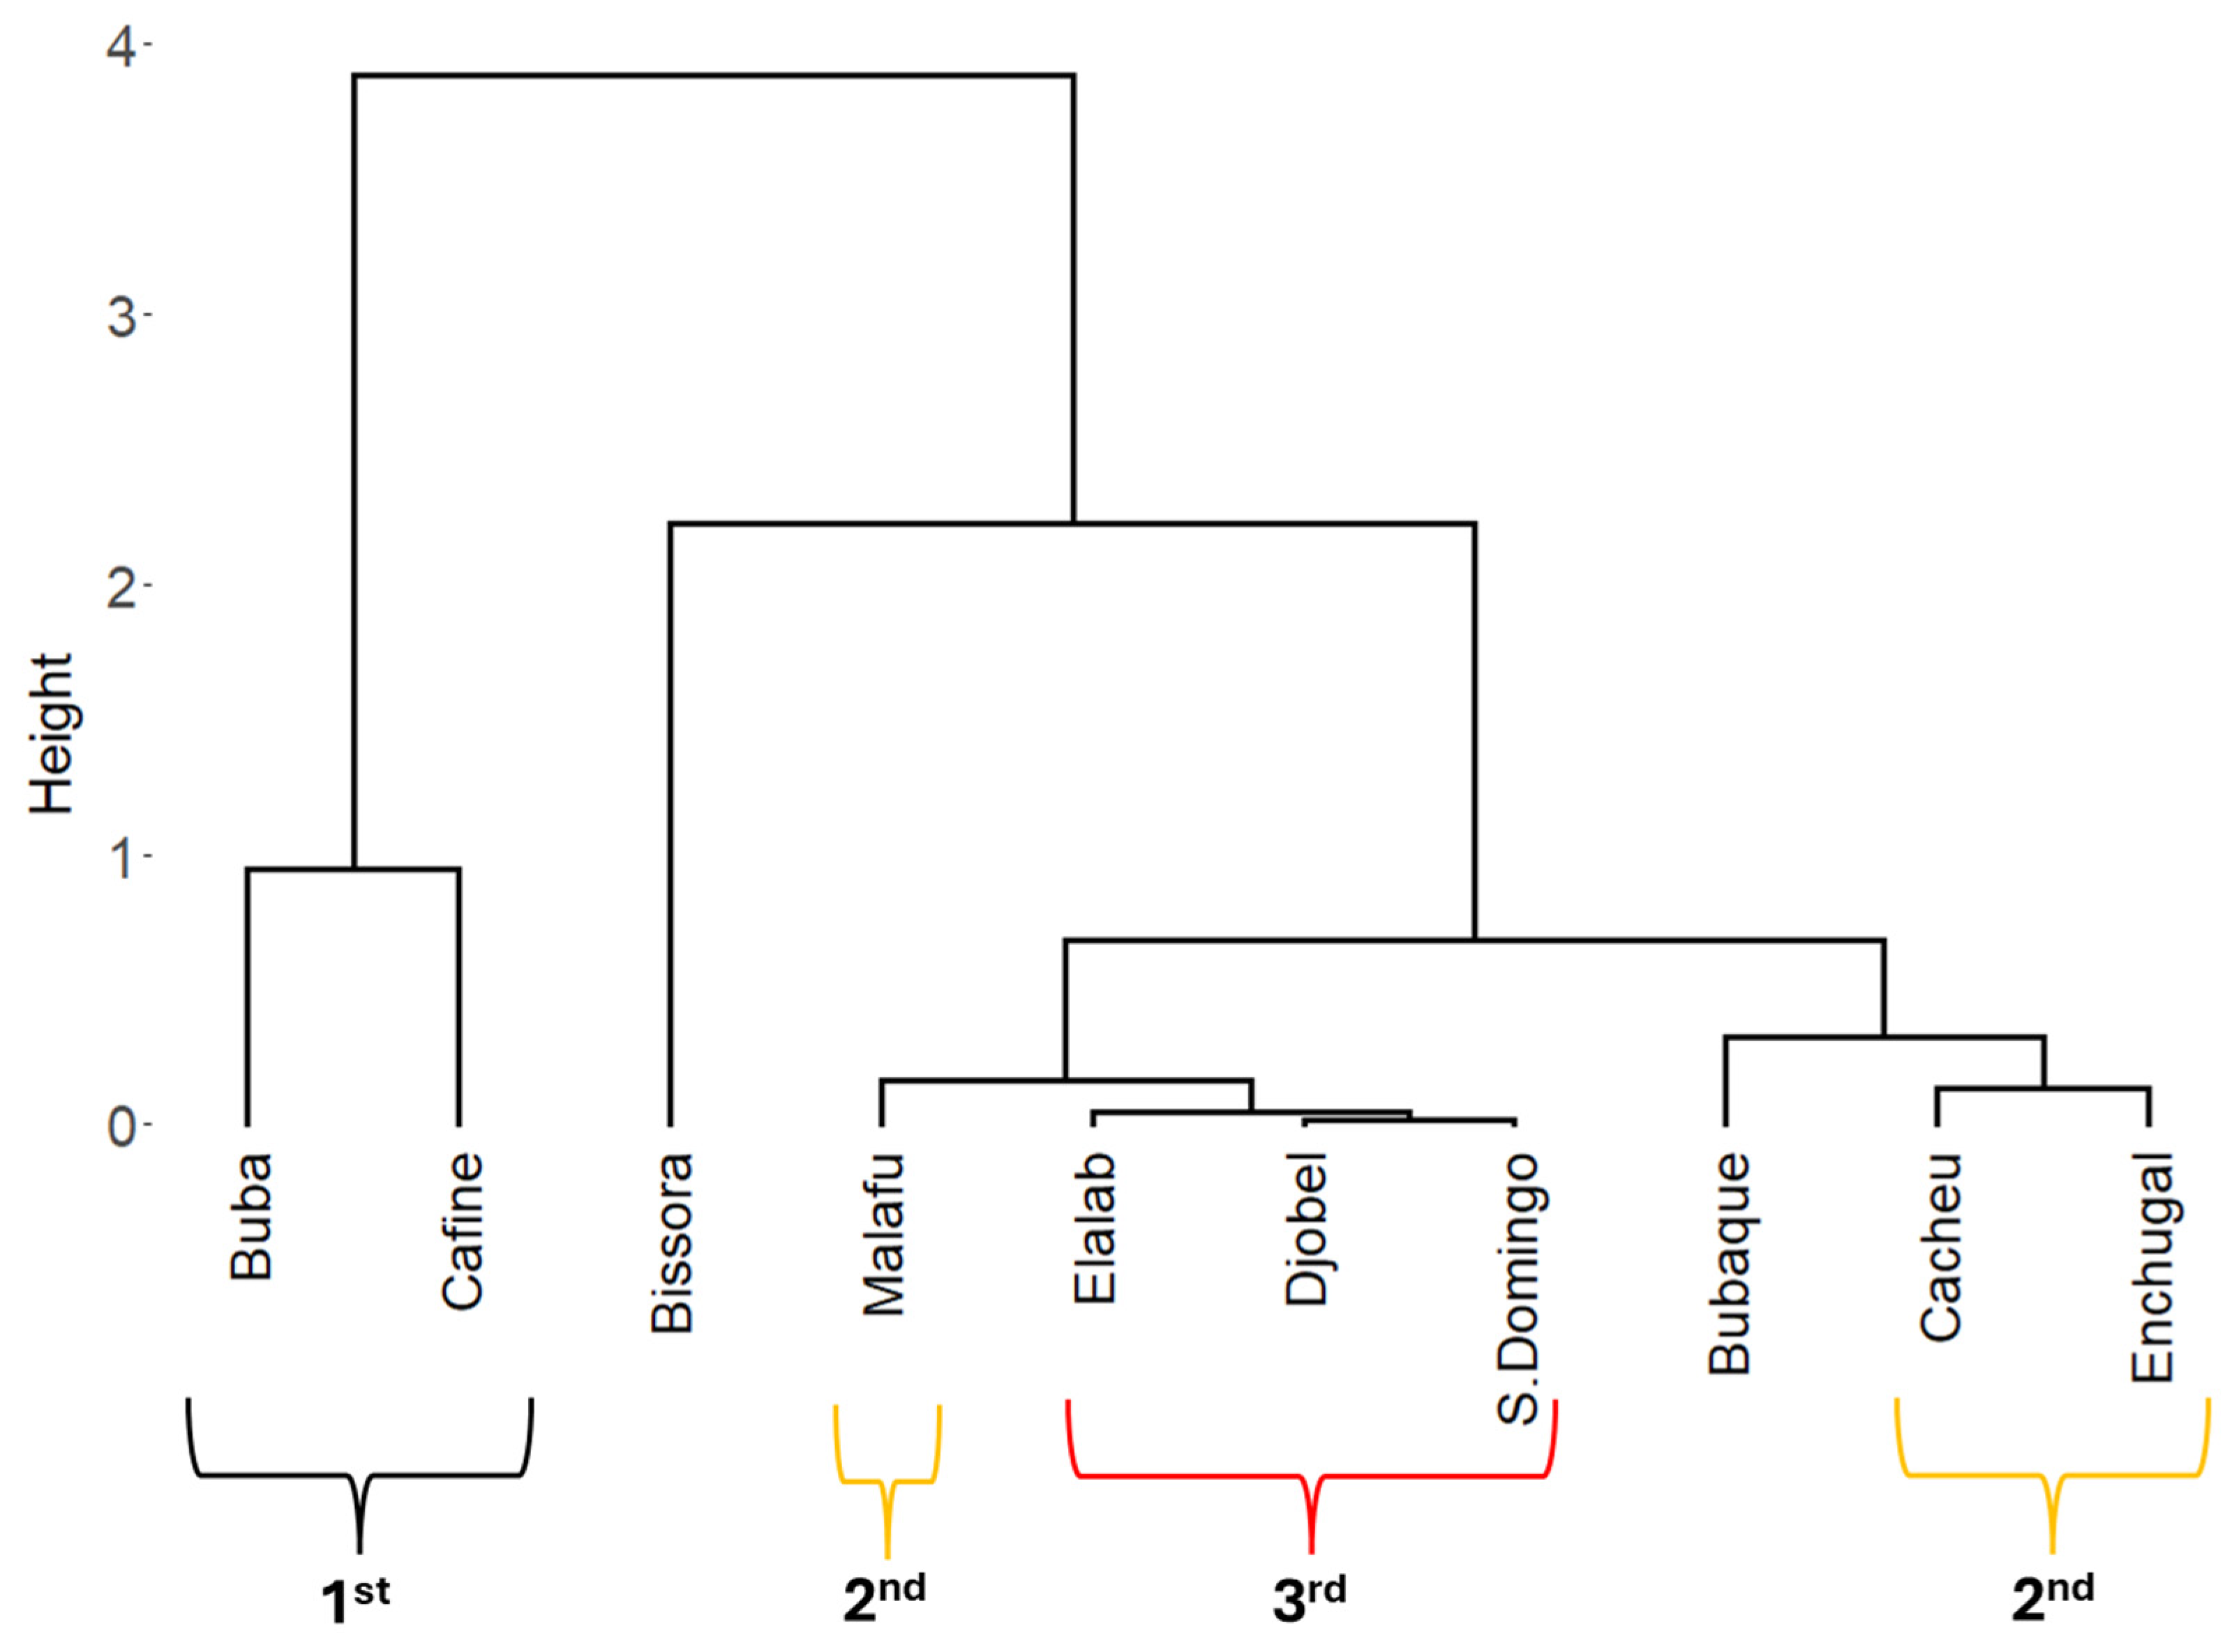
| Cluster | Predictive Equations | kRs | Minimized RMSE (°C−0.5) | Equation | |
|---|---|---|---|---|---|
| 1 | Cafine, Buba, Quebil | 0.196 | 7.9 × 10⁻⁷ | (12) | |
| 2 | Enchugal, Cacheu, Malafu | 0.183 | 1.1 × 10⁻⁶ | (13) | |
| 3 | Djobel, Elalab, S. Domingo | 0.208 | 5.6 × 10⁻⁷ | (14) | |
| - | Bissora | 0.174 | 9.4 × 10⁻⁷ | (15) | |
| - | Bubaque | 0.232 | 2.9 × 10⁻⁶ | (16) | |
| Climate | Predictors | Goodness-of-Fit Indicators | |||||||
|---|---|---|---|---|---|---|---|---|---|
| Tdew | kRs | u2 | b0 | R2 | RMSE (mm d−1) | NRMSE (%) | BIAS | PBIAS (%) | |
| Moist sub-humid | Tmin | Global | Default | 0.93 abc | 0.96 a | 1.00 ab | 20.59 ab | −0.28 bc | −5.83 abc |
| Avg | 0.82 ab | 0.97 a | 1.13 ab | 23.62 ab | −0.78 a | −16.40 ab | |||
| Climate | Default | 0.90 abc | 0.96 a | 1.04 ab | 21.5 ab | −0.42 abc | −8.4 abc | ||
| Avg | 0.79 a | 0.97 a | 1.24 a | 25.73 a | −0.91 ab | −19.17 a | |||
| Optm | Default | 1.07 c | 0.97 a | 1.08 ab | 22.53 ab | 0.43 c | 9.28 c | ||
| Avg | 0.98 bc | 0.98 a | 0.80 b | 16.49 b | −0.01 bc | −0.33 bc | |||
| Humid | Tmin | Global | Default | 0.92 abcde | 0.97 a | 0.87 abcde | 18.61 abcde | −0.36 abcde | −6.78 abcde |
| Avg | 0.82 abc | 0.98 ab | 1.03 abc | 22.01 abc | −0.76 abc | −16.22 abc | |||
| Climate | Default | 0.97 bcde | 0.97 ab | 0.86 abcde | 18.32 abcde | −0.06 bcde | −1.22 bcde | ||
| Avg | 0.88 abcde | 0.98 ab | 0.87 abcde | 18.63 abcde | −0.48 abcde | −10.22 abcde | |||
| Optm | Default | 1.07 e | 0.97 ab | 0.91 abcde | 19.31 abcde | 0.38 e | 8.12 e | ||
| Avg | 0.98 cde | 0.98 ab | 0.68 de | 14.60 de | −0.01 cde | −0.21 cde | |||
| Tmean-2 | Global | Default | 0.86 ab | 0.98 ab | 1.12 ab | 23.82 ab | −0.86 ab | −18.33 ab | |
| Avg | 0.78 a | 0.98 ab | 1.20 a | 25.43 a | −0.97 a | −20.68 a | |||
| Climate | Default | 0.86 abcd | 0.98 ab | 0.95 abcde | 21.11 abcde | −0.57 abcd | −12.15 abcd | ||
| Avg | 0.85 abcd | 0.98 ab | 0.99 abcde | 21.14 abcde | −0.66 abcd | −14.03 abcd | |||
| Optm | Default | 0.97 bcde | 0.98 ab | 0.72 bcde | 15.42 bcde | −0.09 bcde | −1.83 bcde | ||
| Avg | 0.96 abcde | 0.98 ab | 0.71 cde | 15.10 cde | −0.14 abcde | −2.95 abcde | |||
| Tmean-aD (aD opt) | Global | Default | 0.91 abcde | 0.98 ab | 1.02 abcde | 16.64 abcd | −0.33 abcde | −6.91 abcde | |
| Avg | 0.82 abcd | 0.98 ab | 1.02 abcd | 21.72 abcde | −0.75 abcd | −15.91 abcd | |||
| Climate | Default | 0.95 abcde | 0.98 ab | 0.72 abcde | 15.31 cde | −0.15 abcde | −3.10 abcde | ||
| Avg | 0.91 abcde | 0.98 ab | 0.78 cde | 16.63 abcde | −0.33 abcde | −6.91 abcde | |||
| Optm | Default | 0.99 de | 0.98 ab | 0.70 cde | 14.90 cde | 0.03 de | 0.57 de | ||
| Avg | 0.99 cde | 0.98 b | 0.67 e | 14.33 e | 0.02 cde | 0.47 de | |||
Disclaimer/Publisher’s Note: The statements, opinions and data contained in all publications are solely those of the individual author(s) and contributor(s) and not of MDPI and/or the editor(s). MDPI and/or the editor(s) disclaim responsibility for any injury to people or property resulting from any ideas, methods, instructions or products referred to in the content. |
© 2025 by the authors. Licensee MDPI, Basel, Switzerland. This article is an open access article distributed under the terms and conditions of the Creative Commons Attribution (CC BY) license (https://creativecommons.org/licenses/by/4.0/).
Share and Cite
Garbanzo, G.; Céspedes, J.; Temudo, M.; Ramos, T.B.; Cameira, M.d.R.; Pereira, L.S.; Paredes, P. Addressing Weather Data Gaps in Reference Crop Evapotranspiration Estimation: A Case Study in Guinea-Bissau, West Africa. Hydrology 2025, 12, 161. https://doi.org/10.3390/hydrology12070161
Garbanzo G, Céspedes J, Temudo M, Ramos TB, Cameira MdR, Pereira LS, Paredes P. Addressing Weather Data Gaps in Reference Crop Evapotranspiration Estimation: A Case Study in Guinea-Bissau, West Africa. Hydrology. 2025; 12(7):161. https://doi.org/10.3390/hydrology12070161
Chicago/Turabian StyleGarbanzo, Gabriel, Jesus Céspedes, Marina Temudo, Tiago B. Ramos, Maria do Rosário Cameira, Luis Santos Pereira, and Paula Paredes. 2025. "Addressing Weather Data Gaps in Reference Crop Evapotranspiration Estimation: A Case Study in Guinea-Bissau, West Africa" Hydrology 12, no. 7: 161. https://doi.org/10.3390/hydrology12070161
APA StyleGarbanzo, G., Céspedes, J., Temudo, M., Ramos, T. B., Cameira, M. d. R., Pereira, L. S., & Paredes, P. (2025). Addressing Weather Data Gaps in Reference Crop Evapotranspiration Estimation: A Case Study in Guinea-Bissau, West Africa. Hydrology, 12(7), 161. https://doi.org/10.3390/hydrology12070161