
Borehole Geophysical Time-Series Logging to Monitor Passive ISCO Treatment of Residual Chlorinated-Ethenes in a Confining Bed, NAS Pensacola, Florida


Abstract

1. Introduction
2. Site Description
3. Methods
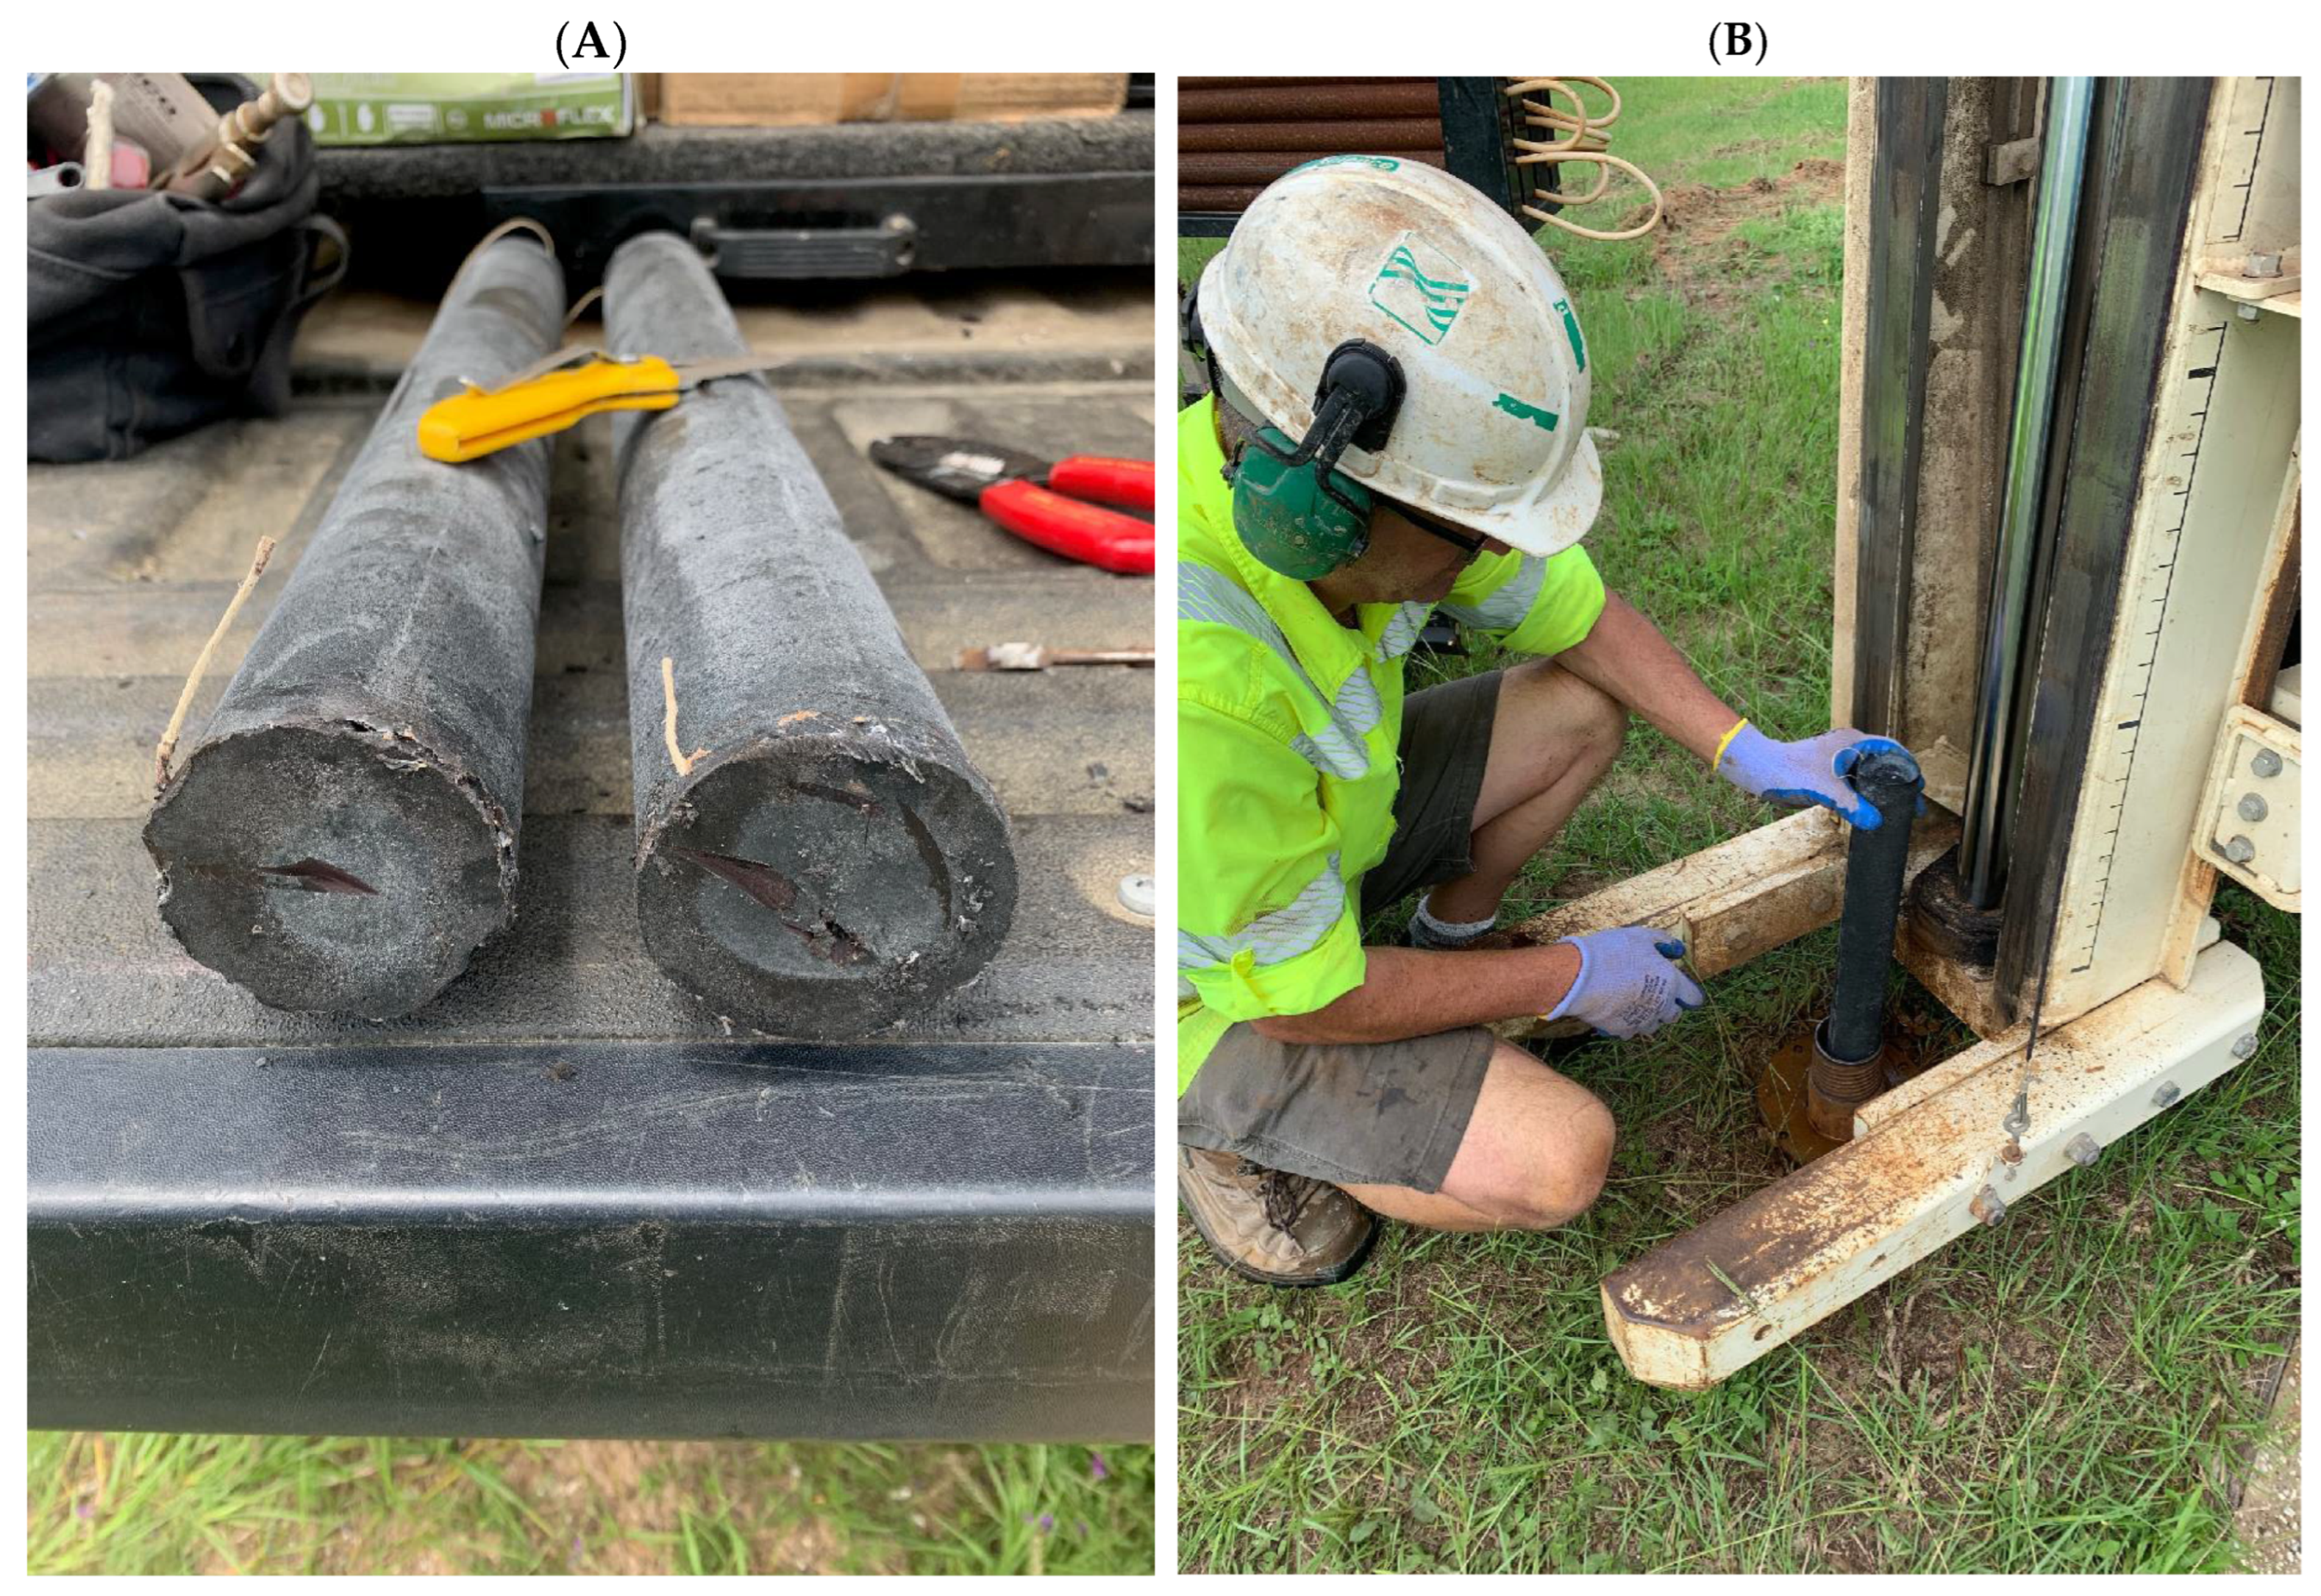
3.1. P-ISCO
3.2. Borehole Geophysical Tools
3.2.1. Borehole EM-Induction Logging
3.2.2. NGR Logging
3.3. Groundwater Parameters and Chemical Constituent Sampling and Analyses
4. Results
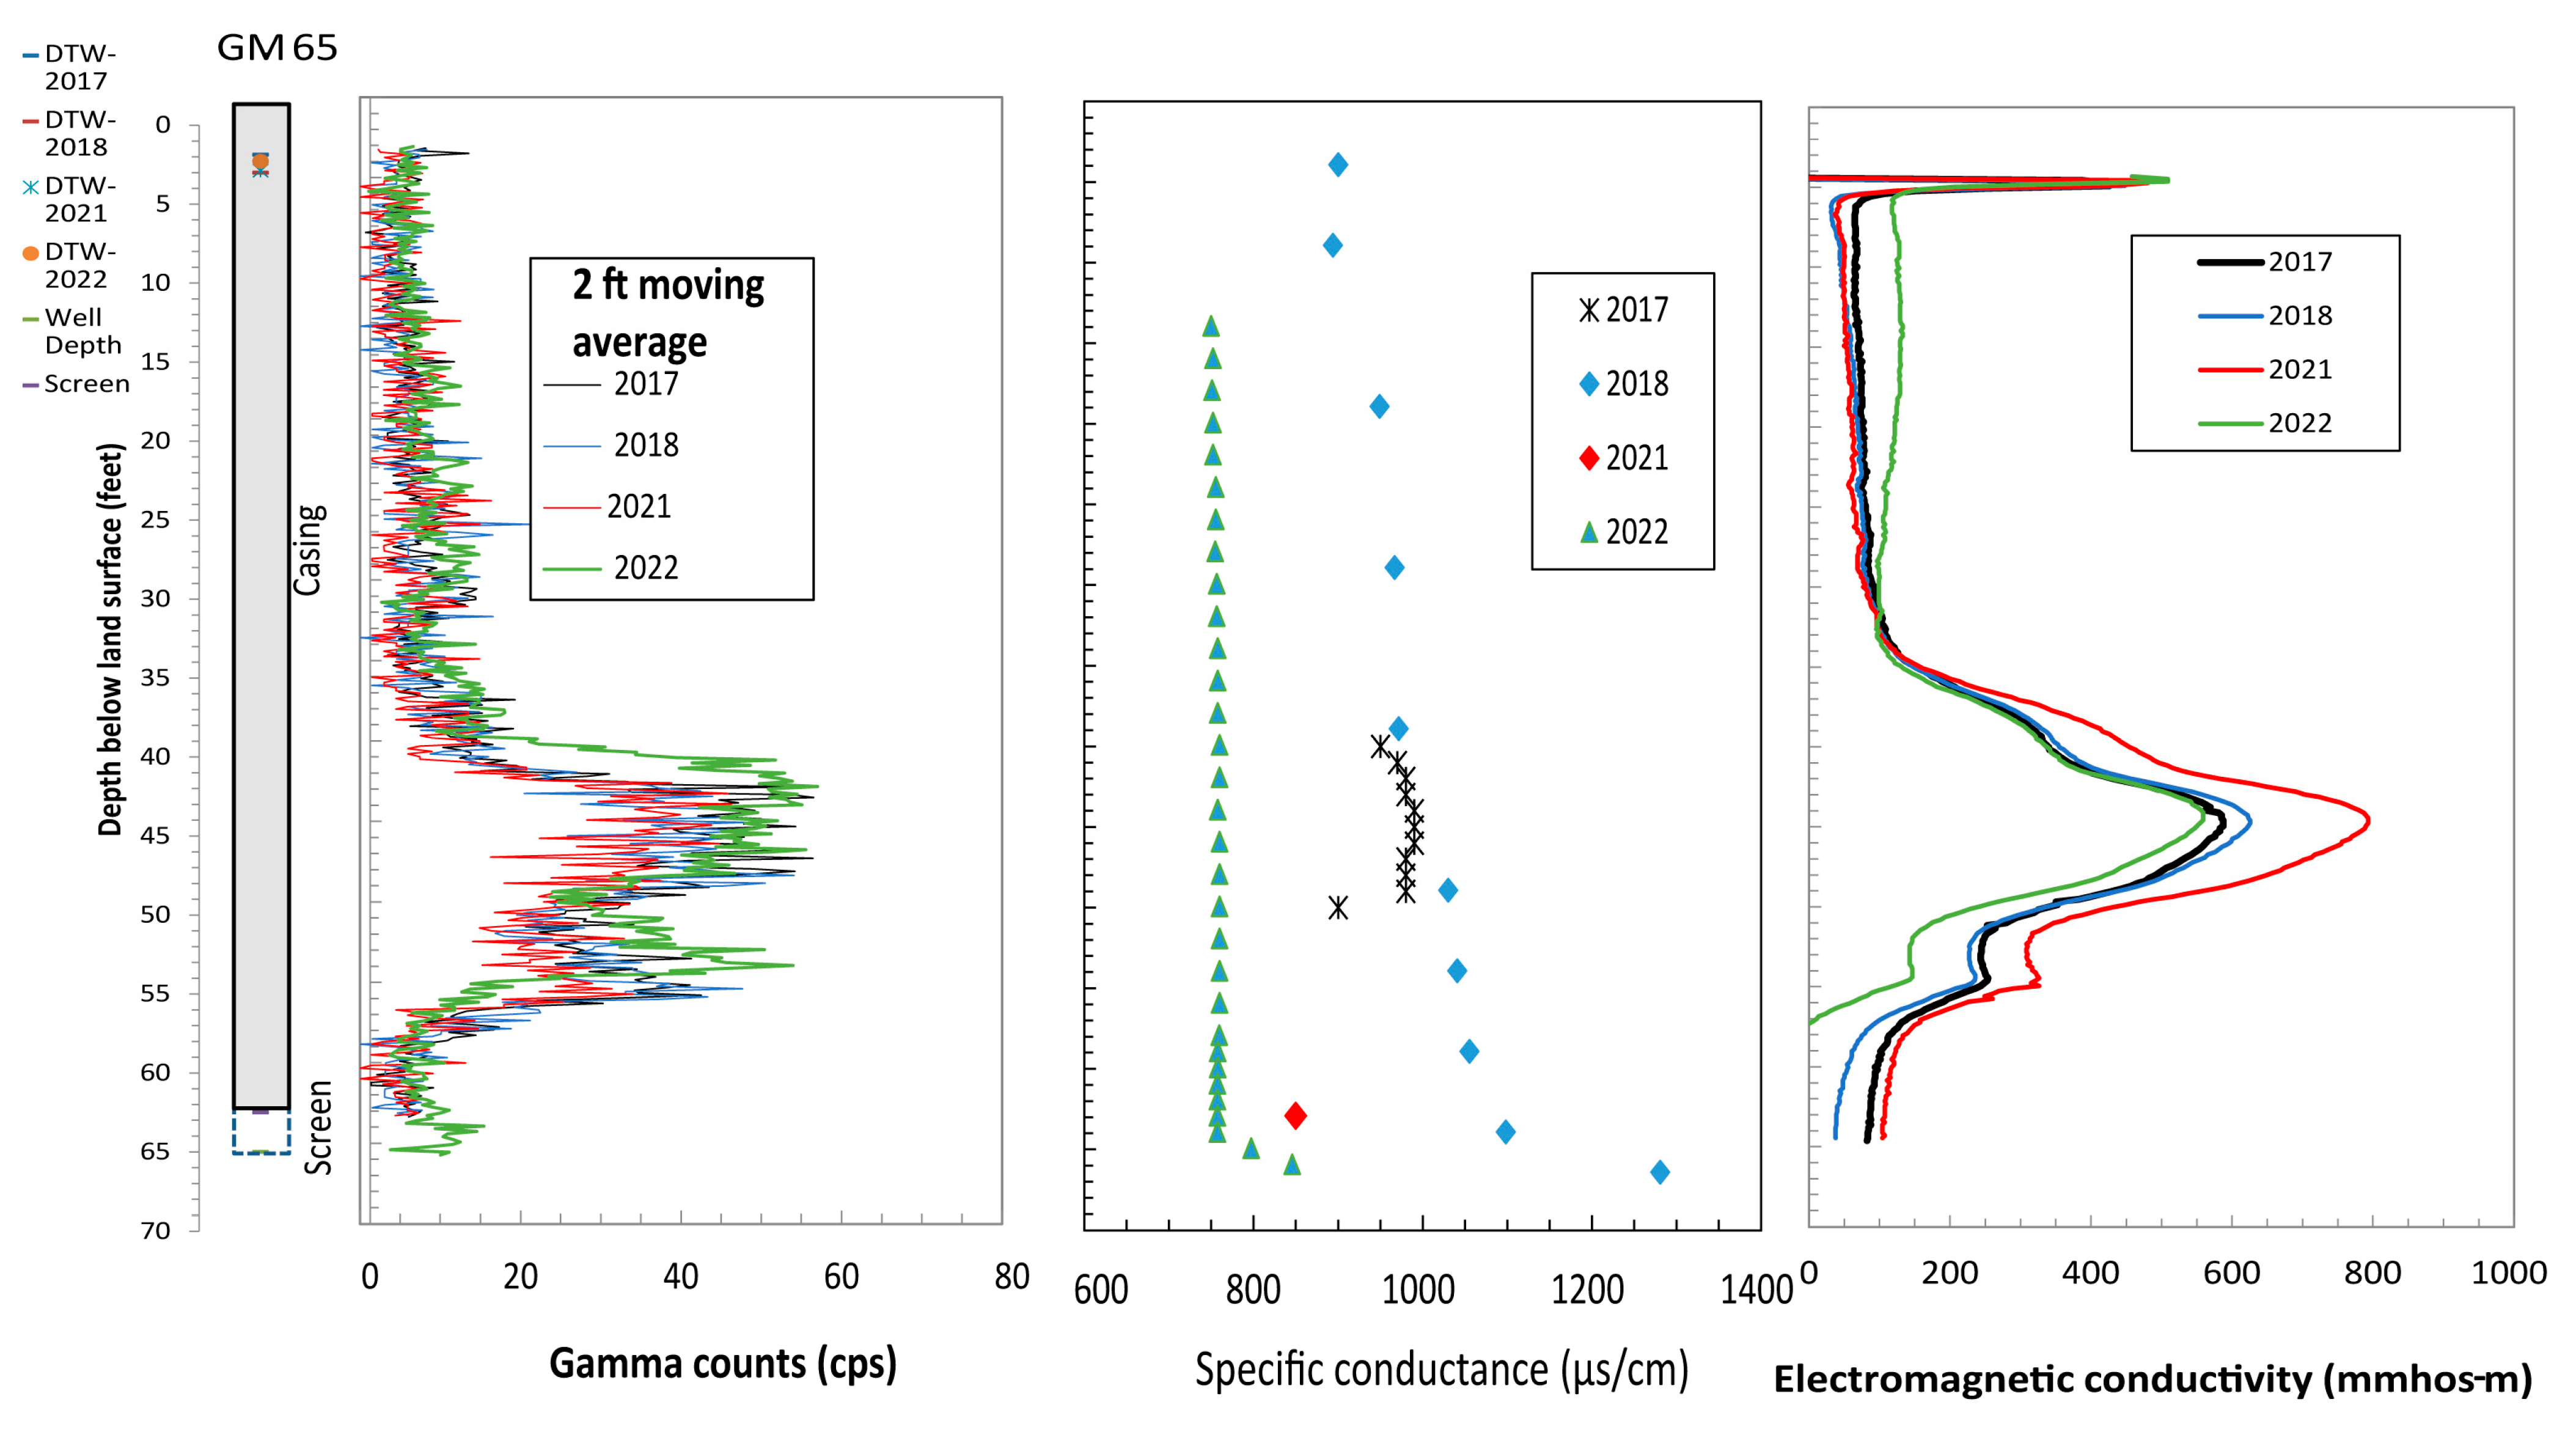
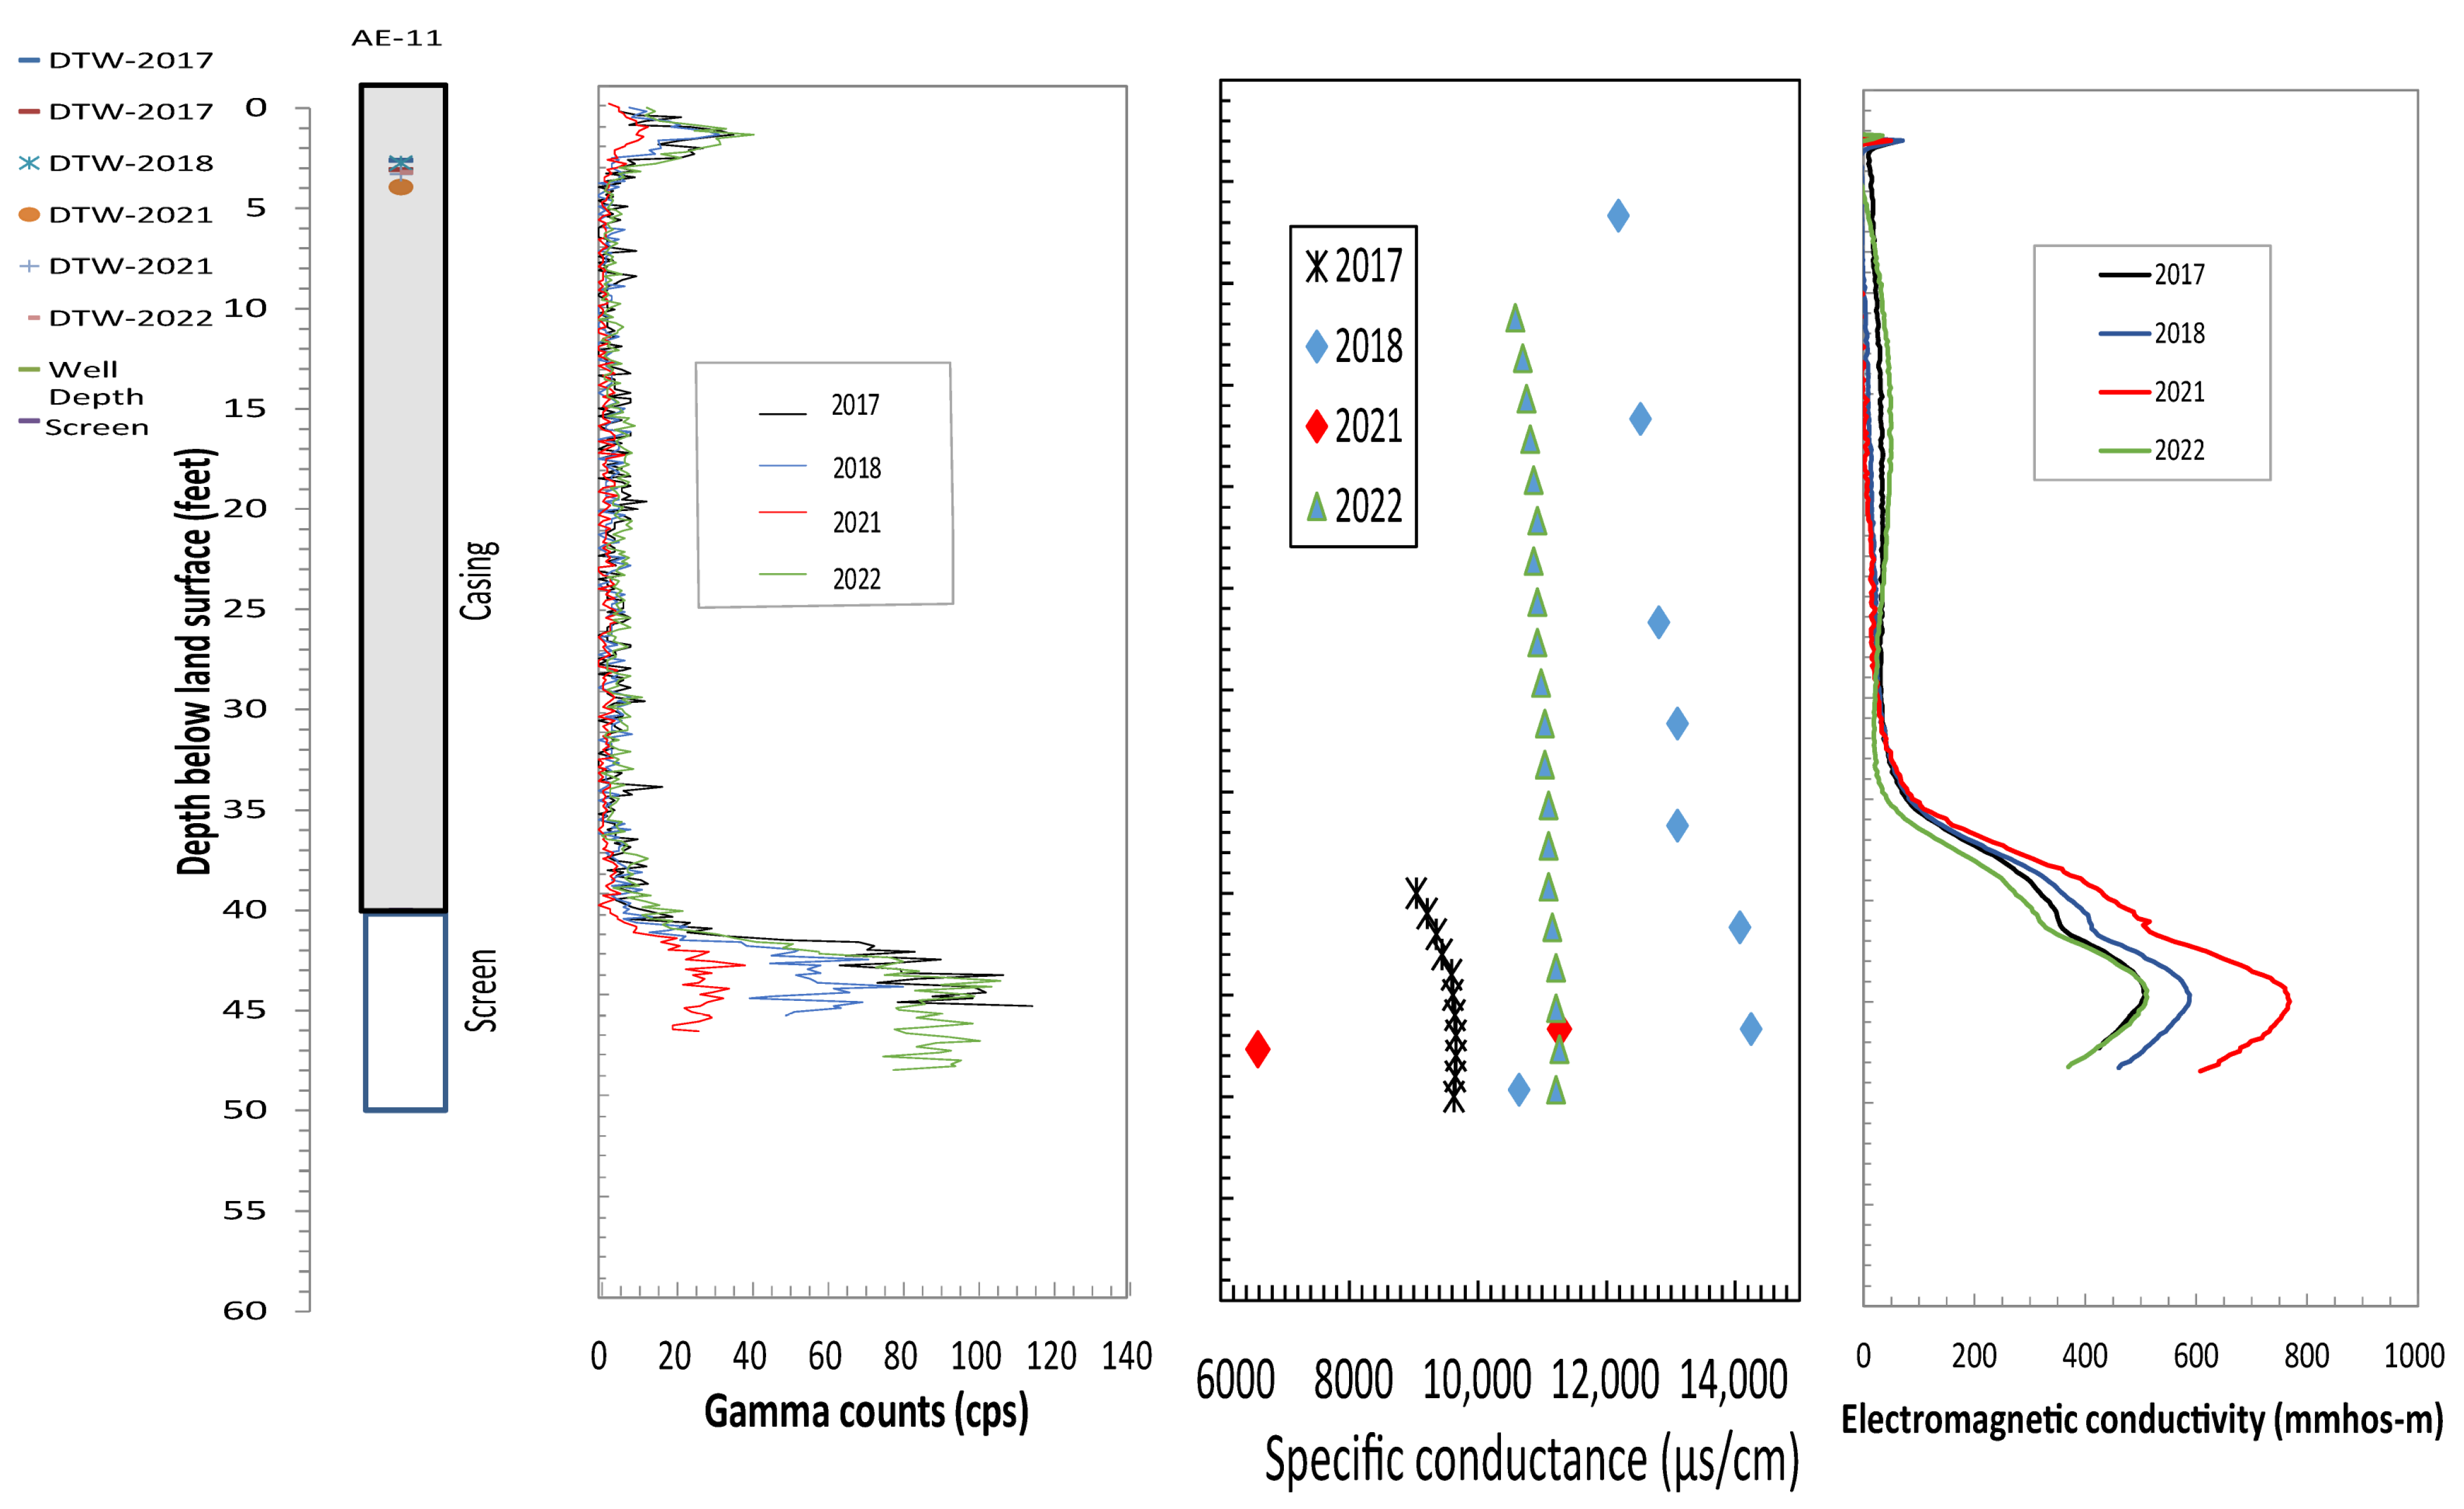
4.1. Borehole Geophysical Logs
4.2. Relation of Formation and Fluid Responses
4.3. Comparison of Logging Signatures to Chlorinated Ethene Concentrations

| Well | Date | Total Dissolved Solids (mg/L) | Specific Conductance (µS/cm) | Manganese (µg/L) | TCE (µg/L) | cDCE (µg/L) | Vinyl Chloride (µg/L) |
|---|---|---|---|---|---|---|---|
| AE-11 | |||||||
| 26 September 2016 | -- | -- | -- | 1200 | * 2500 | * 2400 | |
| 2 November 2021 | 10,000 | 10,931 | 42 | -- | -- | 0.44 J | |
| 14 July 2023 | 6300 | 8912 | 68 | 1.58 | 1.02 | 8.25 | |
| 17 July 2024 | 6130 | 8861 | 14 | 5 | 2.2 | 0.6 | |
| AE-10 | |||||||
| 26 September 2016 | -- | -- | -- | 1100 | -- | -- | |
| 2 November 2021 | 79,000 | 8340 | 3400 | 2300 | 540 J | 160 | |
| 14 July 2023 | 7910 | 8131 | 32,000 | 1548 | 389.2 | 158 | |
| 17 July 2024 | 8720 | 7932 | 43,000 | 990 | 300 | 120 | |
| AE-01RR | |||||||
| 26 September 2016 | -- | -- | -- | 490 | -- | -- | |
| 2 November 2021 | 100,000 | 11,710 | 44 | 490 | 200 J | 640 J | |
| 14 July 2023 | 6500 | 8965 | 28 | 5.28 | 2.99 | 27.1 | |
| 17 July 2024 | 5720 | 8973 | 20 | 0.49 | 0.6 | 13 |
5. Discussion
6. Conclusions
Supplementary Materials
Author Contributions
Funding
Data Availability Statement
Acknowledgments
Conflicts of Interest
Abbreviations
| P-ISCO | Passive In-Situ Chemical Oxidation |
| NASJ | Naval Air Station |
| NGR | Natural Gamma Ray |
| TCE | Trichloroethylene |
| VOC | Volatile Organic Compound |
| DNAPL | Dense Non-Aqueous Phase Liquid |
| SOD | Sediment Oxygen Demand |
| SOCORE | Sustained Oxidation and Controlled Oxidant Release Encapsulants |
| WWTP | Waste Water Treatment Plant |
| SWMU | Solid Waste Management Unit |
| TOD | Total Oxidant Demand |
| USGS | United States Geological Survey |
| NWQL | National Water Quality Laboratory |
| EM | Electromagnetic |
| NOD | Natural Oxidant Demand |
| NWIS | National Water Information System |
References
- ITRC (Interstate Technology & Regulatory Council). Technical and Regulatory Guidance for In Situ Chemical Oxidation of Contaminated Soil and Groundwater, 2nd ed.; The Interstate Technology & Regulatory Council In Situ Chemical Oxidation Team: Washington, DC, USA, 2005; p. 172. Available online: https://itrcweb.org/wp-content/uploads/2024/09/ISCO-2.pdf (accessed on 1 May 2009).
- Cave, L.; Hartog, N.; Al, T.; Parker, B.; Mayer, K.U.; Cogswell, S. Electrical monitoring of In Situ chemical oxidation by permanganate. Ground Water Monit. Remediat. 2007, 27, 77–84. [Google Scholar] [CrossRef]
- Petri, B.G.; Siegrist, R.L.; Crimi, M.L. Effects of groundwater velocity and permanganate concentration on DNAPL mass depletion rates during in situ oxidation. J. Environ. Eng. 2008, 134, 13. [Google Scholar] [CrossRef]
- Christenson, M.D.; Kambhu, A.; Comfort, S.D. Using slow-release permanganate candles to remove TCE from a low permeability aquifer at a former landfill. Chemosphere 2012, 89, 680–687. [Google Scholar] [CrossRef] [PubMed]
- Albano, J.; Comfort, S.D.; Zlotnik, V.; Halihan, T.; Burbach, M.; Chokejaroenrat, C.; Onanong SClayton, W. In Situ Chemical Oxidation of RDX-Contaminated Groundwater with Permanganate at the Nebraska Ordnance Plant. Ground Water Monit. Remediat. 2010, 30, 96–106. [Google Scholar] [CrossRef]
- Harte, P.T.; Smith, T.E.; Williams, J.H.; Degnan, J.R. Time Series Geophysical Monitoring of Permanganate Injections and In-situ chemical Oxidation of PCE, OU1 area, Savage Superfund Site, Milford, NH, USA. J. Contam. Hydrol. 2012, 132, 58–74. [Google Scholar] [CrossRef] [PubMed]
- Han, Z.; Kang, X.; Singha, K.; Wu, J.; Shi, X. Real-time monitoring of in situ chemical oxidation (ISCO) of dissolved TCE by integrating electrical resistivity tomography and reactive transport modeling. Water Res. 2024, 252, 121195. [Google Scholar] [CrossRef] [PubMed]
- Bording, T.; Kuhl, A.K.; Fiandaca, G.; Christensen, J.F.; Christiansen, A.V.; Auken, E. Cross-borehole geoelectrical time-lapse monitoring of in situ chemical oxidation and permeability estimation through induced polarization. Near Surf. Geophys. 2021, 19, 43–58. [Google Scholar] [CrossRef]
- Ensafe/Allen and Hoshall. Final Record of Decision, Operable Uniot 10, NAS Pensacola, Fl.; Ensafe/Allen and Hoshall: Memphis, TN, USA, 1997; p. 113. [Google Scholar]
- Andrews, W.J. Ground-water quality and trends at two industrial wastewater-injection sites in northwestern Florida, 1975–1991. In U.S. Geological Survey Water-Resources Investigations Report; US Geological Survey: Reston, VA, USA, 1994; Volume 93, p. 25. [Google Scholar]
- Miller, J.A. Ground Water Atlas of the United States: Alabama, Florida, Georgia, and South Carolina; Hydrologic Atlas 730; U.S. Geological Survey: Reston, VA, USA, 1990; Chap. G; pp. G1–G28. [Google Scholar] [CrossRef]
- Bradley, P.M.; Singletary, M.A.; Chapelle, F.H. Chloroethene dichlorination in acidic groundwater: Implications for combining Fenton’s treatment with natural attenuation. Remediation 2007, 18, 7–19. [Google Scholar] [CrossRef]
- Chapelle, F.H.; Bradley, P.M.; Thomas, M.A.; McMahon, P.B. Distinguishing iron-reducing from sulfate-reducing conditions. Groundwater 2009, 47, 300–305. [Google Scholar] [CrossRef] [PubMed]
- Chapelle, F.H.; Singletary, M.A. Combining Source-Area Treatment with MNA: A Tale of Two Sites. Groundwater 2010, 48, 803–805. [Google Scholar]
- Harte, P.T.; Landmeyer, J.E.; Welch, S.M. Datasets for Monitoring of a P-ISCO Experiment to Remediate a Chlorinated Ethene Plume, NAS Pensacola, Florida; U.S. Geological Survey Data Release: Reston, VA, USA, 2025. [Google Scholar] [CrossRef]
- SE Sciences Inc. Encapsulated Environmental Reactants. Available online: https://www.sesciences.com/environmental/waterremediation/ (accessed on 15 September 2024).
- ASTM D7262-10; Standard Test Method for Estimating of the Permanganate Natural Oxidant Demand of Soil and Aquifer Solids. American Society of Testing and Materials: West Conshohocken, PA, USA, 2016.
- Mount Sopris Instruments. 2018. Available online: https://mountsopris.com/ (accessed on 2 January 2018).
- ASTM D6767-97; Standard Guide for Conducting Borehole Logging—Mechanical Caliper. American Society of Testing and Materials: West Conshohocken, PA, USA, 2004; p. 6.
- ASTM D6726-01; Standard Guide for Conducting Borehole Geophysical Logging—Electromagnetic Induction. American Society of Testing and Materials: West Conshohocken, PA, USA, 2007; p. 8.
- ASTM D5753-05; Standard Guide for Planning and Conducting Borehole Geophysical Logging. American Society of Testing and Materials: West Conshohocken, PA, USA, 2010; p. 9.
- Canadian Well Logging Society. Log ASCII Standard (LAS): Canadian Well Logging Society Web Page. 2013. Available online: http://www.cwls.org/ (accessed on 8 May 2013).
- US Geological Survey. Borehole Geophysical National Archiver Site; US Geological Survey: Reston, VA, USA, 2024. Available online: https://webapps.usgs.gov/GeoLogLocator (accessed on 8 November 2024).
- Williams, J.H.; Lapham, W.W.; Barringer, T.H. Application of electromagnetic logging to contamination investigations in glacial sand and gravel aquifers. Ground Water Monit. Remediat. Rev. 1993, 13, 129–138. [Google Scholar] [CrossRef]
- McNeill, J.D.; Bosnar, M.; Snelgrove, F.B. Resolution of an Electromagnetic Borehole Conductivity Logger for Geotechnical and Ground Water Applications; Technical Note, TN-25; Geonics Limited: Mississauga, ON, Canada, 1990; p. 28. [Google Scholar]
- McNeill, J.D. Electrical Conductivity of Soils and Rocks; Technical Note, TN-5; Geonics Limited: Mississaugua, ON, Canada, 1980; p. 22. [Google Scholar]
- Keys, W.S. Borehole geophysics applied to water-resources investigations. In U.S. Geological Survey Techniques of Water Resources Investigations; US Geological Survey: Reston, VA, USA, 1990; Book 2, Chap. E2; p. 150. [Google Scholar]
- Archie, G.E. The electrical resistivity log as an aid in determining some reservoir characteristics. Pet. Trans. AIME 1942, 146, 54–62. [Google Scholar] [CrossRef]
- US Geological Survey. National field Manual for the Collection of Water-Quality Data; U.S. Geological Survey Techniques and Methods: Reston, VA, USA, 2020; Book 9, Chaps. A1–A10, [variously paged]. Available online: http://pubs.water.usgs.gov/twri9A (accessed on 3 September 2020).
- U.S Environmental Protection Agency. Method 8260D (SW-846): Volatile Organic Compounds by Gas Chromatography/Mass Spectrometry (GC/MS); Revision 3; U.S Environmental Protection Agency: Washington, DC, USA, 2006. Available online: https://www.epa.gov/esam/epa-method-8260d-sw-846-volatile-organic-compounds-gas-chromatography-mass-spectrometry-gcms (accessed on 23 September 2024).
- US EPA. Method 6010D (SW-846): Inductively Coupled Plasma-Atomic Emission Spectrometry; Revision 4; U.S. EPA: Washington, DC, USA, 2014. Available online: https://www.epa.gov/esam/epa-method-6010d-sw-846-inductively-coupled-plasma-atomic-emission-spectrometry (accessed on 23 September 2024).
- Barlow, P. Ground Water in Freshwater-Saltwater Environments of the Atlantic Coast; U.S. Geological Survey Circular 1262; US Geological Survey: Reston, VA, USA, 2003. [Google Scholar] [CrossRef]
- Jackson, P.D.; Taylor-Smith, D.; Stanford, P.N. Resistivity-porosity-particle shape relationships for marine sands. Geophysics 1978, 43, 1250–1268. [Google Scholar] [CrossRef]
- Stone, P.A. The Universal Confining Layer: A Critical Crypto-Protector of Our Precious Groundwater. 2016. Available online: https://www.researchgate.net/publication/303446366_The_Universal_Confining_Layer_A_critical_crypto-protector_of_our_precious_groundwater?channel=doi&linkId=5743612608ae9ace841b3946&showFulltext=true (accessed on 23 September 2024).
- Haselow, J.S.; Siegrist, R.L.; Crimi, M.; Jarosch, T. Estimating the total oxidant demand of in situ chemical oxidation design. Remediation 2003, 4, 5–16. [Google Scholar] [CrossRef]
- McQueen, J.; Dietart, B.; Lindley, A.; Shirley, J.; Lyssy, G. Evaluation of ISCO oxidant-infused wax cylinders within a tetrachloroethene-impacted fractured bedrock aquifer. In Proceedings of the Battelle 2018 Chlorinated Conference, Palm Springs, CA, USA, 8–12 April 2018; Available online: https://inside.battelle.org/docs/default-source/conferences/chlorinated-conference/proceedings/2018-chlorinated-conference-proceedings/e2-managing-remediating-chlorinated-solvent-impacts-at-fractured-bedrock-sites/e2_-319_poster_macqueen.pdf?sfvrsn=664a8088_0 (accessed on 8 November 2024).
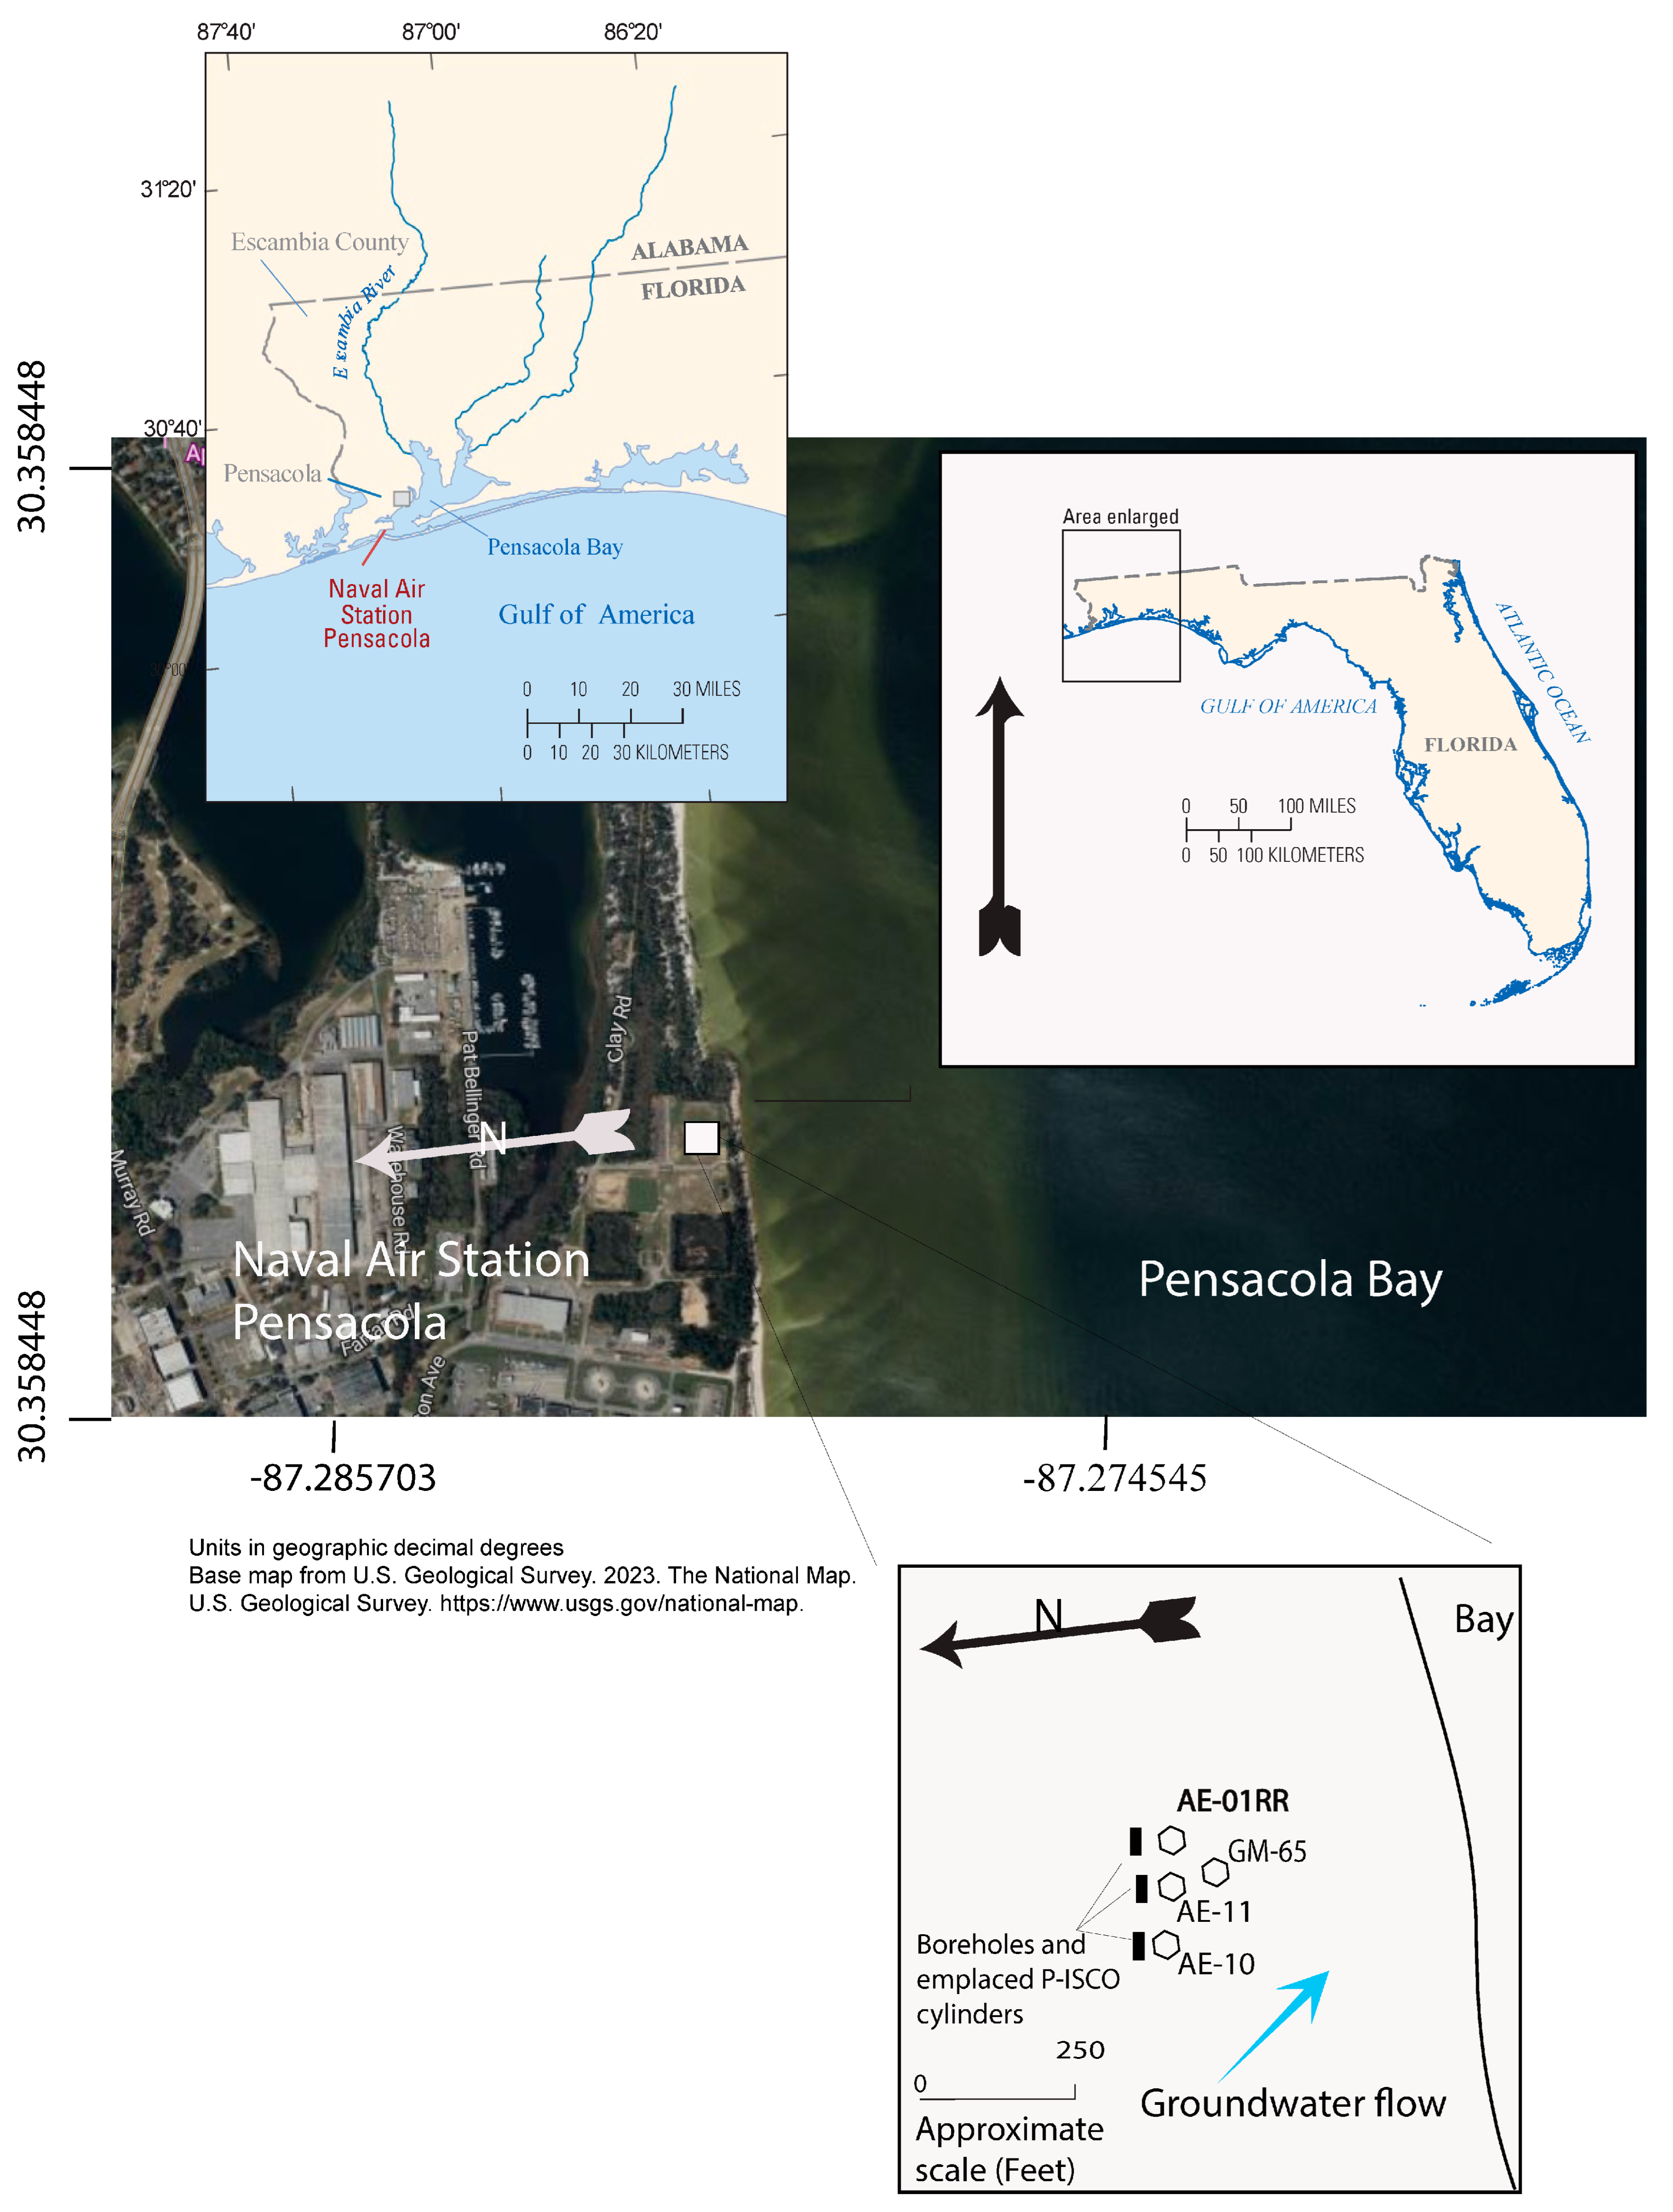


| Well | Site ID | Year Installed | Latitude | Longitude | Well Depths (ft-bgs) | Well Diameter (in) | Screen Interval (ft-bgs) | Groundwater TCE Concentration (26 September 2016) from Wells (µg/L) |
|---|---|---|---|---|---|---|---|---|
| GM-65 | 302148087155401 | Pre-2016 | N30 21 48.22 | W 87 15 54.81 | 65 | 2 | 62.5–65 | -- |
| AE-11R | 302148087155502 | 2016 | N30 21 47.92 | W 87 15 54.92 | 50 | 2 | 40–50 | 490 |
| AE-10R | 302148087155501 | 2016 | N30 21 47.70 | W87 15 54.97 | 50 | 2 | 40–50 | 1200 |
| AE-01RR | 302148087155504 | 2016 | N30 21 48.03 | W87 15 54.92 | 50 | 2 | 40–50 | 1100 |
| Year | Calibrated Water Conductivity (µS/cm) | Associated Calibration Point and Condition for the Derived Formation (αfm) | Computed Pore Fluid (αpf) from EM log (µS/cm) | Calibration Accuracy (%) | Archie Cementation Factor (m) | Archie Porosity (Ɵ) |
|---|---|---|---|---|---|---|
| 2017 | 9650 | Peak or lower silty-clay bed | 9661 | 0.11 | 0.68 | 0.38 |
| Average of bimodal | 9639 | −0.11 | 0.86 | 0.38 | ||
| Upper sandy unit | 9625 | −0.26 | 1.08 | 0.38 | ||
| 2021 | 11,200 | Peak or lower silty-clay bed | 11,272 | 0.64 | 0.4 | 0.38 |
| Average of bimodal | 11,174 | −0.23 | 0.62 | 0.38 | ||
| Upper sandy unit | 11,233 | 0.29 | 0.92 | 0.38 |
Disclaimer/Publisher’s Note: The statements, opinions and data contained in all publications are solely those of the individual author(s) and contributor(s) and not of MDPI and/or the editor(s). MDPI and/or the editor(s) disclaim responsibility for any injury to people or property resulting from any ideas, methods, instructions or products referred to in the content. |
© 2025 by the authors. Licensee MDPI, Basel, Switzerland. This article is an open access article distributed under the terms and conditions of the Creative Commons Attribution (CC BY) license (https://creativecommons.org/licenses/by/4.0/).
Share and Cite
Harte, P.T.; Singletary, M.A.; Landmeyer, J.E. Borehole Geophysical Time-Series Logging to Monitor Passive ISCO Treatment of Residual Chlorinated-Ethenes in a Confining Bed, NAS Pensacola, Florida. Hydrology 2025, 12, 155. https://doi.org/10.3390/hydrology12060155
Harte PT, Singletary MA, Landmeyer JE. Borehole Geophysical Time-Series Logging to Monitor Passive ISCO Treatment of Residual Chlorinated-Ethenes in a Confining Bed, NAS Pensacola, Florida. Hydrology. 2025; 12(6):155. https://doi.org/10.3390/hydrology12060155
Chicago/Turabian StyleHarte, Philip T., Michael A. Singletary, and James E. Landmeyer. 2025. "Borehole Geophysical Time-Series Logging to Monitor Passive ISCO Treatment of Residual Chlorinated-Ethenes in a Confining Bed, NAS Pensacola, Florida" Hydrology 12, no. 6: 155. https://doi.org/10.3390/hydrology12060155
APA StyleHarte, P. T., Singletary, M. A., & Landmeyer, J. E. (2025). Borehole Geophysical Time-Series Logging to Monitor Passive ISCO Treatment of Residual Chlorinated-Ethenes in a Confining Bed, NAS Pensacola, Florida. Hydrology, 12(6), 155. https://doi.org/10.3390/hydrology12060155