Article

Dynamics of Runoff Quantity in an Urbanizing Catchment: Implications for Runoff Management Using Nature-Based Retention Wetland

1
Nature-Based Solutions for Water Management Research Unit, Faculty of Architecture and Planning, Thammasat University, Rangsit Campus, Bangkok 12121, Thailand
2
Faculty of Science, Engineering and Built Environment, School of Engineering, Deakin University, Geelong Waurn Ponds Campus, 75 Pigdons Road, Waurn Ponds 3216, Victoria, Australia
*
Author to whom correspondence should be addressed.
Hydrology 2025, 12(6), 141; https://doi.org/10.3390/hydrology12060141
Submission received: 10 May 2025 / Revised: 31 May 2025 / Accepted: 4 June 2025 / Published: 6 June 2025

Abstract

Rapid suburbanization can alter catchment flow regime and increase stormwater runoff, posing threats to sensitive ecosystems. Applications of Nature-based Solutions (NbS) have increasingly been adopted as part of integrated water management efforts to tackle the hydrological impact of urbanization with co-benefits for improved urban resilience, sustainability, and community well-being. However, the implementation of NbS can be hindered by gaps in performance assessment. This paper introduces a physically based dynamic modeling approach to assess the performance of a nature-based storage facility designed to capture excess runoff from an urbanizing catchment (Armstrong Creek catchment) in Geelong, Australia. The study adopts a numerical modelling approach, supported by extensive field monitoring of water levels over a 2.5-year period. The model provides a decision support tool for Geelong local government in managing stormwater runoff to protect Lake Connewarre, a Ramsar-listed wetland under the Port Phillip Bay (Western Shoreline) and Bellarine Peninsula. Runoff is currently managed via a set of operating rules governing gate operations that prevents flows into the ecological sensitive downstream waterbody from December to April (drier periods in summer and most of autumn). Comparison with observed water level data at three monitoring stations for a continuous simulation period of May 2022 to October 2024 demonstrates satisfactory to excellent model performance (NSE: 0.55–0.79, R2: 0.80–0.89, ISE rating: excellent). Between 1670 × 103 m3 and 2770 × 103 m3 of runoff was intercepted by the nature-based storage facility, representing a 56–70% reduction in stormwater discharge into Lake Connewarre. Our model development underscores the importance of understanding and incorporating user interventions (gate operations and emergency pumping) from the standard operation plan to better manage catchment runoff. As revealed by the seasonal flow analysis for consecutive years, adaptive runoff management practices, capable of responding to rainfall variability, should be incorporated.

1. Introduction

Suburbanization is not a new phenomenon, and although Bourne [1] indicates that there is evidence of planned suburb divisions in ancient Egypt, perhaps we can place modern suburbanization …in the early nineteenth century, as the newly emergent English middle classes began to seek residences removed from the environmental nuisances that they themselves had brought into being [2]. In the United States, Lang et al. [3] suggested that prototype suburbs existed prior to 1850, transitioning to English town and country suburbs between 1850 and 1890, streetcar suburbs (1890–1930), and then highway suburbs (1930–1970). While both Australia and the U.S. have been suggested as “the first suburb nation” [1,4], Zhang et al. [5] note that suburbanization has become a global phenomenon as people seek affordable housing and better living conditions away from densely populated urban centers, facilitated by improved transportation, job decentralization, and public policies. While the suburbanization process benefits some, Kahn [6] argues that such growth may lead to adverse social and environmental consequences, resulting from increased vehicle emissions and excessive land consumption. The land consumption linked to suburbanization often impacts environmentally sensitive areas, such as wetlands, leading to biodiversity loss and ecosystem fragmentation [7]. Additionally, the transformation of the landscape and waterscape can disrupt the entire hydrological cycle, impacting runoff volume, peak flow, infiltration rates, and the water quality of receiving water bodies [8,9].
Faulkner [10] noted that wetland ecosystem health can be particularly vulnerable to expanding suburbanization because their often low topography can produce a cascading hydrologic and nutrient cycling effect from upstream source areas. Historically, wetlands have been seen as nuisance landscapes subject to infilling or draining for more beneficial uses, such that globally wetland area has been reduced between 20 and 50% since the start of the 18th century [11,12]. These global trends in wetland loss and degradation also have been witnessed throughout Australia [13,14,15,16], despite the fact that Costanza et al. [17] reported wetlands as having amongst the highest ecosystem service value per hectare of all global biomes. In response to the growing concern over wetland degradation and loss, the Ramsar Convention on Wetlands was established in 1971 and enacted in 1975, recognizing the ecological value of wetlands and the cost of their loss to humans, nature, and the planet [18]. Australia has 67 Ramsar wetlands that occupy around 8.3 million hectares, with some of these sites facing ongoing environmental stresses [19]. Important ecosystem services provided by wetlands, as identified in the Millennium Ecosystem Assessment [20], include climate regulation, biodiversity in habitat, coastal protection, and hydrological functions, making these environments potentially important Nature-based Solution (NbS) features for addressing emerging societal challenges related to human–water interactions [21].
Australia has a long history of employing Water Sensitive Urban Design (WSUD) as a form of green infrastructure to manage urban stormwater runoff [22,23,24,25]. More recently, the concept of nature-based solutions (NbS) has been introduced and might be regarded as an umbrella framework for WSUD [21,26], having a broader definition: …participatory, holistic, integrated approaches, using nature to enhance adaptive capacity, reduce hydro-meteorological risk, increase resilience, improve water quality, increase the opportunities for recreation, improve human well-being and health, enhance vegetation growth, and connect habitat and biodiversity [27]. The implementation of NbS in Australia is increasing, but the scale remains local, and a number of barriers to mainstreaming NbS in planning and management practice still exist, including a definition that is too broad and diffuse, making it unwieldy for ready policy implementation; a lack of monitoring and performance assessment to guide design; the need for collaborative governance; the need to clearly address climate change challenges; embedding an ecology and biodiversity focus; appreciating there is no one-size-fits all solution; and adapting approaches that incorporate local knowledge, including Indigenous knowledge [28,29,30]. NbS is integrated into several Australian Government policies and programs, including Australia’s Strategy for Nature 2019–2030, the Nature Positive Plan and Nature Repair Market, the National Landcare Program, the National Reserve System, and the National Climate Resilience and Adaptation Strategy 2021–2025 [31]. The gaps in NbS implementation are not exclusive to Australia, given its recent emergence. Cohen-Shacham et al. [21] emphasized that the NbS approach provides greater flexibility in interpretation and integration with existing measures, which can lead to more efficient, cost-effective, and sustainable outcomes. However, few studies have assessed the design and performance of combining NbS features with grey infrastructure, mainly due to the complexity of evaluating such systems [27,32].
Our study addresses the gap in knowledge related to assessment of NbS performance, particularly for a system that combines NbS features with grey infrastructure, using a case study of an urbanizing catchment in Geelong, Australia. The ongoing suburban development in the study catchment raises concern for the local government over increased stormwater runoff, potentially impacting Lake Connewarre, a downstream brackish-water Ramsar site. In addition to implementing extensive WSUD features in the study catchment, Geelong’s local government has transformed former farmland into an end-of-line stormwater retention feature that effectively has become a nature-based retention wetland, locally known as the Sparrovale Wetland. The Geelong government has adopted flow management guidelines to intercept excessive flow that would otherwise discharge into the sensitive downstream ecosystem. The implementation of these guidelines is carried out through the operation of a series of gates and weirs, with provisions for user interventions or deviations from the guidelines to manage large storms and prolonged wet weather. Our study evaluates the effectiveness of the operating rules (both standard gate operation guidelines and user interventions) currently in place, mainly looking at the routing of excess flows from the catchment to the Sparrovale Wetland, alleviating discharge into the receiving waterbody downstream, maintaining its ephemeral nature/characteristic.
The primary objective of this study was to assess the performance of the current runoff management system using a physically based rainfall-runoff numerical model. This assessment places particular emphasis on representing the catchment hydrology and hydraulics of flow through the control structures and in the open channels as part of a larger, mixed nature-based/grey infrastructure stormwater management system. This model provides a tool to inform decision-making for runoff management. Our specific objectives are as follows: (i) implement a network of water level monitoring sensors at critical locations within the system to understand general flow processes and provide the data for model calibration, (ii) validate a rainfall-runoff model quantifying runoff from the contributing watershed incorporating hydraulic control structures and implementation of operating rules in the model, and (iii) characterize catchment runoff and analyze the results against runoff management goals and suggest improvements. Lastly, this study illustrates the value of monitoring and modeling and working collaboratively with local government to enhance decision-making capacity in the Australian context and addresses the gaps in knowledge related to an integrated NbS/grey infrastructure system, as noted above. We emphasize here that our study scope is solely on the hydrologic service performance assessment rather than exploring the full spectrum of NbS benefits and disbenefits. However, it does address barriers to mainstreaming NbS noted above, namely a lack of monitoring and performance assessment to guide design and the limited investigation of a mixed NbS/grey infrastructure design.

2. Materials and Methods
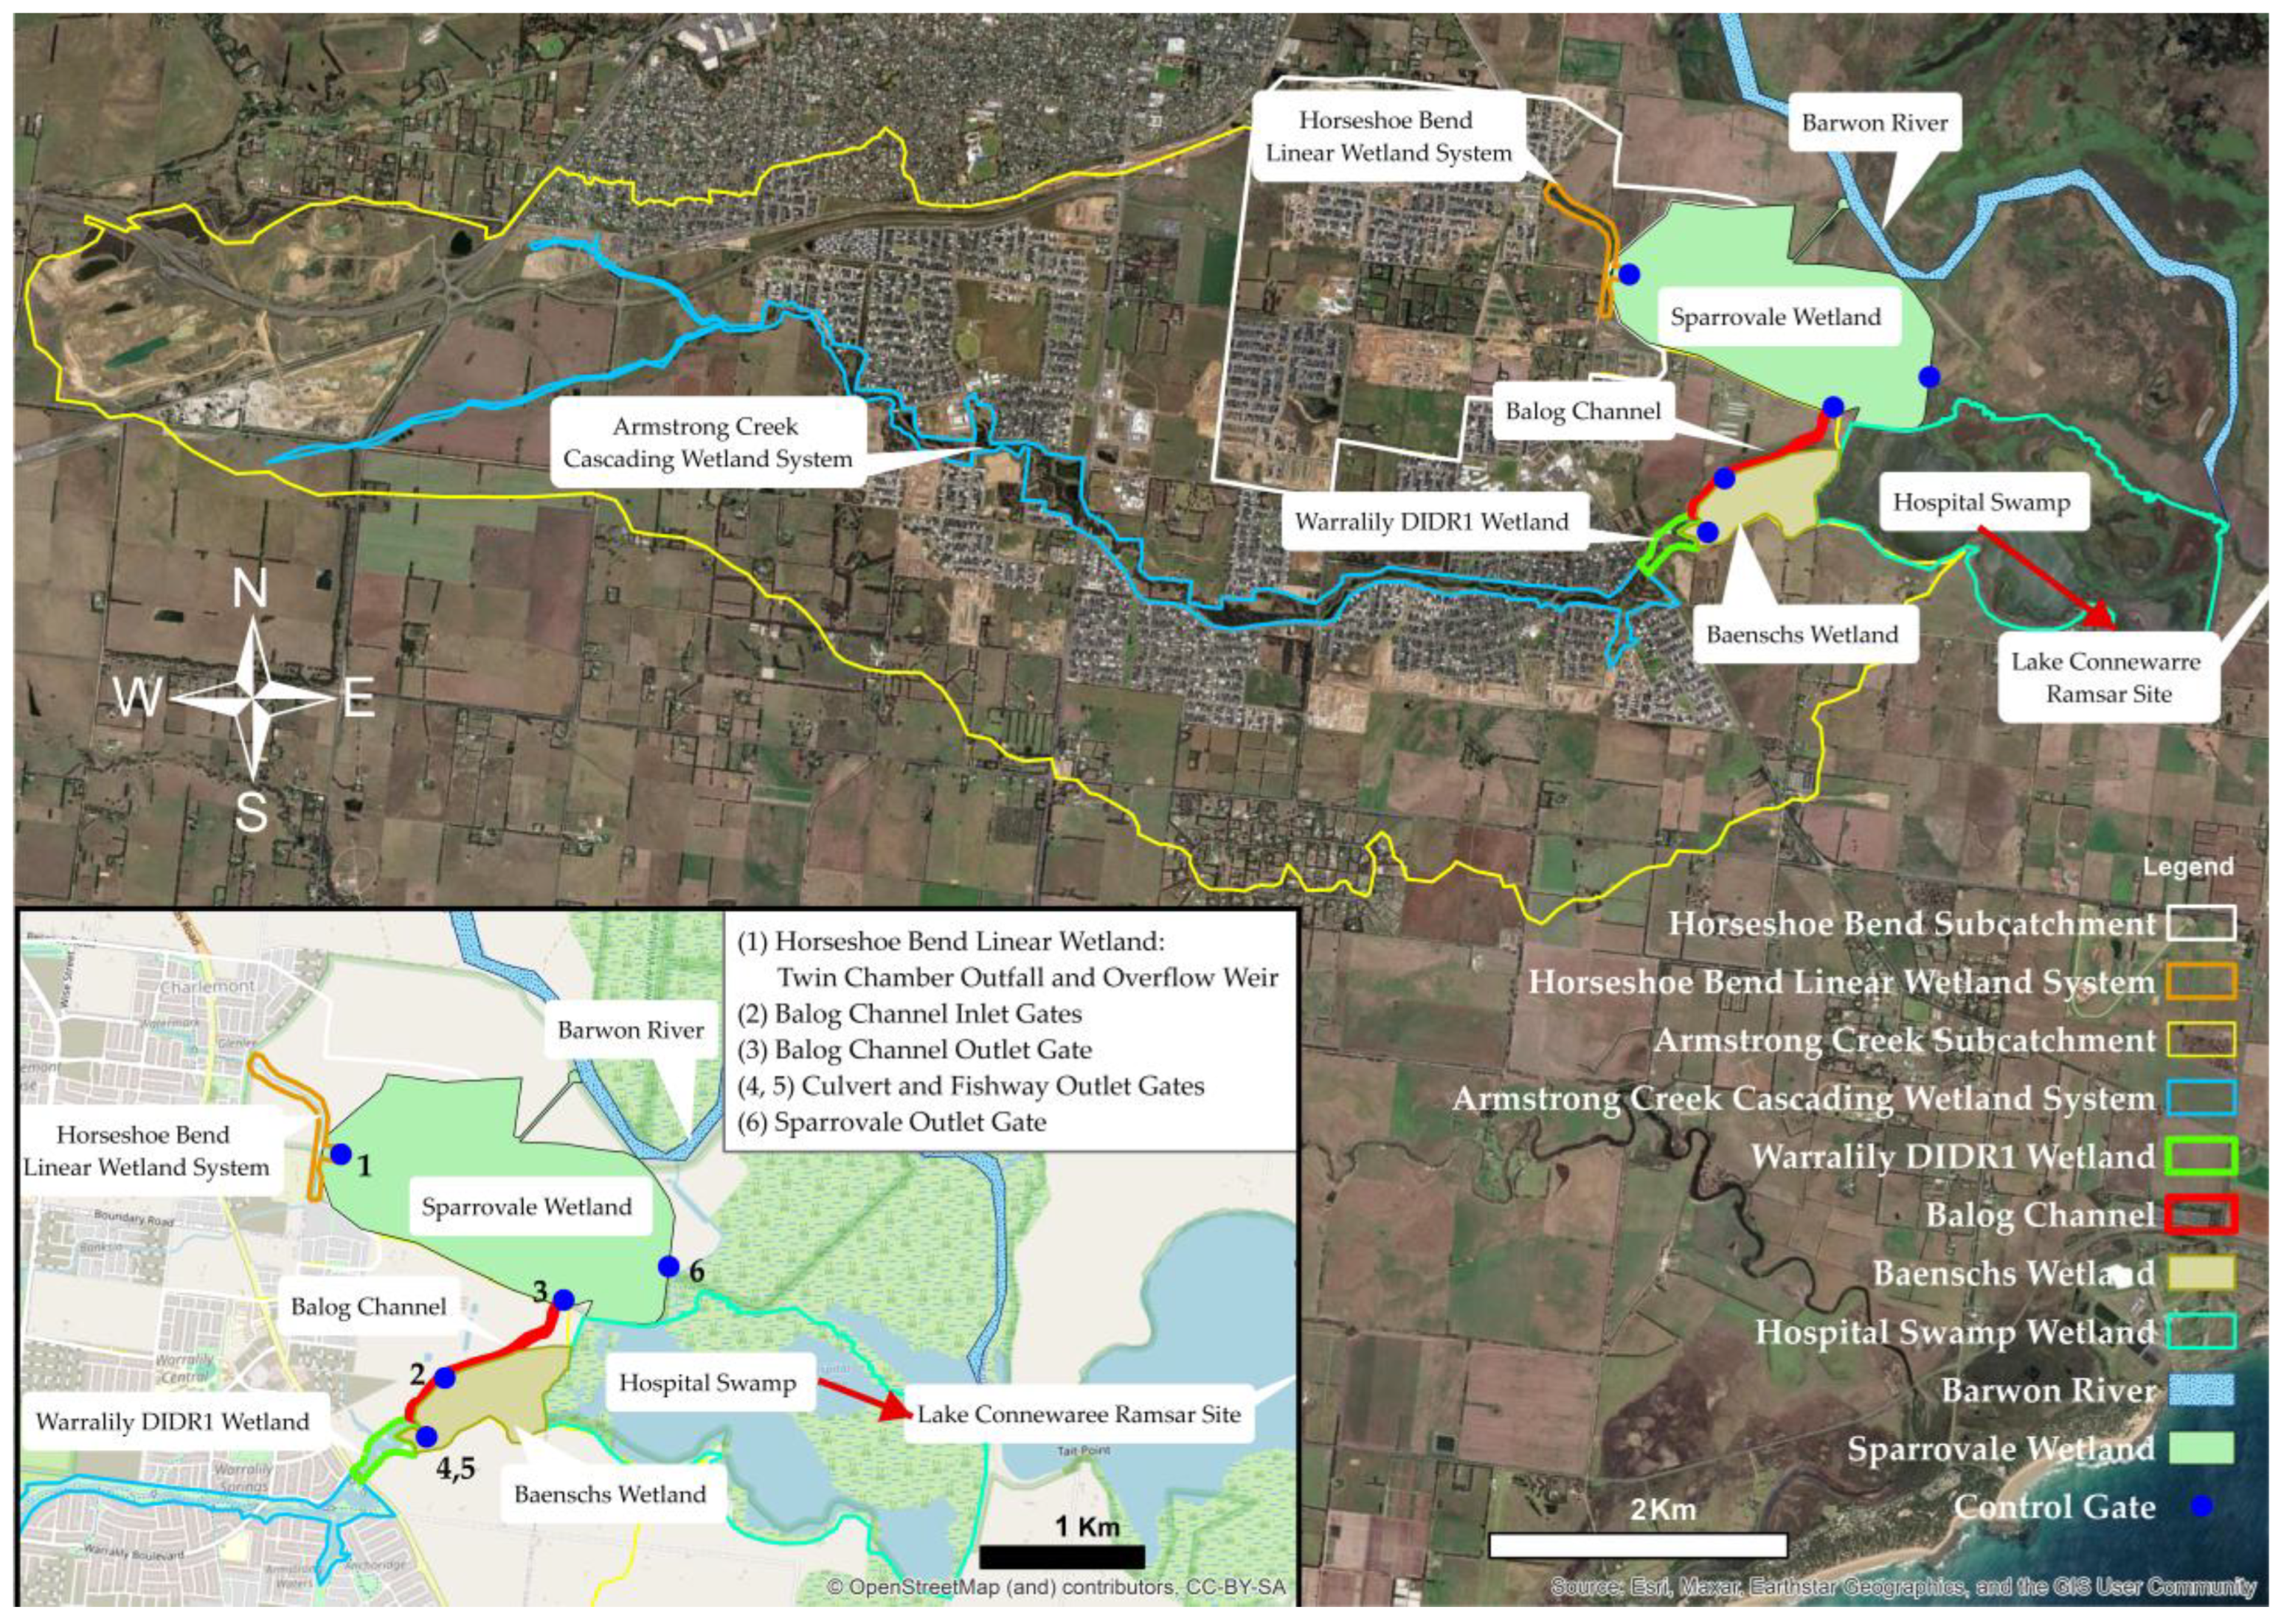
2.1. Study Area

Geelong, as the second largest metropolitan area in the state of Victoria, Australia, has a population that grew from 278,929 in 2016 to 327,878 in 2021 [33]. The rapid population increase has driven suburban development, particularly in the Armstrong Creek area. This expanding suburban area presents concerns regarding potential negative impacts to the downstream Lake Connewarre, a Ramsar-listed wetland under the Port Phillip Bay (Western Shoreline) and Bellarine Peninsula site, which is known for its unique, shallow, brackish habitat that supports a wide variety of plants and thousands of migratory birds [34]. Lake Connewarre covers a large 880-hectare area, with an average depth of 0.4 m and a maximum of 1.5 m at the deepest point. The wetland is tidally influenced, connecting to the sea by the Barwon River estuary, where freshwater from the Barwon River mixes with tidal inflows from Bass Strait, shaping its overall water quality and plant communities [35]. The increased influx of freshwater runoff from the suburbanizing Armstrong Creek watershed could potentially impact Lake Connewarre by diluting its brackish nature through freshwater storm pulses.
The study focuses on the Armstrong Creek growth area, located approximately 11 km southwest of Geelong’s Central Business District (CBD) (Figure 1), encompassing the Armstrong Creek and Horseshoe Bend precincts. Armstrong Creek has emerged as a popular suburban development area for Geelong, the fastest-growing region in the State of Victoria. According to the 2021 population census, the area had a population of 11,200 [36], which is projected to double by 2030. Further development across a total area of 2500 hectares is expected to accommodate a population increase of between 55,000 and 65,000 [37]. The study area experiences a mild climate with seasonal rainfall and potential evapotranspiration, reflecting its Marine West Coast (Cfb) climate under the Köppen climate classification system. The nearest weather station, Geelong Racecourse, recorded an average (2012–2024) minimum and maximum daily temperature of 15 and 26.4 °C and an average annual rainfall and evapotranspiration of 516 mm [38] and 1076 mm [39], respectively.

2.2. Sparrovale Wetland and Its Associated Hydraulic Engineering Structures

The recently constructed Sparrovale Wetland (Figure 1), located at 38°13′17″ S, 144°23′13″ E, represents a significant rewilding of agricultural land serving as a drainage solution for Armstrong Creek development and a hub for conservation and recreational activities. The wetland covers approximately 500 hectares in area as a nature reserve, with a functional retention area of 210 hectares dedicated to catchment runoff management. The City of Greater Geelong acquired the site in 2019, with studies and planning of its development beginning in 2020 [40]. Situated in a low-lying area adjacent to the Barwon River floodplain, the wetland features scattered areas of higher elevation resulting from historical agricultural practices. Sparrovale forms part of a larger estuarine ecological landscape, which includes the Barwon River, Baenschs Wetland, Hospital Swamp, and Lake Connewarre. The local government has incorporated a long-term, seasonally adaptive water regime to maintain the ecological character and biodiversity of the Baenschs, Hospital Swamp, and Lake Connewarre wetland system, including the Sparrovale Wetland. Sparrovale has developed its own unique ecological functions over time despite being initially repurposed as a retention and evaporation basin for increased urban runoff to benefit the Ramsar complex. The recent adoption of the Sparrovale Master Plan presents a vision of “A diverse and sustainable wetland and waterway wildlife reserve to enjoy nature and history and improve community well-being” [41].
Inflows to the Sparrovale Wetland, primarily from the Horseshoe Bend and Armstrong Creek catchments (Figure 1), are regulated by a network of engineered hydraulic structures (Table 1). Runoff from the Horseshoe Bend catchment passes through a linear wetland system (a combination of sediment basins and pocket wetlands) to the outlet pool, which then discharges into Sparrovale Wetland either through a twin chamber outfall pit (invert at 1.0 mAHD) or high-flow bypass weir (invert at 1.5 mAHD). Flow from the Armstrong Creek catchment is routed through the Armstrong Creek Cascading Wetland System to the Warralily DIDR1 Wetland. The flow then discharges to Baenschs Wetland, either via a Culvert (invert at 1.1 mAHD) or a Fishway (invert at 0.98 mAHD), or is diverted to Sparrovale Wetland via the 1.5 km long Balog Channel (invert at 0.8 mAHD). The Balog Channel was constructed as part of the stormwater management plan to divert excess runoff from the brackish Baenschs Wetland especially in summer, thereby reducing risk of dilution. Along the left bank of the Balog Channel, a series of openings in the earthen bund ranging from 0.91 to 1.66 mAHD, with an average width of 9.5 m, have been constructed (Figure S1). These openings act as levee breaks, allowing excess flow in Balog Channel to drain into the area behind the bund during extreme conditions. Outflow from the Sparrovale Wetland is regulated through an outlet gate with an invert elevation of 0.2 mAHD.
A set of standard operating rules adopted by Geelong Council to prescribe gate operation for flow diversions and discharges into Sparrovale Wetland is shown in Table 2. These rules were designed to divert freshwater inflow to Sparrovale Wetlands during the summer months, thereby preserving the salinity levels in the receiving waterbody and maintaining its ecological health during the dry season. The Australian Water Balance Model (AWBM) rainfall-runoff model was used in conjunction with the Two-dimensional Unsteady FLOW (TUFLOW) model to estimate the runoff from the contributing catchments and assess the design flow capacity through the drainage system, respectively. To meet the objective of the standard operating rules, Sparrovale Wetland was designed to accommodate an annual inflow of 1825 × 103 m3. Excess runoff from Armstrong Creek can be diverted into the wetland, ensuring that direct discharge from Armstrong Creek to Hospital Swamp remains as close as possible to the pre-development condition of 3540 × 103 m3 annually.

2.3. Data

Water level data were collected from four monitoring locations, three of which were used for model calibration: Sparrovale Wetland, Horseshoe Bend Linear Wetland outlet, and Balog Channel outlet, and one at Hospital Swamp serving as the model’s downstream boundary condition (Figure 1). The data were measured at 15 min to 1 h intervals using LoRaWAN® Operated Low-Power-Level Transmitters for Liquid with built-in temperature sensors. Rainfall data recorded at 1 min timesteps (May 2022 to October 2024) from the Breakwater (Geelong Racecourse, at 38°10′11.93′′ S, 144°22′48.02′′ E) station (tipping bucket rain gauge station, ID: 87184), approximately 5 km northeast of the catchment, were obtained from the Australian Bureau of Meteorology [38] and used to drive the model. Additionally, evapotranspiration data derived from the Penman–Monteith equation were obtained from the same source for the same period [39]. Infiltration measurements were conducted at five residential areas in the Armstrong Creek catchment during May 2023 using a Turf Tec Infiltrometer [43]. Data were manually recorded at 5 min intervals for up to 60 min to estimate the infiltration rates.
Digital Elevation Map (DEM) data were obtained by City of Greater Geelong Lidar surveys to characterize catchment topography within the model. The latest 2017 Lidar-derived DEM has a spatial resolution of 1 m and a vertical accuracy of 0.1 m. Model configuration was also informed through satellite imagery, as-built drawings, and technical reports, which were provided by the City of Greater Geelong (e.g., Table 1).

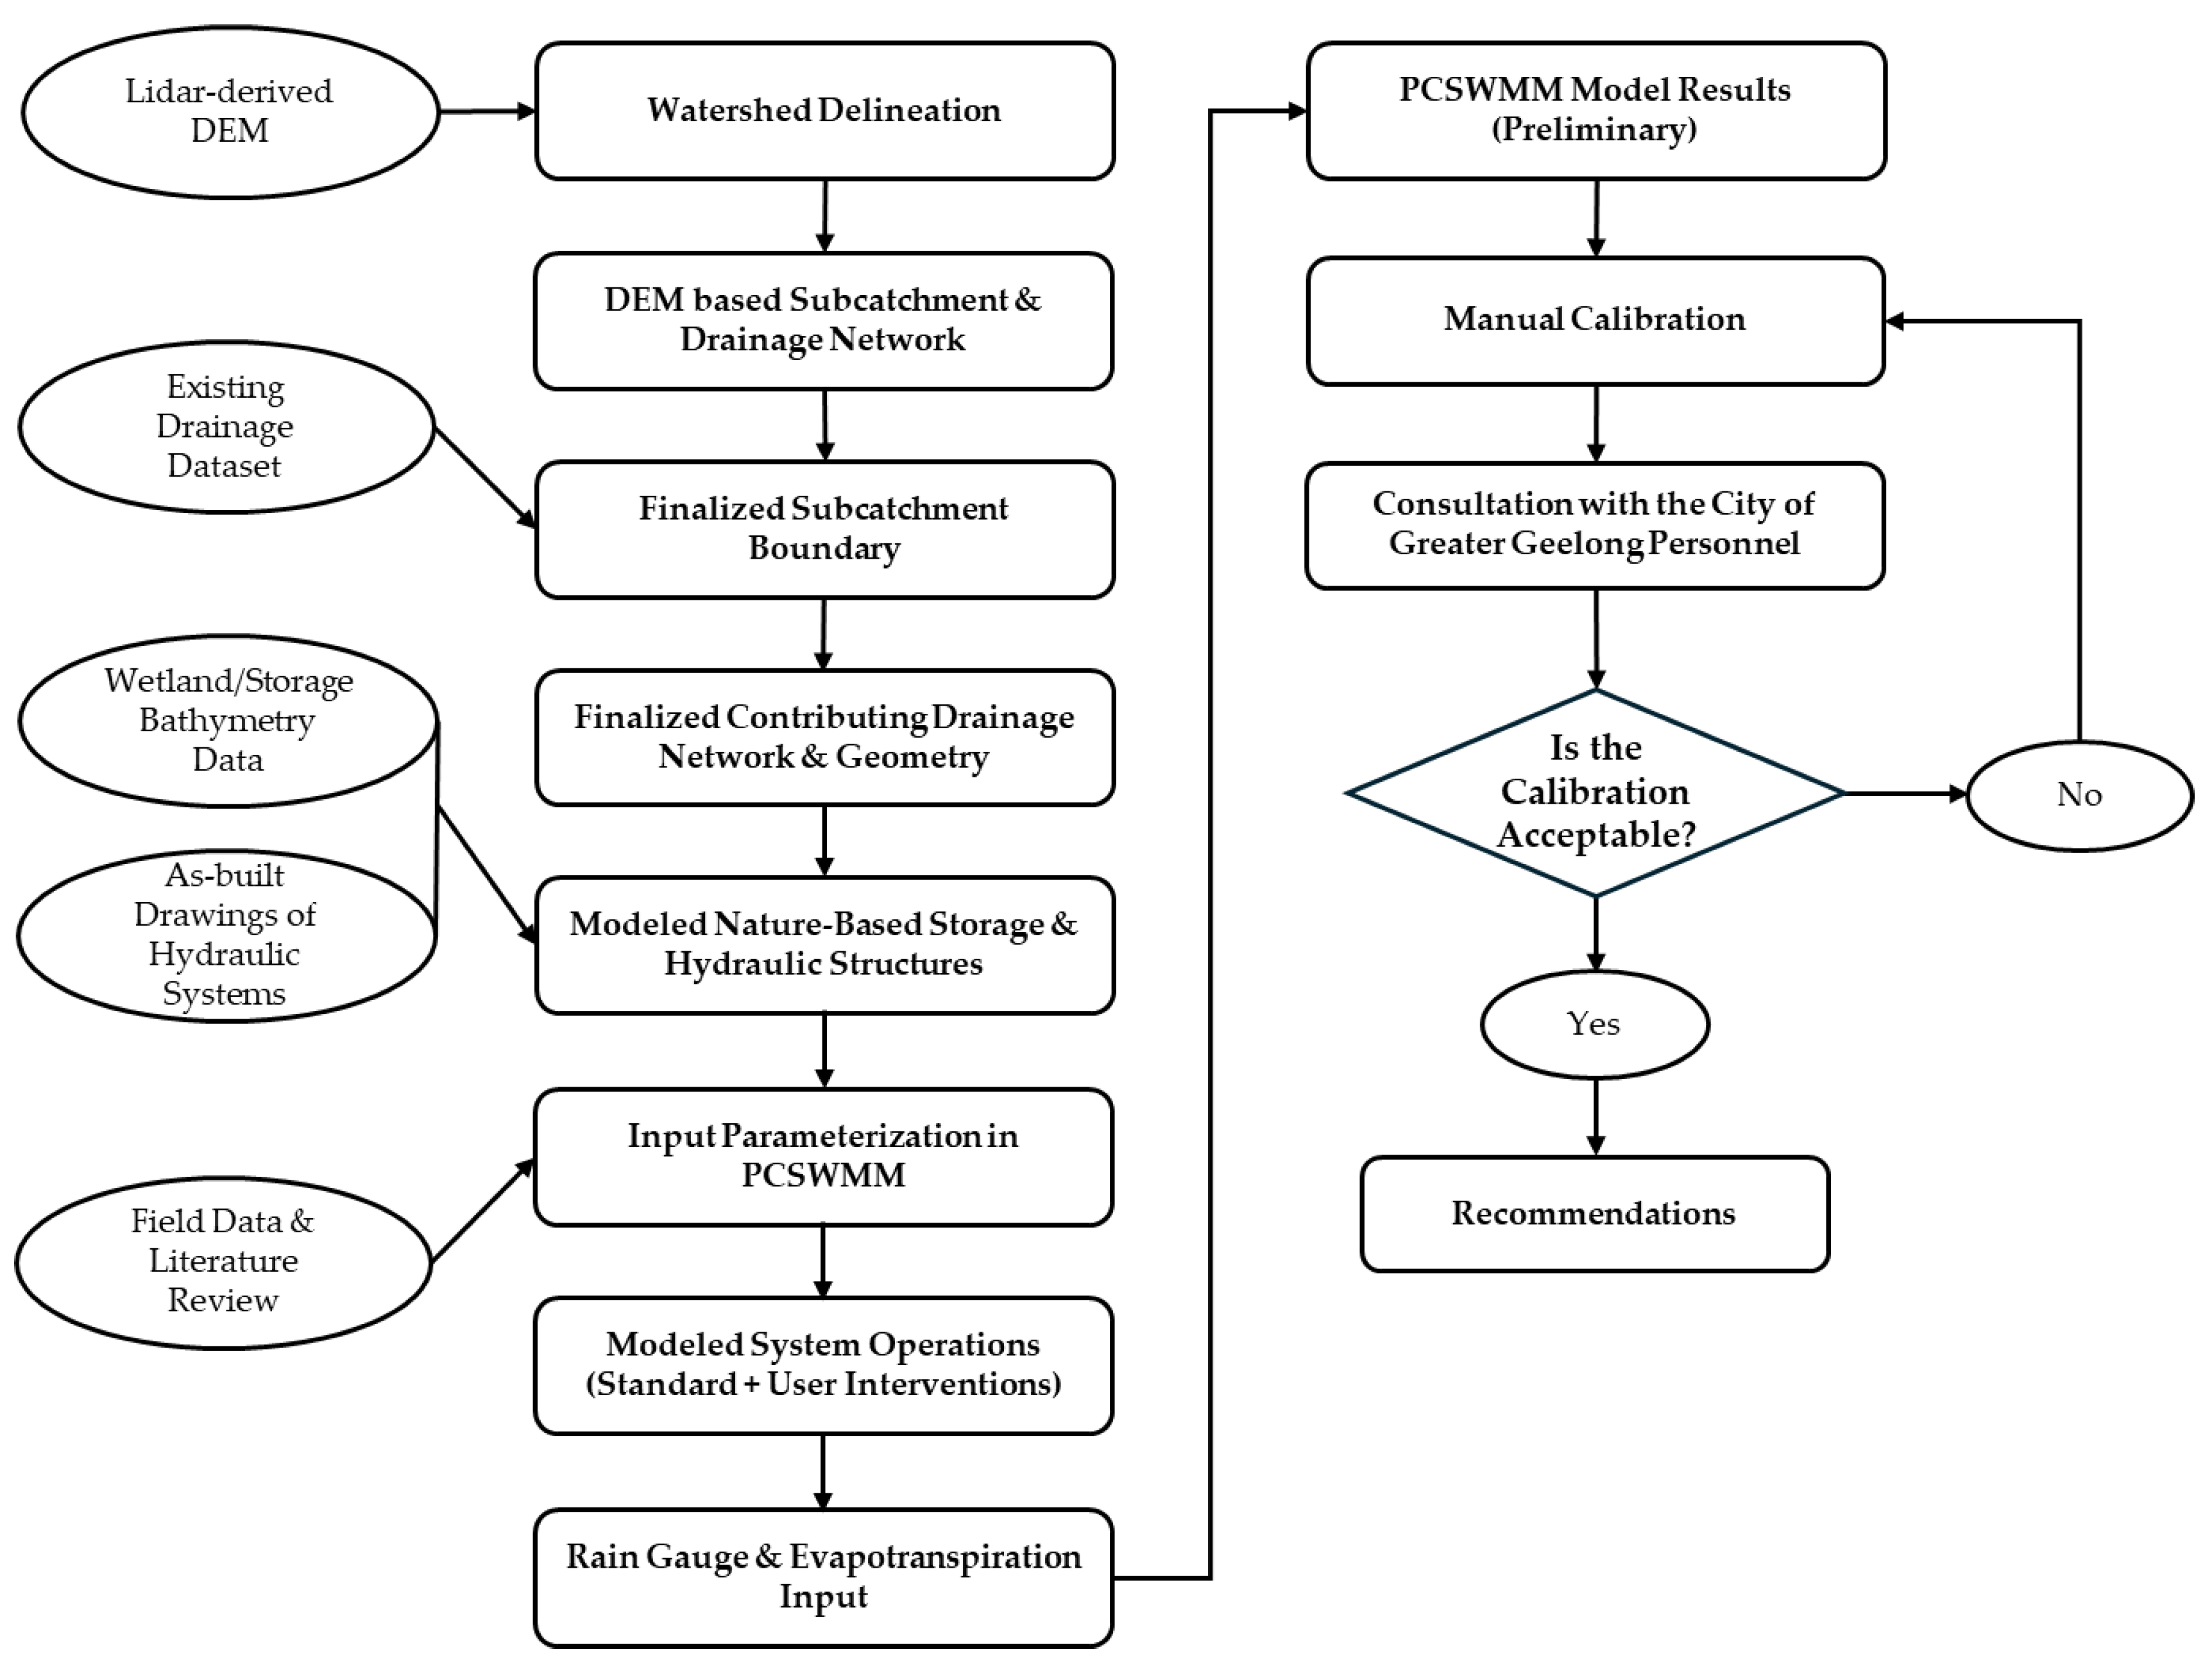
2.4. Model Development

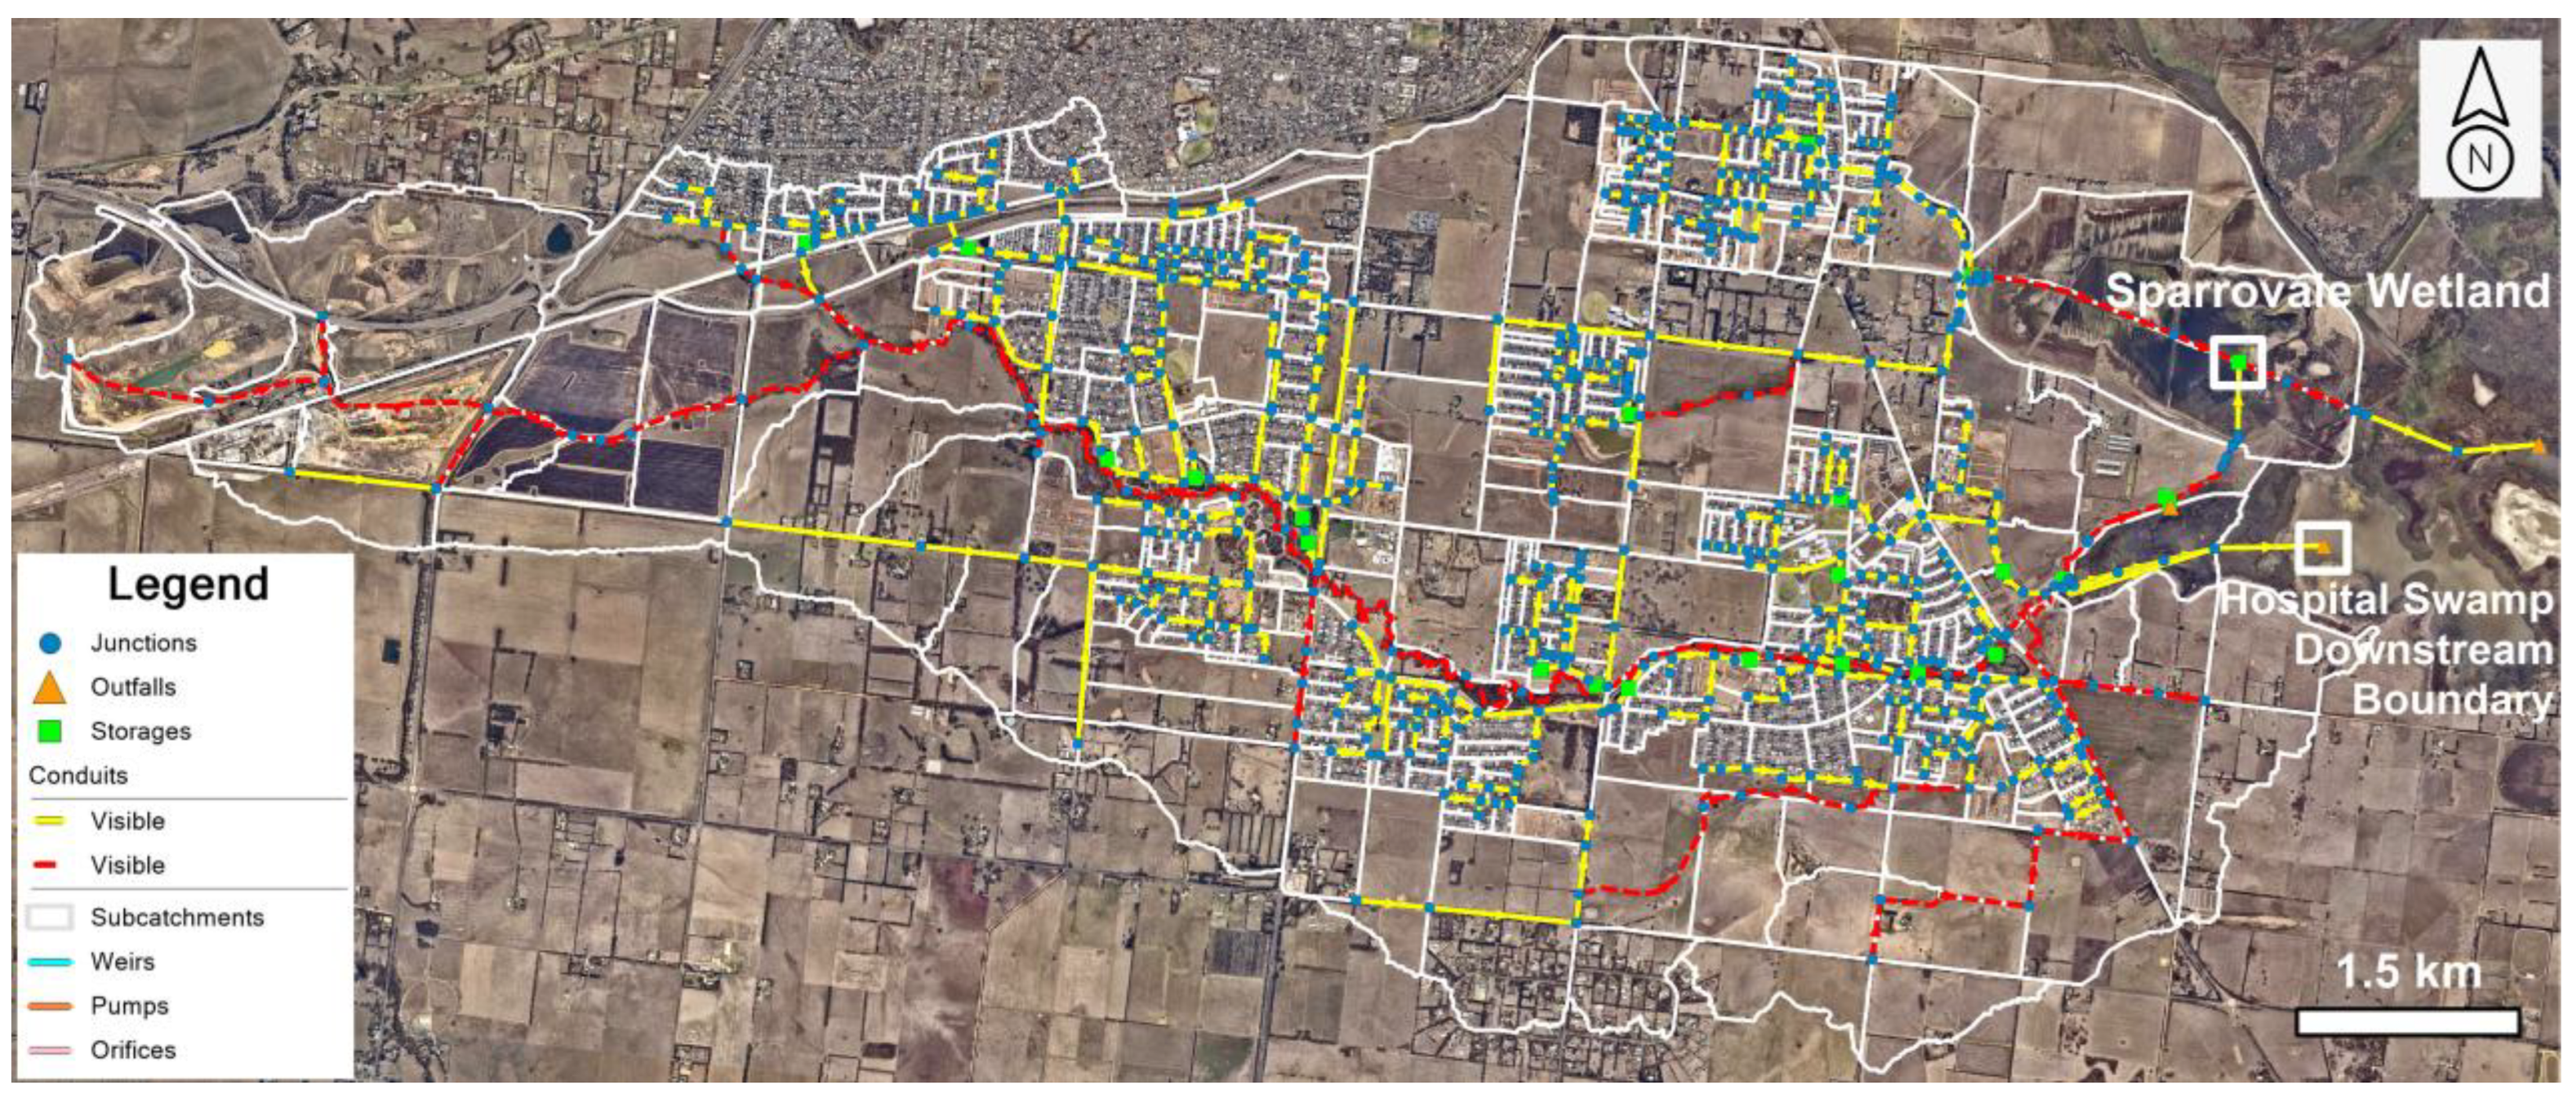
2.4.1. PCSWMM Configuration for Catchment and Wetland Model

PCSWMM (Personal Computer version of the Stormwater Management Model; PCSWMM 2023, version 7.6.3665) was used to model the stormwater runoff from the Armstrong Creek and Horseshoe Bend catchments. PCSWMM employs the U.S. EPA SWMM5.1 computational engine, which provides the capability of modeling hydrologic/hydraulic dynamics in urban and suburban areas for event and continuous simulations, but also sits on an open-source GIS platform and includes a graphical user interface to facilitate data input, management, and visualization. PCSWMM/SWMM have been applied throughout the world, including Australia, for a variety of water quantity, quality, and WSUD/NbS applications [44,45,46,47,48,49,50,51,52]. Hydrologic performance of WSUD features, including raingardens, green roofs, porous pavement, and grassed swales, can be modeled explicitly in PCSWMM, considering the size, vegetation cover, and substrate type and depth, while pond/basin and wetland storage is better represented through the storage editor that utilizes surface area/depth curves. The methodology used in the implementation of PCSWMM is presented in Figure 2.
In this study, the PCSWMM model configuration included 552 subcatchments, 625 junctions, 641 conduits, 14 weirs, 2 orifices, 23 storage nodes, and 2 outfalls (Figure 3). The boundary condition for flow from the Sparrovale Wetland outlet was modeled as a free outfall, while the flow from the Fishway and Culvert outlets was modeled as a timeseries outfall which is based on water level data at Hospital Swamp. The Watershed Delineation Tool (WDT) in PCSWMM directly imports the available DEM to determine the subcatchment characteristics, including surface area, slope, and elevation. Pipe data and drainage networks in GIS formats were imported directly to PCSWMM for the depths and invert elevations of the junctions and outfalls, as well as the lengths and cross-sections of the conduits.
The roughness coefficient value assigned to each conduit was based on the pipe/conduit type [53]. The 2021 land use data and August 2022 aerial imagery were processed in ArcGIS 10.5 to determine subcatchment imperviousness. Subcatchment parameter values, such as Manning’s n (0.013 and 0.15) and depth of depression storage (1.25 and 5 mm) for impervious and pervious surfaces, were based on a previous study conducted in the area [48]. The Horton infiltration equation was employed in this study with values of maximum infiltration rate (f0) set at 76.2 mm/h, minimum infiltration rate (fc) set at 0.3 mm/h, a decay constant (α) of 8/h, and drying time of 7 days. These values were guided by previous modeling work [48] and the field measurement, as noted in Section 2.3.
The Sparrovale Wetland, Balog Channel, Horseshoe Bend Linear Wetland System, Warralily DIDR1 Wetland, and Cascading Wetland System in Armstrong Creek (Figure 1) in the study catchment were modeled as storage nodes. Balog Channel was represented as a storage node (rather than an open channel) due to its design characteristic, which allows runoff water to attenuate through the spillway inlet and outlet system (see Table 1). In developing the bathymetry for the storage nodes, the DEM data were analyzed in Arc GIS 10.5 to define the depth/area curves for each node. The bathymetric characteristics were also informed by the as-built drawings. Seepage losses for the wetlands were represented using the Green–Ampt equation with values of 316.3 mm for suction head (Ψ) and 0.01 mm/h for saturated hydraulic conductivity (K) [54]. These values are representative of the clay-dominated yellow duplex soil present in the area [55].
The model was run in 1D with the dynamic wave option for drainage network hydraulics and calculation and reporting timesteps of 30 s, and 1 h, respectively. Runtime took 3.5 h for a simulation period of 2 years and 6 months (May 2022 to October 2024). The Sparrovale contributing catchments were estimated to have a total area of 4037 hectares, with the Horseshoe Bend catchment considerably smaller (943 hectares) than the Armstrong Creek catchment (3094 hectares). The Sparrovale catchment is primarily occupied by open space and agricultural land (as shown in Figure 3), although there has been a noticeable increase in residential and commercial development in the past 10 years, (as evident in aerial photographs), with further development expected. Based on aerial photography, approximately 20% of the total catchment area was classified as urbanized in August 2022 [56]. The remaining large open space/agriculture area implies that infiltration loss should be a key driver for the overall catchment water budget.

2.4.2. Modeling Hydraulic Structures and Gate Operation Scenarios

Table 3 presents the weir parameter values used for the modeled hydraulic control structures governing inflow to and discharge from the Sparrovale Wetland, categorized by their weir configuration as trapezoidal or transverse. The information for these structures, presented in both Table 1 and Table 3, was derived from a range of technical reports and as-built drawings provided by the City of Greater Geelong and modeled in PCSWMM. Field investigations and thorough consultation with the City of Greater Geelong personnel were made throughout the model development to identify hydraulic structures associated with the Sparrovale Wetland (Table 3).
The City of Greater Geelong personnel occasionally operated the gates manually, deviating from the standard operation plan (SOP) as outlined in Table 2. The dates of these deviations along with pumping were recorded by the City of Greater Geelong personnel and this information was scripted into PCSWMM using the control rule editor. Our standard operation with user intervention scenario (SUI) was limited to the specific gates that are summarized in Table 2. The following gate operation scenarios were scripted in the PCSWMM model:
  • Standard operation plan (SOP) (as outlined in Table 2);
  • Standard operation with user interventions (SUI), based on the schedule provided by the City of Greater Geelong;
  • No operation rules, with all gates fully open (NR).
The results of these scenarios will provide a comparative understanding of how gate operations influence flow distribution, volume control, and overall system performance.

2.4.3. Goodness of Fit

To assess the accuracy and reliability of the model simulations, three performance metrics were employed: the Integral Square Error (ISE) rating, the Nash–Sutcliffe Efficiency (NSE), and the Coefficient of Determination (R2). These metrics are widely used in hydrologic/hydraulic modeling to evaluate the correspondence between observed and simulated data:
  • ISE rating quantifies the cumulative squared deviation between observed and simulated values, with lower values indicating better performance. Model performance is categorized as follows: Excellent (0% ≤ ISE < 3%), Very Good (3% ≤ ISE < 6%), Good (6% ≤ ISE < 10%), Fair (10% ≤ ISE < 25%), and Poor (ISE ≥ 25%) [57].
  • NSE measures the extent to which the simulated data matches the observed data relative to the mean of the observations, with a value of 1 representing a perfect fit. The performance ranges are as follows: Excellent (0.75 ≤ NSE < 1), Very Good (0.65 ≤ NSE < 0.75), Good (0.5 ≤ NSE < 0.65), Fair (0.3 ≤ NSE < 0.5), and Poor (NSE < 0.3) [58].
  • R2 indicates the proportion of variability in the observed data that is explained by the model, ranging from 0 to 1, with higher values signifying less unexplained variance. The performance classifications are as follows: Very Good (0.7 ≤ R2 < 1), Good (0.5 ≤ R2 < 0.7), Satisfactory (0.4 ≤ R2 < 0.5), and Unsatisfactory (R2 < 0.4) [59].

3. Result and Discussion

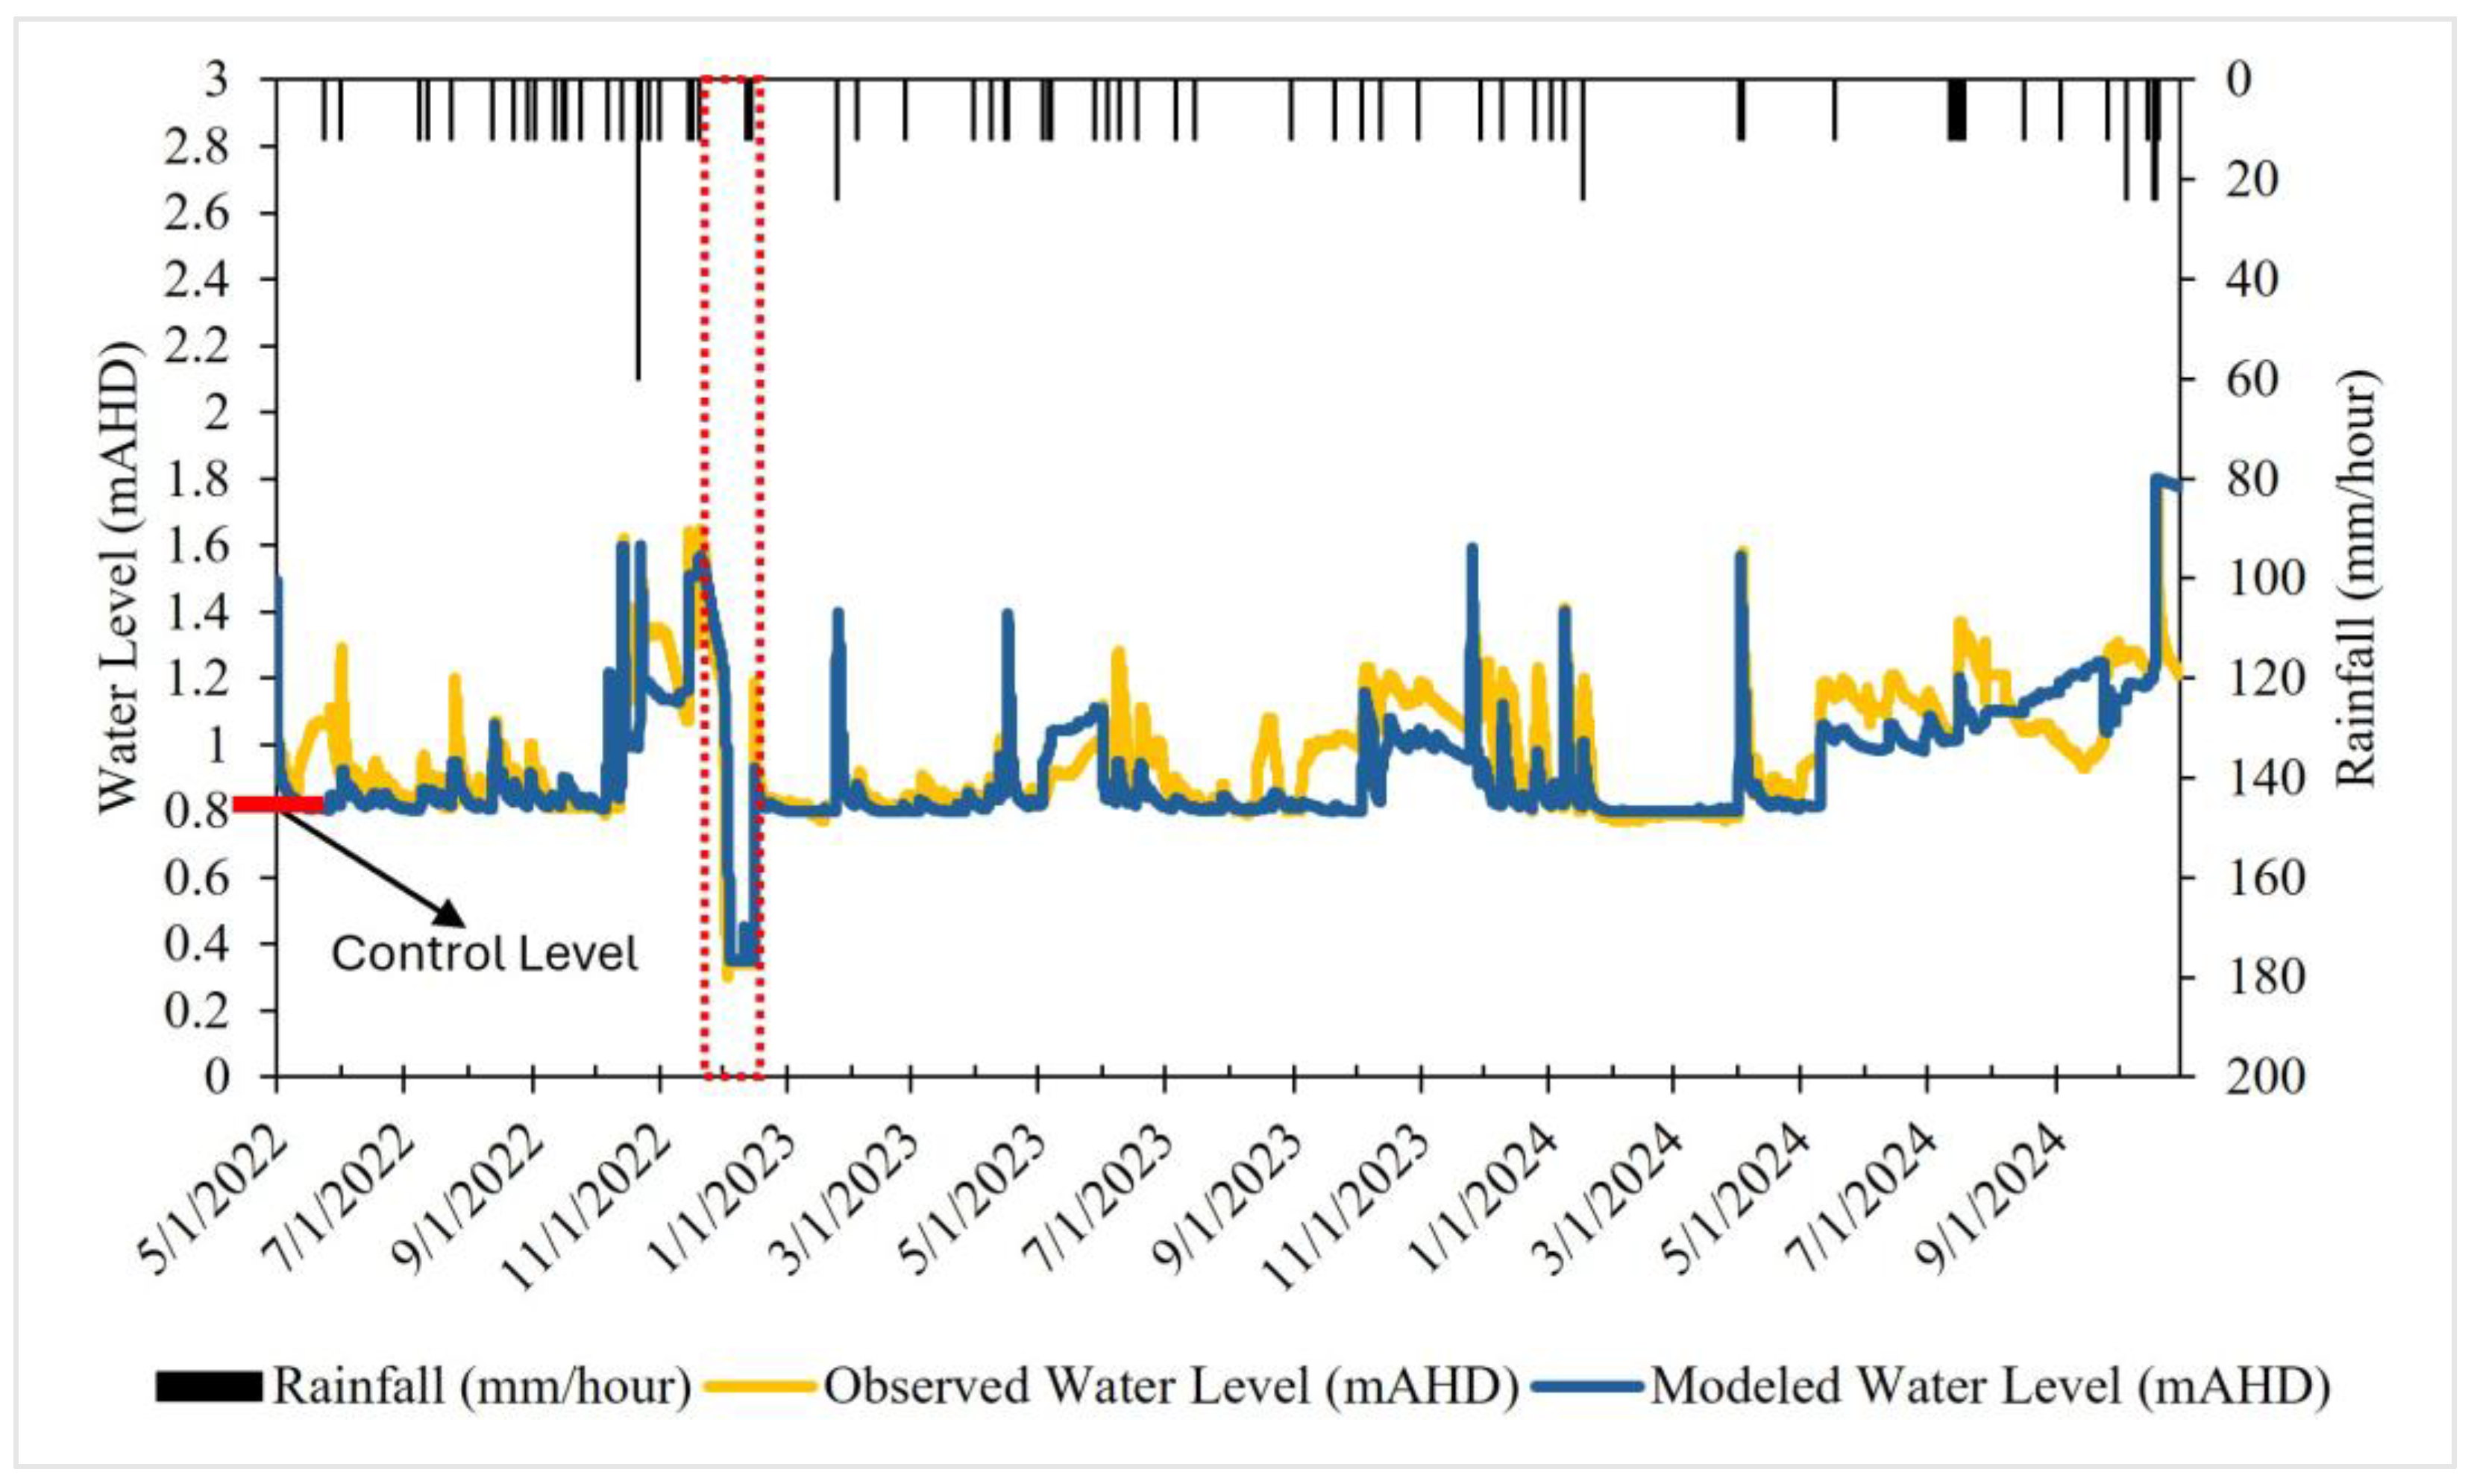
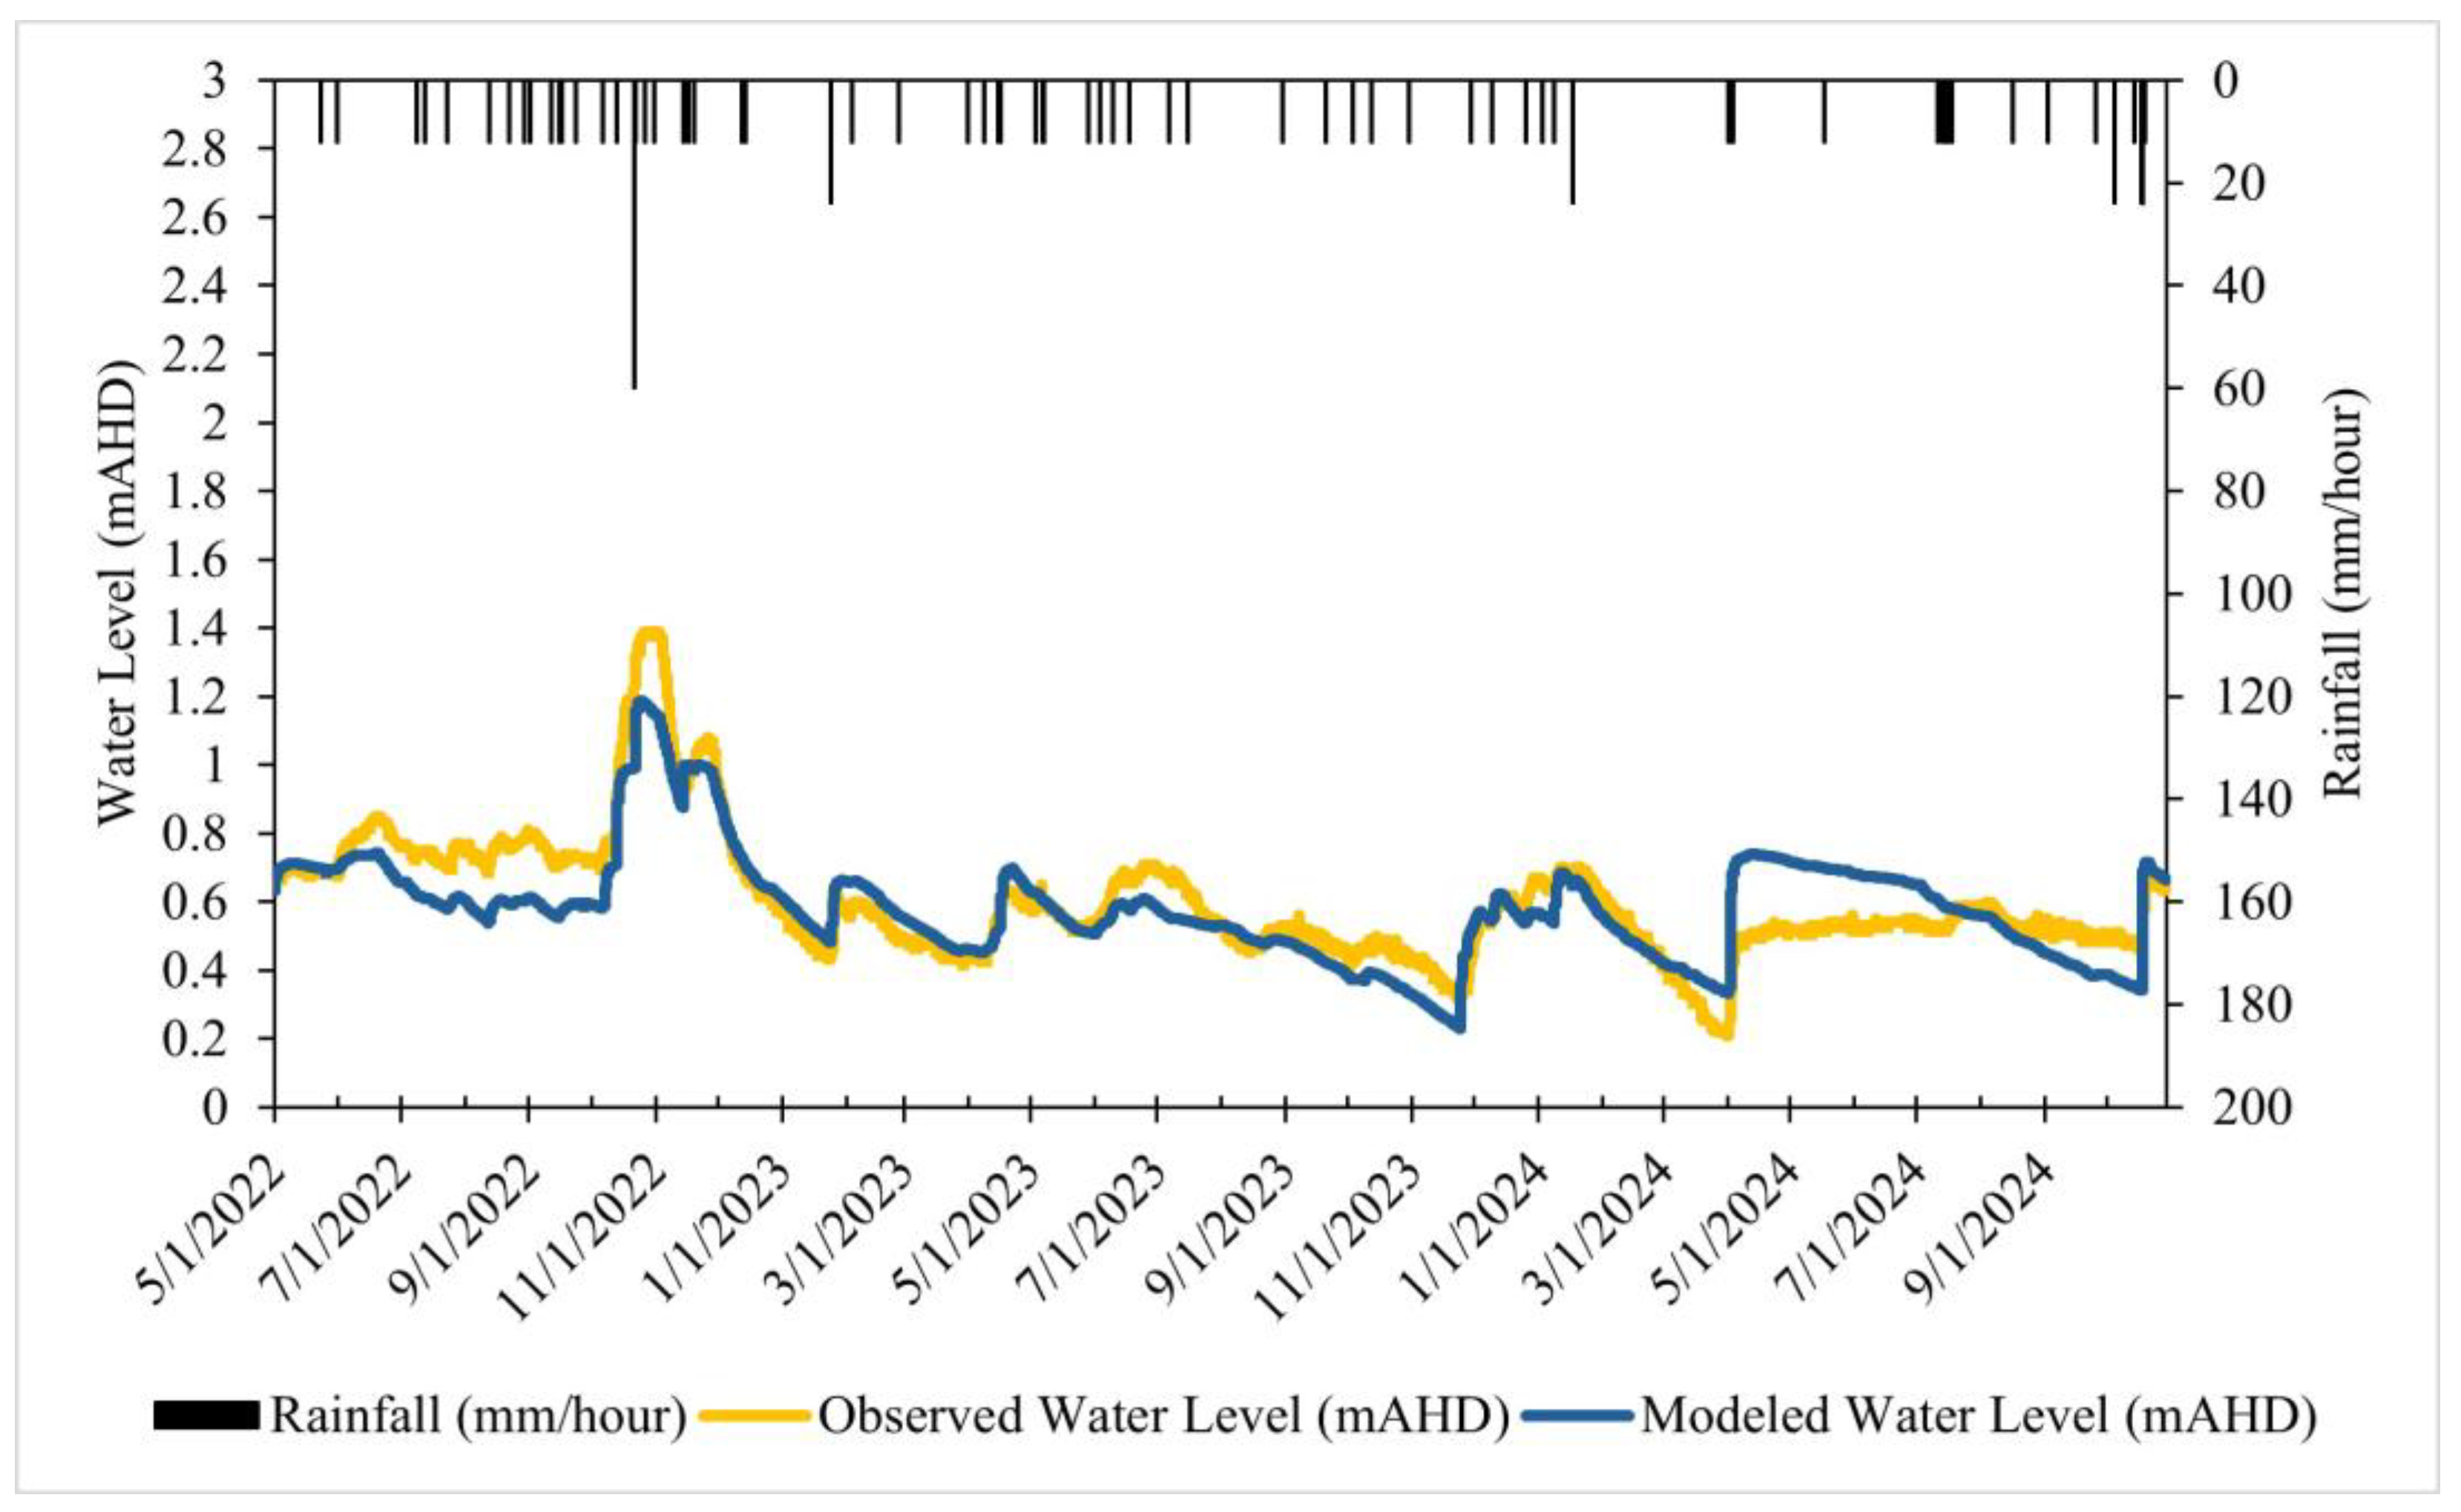
3.1. Model Calibration

Figure 4, Figure 5 and Figure 6 present the model calibration results for water levels at Horseshoe Bend Linear Wetland, Balog Channel outlet, and Sparrovale Wetland, respectively. The water level inside Sparrovale Wetland is controlled by inflow from the Horseshoe Bend Linear Wetland and Balog Channel, direct rainfall, and outflow through the Sparrovale Wetland outlet gate (as discussed in Section 2.2). Water levels are designed to be maintained at 1.0 mAHD in the Horseshoe Bend Linear Wetland, and levels higher than this will result in spillage into Sparrovale Wetland. Similarly, levels higher than 0.8 mAHD in Balog Channel will induce flow into Sparrovale Wetland and levels higher than 0.9–1.66 mAHD will cause overtopping of the Overflow Banks in Balog Channel. Drawdown of water level below the design levels indicates that pumping had taken place, as shown in Figure 4 and Figure 5. The results presented are limited to a period of 30 months because Balog Channel became operational in May 2022. Overall, the model results demonstrate an excellent fit based on the ISE rating across all locations. Other fit metrics show reasonable agreement, with NSE values varying from 0.55 to 0.79 and R2 values varying from 0.8 to 0.89. While these metrics suggest good model performance, we also recognize that an understanding of the study site characteristics, including its local climate, land use, and runoff management system, is important in addressing model adequacy and guiding the interpretation of model results to ensure that the model reflects the conditions of the area [60,61,62].
The model demonstrates a superior fit for the Horseshoe Bend site (Figure 4, NSE = 0.79 and R2 = 0.89), which has a smaller contributing catchment and less-complicated hydraulic controls compared to Balog Channel. The Horseshoe Bend water level time series captures a range of flow conditions, from extreme flood to low flows, including rapid level reductions from mid-December 2023 to late-April 2024 driven by the dewatering of the south sediment basin in the Linear Wetland system through pump operation. Subsequently, the low-flow gate operation began as part of sedimentation management process. However, the model slightly underestimated the lower peak events from late April to August 2024, likely due to uncertainties in the lower flow gate operation control.
Model predictions for water levels in Balog Channel are satisfactory (Figure 4, NSE = 0.55 and R2 = 0.8) (Figure 5). The observed water level at Balog exhibits greater fluctuations than at Horseshoe Bend, reflecting its more complex hydraulics with more active control gate deviations to manage the larger runoff volume from the Armstrong Creek catchment. While our model generally corresponds well to the rainfall data, the observed data show occasional divergence from the rainfall pattern, particularly during some of the no-flow and low-flow events (May 2022 and mid-August to late-September 2023). This discrepancy appears to be related to the uncertainty of using a single rain gauge in representing the spatial coverage of rainfall [61,63]. Rainfall data from the Ocean Grove station located at 38°15′0.23″ S, 144°30′35.64″ E (ID: 87178), with a similar distance but southwest from Sparrovale Wetland, were used to run the model for comparison. The Ocean Grove gauge tends to record much higher rainfall than the Geelong Racecourse gauge due to its proximity to the coast, leading to an overestimation of catchment runoff and water levels, particularly in the Balog Channel. For example, during wet month periods of June to August 2022 and November to December 2022, the Racecourse data produced a better fitting model.
Model results for the Sparrovale Wetland also demonstrate acceptable performance compared to the observed data (Figure 6, NSE = 0.67 and R2 = 0.83). In addition to the Balog and Linear Wetland inflows, the water level inside the Sparrovale Wetland is highly influenced by direct rainfall on the wetland surface and Sparrovale outlet gate operation, as stated earlier. Uncertainties persist with respect to the water level prediction under extreme weather conditions. For example, the model underestimates water levels during the October–December 2022 wet period and overestimates during the April–August 2024 dry period. Average rainfall had been recorded across the state in the months leading up to the October–December 2022 period, with October 2022 being the wettest month on record, followed by heavy rainfall events in November 2022 [64]. The model captured the general response of the wetland water levels to these extreme conditions, although peak water levels are underestimated. The Sparrovale Wetland essentially is rewilded agricultural land. The City of Greater Geelong has observed that it already is beginning to develop its own unique ecosystem. In particular, the emerging ecology inside the wetland (such as Lignum Swamp and Seasonally Inundated Subsaline Herbland) requires water depths of between 0.3 to <1 m and can be sensitive to high water levels [42]. This ecosystem health consideration was another driver for the user intervention of more frequent gate openings at the Sparrovale Wetland outlet, despite the outlet gate being intended to remain closed year-round under standard operations.

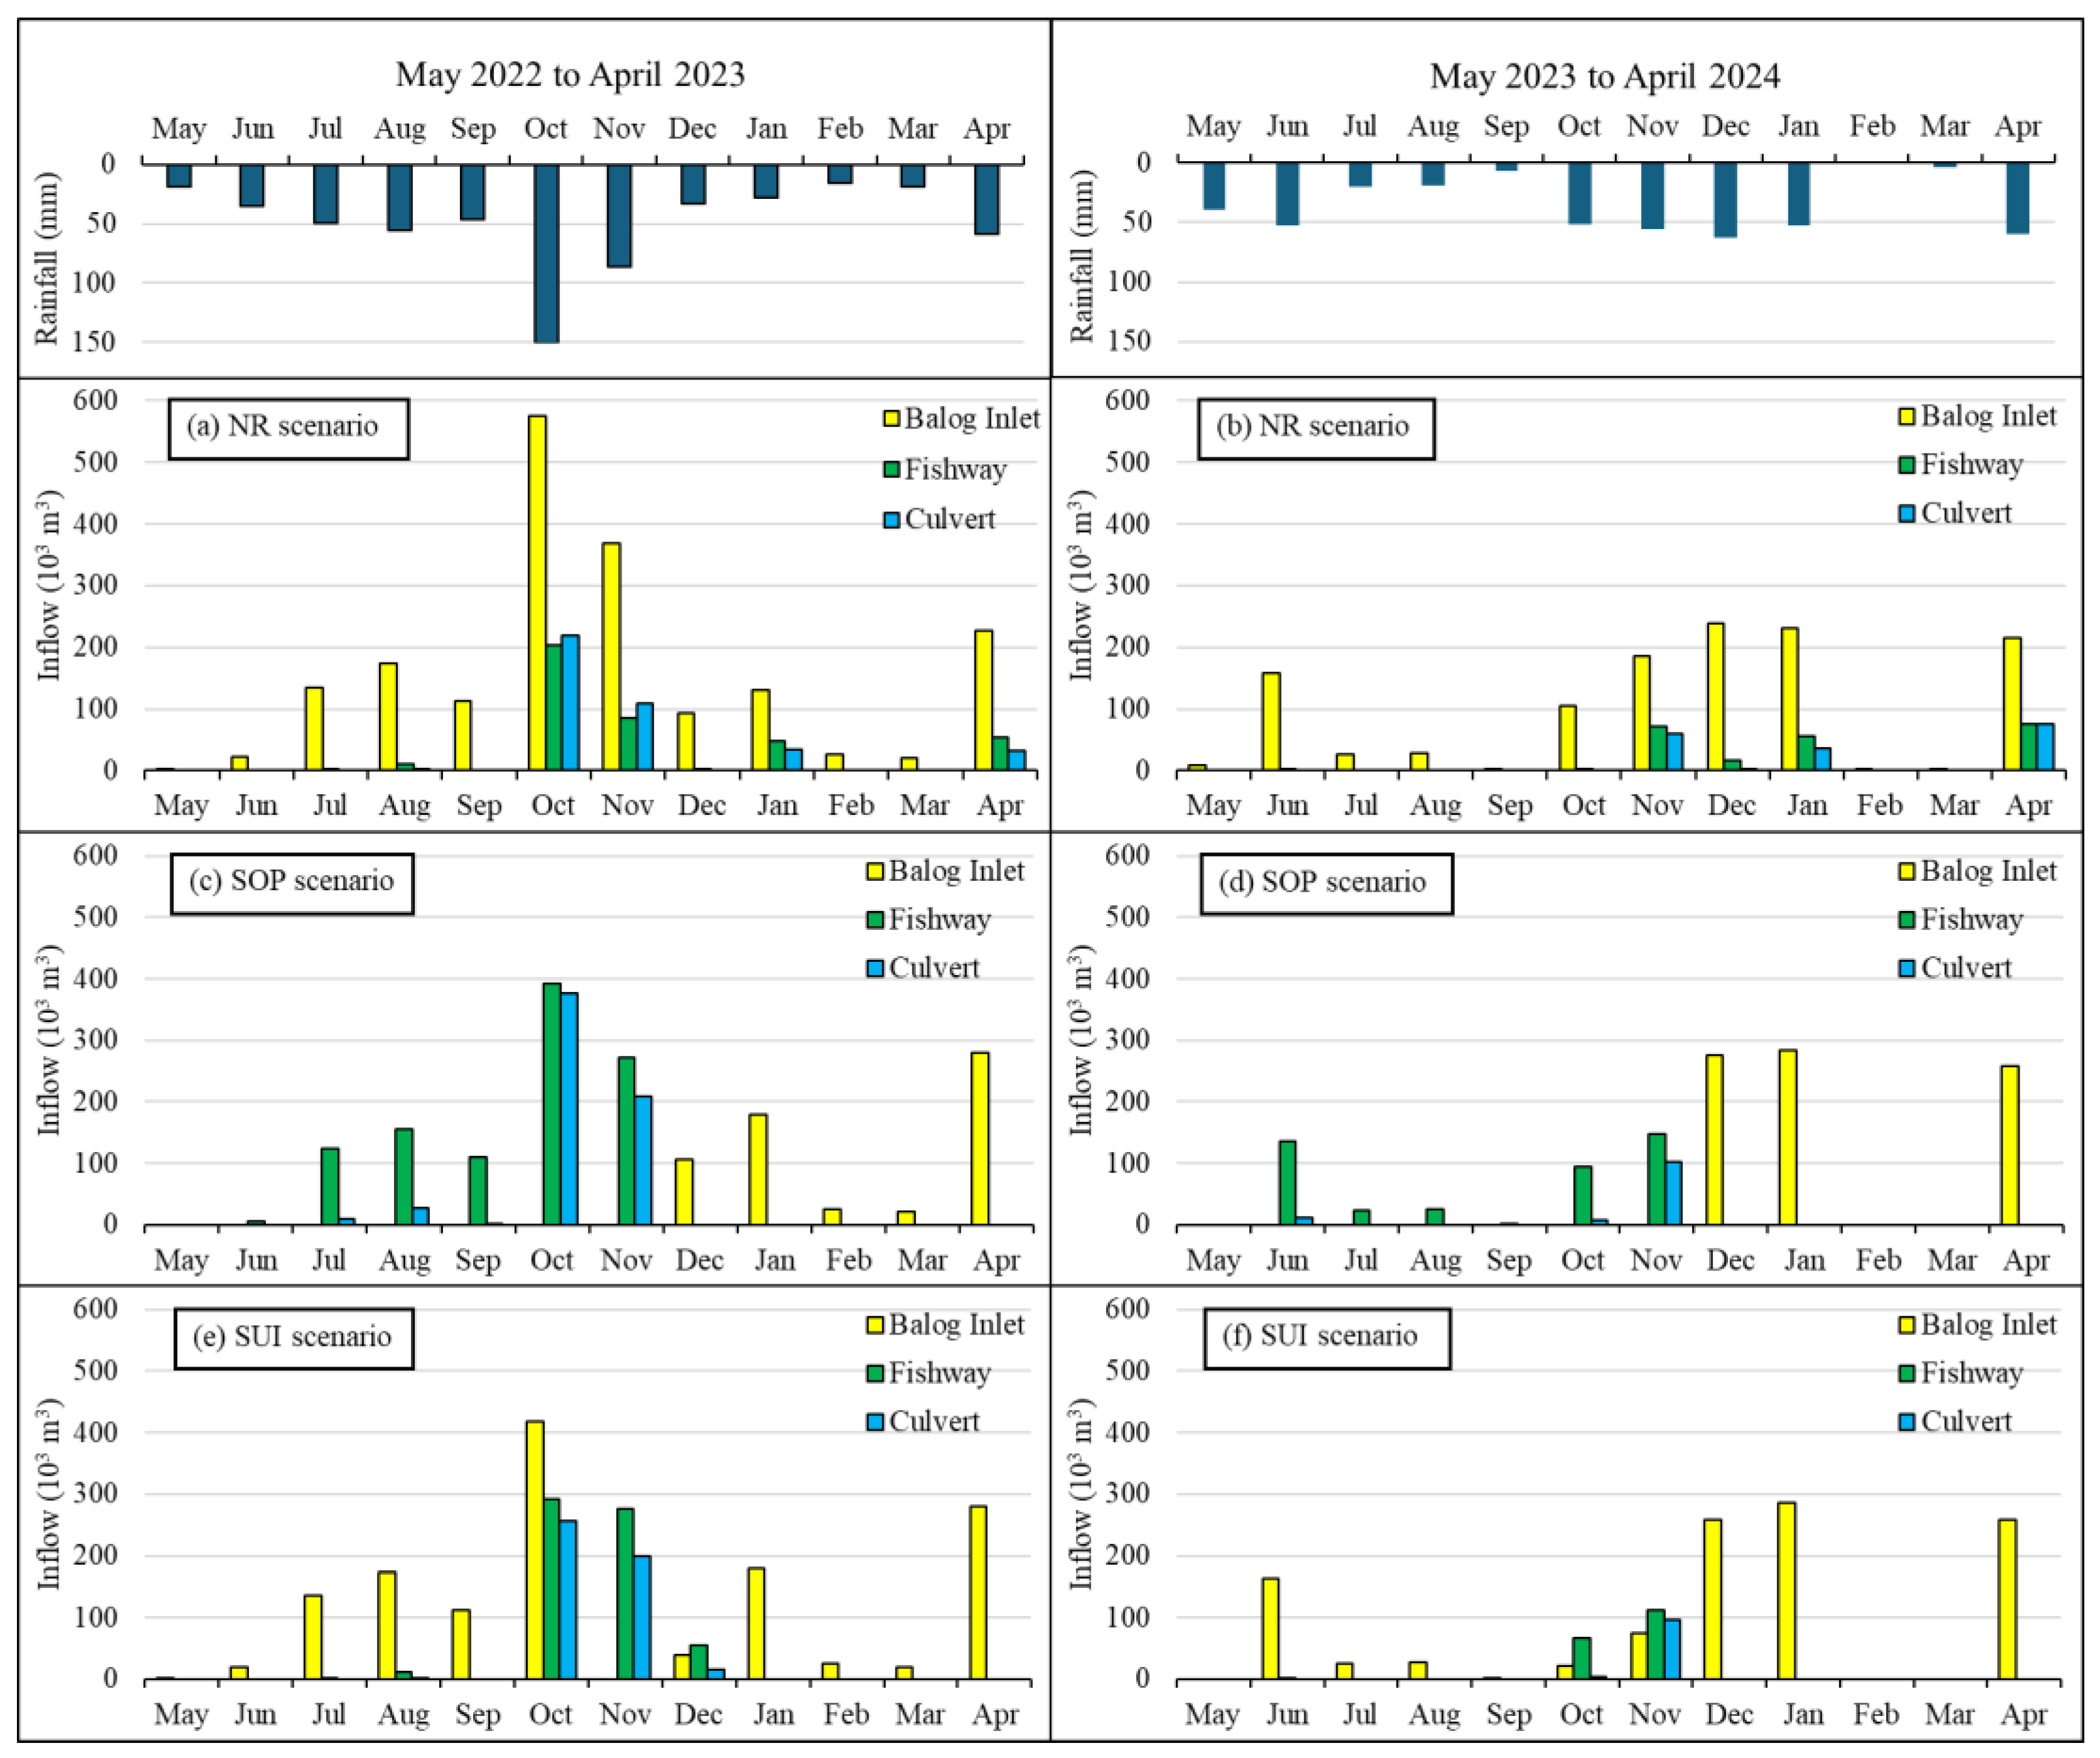
3.2. Flow Across Hydraulic Control Structures

Table 4 provides peak flow estimates for different control structures compared to the design values reported by Water Technology [42]. Our modeled peak flows are comparable with the design flows for all structures except for Balog Channel. High maximum inflows (up to 1.85 m3/s) in Balog during high-flow events also were reported in Water Technology [42], which may exceed the design capacity and lead to overtopping (flooding) into the adjacent open space facilitated by the breaks between the individual bunds. Field investigations during May 2023 and from May to July 2024 indicated frequent overtopping at the site. For example, with multiple rainfall events occurring between October and December 2022, the model reported maximum rainfall intensities reaching 60 mm/h. Throughout this period, both the inlet and outlet gates for the Balog Channel were fully open, allowing substantial inflow from Armstrong Creek to drain into the Sparrovale Wetland. The open space area west of Balog Channel and the Sparrovale Wetland were submerged, as captured by drone footage during that period (Figure 7). The openings in the bund facilitate the overtopping to the nearby open space, while a portion of the overflow will return once the level in Balog Channel recedes. The remaining volume held in the open space will be lost through infiltration or evaporation.

3.3. Sparrovale Catchment Runoff Characteristics and Water Budget

The calibrated model showed that subcatchment infiltration loss accounted for 70% of the total precipitation (1164 mm) between May 2022 and October 2024, followed by surface runoff (20%) and evaporation loss (10%). Subcatchment runoff coefficients varied between 0.11 to 0.62, depending on the extent of buildout. As the impervious surface area increases, runoff in the catchment also will increase [9,63]. Our analysis revealed that the runoff coefficient was highly correlated with the subcatchment imperviousness (r = 0.99).
In addition to land use, rainfall characteristics play a critical role in determining the occurrence and volume of runoff [65], thus impacting the water budget of the catchment. Table 5 shows a water balance analysis for the Sparrovale catchment under wet (May 2022–April 2023) and dry year (May 2023–April 2024) conditions. As indicated in the table, the wet year represented higher than average rainfall (596 mm vs. 516 mm), attributed mainly to significant rainfall between October and December 2022 (Section 3.1). Conversely, the dry year had lower than average rainfall (430 mm vs. 516 mm). The difference in rainfall characteristics led to considerable variation in the catchment runoff and water budget. The Armstrong Creek and Horseshoe Bend catchments produced a total runoff volume of 4942 × 103 m3 for the wet year period and 2387 × 103 m3 for the dry year. The total flow from Armstrong Creek was 4 to 5 times greater than from Horseshoe Bend for both years, as the area of Horseshoe Bend is much smaller. The estimated runoff from Armstrong Creek during the wet year (3847 × 103 m3) is comparable to the design flow of 3540 × 103 m3 [42]; however, catchment runoff in the dry year was reduced by nearly half (2387 × 103 m3). While the total inflow to the Sparrovale Wetland during the wet year exceeded the design (2769 × 103 m3 vs. 1825 × 103 m3), the dry year inflow was similar (1997 × 103 m3 vs. 1825 × 103 m3).

3.4. Seasonal Consideration for the Management of Sparrovale Wetlands

Figure 8 summarizes the monthly flows entering Balog Channel, Fishway, and Culvert for the NR, SOP, and SUI scenarios in wet (May 2022 to April 2023) and dry years (May 2023 to April 2024). The monthly rainfall distribution for both years follows a distinct seasonal pattern, with the wet year exhibiting greater rainfall variability compared to the dry year. Specifically, the wet year is characterized by a wetter winter (June to August) and spring (September to November), a drier summer (December to February), and a comparable rainfall pattern in autumn (March to May). The monthly total inflow to Balog Channel under the NR scenario (Figure 8a,b) is higher than the combined Fishway and Culvert flows to Baenschs Wetland, with peak flows occurring in October (580 × 103 m3) and November (370 × 103 m3) during the wet year, and in December (240 × 103 m3) and January (230 × 103 m3) during the dry year. The Balog inlet would receive inflow year-round under the NR scenario, while the Fishway and Culvert outlets activate only in high-rainfall months. Excessive inflow to Balog during high rainfall events may surpass the storage capacity, causing the risk of overtopping Balog Channel (Section 3.2). High water levels would be expected year-round in Sparrovale Wetland. Similarly, the dependence of the Fishway and Culvert operation during high rainfall events may cause seasonal disparity and prolonged drying periods in Baenschs Wetland.
Under the SOP scenario (Figure 8c,d), inflow to Balog and Fishway and Culvert share a completely different seasonal pattern as compared to the NR scenario for the wet and dry year. The monthly flow distribution follows a watering plan (wet and dry regime) intended to alternate flow pathways based on ecological timing needs in Baenschs and Sparrovale Wetlands (Table 2). From the results, the SOP may provide sufficient ecological protection for the wetland system and downstream Ramsar site (Lake Connewarre) when rainfall follows typical patterns and the yearly total remains at or below the annual average. However, this scheduling is unable to react to unexpected rainfall variations, in particular during extreme rainfall months of October and November 2022 (Figure 8c). The maximum monthly inflows to Fishway and Culvert occur in October (800 × 103 m3 and 100 × 103 m3, respectively) and November (500 × 103 m3 and 250 × 103 m3, respectively) during the wet year (Figure 8c), which is significantly higher than that for the corresponding periods in the dry year (Figure 8d). Extreme wet-year flows, driven by heavy rainfall (October–November 2022), may cause erosion and habitat disturbance in Baenschs and subsequently Lake Connewarre.
Under the SUI scenario, Balog Channel typically receives more flow than the Fishway and Culvert for both years, except in October and November, when the combined flow (Fishway + Culvert) is higher (Figure 8e,f). Between December and April, the monthly total flow volumes into all structures under the SUI scenario are consistent with those of the SOP scenario, while the differing flow patterns between May and November imply a deviation from the SOP (i.e., flow goes to Balog Channel while under the SOP there should be no flow). The deviations during the wet year (May to November), with flow being conveyed into Balog and closing of Fishway and Culvert, were carried out to prevent excess water from entering Baenschs Wetland. This measure aimed to limit additional discharge into the downstream Hospital Swamp Wetland, which was already experiencing high water levels due to greater rainfall. The Fishway and Culvert operations resumed from May to November (Figure 8f) in compliance with the SOP during the dry year, but Balog also was opened concurrently to draw down the high water level in the Warralily DIDR1 Wetland due to concerns about plant inundation. However, no flow was directed to Baenschs Wetland, although there should have been flow during that period as indicated under the SOP (Figure 8d) because of the higher invert elevations at Fishway and Culvert as compared to Balog. Insufficient flow to the Fishway and Culvert throughout the year may result in extended dry periods in the Baenschs Wetland, consequently affecting the ecological health and biodiversity of the downstream wetland system. The monthly flow distribution results under the SUI scenario highlight the challenges to ad hoc user interventions in balancing water levels, which in this case resulted in no flow to the Fishway and Culvert (Figure 8f). Modeling can help elucidate these complex interactions, particularly when addressing the challenges of implementing adaptive management operations.
These results emphasize the important role of the Balog Channel and catchment runoff management through flow diversion, preventing the Armstrong Creek freshwater storm pulses from overly diluting the brackish Baenschs Wetland. Without diversion, discharge to Baenschs would increase dramatically, likely resulting in the disruption of the entire wetland complex and the Lake Connewarre ecosystem. Although the system operation under the SUI scenario appears to be the most effective approach to managing the current runoff as it considers system-wide benefits, including timely dewatering and management of water depth in Sparrovale and Warralily in consideration of plant inundation, the scenario relies upon on-site observations and operating gates manually. This reliance on manual adjustment may not be desirable in the longer term as it is resource intensive. Management operations for the Sparrovale system could benefit from implementing a real time storm event prediction platform, including automatic gate operations with integrated water level monitoring sensors. Our study highlights the importance of employing a continuous modeling approach (rather than relying on fixed scheduling of gate operations), which is essential in supporting better water management decision-making. The findings are valuable for managing not only Sparrovale Wetland but sensitive ecosystems that depend on complex hydrologic/hydraulic interactions, including specific seasonal patterns, water level fluctuations, and inundation and drying cycles.

4. Conclusions

Increased urbanization has been linked to the loss of many of Australia’s wetlands. The suburban development of our study catchment, in particular, poses threats to the downstream brackish-water Ramsar site, Lake Connewarre, raising concerns about increased freshwater surface runoff discharging into the wetland and upsetting the ecosystem balance. Development of the PCSWMM model for the Sparrovale contributing catchment provided valuable insights into system dynamics and the satisfactory model results suggest that a physically based, dynamic model can capture the key processes of a hydraulically complicated, NbS/grey infrastructure design, thereby serving as a valuable decision-making tool. In developing the model application, we were fortunate to benefit from a data-rich and collaborative modeling environment. The access to extensive meteorologic, hydrologic, geospatial, and design data, collectively with strong collaborative interaction from local government to help guide model development, were key elements to successful modeling.
Under current conditions, subcatchment infiltration loss remains the dominant part of the catchment water budget (~70% of total precipitation). Runoff coefficients were strongly correlated with imperviousness (r = 0.99), indicating that future increases in runoff will occur as development expands. Options for the management of the Sparrovale system remain to be explored. Our study indicates the critical role of gate operations and user interventions in managing flow and maintaining optimal flows and water depths. Incorporating real-time monitoring and automated gate operations into existing catchment runoff management may optimize the system performance amid urbanization pressure. There are some important critical next steps in exploring additional scenarios with a model that we believe can accurately capture system dynamics. First, the model should be used to further explore the value of a more sophisticated gate operation plan. In support of this more detailed management plan, as already noted, a real-time application, including a platform that seamlessly integrates rainfall forecasting and PCSWMM predictions, is being developed as part of the next phase of the project to support the gate operation interventions. The process would involve using more spatially explicit rainfall data by combining weather radar with ground-based observations to ensure prediction accuracy. Second, future buildout scenarios should be explored with PCSWMM to better understand the extent to which the suburbanization process might impact Lake Connewarre. This impact assessment should include consideration of water quality (including a more detailed assessment of the NbS cascading wetland treatment efficacy). PCSWMM is capable of modeling the catchment water quality, but for more complicated water bodies such as Lake Connewarre, it will be necessary to script a linkage for catchment runoff estimates to become input for a 3D receiving water model (e.g., [66]). This future step likely would require a more detailed assessment of the NbS wetland treatment designs to help optimize the ecosystem service benefits provided. Third, climate change scenarios should be assessed to better understand future impacts both on the catchment and Lake Connewarre. The climate change scenarios might be combined with the suburbanization scenarios to examine the collective impact of these disruptive events. Lastly, integrating hydrologic/hydraulic modeling within a Decision Support System (DSS) framework could enhance real-time decision-making and support adaptive management under variable and extreme conditions. This represents a promising direction for future development, particularly in supporting operational staff with timely, data-driven management strategies.

Supplementary Materials

The following supporting information can be downloaded at: https://www.mdpi.com/article/10.3390/hydrology12060141/s1, Figure S1: Aerial view of Balog Channel showing a series of openings in the earth bund retrieved from Nearmap imagery, with surveyed elevations and widths; Figure S2: Balog Channel hydraulic system; Figure S3: Horseshoe Bend Linear Wetland hydraulic system; Figure S4: Location of the Sparrovale Wetland outlet gate; Figure S5: Warralily DIDR1 Wetland hydraulic system.

Author Contributions

Conceptualization, L.T., K.N.I. and L.H.C.C.; methodology, L.T., K.N.I. and L.H.C.C.; validation, L.T., K.N.I. and L.H.C.C.; formal analysis, L.T., K.N.I. and L.H.C.C.; investigation, L.T., K.N.I., L.H.C.C. and M.U.; data curation, L.T.; writing—original draft preparation, L.T.; writing—review and editing, L.T., K.N.I. and L.H.C.C.; visualization, L.T. and M.U.; supervision, K.N.I. and L.H.C.C. All authors have read and agreed to the published version of the manuscript.

Funding

Funding for this project was provided by the City of Greater Geelong, Victoria, Australia.

Data Availability Statement

Access to data needed to reproduce the figures will be made available by the authors on request.

Acknowledgments

Thammasat University’s award of a Postgraduate Research Scholarship (TUPRS) for PhD studies is gratefully acknowledged by the first author. The authors are also grateful to the City of Greater Geelong for providing project funding through the project Sparrovale Wetlands Water Monitoring and Modelling Project. We also thank Donna Smithyman (City of Greater Geelong) and Jarrod Gaut (WaterInsites (VIC) Pty Ltd.) for the many discussions over the course of this project, whose insightful comments have made an immense contribution to the study.

Conflicts of Interest

The authors declare no conflicts of interest.

References

  1. Bourne, L.S. Reinventing the Suburbs: Old Myths and New Realities. Prog. Plan. 1996, 46, 163–184. [Google Scholar] [CrossRef]
  2. McManus, R.; Ethington, P.J. Suburbs in Transition: New Approaches to Suburban History. Urban Hist. 2007, 34, 317–337. [Google Scholar] [CrossRef]
  3. Lang, R.E.; LeFurgy, J.; Nelson, A.C. The Six Suburban Eras of the United States: Research Note. Opolis 2006, 2, 65–72. [Google Scholar]
  4. Davison, G. Australia: The First Suburban Nation? J. Urban Hist. 1995, 22, 40–74. [Google Scholar] [CrossRef]
  5. Zhang, X.Q. The Trends, Promises and Challenges of Urbanisation in the World. Habitat Int. 2016, 54, 241–252. [Google Scholar] [CrossRef]
  6. Kahn, M.E. The Environmental Impact of Suburbanization. J. Pol. Anal. Manag. 2000, 19, 569–586. [Google Scholar] [CrossRef]
  7. Bai, X.; McPhearson, T.; Cleugh, H.; Nagendra, H.; Tong, X.; Zhu, T.; Zhu, Y.-G. Linking Urbanization and the Environment: Conceptual and Empirical Advances. Annu. Rev. Environ. Resour. 2017, 42, 215–240. [Google Scholar] [CrossRef]
  8. Fletcher, T.D.; Andrieu, H.; Hamel, P. Understanding, Management and Modelling of Urban Hydrology and Its Consequences for Receiving Waters: A State of the Art. Adv. Water Resour. 2013, 51, 261–279. [Google Scholar] [CrossRef]
  9. McGrane, S.J. Impacts of Urbanisation on Hydrological and Water Quality Dynamics, and Urban Water Management: A Review. Hydrol. Sci. J. 2016, 61, 2295–2311. [Google Scholar] [CrossRef]
  10. Faulkner, S. Urbanization Impacts on the Structure and Function of Forested Wetlands. Urban Ecosyst. 2004, 7, 89–106. [Google Scholar] [CrossRef]
  11. Davidson, N.C. How Much Wetland Has the World Lost? Long-Term and Recent Trends in Global Wetland Area. Mar. Freshw. Res. 2014, 65, 934. [Google Scholar] [CrossRef]
  12. Fluet-Chouinard, E.; Stocker, B.D.; Zhang, Z.; Malhotra, A.; Melton, J.R.; Poulter, B.; Kaplan, J.O.; Goldewijk, K.K.; Siebert, S.; Minayeva, T.; et al. Extensive Global Wetland Loss over the Past Three Centuries. Nature 2023, 614, 281–286. [Google Scholar] [CrossRef] [PubMed]
  13. Bino, G.; Kingsford, R.T.; Brandis, K. Australia’s Wetlands—Learning from the Past to Manage for the Future. Pac. Conserv. Biol. 2016, 22, 116. [Google Scholar] [CrossRef]
  14. Brock, M.A.; Smith, R.G.B.; Jarman, P.J. Drain It, Dam It: Alteration of Water Regime in Shallow Wetlands on the New England Tableland of New South Wales, Australia. Wetl. Ecol. Manag. 1999, 7, 37–46. [Google Scholar] [CrossRef]
  15. Davis, J.A.; Froend, R. Loss and Degradation of Wetlands in Southwestern Australia: Underlying Causes, Consequences and Solutions. Wetl. Ecol. Manag. 1999, 7, 13–23. [Google Scholar] [CrossRef]
  16. Tapsuwan, S.; Ingram, G.; Burton, M.; Brennan, D. Capitalized Amenity Value of Urban Wetlands: A Hedonic Property Price Approach to Urban Wetlands in Perth, Western Australia*. Aust. J. Agric. Resour. Econ. 2009, 53, 527–545. [Google Scholar] [CrossRef]
  17. Costanza, R.; De Groot, R.; Sutton, P.; Van Der Ploeg, S.; Anderson, S.J.; Kubiszewski, I.; Farber, S.; Turner, R.K. Changes in the Global Value of Ecosystem Services. Glob. Environ. Change 2014, 26, 152–158. [Google Scholar] [CrossRef]
  18. Convention on Wetlands. Global Wetland Outlook: Special Edition 2021; Secretariat of the Convention on Wetlands: Gland, Switzerland, 2021. [Google Scholar]
  19. Gell, P.A.; Finlayson, C.M.; Davidson, N.C. Understanding Change in the Ecological Character of Ramsar Wetlands: Perspectives from a Deeper Time—Synthesis. Mar. Freshw. Res. 2016, 67, 869. [Google Scholar] [CrossRef]
  20. Millennium Ecosystem Assessment (MEA). Ecosystems and Human Well-Being: Wetland and Water Synthesis; World Resources Institute: Washington, DC, USA, 2005; Available online: https://www.millenniumassessment.org/documents/document.358.aspx.pdf (accessed on 17 January 2025).
  21. Cohen-Shacham, E.; Andrade, A.; Dalton, J.; Dudley, N.; Jones, M.; Kumar, C.; Maginnis, S.; Maynard, S.; Nelson, C.R.; Renaud, F.G.; et al. Core Principles for Successfully Implementing and Upscaling Nature-Based Solutions. Environ. Sci. Policy 2019, 98, 20–29. [Google Scholar] [CrossRef]
  22. Barton, A.B.; Argue, J.R. A Review of the Application of Water Sensitive Urban Design (WSUD) to Residential Development in Australia. Australas. J. Water Resour. 2007, 11, 31–40. [Google Scholar] [CrossRef]
  23. Beza, B.B.; Zeunert, J.; Hanson, F. The Role of WSUD in Contributing to Sustainable Urban Settings. In Approaches to Water Sensitive Urban Design; Elsevier: Amsterdam, The Netherlands, 2019; pp. 367–380. ISBN 978-0-12-812843-5. [Google Scholar]
  24. Radcliffe, J.C. History of Water Sensitive Urban Design/Low Impact Development Adoption in Australia and Internationally. In Approaches to Water Sensitive Urban Design; Elsevier: Amsterdam, The Netherlands, 2019; pp. 1–24. ISBN 978-0-12-812843-5. [Google Scholar]
  25. Wong, T.H.F. An Overview of Water Sensitive Urban Design Practices in Australia. Water Pract. Technol. 2006, 1, wpt2006018. [Google Scholar] [CrossRef]
  26. Irvine, K.; Chua, L.H.C.; Hua’an, Z.; Qi, L.E.; Xuan, L.Y. Nature-Based Solutions to Manage Particle-Bound Metals in Urban Stormwater Runoff: Current Design Practices and Knowledge Gaps. J. Soils Sediments 2023, 23, 3671–3688. [Google Scholar] [CrossRef]
  27. Ruangpan, L.; Vojinovic, Z.; Di Sabatino, S.; Leo, L.S.; Capobianco, V.; Oen, A.M.P.; McClain, M.E.; Lopez-Gunn, E. Nature-Based Solutions for Hydro-Meteorological Risk Reduction: A State-of-the-Art Review of the Research Area. Nat. Hazards Earth Syst. Sci. 2020, 20, 243–270. [Google Scholar] [CrossRef]
  28. Bush, J.; Frantzeskaki, N.; Ossola, A.; Pineda-Pinto, M. Priorities for Mainstreaming Urban Nature-Based Solutions in Australian Cities. Nat.-Based Solut. 2023, 3, 100065. [Google Scholar] [CrossRef]
  29. Moosavi, S.; Browne, G.R.; Bush, J. Perceptions of Nature-Based Solutions for Urban Water Challenges: Insights from Australian Researchers and Practitioners. Urban For. Urban Green. 2021, 57, 126937. [Google Scholar] [CrossRef]
  30. Zhu, D.; Zhang, Y.; Kendal, D.; Fraser, L.; Flies, E.J. Nature-Based Solutions in Australia: A Systematic Quantitative Literature Review of Terms, Application and Policy Relevance. Nat.-Based Solut. 2023, 4, 100092. [Google Scholar] [CrossRef]
  31. Nias, R.; Lawrence, A.; Kendal, D.; Flies, E. Nature-Based Solutions in Australia—Applications and Opportunities to Deliver Real Outcomes for Communities and Nature; University of Tasmania: Tasmania, Australia, 2023. [Google Scholar]
  32. Lafortezza, R.; Chen, J.; Van Den Bosch, C.K.; Randrup, T.B. Nature-Based Solutions for Resilient Landscapes and Cities. Environ. Res. 2018, 165, 431–441. [Google Scholar] [CrossRef]
  33. Australian Bureau of Statistics. Geelong, Census All Persons QuickStats. Available online: https://www.abs.gov.au/census/find-census-data/quickstats/2021/203 (accessed on 15 January 2025).
  34. Department of Environment, Land, Water and Planning. Port Phillip Bay (Western Shoreline) and Bellarine Peninsula Ramsar Site Management Plan Summary; Department of Environment, Land, Water and Planning: East Melbourne, Australia, 2018.
  35. Reeves, J.M.; Gell, P.A.; Reichman, S.M.; Trewarn, A.J.; Zawadzki, A. Industrial Past, Urban Future: Using Palaeo-Studies to Determine the Industrial Legacy of the Barwon Estuary, Victoria, Australia. Mar. Freshw. Res. 2016, 67, 837. [Google Scholar] [CrossRef]
  36. Australian Bureau of Statistics. Armstrong Creek, Census All Persons QuickStats. Available online: https://www.abs.gov.au/census/find-census-data/quickstats/2021/SAL20068 (accessed on 16 January 2025).
  37. City of Greater Geelong. Armstrong Creek—Whole of Growth Area. Available online: https://www.geelongaustralia.com.au/armstrongcreek/armstrong/article/item/8cfafd49ea31e3f.aspx (accessed on 16 January 2025).
  38. Australian Bureau of Meteorology. Rainfall: Breakwater (Geelong Racecourse). Available online: http://www.bom.gov.au/jsp/ncc/cdio/weatherData/av?p_nccObsCode=139&p_display_type=dataFile&p_startYear=&p_c=&p_stn_num=87184 (accessed on 16 January 2025).
  39. Australian Bureau of Meteorology. Evapotranspiration: Breakwater (Geelong Racecourse). Available online: http://www.bom.gov.au/watl/eto/tables/vic/breakwater_(geelong_racecourse)/breakwater_(geelong_racecourse).html (accessed on 16 January 2025).
  40. Smithyman, D.; Provily, S. Building a Regional Park: The Sparrovale Wetlands Project, Growing Geelong’s Natural Areas. Plan. News 2020, 46, 28–29. [Google Scholar]
  41. City of Greater Geelong. Sparrovale Ngubitj Yoorree Wetlands Master Plan; City of Greater Geelong: Geelong, Australia, 2021; Available online: https://hdp-au-prod-app-ggc-yoursay-files.s3.ap-southeast-2.amazonaws.com/8716/2754/1264/Sparrovale_Master_Plan_Final_-_18.06.21.PDF (accessed on 16 January 2025).
  42. Water Technology. Sparrovale Wetland Operating Rules; Technical Report (unpublished report); City of Greater Geelong: Geelong, Australia, 2022. [Google Scholar]
  43. Irvine, K.; Chua, L. Modeling Stormwater Runoff from an Urban Park, Singapore Using PCSWWM. J. Water Manag. Model. 2016, 25, C410. [Google Scholar] [CrossRef]
  44. Abduljaleel, Y.; Chikabvumbwa, S.R.; Haq, F.U. Assessing the Efficacy of Permeable Interlocking Concrete Pavers (PICP) in Managing Stormwater Runoff under Climate Change and Land Use Scenarios. J. Hydrol. 2025, 646, 132329. [Google Scholar] [CrossRef]
  45. Akhter, M.; Hewa, G. The Use of PCSWMM for Assessing the Impacts of Land Use Changes on Hydrological Responses and Performance of WSUD in Managing the Impacts at Myponga Catchment, South Australia. Water 2016, 8, 511. [Google Scholar] [CrossRef]
  46. Aziz, F.; Wang, X.; Qasim Mahmood, M.; Guild, R. Wastewater Flooding Risk Assessment for Coastal Communities: Compound Impacts of Climate Change and Population Growth. J. Hydrol. 2024, 645, 132136. [Google Scholar] [CrossRef]
  47. Chitwatkulsiri, D.; Miyamoto, H.; Irvine, K.N.; Pilailar, S.; Loc, H.H. Development and Application of a Real-Time Flood Forecasting System (RTFlood System) in a Tropical Urban Area: A Case Study of Ramkhamhaeng Polder, Bangkok, Thailand. Water 2022, 14, 1641. [Google Scholar] [CrossRef]
  48. Dharmasena, T.; Chua, L.H.C.; Barron, N.; Zhang, H. Performance Assessment of a Constructed Wetland Using a Numerical Modelling Approach. Ecol. Eng. 2021, 173, 106441. [Google Scholar] [CrossRef]
  49. Ghofrani, Z.; Sposito, V.; Faggian, R. Designing a Pond and Evaluating Its Impact Upon Storm-Water Quality and Flow: A Case Study in Rural Australia. Ecol. Chem. Eng. S 2019, 26, 475–491. [Google Scholar] [CrossRef]
  50. Irvine, K.; Sovann, C.; Suthipong, S.; Kok, S.; Chea, E. Application of PCSWMM to Assess Wastewater Treatment and Urban Flooding Scenarios in Phnom Penh, Cambodia: A Tool to Support Eco-City Planning. J. Water Manag. Model. 2015, 23, C389. [Google Scholar] [CrossRef]
  51. Petschek, P.; Aung, A.P.P.; Suwanarit, A.; Irvine, K.N. Integration of Building Information Modeling and Stormwater Runoff Modeling: Enhancing Design Tools for Nature-Based Solutions in Sustainable Landscapes. Sustainability 2024, 16, 3694. [Google Scholar] [CrossRef]
  52. Wu, W.; Jamali, B.; Zhang, K.; Marshall, L.; Deletic, A. Water Sensitive Urban Design (WSUD) Spatial Prioritisation through Global Sensitivity Analysis for Effective Urban Pluvial Flood Mitigation. Water Res. 2023, 235, 119888. [Google Scholar] [CrossRef]
  53. Rossman, L.A. Stormwater Management Model: User’s Manual Version 5.0; United States Environmental Protection Agency: Washington, DC, USA, 2010.
  54. Rawls, W.J.; Brakensiek, D.L.; Miller, N. Green-ampt Infiltration Parameters from Soils Data. J. Hydraul. Eng. 1983, 109, 62–70. [Google Scholar] [CrossRef]
  55. EverGraze. South-West Victoria Lower Soils; EverGraze. Available online: https://www.evergraze.com.au/library-content/south-west-victoria-lower-soils/index.html (accessed on 10 February 2025).
  56. Nearmap. High-Resolution Aerial Maps & Location Intelligence: Nearmap Australia. Available online: https://www.nearmap.com/ (accessed on 22 August 2022).
  57. Sarma, P.; Delleur, J.; Rao, A. Comparison of Rainfall-Runoff Models for Urban Areas. J. Hydrol. 1973, 18, 329–347. [Google Scholar] [CrossRef]
  58. Moriasi, D.N.; Arnold, J.G.; van Liew, M.W.; Bingner, R.L.; Harmel, R.D.; Veith, T.L. Model Evaluation Guidelines for Systematic Quantification of Accuracy in Watershed Simulations. Trans. ASABE 2007, 50, 885–900. [Google Scholar] [CrossRef]
  59. Hlaing, P.T.; Humphries, U.W.; Waqas, M. Hydrological Model Parameter Regionalization: Runoff Estimation Using Machine Learning Techniques in the Tha Chin River Basin, Thailand. MethodsX 2024, 13, 102792. [Google Scholar] [CrossRef]
  60. Althoff, D.; Rodrigues, L.N. Goodness-of-Fit Criteria for Hydrological Models: Model Calibration and Performance Assessment. J. Hydrol. 2021, 600, 126674. [Google Scholar] [CrossRef]
  61. Irvine, K.; Chua, L.; Ashrafi, M.; Loc, H.H.; Le, S.H. Drivers of Model Uncertainty for Urban Runoff in a Tropical Climate: The Effect of Rainfall Variability and Subcatchment Parameterization. J. Water Manag. Model. 2023, 31, C496. [Google Scholar] [CrossRef]
  62. Ritter, A.; Muñoz-Carpena, R. Performance Evaluation of Hydrological Models: Statistical Significance for Reducing Subjectivity in Goodness-of-Fit Assessments. J. Hydrol. 2013, 480, 33–45. [Google Scholar] [CrossRef]
  63. Courty, L.G.; Rico-Ramirez, M.Á.; Pedrozo-Acuña, A. The Significance of the Spatial Variability of Rainfall on the Numerical Simulation of Urban Floods. Water 2018, 10, 207. [Google Scholar] [CrossRef]
  64. Bureau of Meteorology. Bureau of Meteorology Submission to the Inquiry into the 2022 Flood Event in Victoria: Victorian Upper House Parliamentary Inquiry; Commonwealth of Australia, 2023. Available online: https://www.parliament.vic.gov.au/4af93b/contentassets/08059cabb8cb4ead975055ae0f5da617/073.-bureau-of-meteorology_red.pdf (accessed on 10 May 2025).
  65. Gámez-Balmaceda, E.; López-Ramos, A.; Martínez-Acosta, L.; Medrano-Barboza, J.P.; Remolina López, J.F.; Seingier, G.; Daesslé, L.W.; López-Lambraño, A.A. Rainfall Intensity-Duration-Frequency Relationship. Case Study: Depth-Duration Ratio in a Semi-Arid Zone in Mexico. Hydrology 2020, 7, 78. [Google Scholar] [CrossRef]
  66. Yang, P.; Chua, L.H.C.; Irvine, K.N.; Nguyen, M.T.; Low, E.-W. Impacts of a Floating Photovoltaic System on Temperature and Water Quality in a Shallow Tropical Reservoir. Limnology 2022, 23, 441–454. [Google Scholar] [CrossRef]
Figure 1. Location map of the study area.
Hydrology 12 00141 g001
Figure 2. PCSWMM modeling process for this study.
Hydrology 12 00141 g002
Figure 3. PCSWMM configuration for the study area, with Sparrovale Wetland as a storage node and Hospital Swamp boundary as an outfall node, enclosed in white rectangles.
Hydrology 12 00141 g003
Figure 4. Modeled and observed water level at Horseshoe Bend Linear Wetland outlet, with pump operation (14 December 2023 to 23 April 2024) and low-flow gate operation (24 April 2024 to 29 October 2024) periods enclosed in red box, NSE = 0.79; R2 = 0.89.
Hydrology 12 00141 g004
Figure 5. Modeled and observed water level at Balog Channel outlet, with pump operation period (20 November 2022 to 17 December 2022) enclosed in red box, NSE = 0.55; R2 = 0.8.
Hydrology 12 00141 g005
Figure 6. Modeled and observed water level at Sparrovale Wetland, NSE = 0.67; R2 = 0.83.
Hydrology 12 00141 g006
Figure 7. Drone footage taken on 16 October 2022 of (a) Sparrovale Wetland and (b) Balog Channel, including the overtopping to the adjacent open space (foreground).
Hydrology 12 00141 g007
Figure 8. Seasonality of flow volume through control gates at Warralily DIDR1 wetland under different scenarios for May 2022 to April 2023 and May 2023 to April 2024.
Hydrology 12 00141 g008
Table 1. Governing hydraulic engineered systems for Sparrovale Wetland.
Hydraulic SystemsControl StructuresDimensionElevation
(mAHD)
Horseshoe Bend Linear Wetland System
(Figure S3)
Pocket wetlandsn/a (×4)0.35
Sediment basins1517–2930 m2 −1.2 to −0.5
Outlet pooln/a−0.5
Overflow weir49.5 m long1.5
Twin chamber outfall pit with gates 2.48 m × 2.48 m × 2 m 1
Balog Channel
(Figures S1 and S2)
Inlet gate0.9 m × 0.6 m (×2)0.8
Outlet gate1.2 m0.1
Surcharge pit1.8 m × 1.2 m0.8
Trapezoidal channel1.5 km long, 1:3 side slope−0.5
Overflow banks1.5–15 m width 0.91 to 1.66
Warralily DIDR1 Wetland
(Figure S5)
Pocket wetlands n/a (×10)−0.5 to 0.65
Sediment basinn/a−0.5
Overflow bank200 m long1.3
Culvert outlet3.5 m long, 0.6 m × 0.45 m1.1
Fishway outlet18 m long, 1.65 m × 0.7 m0.98
Sparrovale Wetland (Figure S4)Outlet gate0.95 m × 0.75 m0.2
Table 2. Standard operating rules for the main control gates of the hydraulic systems (retrieved from [42]).
Control GatesTimingAction
Horseshoe Bend Linear Wetland outlets: twin chamber outfall and overflow weir (1)All YearOpen
Balog Channel inlet and outlet gates (2, 3)December–AprilOpen
May–NovemberClosed
Culvert and Fishway outlet gates (4, 5)December–AprilClosed
May–NovemberOpen
Sparrovale outlet gate (6)All YearClosed
Note: Gate numbers (1–6) correspond to mapped point locations in Figure 1.
Table 3. Weir parameter values for modeled hydraulic control structures in PCSWMM.
Hydraulic SystemsControl StructuresWeir ConfigurationsHeight (m)Length (m)Side Slope (m/m)Weir Coefficient (Cw, m3/s)
Horseshoe Bend Linear Wetland Overflow weirTrapezoidal0.3490.171.83
Twin chamber outfall pit with gatesTransverse0.50.625n/a1.83
Balog ChannelInlet gate (×2)Transverse0.60.9n/a1.83
Outlet gateTransverse1.21.515n/a1.83
Surcharge pitTransverse33n/a1.83
Overflow bank (×5)Transverse0.5–21.5–15n/a1.83
Warralily DIDR1
Wetland
Overflow bankTransverse1.5200n/a1.83
Culvert outletTransverse0.452n/a1.83
Fishway outletTransverse0.771.65n/a1.83
Sparrovale WetlandOutlet gateTransverse0.750.95n/a1.83
Table 4. Peak flow across hydraulic control structures.
Control StructuresDesign (m3/s)Model Result (m3/s)
Balog Channel0.8–11.3–1.8
Fishway10.6–1
Culvert0.6–11–1.3
Table 5. Water balance for May 2022–April 2023 and May 2023–April 2024.
ParametersMay 2022–
April 2023
May 2023–
April 2024
Total rainfall (mm)596425
Total catchment runoff (103 m3), Horseshoe Bend1095390
Total catchment runoff (103 m3), Armstrong Creek38471997
Total catchment runoff (103 m3)49422387
Total flow into Sparrovale (103 m3)27691666
Total flow into Baenschs Wetland (103 m3)2464885
Total outflow from Sparrovale outlet gate (103 m3)1214500
Total loss in Sparrovale through infiltration and ETA (103 m3)1191225
Disclaimer/Publisher’s Note: The statements, opinions and data contained in all publications are solely those of the individual author(s) and contributor(s) and not of MDPI and/or the editor(s). MDPI and/or the editor(s) disclaim responsibility for any injury to people or property resulting from any ideas, methods, instructions or products referred to in the content.

