

Microplastic Pollution in Tropical River: Fourier Transform Infrared Spectroscopy-Based Characterization of Abundance and Polymer Composition in Water and Sediments from Filobobos River, Mexico

 , , and
Abstract

1. Introduction
2. Materials and Methods
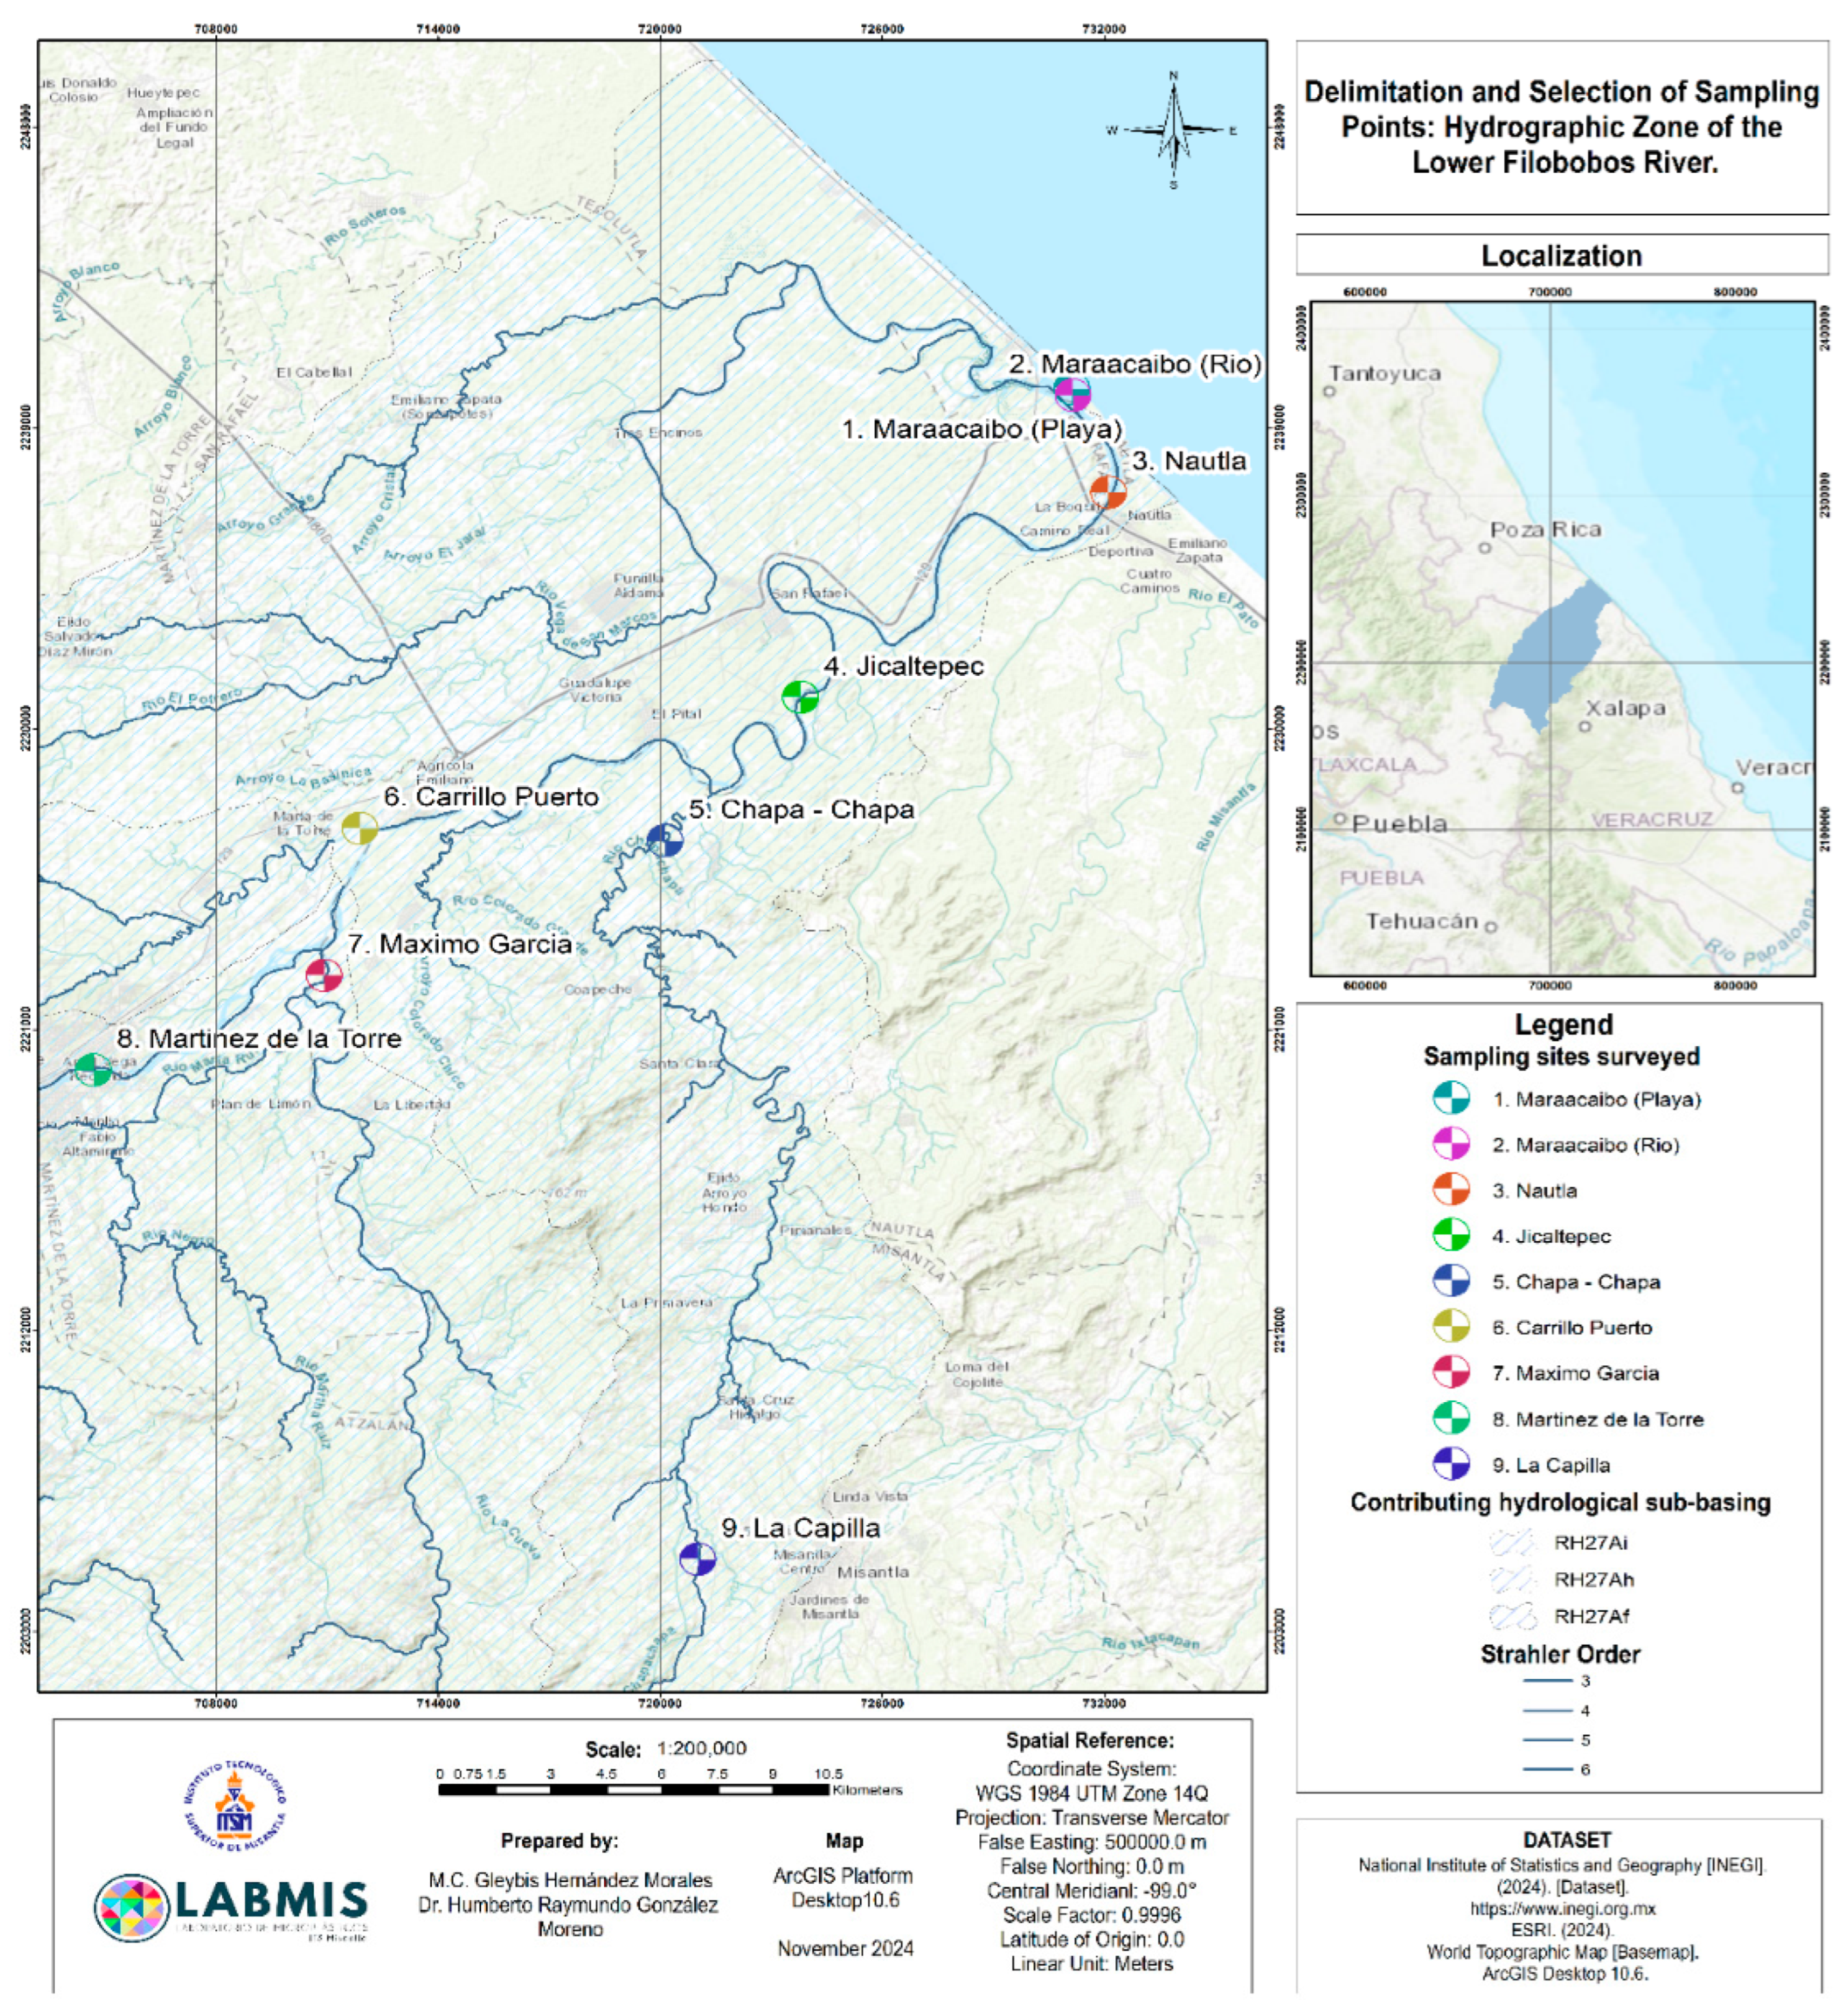
2.1. Study Area
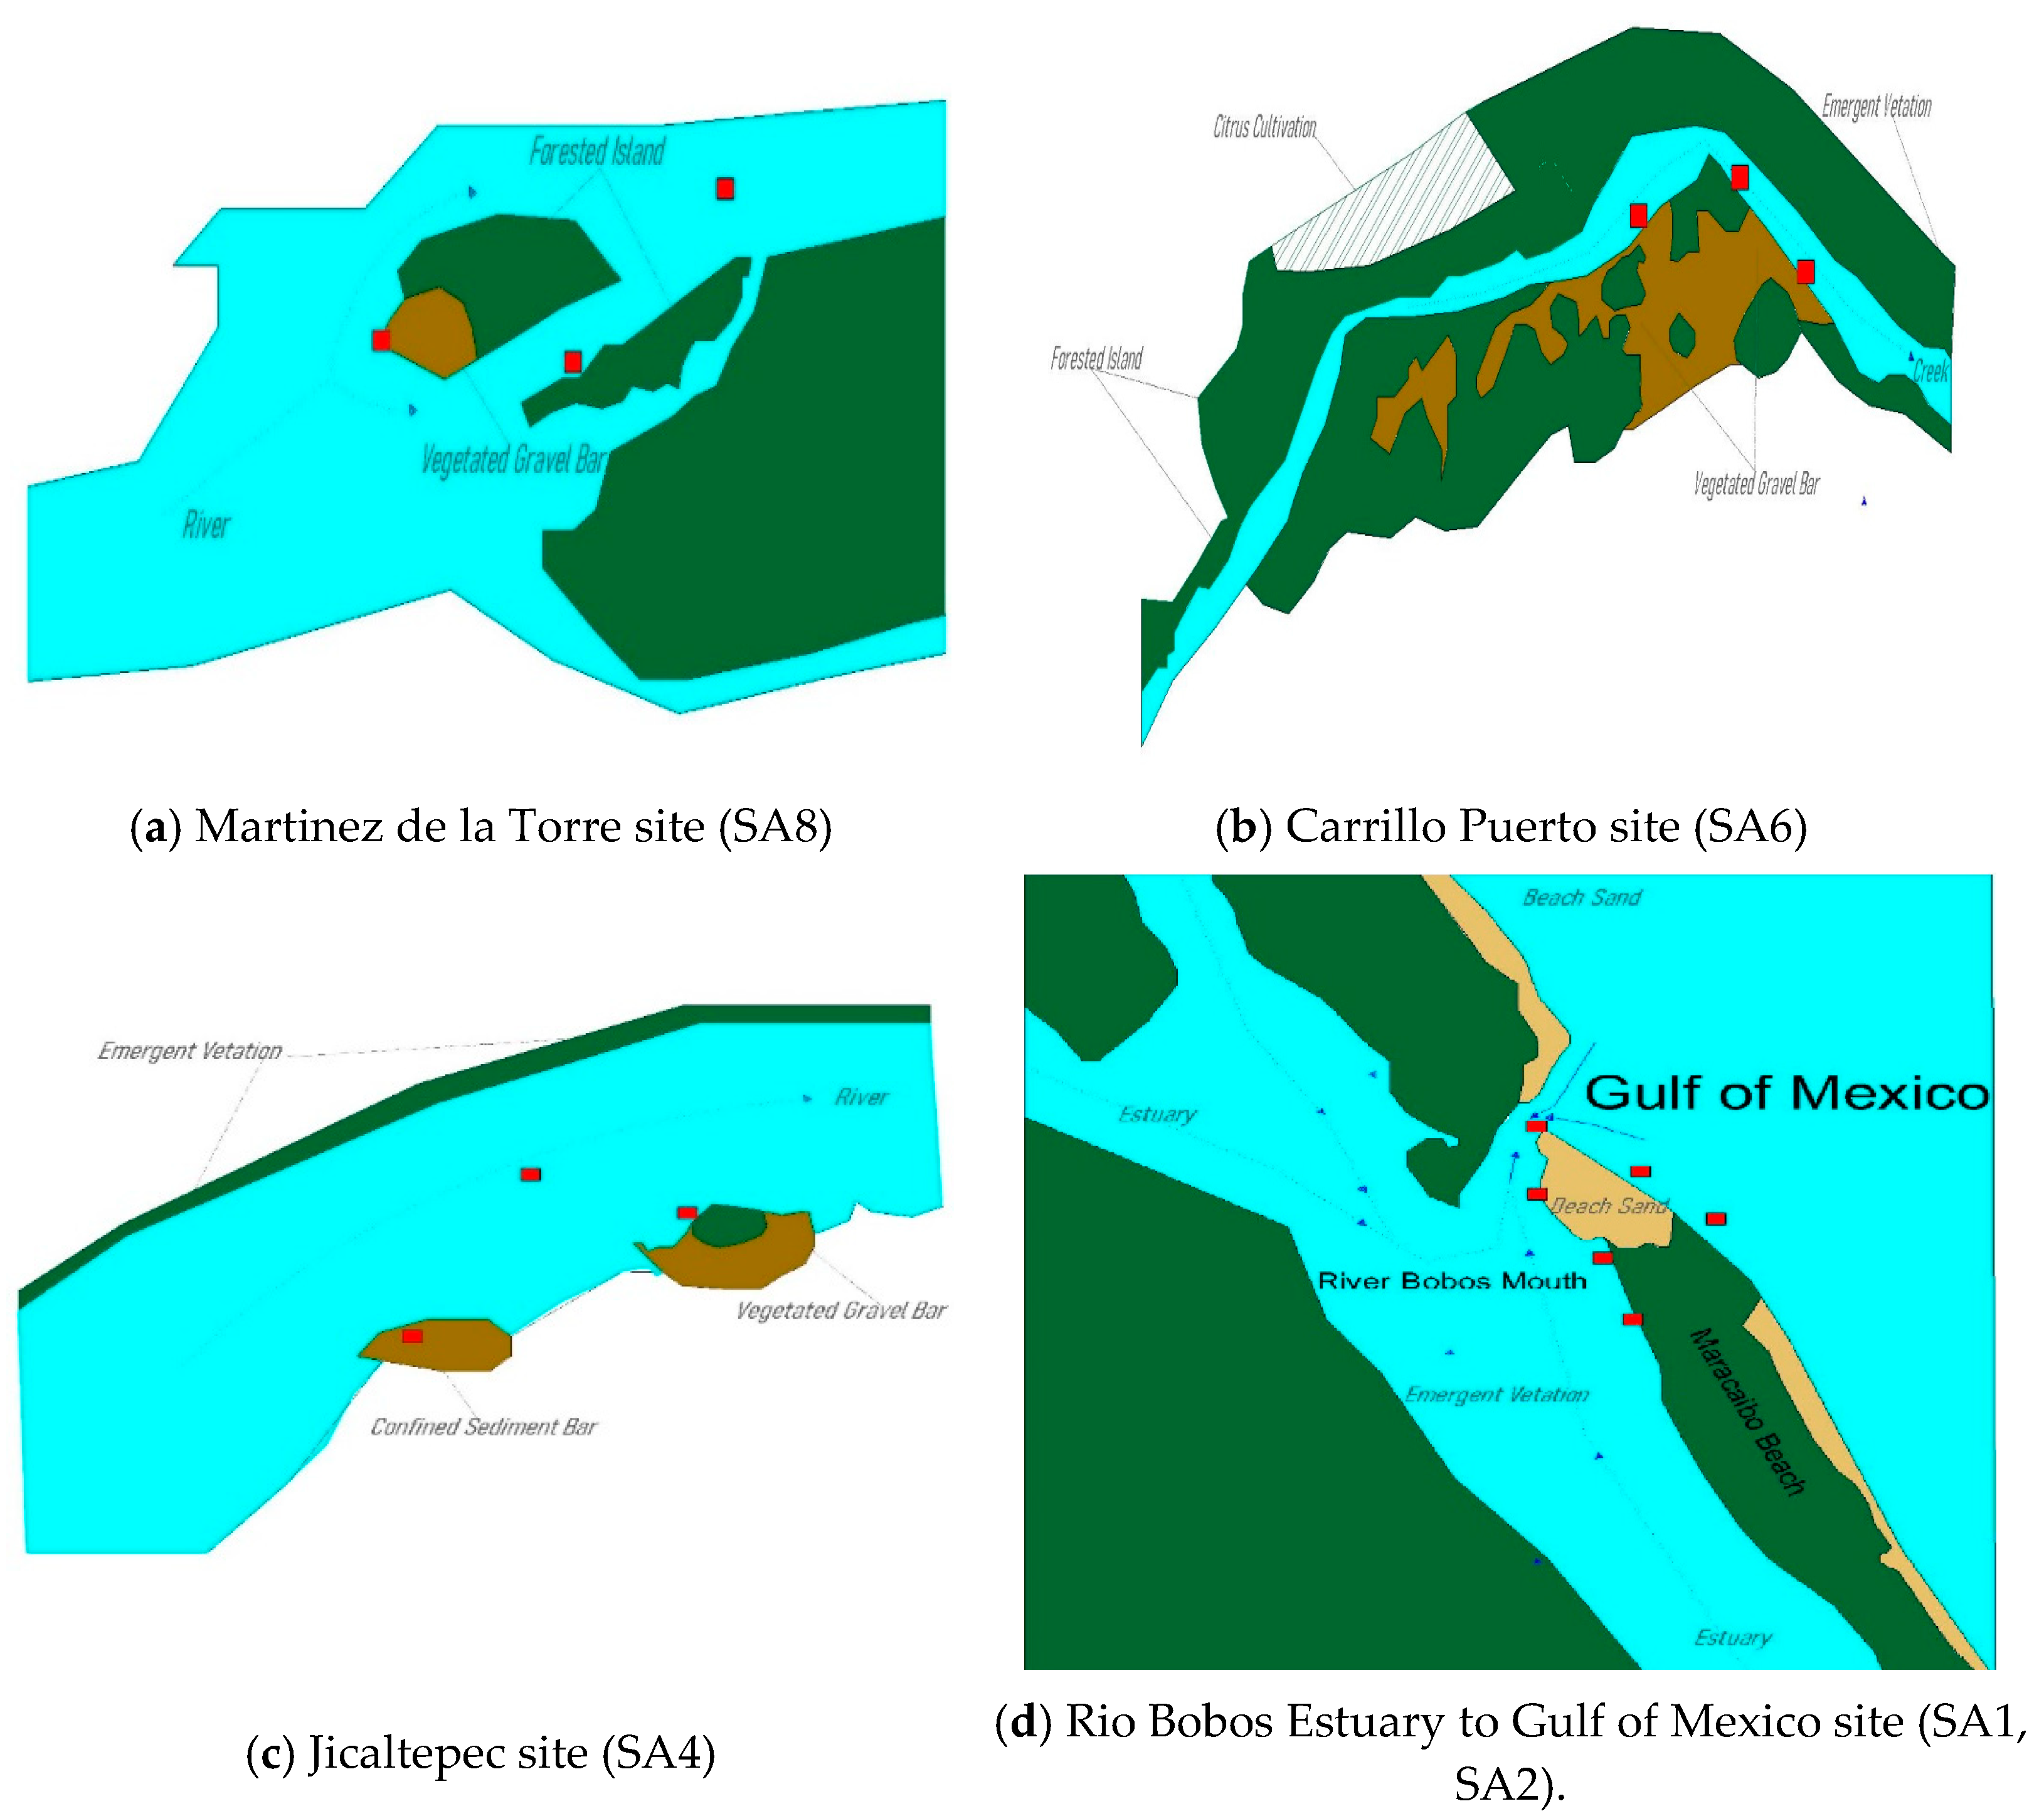
2.2. Sampling Areas
2.2.1. Water Sampling
2.2.2. Sediment Sampling
2.3. Sample Chemical Digestion
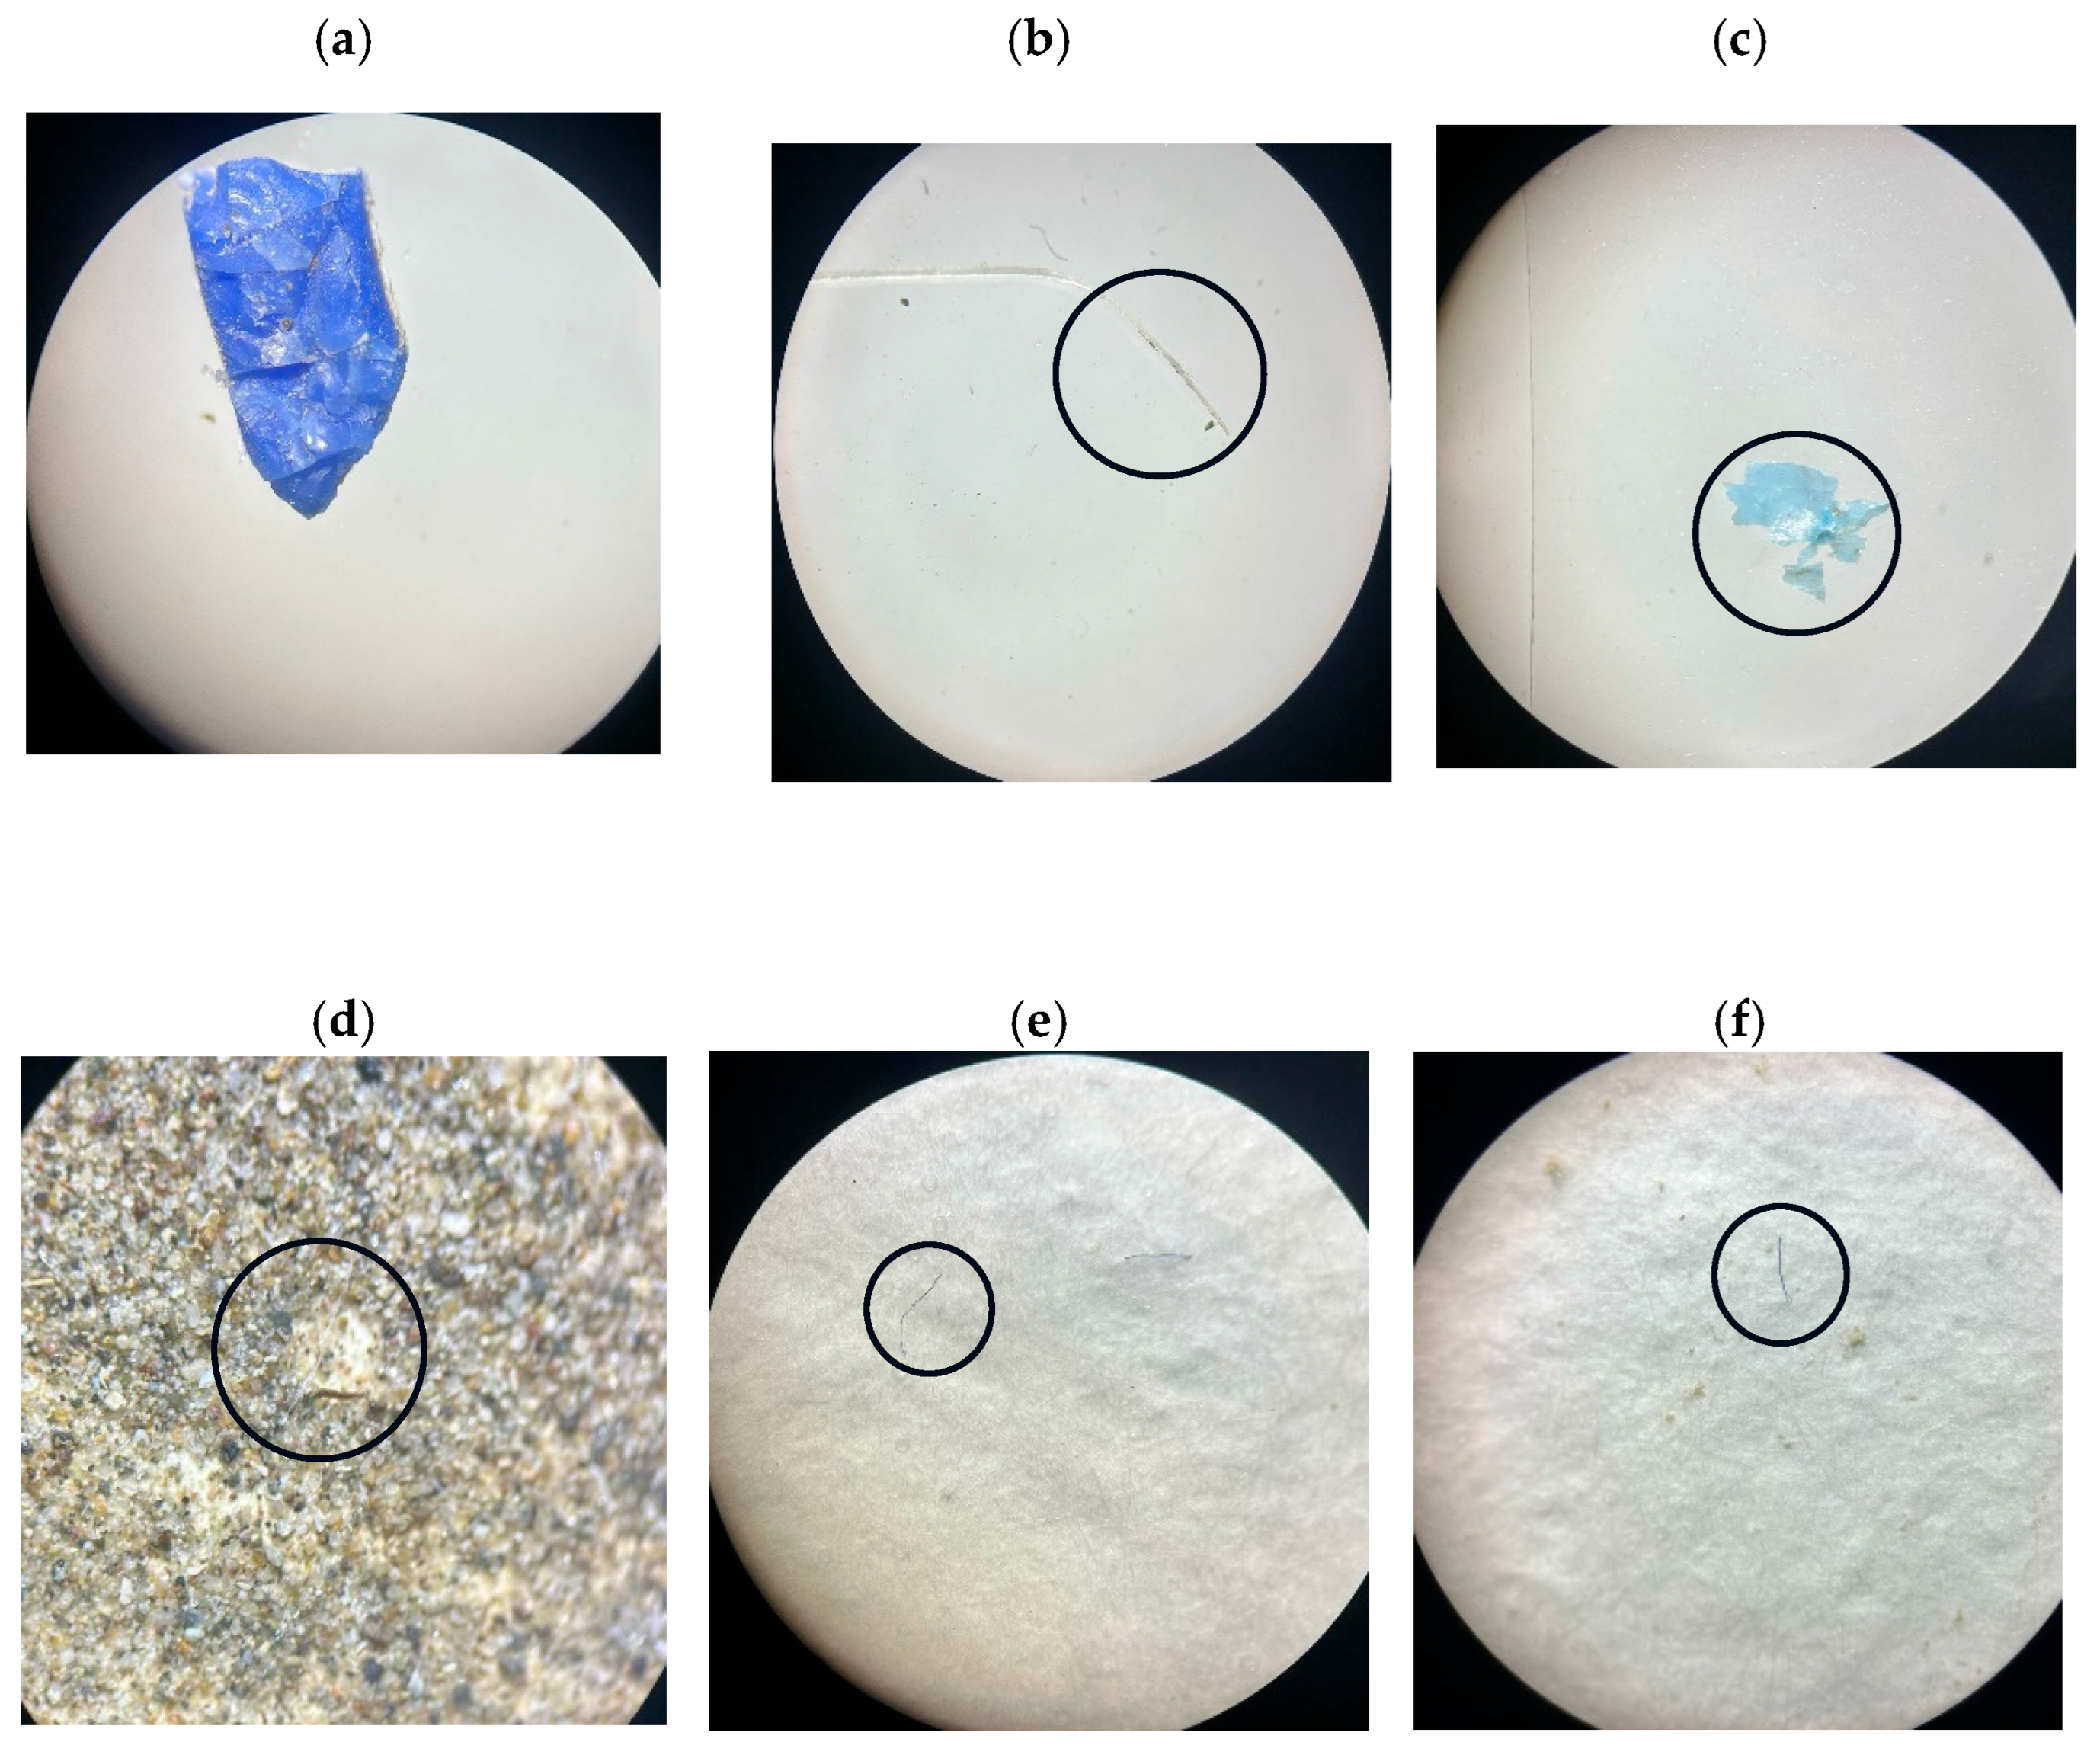
2.4. Extraction and Classification of MPs
3. Results
3.1. Water Physicochemical Parameters
3.1.1. Statistical Analysis
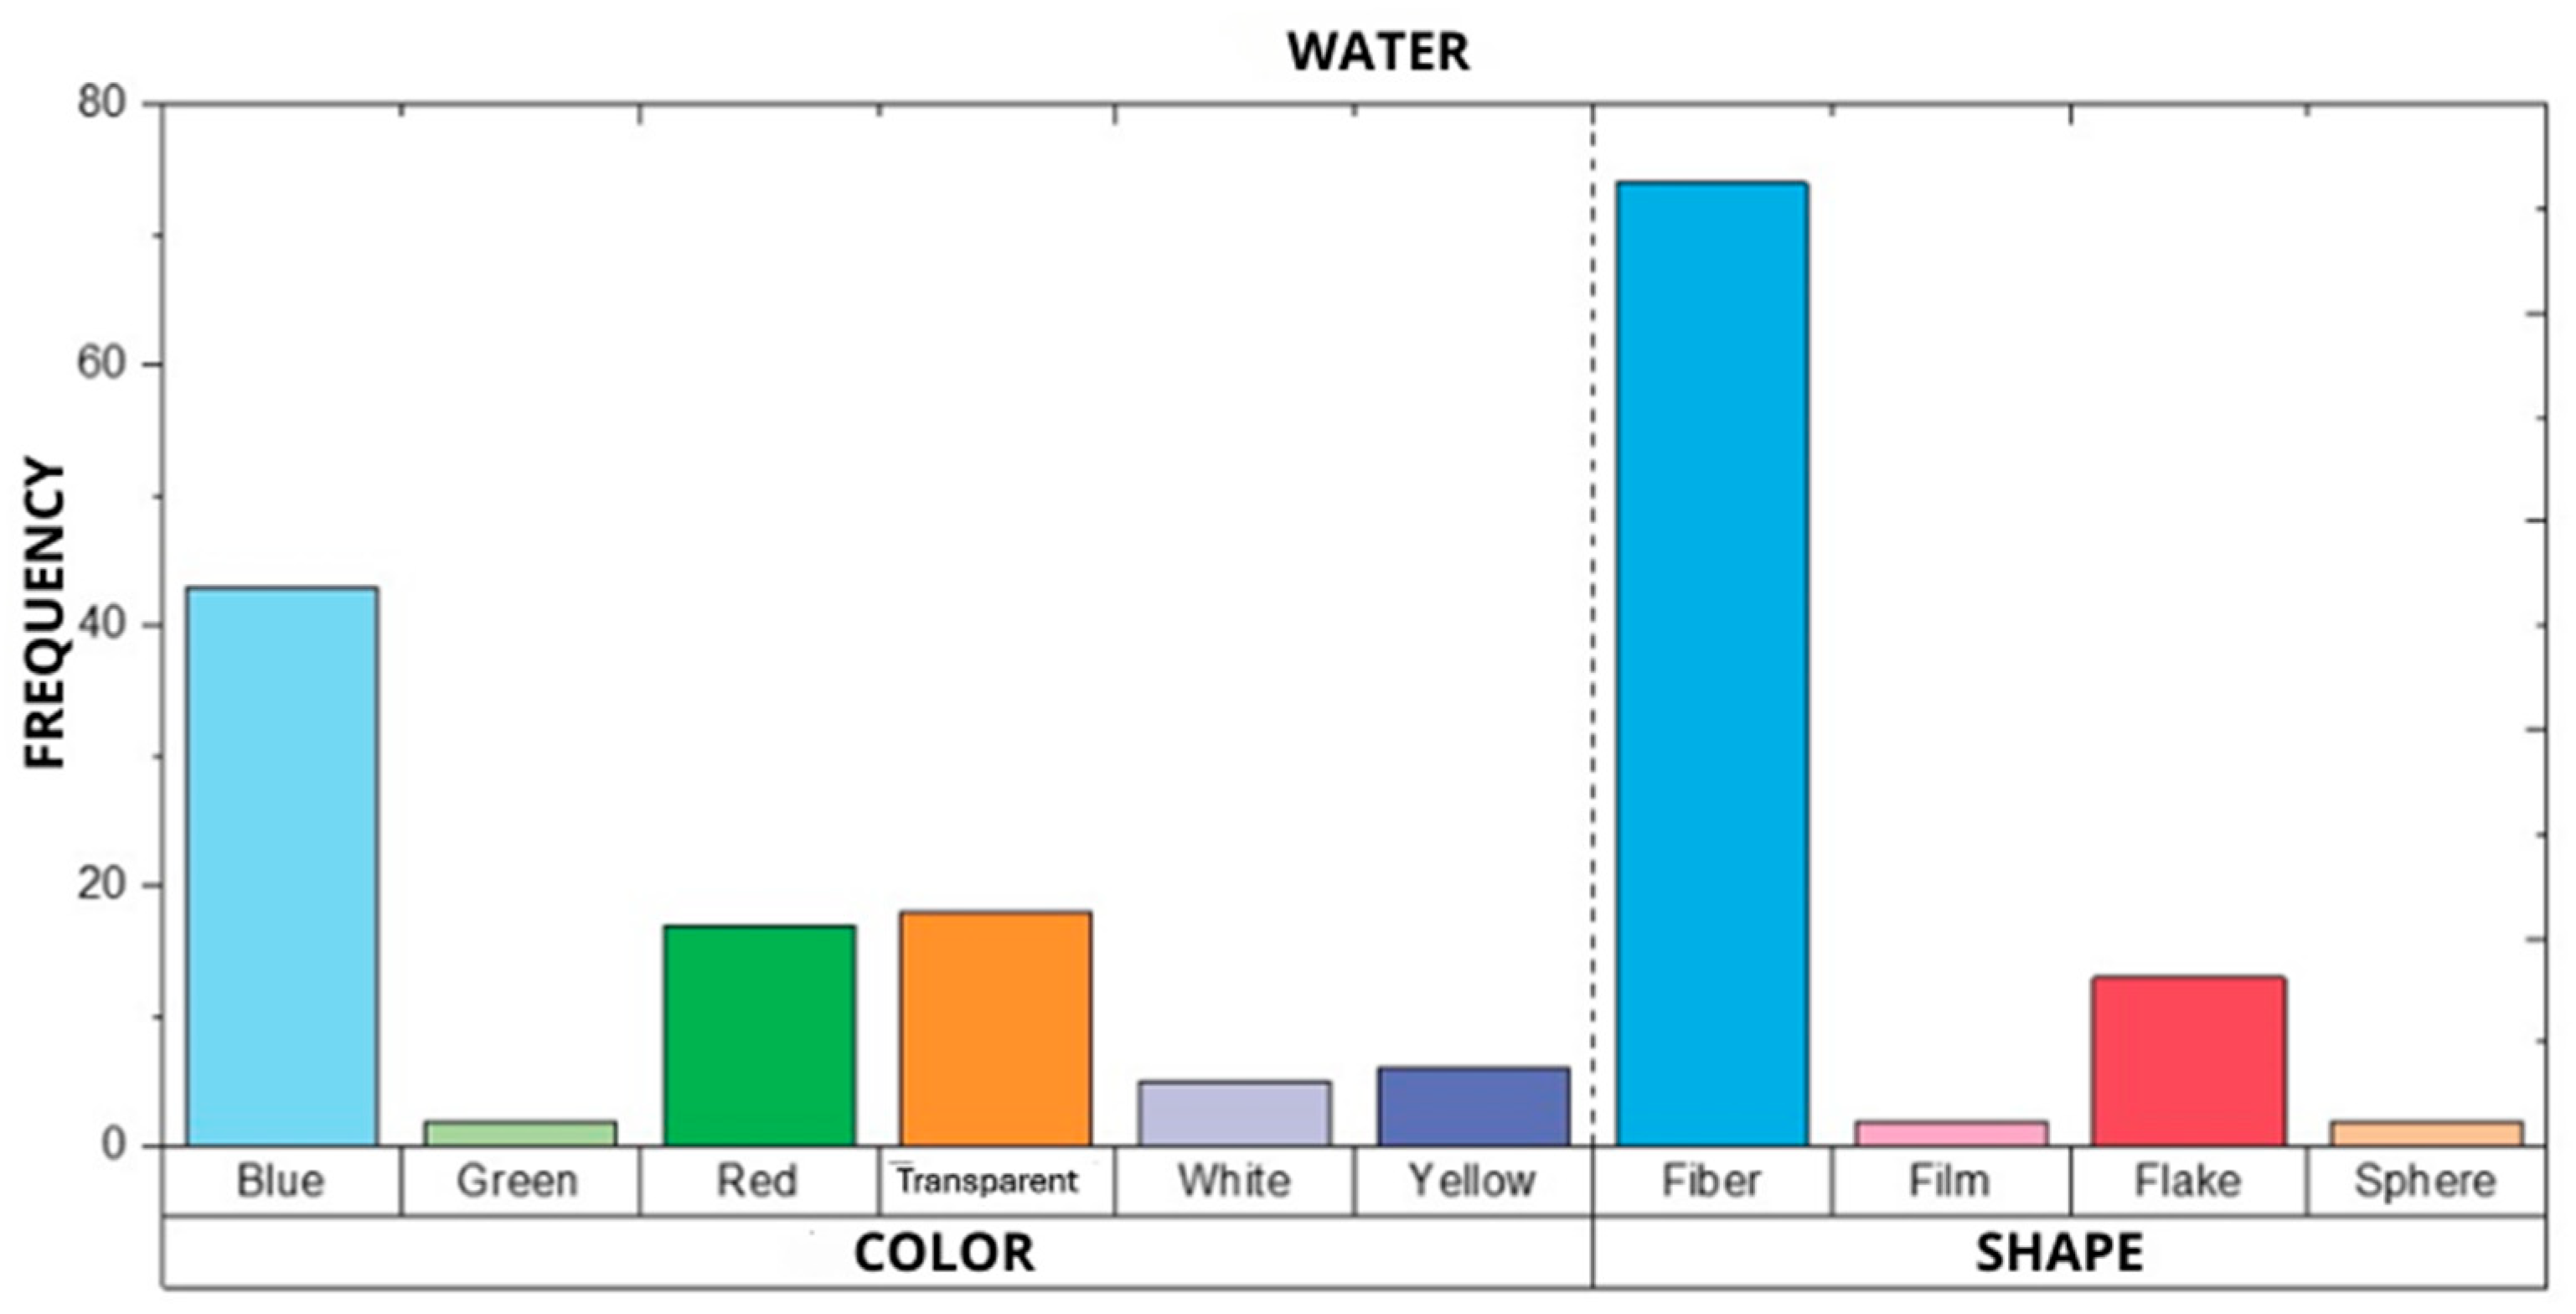
3.1.2. Microplastics (MPs) in Water Samples
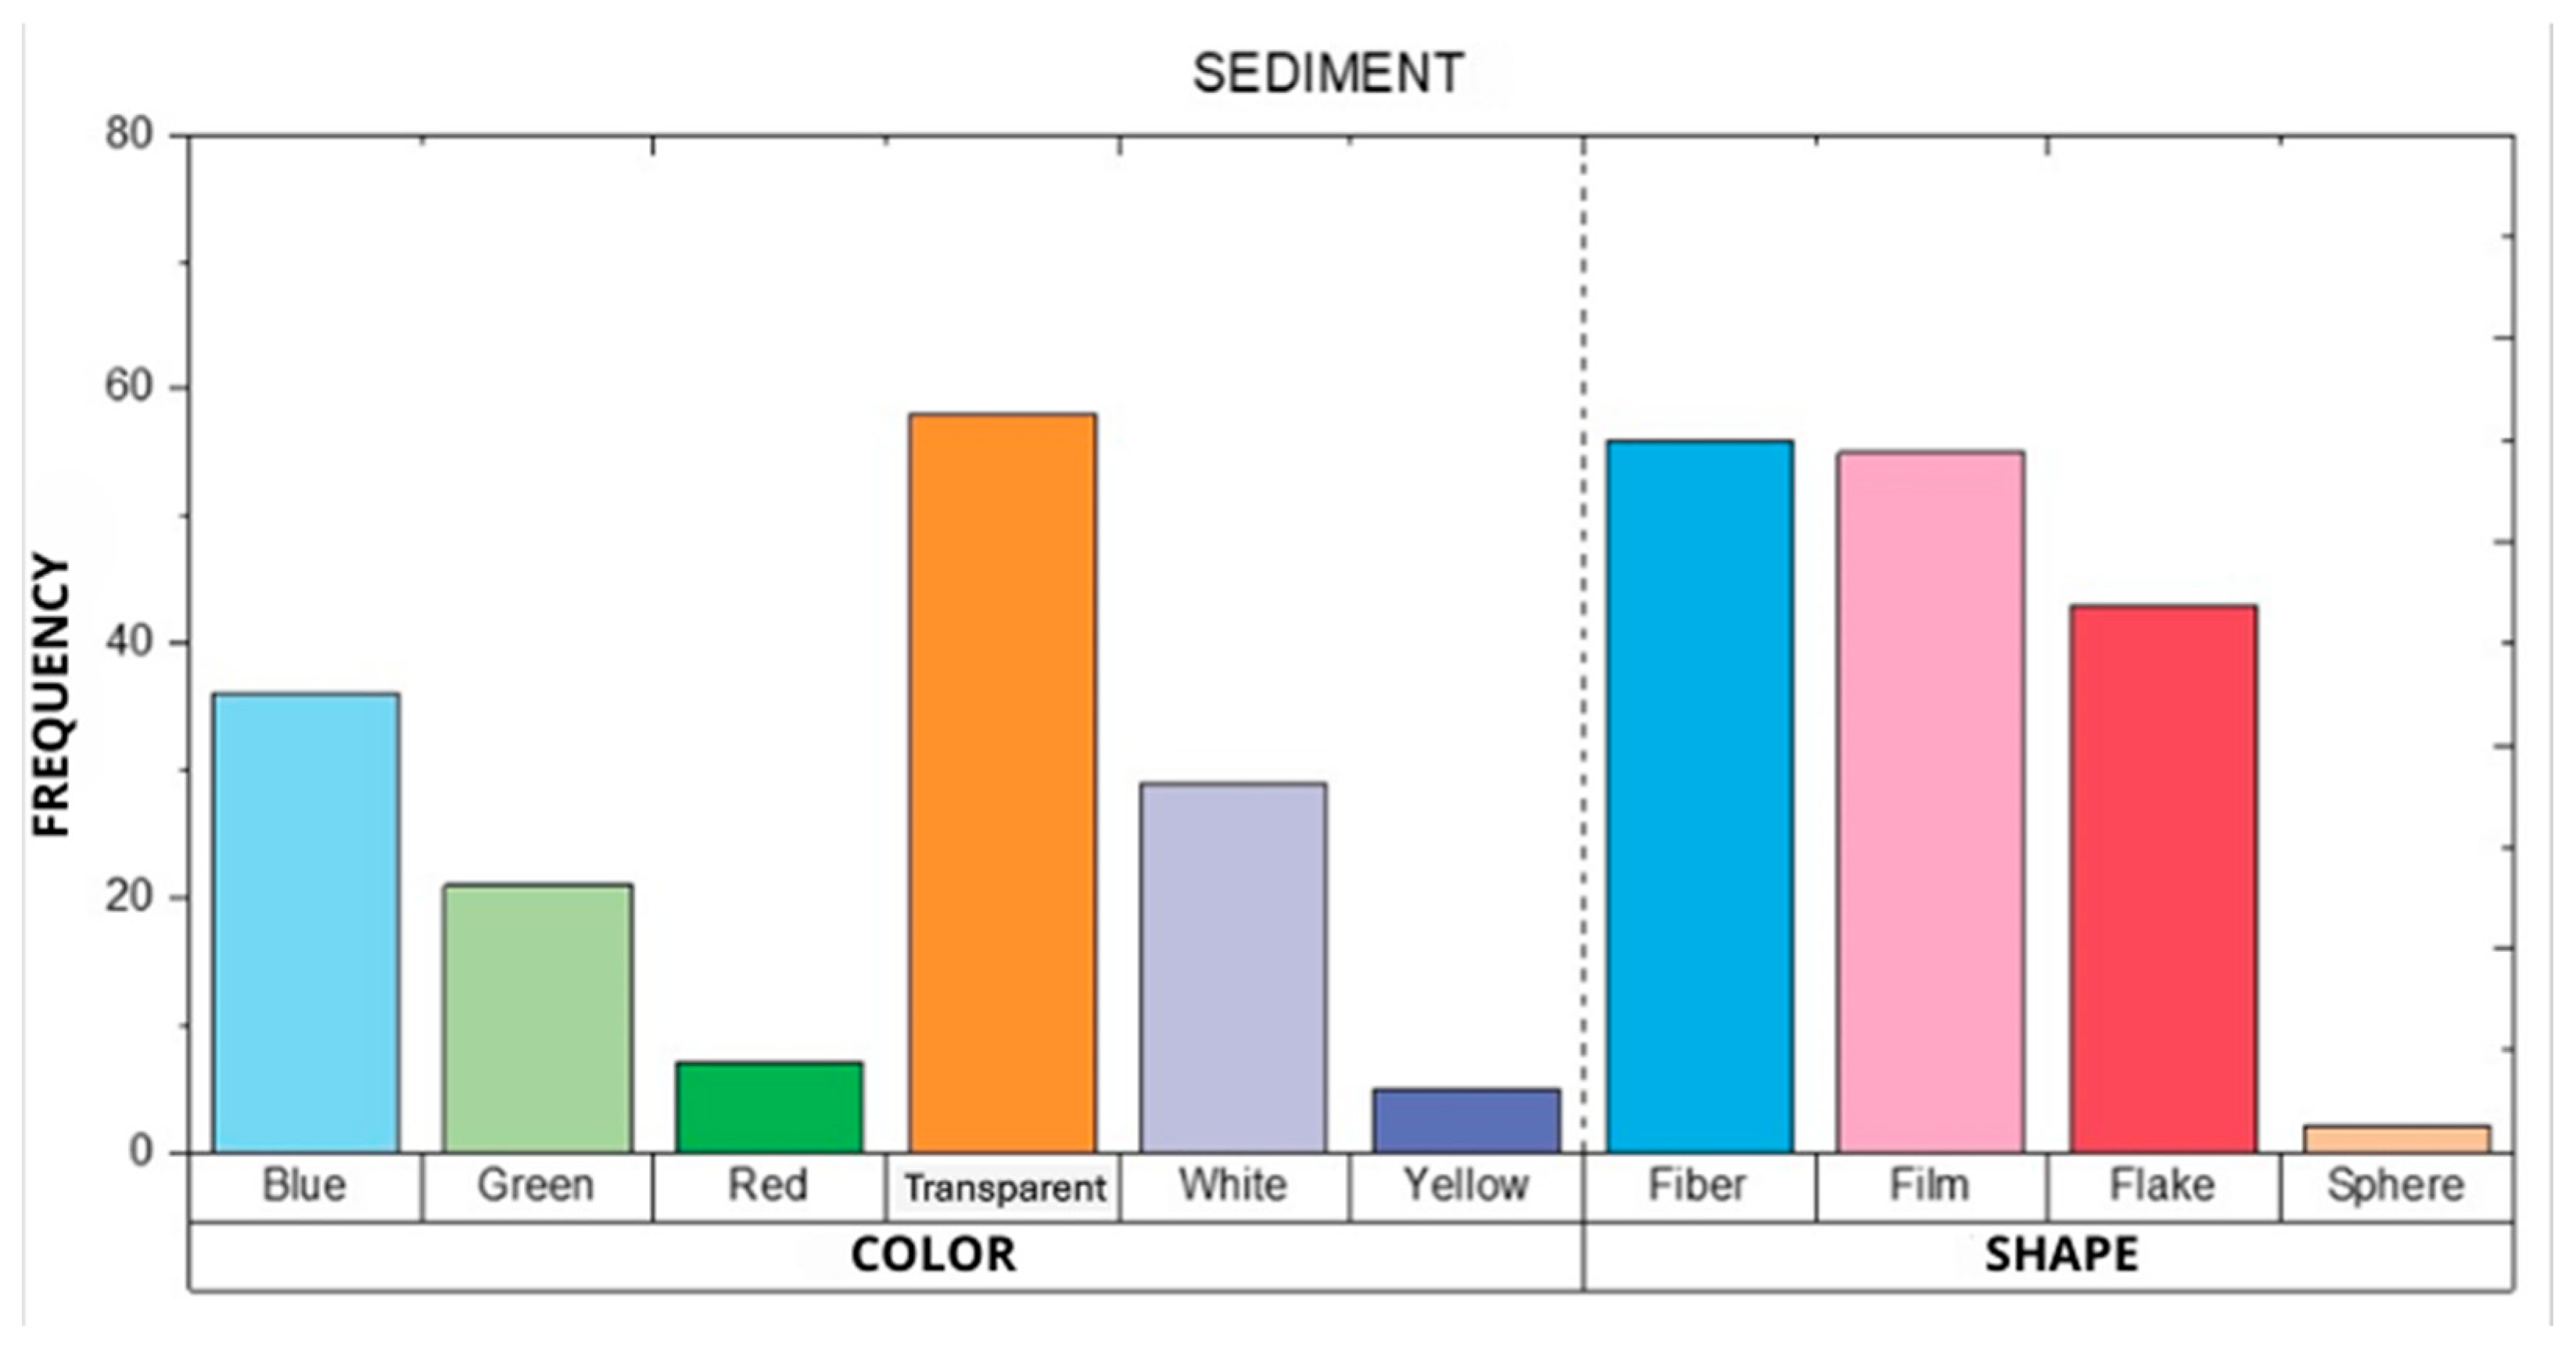
3.2. MPs in Sediment Samples
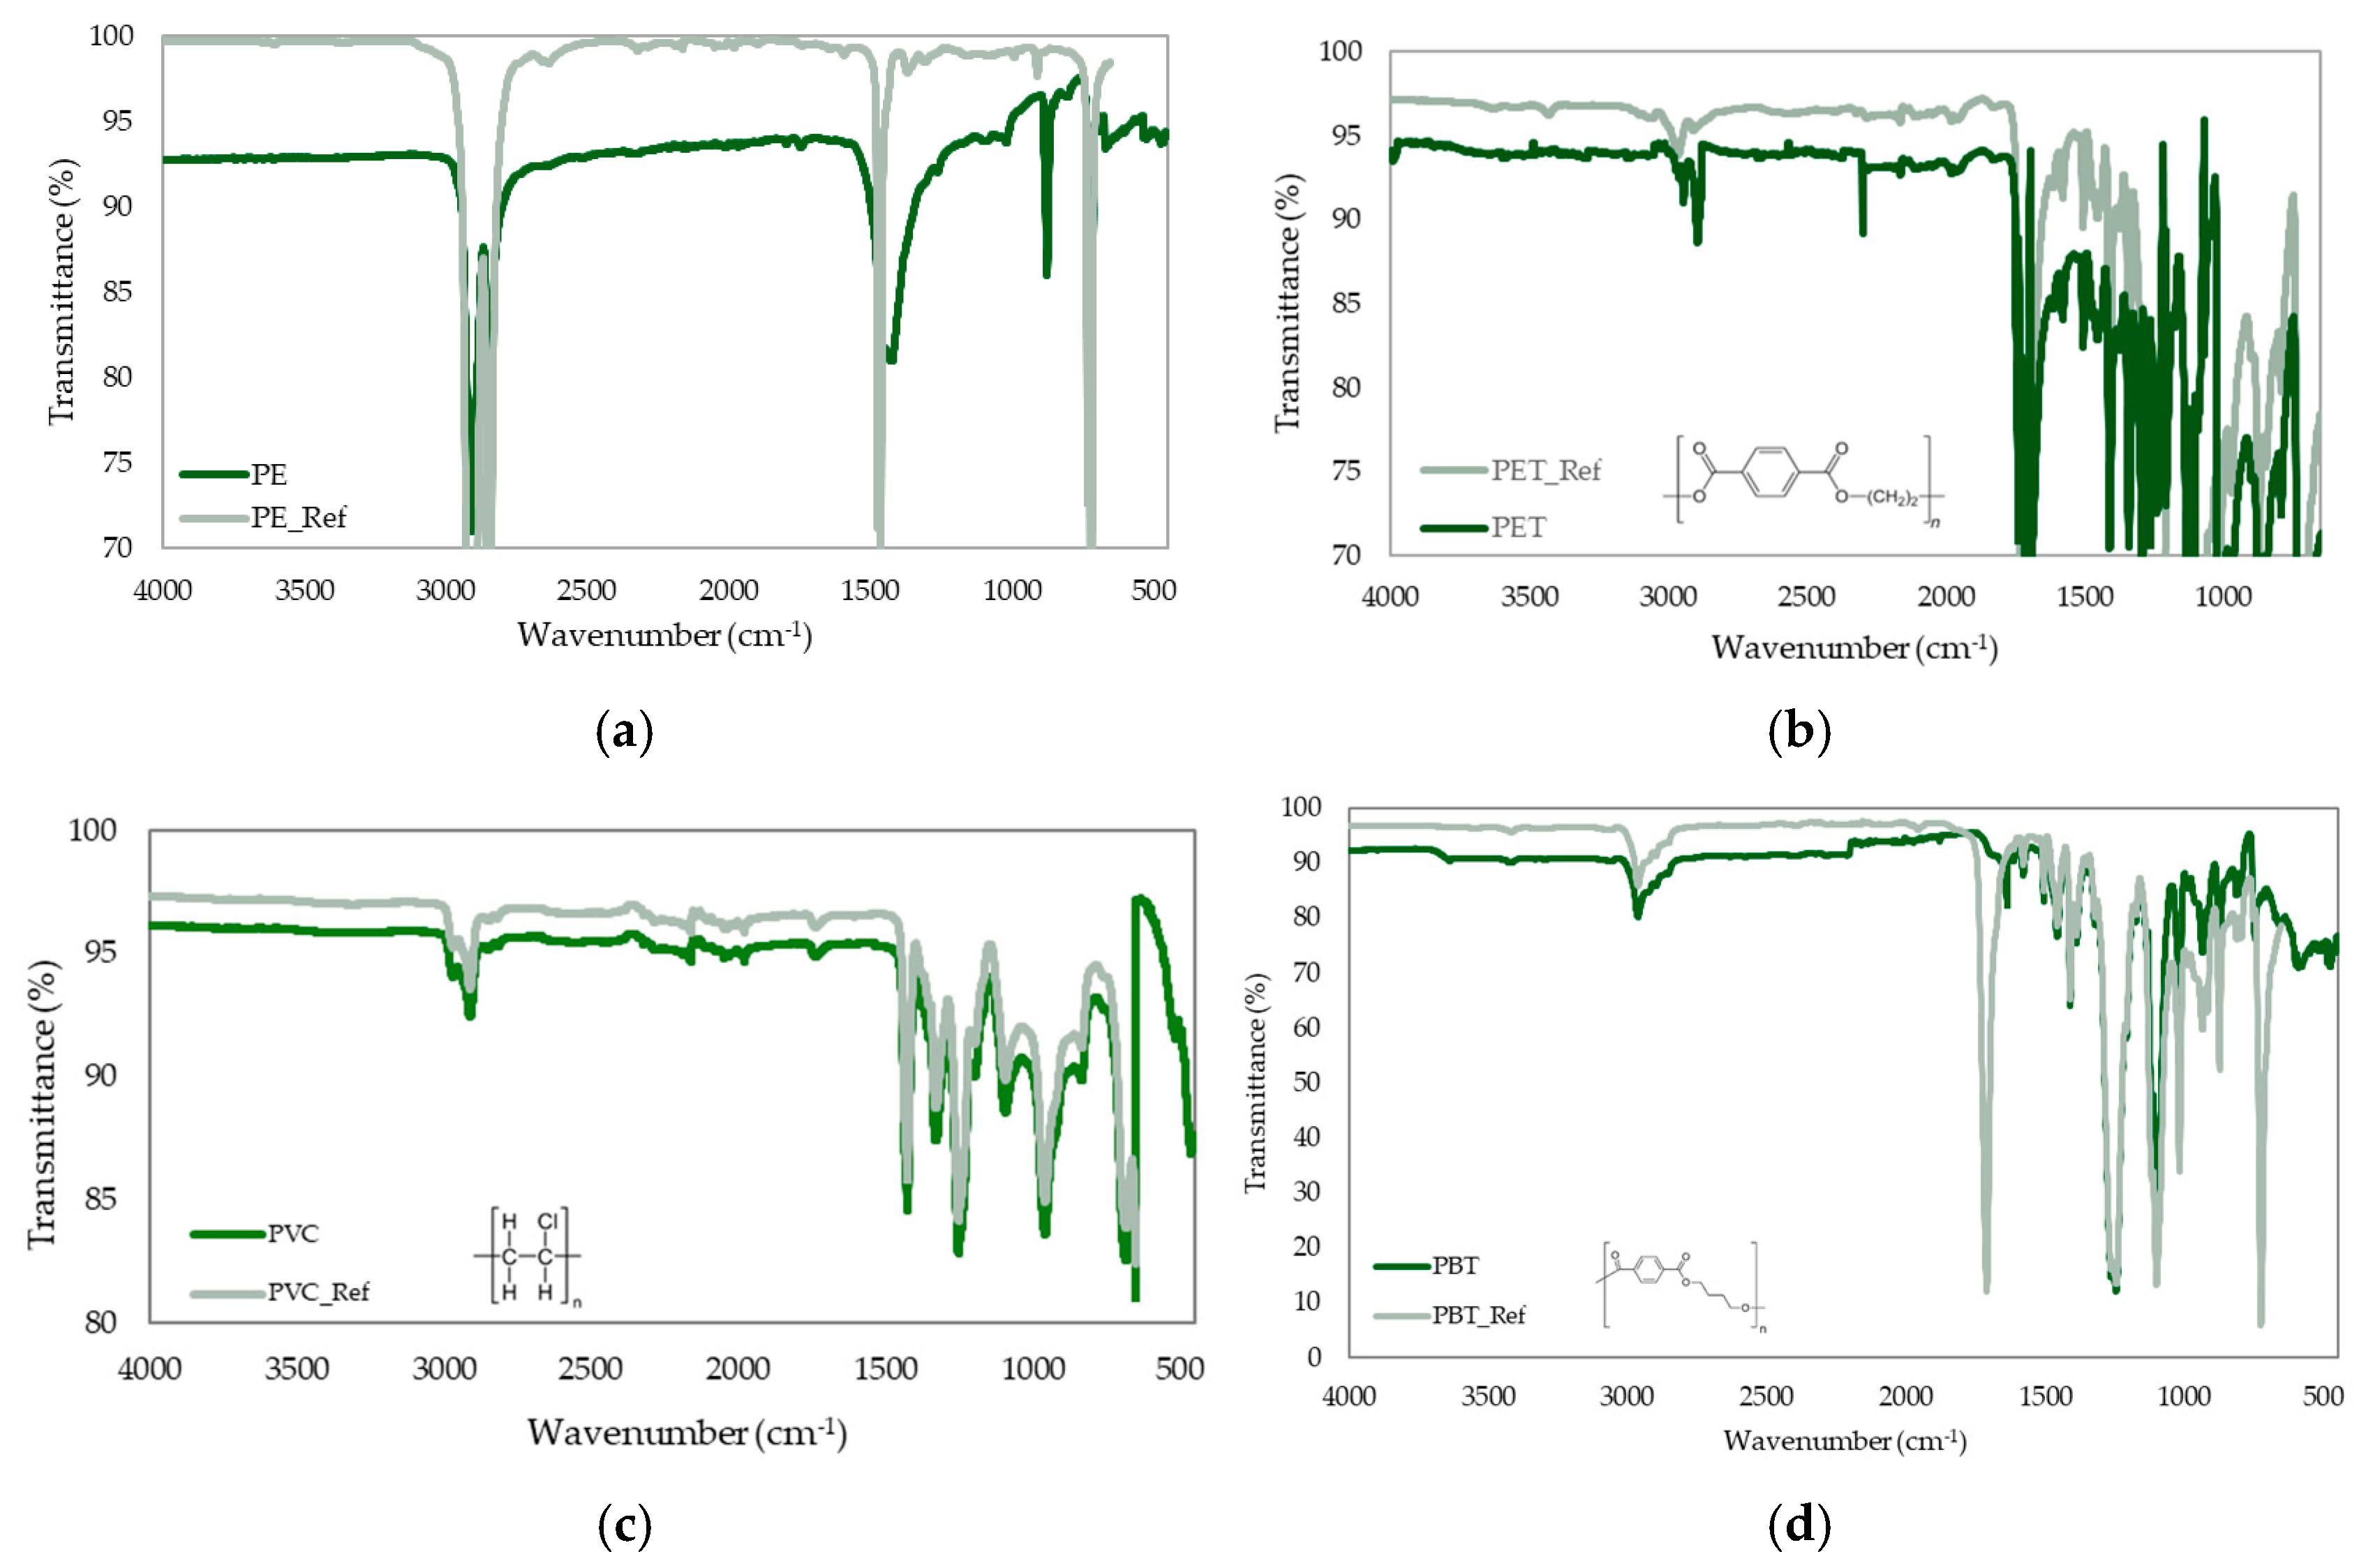
3.3. Chemical Identification of MP Types Present in Samples
4. Discussion
4.1. Hydrodynamics Influence on Microplastic Retention
4.2. Relationship Between Citrus Industry and Microplastic Contamination
5. Conclusions
Author Contributions
Funding
Data Availability Statement
Acknowledgments
Conflicts of Interest
References
- Li, C.; Zhu, L.; Wang, X.; Liu, K.; Li, D. Cross-Oceanic Distribution and Origin of Microplastics in the Subsurface Water of the South China Sea and Eastern Indian Ocean. Sci. Total Environ. 2022, 805, 150243. [Google Scholar] [CrossRef] [PubMed]
- Chen, Y.; Kumar, A.A.; Wei, F.; Tan, Q.; Li, J. Single-Use Plastics: Production, Usage, Disposal, and Adverse Impacts. Sci. Total Environ. 2021, 752, 141772. [Google Scholar] [CrossRef] [PubMed]
- Ncube, L.K.; Ude, A.U.; Ogunmuyiwa, E.N.; Zulkifli, R.; Beas, I.N. An Overview of Plastic Waste Generation and Management in Food Packaging Industries. Recycling 2021, 6, 12. [Google Scholar] [CrossRef]
- White, D.; Winchester, N. The Plastic Intensity of Industries in the USA: The Devil Wears Plastic. Environ. Model. Assess. 2022, 28, 15–28. [Google Scholar] [CrossRef]
- Shekh, M.R.; Kumar, V. Impact of Plastic Pollution on Ecosystems: A Review of Adverse Effects and Sustainable Solutions. Environ. Monit. Assess. 2025, 197, 264. [Google Scholar] [CrossRef]
- Jong, M.-C.; Tong, X.; Li, J.; Xu, Z.; Chng, S.H.Q.; He, Y.; Gin, K.Y.-H. Microplastics in Equatorial Coasts: Pollution Hotspots and Spatiotemporal Variations Associated with Tropical Monsoons. J. Hazard. Mater. 2022, 424, 127626. [Google Scholar] [CrossRef]
- Caroline, B.; Soroldoni, S.; Kessler, F.; Fernandes, A.; Pinho, G. Could a Future Ocean Acidification Scenario Influence the Photodegradation of Microplastics? SSRN Electron. J. 2022, 42. [Google Scholar] [CrossRef]
- Christensen, N.D.; Wisinger, C.E.; Maynard, L.A.; Chauhan, N.; Czuba, J.A.; Schubert, T.; Barone, J.R. Transport and Characterization of Microplastics in Inland Waterways. J. Water Process Eng. 2020, 38, 101640. [Google Scholar] [CrossRef]
- Narwal, N.; Katyal, D. The Abundance and Analytical Characterization of Microplastics in the Surface Water of Haryana, India. Microsc. Res. Tech. 2024, 88, 139–153. [Google Scholar] [CrossRef]
- Ponis, S.T.; Plakas, G.; Aretoulaki, E.; Tzanetou, D. LoRaWAN for Tracking Inland Routes of Plastic Waste: Introducing the Smart TRACKPLAST Bottle. Clean. Waste Syst. 2022, 4, 100068. [Google Scholar] [CrossRef]
- Sánchez-Campos, M.; Ponce-Vélez, G.; Sanvicente-Añorve, L.; Alatorre-Mendieta, M. Microplastic Contamination in Three Environmental Compartments of a Coastal Lagoon in the Southern Gulf of Mexico. Environ. Monit. Assess. 2024, 196, 1012. [Google Scholar] [CrossRef] [PubMed]
- Belioka, M.-P.; Achilias, D.S. The Effect of Weathering Conditions in Combination with Natural Phenomena/Disasters on Microplastics’ Transport from Aquatic Environments to Agricultural Soils. Microplastics 2024, 3, 518–538. [Google Scholar] [CrossRef]
- Chen, H.; Wang, T.; Ding, Y.; Yuan, F.; Zhang, H.; Wang, C.; Wang, Y.; Wang, Y.; Song, Y.; Fu, G.; et al. A Catchment-Wide Microplastic Pollution Investigation of the Yangtze River: The Pollution and Ecological Risk of Tributaries Are Non-Negligible. J. Hazard. Mater. 2024, 466, 133544. [Google Scholar] [CrossRef]
- Ruíz-Reyes, C.I.; Lango-Reynoso, F.; Castañeda-Chávez, M.d.R.; Moran-Silva, A. Microplastics on Beaches in the Nautla-Vega de Alatorre Turtle Nesting Area, Veracruz. Microplastics 2023, 2, 230–241. [Google Scholar] [CrossRef]
- Gobierno del Estado de Veracruz Diagnóstico Cuenca del Río Nautla. Available online: https://www.researchgate.net/publication/339106188_Diagnostico_para_la_planeacion_y_el_manejo_integral_de_los_recursos_El_caso_de_la_Cuenca_del_Rio_Nautla (accessed on 10 February 2025).
- Sandoval Herazo, L.C.; González-Moreno, H.R.; Carreto-Hernandez, L.G.; Zurita, F.; Nani, G.; Zamora, S.; Sandoval-Herazo, M.; Martínez-Reséndiz, G. Impact of the Citrus Industry on the Water Quality of the Filobobos River in Veracruz, Mexico. Sustainability 2024, 16, 1536. [Google Scholar] [CrossRef]
- American Water Works Association. Standard Methods for Examination of Water and Wastewater; American Public Health Association; Water Pollution Control Federation: Washington, DC, USA, 1995. [Google Scholar]
- Gobierno de México Norma Mexicana NMX-AA-030/1-SCFI-2012;Análisis de Agua—Medición de La Demanda Química de Oxígeno En Aguas Naturales, Residuales y Residuales Tratadas. Available online: https://www.gob.mx/cms/uploads/attachment/file/166774/NMX-AA-030-1-SCFI-2012.pdf?utm_source=chatgpt.com (accessed on 5 March 2025).
- Diario Oficial de la Federación Secretaría de Medio Ambiente y Recursos Naturales (SEMARNAT). Norma Oficial Mexicana NOM-001-SEMARNAT-2021. Available online: https://www.dof.gob.mx/nota_detalle_popup.php?codigo=5645374 (accessed on 5 March 2025).
- Prambudy, H.; Supriyatin, T.; Setiawan, F. The Testing of Chemical Oxygen Demand (COD) and Biological Oxygen Demand (BOD) of River Water in Cipager Cirebon. J. Phys. Conf. Ser. 2019, 1360, 012010. [Google Scholar] [CrossRef]
- Tirkey, A.; Upadhyay, L.S.B. Microplastics: An Overview on Separation, Identification and Characterization of Microplastics. Mar. Pollut. Bull. 2021, 170, 112604. [Google Scholar] [CrossRef]
- Yang, L.; Zhang, Y.; Kang, S.; Wang, Z.; Wu, C. Microplastics in Soil: A Review on Methods, Occurrence, Sources, and Potential Risk. Sci. Total Environ. 2021, 780, 146546. [Google Scholar] [CrossRef]
- de Carvalho, A.R.; Van-Craynest, C.; Riem-Galliano, L.; Ter Halle, A.; Cucherousset, J. Protocol for Microplastic Pollution Monitoring in Freshwater Ecosystems: Towards a High-Throughput Sample Processing—MICROPLASTREAM. MethodsX 2021, 8, 101396. [Google Scholar] [CrossRef]
- Al-Azzawi, M.S.M.; Kefer, S.; Weißer, J.; Reichel, J.; Schwaller, C.; Glas, K.; Knoop, O.; Drewes, J.E. Validation of Sample Preparation Methods for Microplastic Analysis in Wastewater Matrices—Reproducibility and Standardization. Water 2020, 12, 2445. [Google Scholar] [CrossRef]
- Crawford, C.B.; Quinn, B. Microplastic Pollutants; Elsevier Science: Amsterdam, The Netherlands, 2017. [Google Scholar]
- Dioses-Salinas, D.C.; Pizarro-Ortega, C.I.; De-la-Torre, G.E. A Methodological Approach of the Current Literature on Microplastic Contamination in Terrestrial Environments: Current Knowledge and Baseline Considerations. Sci. Total Environ. 2020, 730, 139164. [Google Scholar] [CrossRef] [PubMed]
- Radford, F.; Zapata-Restrepo, L.M.; Horton, A.A.; Hudson, M.D.; Shaw, P.J.; Williams, I.D. Developing a Systematic Method for Extraction of Microplastics in Soils. Anal. Methods 2021, 13, 1695–1705. [Google Scholar] [CrossRef] [PubMed]
- Zhi, W.; Feng, D.; Tsai, W.-P.; Sterle, G.; Harpold, A.; Shen, C.; Li, L. From Hydrometeorology to River Water Quality: Can a Deep Learning Model Predict Dissolved Oxygen at the Continental Scale? Environ. Sci. Technol. 2021, 55, 2357–2368. [Google Scholar] [CrossRef]
- Zhao, N.; Fan, Z.; Zhao, M. A New Approach for Estimating Dissolved Oxygen Based on a High-Accuracy Surface Modeling Method. Sensors 2021, 21, 3954. [Google Scholar] [CrossRef]
- Zhi, W.; Ouyang, W.; Shen, C.; Li, L. Temperature Outweighs Light and Flow as the Predominant Driver of Dissolved Oxygen in US Rivers. Nat. Water 2023, 1, 249–260. [Google Scholar] [CrossRef]
- Zhao, W.; Jiang, J.; Liu, M.; Tu, T.; Wang, L.; Zhang, S. Exploring Correlations Between Microplastics, Microorganisms, and Water Quality in an Urban Drinking Water Source. Ecotoxicol. Environ. Saf. 2024, 275, 116249. [Google Scholar] [CrossRef]
- Lemessa, F.; Simane, B.; Seyoum, A.; Gebresenbet, G. Assessment of the Impact of Industrial Wastewater on the Water Quality of Rivers Around the Bole Lemi Industrial Park (BLIP), Ethiopia. Sustainability 2023, 15, 4290. [Google Scholar] [CrossRef]
- Mondal, I.; Bandyopadhyay, J.; Paul, A.K. Water Quality Modeling for Seasonal Fluctuation of Ichamati River, West Bengal, India. Model. Earth Syst. Environ. 2016, 2, 113. [Google Scholar] [CrossRef]
- Isaac, R.; Siddiqui, S. Application of Water Quality Index and Multivariate Statistical Techniques for Assessment of Water Quality Around Yamuna River in Agra Region, Uttar Pradesh, India. Water Supply 2022, 22, 3399–3418. [Google Scholar] [CrossRef]
- Bhaduri, R.N.; Sinha, S.; Guererro, A.M.; Jackson, S.L.; Alemán, E.A.; Chatterjee, S. Microplastic Contamination and Environmental Risks in the Beas River, Western Himalayas. Environ. Pollut. 2025, 365, 125387. [Google Scholar] [CrossRef]
- Huang, D.; Li, X.; Ouyang, Z.; Zhao, X.; Wu, R.; Zhang, C.; Lin, C.; Li, Y.; Guo, X. The Occurrence and Abundance of Microplastics in Surface Water and Sediment of the West River Downstream, in the South of China. Sci. Total Environ. 2021, 756, 143857. [Google Scholar] [CrossRef] [PubMed]
- Arnon, S. Making Waves: Unraveling Microplastic Deposition in Rivers Through the Lens of Sedimentary Processes. Water Res. 2025, 272, 122934. [Google Scholar] [CrossRef] [PubMed]
- Möller, J.N.; Löder, M.G.J.; Laforsch, C. Finding Microplastics in Soils: A Review of Analytical Methods. Environ. Sci. Technol. 2020, 54, 2078–2090. [Google Scholar] [CrossRef] [PubMed]
- Comision Nacional del Agua (Conagua). Banco Nacional de Datos de Aguas Superficiales (BANDAS). Available online: https://www.imta.gob.mx/media/iframes/bandas.html (accessed on 9 February 2025).
- Servicio Meteorológico Nacional (SMN-CONAGUA). Reportes Climáticos. Available online: https://smn.conagua.gob.mx/es/climatologia/diagnostico-climatico/reporte-del-clima-en-mexico (accessed on 9 February 2025).
- Jacobs, S.R.; Breuer, L.; Butterbach-Bahl, K.; Pelster, D.E.; Rufino, M.C. Land Use Affects Total Dissolved Nitrogen and Nitrate Concentrations in Tropical Montane Streams in Kenya. Sci. Total Environ. 2017, 603–604, 519–532. [Google Scholar] [CrossRef]
- Suhaimi Sulaiman, M.; Abd Rahman, M.F.; Mohd Adam, A.F. Variance of Total Dissolved Solids and Electrical Conductivity for Water Quality in Sabak Bernam. Int. J. Electr. Comput. Eng. (IJECE) 2023, 13, 2259. [Google Scholar] [CrossRef]
- Mejía-Estrella, I.A.; Peña-Montes, C.; Peralta-Peláez, L.A.; Del Real Olvera, J.; Sulbarán-Rangel, B. Microplastics in Sandy Beaches of Puerto Vallarta in the Pacific Coast of Mexico. Sustainability 2023, 15, 15259. [Google Scholar] [CrossRef]
- Rebelein, A.; Int-Veen, I.; Kammann, U.; Scharsack, J.P. Microplastic Fibers—Underestimated Threat to Aquatic Organisms? Sci. Total Environ. 2021, 777, 146045. [Google Scholar] [CrossRef]
- Flores-Ocampo, I.Z.; Armstrong-Altrin, J.S. Abundance and Composition of Microplastics in Tampico Beach Sediments, Tamaulipas State, Southern Gulf of Mexico. Mar. Pollut. Bull. 2023, 191, 114891. [Google Scholar] [CrossRef]
- Castro-Amoedo, R.; Granacher, J.; Kantor, I.; Dahmen, A.; Barbosa-Povoa, A.; Maréchal, F. On the Role of System Integration in Plastic Waste Management. Resour. Conserv. Recycl. 2024, 201, 107295. [Google Scholar] [CrossRef]
- Rypina, I.I.; Pratt, L.J.; Dotzel, M. Aggregation of Slightly Buoyant Microplastics in 3D Vortex Flows. Nonlinear Process. Geophys. 2024, 31, 25–44. [Google Scholar] [CrossRef]
- Zhang, Q.-Q.; Lan, M.-Y.; Li, H.-R.; Qiu, S.-Q.; Guo, Z.; Liu, Y.-S.; Zhao, J.-L.; Ying, G.-G. Plastic Pollution from Takeaway Food Industry in China. Sci. Total Environ. 2023, 904, 166933. [Google Scholar] [CrossRef] [PubMed]
- Dewangan, S.K.; Toppo, D.N.; Kujur, A. Investigating the Impact of PH Levels on Water Quality: An Experimental Approach. Int. J. Res. Appl. Sci. Eng. Technol. 2023, 11, 756–759. [Google Scholar] [CrossRef]
- Xia, F.; Yang, W.; Zhao, H.; Cai, Y.; Tan, Q. Occurrence Characteristics and Transport Processes of Riverine Microplastics in Different Connectivity Contexts. npj Clean Water 2025, 8, 1. [Google Scholar] [CrossRef]
- Liu, X.; Zhong, B.; Li, N.; Wu, W.-M.; Wang, X.; Li, X.; Yang, Z.; Mei, X.; Yi, S.; He, Y. Notable Ecological Risks of Microplastics to Minjiang River Ecosystem over Headwater to Upstream in Eastern Qinghai-Tibetan Plateau. Water Res. 2025, 274, 123137. [Google Scholar] [CrossRef]
- Choudhary, A.; George, L.; Mandal, A.; Biswas, A.; Ganie, Z.A.; Darbha, G.K. Assessment of Microplastics and Associated Ecological Risk in the Longest River (Godavari) of Peninsular India: A Comprehensive Source-to-Sink Analysis in Water, Sediment and Fish. Mar. Pollut. Bull. 2025, 212, 117560. [Google Scholar] [CrossRef]
- Larrea Valdivia, A.E.; Larico, J.R.; Valenzuela Huillca, C.; Arias, A.H. First Evidence of Microplastics in the Quilca-Vítor-Chili River Basin, Arequipa Region, Peru. J. Contam. Hydrol. 2025, 269, 104484. [Google Scholar] [CrossRef]
- Dimassi, S.N.; Hahladakis, J.N.; Yahia, M.N.D.; Ahmad, M.I.; Sayadi, S.; Al-Ghouti, M.A. Degradation-Fragmentation of Marine Plastic Waste and Their Environmental Implications: A Critical Review. Arab. J. Chem. 2022, 15, 104262. [Google Scholar] [CrossRef]
- Shen, L.; Worrell, E. Plastic Recycling. In Handbook of Recycling; Elsevier: Amsterdam, The Netherlands, 2024; pp. 497–510. [Google Scholar]
- Ghaffar, I.; Rashid, M.; Akmal, M.; Hussain, A. Plastics in the Environment as Potential Threat to Life: An Overview. Environ. Sci. Pollut. Res. 2022, 29, 56928–56947. [Google Scholar] [CrossRef]
- Talbot, R.; Chang, H. Microplastics in Freshwater: A Global Review of Factors Affecting Spatial and Temporal Variations. Environ. Pollut. 2022, 292, 118393. [Google Scholar] [CrossRef]
- He, Y.; Lu, J.; Li, C.; Wang, X.; Jiang, C.; Zhu, L.; Bu, X.; Jabeen, K.; Vo, T.T.; Li, D. From Pollution to Solutions: Insights into the Sources, Transport and Management of Plastic Debris in Pristine and Urban Rivers. Environ. Res. 2024, 245, 118024. [Google Scholar] [CrossRef]
- Mallik, A.; Xavier, K.A.M.; Naidu, B.C.; Nayak, B.B. Ecotoxicological and Physiological Risks of Microplastics on Fish and Their Possible Mitigation Measures. Sci. Total Environ. 2021, 779, 146433. [Google Scholar] [CrossRef] [PubMed]
- Conowall, P.; Schreiner, K.M.; Minor, E.C.; Hrabik, T.; Schoenebeck, C.W. Variability of Microplastic Loading and Retention in Four Inland Lakes in Minnesota, USA. Environ. Pollut. 2023, 328, 121573. [Google Scholar] [CrossRef] [PubMed]
- Janakiram, R.; Keerthivasan, R.; Janani, R.; Ramasundaram, S.; Martin, M.V.; Venkatesan, R.; Ramana Murthy, M.V.; Sudhakar, T. Seasonal Distribution of Microplastics in Surface Waters of the Northern Indian Ocean. Mar. Pollut. Bull. 2023, 190, 114838. [Google Scholar] [CrossRef]
- Kumar, V.; Umesh, M.; Chakraborty, P.; Sharma, P.; Sarojini, S.; Basheer, T.; Kaur, K.; Pasrija, R.; Barcelo, D. Origin, Ecotoxicity, and Analytical Methods for Microplastic Detection in Aquatic Systems. TrAC Trends Anal. Chem. 2024, 170, 117392. [Google Scholar] [CrossRef]
- Peña, A.; Rodríguez-Liébana, J.A.; Delgado-Moreno, L. Interactions of Microplastics with Pesticides in Soils and Their Ecotoxicological Implications. Agronomy 2023, 13, 701. [Google Scholar] [CrossRef]
- Liu, Y.; Liu, Y.; Li, Y.; Bian, P.; Hu, Y.; Zhang, J.; Shen, W. Effects of Irrigation on the Fate of Microplastics in Typical Agricultural Soil and Freshwater Environments in the Upper Irrigation Area of the Yellow River. J. Hazard. Mater. 2023, 447, 130766. [Google Scholar] [CrossRef]
- Secretaría de Medio Ambiente, R.N. y P. (SEMARNAP). Norma Oficial Mexicana NOM-003-ECOL-1997. Available online: https://www.gob.mx/cms/uploads/attachment/file/311363/NOM_003_SEMARNAT.pdf (accessed on 15 February 2025).
- Reyes Jaime, A.; Aguilar Ibarra, A.; Anglés Hernández, M.; Güereca Hernández, L.P. Legislaciones Estatales Para Los Plásticos de Un Sólo Uso En México: ¿Qué Sectores Están Incluidos? Rev. Int. Contam. Ambient. 2024, 40, 105–117. [Google Scholar] [CrossRef]
- Congreso de la Ciudad de México Ley de Residuos Sólidos. Available online: https://www.congresocdmx.gob.mx/media/documentos/5e9cfdc1fa63fdf6120fd92f434a3e407d58af30.pdf (accessed on 2 March 2025).
- Mishra, S.; Ren, Y.; Sun, X.; Lian, Y.; Singh, A.K.; Sharma, N.; Shikhar, K.C. Microplastics–Biofilm in Aquatic Ecosystem: Formation, Pollutants Complexation, Greenhouse Gas Emission and Ecotoxicology. J. Environ. Manag. 2024, 370, 122930. [Google Scholar] [CrossRef]
- Mariano, S.; Tacconi, S.; Fidaleo, M.; Rossi, M.; Dini, L. Micro and Nanoplastics Identification: Classic Methods and Innovative Detection Techniques. Front. Toxicol. 2021, 3, 636640. [Google Scholar] [CrossRef]
- Kadac-Czapska, K.; Ośko, J.; Knez, E.; Grembecka, M. Microplastics and Oxidative Stress—Current Problems and Prospects. Antioxidants 2024, 13, 579. [Google Scholar] [CrossRef]
- Ashrafy, A.; Liza, A.A.; Islam, M.N.; Billah, M.M.; Arafat, S.T.; Rahman, M.M.; Rahman, S.M. Microplastics Pollution: A Brief Review of Its Source and Abundance in Different Aquatic Ecosystems. J. Hazard. Mater. Adv. 2023, 9, 100215. [Google Scholar] [CrossRef]
- Ghosh, S.; Sinha, J.K.; Ghosh, S.; Vashisth, K.; Han, S.; Bhaskar, R. Microplastics as an Emerging Threat to the Global Environment and Human Health. Sustainability 2023, 15, 10821. [Google Scholar] [CrossRef]
- Roy, P.; Mohanty, A.K.; Misra, M. Microplastics in Ecosystems: Their Implications and Mitigation Pathways. Environ. Sci. Adv. 2022, 1, 9–29. [Google Scholar] [CrossRef]

| ID | Sampling Area | Geographic Coordinates |
|---|---|---|
| SA-1 | Maracaibo Beach | E 732099.806252 N 2236577.718221 |
| SA-2 | Maracaibo River | E 732099.806252 N 2236577.718604 |
| SA-3 | Nautla | E 724696.863808 N 2231664.942291 |
| SA-4 | Jicaltepec | E 724659.198550 N 2231566.645207 |
| SA-5 | Chapa-Chapa | E 732259.440263 N 2236838.257247 |
| SA-6 | Carrillo Puerto | E 724659.198550 N 2231566.645207 |
| SA-7 | Máximo Garcia | E 732099.806252 N 2236577.718604 |
| SA-8 | Martínez | E 704710.236904 N 2219794.298297 |
| SA-9 | La Capilla | E 6804710.246904 N 2219794.298297 |
| Sample | Dissolved Oxygen mg/L−1 (gpg) | Temperature °C (°F) | Electrical Conductivity (mS cm−1) | pH |
|---|---|---|---|---|
| SA1 | 5.43 ± 0.15 (0.318 ± 0.009) | 29.93 ± 0.06 (85.87 ± 0.11) | 3.98 ± 0.01 | 5.17 ± 0.72 |
| SA2 | 6.17 ± 0.12 (0.360 ± 0.007) | 33.83 ± 0.06 (92.89 ± 0.11) | 3.98 ± 0.01 | 7.51 ± 0.50 |
| SA3 | 7.23 ± 0.31 (0.422 ± 0.018) | 29.37 ± 0.12 (84.87 ± 0.22) | 1.14 ± 0.73 | 8.47 ± 0.55 |
| SA4 | 6.17 ± 0.23 (0.360 ± 0.013) | 27.67 ± 0.15 (81.81 ± 0.27) | 0.29 ± 0.06 | 8.94 ± 1.79 |
| SA5 | 7.00 ± 0.20 (0.409 ± 0.012) | 27.43 ± 0.12 (81.37 ± 0.22) | 0.65 ± 0.07 | 8.02 ± 0.85 |
| SA6 | 6.37 ± 0.23 (0.372 ± 0.013) | 29.37 ± 0.12 (84.87 ± 0.22) | 0.25 ± 0.03 | 7.21 ± 0.69 |
| SA7 | 6.57 ± 0.25 (0.384 ± 0.015) | 27.00 ± 0.20 (80.60 ± 0.36) | 0.37 ± 0.12 | 6.82 ± 1.02 |
| SA8 | 5.53 ± 0.31 (0.323 ± 0.018) | 26.53 ± 0.25 (79.75 ± 0.45) | 0.37 ± 0.12 | 8.23 ± 0.68 |
| SA9 | 6.77 ± 0.23 (0.396 ± 0.013) | 27.73 ± 0.15 (81.91 ± 0.27) | 0.52 ± 0.05 | 8.21 ± 0.71 |
| Parameter | pH | EC | T | TDS | DO | COD | TN | NO3 | TP | PO4 |
|---|---|---|---|---|---|---|---|---|---|---|
| pH | 1 | |||||||||
| EC | −0.603 | 1 | ||||||||
| T | −0.283 | 0.811 ** | 1 | |||||||
| TDS | −0.772 * | 0.937 ** | 0.618 | 1 | ||||||
| DO | 0.471 | −0.409 | −0.102 | −0.580 | 1 | |||||
| COD | −0.045 | 0.452 | 0.310 | 0.334 | −0.556 | 1 | ||||
| TN | −0.338 | 0.355 | 0.425 | 0.338 | 0.154 | −0.155 | 1 | |||
| NO3 | −0.426 | 0.409 | 0.584 | 0.389 | 0.081 | −0.231 | 0.911 ** | 1 | ||
| TP | −0.590 | 0.575 | 0.420 | 0.666 | −0.411 | 0.196 | 0.678 * | 0.597 | 1 | |
| PO4 | −0.299 | 0.474 | 0.533 | 0.435 | 0.120 | −0.108 | 0.975 ** | 0.898 ** | 0.697 * | 1 |
| ID | Sampling Area | MP Shape—Sediment | |||
|---|---|---|---|---|---|
| Sphere | Flake | Film | Fiber | ||
| SA1-1 | Maracaibo Beach 1 | - | 2 | 2 | 14 |
| SA1-2 | Maracaibo Beach 2 | - | 1 | - | 8 |
| SA1-3 | Maracaibo Beach 3 | - | 1 | 2 | 2 |
| SA2-1 | Maracaibo River 1 | - | - | 2 | 4 |
| SA2-2 | Maracaibo River 2 | - | 3 | 2 | 1 |
| SA2-3 | Maracaibo River 3 | - | 2 | - | 2 |
| SA3-1 | Nautla 1 | - | 6 | - | 2 |
| SA3-2 | Nautla 2 | - | 4 | - | 5 |
| SA3-3 | Nautla 3 | - | - | 2 | 2 |
| SA4 | Jicaltepec | 1 | 2 | 2 | 4 |
| SA5-1 | Chapa-Chapa 1 | 1 | 2 | 3 | 1 |
| SA5-2 | Chapa-Chapa 2 | - | 2 | 2 | 1 |
| SA5-3 | Chapa-Chapa 3 | - | - | 2 | 1 |
| SA6-1 | Carrillo Puerto 1 | - | - | 1 | - |
| SA6-2 | Carrillo Puerto 2 | - | - | 6 | - |
| SA6-3 | Carrillo Puerto 3 | - | - | 1 | - |
| SA7-1 | Maximo García 1 | - | - | 1 | - |
| SA7-2 | Maximo García 2 | - | 2 | 4 | - |
| SA7-3 | Maximo García 3 | - | - | 1 | - |
| SA8-1 | Martínez 1 | - | 2 | 6 | 2 |
| SA8-2 | Martínez 2 | - | 3 | 7 | 4 |
| SA8-3 | Martínez 3 | - | - | 3 | 3 |
| SA9-1 | La Capilla 1 | - | 6 | 2 | - |
| SA9-2 | La Capilla 2 | - | 3 | 1 | - |
| SA9-3 | La Capilla 3 | - | 2 | 3 | - |
| MP Shape—Water | |||||
| SA1 | Maracaibo Beach | - | 1 | - | 9 |
| SA2 | Maracaibo River | - | 1 | - | 10 |
| SA3 | Nautla | - | 1 | - | 7 |
| SA4 | Jicaltepec | - | 2 | - | 10 |
| SA5 | Chapa-Chapa | - | - | - | 7 |
| SA6 | Carrillo Puerto | 2 | 2 | - | 9 |
| SA7 | Maximo García | - | 2 | 2 | 8 |
| SA8 | Martínez | - | 3 | - | 7 |
| SA9 | La Capilla | - | 1 | - | 7 |
| Hydraulic Factor | Effect on MP Mobility | Reference |
|---|---|---|
| High-Speed Flow | Downstream Dispersal and Transportation | [51] |
| Lower Speed in Meanders | Retention and Accumulation of Sediments | [52] |
| Turbulence | MP Suspension in Water Column | [53] |
| Sediment Bank Formation | MP Adsorption in Finer Particulates | [54] |
| Microplastics Source in Citrus Industry | Example | Environmental Impact | Reference |
|---|---|---|---|
| Fruit plastic packaging | Polyethylene bags, PET boxes | Contamination by MP fragments | [61] |
| Greenhouse coverings | Polyethylene plastics | Wear and release of microfibers | [62] |
| Pesticides and herbicides | Formulations with MPs as carrier agents | Entry of MPs into soil and water | [63] |
| Irrigation systems | Water contaminated with MPs transported from other sources | Redistribution of MPs in crops and water bodies | [64] |
Disclaimer/Publisher’s Note: The statements, opinions and data contained in all publications are solely those of the individual author(s) and contributor(s) and not of MDPI and/or the editor(s). MDPI and/or the editor(s) disclaim responsibility for any injury to people or property resulting from any ideas, methods, instructions or products referred to in the content. |
© 2025 by the authors. Licensee MDPI, Basel, Switzerland. This article is an open access article distributed under the terms and conditions of the Creative Commons Attribution (CC BY) license (https://creativecommons.org/licenses/by/4.0/).
Share and Cite
Hernández-Morales, G.; López-Mendez, M.C.; Rico-Barragán, A.A.; Pérez-Moreno, J.; Peña-Montes, C.; Peralta-Pelaez, L.A.; González-Moreno, H.R. Microplastic Pollution in Tropical River: Fourier Transform Infrared Spectroscopy-Based Characterization of Abundance and Polymer Composition in Water and Sediments from Filobobos River, Mexico. Hydrology 2025, 12, 124. https://doi.org/10.3390/hydrology12050124
Hernández-Morales G, López-Mendez MC, Rico-Barragán AA, Pérez-Moreno J, Peña-Montes C, Peralta-Pelaez LA, González-Moreno HR. Microplastic Pollution in Tropical River: Fourier Transform Infrared Spectroscopy-Based Characterization of Abundance and Polymer Composition in Water and Sediments from Filobobos River, Mexico. Hydrology. 2025; 12(5):124. https://doi.org/10.3390/hydrology12050124
Chicago/Turabian StyleHernández-Morales, Gleybis, María Cristina López-Mendez, Alan Antonio Rico-Barragán, Jesús Pérez-Moreno, Carolina Peña-Montes, Luis Alberto Peralta-Pelaez, and Humberto Raymundo González-Moreno. 2025. "Microplastic Pollution in Tropical River: Fourier Transform Infrared Spectroscopy-Based Characterization of Abundance and Polymer Composition in Water and Sediments from Filobobos River, Mexico" Hydrology 12, no. 5: 124. https://doi.org/10.3390/hydrology12050124
APA StyleHernández-Morales, G., López-Mendez, M. C., Rico-Barragán, A. A., Pérez-Moreno, J., Peña-Montes, C., Peralta-Pelaez, L. A., & González-Moreno, H. R. (2025). Microplastic Pollution in Tropical River: Fourier Transform Infrared Spectroscopy-Based Characterization of Abundance and Polymer Composition in Water and Sediments from Filobobos River, Mexico. Hydrology, 12(5), 124. https://doi.org/10.3390/hydrology12050124