
Parsimonious Model of Groundwater Recharge Potential as Seen Related with Two Topographic Indices and the Leaf Area Index


Abstract
1. Introduction
2. Materials and Methods
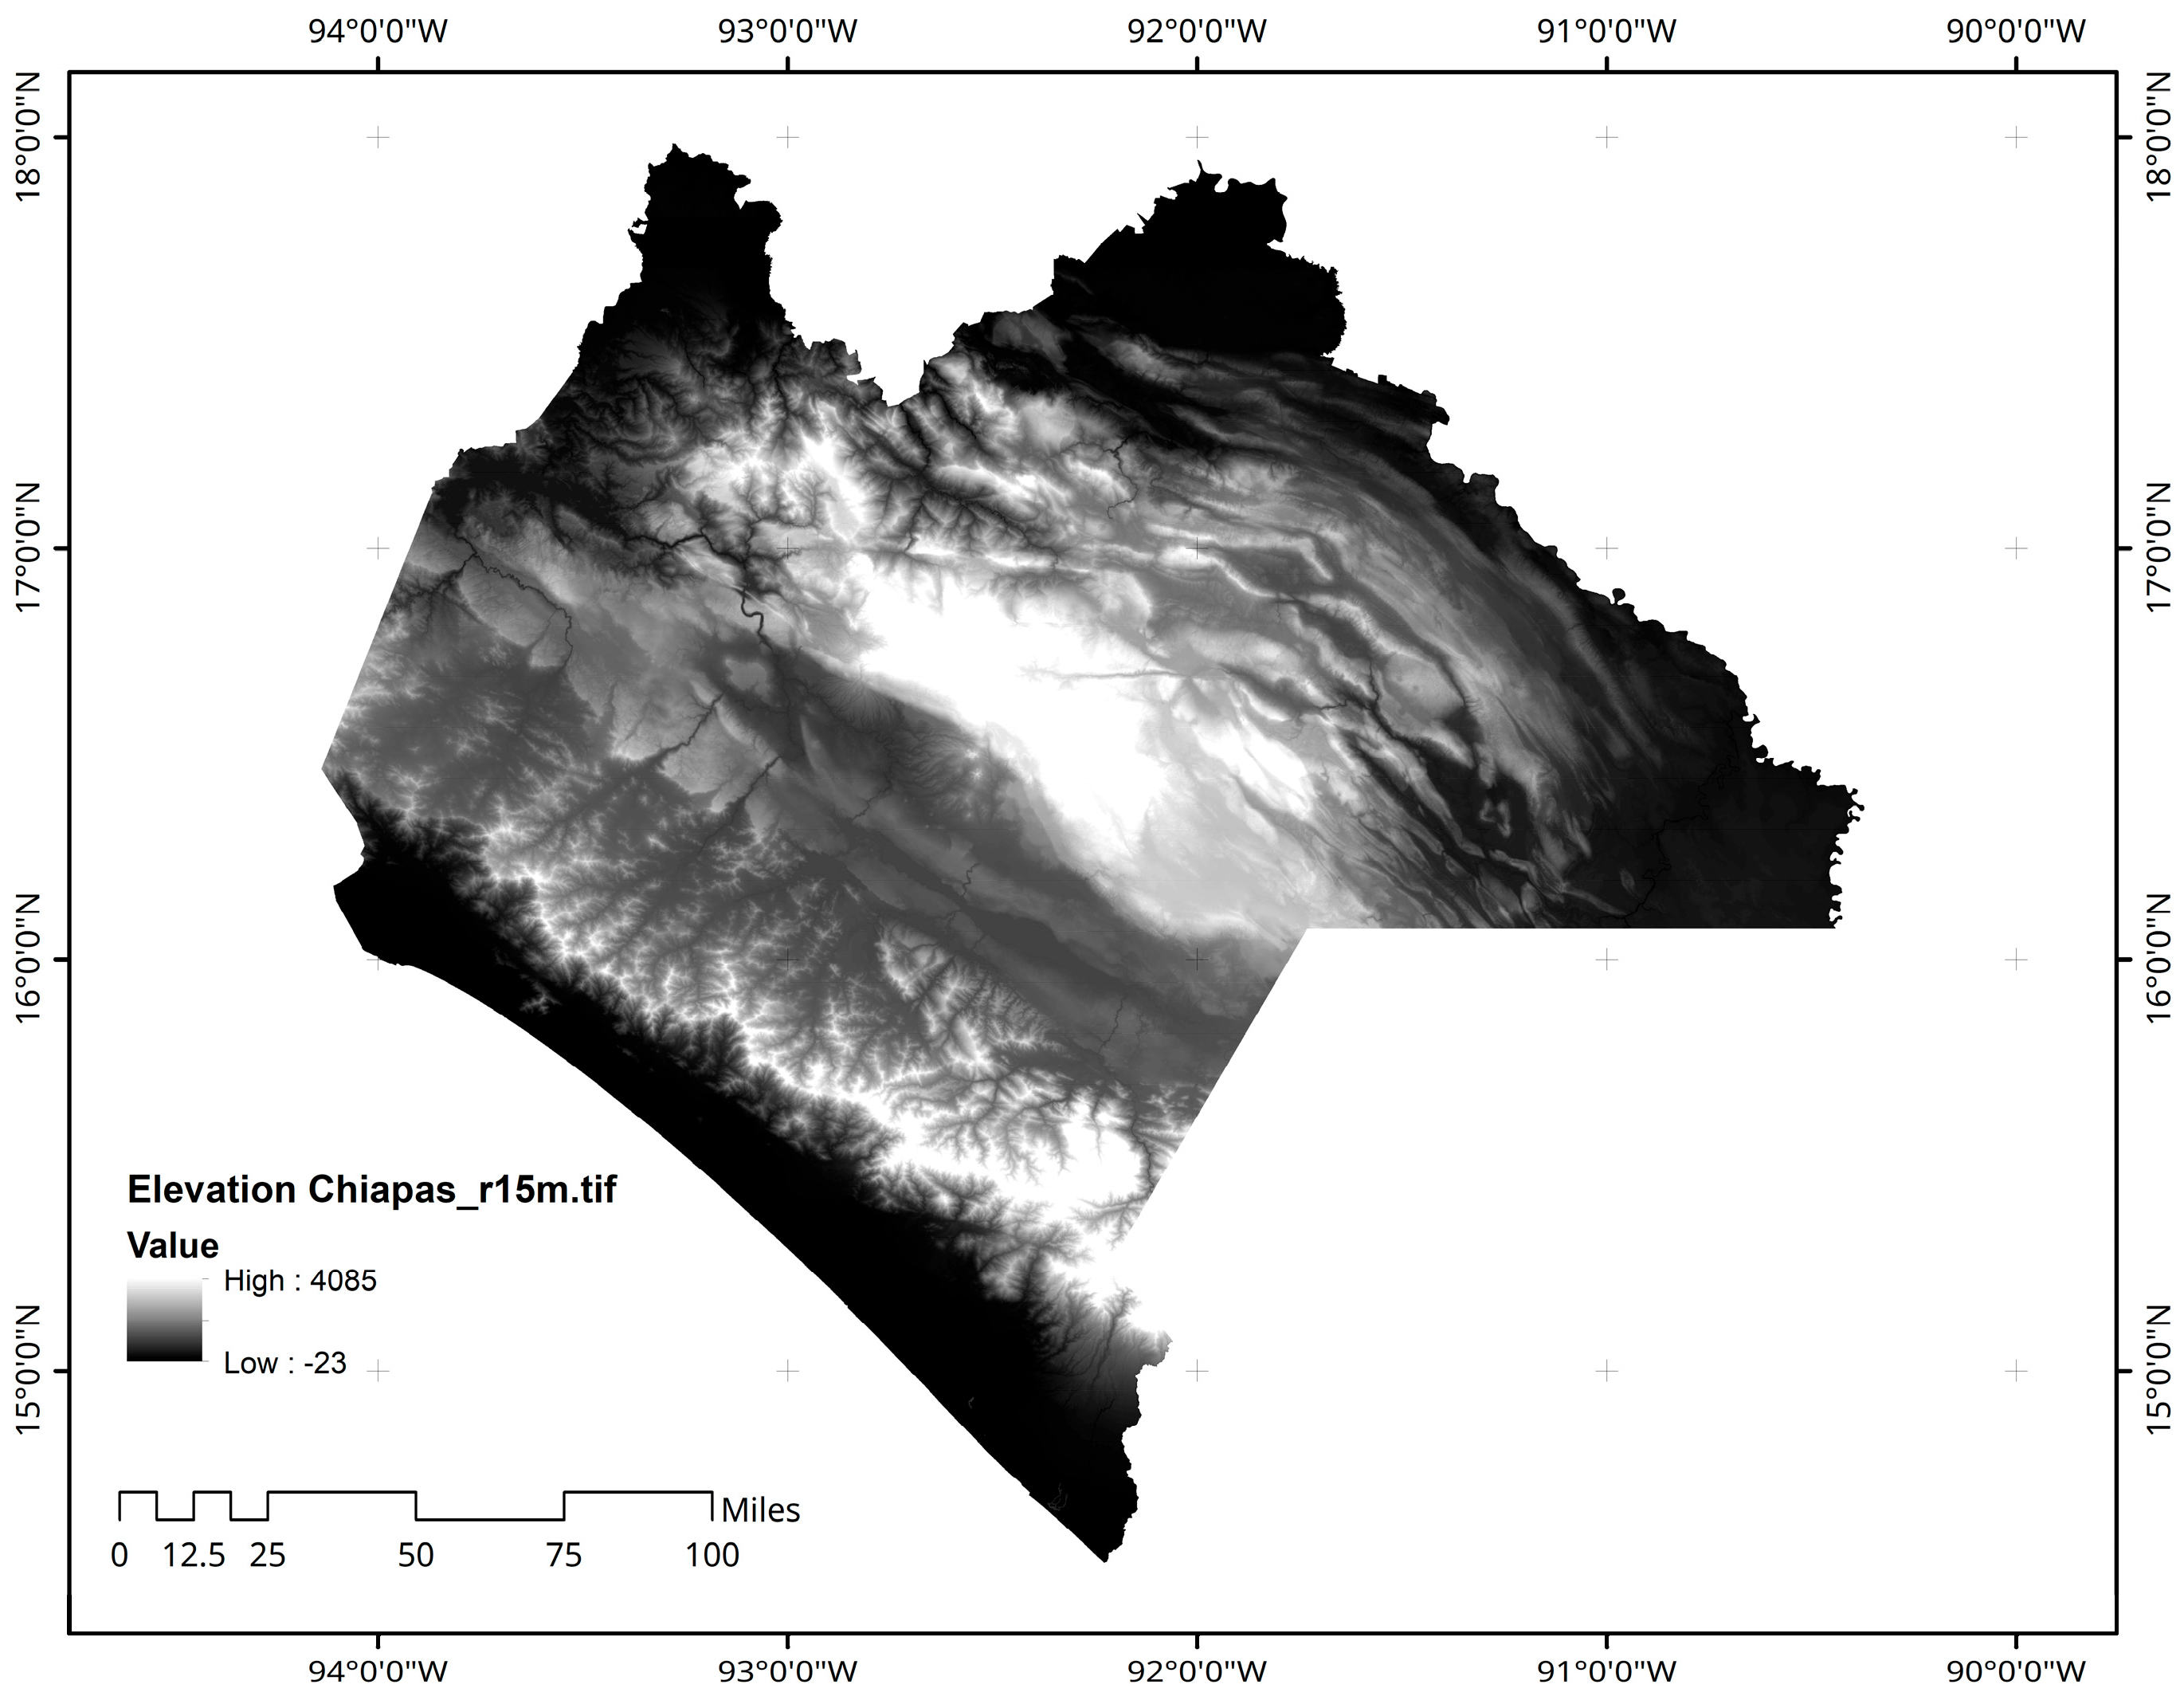
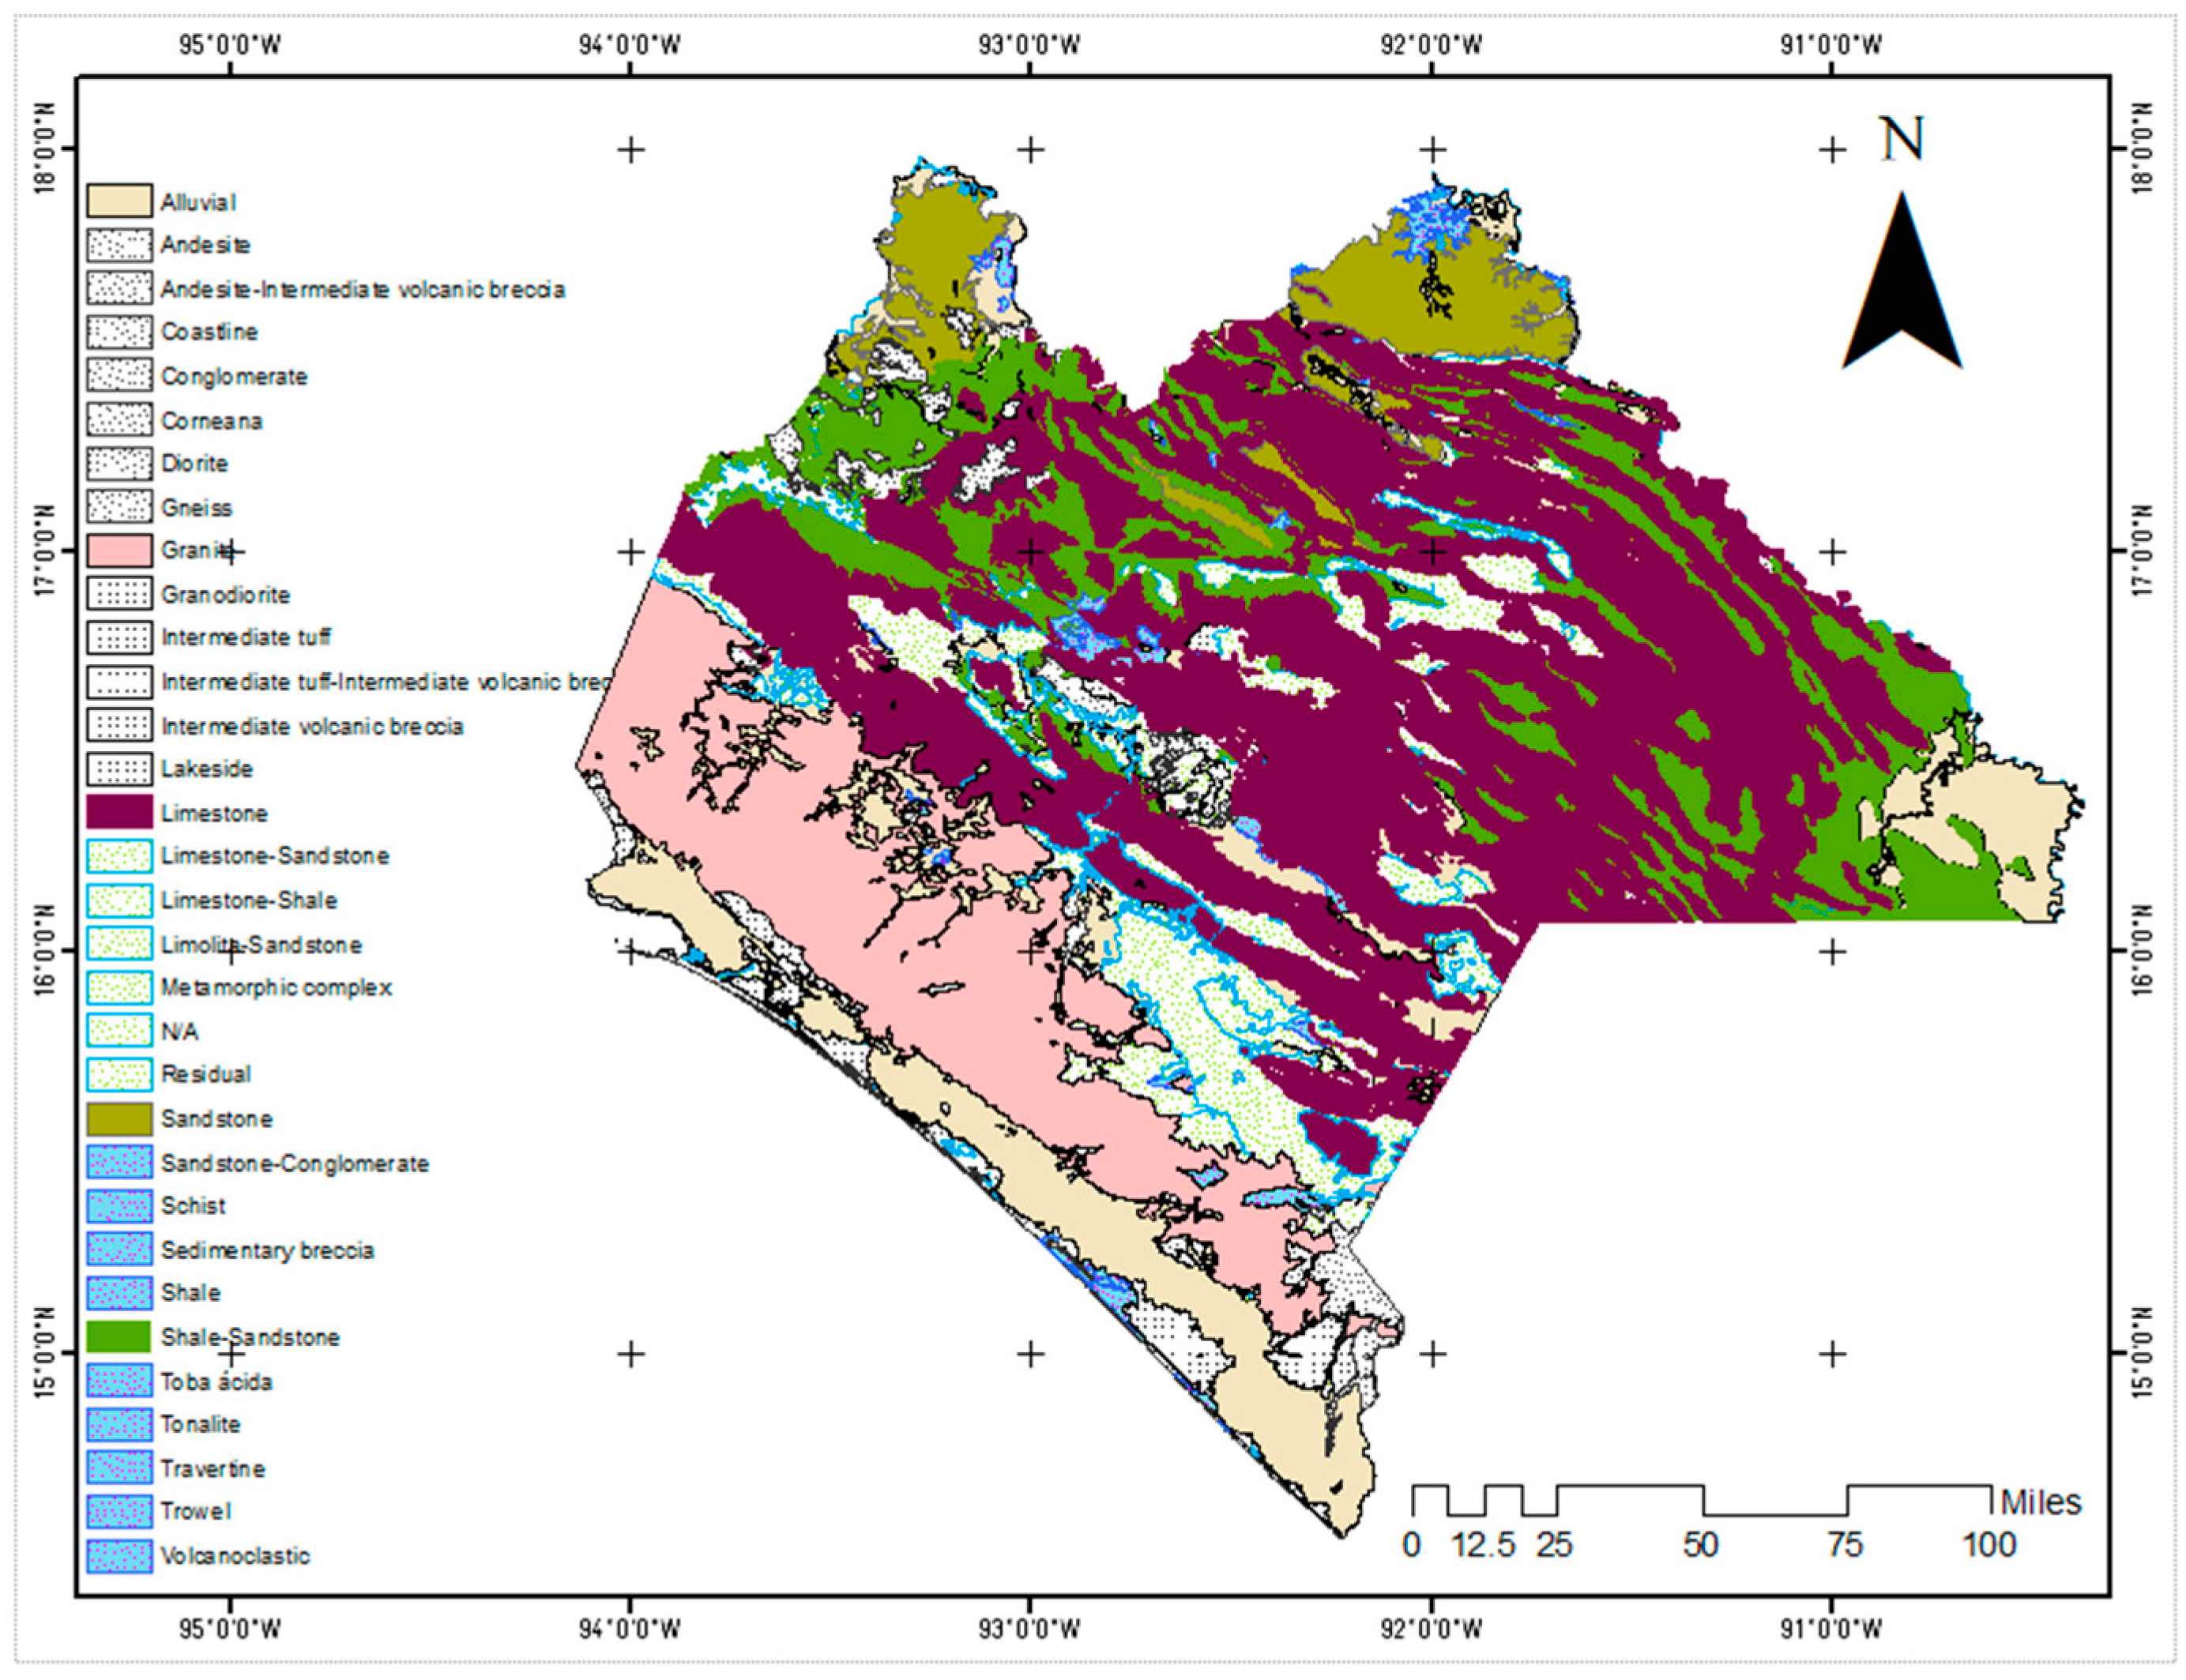
2.1. Description of the Study Area
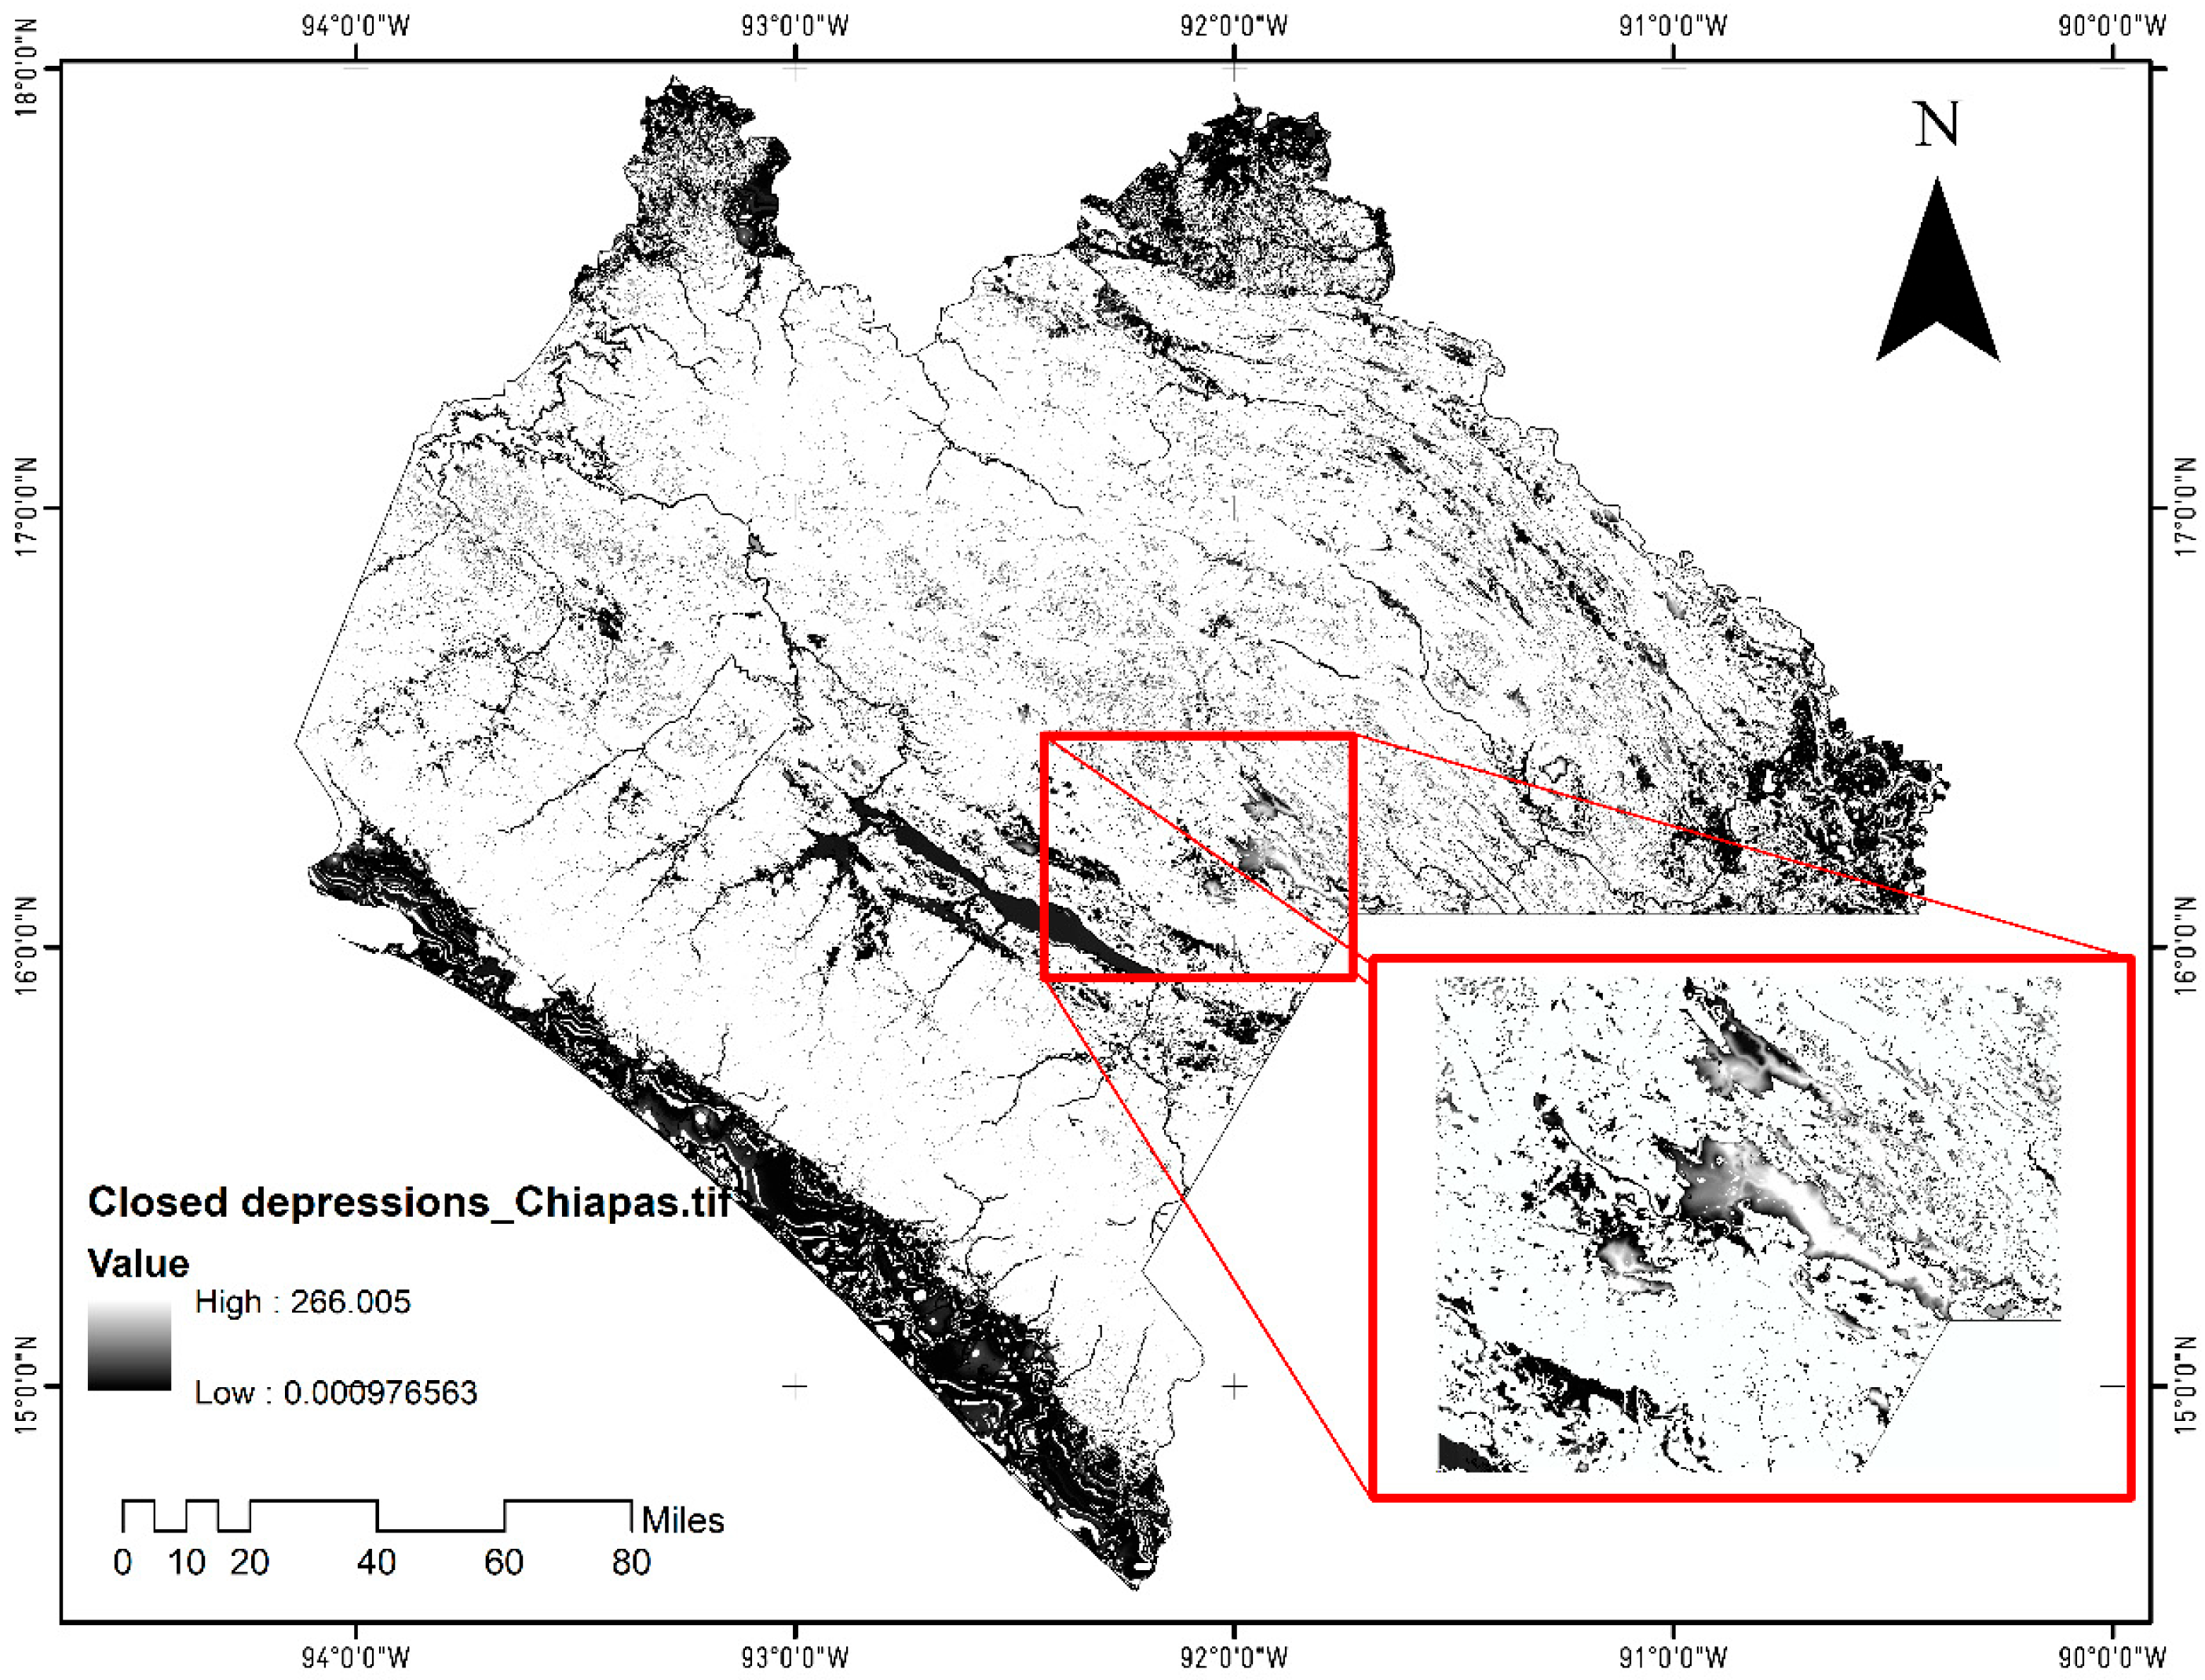
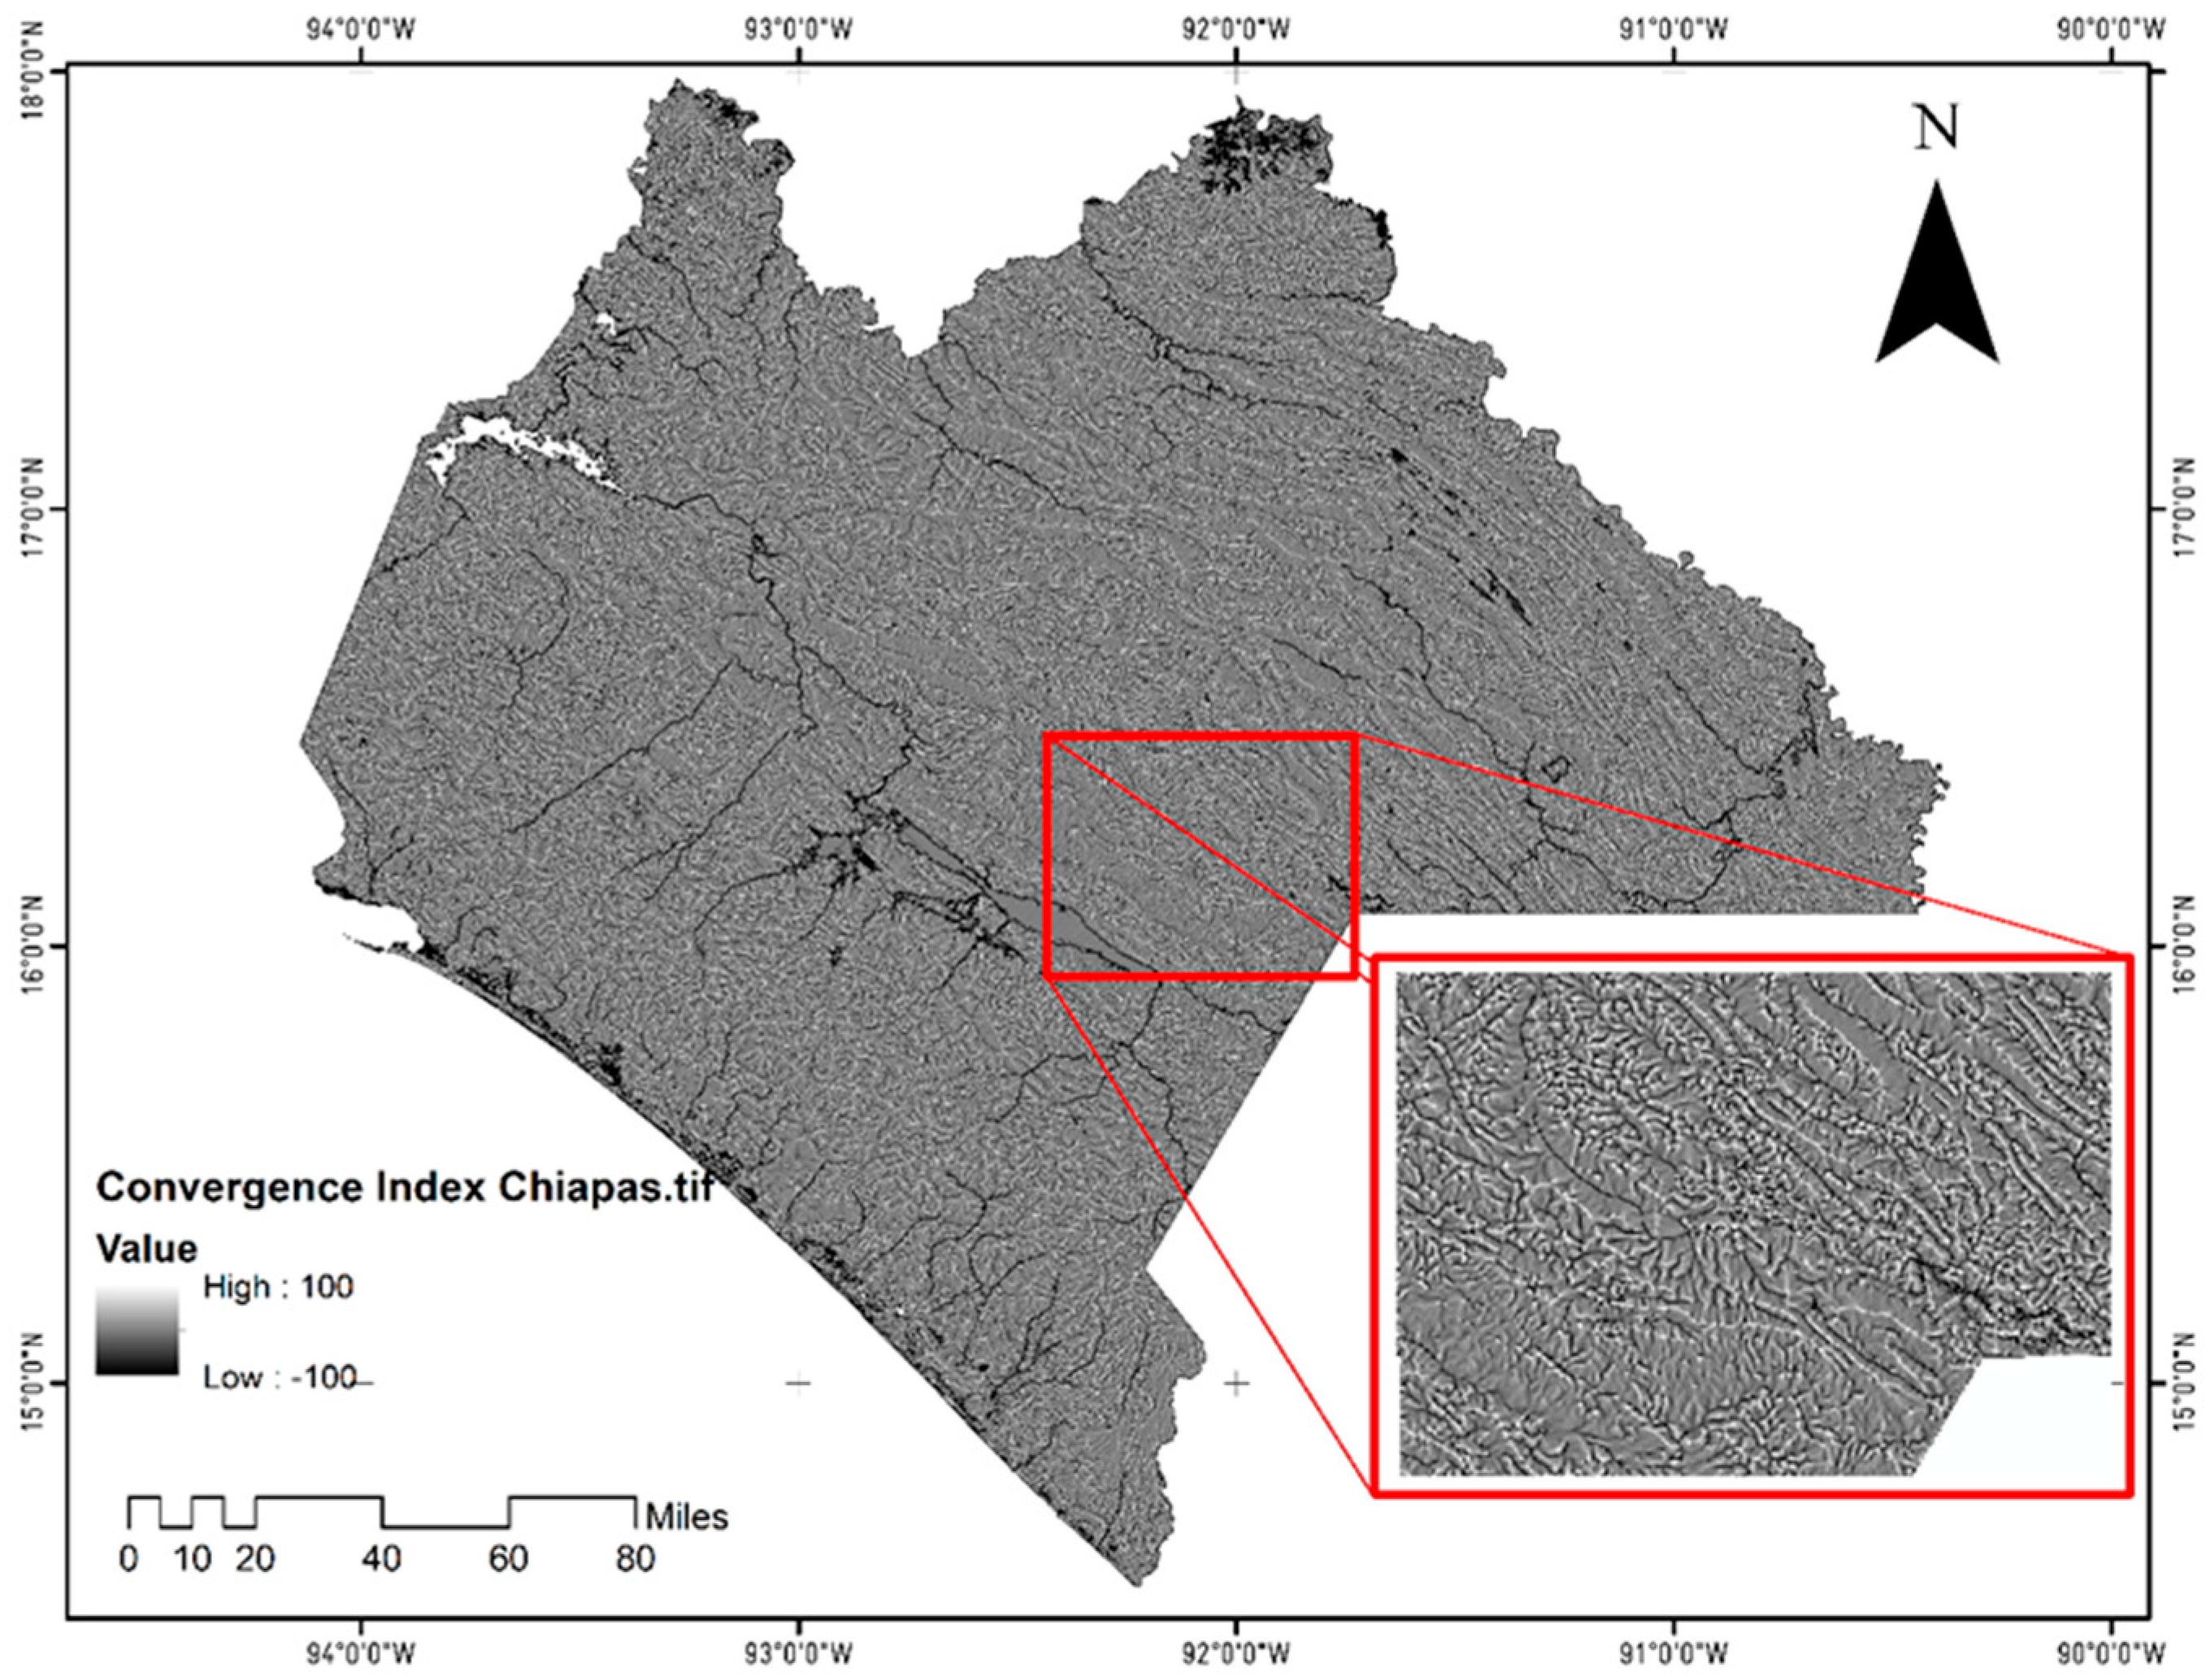
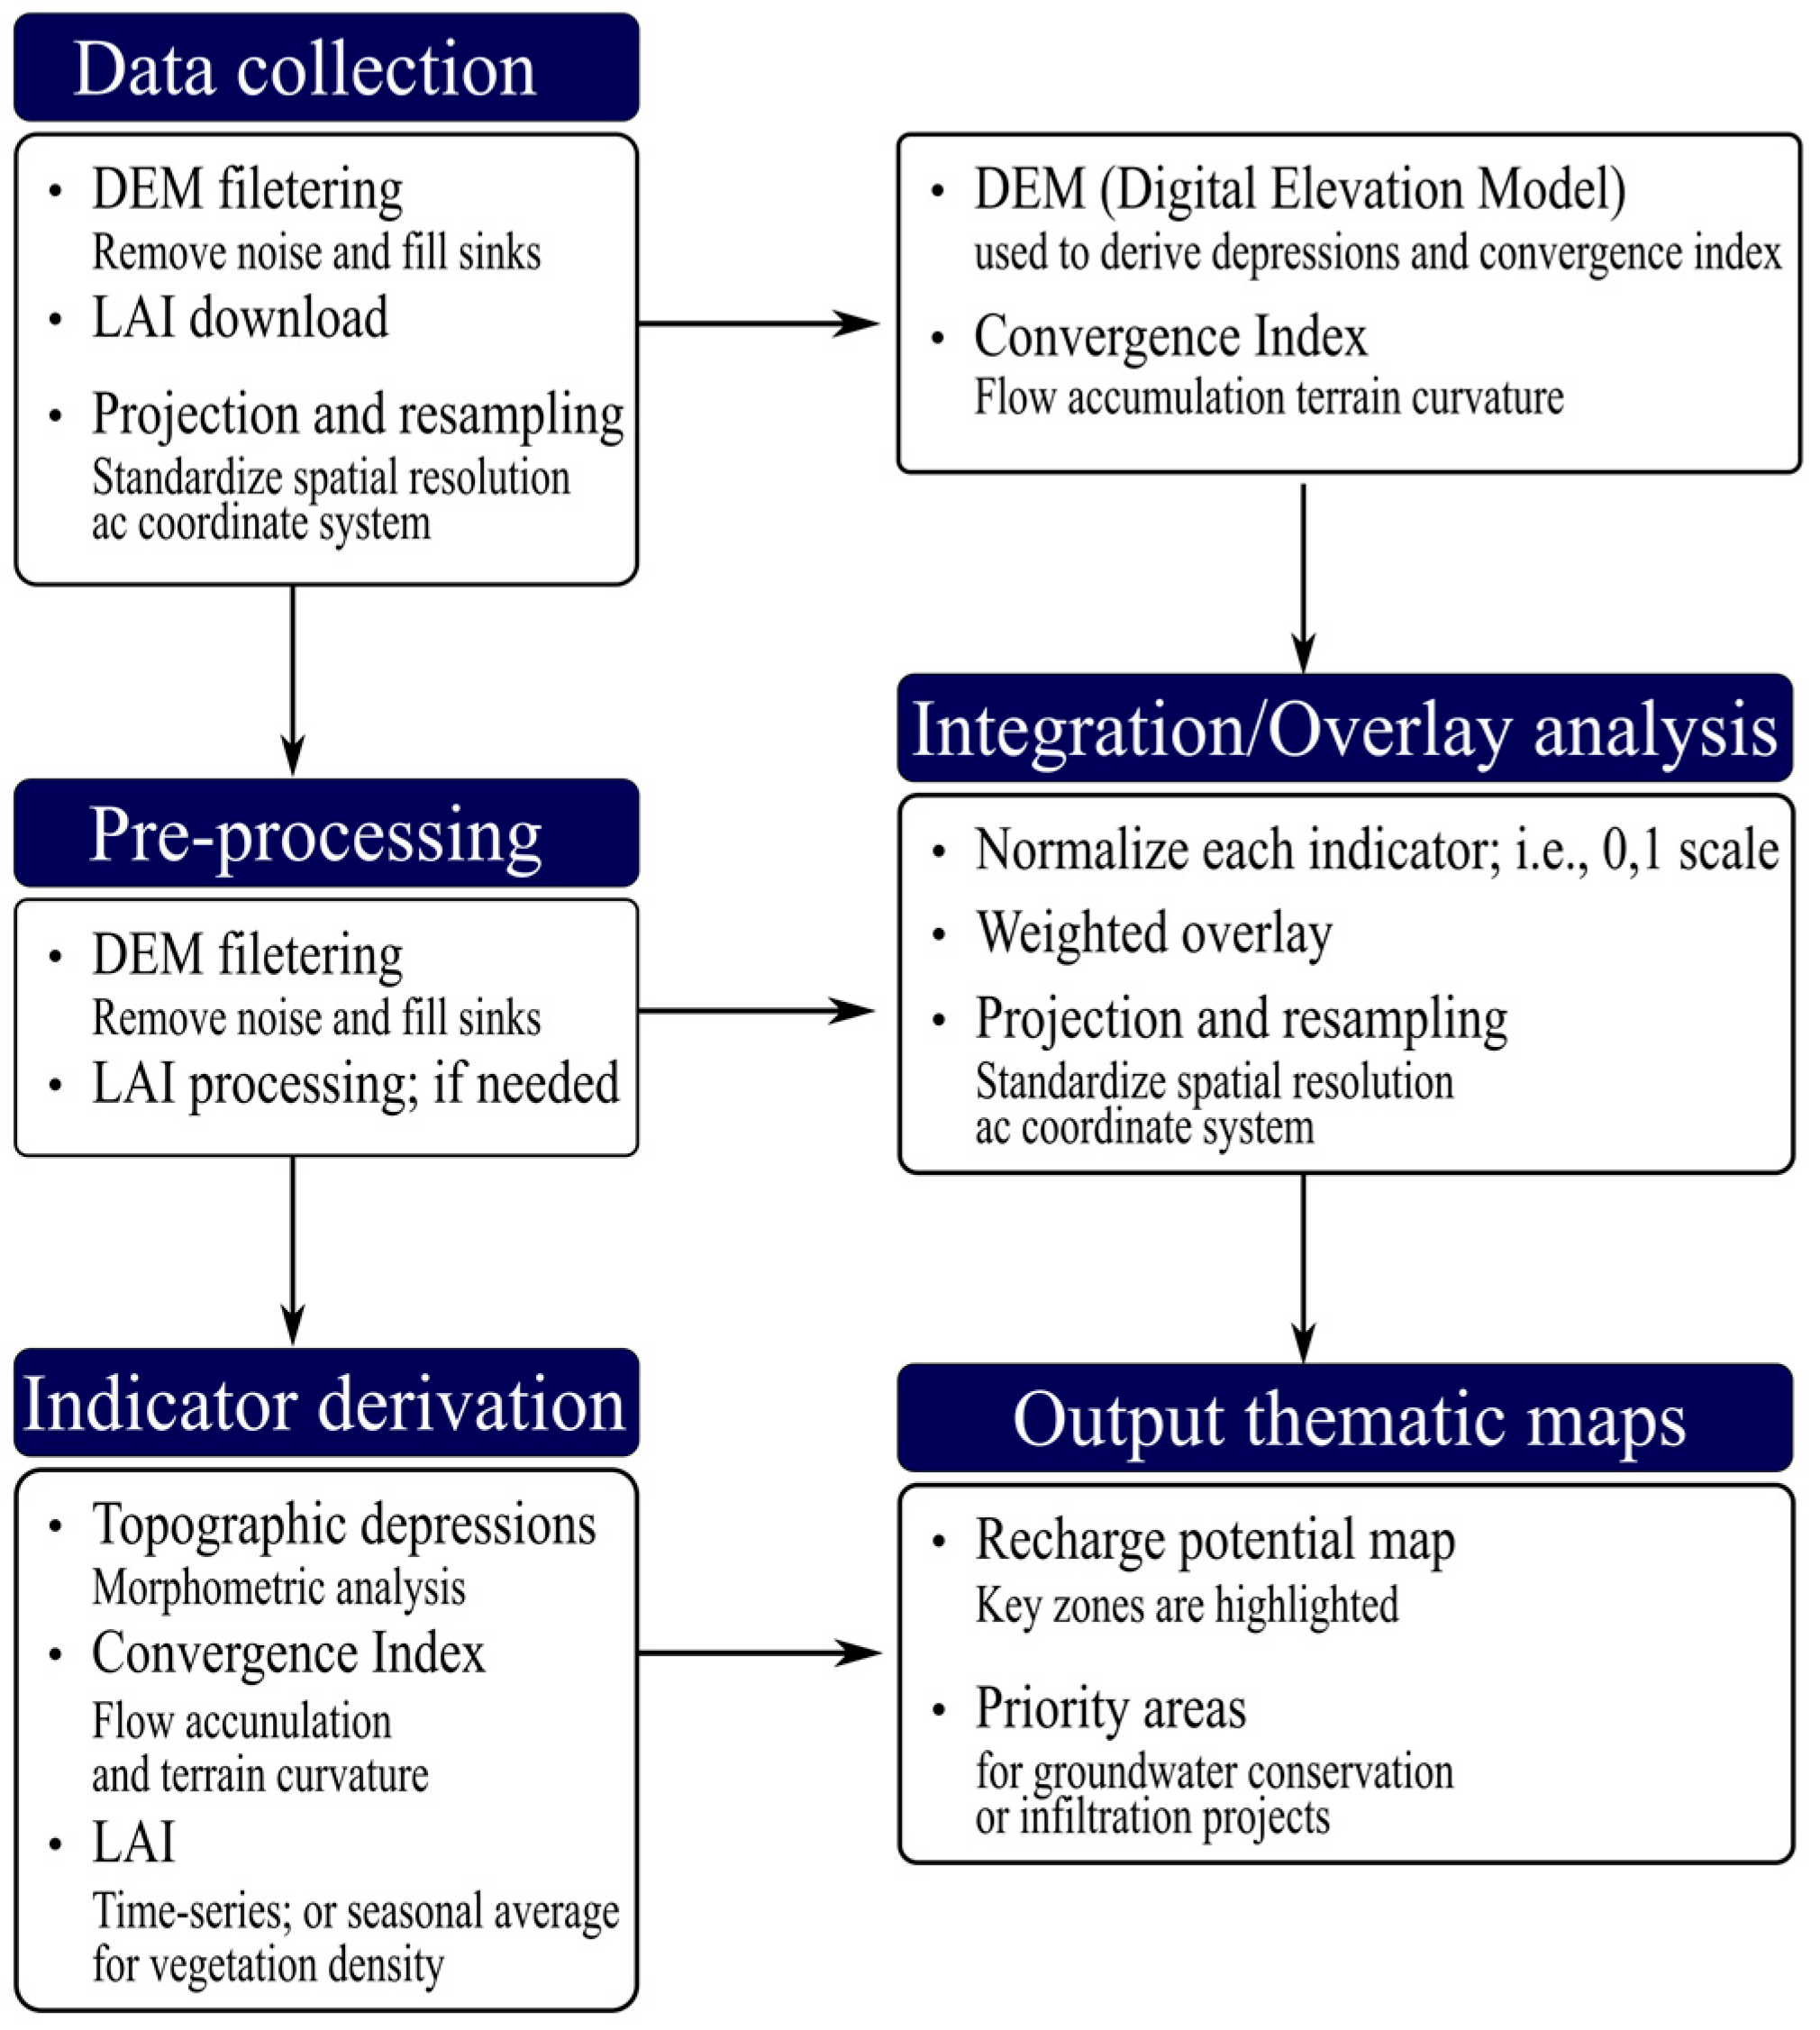
2.2. Topographic Indices and Leaf Area Index (LAI)
2.3. Model’s Parameters
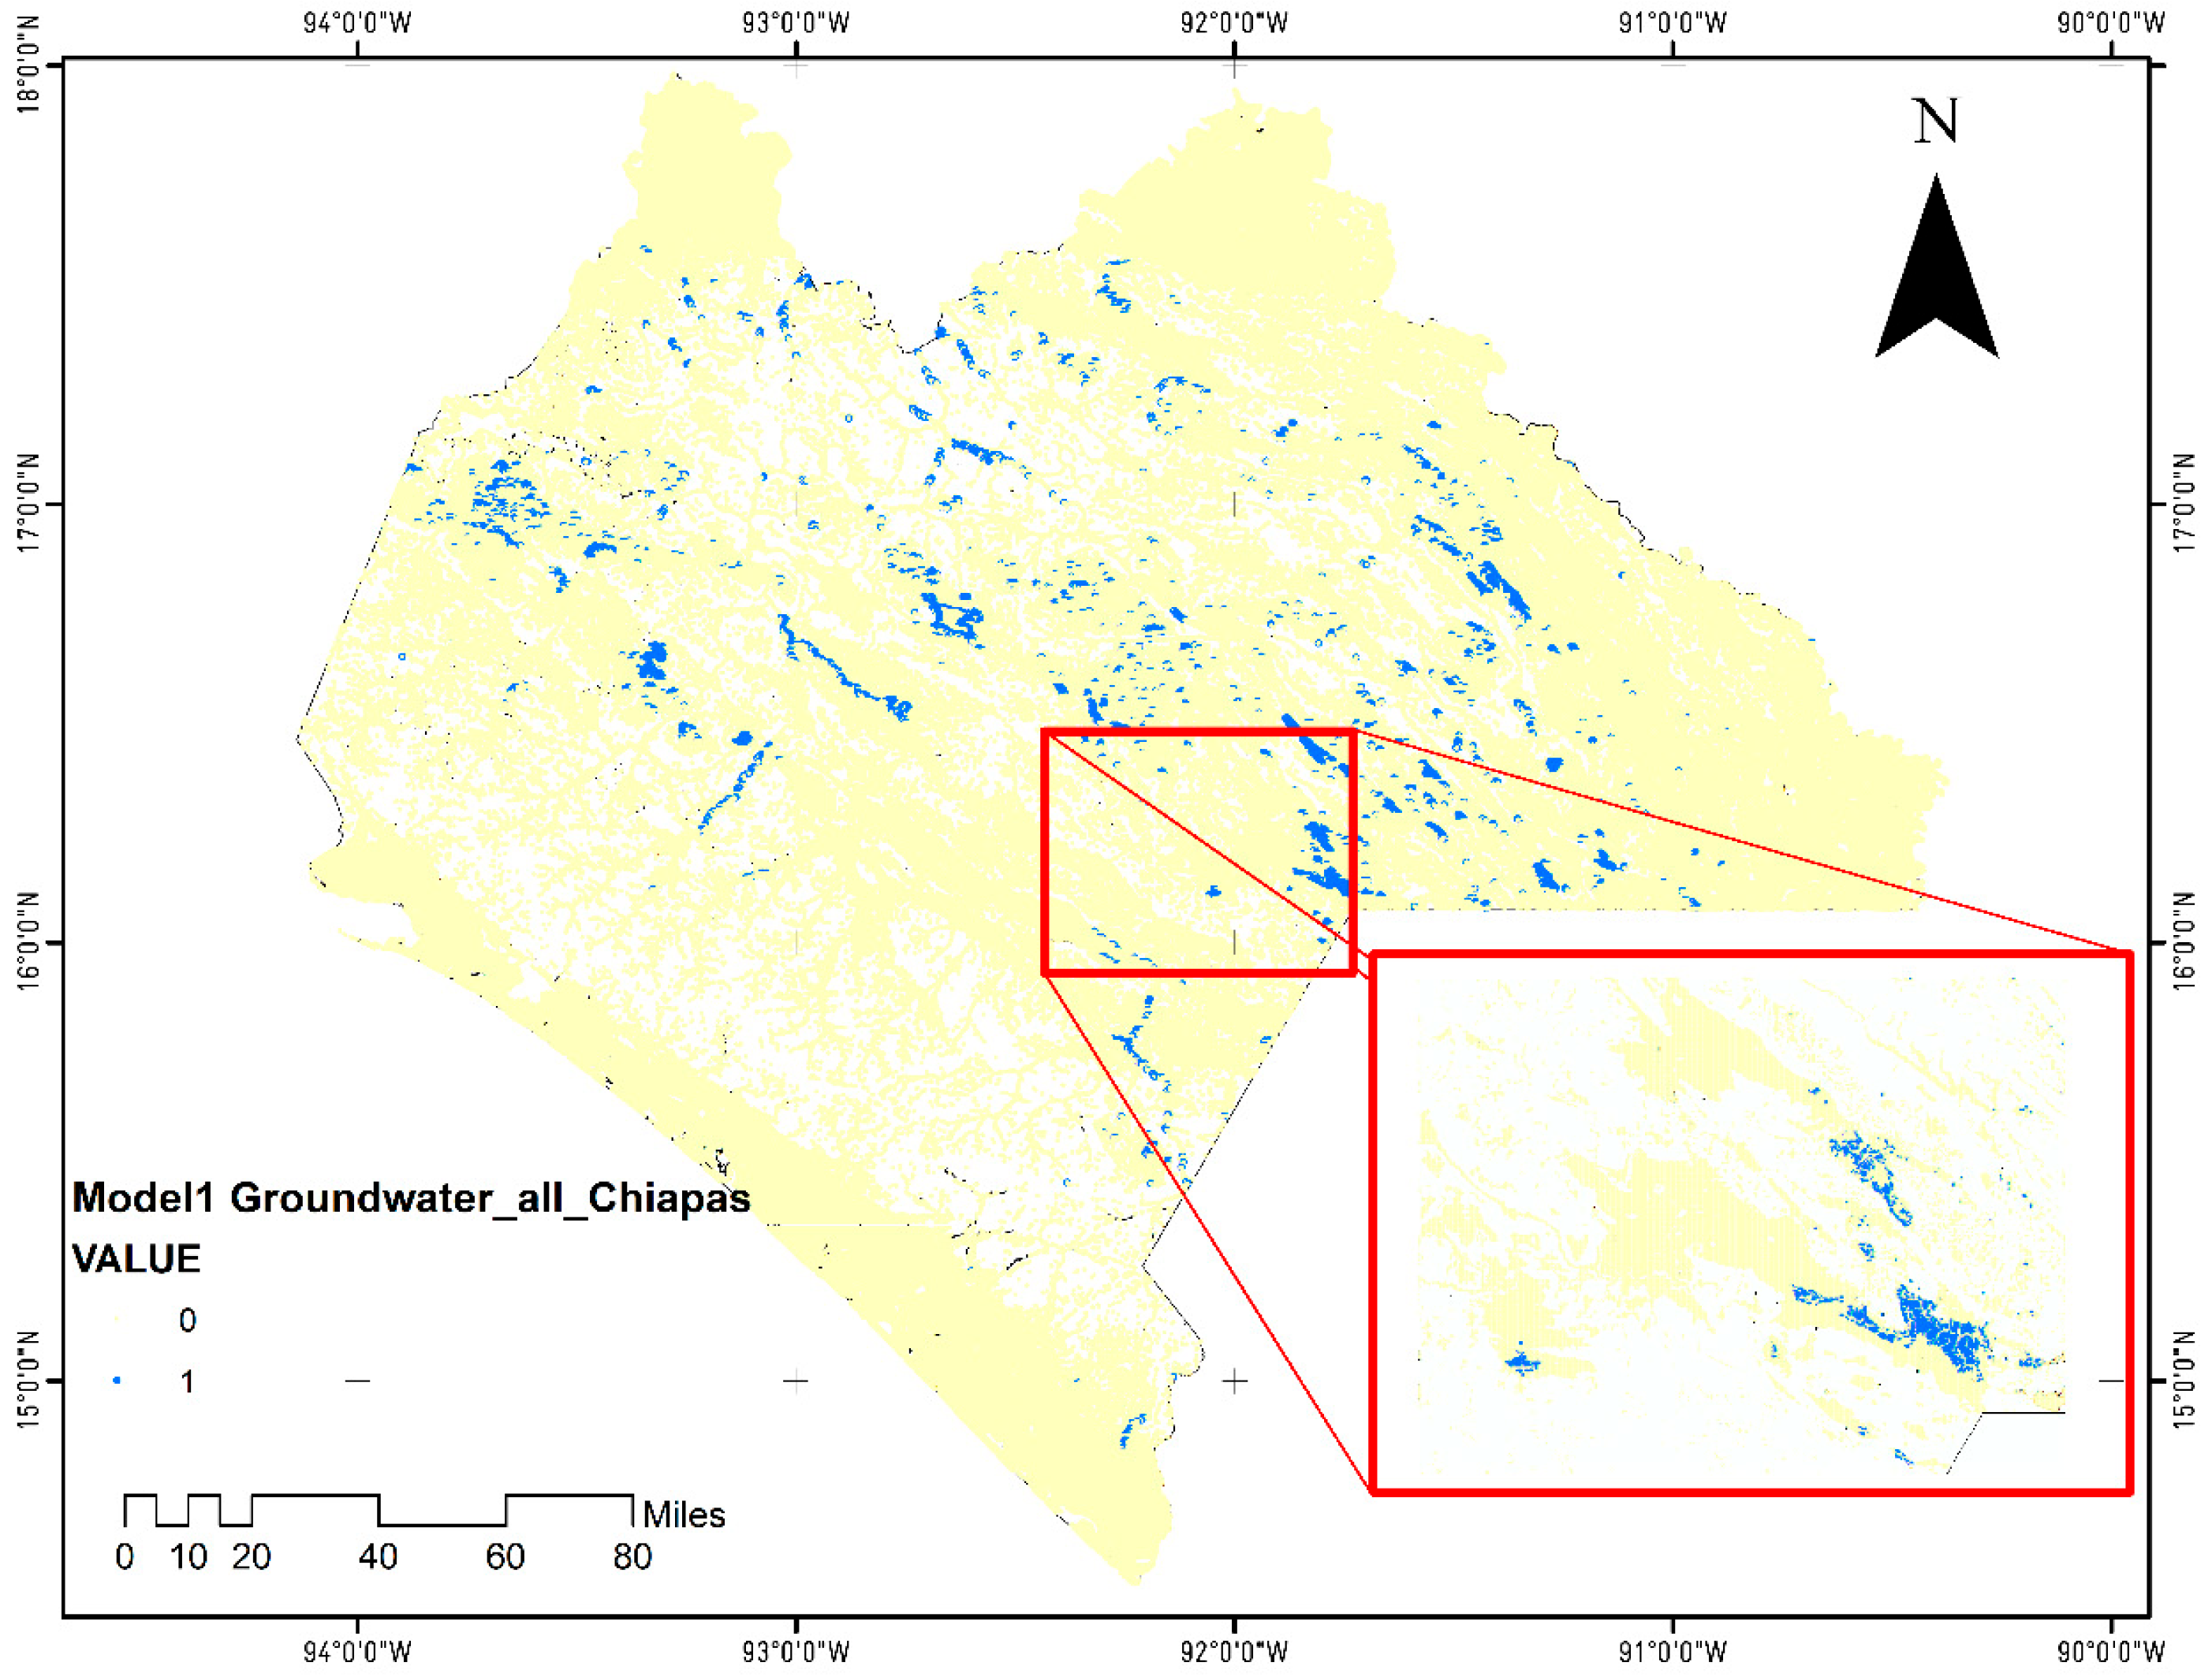
2.4. Model Outputs
3. Results
3.1. Model Clarification Conditions
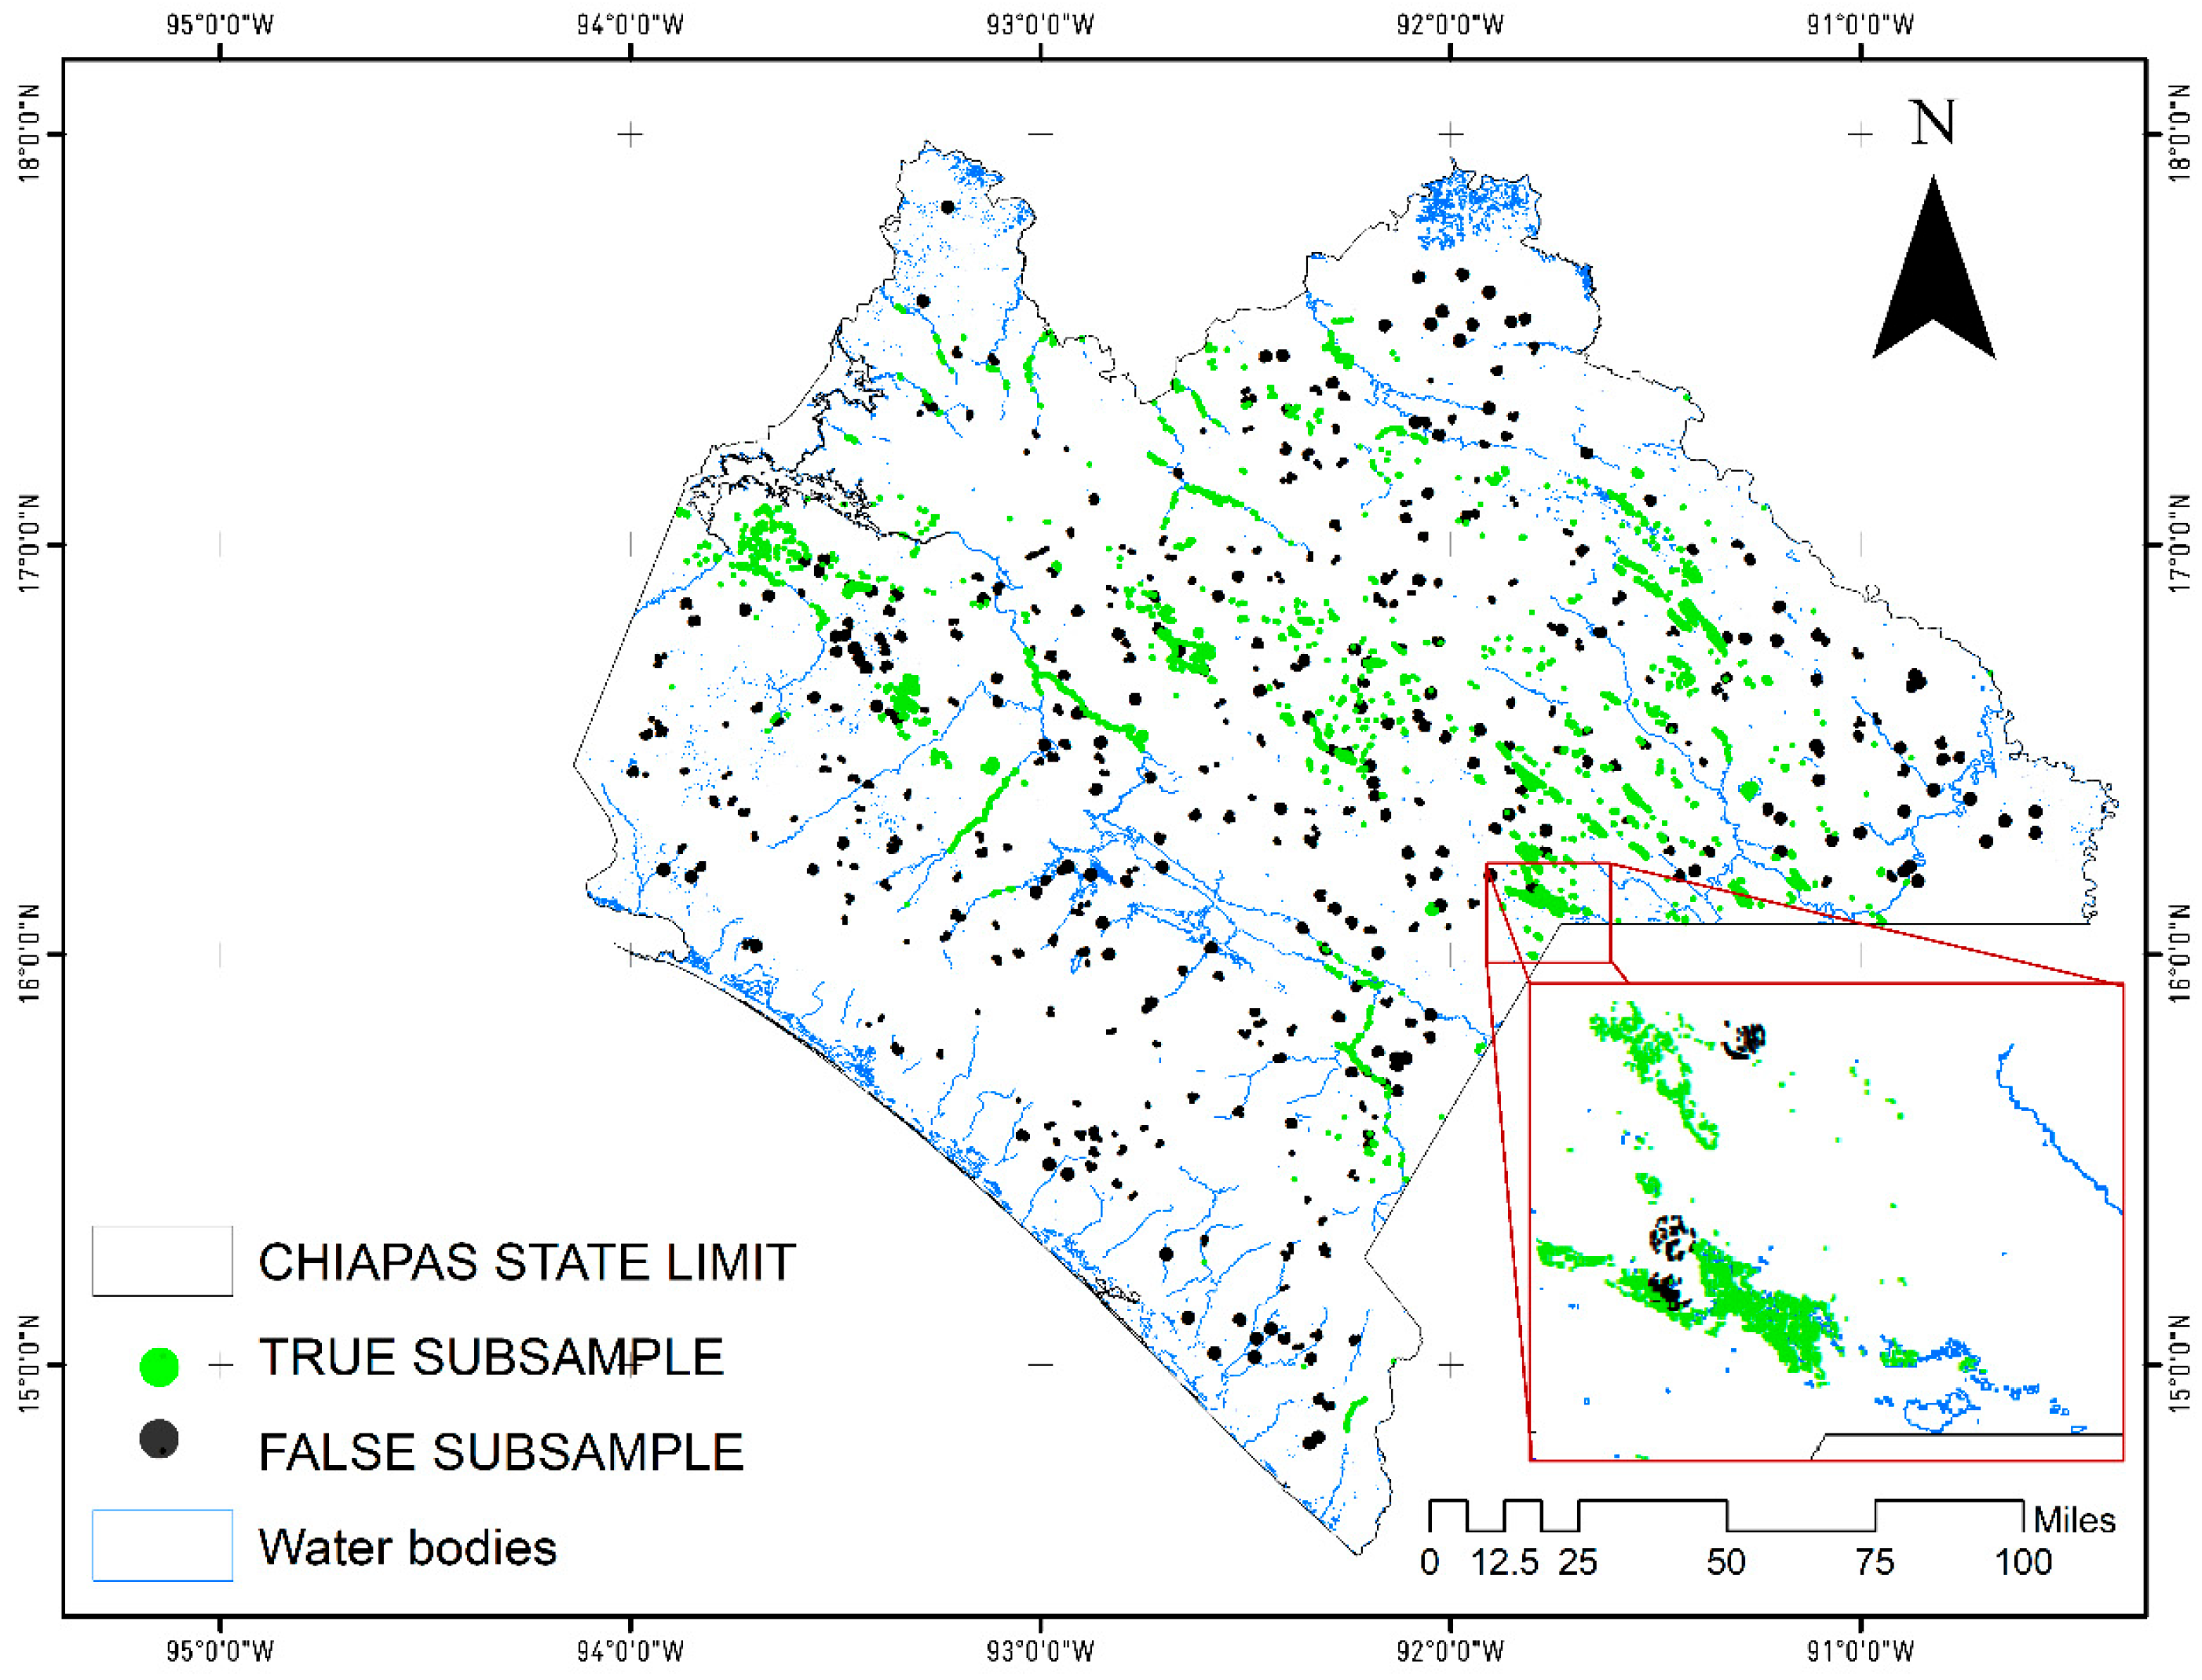
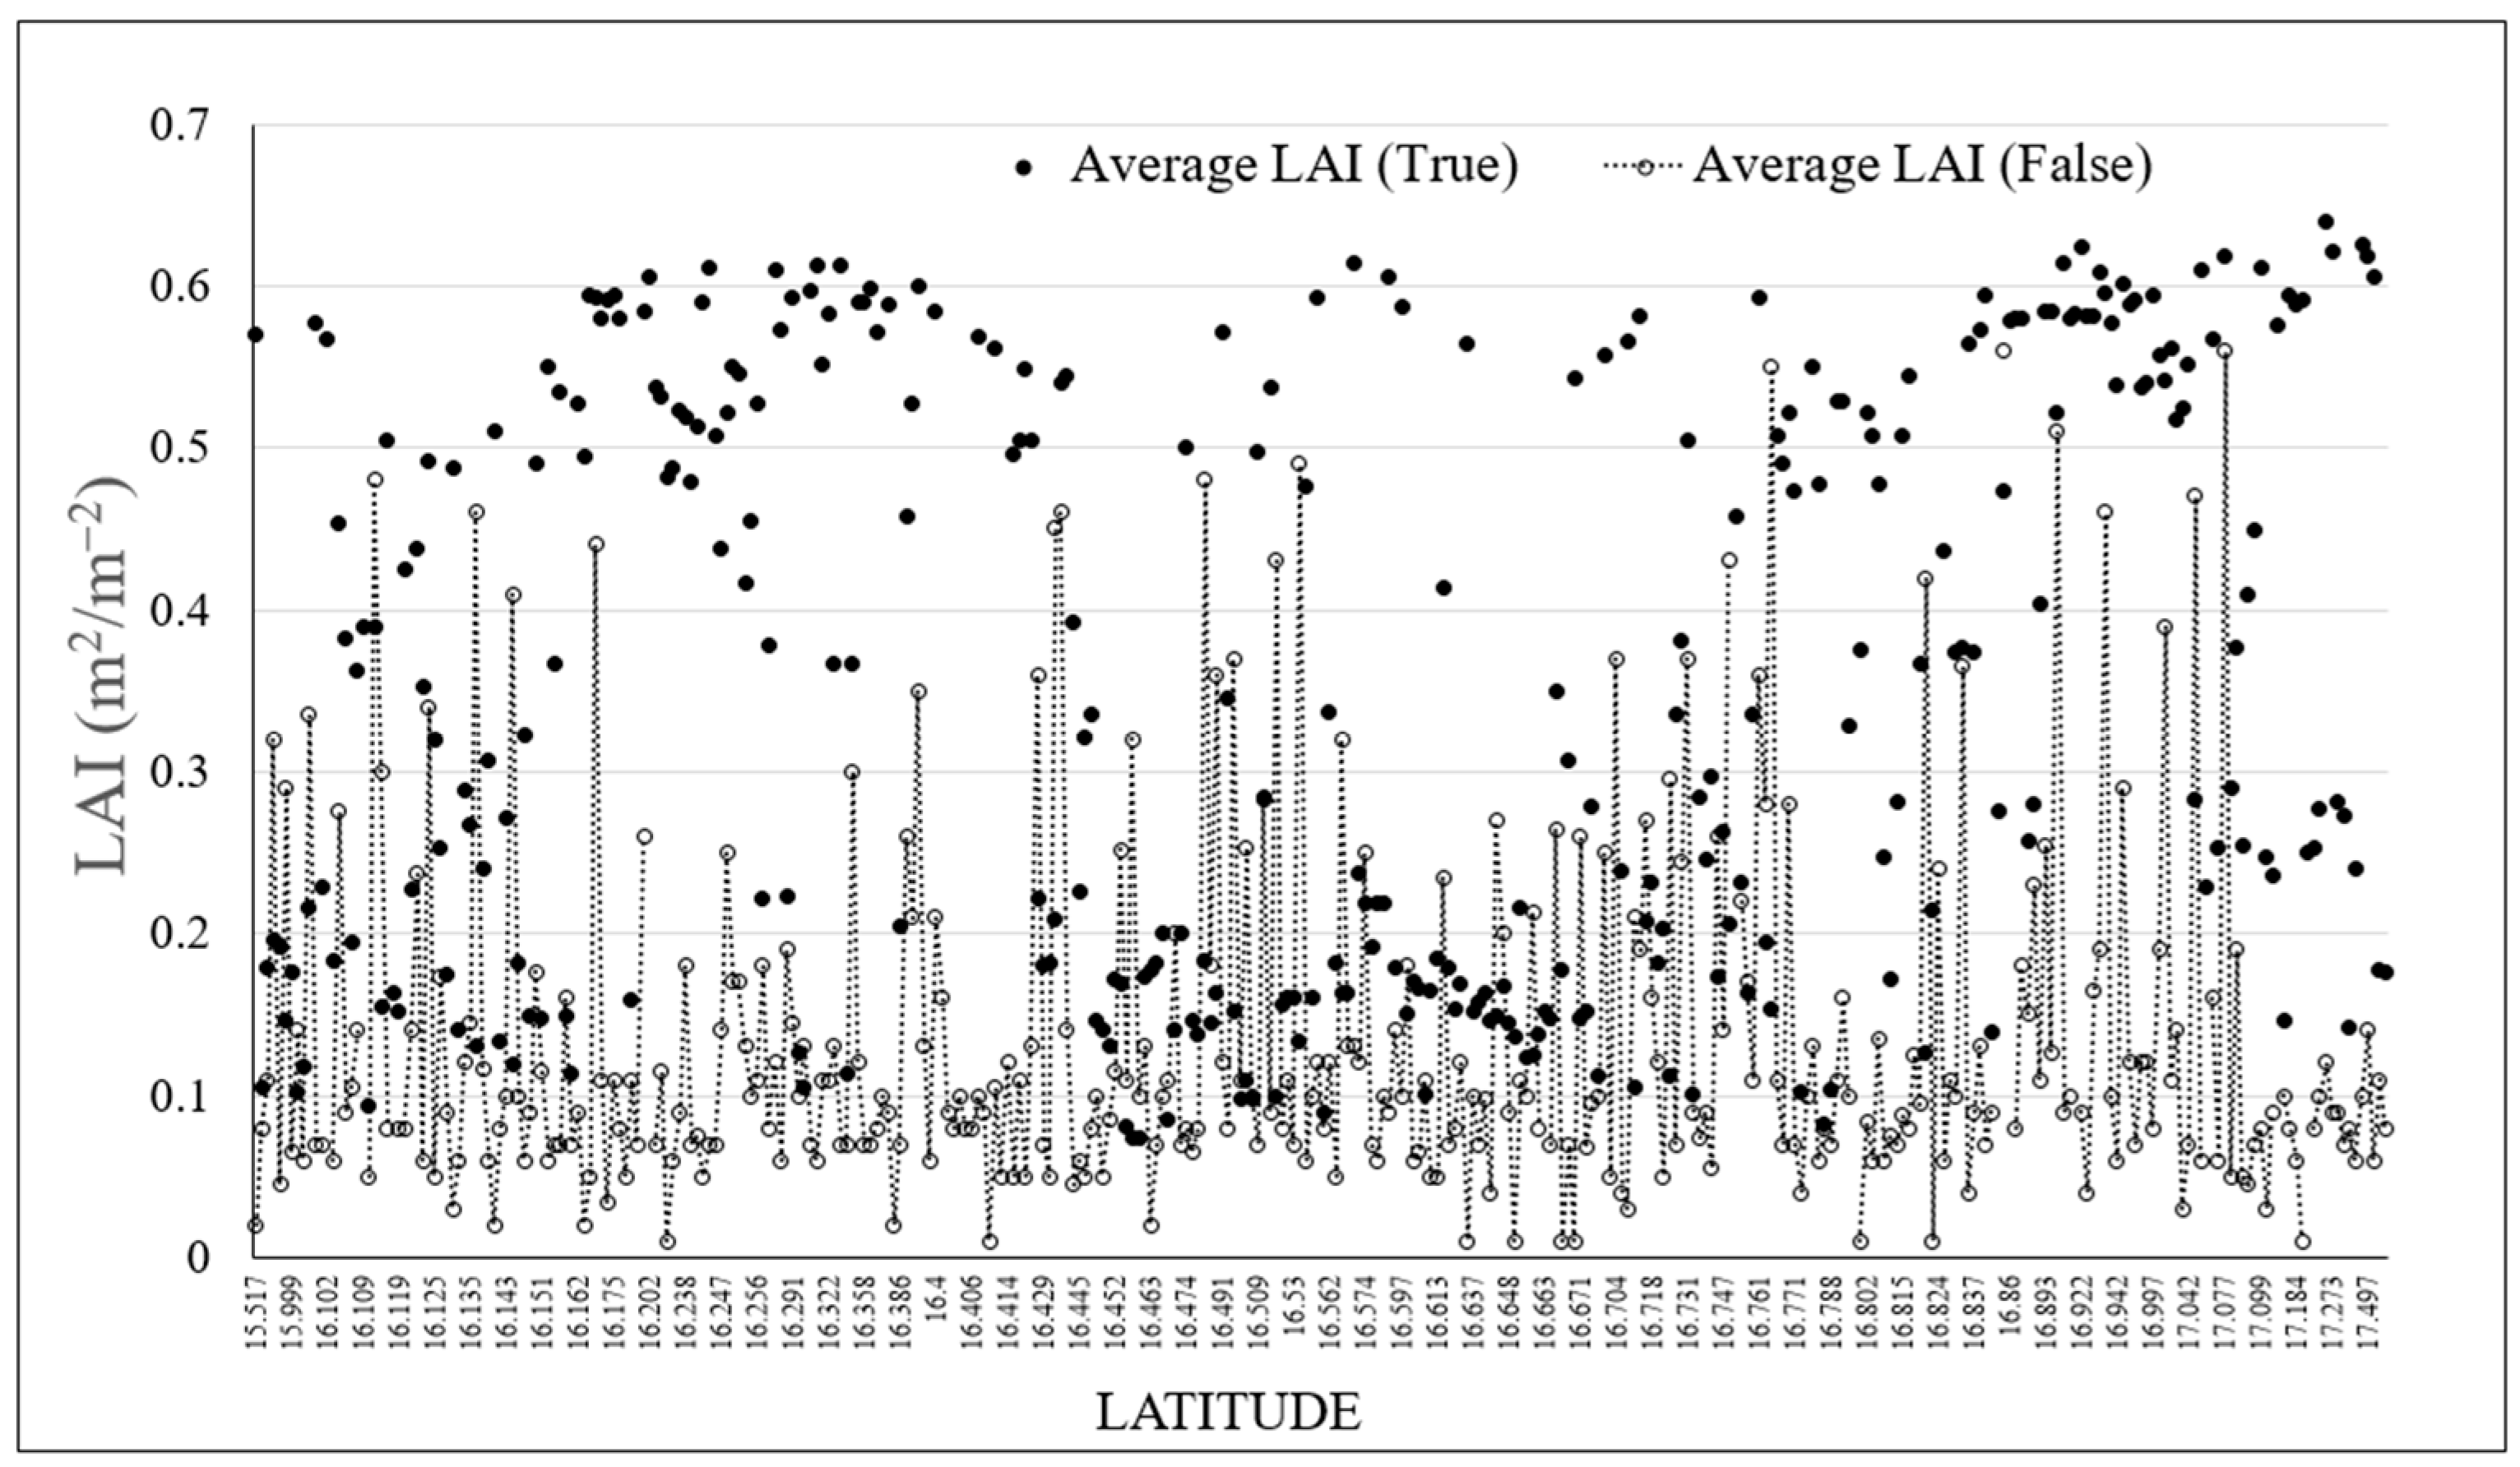
3.2. Random Selection Points
4. Discussion
Posing New Research Questions
- Defining threshold values for topographic indices was an essential step in this research. Further refinement of these thresholds can lead to more accurate identification of potential aquifer recharge zones. By refining the strata rank, we can explore different threshold values to optimize the model’s performance.
- As mentioned before, expanding the number of classes can provide a more detailed and nuanced understanding of potential recharge areas. This can help differentiate between various degrees of suitability for recharge and can be particularly useful for land management decisions.
- Adding new variables, such as soil moisture values and evapotranspiration, could enrich the analysis. The ET losses generally increase with increasing LAI across the whole soil textural gradient [58], and in combination with the soil moisture data, they can provide valuable information about the ecosystem’s capacity to facilitate groundwater recharge. Researchers have to consider how these variables interact with topographic indices.
- Improving the accuracy of location identification and the spatial distribution of potential recharge areas is a commendable goal. Fine-tuning of Model 1 and incorporating additional data could contribute to achieving this objective.
- It is necessary to validate and calibrate Model 1 using field data and observations. This step could help to ensure that the model’s predictions align with real-world conditions.
- Collaborating with experts from related fields, such as hydrology, ecology, and geology, would provide valuable insights and data sources to strengthen this research.
- The relevance of long-term monitoring to assess the actual effectiveness of identified recharge areas over time. This study can provide critical information for aquifer management and conservation efforts.
5. Conclusions
Author Contributions
Funding
Data Availability Statement
Acknowledgments
Conflicts of Interest
References
- Freeze, R.A.; Cherry, J.A. Groundwater; Prentice-Hall Inc.: Englewood Cliffs, NJ, USA, 1979. [Google Scholar]
- Perry, E.; Velazquez-Oliman, G.; Marin, L. The Hydrogeochemistry of the Karst Aquifer System of the Northern Yucatan Peninsula, Mexico. Int. Geol. Rev. 2002, 44, 191–221. [Google Scholar] [CrossRef]
- Escolero, O.; Marín, L.E.; Steinich, B.; Pacheco, J.A.; Molina-Maldonado, A.; Anzaldo, J.M. Geochemistry of the hydrogeological reserve of Mérida, Yucatán, Mexico. Geofísica Int. 2005, 44, 301–314. [Google Scholar] [CrossRef]
- Dikau, R.; Schmidt, J. Georeliefklassifikation. In Angewandte Landschaftsökologie; Schneider-Sliwa, R., Gerold, G., Schaub, D., Eds.; Springer: Berlin/Heidelberg, Germany, 1999. [Google Scholar] [CrossRef]
- Fränzle, O. Physische Geographie als quantitative Landschaftsforschung; Schriften des Geographischen Institutes der Universität Kiel: Kiel, Germany, 1971; Volume 37, pp. 297–312. [Google Scholar]
- Kugler, H. Das Georelief und Seine Kartographische Modellierung. Master’s Thesis, Martin-Luther-Universität Halle-Wittenberg, Halle, Germany, 1974. [Google Scholar]
- Prabhakar, A.; Tiwari, H. Land use and land cover effect on groundwater storage. Model. Earth Syst. Environ. 2015, 1, 45. [Google Scholar] [CrossRef]
- UNESCO World Water Assessment Programme. Facts and Figures; from the United Nations World Water Development Report 4: Managing Water Under Uncertainty and Risk. UNESDOC Digital Library. Available online: https://unesdoc.unesco.org/ark:/48223/pf0000215492 (accessed on 18 May 2025).
- Dile, Y.T.; Tekleab, S.; Ayana, E.K.; Gebrehiwot, S.G.; Worqlul, A.W.; Bayabil, H.K.; Yimam, Y.T.; Tilahun, S.A.; Daggupati, P.; Karlberg, L.; et al. Advances in water resources research in the Upper Blue Nile basin and the way forward: A review. J. Hydrol. 2018, 560, 407–423. [Google Scholar] [CrossRef]
- Chung, I.-M.; Sophocleous, M.A.; Mitiku, D.B.; Kim, N.W. Estimating groundwater recharge in the humid and semi-arid African regions. Geosci. J. 2016, 20, 731–744. [Google Scholar] [CrossRef]
- Nimmo, J.; Stonestrom, D.A.; Healy, R.W. Aquifers: Recharge. In Fresh Water and Watersheds, 2nd ed.; CRC Press: Boca Raton, FL, USA, 2020; pp. 11–15. [Google Scholar]
- Kebede, S. Groundwater in Ethiopia; Springer: Berlin/Heidelberg, Germany, 2013; ISBN 978-3-642-30390-6. [Google Scholar]
- Negm, A.; Abdrakhimova, P.; Hayashi, M.; Rasouli, K. Effects of climate change on depression-focused groundwater recharge in the Canadian Prairies. Vadose Zone J. 2021, 20, e20153. [Google Scholar] [CrossRef]
- Sherif, M.; Sefelnasr, A.; Al Rashed, M.; Alshamsi, D.; Zaidi, F.K.; Alghafli, K.; Baig, F.; Al-Turbak, A.; Alfaifi, H.; Loni Allfouza, O.; et al. A Review of Managed Aquifer Recharge Potential in the Middle East and North Africa Region with Examples from the Kingdom of Saudi Arabia and the United Arab Emirates. Water 2023, 15, 742. [Google Scholar] [CrossRef]
- Pierce, S.A.; Sharp, J.M.; Guillaume, J.H.A.; Mace, R.E.; Eaton, D.J. Aquifer-yield continuum as a guide and typology for science-based groundwater management. Hydrogeol. J. 2013, 21, 331–340. [Google Scholar] [CrossRef]
- Zhou, Y. A critical review of groundwater budget myth, safe yield and sustainability. J. Hydrol. 2009, 370, 207–213. [Google Scholar] [CrossRef]
- Green, T.R.; Taniguchi, M.; Kooi, H.; Gurdak, J.J.; Allen, D.M.; Hiscock, K.M.; Treidel, H.; Aureli, A. Beneath the surface of global change: Impacts of climate change on groundwater. J. Hydrol. 2011, 405, 532–560. [Google Scholar] [CrossRef]
- Holman, I.P. Climate change impacts on groundwater recharge-uncertainty, shortcomings, and the way forward? Hydrogeol. J. 2006, 14, 37–647. [Google Scholar] [CrossRef]
- Sutinen, R.; Hänninen, P.; Venäläinen, A. Effect of mild winter events on soil water content beneath snowpack. Cold Reg. Sci. Technol. 2008, 51, 56–67. [Google Scholar] [CrossRef]
- Crosbie, R.S.; Scanlon, B.R.; Mpelasoka, F.S.; Reedy, R.C.; Gates, J.B.; Zhang, L. Potential climate change effects on groundwater recharge in the High Plains Aquifer, USA. Water Resour. Res. 2013, 49, 3936–3951. [Google Scholar] [CrossRef]
- Eckhardt, K.; Ulbrich, U. Potential impacts of climate change on groundwater recharge and streamflow in a central European low mountain range. J. Hydrol. 2003, 284, 244–252. [Google Scholar] [CrossRef]
- Jyrkama, M.I.; Sykes, J.F. The impact of climate change on spatially varying groundwater recharge in the Grand River watershed. J. Hydrol. 2007, 338, 237–250. [Google Scholar] [CrossRef]
- de Vries, J.J.; Simmers, I. Groundwater recharge: An overview of processes and challenges. Hydrogeol. J. 2002, 10, 5–17. [Google Scholar] [CrossRef]
- Greenwood, W.J.; Buttle, J.M. Land cover controls on depression-focused recharge on the Oak Ridges Moraine, southern Ontario. Canada. Hydrol. Process. 2018, 32, 1909–1926. [Google Scholar] [CrossRef]
- Izbicki, J.A.; Radyk, J.; Michel, R.L. Water movement through a thick unsaturated zone underlying an intermittent stream in the western Mojave Desert, southern California, USA. J. Hydrol. 2000, 238, 194–217. [Google Scholar] [CrossRef]
- Scanlon, B.R.; Keese, K.E.; Flint, A.L.; Flint, L.E.; Gaye, C.B.; Edmunds, W.M.; Simmers, I. Global synthesis of groundwater recharge in semiarid and arid regions. Hydrol. Process. 2006, 20, 3335–3370. [Google Scholar] [CrossRef]
- Ford, D.; Williams, P. Karst Hydrogeology and Geomorphology; John Wiley & Sons: Hoboken, NJ, USA, 2007; 562p. [Google Scholar]
- Abdelkareem, M.; El-Baz, F. Analyses of optical images and radar data reveal structural features and predict groundwater accumulations in the central Eastern Desert of Egypt. Arab. J. Geosci. 2015, 8, 2653–2666. [Google Scholar] [CrossRef]
- Hayashi, M.; van Der Kamp, G.; Schmidt, R. Focused infiltration of snowmelt water in partially frozen soil under small depressions. J. Hydrol. 2003, 270, 214–229. [Google Scholar] [CrossRef]
- Pardo-Igúzquiza, E.; Dowd, P.A. Fractal analysis of karst landscapes. Math. Geosci. 2020, 52, 543–563. [Google Scholar] [CrossRef]
- Wang, D.; Shu, L. Late Mesozoic basin and range tectonics and related magmatism in Southeast China. Geosci. Front. 2012, 3, 109–124. [Google Scholar] [CrossRef]
- Kuzucuoglu, C.; Parish, R.; Karabiyikoglu, M. The dune systems of the Konya plain (Turkey): Their relation to environmental changes in Central Anatolia during the late Pleistocene and Holocene. Geomorphology 1998, 23, 257–271. [Google Scholar] [CrossRef]
- Briere, P.R. Playa, playa lake, sebkha: Proposed definitions for old terms. J. Arid. Environ. 2000, 45, 1–7. [Google Scholar] [CrossRef]
- Aref, M.A.M.; El-Khoriby, E.; Hamdan, M.A. The role of salt weathering in the origin of the Qattara Depression, Western Desert, Egypt. Geomorphology 2002, 45, 181–195. [Google Scholar] [CrossRef]
- Martínez, F.; Gonzalez, R.; Bascuñan, S.; Arriagada, C. Structural styles of the Salar de Punta Negra Basin in the Preandean depression (24°–25°S) of the Central Andes. J. S. Am. Earth Sci. 2018, 87, 188–199. [Google Scholar] [CrossRef]
- García, H.P.A.; Gianni, G.M.; Lupari, M.N.; Sánchez, M.A.; Soler, S.R.; Ruiz, F.; Kinger, F.G.L. Effective elastic thickness in the Central Andes. Correlation to orogenic deformation styles and lower crust high-gravity anomaly. J. S. Am. Earth Sci. 2018, 87, 232–246. [Google Scholar] [CrossRef]
- Leeuw, A.D.; Mandic, O.; Krijgsman, W.; Kuiper, K.; Hrvatovic, H. Paleomagnetic and geochronologic constrains on the geodynamic evolution of the Central Dinarides. Tectonophysics 2012, 530–531, 286–298. [Google Scholar] [CrossRef]
- Bonacci, O. Poljes, ponors and their cathchments. In Treatise on Geomorphology. Karst Geomorphology; Shroder, J.F., Frumkin, A., Eds.; Academic Press: San Diego, CA, USA, 2013; Volume 6, pp. 112–120. [Google Scholar]
- Meneghel, M.; Sauro, U. Dolines of karstic and periglacial origin in the high mountain karst of Pale di San Martino plateau (Dolomites). Z. Geomorphol. Suppl. Issues 2006, 50, 63–76. [Google Scholar] [CrossRef]
- Kranjc, A. Classification of closed depressions in carbonate karst. In Treatise on Geomorphology. Karst Geomorphology; Shroder, J.F., Frumkin, A., Eds.; Academic Press: San Diego, CA, USA, 2013; Volume 6, pp. 104–111. [Google Scholar]
- White, W.B.; White, E.L. Size scales for closed depression landforms: The place of tiankengs. Spelogenesis Evol. Karst Acquifers 2006, 4, 1–10. [Google Scholar]
- Gabrovšek, F.; Stepišnik, U. On the formation of collapse dolines: A modelling perspective. Geomorphology 2011, 134, 23–31. [Google Scholar] [CrossRef]
- Monroe, W.H. A Glossary of Karst Terminology; Water Supply Paper; The US Government Publishing Office: New York, NY, USA, 1972; 29p. [Google Scholar]
- Claps, P.; Fiorentino, M.; Oliveto, G. Informational entropy of fractal river networks. J. Hydrol. 1996, 187, 145–156. [Google Scholar] [CrossRef]
- Instituto Nacional de Estadística, y Geografía (INEGI). Continuo de elevaciones mexicano y modelos digitales de elevación. 2013. Available online: https://www.inegi.org.mx/app/geo2/elevacionesmex/ (accessed on 15 May 2025).
- Comisión para el Conocimiento y Uso de la Biodiversidad (CONABIO). La Biodiversidad en Chiapas: Estudio de Estado. Tuxtla Gutiérrez, Chiapas: Gobierno del Estado de Chiapas. 2013. Available online: https://www.biodiversidad.gob.mx/region/eeb/estudios/ee_chiapas (accessed on 18 May 2025).
- Galicia-Luna, V.J. Cartografías del Deseo en Chiapas: Entre la Conservación y el Extractivismo (Tesis de Maestría). El Colegio de la Frontera Sur, San Cristobal de las Casas, Chiapas. Available online: http://ecosur.repositorioinstitucional.mx/jspui/handle/1017/1519 (accessed on 18 May 2025).
- Mora, J.C.; Jaimes-Viera, M.C.; Garduño-Monroy, V.H.; Layer, P.W.; Pompa-Mera, V.; Godinez, M.L. Geology and geochemistry characteristics of the Chiapanecan Volcanic Arc (Central Area), Chiapas Mexico. J. Volcanol. Geotherm. Res. 2007, 162, 43–72. [Google Scholar] [CrossRef]
- Pantoja-Alor, J. Contribución a la geocronología del Estado de Chiapas: Mexico, D.F. Boletín Asoc. Mex. De Geólogos Petroleros 1974, 26, 29. [Google Scholar]
- López-Ramos, E. Carta Geológica del Estado de Chiapas: Mexico, D.F. Universidad Nacional Autónoma de México, Instituto de Geología, Escala 1:500,000; Universidad Nacional Autónoma de México, Instituto de Geología: Ciudad de Mexico, Mexico, 1975. [Google Scholar]
- Salas, G.P. Carta y Provincias Metalogenéticas de la Republica Mexicana; 21-E; Consejo de Recursos Minerales: Ciudad de Mexico, Mexico, 1975; Volume 21, 242p. [Google Scholar]
- Castro-Mora, J. Monografía Geológico-Minera del Estado de Chiapas; Consejo de Recursos Minerales: Ciudad de Mexico, Mexico, 1999; 178p. [Google Scholar]
- Kadam, A.K.; Umrikar, B.N.; Sankhua, R.N. Assessment of recharge potential zones for groundwater development and management using geospatial and MCDA technologies in semiarid region of Western India. SN Appl. Sci. 2020, 2, 312. [Google Scholar] [CrossRef]
- Gary, M. Understanding Zacatón: Exploration and initial interpretation of the worlds deepest known phreatic sinkhole and related karst features, southern Tamaulipas, Mexico. Karst Waters Inst. Spec. Publ. 2002, 7, 141–145. [Google Scholar]
- Guerra, V.; Lazzari, M. Geomorphological mapping as a tool for geoheritage inventory and geotourism promotion: A case study from the middle vallye of Marecchia river (northen Italy). Géomorphologie 2021, 27, 127–145. [Google Scholar] [CrossRef]
- Planchon, O.; Darboux, F. A fast, simple and versatile algorithm to fill the depressions of digital elevation models. Catena 2001, 46, 159–176. [Google Scholar] [CrossRef]
- Fang, H.; Baret, F.; Plummer, S.; Schaepman-Strub, G. An Overview of Global Leaf Area Index (LAI): Methods, Products, Validation, and Applications. Rev. Geophys. 2019, 57, 739–799. [Google Scholar] [CrossRef]
- Simic, A.; Fernandes, R.; Wang, S. Assessing the Impact of Leaf Area Index on Evapotranspiration and Groundwater Recharge across a Shallow Water Region for Diverse Land Cover and Soil Properties. J. Water Resour. Hydraul. Eng. 2014, 3, 60–73. [Google Scholar]
- Myneni, R.; Knyazikhin, Y.; Park, T. MOD15A2H MODIS Leaf Area Index/FPAR 8-Day L4 Global 500m SIN Grid V006. NASA EOSDIS Land Processes DAAC. Available online: https://modis.gsfc.nasa.gov/data/dataprod/mod15.php (accessed on 9 September 2023).
- Goldin, A.; Nimios, T. Vegetation Patterns on Limestone and Acid Parent Materials in the Garnet Mountains of Western Montana. Northwest Sci. 1977, 51, 149–160. [Google Scholar]
- Somaratne, N. Characteristics of Point Recharge in Karst Aquifers. Water 2014, 6, 2782–2807. [Google Scholar] [CrossRef]
- Hayes, A. Descriptive Statistics: Definition, Overview, Types, Example. [Revised: 28 September 2023]. 2023. Available online: https://www.investopedia.com/terms/d/descriptive_statistics.asp (accessed on 18 May 2025).
- Dwevedi, A.; Kumar, P.; Kumar, P.; Kumar, Y.; Sharma, Y.K.; Kayastha, A.M. Soil sensors: Detailed insight into research updates, significance, and future prospects. In New Pesticides and Soil Sensors; Academic Press: Cambridge, MA, USA, 2017; pp. 561–594. [Google Scholar] [CrossRef]
- Dingman, S.L. Physical Hydrology; Prentice Hall, Inc.: Englewood Cliffs, NJ, USA, 1994. [Google Scholar]
- Thurow, T.L.; Blackburn, W.H.; Taylor, C.A. Hydrologic characteristics of vegetation types as affected by livestock grazing systems, Edward Plateau, Texas. J. Range Manag. 1986, 39, 505–508. [Google Scholar] [CrossRef]
- Emerson, W.W.; Bond, R.D.; Dexter, A.R. Modification of Soil Structure; John Wiley: New York, NY, USA, 1978. [Google Scholar]
- Batelaan, O.; De Smedt, F. GIS-based recharge estimation by coupling surface-subsurface water balances. J. Hydrol. 2007, 337, 355. [Google Scholar] [CrossRef]

| Type | Characteristics |
|---|---|
| Sandstone | Sandstone is often highly permeable due to its well-connected pore spaces. Water can flow through sandstone relatively easily, promoting groundwater recharge. |
| Limestone (e.g., karst) | Limestone is known for developing karst landscapes, characterized by features like sinkholes, caves, and underground rivers. These features enhance water infiltration and contribute to groundwater recharge. |
| Gravel and conglomerate | Rocks composed of gravel and conglomerate have high porosity, allowing water to move through the interconnected pore spaces. This facilitates groundwater movement and recharge. |
| Fractured igneous and metamorphic rocks | While igneous and metamorphic rocks are generally less porous, fractures and faults within these rocks can create pathways for water. Fractured rocks contribute to localized groundwater recharge. |
| Volcanic rocks (e.g., basalt) | Volcanic rocks often have vesicles (voids left by gas bubbles) and fractures that enhance permeability, supporting groundwater movement. |
| Sedimentary deposits (alluvial and fluvial) | Alluvial and fluvial deposits, such as those found in river valleys, often consist of well-sorted sediments like sand and gravel. These sediments promote both surface water infiltration and groundwater recharge. |
| Porous and permeable sedimentary rocks (e.g., sand and siltstone) | Sedimentary rocks with well-defined pore spaces, such as sandstone and siltstone, allow the movement of water. These rocks can contribute to groundwater recharge. |
| Model ID | Closed Depressions (Unitless; Rank) | Convergence Index (Unitless; Rank) |
|---|---|---|
| Model l * | 40–80 | −5.61–10.95 |
| Model 2 | 80–120 | 10.95–14.00 |
| Model 3 | 120–200 | 14.00–18.00 |
| Model 4 | 200–266 | 18.00–30.00 |
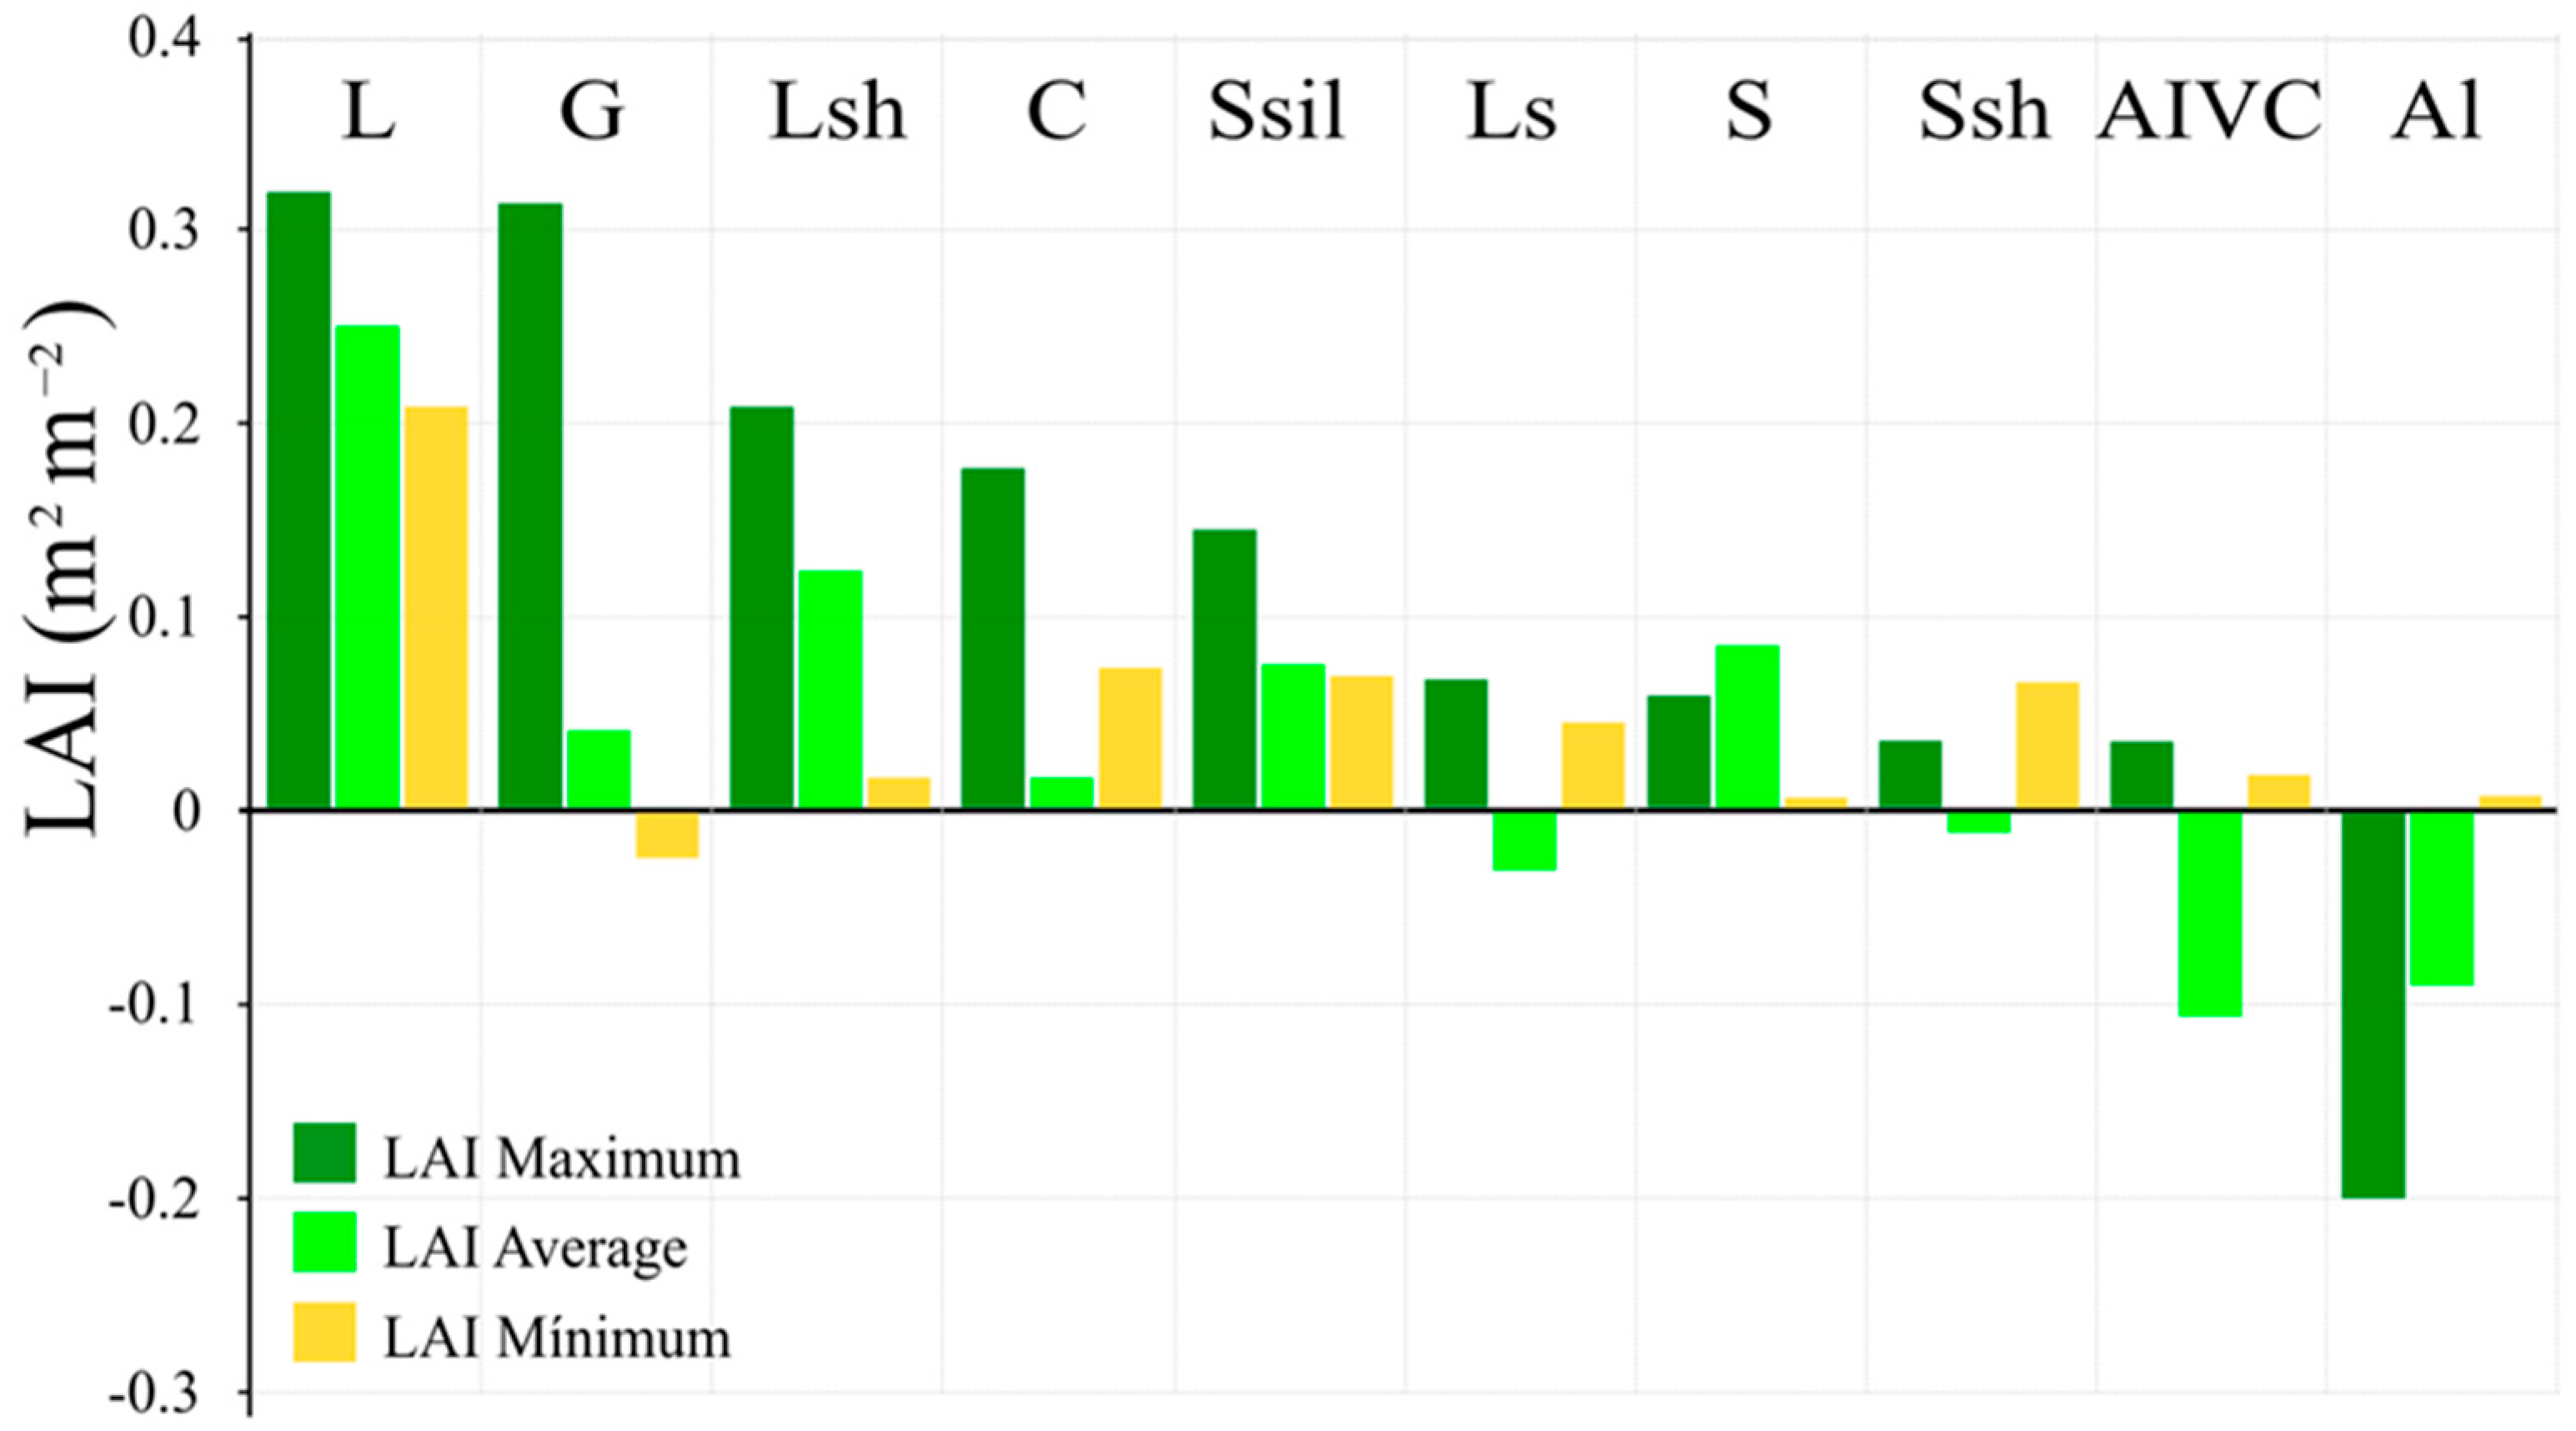
| TYPE | False: LMn | True: LMn | DIF | False: LMean | True: LMean | DIF | False: LMx | True: LMx | DIF |
|---|---|---|---|---|---|---|---|---|---|
| Limestone (L) | 0.14 | 0.35 | 0.21 | 0.34 | 0.59 | 0.25 | 0.43 | 0.75 | 0.32 |
| Granite (G) | 0.10 | 0.08 | −0.03 | 0.23 | 0.27 | 0.04 | 0.26 | 0.58 | 0.31 |
| Sandstone shale (SSh) | 0.10 | 0.17 | 0.07 | 0.43 | 0.42 | −0.01 | 0.52 | 0.56 | 0.04 |
| Alluvial (Al) | 0.16 | 0.07 | −0.09 | 0.15 | 0.16 | 0.01 | 0.56 | 0.36 | −0.20 |
| Sandstone siltstone (Ssil) | 0.02 | 0.09 | 0.07 | 0.23 | 0.31 | 0.08 | 0.34 | 0.48 | 0.14 |
| Sandstone (S) | 0.03 | 0.12 | 0.09 | 0.22 | 0.23 | 0.01 | 0.31 | 0.37 | 0.06 |
| Andesite–intermediate volcanic crust (AIVC) | 0.06 | 0.08 | 0.02 | 0.47 | 0.37 | −0.11 | 0.57 | 0.61 | 0.04 |
| Limestone–sandstone (Ls) | 0.02 | 0.07 | 0.05 | 0.15 | 0.12 | −0.03 | 0.19 | 0.26 | 0.07 |
| Limestone–shale (Lsh) | 0.07 | 0.08 | 0.02 | 0.16 | 0.28 | 0.12 | 0.22 | 0.42 | 0.21 |
| Conglomerate (C) | 0.02 | 0.10 | 0.07 | 0.17 | 0.19 | 0.02 | 0.19 | 0.37 | 0.18 |
| Andesite (A) | 0.04 | NO DATA | 0.11 | NO DATA | 0.19 | NO DATA | |||
| Sandstone conglomerate (Sc) | 0.05 | NO DATA | 0.17 | NO DATA | 0.21 | NO DATA | |||
| Metamorphic complex (Mc) | 0.14 | NO DATA | 0.21 | NO DATA | 0.24 | NO DATA | |||
| Shale (Sh) | 0.06 | NO DATA | 0.28 | NO DATA | 0.34 | NO DATA | |||
| Granodiorite (Gr) | 0.03 | NO DATA | 0.20 | NO DATA | 0.27 | NO DATA | |||
| Lake | 0.06 | NO DATA | 0.18 | NO DATA | 0.22 | NO DATA | |||
Disclaimer/Publisher’s Note: The statements, opinions and data contained in all publications are solely those of the individual author(s) and contributor(s) and not of MDPI and/or the editor(s). MDPI and/or the editor(s) disclaim responsibility for any injury to people or property resulting from any ideas, methods, instructions or products referred to in the content. |
© 2025 by the authors. Licensee MDPI, Basel, Switzerland. This article is an open access article distributed under the terms and conditions of the Creative Commons Attribution (CC BY) license (https://creativecommons.org/licenses/by/4.0/).
Share and Cite
Manuel, R.-M.V.; Gunter, K.T. Parsimonious Model of Groundwater Recharge Potential as Seen Related with Two Topographic Indices and the Leaf Area Index. Hydrology 2025, 12, 127. https://doi.org/10.3390/hydrology12060127
Manuel R-MV, Gunter KT. Parsimonious Model of Groundwater Recharge Potential as Seen Related with Two Topographic Indices and the Leaf Area Index. Hydrology. 2025; 12(6):127. https://doi.org/10.3390/hydrology12060127
Chicago/Turabian StyleManuel, Rodríguez-Moreno Victor, and Kretzschmar Thomas Gunter. 2025. "Parsimonious Model of Groundwater Recharge Potential as Seen Related with Two Topographic Indices and the Leaf Area Index" Hydrology 12, no. 6: 127. https://doi.org/10.3390/hydrology12060127
APA StyleManuel, R.-M. V., & Gunter, K. T. (2025). Parsimonious Model of Groundwater Recharge Potential as Seen Related with Two Topographic Indices and the Leaf Area Index. Hydrology, 12(6), 127. https://doi.org/10.3390/hydrology12060127