Article

Using High-Resolution Flood Hazard and Urban Heat Island Maps for High-Priority BGI Placement at the City Scale

by
Stefan Reinstaller
*,
Albert Wilhelm König
and
Dirk Muschalla
Institute of Urban Water Management and Landscape Water Engineering, Graz University of Technology, 8010 Graz, Austria
*
Author to whom correspondence should be addressed.
Hydrology 2025, 12(5), 125; https://doi.org/10.3390/hydrology12050125
Submission received: 22 April 2025 / Revised: 9 May 2025 / Accepted: 13 May 2025 / Published: 20 May 2025
(This article belongs to the Special Issue Advances in Urban Hydrology and Stormwater Management)

Abstract

This study presents a general workflow for creating a priority map for blue–green infrastructure (BGI) placement at the city scale, incorporating model-based benefit analysis. This workflow generates a BGI priority map, combining flood hazard and urban heat island maps, that guarantees multi-functional requirements are met. This approach was applied at a small study site in Feldbach, Austria. In the second part, we used the priority map generated to implement six BGI strategies in an integrated 1D-2D urban flood model and a semi-distributed hydrological model at high-priority and low-priority locations. The use of the efficiency index (EImod) enabled a multi-objective assessment. The results indicate that all the strategies led to a higher EImod when implemented in high-priority locations compared to low-priority locations. Our findings demonstrate that priority maps support decision making regarding where strategies should be implemented, providing remarkable benefits for water management objectives. Additionally, the findings highlight the importance of incorporating potential flooding areas to enhance prioritisation regarding flood hazard indicators. In future assessments, economic parameters, such as cost considerations, should also be integrated in order to optimise BGI placement efficiency.

1. Introduction

In recent decades, floods have been one of the most frequent natural hazards, primarily because of anthropogenic climate change [1,2]. The global annual cost of flood-related damage is estimated to be USD 143 billion, and this is likely an underestimate [3]. Numerous storm events, such as Hurricane Ida in the United States [4,5] or the European summer floods of 2021 in Germany, Belgium, and the Netherlands [6], have highlighted the need for effective stormwater management. Urban areas are vulnerable because of their high population densities and infrastructure exposure. Therefore, a fundamental shift in urban water management by combining modelling techniques with adaptive decision-making strategies is required in order to enhance urban flood resilience [7,8].
Various flood mitigation strategies exist, ranging from the use of conventional detention and retention ponds [9,10] to more advanced sustainable stormwater management approaches, such as Low-Impact Development in the USA, Water-Sensitive Urban Design in Australia, and Sponge Cities in China. While these concepts vary in name, they share the objectives of storing water and reintegrating it into the natural water cycle. Given the challenges of climate change, cities must develop strategies for mitigating flood risks and reducing urban heat islands. Blue–Green infrastructure (BGI) effectively addresses both issues by storing water (e.g., via green roofs or detention ponds) and enhancing evapotranspiration for cooling (e.g., using tree pits) [7,11,12,13,14]. Integrating BGI into urban wastewater management is also a strict requirement presented by the European Parliament directive on urban wastewater treatment [15].
The benefits of BGI strategies strongly depend on the details regarding their placement within a catchment at the city scale [7,9,16,17,18]. Numerous studies have developed methods for identifying suitable locations, ranging from scenario-based analyses [19] to the use of advanced multi-objective optimisation algorithms (MOOAs) [20,21,22]. Most of these are based on hydrodynamic flood models (e.g., CityCAT [20,23,24], PCSWMM2D [21], and more) or urban drainage models (e.g., SWMM [22,25]). While these models provide high accuracy, they are computationally demanding. Consequently, geospatial topographic analysis tools using remote sensing data (e.g., SCALGO Live [26]) have emerged as efficient alternatives for identifying efficient BGI locations [16].
Beyond determining which tool to select, a key question remains: how does one determine the optimal location for implementing BGI strategies? Besides flooding areas, surface temperature is a critical factor. Impervious surfaces increase both urban flood damage and heat stress [2,27]. Consequently, planning resilient Blue–Green cities in the future requires reducing both indicators. In this analysis, we define a high-priority BGI location as an area with high flood hazard and surface temperature.
Temperature has a proportional relationship with evapotranspiration rate [28]. Areas with high surface temperatures have great potential for heat reduction through enhanced evapotranspiration. GIS-based microclimate analyses based on digital elevation models (DEMs), colour-infrared imagery, meteorological data, and building geometries are used to identify urban heat islands at the city scale [29,30].
Various flood management approaches exist at the city scale, ranging from complex 1D-2D hydrodynamic models (e.g., PCSWMM [31,32] or InfoWorks [33]) and 2D models (e.g., TELEMAC [34], BASEMENT [35,36], and HEC-RAS 2D [37]) to raster-based 2D models (e.g., CA-ffé [38] and LISFLOOD-FP 8.1. [39]) and GIS-based approaches (e.g., the topographic control index [40] and flow path analysis using the D8 approach [41]). When vertical fluctuations cannot be neglected, fully three-dimensional models (e.g., FLOW-3D [42]) provide an alternative for simulating surface water transport. This approach is particularly relevant for study areas frequently affected by coastal flooding events or lacking flat terrain, where the assumptions required to apply the shallow water equations are not satisfied [43]. Nevertheless, the benefits of precise water transport modelling must always be weighed against the additional effort of model build-up, calibration, and computation time. Raster-based models represent good alternatives because of their lower data requirements, reduced computational time, and simple integration with other raster-based datasets, such as temperature data, for spatially and multi-objective site selection.
While previous studies have focused on BGI site selection based on flooding areas (e.g., CityCAT [24] and Scalgo Live [26]), a multi-objective approach that integrates flood hazards and heat stress is necessary for comprehensive planning. Alves et al. [44] proposed a district-scale assessment combining potential pluvial flood locations and urban heat stress to identify suitable locations for implementing nature-based solutions (NBSs). However, a micro-scale site selection process and physically based models for benefit assessment are still lacking. The locations identified are used to implement BGI strategies to enhance urban flood resilience. However, whether high-priority locations yield better results than randomly placed BGI sites remains unclear. To address this issue, quantifying the benefit is necessary [44]. This quantification would enable a better assessment of BGI benefits, as recommended by Korkou et al. [45].
In summary, this review resulted in the development of two main study objectives: (i) develop a general workflow for identifying BGI sites at the city scale by combining high-resolution flood hazard and urban heat island maps and (ii) carry out a benefit assessment comparing the implementation of this strategy at high-priority locations versus random placement, focusing on urban flood resilience improvements.

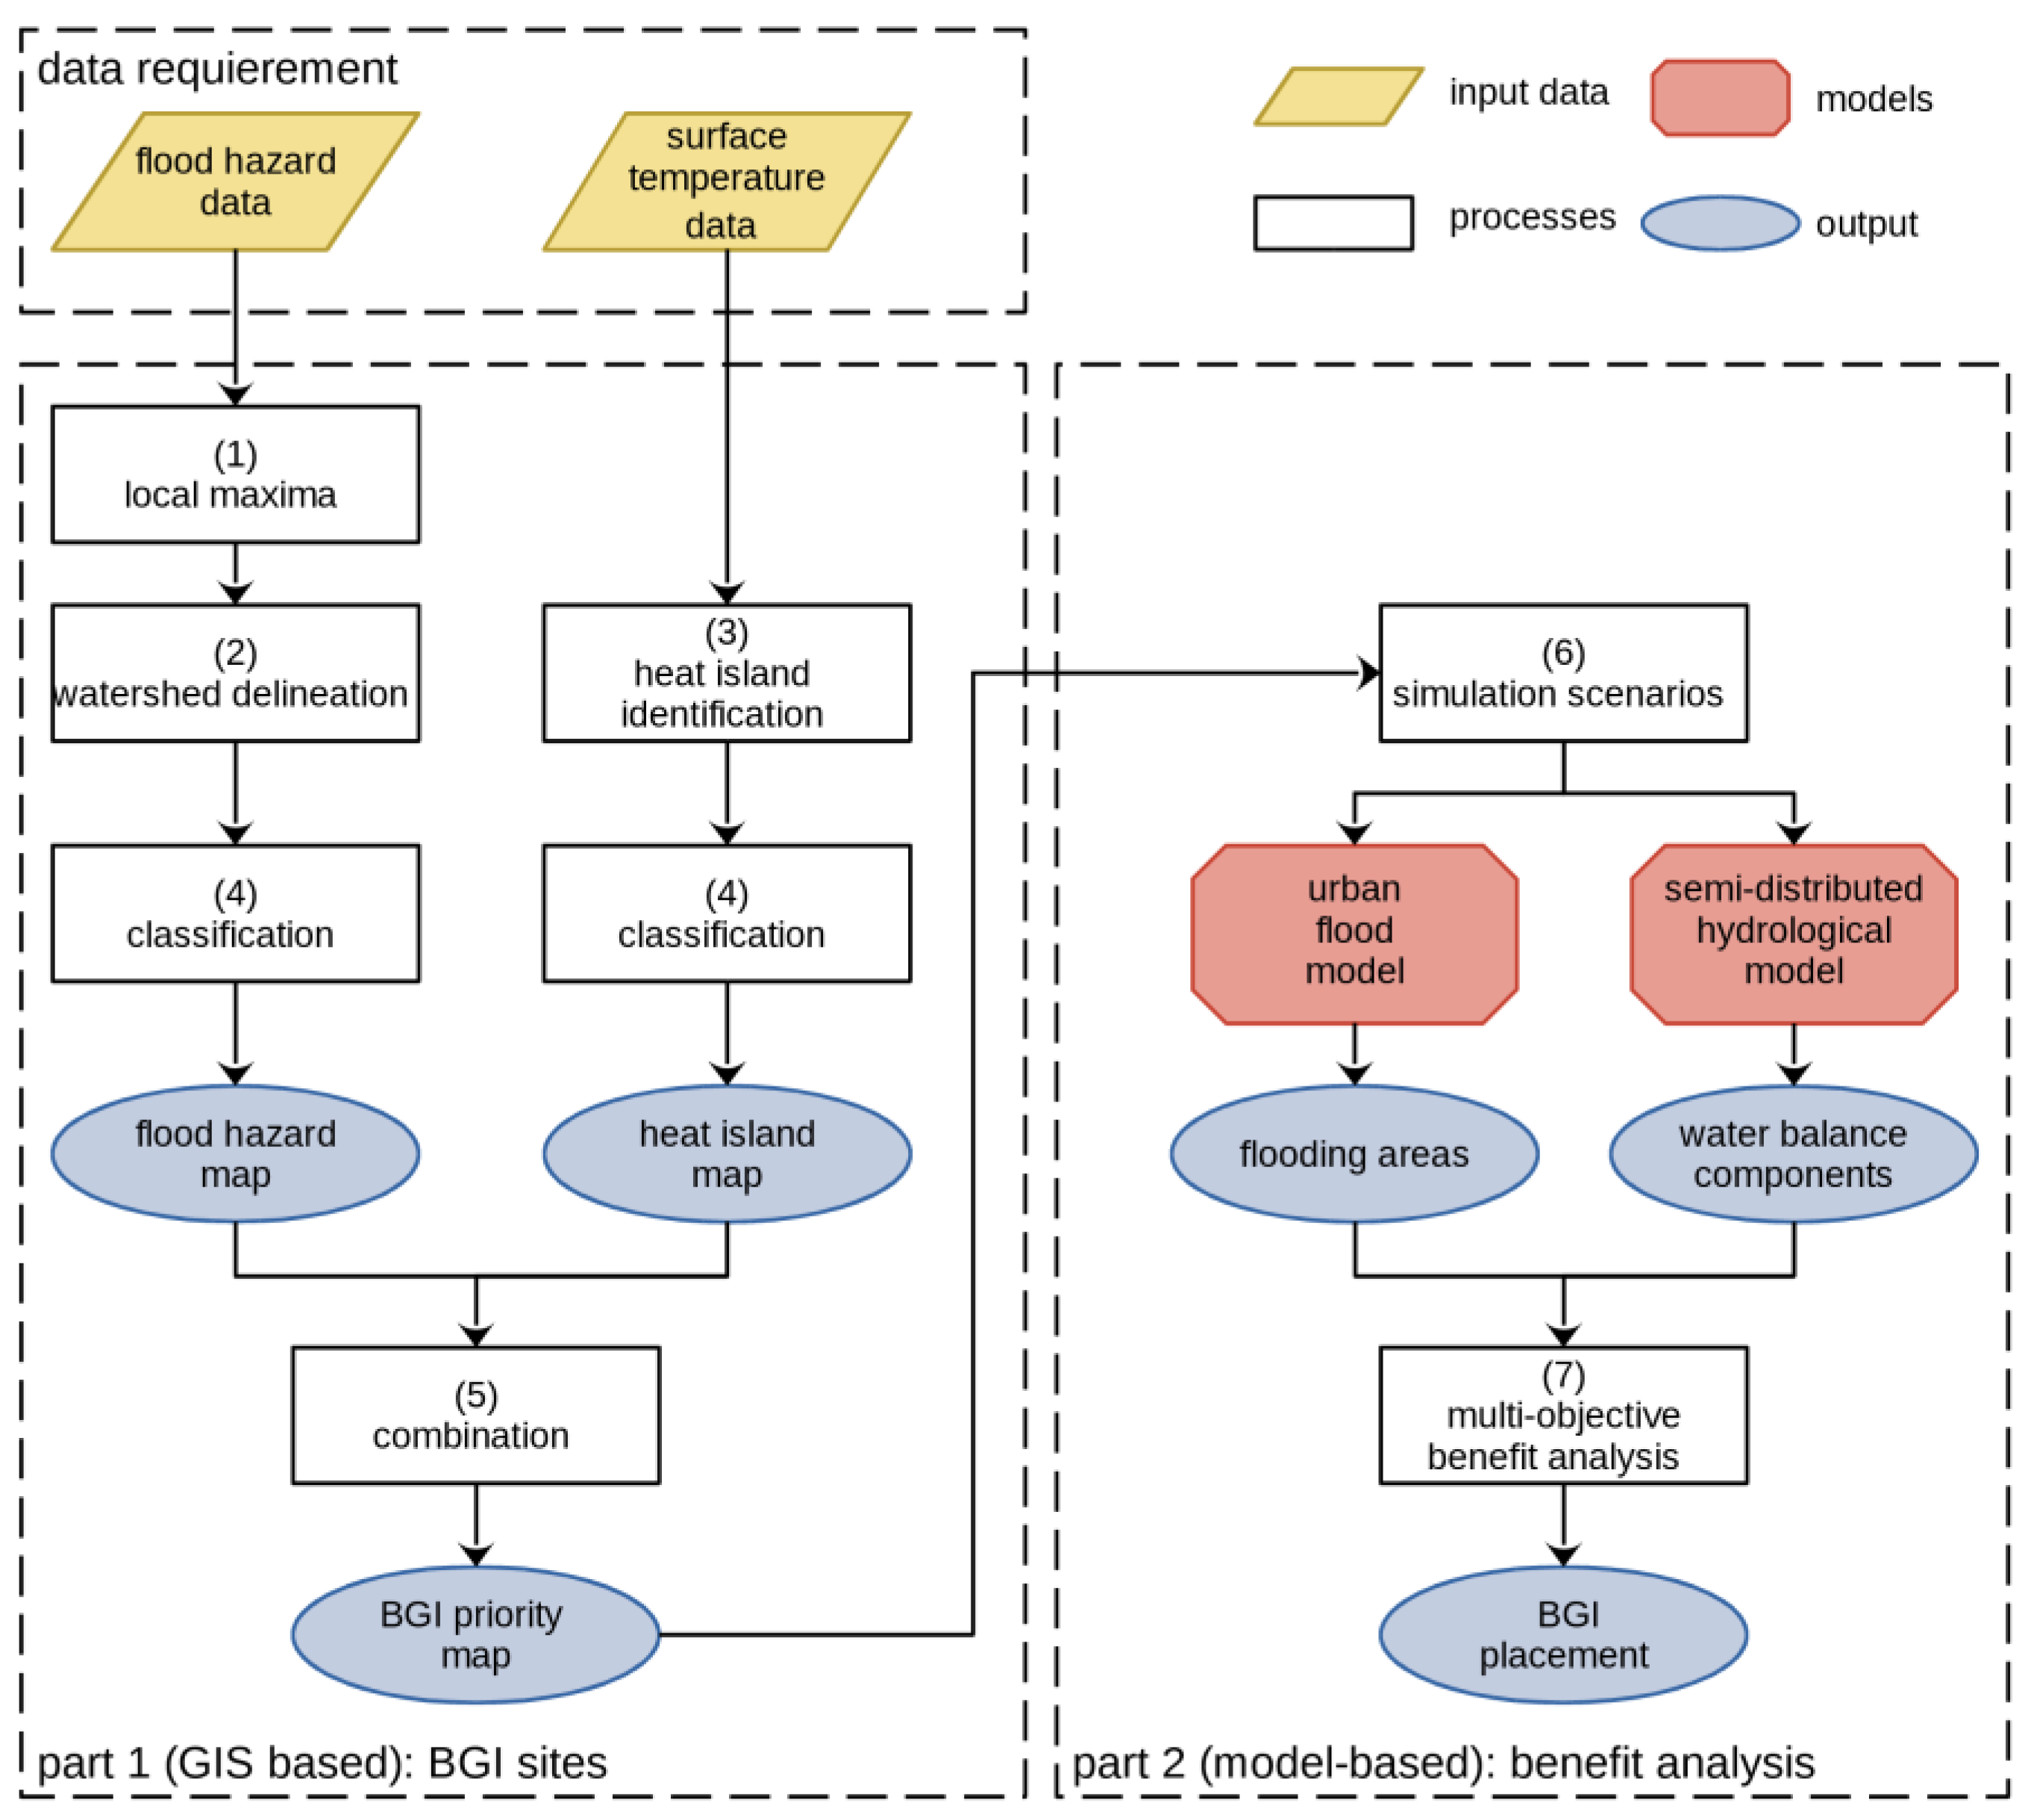
2. Materials and Methods

The first part of the workflow (Figure 1) identifies the optimal BGI sites based on the combination of two indicators. This part is based on processes and functions implemented in a geographic information system (GIS). Both indicators are quantified using raster data, wherein each raster cell represents a specific georeferenced value: (i) flood hazard hotspots and (ii) urban heat islands. The raster datasets classify values into four priority levels, ranging from 0 to 3, to generate individual maps for flood hazard and urban heat island prioritisation. Both indicators are combined using a multiplicative approach, resulting in a priority matrix with values ranging from 0 (low priority) to 9 (high priority). The outcome of this first step is a priority map for BGI strategies at the city scale.
The second part of the workflow involves evaluating and quantifying the benefits of the selected strategies. Suitable mitigation strategies are implemented and designed at both the highest-priority and lowest-priority sites to quantify the benefits. Each strategy is simulated using an integrated 1D-2D hydrodynamic model to quantify flood hazard based on the resulting flood extent (short-term impact) and a semi-distributed hydrological model to assess changes in the water balance (long-term impact). This approach enables a multi-objective benefit analysis that supports the implementation of BGI strategies.

2.1. Data Requirements

A key requirement for applying this workflow is the availability of input data for quantifying flood hazards and urban heat islands. Flooding areas serve as key indicators for assessing flood hazards. Various parameters help define these areas: (i) topographic flow path values (e.g., those determined via the topographic control index [40]); (ii) water depth (e.g., determined via cellular automata flood models [38]); and (iii) flow velocity (e.g., determined via hydrodynamic flood models [39]). If no flood hazard data are available, other modelling approaches, such as flow path analysis, raster-based 2D models, or hydrodynamic 2D models, can generate the required input data.
The primary indicator for urban heat islands is surface temperature, typically derived from remote sensing data, such as satellite-based thermal infrared measurements. However, these data are often unavailable. In such cases, alternative modelling approaches can be used to generate spatially distributed surface temperature data (Table 1). Since both input datasets are essential for applying the corresponding workflow, their availability is critical.

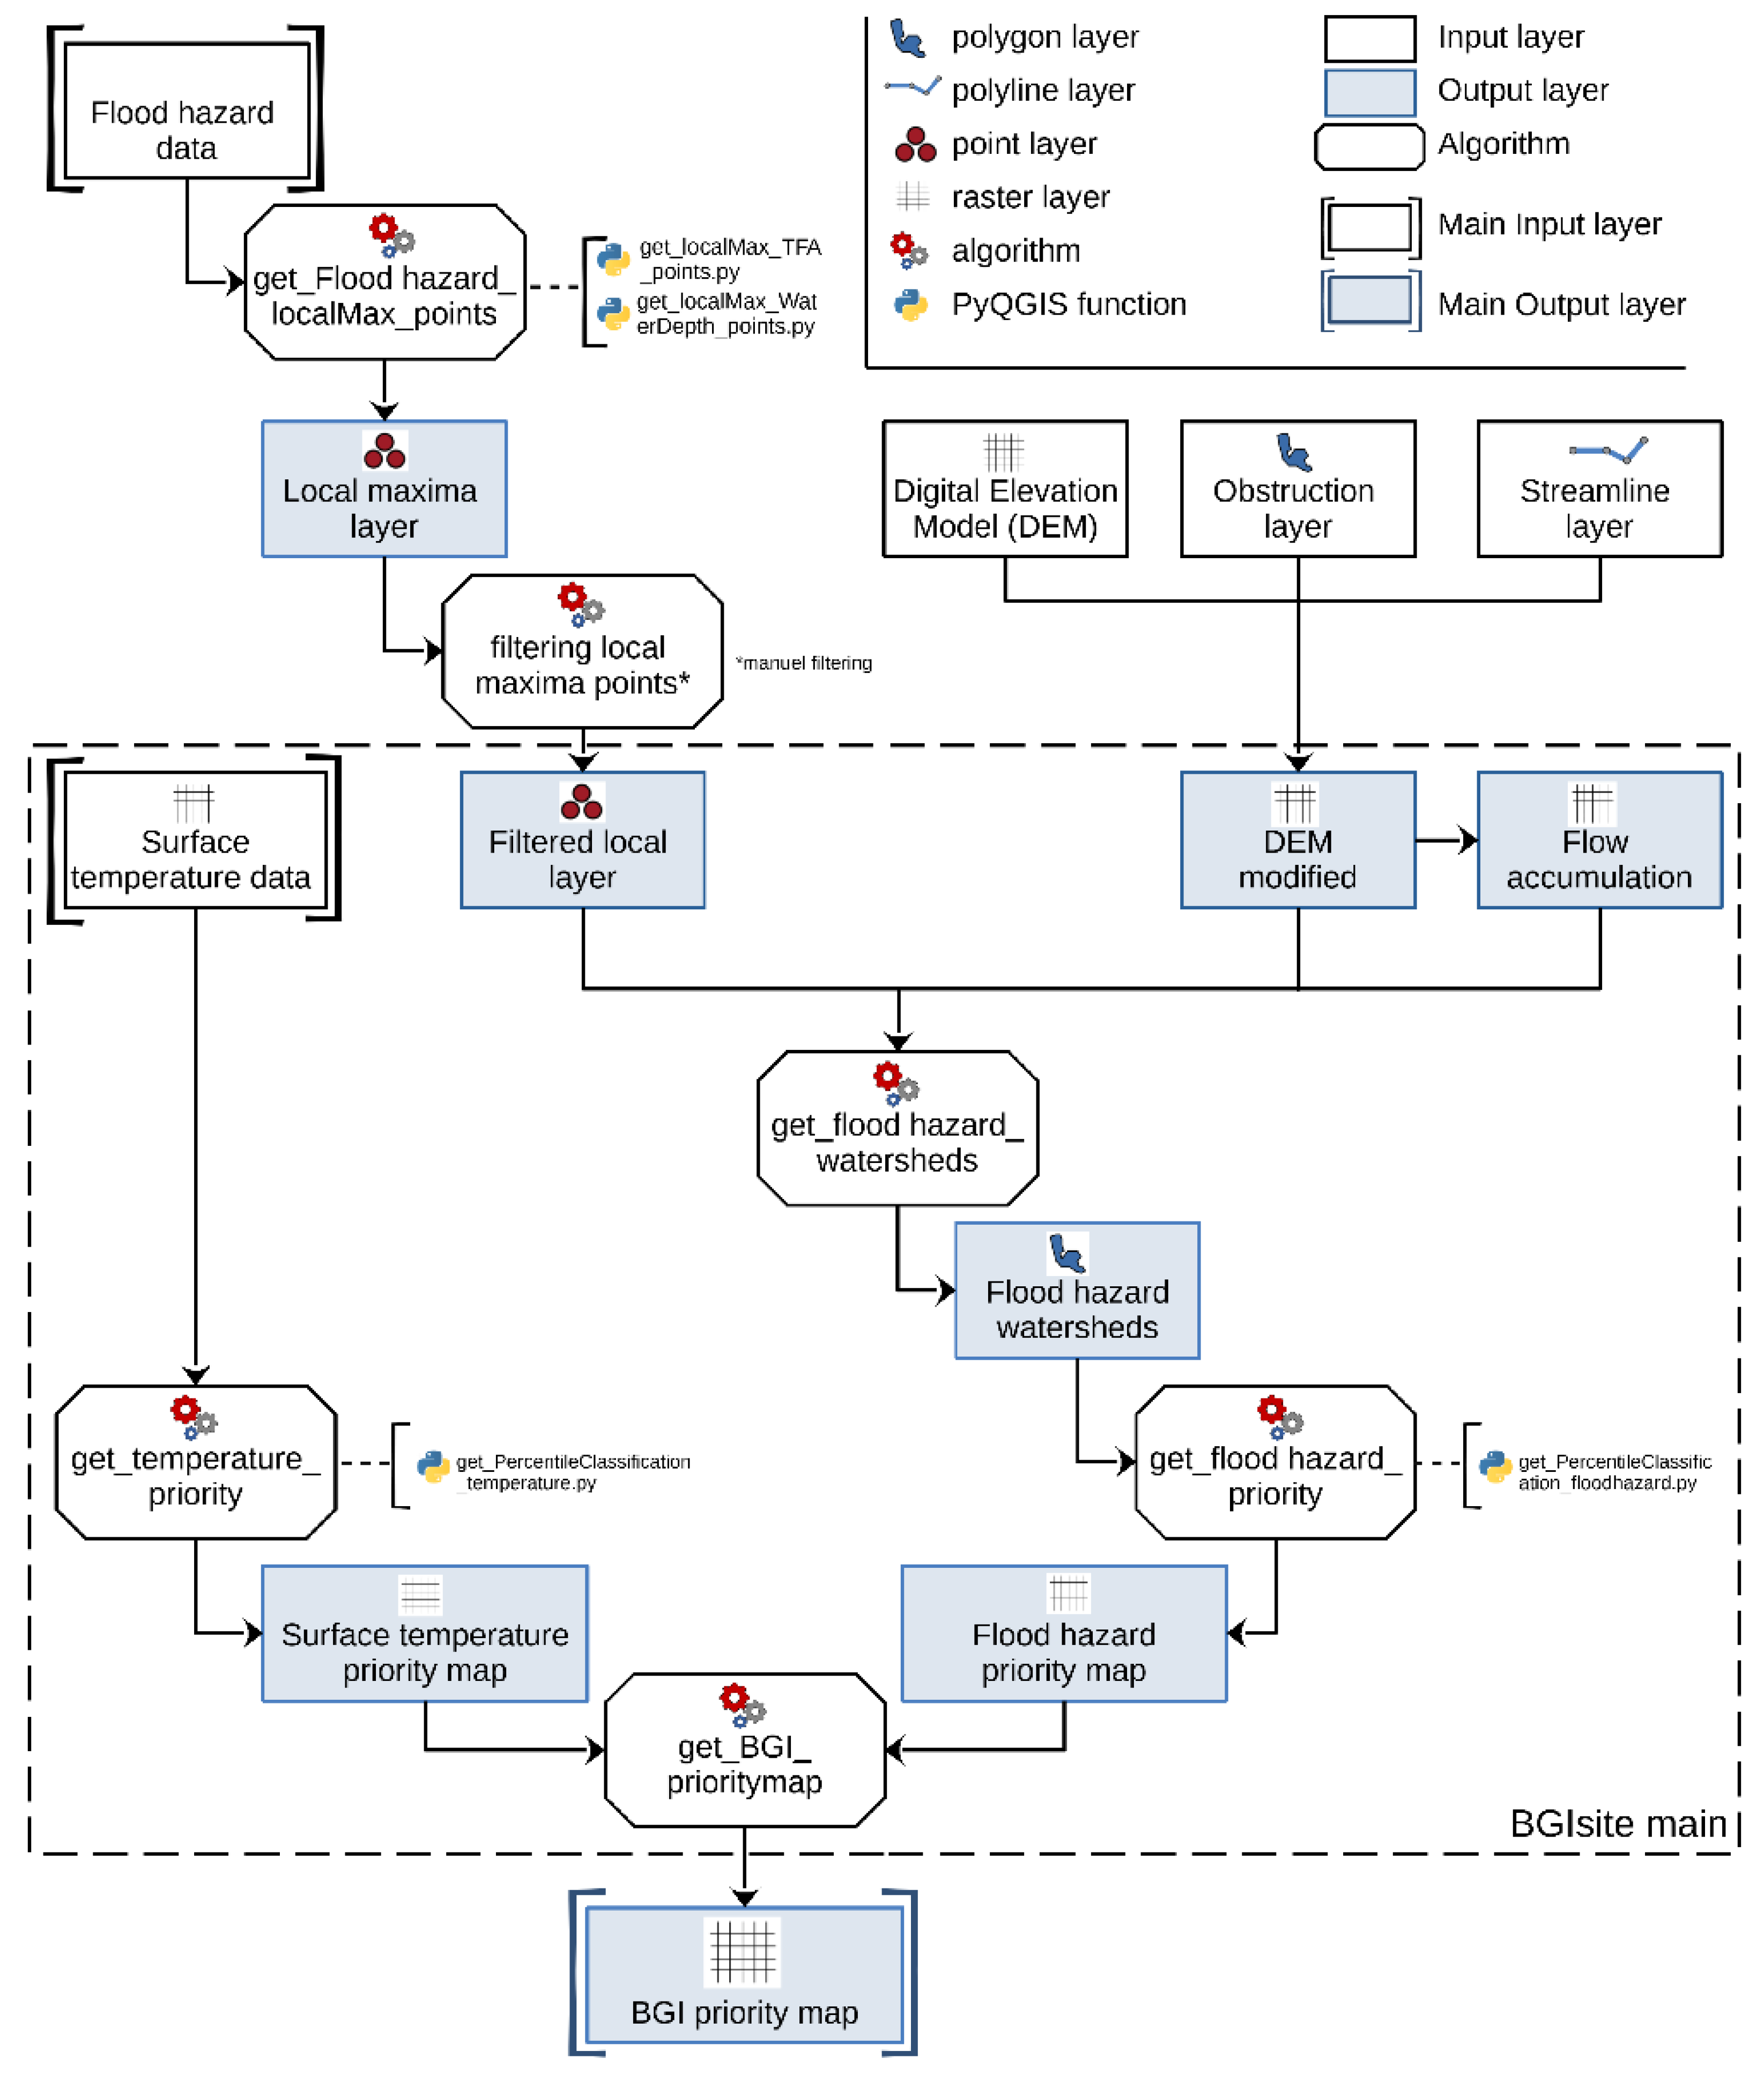
2.2. Part 1: GIS-Based Identification of Optimal Areas for Mitigation Strategy Implementation

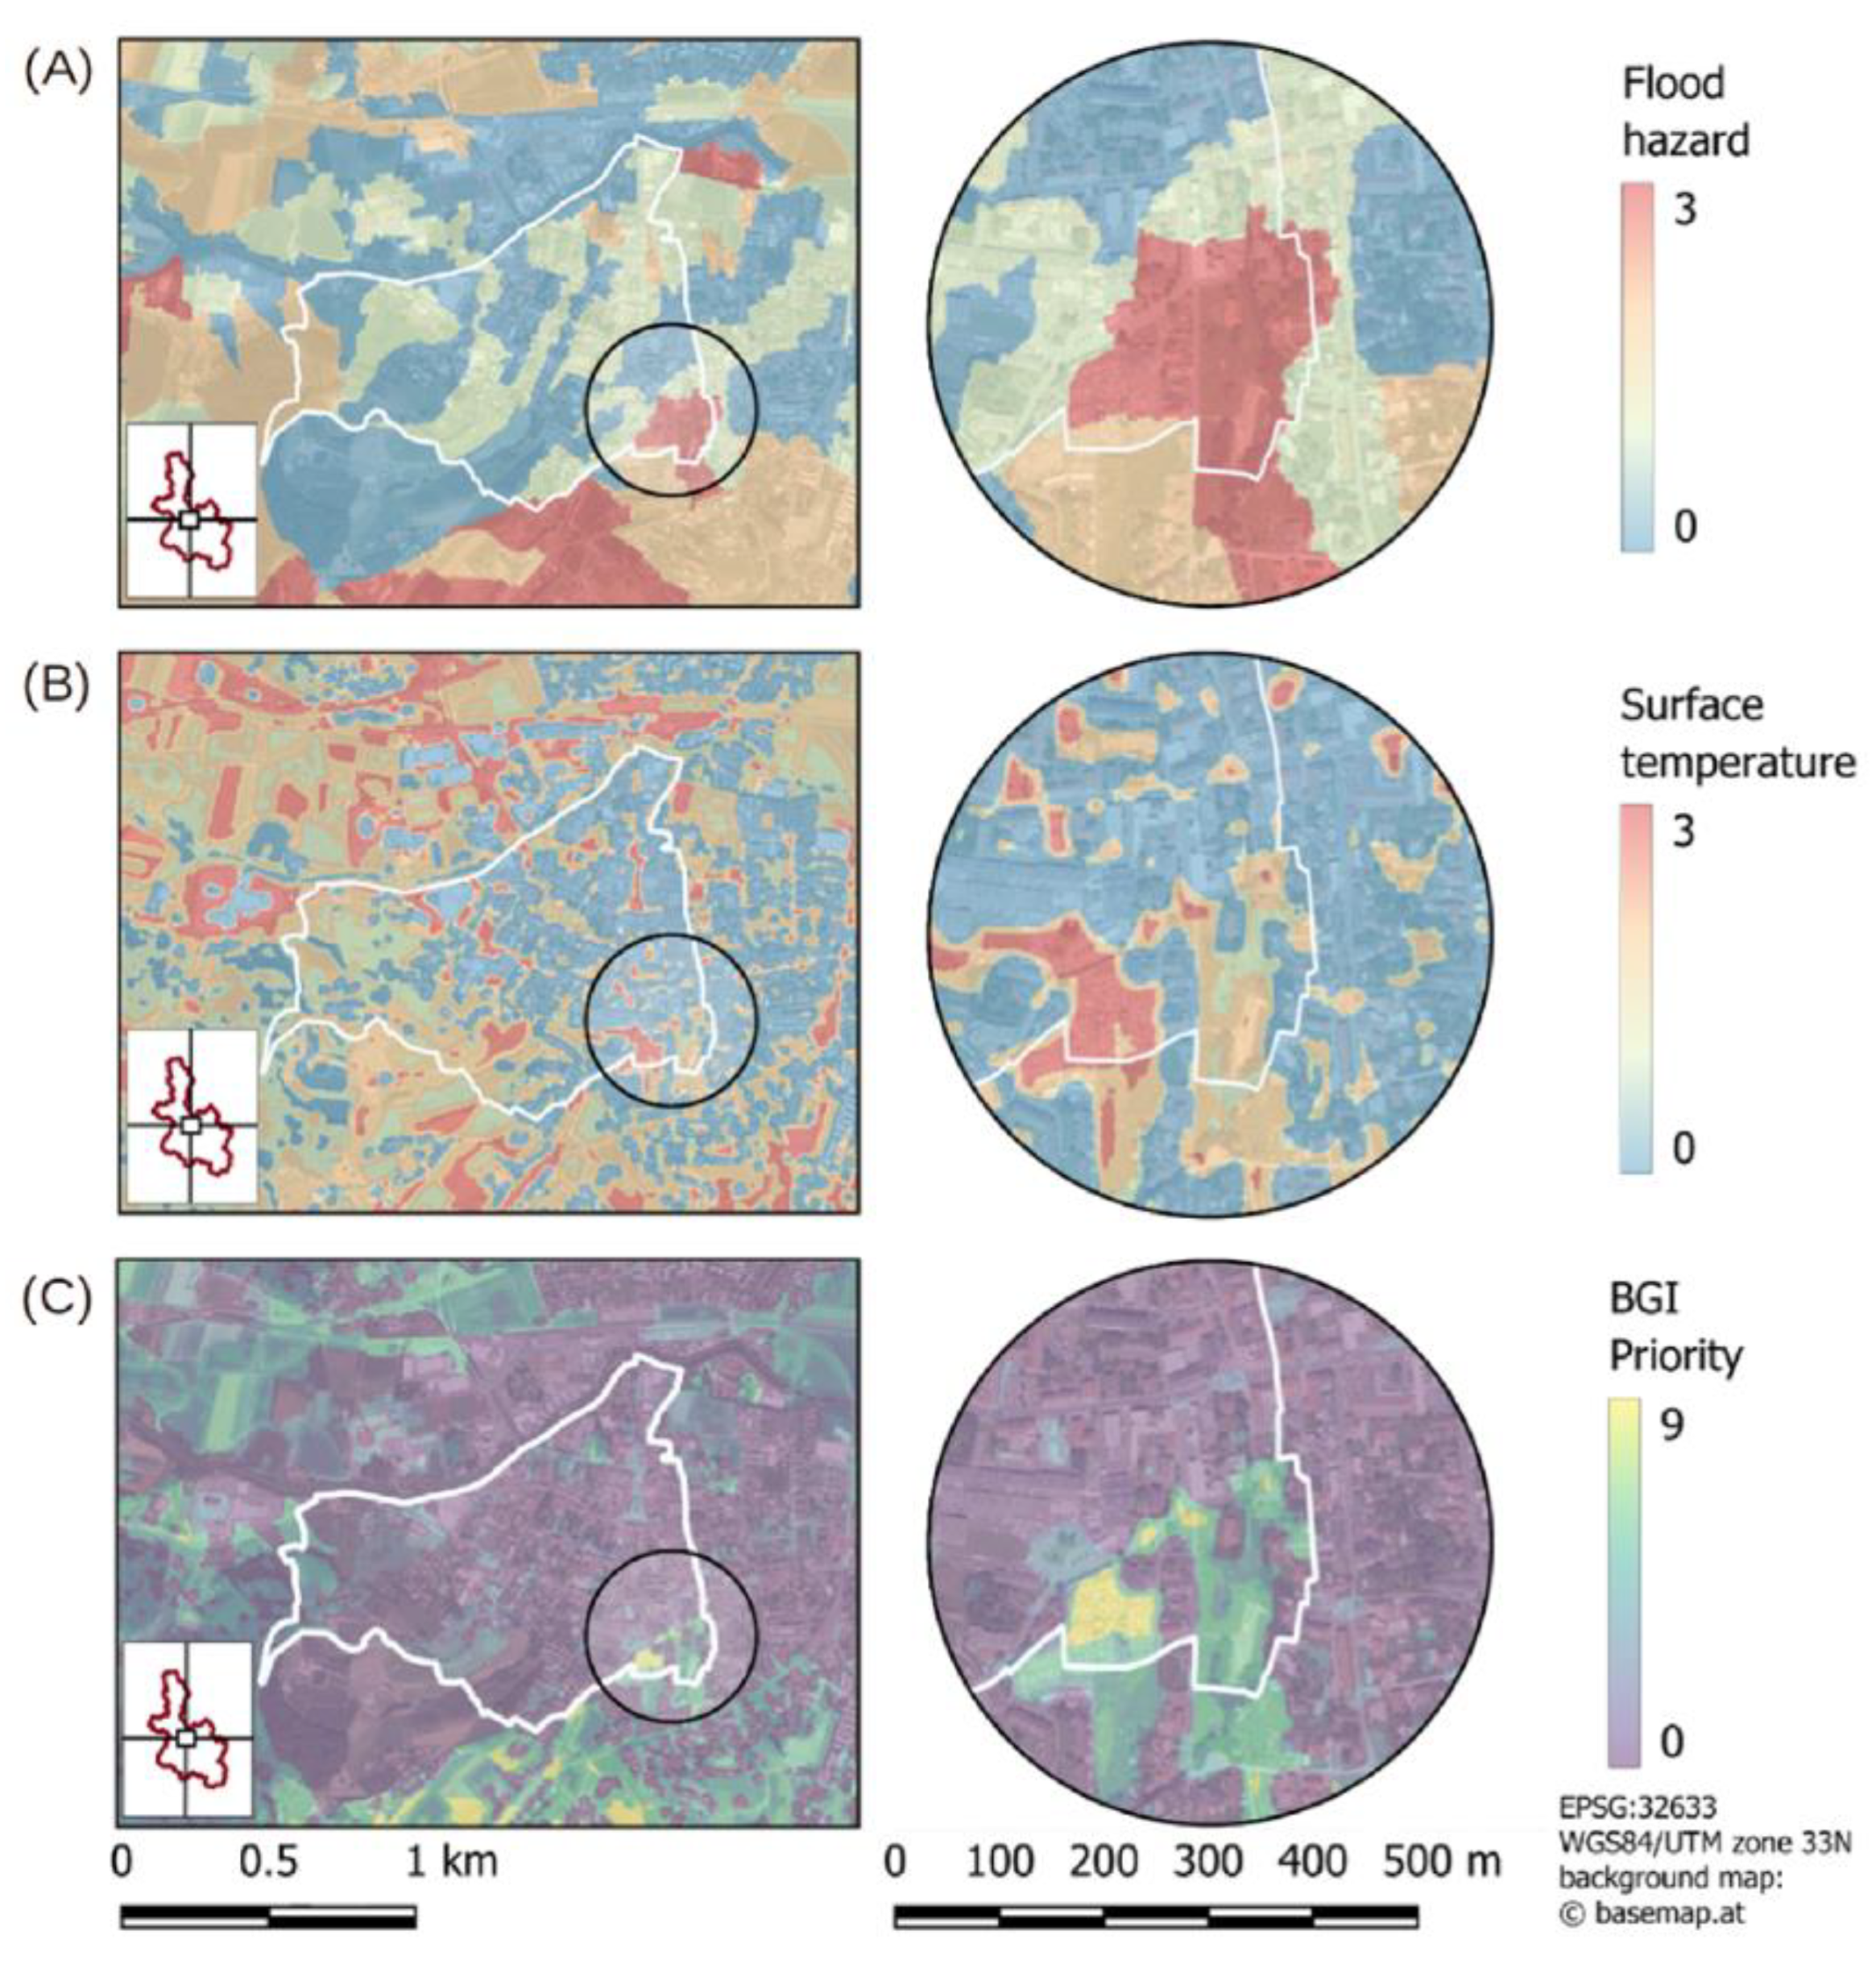
2.2.1. Local Maximum of Flooding Areas (1)

Flooding area is defined as the spatial extent of water on the surface in a given area. However, not all flooded areas with a water depth greater than 0 m cause damage. Therefore, the flood hazard data are filtered using a depth threshold (water depth > 0.1 m [47,48]) and an area threshold for the spatial extent (flooding area > 100 m2). Smaller flooding areas are assumed to be irrelevant in the context of flood damage. For each filtered flooding area, we identify the local maximum. The local maximum is the highest objective value (e.g., water depth) within a contiguous flooded area greater than 100 m2 and greater than 0.1 m in depth. In other words, in this stage, we define the maximum value as the greatest difference between the topography and water level within one flooding area. Suppose a topographic flow path analysis is used to quantify flood hazard based on the topographic depression volume and the corresponding watershed. In this case, our approach identifies the maximum value within each depression area as the local maximum. Once the local maximum is determined, the shifted position of the local maxima (the x and y coordinates) with respect to the nearest main flow path is required to determine the corresponding watershed for each local maximum.

2.2.2. Watershed Delineation (2)

In this stage, we use each local maximum position and shift it to the nearest main flow path to serve as an outlet for delineating the corresponding watersheds. This step ensures the consideration of not only the maximum value of a single flood area but also the corresponding area responsible for this maximum.
The D8 algorithm delineates each watershed using the flow accumulation [41] based on a high-resolution DEM. To ensure a realistic watershed delineation is achieved, the DEM must consider all relevant structures (e.g., streams, culverts, walls, and buildings) affecting surface runoff. Consequently, the DEM must be modified to obtain realistic flow accumulation, which defines the watershed area for each local maximum.

2.2.3. Heat Island Identification (3)

The second indicator provides surface temperature information for quantifying urban heat islands. As this study focuses on identifying local urban heat islands at the ground level, we excluded high rooftop temperatures. To identify an urban heat island, surface temperature data must be compared with the surrounding area. This assumption was based on the work carried out Martin et al. [49], who defined urban heat islands as the temperature difference within the urban catchment rather than the difference between the urban and rural areas. To determine the surrounding area, the average private land area at the study site is used as a reference (e.g., 30 m × 30 m, corresponding to an average private land area of 900 m2). The average surface temperature within this surrounding area is used to identify a local urban heat island.

2.2.4. Classification (4)

The previous steps result in high-resolution raster data containing information on the local maxima of flood areas, transferred to the corresponding watershed, and the spatially filtered mean surface temperature, serving as an indicator of urban heat islands. Both raster datasets are classified into four categories (0–3). This four-class categorisation is based on a non-standardised heuristic hazard classification commonly used for flooding events [50]. The statistical distribution of the data defines the threshold values by using the percentile values at 25% (Pi,25), 75% (Pi,75), and 90% (Pi,90) as thresholds for the categorisation (Table 2). Using a zero class guarantees that each indicator must have a high range for prioritisation.
The percentile values are not derived from the entire dataset Xi because a high number of zeroes or missing values may be present at the study site’s boundaries or building locations. Therefore, data filtering is applied to determine X i + , ensuring that percentile values and classifications are based on relevant data. This process results in two separate maps showing the spatial distribution of flood hazards and urban heat islands.

2.2.5. Combination (5)

The classification results in two discrete raster datasets, where each raster cell contains a value between 0 (low priority) and 3 (high priority). The location where both indicators have high priority defines a good location for implementation. Therefore, a multiplicative combination approach is applied (Equation (1)). No additional weighting factors are defined to maintain equal weighting for both indicators. The result is a single-priority map highlighting high- and low-priority BGI sites for managing urban water systems (as one potential application).
p r i o r i t y   ( p )   =   f l o o d   h a z a r d   ( f )   ×   s u r f a c e   t e m p e r a t u r e   ( s ) p N 0 p 9

2.3. Part 2: Model-Based Benefit Analysis

The next step involves analysing strategy benefits. The developed priority map supports the implementation of strategies at the high- and low-priority locations identified. Comparing the same strategy in two locations enables the quantification of the benefits. Therefore, each strategy is assessed twice: (i) at a high-priority site and (ii) at a randomly selected site. This assessment considers short-term (changes in flooding areas) and long-term impacts (changes in water balance) because of the multi-functional requirements of the mitigation strategies. This assessment makes it easier for decision makers to target and argue for or against investments, improving the decision-making process.

2.3.1. Design and Development of Simulation Scenarios (6)

The priority map represents the basis for implementing suitable mitigation strategies. These include urban flood prevention improvements and urban water cycle enhancements. Both large-scale strategies (e.g., the use of retention and detention basins) and small-scale solutions (e.g., BGI placement to reduce local surface runoff) are analysed. Each strategy is designed according to state-of-the-art practices and adapted to the local conditions of the locations identified. The pre-designed strategies are then employed in an urban flood model to analyse their benefits in terms of reducing urban flooding. These strategies are also integrated into a hydrological model to assess long-term effects. Each modelled strategy represents a unique simulation scenario, which is tested using short-term heavy rainfall events and long-term precipitation data to evaluate the benefit.

2.3.2. Multi-Objective Benefit Analysis (7)
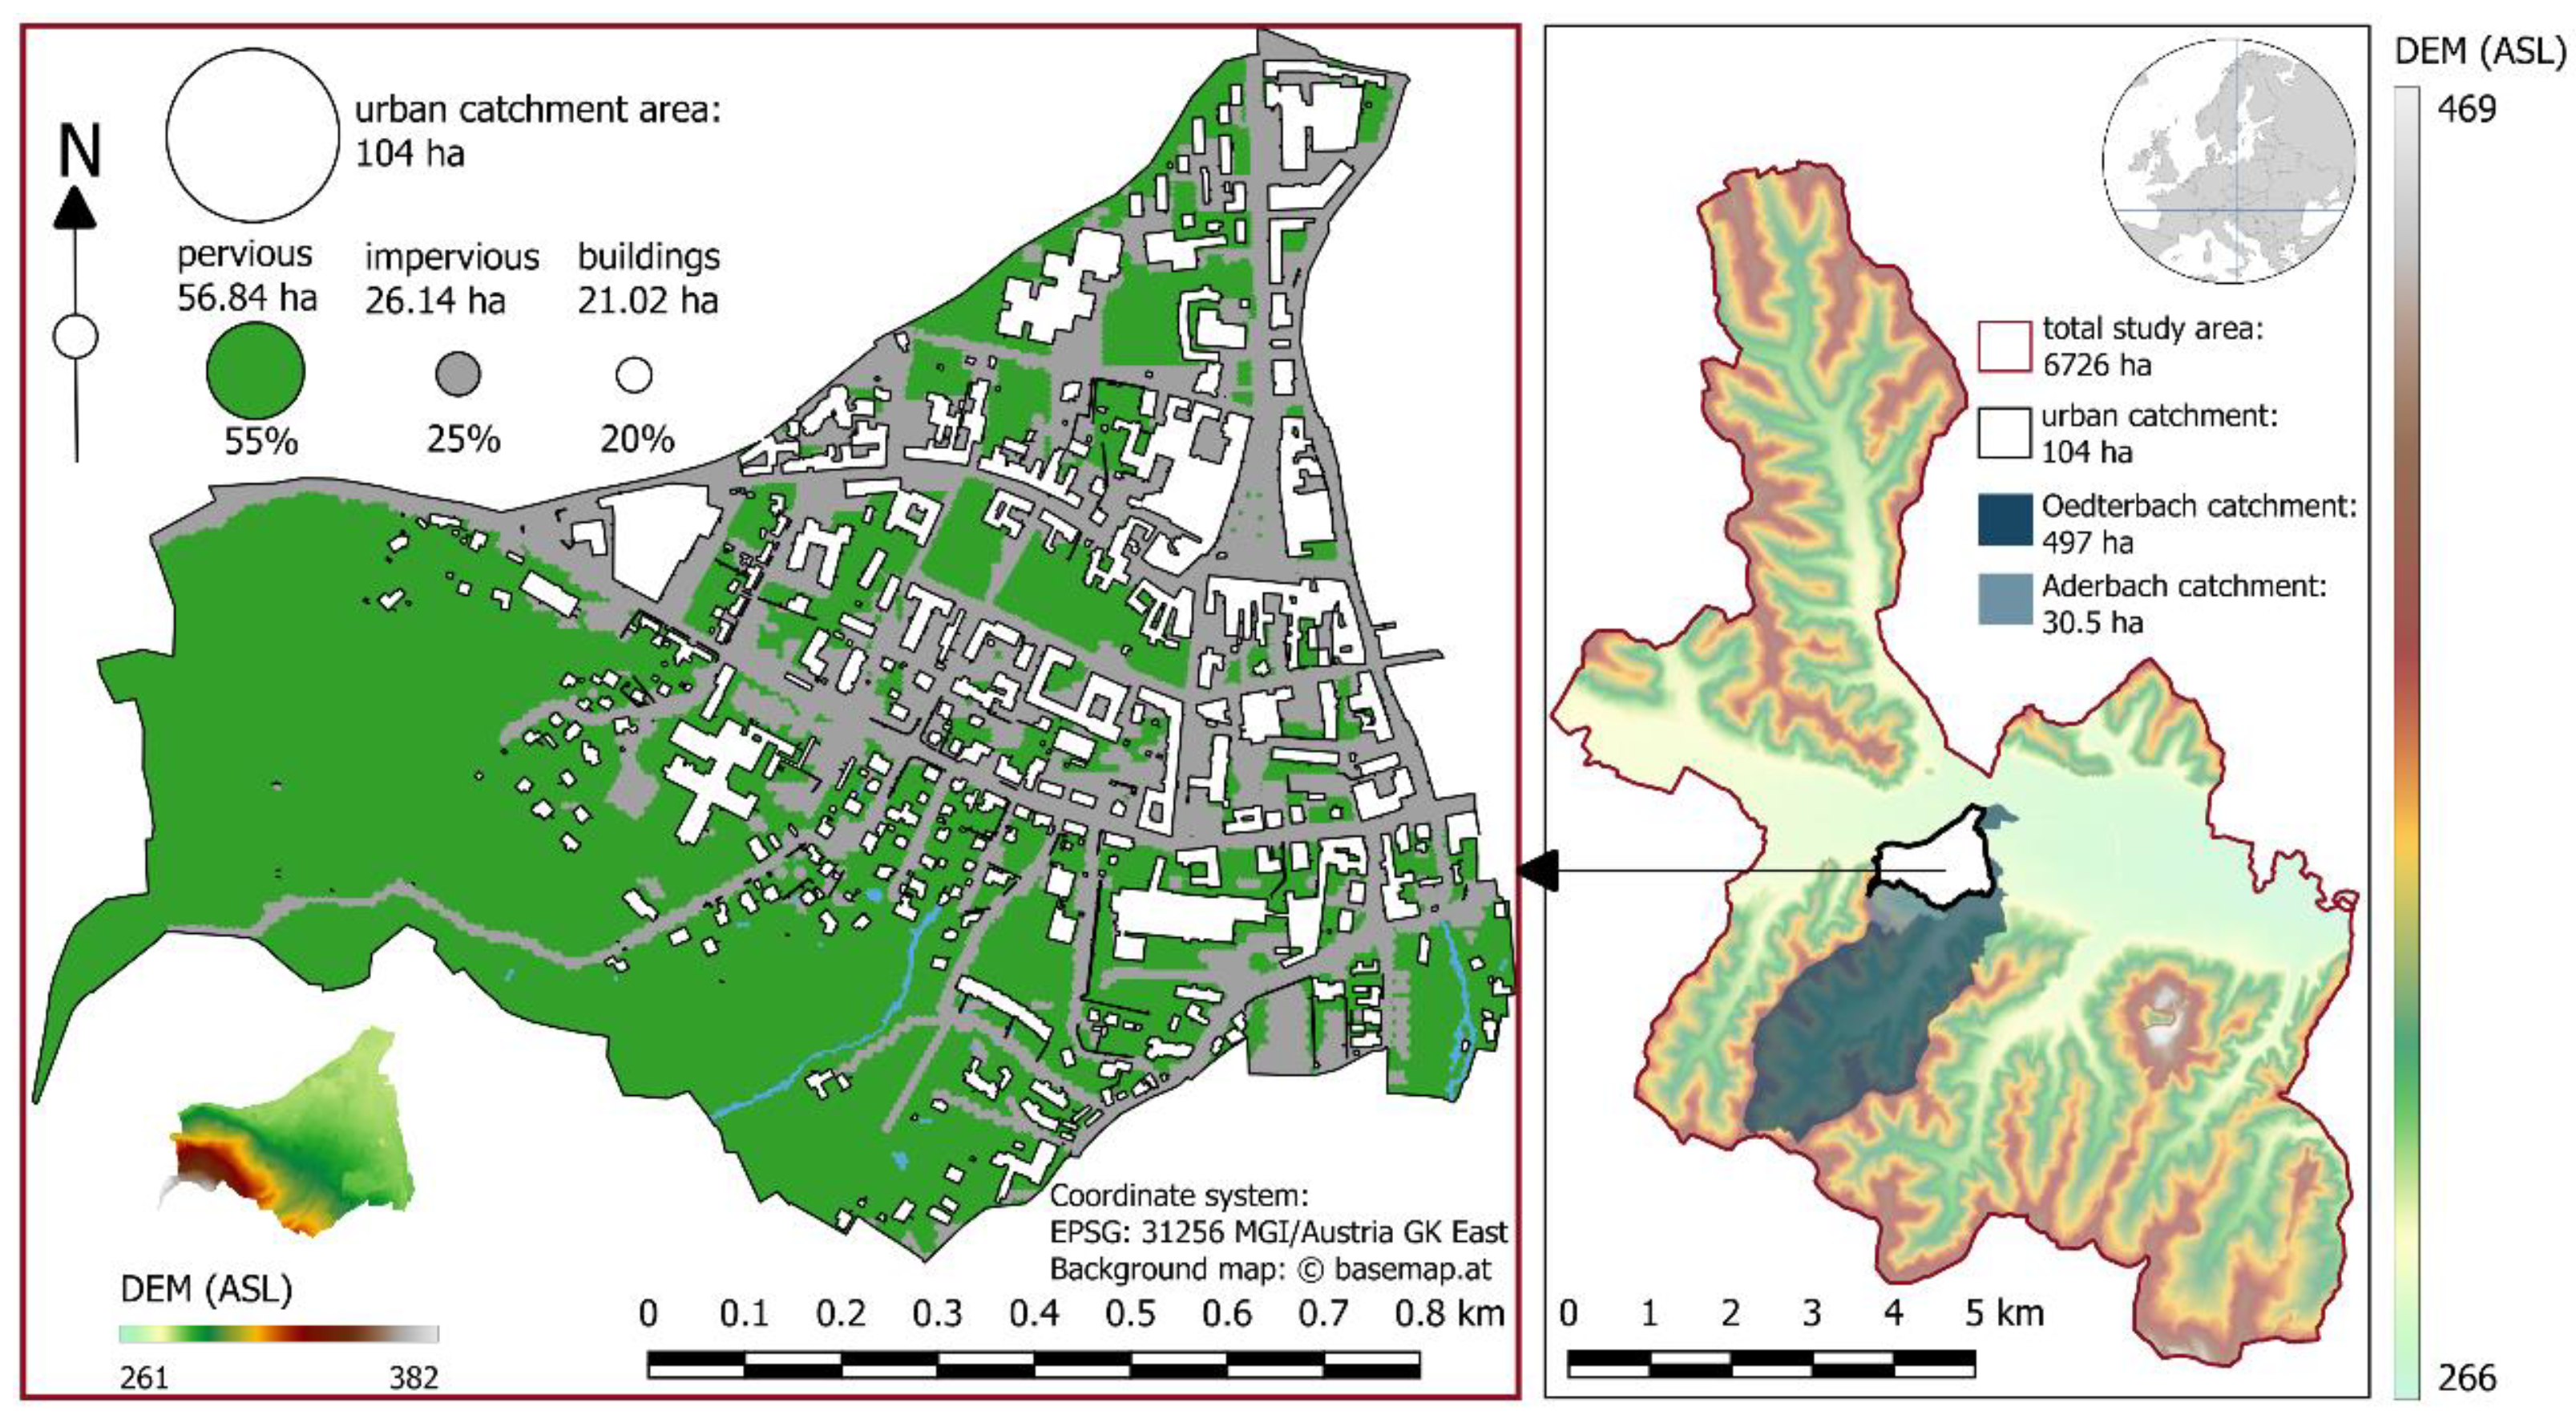
Combining the simulation results from both models quantifies the strategy benefit through a multi-objective assessment approach. The relative deviation from the reference state (i.e., the state without mitigation strategies applied) is determined for each strategy. The water depth and parameters of the urban water balance (evapotranspiration, urban runoff, and rural runoff) are selected as required model variables. Each of these are normalised to combine them into one value to quantify a benefit of the strategy. This value enables a simple comparison of mitigation strategies and their benefits, supporting decision making.

2.4. Study Site

2.4.1. Study Site Description

The study site (Figure 2) covers 6726 ha in the Raab valley in Southeastern Styria, Austria. It includes several smaller streams that flow into the main river Raab. The city centre is in the flat part of the catchment, surrounded by steep rural catchments with an average slope of 10–12 percent. The urban catchment area covers 104 ha, while two rural catchments—Oederbach (497 ha) and Aderbach (30.5 ha)—are directly connected to the urban catchment area via streams that channel water through the city centre.

2.4.2. Priority Map

The developed automated GIS tool BGIsite uses the first part of the presented workflow to create a priority map regarding where to implement the strategy. BGIsite uses QGIS (version 3.36.0) [51], WhiteboxTools (version 1.0.9) [52], and PyQGIS (version 3.36.0) [53]. This tool is described in Appendix A and available on Zenodo [54]. The final output consists of three maps highlighting flood hazards in urban heat islands, and their combination results in a priority map that can be used to create modelling scenarios.
Topographic flow path analysis is used to quantify the flood hazards. This analysis combines flow accumulation (defining watershed areas), mean upslope (indicating flow velocity impact), and depression volume per raster cell, following the depression-based index approach developed by Huang et al. [40] without the included filtering approach. A GIS-based microclimate analysis [29] is used to identify urban heat islands using surface temperature raster data as an output.

2.4.3. Model Development

An integrated 1D-2D urban flash flood model using the commercial software PCSWMM2D [31,32] determines the flooding area in the study site. This model type was selected due to the significant influence of the sewer system on surface runoff dynamics during urban flooding [55,56,57,58], similar to streamflow at the site. Surface water transport is solved by the 2D model, and sewer system transport by the 1D model. Both solve water transport hydrodynamically using the Saint-Venant equations with an implicit finite difference method. The models are hydraulically coupled bidirectionally via a bottom orifice at each sewer junction or a weir for overflow. The model in the study site, developed by Reinstaller et al. [17], was evaluated with post-flooding reports, watermarks, and fire department protocols.
Additionally, a semi-distributed hydrological model was derived from the 1D-2D model. Each 2D raster cell with the same land cover was aggregated to a hydrological response unit, with outflow depending on the main flow path. The required hydrological processes were assessed by long-term rainfall-runoff simulations using SWMM 5.2 [25].

2.4.4. Model-Based Design of Mitigation Strategies

Nature-based solutions in rural catchments, blue–green infrastructures (BGIs), multi-functional detention basins, and their combinations were analysed, as demonstrated by Reinstaller et al. [17,59]. First, the strategies were implemented in low-priority locations, followed by high-priority locations, to compare the benefits of different placements.
In this case, the strategies were employed according to Austrian state-of-the-art design guidelines [60] for the selected locations to facilitate realistic planning. The design process balances input and output water volumes to determine the required design volume based on a given return period. In this process, four key design parameters were considered:
(i)
Accumulated surface runoff volume;
(ii)
Optional infiltration volume draining into the soil;
(iii)
Base outlet flow to the sewer system or a nearby stream;
(iv)
Flooding discharge volume flowing into the sewer system or a stream.
The maximum difference between the input and output volume defines the design volume. A tool developed (preDesign tool (version 1.0.0)) using the QGIS model designer (version 3.36.0) supported the process of determining the design volume for each identified location automatically (Appendix B).
The resulting design volume was required in order to define the geometric characteristics of the technical strategies in the integrated 1D-2D urban flood model and the semi-distributed hydrological model. Such geometric settings include the height of the dam in the detention basin or the available ground area for the vegetative swale. These parameters are necessary for modelling the strategies as realistically as possible.
Both models use the SWMM 5.2 model [25] implemented in PCSWMM2D software [31,32]. The numerical mesh directly incorporates the storage height, calculated by dividing the design volume by the available area at the selected locations. Also, hydraulic elements (conduits and orifices) control both base and flooding outflow to the sewer system or stream. In contrast, the hydrological model applies the low-impact-development (LID) approach in SWMM 5.2 to model each strategy [61].
Both models simulated each mitigation strategy using a documented heavy storm event from 22 August 2020. One-year precipitation data supported the analysis of hydrological water balance. Both datasets originate from the GeoSphere Austria open data hub [62] (Figure 3).

2.4.5. Benefit Analysis

The efficiency index (EI) [17] serves as the basis for the benefit analysis by evaluating mitigation strategies through the normalised relative deviation from a reference state (performance without mitigation strategies). The benefit assessment focuses on surface flooding and changes to the water balance. This assessment is reasonable because both indicators were applied in the previous step to identify suitable BGI sites. Water balance change (WB) represents the difference between the total input volume (runoff within the urban catchment and inflow from the rural catchment) and the output volume (evapotranspiration and infiltration in the urban area). The final EImod calculation is based on the mean value of both normalised sub-components, as described in Equation (2).
E I m o d = 1 2 E I f l o o d i n g + E I W B
EImod = modified efficiency index; EIflooding = normalised relative deviation of the flooding area; EIWB = normalised relative deviation of the combined water balance change value (WB).

3. Results

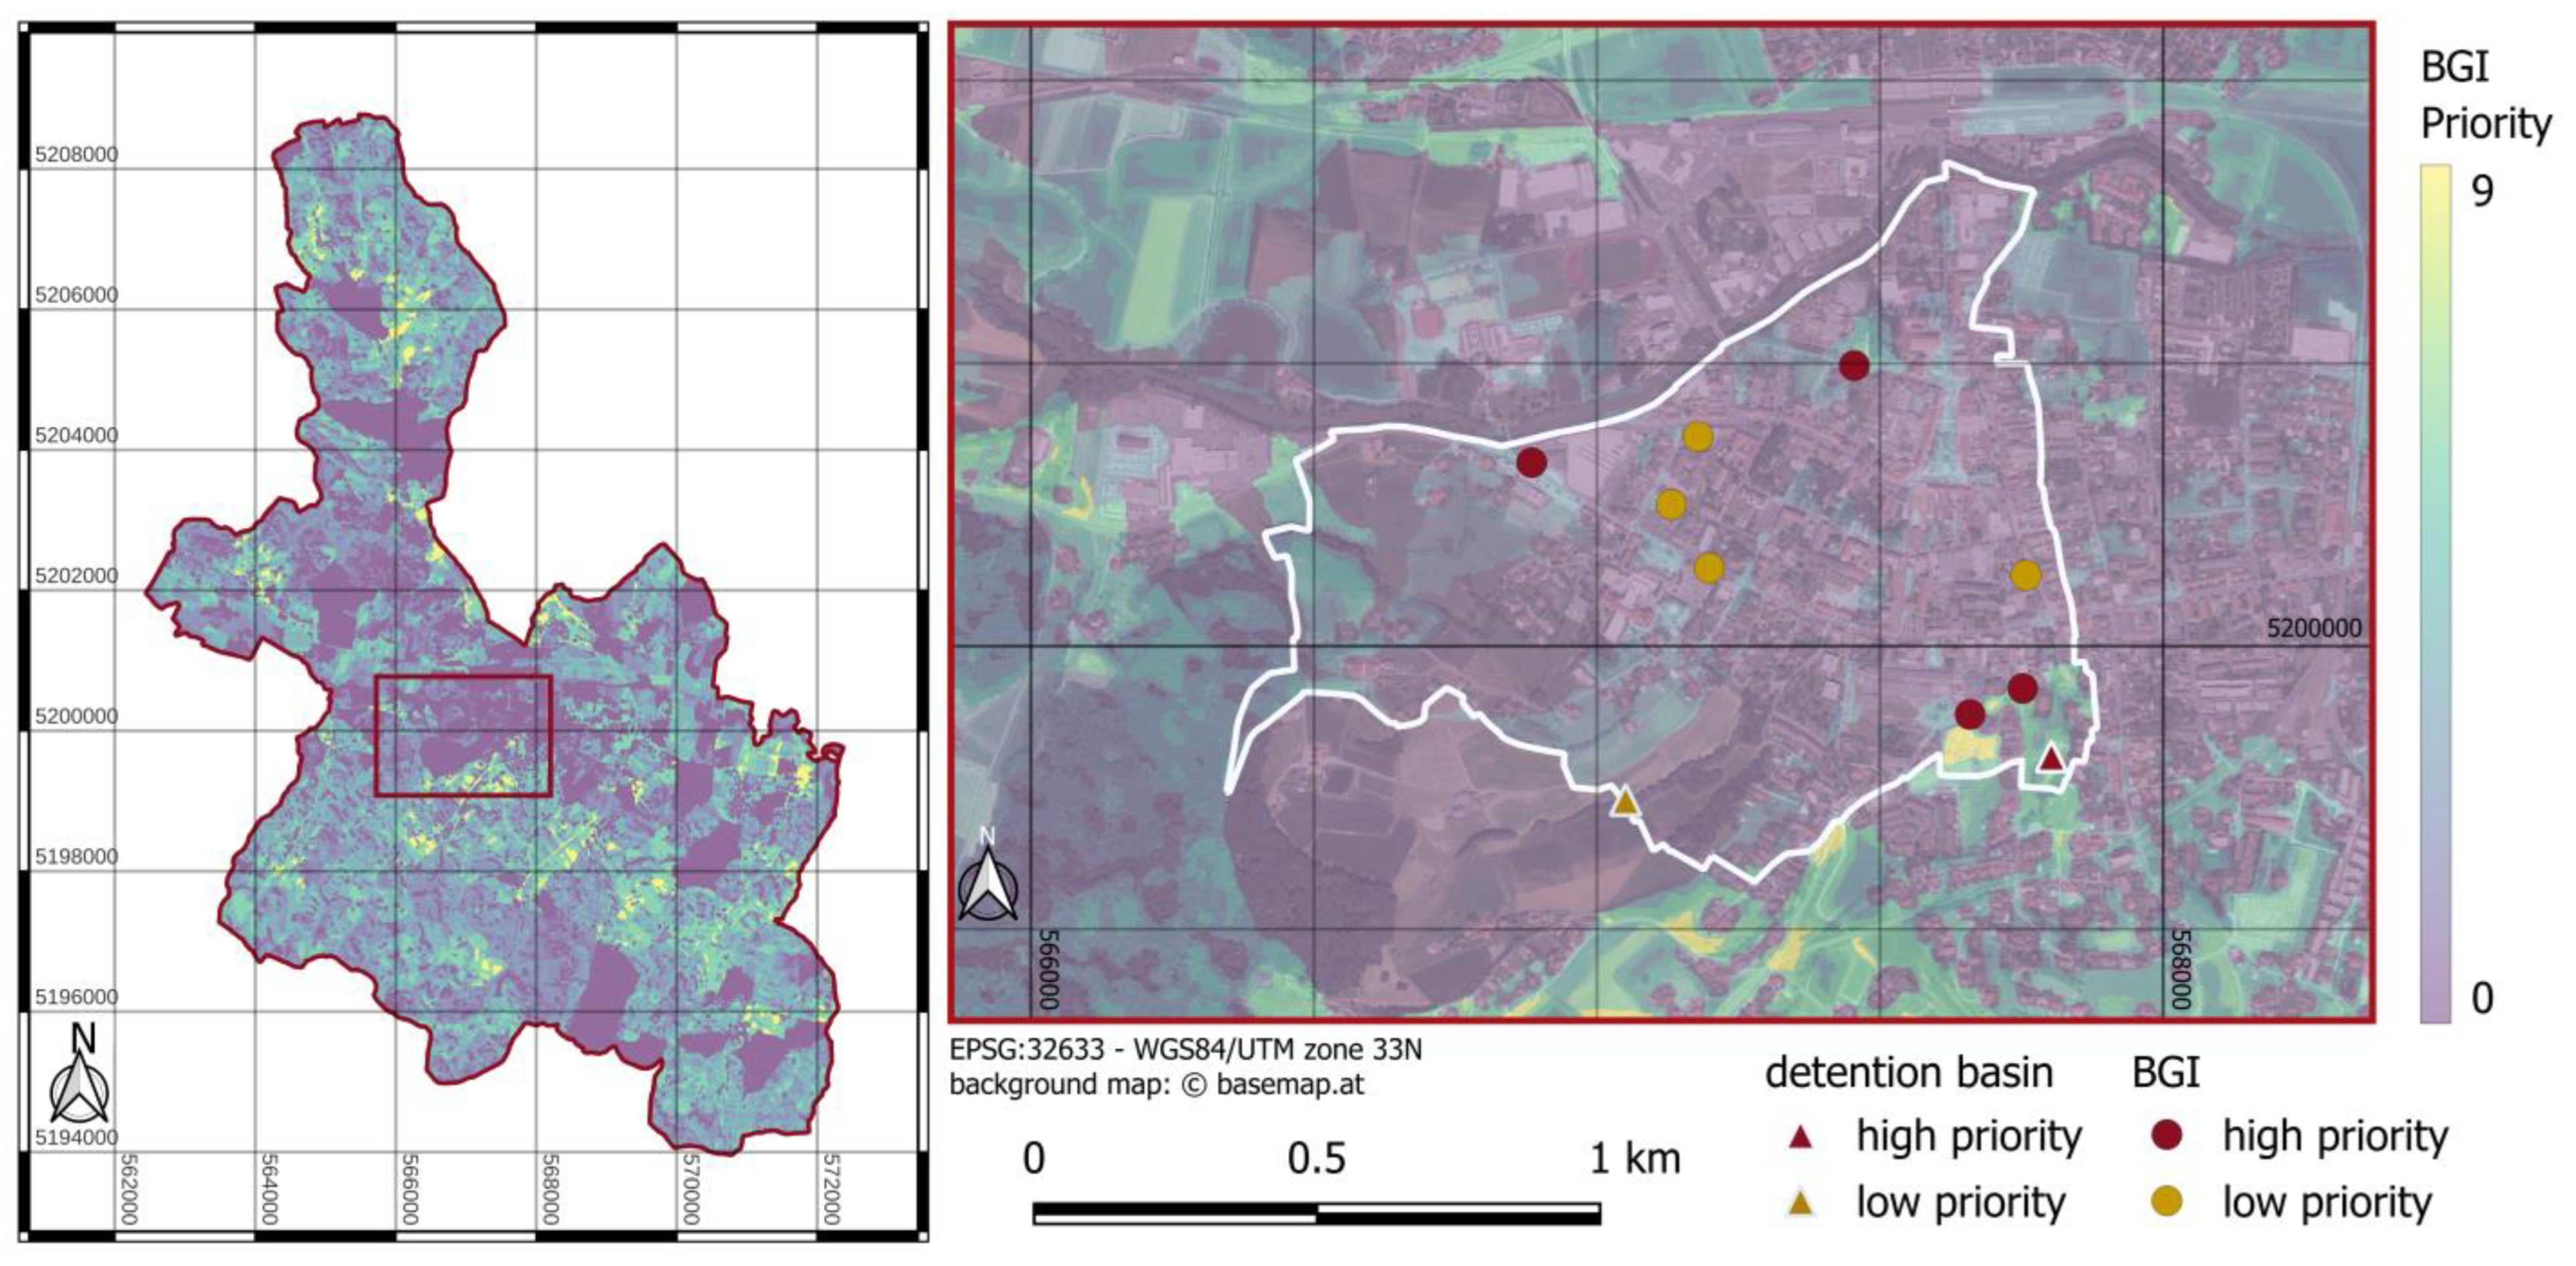
3.1. BGI Priority Map

Applying the presented workflow resulted in a priority map combining flood hazard and urban heat island maps (Figure 4). This priority map identifies high-priority locations for implementing the strategies.
One high-priority location was determined to be in the southeastern corner of the urban watershed, marking the transition area between the rural catchment of Oederbach and the urban detail area. This location is the only one within the urban detail catchment classified as highest-priority class 9. Additionally, two locations were identified with high priority (class 4–6) in the northeastern and northern parts of the urban detail area (Figure 5). The remaining urban detail area was classified as a low-priority area (0). Furthermore, the Oederbach catchment had a higher mean priority classification than the Aderbach rural catchment.

3.2. Implementation, Design, and Modelling of Mitigation Strategies

Using the priority map enables the selection of locations for implementing detention basin, vegetative swale, and NBS strategies in rural catchments in the 1D-2D urban flood and semi-distributed hydrological models (Figure 5). The results reveal one highest-priority site (class 9) and three high-priority sites (classes 4–6) for BGI implementation. Additionally, four low-priority locations (class 0) were selected. Furthermore, the priority map considered implementing detention basin and NBS strategies in the Oederbach rural catchment to be a higher priority than implementing them in the Aderbach rural catchment.
The PreDesign tool in the version 1.0.0 (Appendix B) supported the design of each selected strategy at the corresponding locations. In the design process, multi-functional detention basins and decentralised BGI strategies were defined based on a predefined return period, determining the required design storage volume. In rural boundary catchments, NBS strategies convert 10% of impervious surfaces into pervious ones. Additionally, the model placed green roofs on flat-roof buildings in the urban detail area to further mitigate surface runoff. Table 3 summarises each parameter used for the design process. These parameters define the geometric settings for integrating the strategies into the 1D-2D and semi-distributed hydrological models.

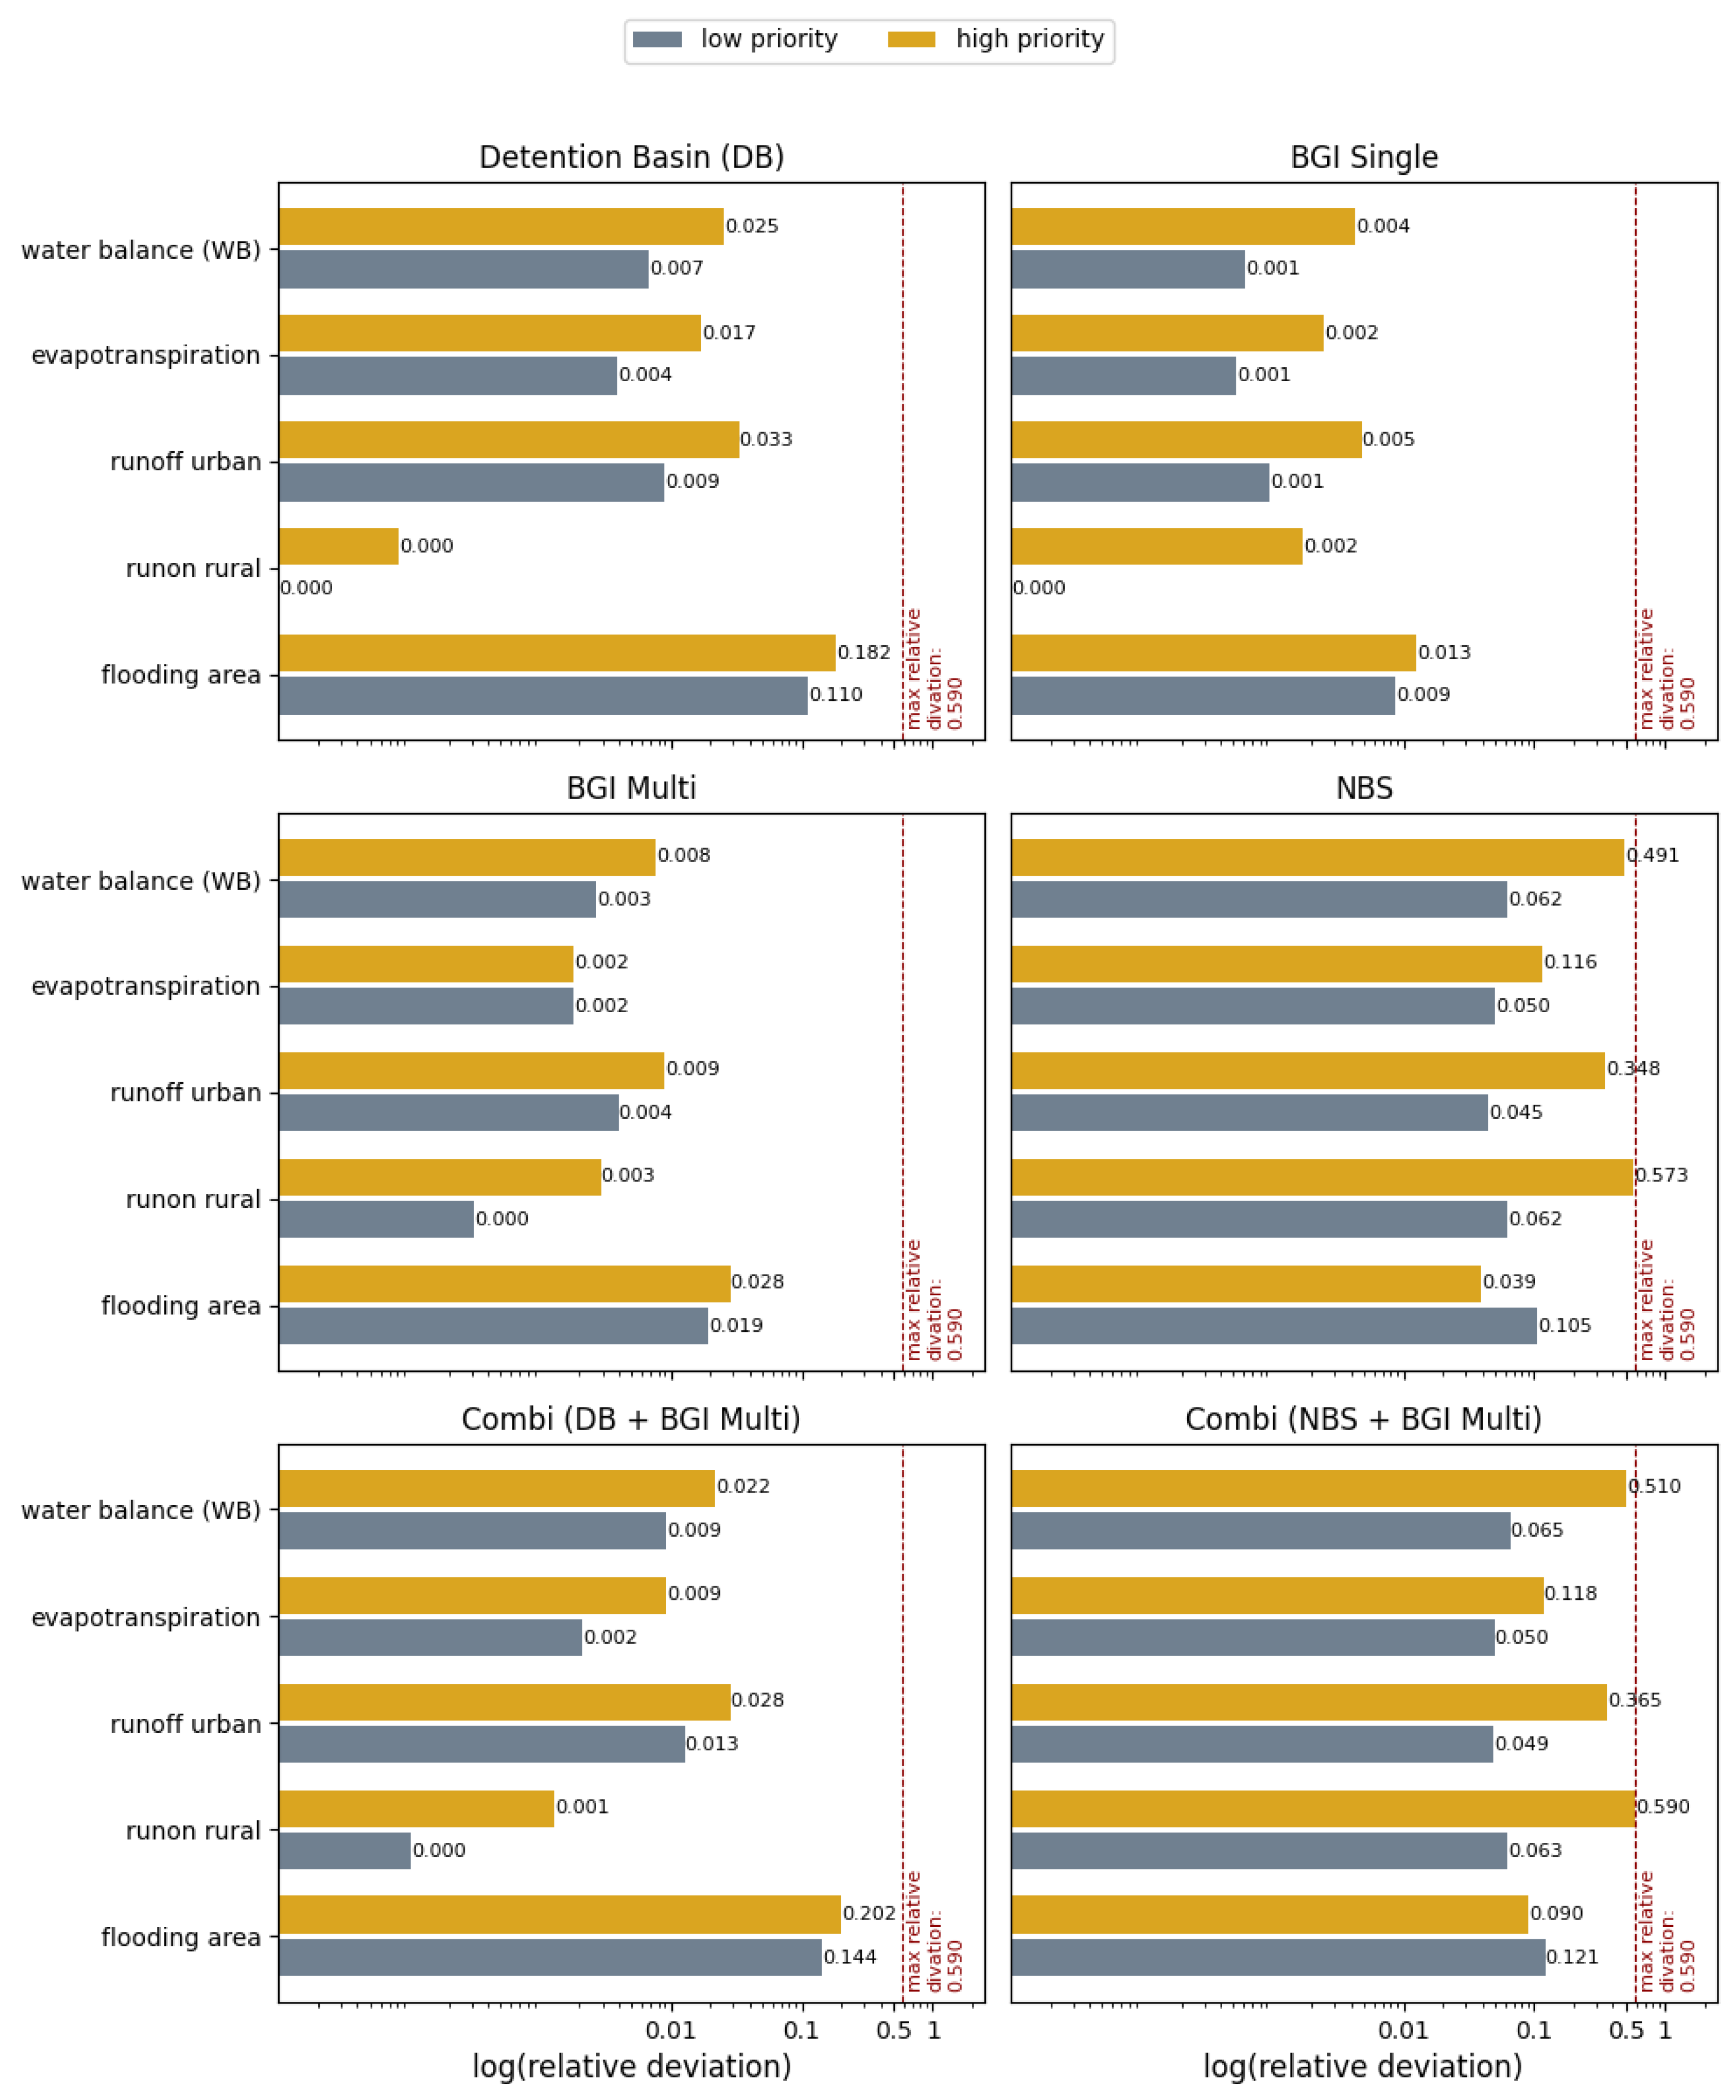
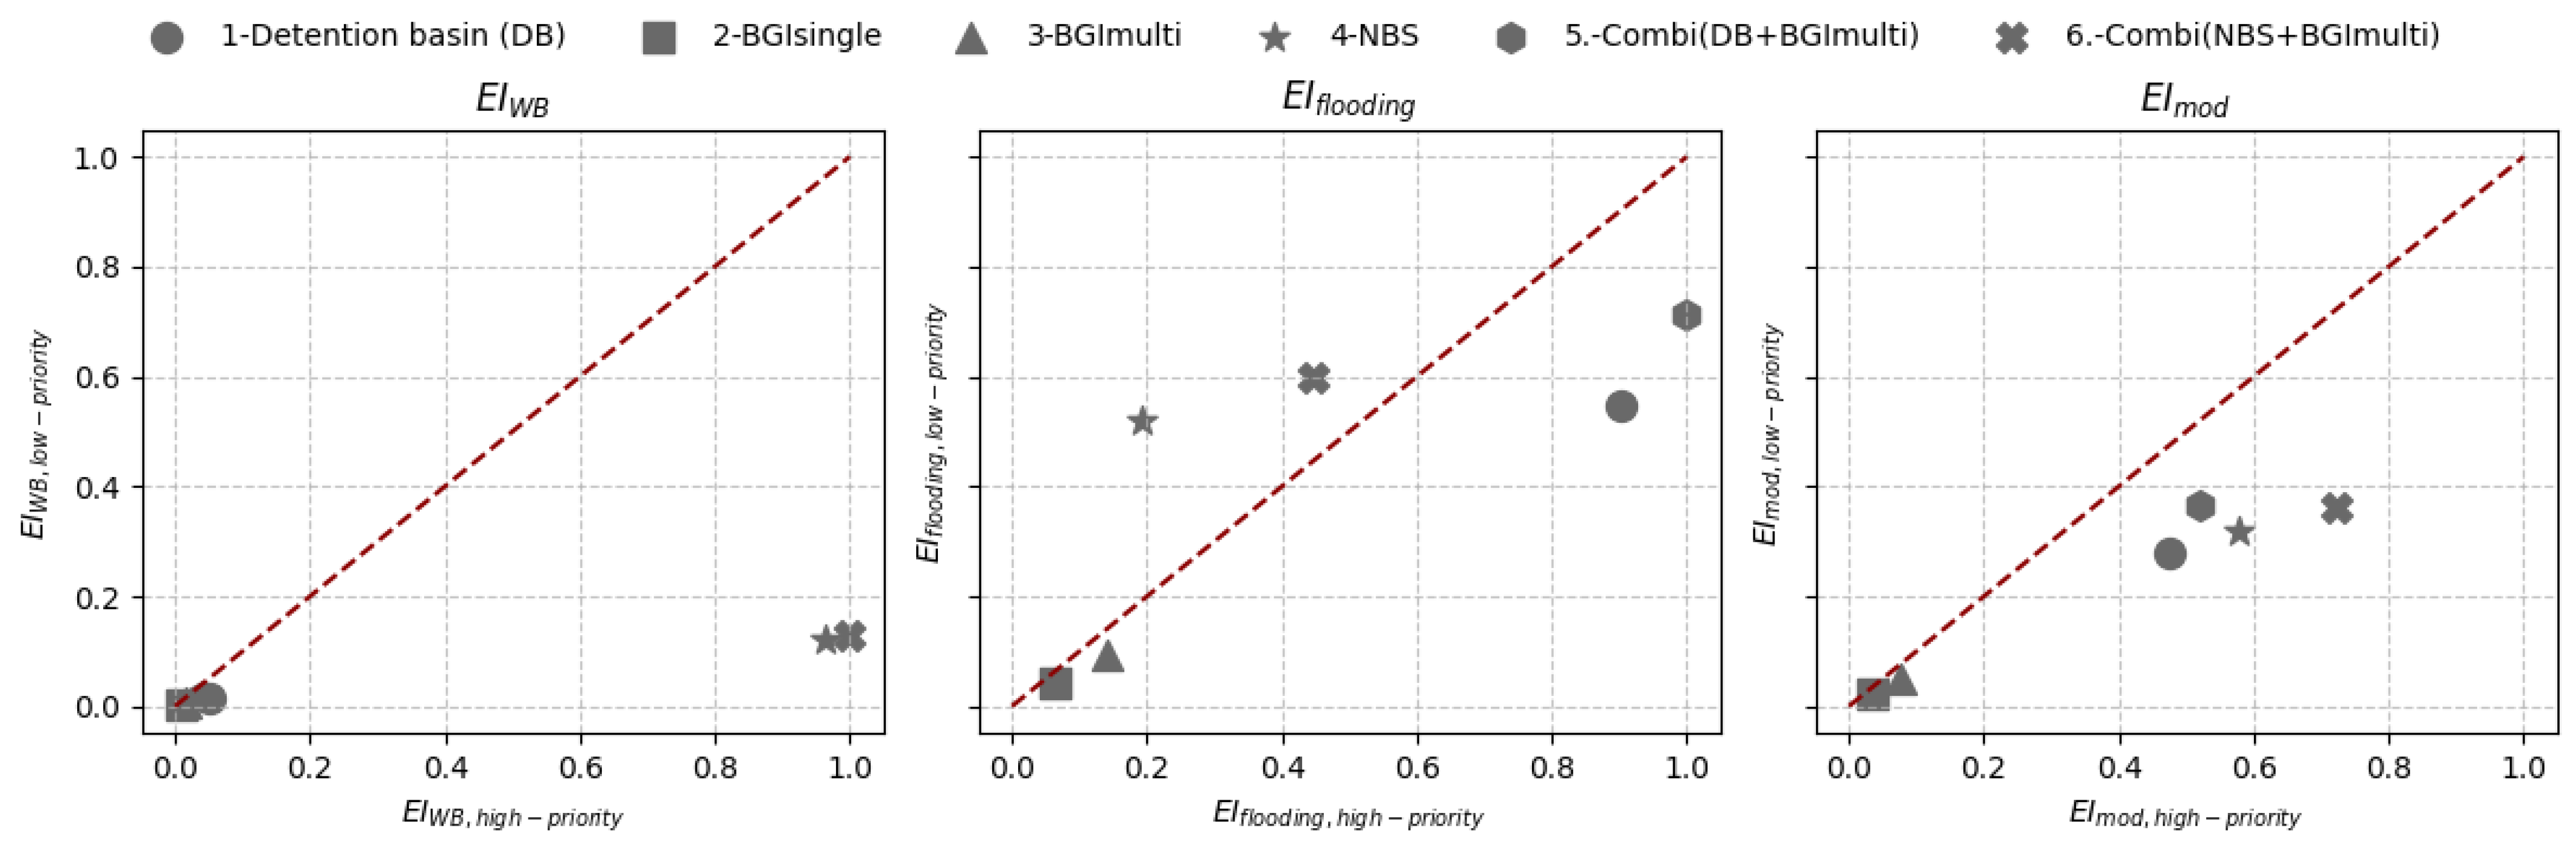
3.3. Benefit Analysis

The benefit of the strategies was quantified using the modified efficiency index (EImod). Table A2 in Appendix C summarises the absolute values of the relevant model outputs (flooding area, urban runoff, rural runoff, evapotranspiration, and infiltration in the urban catchment) for each of the 12 simulated scenarios and the reference scenario. Each simulated flooding area for the 22 August 2020 storm event reduced the extent of flooding. The results ranged from 123,700 to 153,594 m2, with a reference value of 154,955 m2. The most minor reduction was observed in the BGIsingle scenario (A.2 and B.2), while the most considerable reduction occurred in the combined scenario of the detention basin and BGImulti (A.5 and B.5).
All simulated strategies increased evapotranspiration and decreased runoff in urban and rural catchments. The scenario combining NBS with BGImulti (A.6 and B.6) yielded the most remarkable improvements in all water balance components, whereas the BGIsingle scenarios showed minor improvements.
Furthermore, the relative deviation between the reference scenario and the simulated strategies was determined (Figure 6). In addition to the flooding area, the components of the urban water balance and the resulting combined WB value were used to assess changes in the urban water balance.
Each comparison between high-priority and low-priority scenarios resulted in a higher relative deviation regarding the urban water balance components. The relative deviation of the combined water balance objective (WB) ranged from 0.4 (BGIsingle (B.2)) to 51 percent (Combi(NBS+BGImulti) (B.6)) improvement for strategies in the highest (high)-priority locations. In contrast, low-priority strategies showed a lower range of improvement, ranging from 0.1 (BGIsingle (A.2)) to 6.5 percent (Combi(NBS+BGImulti) (A.6)).
The relative deviation in the flooding area showed a higher range of improvements for the highest (high)-priority locations in each simulated scenario, except for NBS (A.4 and B.4) and the combined scenario of NBS and BGImulti (A.6 and B.6). The combination of a detention basin and BGImulti resulted in the highest relative reduction in flooding area, with reductions of 20 (B.5) and 14 percent (A.5). The BGIsingle scenario at low-priority locations (A.2) exhibited the slightest reduction in flooding area (0.9 percent).
Each simulated strategy resulted in a greater benefit (EImod) in terms of flood reduction and urban water balance improvement in the scenarios with the highest (high)-priority locations (Table 4). The strategy with the greatest benefit for the study site was the NBS and BGImulti combined scenario, resulting in an EImod of 0.723. The BGIsingle strategy was the least efficient, with an EImod of 0.022 in terms of improvement.
The EImod was used to identify which simulated strategy at which location resulted in greater benefits (Figure 7). A spatial comparison revealed that the strategies implemented in the highest (high)-priority locations had higher EImod values than those in the low-priority locations. Similar results were observed for the combined water balance change (WB). Only the two mitigation strategies that included NBS in rural catchments (scenarios 4 and 6) resulted in greater benefits regarding flooding area reduction for implementation in low-priority locations.

4. Discussion

4.1. Identification of High-Priority Strategy Sites

Applying the workflow resulted in a priority map for the study site in Feldbach, which combines flood hazard and urban heat island indicators. To obtain the definitions for the simulation scenarios, the resulting priority map was used. It is considered suitable for determining where to implement a strategy to enhance urban flood resilience. The application described herein illustrates one possible application of this priority map. Another potential use is in planning, designing, and optimising urban drainage systems through implementing decentralised BGI measures (e.g., tree pits) in the identified locations.
The results revealed many of the highest-priority locations in the study area, with just one in the detailed urban area. This finding contrasts with the widely accepted view that densely built urban areas are more susceptible to flood hazards [7] and heat stress [29,63] than rural areas. High-priority locations are identified based on classification using the percentile values within the total study site area; this approach does not represent an absolute ranking. The flood hazard indicator, assessed through GIS-based flow path analysis, is the primary influence on this classification, leading to a greater flood potential at slope transitions in the hilly peri-urban surroundings, which are not part of the detailed urban area, supporting the findings regarding catchment characteristics reported by Reinstaller et al. [17].
In contrast to other methods of identifying the best strategy locations (e.g., SCALGO Live [26]), the developed workflow integrates flood hazard and surface temperature data. This approach aligns with the three-step method proposed by Alves et al. [44] but offers higher spatial resolution, allowing more precise identification. A physics-based modelling approach through model-based benefit analysis also ensures a more realistic assessment. Therefore, the presented workflow constitutes an advancement of the three-step approach. Furthermore, social quantities, such as population density, or economic vulnerability, as indicated by economic income, represent further options for prioritisation indicators if the data requirement is available [16].
Both indicators were classified into four priority classes (0 = low, and 3 = highest) to identify high-priority locations. This classification contrasts with flood risk analyses, in which three or five classes are typically employed [64,65,66,67,68], with the option of a medium class definition. This classification focuses on distinguishing the maximum and minimum values of both indicators. A two-class system is also suitable in this context but has a disadvantage: the statistical distribution of the indicators is not entirely considered. Therefore, the four-class system, with two classes each in the lower and upper ranges, offers a suitable compromise between simplicity and representativeness. The percentile thresholds prevent direct class comparisons between different study sites. The aim of this classification scheme is not to compare different study sites. Instead, the thresholds clearly distinguish between the highest and lowest indicators inside one study site.
The additional benefit of the presented classification is the straightforward interpretation of the prioritisation results with the classification between 0 and 9. This approach improves the discussion and interpretation of the identified locations with each stakeholder (politician, scientist, engineer, water department, agriculture department, and population) involved in the decision-making process.

4.2. Impact of the Strategy Design Parameters on Benefits

Our strategy was designed according to the Austrian standards, with the given design parameters (upslope catchment area, boundary conditions for outflow control, soil conditions, and land cover distribution) of the selected location to ensure the realistic planning of mitigation strategies. This approach constitutes a practical engineering method.
The upslope catchment area, a key design parameter for determining inflow water volume, was significantly larger in the high-priority locations (9.7 to 510.2 hectares) than in the low-priority locations (1.2 to 34.8 hectares). Applying the topographic flow path to quantify flood hazards explains this outcome because this approach considers the connected catchment area to be one key parameter [40]. Consequently, a larger connected catchment area resulted in a greater flood hazard and a greater required retention volume.
These findings align with the results reported by Birkinshawand and Krivtsov [18], who demonstrated that catchment size and land cover distribution influence the required retention volume and, subsequently, the effectiveness of using a retention basin as a flood mitigation strategy. This finding underscores the necessity of incorporating design parameters, particularly the contribution of the upslope catchment area, when identifying high-priority locations for flood mitigation strategies.

4.3. Benefits of Mitigation Strategies

The second part of the workflow evaluates mitigation strategy benefits using the modified efficiency index (EImod). This analysis quantifies the benefit by combining the flooding area (EIflooding) with improving the water balance (EIWB).
The results showed that high-priority locations yielded higher benefits (EImod between 0.036 and 0.723) than low-priority locations (EImod between 0.022 and 0.366). Therefore, the findings support the established understanding that implementation location significantly influences overall system efficiency in increasing urban flood resilience in the short and long terms [18,44].
The results further identified that the scenario combining NBS with multiple BGI strategies at high-priority sites (compare EImod for the B-6 strategy) was the most beneficial strategy (EImod of 0.723). While this method can quantify the overall system benefit, it cannot determine the most efficient strategy. Considering economic objectives (e.g., life-cycle cost) can enable such optimisation.
A detailed analysis of the EIflooding sub-parameter revealed that NBS scenarios in the rural boundary catchment area led to a greater reduction in flooding area at the low-priority locations (10.5% in A.4 and 12.1% in A.6) compared to that in the high-priority locations (4% in B.4 and 9% in B.6). The potential downstream flooding area from locations where both streams discharge into the existing stormwater system explains this result. The analysis indicated that the potential flooding area is greater along the canalised Aderbach (Apotential = 61,687 m2, streamline length = 1552 m, and 172 manholes) than along the Oederbach (Apotential = 13,738 m2, streamline length = 761 m, and 32 manholes) (Figure 8).
As a result, in the NBS scenarios, reducing inflow from rural catchments had a greater impact on flood area reduction (EIflooding) in the smaller Aderbach catchment. However, only the upstream catchment area was considered in the presented flood hazard prioritisation based on the topographic analysis. Applying a 2D urban flood model would enable a better consideration of potential flooding areas and improve the selection of high-priority locations.

4.4. Limitations and Improvements

Combining two objectives in a multiplicative way enables the selection of locations only where both indicators (high flood risk and high surface temperature) are relevant. This approach guarantees that both objectives, namely reducing flooded area and improving the water balance, which are also key goals of BGI strategies [7], are achieved.
Finding the optimal locations for implementing mitigation strategies is a spatial multi-objective optimisation problem. The two objectives, minimising flooding area and maximising the urban water balance, constitute a classical multi-objective optimisation problem, which can be solved using MOO algorithms (e.g., NSGA-II [20]). The resulting Pareto-optimal solutions require numerous model simulations for each potential location for implementing the strategy, which must be simulated with each appropriate mitigation strategy.
The presented priority map leads to a sharp reduction in the number of possible locations with the highest priority (class 9), as the boundary condition for implementation is that both indicators must be of the highest priority class (class 3). This assumption reflects the planning objective of addressing both resilience goals simultaneously [7]. As such, the priority map reduces the number of required simulations while still supporting the identification of Pareto-optimal solutions.
Furthermore, incorporating economic parameters, such as design volume in relation to cost per storage or land unit, would help quantify mitigation strategy efficiency from an economic perspective after the assessment phase. Such a cost–benefit analysis requires local cost rates for construction, planning, and maintenance and the definition of a mean interest rate for life-cycle cost calculations. It is important to emphasise that these cost estimations introduce considerable uncertainties due to assumptions regarding regional cost rates and data availability. A more robust and region-specific cost–benefit analysis, as demonstrated by Huang et al. [69], would reduce these uncertainties and provide a more comprehensive understanding of the economic impact of mitigation strategies.
The strategy scenario can only be implemented in a realistic way if it is technically feasible at the identified site. To plan appropriately and establish the feasibility of implementation, it is necessary to assess the given location thoroughly. In other words, evaluating which strategies are suitable for which sites is essential. Developing a suitability map that includes construction parameters such as infiltration capacity, groundwater depth, and other relevant factors can fulfil this requirement. For this reason, the identified locations provide a basis for selecting suitable strategies. Combining with a suitability map would further enhance the decision-making process concerning realistic mitigation strategy implementation and planning.
All discussion points are based on the results of one specific study site with an individual hydrological and topographic character. Applying the presented workflow for further study sites would improve the robustness of the main study findings.
The results are based on simulations using one well-documented heavy storm event and one year of precipitation data to estimate the long-term impact of the strategies. However, this precipitation dataset does not capture the full variability of potential rainfall patterns at the study site. Therefore, additional simulations of multiple observed heavy storm events, ideally those associated with documented damage, are required to improve the representativeness of the analysis. Such events are currently lacking in the available database. Furthermore, incorporating different climate change scenarios for extreme storm events and long-term precipitation would enable a more comprehensive assessment of uncertainties within the strategy assessment part using the presented EImod. This step would enhance the robustness and reliability of the overall analysis.

5. Conclusions

The developed workflow utilises high-resolution flood hazard and surface temperature data to generate priority maps for flood mitigation and urban heat island reduction at the city scale. The first key outcome was the creation of a priority map identifying suitable locations for implementing blue–green infrastructure (BGI) strategies. The second primary outcome was the use of these identified locations to plan and design mitigation strategy scenarios. Physically based models assessed the benefit of each analysed strategy, providing a quantitative performance evaluation to support the decision-making process. The workflow was successfully implemented and tested at the study site (Feldbach, Austria), leading to the following main findings:
  • The presented workflow supports the development of high-resolution priority maps to determine the best locations for implementing BGI strategies. The workflow successfully supported urban flood mitigation strategy planning at the study site (Feldbach). This map can support the development of an integrated urban water management plan, representing one requirement for planning future urban water systems.
  • The most beneficial strategy combined multiple BGI strategies with nature-based solutions (NBSs) in rural upstream areas. These strategies resulted in the highest short-term benefits (flood area reduction) and long-term advantages (improvements in urban water balance). Furthermore, each strategy implemented at the highest-priority locations demonstrated a greater range of benefits compared to those implemented at low-priority locations.
  • We recommend extending the potential flooding areas in the prioritisation process to enhance the identification of high-priority locations regarding flood hazards. The findings suggest that the drainage characteristics of the sewer system strongly influence these areas, especially in locations where watercourses are channelled through urban areas.
  • The proposed workflow does not find optimal solutions for determining where to implement mitigation strategies, but it provides a basis for multi-objective optimisation algorithms (MOOAs). While the current approach focuses on technical benefits, incorporating economic considerations in the assessment (e.g., construction and maintenance costs) would be a valuable extension.

Author Contributions

Conceptualisation, S.R., A.W.K. and D.M.; methodology, S.R. and A.W.K.; software, S.R.; validation, S.R.; formal analysis, S.R. and A.W.K.; investigation, S.R.; resources, S.R.; data curation, S.R.; writing—original draft preparation, S.R.; writing—review and editing, S.R., A.W.K. and D.M.; visualisation, S.R. and A.W.K.; supervision, D.M.; project administration, S.R. and A.W.K.; funding acquisition, S.R., A.W.K. and D.M. All authors have read and agreed to the published version of this manuscript.

Funding

This research was part of the research project “PeriSponge”. This project is funded by the Austrian Climate and Energy Fund (https://www.klimafonds.gv.at/) and administrated by the Austrian Research Promotion Agency (FFG) (www.ffg.at) under project number FO999892011 (accessed on 2 April 2025). The TU Graz Open Access Publishing Fund supported this work.

Attachment

The BGIsite tool can be downloaded at https://zenodo.org/records/14579482. A short description of the tool is attached in Appendix A. Furthermore, an unpublished preDesign tool in QGIS was used to determine the required design volume for the strategies. A short description of this tool is presented in Appendix B. A summary of the simulation results for each required model variable is presented in Appendix C.

Data Availability Statement

All the data for the topographic flow path analysis used as an input to create the urban heat island map were based on the open data from a government data platform: https://data.steiermark.at/ (digital elevation model (DEM), digital surface model (DSM), and coloured infrared image (CIR)). The DEM, building data, and the streamlined data used to create the flood hazard map were created using or obtained from the same data source. The digital sewer data used for the 1D-2D model and the calibration data were provided by the city of Feldbach. They can be provided on request. For the precipitation data, the data hub of geosphere Austria (https://data.hub.geosphere.at/) was used.

Acknowledgments

We want to acknowledge all project partners of the PeriSponge research project for supporting this study and its inputs. Several Feldbach departments supported this study using the integrated 1D-2D urban flood model. Additionally, we are very grateful for the assistance of Computational Hydraulics International (CHI-Water), which supported this research by providing access to PCSWMM2D software. Open Access Funding by the Graz University of Technology.

Conflicts of Interest

The authors declare no conflicts of interest.

Abbreviations

BGIBlue-Green Infrastructure
CIRColoured infrared images
DEMDigital elevation model
DSMDigital surface model
EIEfficiency index
EImodModified efficiency index
GISGeographic information system
NBSNature-based solutions
MOOAMulti-objective optimisation algorithm
SWMMStormwater management model
WBWater balance

Appendix A. BGIsite, a QGIS Tool

The presented workflow served as the basis for developing the BGIsite tool [54]. This tool uses the model designer of the open-source software QGIS (version: 3.34.3 [51]) to generate a priority map based on flood hazard and heat stress raster data. Several standard QGIS functions and the functions of the open-source package WhiteboxTools [52] are combined with custom-developed functions (e.g., localMax and classification functions) using PyQGIS [53].
Only high-resolution surface temperature data from remote sensing infrared imagery or GIS-based microclimate analysis are required to create an urban heat island map. This tool currently offers two options for determining flood hazard: (i) topographic flow path analysis and (ii) flood area raster data based on 2D hydrodynamic models.
In addition to the general flood hazard data, the tool requires a modified digital elevation model (DEM) to determine the required flow accumulation raster data, local maximum point layer, and the corresponding watershed raster data for each local maximum point. The general algorithm (Figure A1), which generates a priority map for BGI sites at the city scale, is documented in the BGIsite tool documentation.
Figure A1. Main algorithm of the BGIsite tool used to create a city-scale priority map as an output of the first part of the presented workflow.
Hydrology 12 00125 g0a1

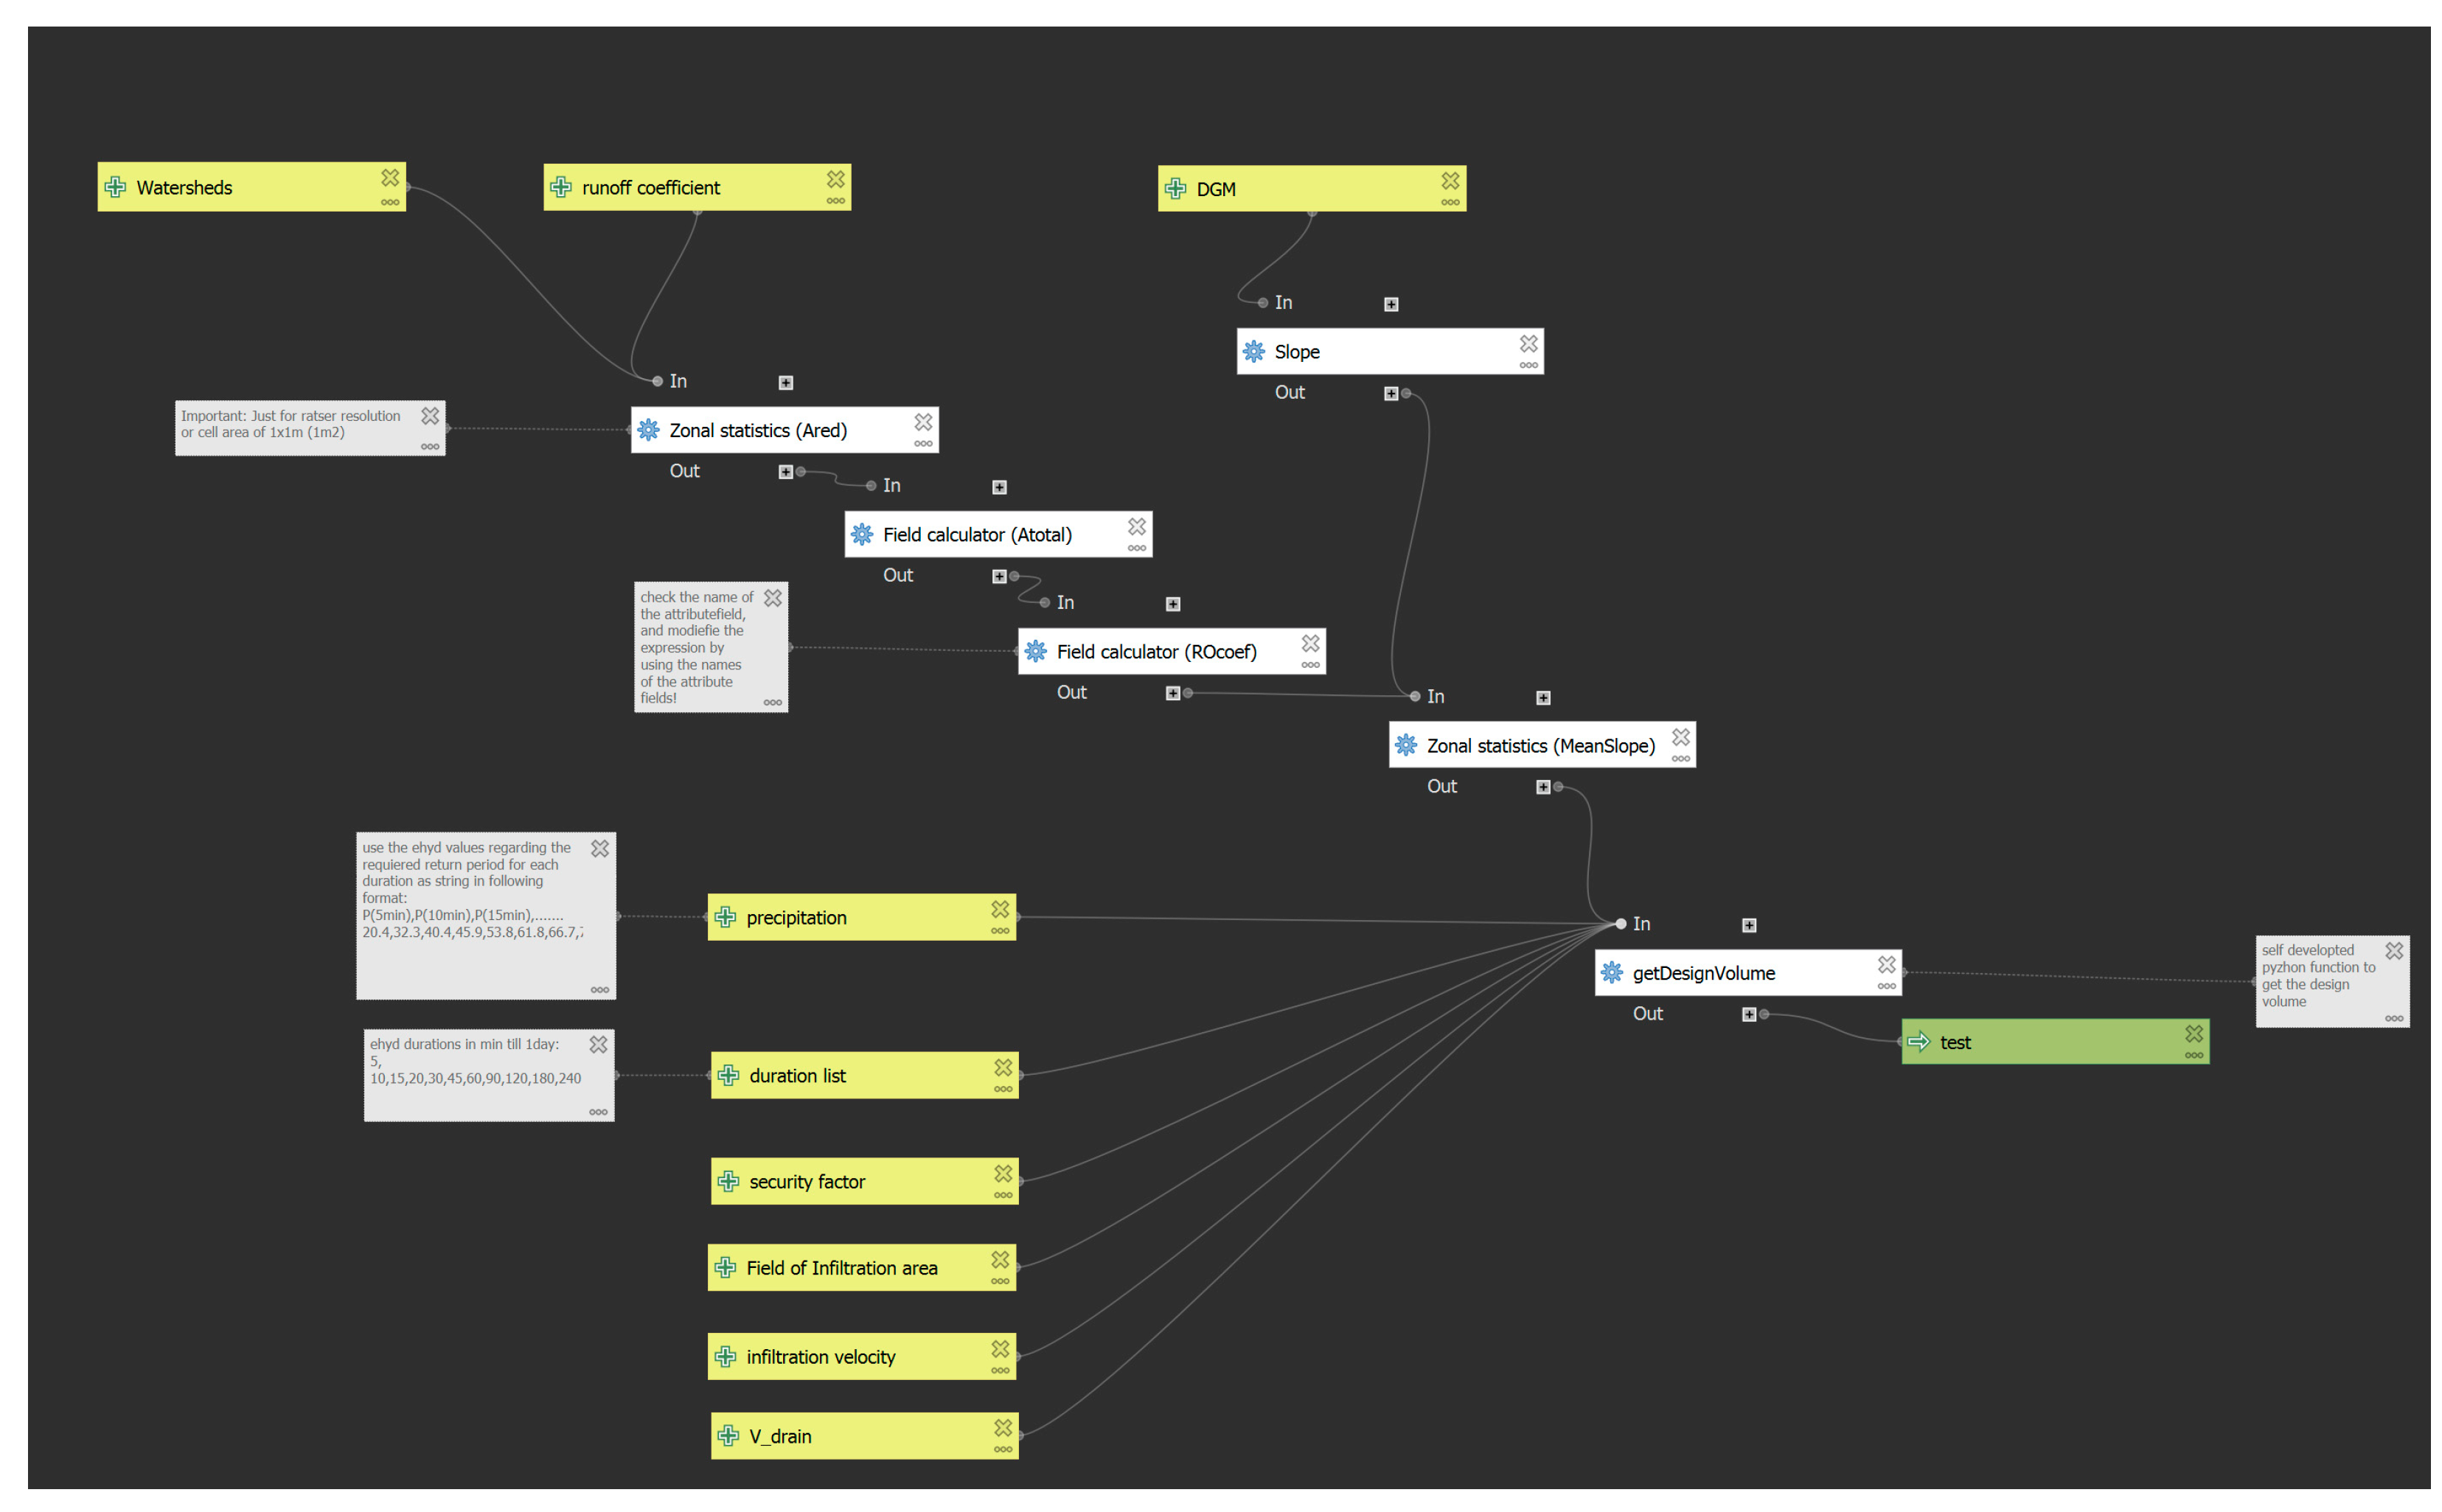
Appendix B. PreDesign, a QGIS Tool

This algorithm is based on the design standard for stormwater measures as based on infiltration processes in Austria [60]. It was developed using QGIS model designer, which generates a polygon layer containing all required design parameters as attributes (design volume, runoff coefficient, catchment area, and mean slope). Each polygon represents the connected watershed corresponding to the selected implementation location, which is defined as a point layer. The following data requirements must be met to apply the PreDesign tool (Table A1): one must have (i) a geographically related point file that defines the location where the strategy will be implemented; (ii) a spatially distributed raster file with the runoff coefficient depending on the land cover; (iii) a statistical precipitation time series for setting the designed amount of rainfall; (iv) and a digital elevation model for estimating the mean slope in the catchment.
Table A1. Data requirement for using PreDesign.
DataTyp
Flow accumulationRaster
Runoff coefficientRaster
Digital elevation model (DEM)Raster
Precipitation data[-]
Information regarding the design return period at the location and the base outflow design condition[-]
Location where the strategy will be implementedVector (point)
The maximum value between the inflow and outflow of the strategies determines the design volume. Inflow is calculated based on the catchment area, the mean runoff coefficient within the catchment, and the precipitation for each duration (5 min–8640 min). The outflow is determined by the sum of the possible infiltration rate and the controlled outflow of the strategy (e.g., weir discharge or bottom-orifice outflow). The custom-developed function getDesignVolume was implemented using PyQGIS and integrated into the PreDesign tool (Figure A2) to compute the design volume.
Figure A2. The main algorithms of the PreDesign tool integrated with the model designer in QGIS.
Hydrology 12 00125 g0a2

Appendix C. Overview of the Simulation Results

Table A2. Overview of the absolute simulation results for each scenario for the relevant subparts EIFlooding and EIWB of the reduction index (EImod) used to assess mitigation strategies.
NameFlooding Area
[m2] *
Runoff Rural
[mm]
Runoff Urban
[mm]
Evapotranspiration Urban [mm]Infiltration Urban[mm]
Reference154,955480.5840.11132.38323.38
A.1—Detention basin (DB)137,851480.5832.53133.01330.38
A.2—BGIsingle153,594480.5839.31132.42324.24
A.3—BGImulti151,994480.4836.8132.25326.77
A.4—NBS138,755450.5802.65139.18323.38
A.5—Combination (DB+BGImulti)132,646480829.44132.77333.77
A.6—Combination
(NBS+BGImulti)
136,237450.41799.24139.07326.73
B.1—Detention basin (DB)126,782480.5812.31134.76348.91
B.2—BGIsingle153,001480836.1132.82326.23
B.3—BGImulti150,557479.14832.58132.73329.17
B.4—NBS148,915205.05547.67147.8323.38
B.5—Combination (DB+BGImulti)123,700480816.25133.72345.42
B.6—Combination
(NBS+BGImulti)
141,019197.09533.52148.07329.16
* Flooding area defined as each raster cell with a maximum water depth of 0.1 m.

References

  1. Intergovernmental Panel on Climate Change (IPCC) Climate Change 2022—Impacts, Adaptation and Vulnerability: Working Group II Contribution to the Sixth Assessment Report of the Intergovernmental Panel on Climate Change, 1st ed.; Cambridge University Press: Cambridge, UK, 2023; ISBN 978-1-00-932584-4.
  2. O’Donnell, E.C.; Thorne, C.R. Drivers of Future Urban Flood Risk. Philosophical Transactions of the Royal Society A: Mathematical. Phys. Eng. Sci. 2020, 378, 20190216. [Google Scholar] [CrossRef]
  3. Newman, R.; Noy, I. The Global Costs of Extreme Weather That Are Attributable to Climate Change. Nat. Commun. 2023, 14, 6103. [Google Scholar] [CrossRef] [PubMed]
  4. Zaveri, M.; Haag, M.; Playford, A.; Schweber, N. How the Storm Turned Basement Apartments into Death Traps. New York Times. 2021. Available online: https://www.nytimes.com/2021/09/02/nyregion/basement-apartment-floods-deaths.html (accessed on 30 October 2024).
  5. Beven, J.L.; Hagen, A.; Berg, R. Hurricane Ida (AL092021); National Hurricane Center: Miami, FL, USA, 2022.
  6. Lehmkuhl, F.; Schüttrumpf, H.; Schwarzbauer, J.; Brüll, C.; Dietze, M.; Letmathe, P.; Völker, C.; Hollert, H. Assessment of the 2021 Summer Flood in Central Europe. Environ. Sci. Eur. 2022, 34, 107. [Google Scholar] [CrossRef]
  7. O’Donnell, E.; Thorne, C.; Ahilan, S.; Arthur, S.; Birkinshaw, S.; Butler, D.; Dawson, D.; Everett, G.; Fenner, R.; Glenis, V.; et al. The Blue-Green Path to Urban Flood Resilience. Blue Green Syst. 2019, 2, 28–45. [Google Scholar] [CrossRef]
  8. Savić, D. Urban Flood Risk and Resilience: How Can We Protect Our Cities from Flooding? Hydrology 2025, 12, 78. [Google Scholar] [CrossRef]
  9. Abduljaleel, Y.; Salem, A.; ul Haq, F.; Awad, A.; Amiri, M. Improving Detention Ponds for Effective Stormwater Management and Water Quality Enhancement under Future Climate Change: A Simulation Study Using the PCSWMM Model. Sci. Rep. 2023, 13, 5555. [Google Scholar] [CrossRef]
  10. Nordbeck, R.; Steurer, R.; Löschner, L. The Future Orientation of Austria’s Flood Policies: From Flood Control to Anticipatory Flood Risk Management. J. Environ. Plan. Manag. 2019, 62, 1864–1885. [Google Scholar] [CrossRef]
  11. Almaaitah, T.; Appleby, M.; Rosenblat, H.; Drake, J.; Joksimovic, D. The Potential of Blue-Green Infrastructure as a Climate Change Adaptation Strategy: A Systematic Literature Review. Blue Green Syst. 2021, 3, 223–248. [Google Scholar] [CrossRef]
  12. Versini, P.-A.; Kotelnikova, N.; Poulhes, A.; Tchiguirinskaia, I.; Schertzer, D.; Leurent, F. A Distributed Modelling Approach to Assess the Use of Blue and Green Infrastructures to Fulfil Stormwater Management Requirements. Landsc. Urban Plan. 2018, 173, 60–63. [Google Scholar] [CrossRef]
  13. Ghofrani, Z.; Sposito, V.; Faggian, R. A Comprehensive Review of Blue-Green Infrastructure Concepts. Int. J. Environ. Sustain. 2017, 6, 15–36. [Google Scholar] [CrossRef]
  14. Liao, K.-H.; Deng, S.; Tan, P.Y. Blue-Green Infrastructure: New Frontier for Sustainable Urban Stormwater Management. In Greening Cities: Forms and Functions; Tan, P.Y., Jim, C.Y., Eds.; Springer: Singapore, 2017; pp. 203–226. ISBN 978-981-10-4113-6. [Google Scholar]
  15. European Union. Directive (EU) 2024/3019 of the European Parliament and of the Council of 27 November 2024 Concerning Urban Wastewater Treatment (Recast) (Text with EEA Relevance); European Union: Brussels, Belgium, 2024. [Google Scholar]
  16. Czyża, S.; Kowalczyk, A.M. Applying GIS in Blue-Green Infrastructure Design in Urban Areas for Better Life Quality and Climate Resilience. Sustainability 2024, 16, 5187. [Google Scholar] [CrossRef]
  17. Reinstaller, S.; Funke, F.; König, A.W.; Pichler, M.; Kleidorfer, M.; Muschalla, D. Resilient Urban Flood Management: A Multi-Objective Assessment of Mitigation Strategies. Sustainability 2024, 16, 4123. [Google Scholar] [CrossRef]
  18. Birkinshaw, S.J.; Krivtsov, V. Evaluating the Effect of the Location and Design of Retention Ponds on Flooding in a Peri-Urban River Catchment. Land 2022, 11, 1368. [Google Scholar] [CrossRef]
  19. D’Ambrosio, R.; Balbo, A.; Longobardi, A.; Rizzo, A. Re-Think Urban Drainage Following a SuDS Retrofitting Approach against Urban Flooding: A Modelling Investigation for an Italian Case Study. Urban For. Urban Green. 2022, 70, 127518. [Google Scholar] [CrossRef]
  20. Ur Rehman, A.; Glenis, V.; Lewis, E.; Kilsby, C. Multi-Objective Optimisation Framework for Blue-Green Infrastructure Placement Using Detailed Flood Model. J. Hydrol. 2024, 638, 131571. [Google Scholar] [CrossRef]
  21. Lu, W.; Xia, W.; Shoemaker, C.A. Surrogate Global Optimization for Identifying Cost-Effective Green Infrastructure for Urban Flood Control With a Computationally Expensive Inundation Model. Water Resour. Res. 2022, 58, e2021WR030928. [Google Scholar] [CrossRef]
  22. Leimgruber, J.; Krebs, G.; Camhy, D.; Muschalla, D. Model-Based Selection of Cost-Effective Low Impact Development Strategies to Control Water Balance. Sustainability 2019, 11, 2440. [Google Scholar] [CrossRef]
  23. Iliadis, C.; Glenis, V.; Kilsby, C. A Cost-Benefit ‘Source-Receptor’ Framework for Implementation of Blue-Green Flood Risk Management. J. Hydrol. 2024, 634, 131113. [Google Scholar] [CrossRef]
  24. Glenis, V.; Kutija, V.; Kilsby, C.G. A Fully Hydrodynamic Urban Flood Modelling System Representing Buildings, Green Space and Interventions. Environ. Model. Softw. 2018, 109, 272–292. [Google Scholar] [CrossRef]
  25. Rossman, L.A.; Simon, M.A. Storm Water Management Model User’s Manual, Version 5.2; United States Environmental Protection Agency: Washington, DC, USA, 2022.
  26. SCALGO Live. Available online: https://scalgo.com/de/ (accessed on 30 October 2024).
  27. Berndtsson, R.; Becker, P.; Persson, A.; Aspegren, H.; Haghighatafshar, S.; Jönsson, K.; Larsson, R.; Mobini, S.; Mottaghi, M.; Nilsson, J.; et al. Drivers of Changing Urban Flood Risk: A Framework for Action. J. Environ. Manag. 2019, 240, 47–56. [Google Scholar] [CrossRef] [PubMed]
  28. Sun, Z.; Wang, Q.; Batkhishig, O.; Ouyang, Z. Relationship between Evapotranspiration and Land Surface Temperature under Energy- and Water-Limited Conditions in Dry and Cold Climates. Adv. Meteorol. 2016, 2016, 1835487. [Google Scholar] [CrossRef]
  29. Back, Y.; Bach, P.M.; Jasper-Tönnies, A.; Rauch, W.; Kleidorfer, M. A Rapid Fine-Scale Approach to Modelling Urban Bioclimatic Conditions. Sci. Total Environ. 2021, 756, 143732. [Google Scholar] [CrossRef]
  30. Hiscock, O.H.; Back, Y.; Kleidorfer, M.; Urich, C. A GIS-Based Land Cover Classification Approach Suitable for Fine-scale Urban Water Management. Water Resour Manag. 2021, 35, 1339–1352. [Google Scholar] [CrossRef]
  31. CHI PCSWMM. Available online: https://www.pcswmm.com/ (accessed on 2 November 2024).
  32. James, R.; Finney, K.; Perera, N.; Peyron, N. SWMM5/PCSWMM Integrated 1D-2D Modeling. In Proceedings of the Engineering Conferences International ECI Digital Archives, Boulder, CO, USA, 24–26 September 2012. [Google Scholar]
  33. Autodesk InfoWorks ICM. Available online: https://help.autodesk.com/view/IWICMS/2024/ENU/ (accessed on 2 November 2024).
  34. EDF-R&D. Telemac-2D Users Manual, Version V8p1; EDF-R&D: Moret Sur Loing, France, 2020. [Google Scholar]
  35. Basement; Version 4.1.0; Basic Simulation Environment for Computation of Environmental Flows and Natural Hazard Simulation; ETH Zurich: Zurich, Switzerland, 2024; Available online: https://basement.ethz.ch/ (accessed on 2 November 2024).
  36. Vetsch, D.; Bürgler, M.; Gerke, E.; Kammerer, S.; Vanzo, D.; Boes, R. BASEMENT—Softwareumgebung zur numerischen Modellierung der Hydro- und Morphodynamik in Fließgewässern. Österr Wasser Abfallw. 2020, 72, 281–290. [Google Scholar] [CrossRef]
  37. Brunner, G.W. HEC-RAS 2D User’s Manual; USACE Hydrologic Engineering Center: Davis, CA, USA, 2024. [Google Scholar]
  38. Jamali, B.; Bach, P.M.; Cunningham, L.; Deletic, A. A Cellular Automata Fast Flood Evaluation (CA-Ffé) Model. Water Resour. Res. 2019, 55, 4936–4953. [Google Scholar] [CrossRef]
  39. Sharifian, M.K.; Kesserwani, G.; Chowdhury, A.A.; Neal, J.; Bates, P. LISFLOOD-FP 8.1: New GPU-Accelerated Solvers for Faster Fluvial/Pluvial Flood Simulations. Geosci. Model Dev. 2023, 16, 2391–2413. [Google Scholar] [CrossRef]
  40. Huang, H.; Chen, X.; Wang, X.; Wang, X.; Liu, L. A Depression-Based Index to Represent Topographic Control in Urban Pluvial Flooding. Water 2019, 11, 2115. [Google Scholar] [CrossRef]
  41. O’Callaghan, J.F.; Mark, D.M. The Extraction of Drainage Networks from Digital Elevation Data. Comput. Vis. Graph. Image Process. 1984, 28, 323–344. [Google Scholar] [CrossRef]
  42. Flow Science, Inc. FLOW-3D. Available online: https://www.flow3d.com/ (accessed on 5 May 2025).
  43. Rong, Y.; Zhang, T.; Zheng, Y.; Hu, C.; Peng, L.; Feng, P. Three-Dimensional Urban Flood Inundation Simulation Based on Digital Aerial Photogrammetry. J. Hydrol. 2020, 584, 124308. [Google Scholar] [CrossRef]
  44. Alves, A.; van Opstal, C.; Keijzer, N.; Sutton, N.; Chen, W.-S. Planning the Multifunctionality of Nature-Based Solutions in Urban Spaces. Cities 2024, 146, 104751. [Google Scholar] [CrossRef]
  45. Korkou, M.; Tarigan, A.K.M.; Hanslin, H.M. The Multifunctionality Concept in Urban Green Infrastructure Planning: A Systematic Literature Review. Urban For. Urban Green. 2023, 85, 127975. [Google Scholar] [CrossRef]
  46. Back, Y.; Kumar, P.; Bach, P.M.; Rauch, W.; Kleidorfer, M. Integrating CFD-GIS Modelling to Refine Urban Heat and Thermal Comfort Assessment. Sci. Total Environ. 2023, 858, 159729. [Google Scholar] [CrossRef] [PubMed]
  47. Smith, G.P.; Davey, E.K.; Cox, R. Flood Hazard WRL Technical Report 2014/07; University of New South Wales: Sydney, NSW, Australia, 2014. [Google Scholar]
  48. Smith, G.; Modra, B.; Tucker, T.; Cox, R. Vehicle Stability Testing for Flood Flows; Technical Report 2017/07; Water Research Laboratory, University of New South Wales: Sydney, NSW, Australia, 2017; p. 62. [Google Scholar]
  49. Martin, P.; Baudouin, Y.; Gachon, P. An Alternative Method to Characterise the Surface Urban Heat Island. Int. J. Biometeorol. 2015, 59, 849–861. [Google Scholar] [CrossRef]
  50. Maranzoni, A.; D’Oria, M.; Rizzo, C. Quantitative Flood Hazard Assessment Methods: A Review. J. Flood Risk Manag. 2023, 16, e12855. [Google Scholar] [CrossRef]
  51. QGIS Development Team, QGIS Geographic Information System. Open Source Geospatial Foundation Project, 2024.3.34.3. 2024. Available online: http://qgis.osgeo.org (accessed on 3 November 2024).
  52. Lindsay, J.B. WhiteboxTools User Manual; Geomorphometry and Hydrogeomatics Research Group: Guelph, ON, Canada, 2020. [Google Scholar]
  53. PyQGIS Developer Cookbook—QGIS Documentation. Available online: https://docs.qgis.org/3.34/en/docs/pyqgis_developer_cookbook/ (accessed on 20 November 2024).
  54. Reinstaller, S. BGIsite Tool; Version 1.0.0.; Zenodo: Geneva, Switzerland, 2024. [Google Scholar] [CrossRef]
  55. GebreEgziabher, M.; Demissie, Y. Modeling Urban Flood Inundation and Recession Impacted by Presence of Manholes. Water 2020, 12, 1160. [Google Scholar] [CrossRef]
  56. Guo, K.; Guan, M.; Yu, D. Urban Surface Water Flood Modelling—A Comprehensive Review of Current Models and Future Challenges. Hydrol. Earth Syst. Sci. 2021, 25, 2843–2860. [Google Scholar] [CrossRef]
  57. Dong, B.; Xia, J.; Zhou, M.; Deng, S.; Ahmadian, R.; Falconer, R.A. Experimental and Numerical Model Studies on Flash Flood Inundation Processes over a Typical Urban Street. Adv. Water Resour. 2021, 147, 103824. [Google Scholar] [CrossRef]
  58. Reinstaller, S.; Krebs, G.; Pichler, M.; Muschalla, D. Identification of High-Impact Uncertainty Sources for Urban Flood Models in Hillside Peri-Urban Catchments. Water 2022, 14, 1973. [Google Scholar] [CrossRef]
  59. Reinstaller, S.; Funke, F.; Kleidorfer, M.; Muschalla, D. Urban Flood Prevention: The Effectiveness of Decentralised Stormwater Management Compared to Conventional Technical Measures. Osterr. Wasser Abfallwirtsch. 2023, 75, 626–633. [Google Scholar] [CrossRef]
  60. ÖNORM B 2506-1; Regenwasser-Sickeranlagen Für Abläufe von Dachflächen Und Befestigten Flächen. Teil 1: Anwendung, Hydraulische Bemessung, Bau Und Betrieb. Austrian Standards International: Vienna, Austria, 2013.
  61. Rossman, L.A.; Huber, W.C. Storm Water Management Model Reference Manual Volume III—Water Quality; EPA—United States Environmental Protection Agency: Cincinnati, OH, USA, 2016.
  62. GeoSpere Austria Geosphere Austria Data Hub. Available online: https://data.hub.geosphere.at/ (accessed on 27 December 2024).
  63. Bastin, J.-F.; Clark, E.; Elliott, T.; Hart, S.; Van Den Hoogen, J.; Hordijk, I.; Ma, H.; Majumder, S.; Manoli, G.; Maschler, J.; et al. Understanding Climate Change from a Global Analysis of City Analogues. PLoS ONE 2019, 14, e0217592. [Google Scholar] [CrossRef]
  64. Merz, B.; Thieken, A.; Gocht, M. Flood Risk Mapping At The Local Scale: Concepts and Challenges. In Flood Risk Management in Europe; Chapter 13, pp. 231–251, ISBN 978-1-4020-4199-0, 2007.
  65. Asare-Kyei, D.; Forkuor, G.; Venus, V. Modeling Flood Hazard Zones at the Sub-District Level with the Rational Model Integrated with GIS and Remote Sensing Approaches. Water 2015, 7, 3531–3564. [Google Scholar] [CrossRef]
  66. Deroliya, P.; Ghosh, M.; Mohanty, M.P.; Ghosh, S.; Rao, K.H.V.D.; Karmakar, S. A Novel Flood Risk Mapping Approach with Machine Learning Considering Geomorphic and Socio-Economic Vulnerability Dimensions. Sci. Total Environ. 2022, 851, 158002. [Google Scholar] [CrossRef]
  67. Bodoque, J.M.; Esteban-Muñoz, Á.; Ballesteros-Cánovas, J.A. Overlooking Probabilistic Mapping Renders Urban Flood Risk Management Inequitable. Commun. Earth Environ. 2023, 4, 279. [Google Scholar] [CrossRef]
  68. Rendana, M.; Idris, W.; Abd Rahim, S.; Abdo, H.; Almohamad, H.; Dughairi, A. Flood Risk and Shelter Suitability Mapping Using Geospatial Technique for Sustainable Urban Flood Management: A Case Study in Palembang City, South Sumatera, Indonesia. Geol. Ecol. Landsc. 2023, 1–11. [Google Scholar] [CrossRef]
  69. Huang, J.J.; Xiao, M.; Li, Y.; Yan, R.; Zhang, Q.; Sun, Y.; Zhao, T. The Optimization of Low Impact Development Placement Considering Life Cycle Cost Using Genetic Algorithm. J. Environ. Manag. 2022, 309, 114700. [Google Scholar] [CrossRef]
Figure 1. The main workflow for identifying high-priority locations for BGI strategy implementation (part 1) and quantifying the benefits of the implemented strategy based on flood hazard reduction (short-term impact) and urban water balance improvement (long-term impact).
Hydrology 12 00125 g001
Figure 2. Overview of the study site with the detailed urban catchments, including the basic land cover distribution and both connected rural boundary catchments (Aderbach (steel blue) and Oederbach (dark blue)).
Hydrology 12 00125 g002
Figure 3. Precipitation data used for the benefit analysis: (left) long-term precipitation data with a yearly sum of 900.6 mm in the year analysed; (right) heavy storm events observed on 22 August 2020 (return period T > 100 a), with a precipitation sum of 106.5 mm in 2 h.
Hydrology 12 00125 g003
Figure 4. Priority maps for high priority strategy placement in the urban detail area of the study site (Feldbach), with a detailed image of one high-priority location: (A) priority regarding flood hazard (0–3); (B) priority regarding surface temperature; and (C) combination of flood hazard and surface temperature.
Hydrology 12 00125 g004
Figure 5. Locations selected for implementing single and multiple BGI strategies and the detention basin in the 1D-2D model and the semi-distributed hydrological model to evaluate efficiencies.
Hydrology 12 00125 g005
Figure 6. Relative deviations in logarithmic scale of each analysed strategy (Multifunctional detention basin, BGI single, BGImulti, NBS, Combi (DB + BGI Multi), and Combi (NBS + BGI multi)) with respect to the reference state for the high-priority (goldenrod) and low-priority (slate grey) locations, and the maximum value, serving as a reference for visualising the best strategies (the dark-red line).
Hydrology 12 00125 g006
Figure 7. Spatial comparison between the two analysed priority classes (low and high), with the modified efficiency index and the subparts (change in water balance (WB) and flooding area) as the objective.
Hydrology 12 00125 g007
Figure 8. Comparison between the simulated flooding area of the NBS scenario at low-priority locations (A) and high-priority locations (B), with the reference flooding area and the corresponding impact area regarding flooding of the stream, for Aderbach (red) and Oederbach (yellow).
Hydrology 12 00125 g008
Table 1. Exemplary modelling approaches for quantifying the input data (flooding areas and surface temperature) required for the developed workflow.
Input DataApproachTypeReference
flooding areastopographic flow path analysisGIS-based modelHuang et al. [40]
LISFLOOD-FP 8.1hydrodynamic 2D modelSharifan et al. [39]
surface temperaturemicro-climate analysisGIS-based modelBack et al. [29]
Integrated GIS-CFD modelBack et al. [46]
Table 2. Overview and mathematical formulation of the relative threshold values used for classification.
CategoriesMathematical Formulations
class 0 (low priority) x i x i X i + x i < P i , 25
class 1 (middle priority) x i x i X i + P i ,   25 x i < P i , 75
class 2 (high priority) x i x i X i + P i , 75 x i < P i , 90
class 3 (highest priority) x i x i X i + x i P i , 90
with
X i + = x i X i x i > 0 x R
Table 3. A summary of the determined design parameters of the analysed BGI strategies: A.1–A.6: strategies in locations with the lowest priority class; B.1–B.6: strategies in locations with the highest priority class.
NameDescriptionArea Used [m2]Design Volume
[m3]
Design Return Period [a]Catchment Area [m2]
A.1—Multifunctional detention basin (DB)Installing a green detention basin in Aderbach in a location falling under the low-priority class440011,971100300,312
A.2—BGI singleCreating one vegetative swale in a location categorised into the low-priority class5107443012,393
A.3—BGI multiMultiplied (four) vegetative swales in locations in the low-priority class209030353047,378
A.4—NBSImplementing an NBS in a rural area in Aderbach and green roofs on flat roofs in the urban catchment in the low-priority class443,77 *0-300,312
A.5—Combination (BGImulti+DB)Combination of strategies A.1 and A.3649015,00630 and 100347,690
A.6—Combination
(BGImulti+NBS)
Combination of strategies A.3 and A.446,467303530347,690
B.1—Multifunctional Detention basin (DB)Installing a green detention basin in Oederbach in a location in the high-priority class15,000254,6861004,937,691
B.2—BGI singleCreating one vegetative swale in a location in the high-priority class400063783097,056
B.3—BGI multiMultiplied (four) vegetative swales in locations in the high-priority class718210,17730164,093
B.4—NBSEmploying an NBS in the Oederbach rural catchment and green roofs on flat roofs in the urban catchment in the high-priority class525,109 *0-4,937,691
B.5—Combination (BGImulti+DB)Combination of strategies B.1 and B.322,182264,86330 and 1005,101,784
B.6—Combination
(BGImulti+NBS)
Combination of strategies B.3 and B.4532,29110,177305,101,784
* Modification with a realistic value of 10 percent of the rural catchment area in combination with the sum of green-roof areas in the urban detail area.
Table 4. Modified efficiency index (EImod) for each simulated mitigation strategy for the low-priority (A) and high-priority (B) locations.
EImodDetention
Basin
(1)
BGI
Single
(2)
BGI
Multi
(3)
NBS (4)Combi
(DB + BGI Multi)
(5)
Combi
(NBS + BGI Multi)
(6)
low-priority sites (A)0.2800.0220.0500.3200.3660.363
high-priority sites (B)0.4760.0360.0780.5780.5210.723
Disclaimer/Publisher’s Note: The statements, opinions and data contained in all publications are solely those of the individual author(s) and contributor(s) and not of MDPI and/or the editor(s). MDPI and/or the editor(s) disclaim responsibility for any injury to people or property resulting from any ideas, methods, instructions or products referred to in the content.

