Article

Identification of Attribution of Runoff Variations in the Tumen River Basin Based on Budyko’s Hypothesis

1
College of Geography and Ocean Sciences, Yanbian University, Yanji 133002, China
2
Yanbian Branch, Jilin Hydrology and Water Resources Bureau, Yanji 133002, China
*
Author to whom correspondence should be addressed.
Hydrology 2025, 12(5), 122; https://doi.org/10.3390/hydrology12050122
Submission received: 27 March 2025 / Revised: 7 May 2025 / Accepted: 15 May 2025 / Published: 18 May 2025

Abstract

The Tumen River Basin (TRB), a critical China border region, has experienced a complex evolution of runoff due to climate change and human activities. This study aims to quantify the main drivers of runoff variations in the TRB based on the Budyko framework to assess the relative contributions of climate change and human activities to runoff fluctuations. Results indicate pronounced warming and increased precipitation in the TRB, while runoff exhibits a declining trend with temporal variability. Runoff decreased during 1956–1980 but increased post 1980. Overall, climate change is the dominant factor driving runoff fluctuations in the TRB. A comparison across different sub-basins shows that the contribution of climate change to runoff variations is higher in the middle and upper reaches of the Tumen River, reaching up to 93.8%. In the lower basin, human activities contribute significantly to runoff variations. Higher forest cover and reservoir construction help maintain the long-term stability of watershed runoff. This study provides a scientific basis and data support for water resources development and ecological protection in the basin.

1. Introduction

The United States Global Change Research Act defines global environmental change as ‘changes in the global environment (including climate, land productivity, ocean or other water resources, atmospheric chemistry, and ecosystems) that may alter the Earth’s ability to sustain life’ [1]. Climate change and human activities, as two important factors, are involved in the global water cycle by influencing evaporation, infiltration, and surface runoff. The complex interaction of the two has resulted in dramatic changes in runoff in many watersheds [2].
The IPCC’s Sixth Assessment Report shows that as of 2017, global climate change-induced warming is about 1 °C higher compared to pre-industrial levels. Global warming has become an undisputed world problem. Warming melts glaciers and causes frequent climate extremes, leading to changes in precipitation and runoff patterns. An imbalance in the ratio of precipitation to evaporation in the basin exacerbates the instability of the water cycle [3].
Moreover, increasingly complex human activities driven by urbanization and the demands of human production and daily life are directly or indirectly impacting global river runoff. Land use and land cover changes driven by human activities, such as urban pavement hardening, afforestation, and farmland reforestation, alter the underlying surface characteristics of river basins. These activities affect infiltration and evapotranspiration of runoff, indirectly causing changes in river runoff and upsetting the water balance of the basin, causing it to experience severe floods and droughts [4,5].
In 2022, the USGS presented an update to water cycle schematics [6]. It adds human activity processes such as industrial and agricultural water use, urban runoff, and reservoirs to the original natural links. This underlines the active involvement and serious impact of human activities on the water cycle process. Therefore, exploring the evolution of watershed runoff in the context of climate change and human activities, analyzing its influencing factors, and predicting changes in runoff in future environments are the key issues of the day.
Relevant studies show that, in the context of global climate change, the spatial and temporal distribution of water resources is uneven, and the imbalance between the supply and demand of water resources is becoming more and more prominent [7]. Water, as the most important factor in atmospheric circulation and the hydrological cycle, is most directly affected by climate change [8]. Among the associated variables, changes in precipitation and temperature have the most direct impact on runoff. Therefore, to derive the evolutionary pattern of runoff, these important meteorological factors need to be analyzed. For example, using the Budyko framework, Tan et al. identified precipitation and potential evapotranspiration as the main factors influencing runoff variability in 434 watersheds globally [9]. Su et al. used the SWAT model to make predictions and found that temperature and precipitation changes will be dominant factors influencing the increase in runoff in the Weihe River over the next 30 years [10].
Compared to climate change, anthropogenic impacts on runoff are relatively short-lived and concentrated in time. If left unregulated, they will eventually have a non-negligible effect on runoff. Different land types in a watershed can bring about differences in flow production mechanisms, and, in general, urbanization and the destruction of natural vegetation can lead to increased surface runoff in a watershed [11]. Ecological measures such as planted forests help to mitigate the increase in runoff from deforestation in watersheds [12]. Many scholars have already analyzed the runoff variations in typical watersheds in China, such as the Yangtze River Basin, the Yellow River Basin, the Pearl River Basin, and the Songhua River Basin [13,14,15,16,17,18]. There are also many scholars who have focused on important watersheds in countries around the world, such as the Amazon River Basin, the Mississippi River Basin, the Nile River Basin, the Danube River Basin, and the Ganges River Basin [19,20,21,22,23]. Numerous studies have shown that runoff variations are caused by both climate change and human activities. However, in recent years, more and more studies have shown that the influence of human activities on runoff variations has been enhanced. In some areas, the influence of human activities even dominates the characteristics of runoff variations in the region [24].
In the context of the aforementioned environmental changes, the global hydrological cycle and water resource distribution have become increasingly complex, with the spatiotemporal distribution of surface water resources exhibiting heightened disparities. Border regions, due to their distinct geographical location, become focal points of research on the evolution of watershed runoff and its response mechanisms to climate change and human activities. The Tumen River Basin (TRB) is located at the tri-junction of China, North Korea, and Russia, making it a significant border area for China. It holds a key position within the ecological network of Northeast Asia [25]. The region is characterized by diverse topography and a dense network of tributaries. Located in a temperate continental monsoon climate zone, the runoff variation mechanism in this basin is further complicated by its proximity to the ocean. As a result, the basin’s runoff is more sensitive to both climate change and human activities. The TRB is an important source of water resources in Yanbian Prefecture. The acceleration of urbanization processes, driven by factors such as international trade, border tourism, and the reform of industry and agriculture, has also exerted adverse impacts on the sustainable utilization of water resources in the TRB.
At present, affected by climate change and human activities, water pollution in the TRB region has increased, the imbalance between supply and demand of water resources has worsened, and the ecological carrying capacity has declined [26,27]. It is evident that under the changing environmental conditions, the evolution of runoff in the TRB exhibits complexity and uncertainty. The attribution study of runoff variations helps reveal the hydrological cycle process and its changing law in the basin and provides a scientific basis for the government to formulate reasonable water resource development and utilization, conservation and protection, and deployment programs. This is important to ensure the sustainable use of water resources in the basin. However, existing studies on water resources in watersheds mainly focus on wetland landscape patterns and river ecosystem services [28,29], with fewer studies on runoff variations and attribution.
Complex climate change and human activities constitute mechanisms that influence the evolution of runoff. The commonly used precipitation–runoff double-accumulation curve model is not only difficult to use to accurately capture the overall characteristics of runoff variations but also to effectively distinguish between the independent contributions of climate change and human activities to runoff [30]. The elasticity coefficient method is a widely used hydrological model in the study of runoff variations. It can be used to quantify the impacts of climate change and human activities on runoff, and the applicability of this method has been demonstrated in many watersheds in China.
In this study, meteorological data from six stations in the TRB, Wangqing, Antu, HeLong, Yanji, Longjing, and Hunchun, are employed to analyze the trends of extreme weather in the basin. Runoff observation data from six hydrological stations including Quanhe, Mopanshan, Sandaochong, Hunchun, Longjing, and Wangqing are used to analyze the runoff variations trends within the basin. The elasticity coefficient method, based on the Budyko framework, is adopted with the aim of quantifying the impacts of climate change and human activities on runoff.

2. Materials and Methods

2.1. Study Area

The TRB is located in the Yanbian Korean Autonomous Prefecture in the southeastern part of Jilin Province, China, and is the border between China, North Korea, and Russia. The geographic coordinates range from 42°0′35″ N to 44°0′23″ N and from 128°36′23″ E to 131°18′45″ E (Figure 1). The basin is bordered by Russia to the east and North Korea to the south across the river. The terrain is complex and varied, including mountains, hills, plains, and basins, with altitudes ranging from 500 to 1500 m.
The main stream of the Tumen River originates from the Changbai Mountain range, flowing from north to south before eventually discharging into the Sea of Japan. Its river system is well defined with numerous tributaries, including the Burhatong River, Gaya River, and Hunchun River, among others. Influenced by the continental monsoon climate, the TRB has high-temperature, rainy summers and cold, dry winters. In recent years, the basin has experienced a clear warming trend, coupled with an intensification of human activities. In recent years, there has been a clear trend of warming in the watersheds and an intensification of human activities, which have led to problems of ecological degradation and reduced sustainability, with important hydrological and ecological impacts.

2.2. Data

This study collected and analyzed remote sensing imagery, observed hydrological runoff data, and evaluated meteorological data for the TRB.
Land use data were visually interpreted using Landsat remote sensing imagery as the data source, with a spatial resolution of 30 m. The remote sensing data were sourced from the Geospatial Data Cloud (https://www.gscloud.cn/, accessed on 8 January 2025). Visual interpretation and reclassification of land use types was carried out using five periods of remote sensing data from 1976 to 2017. The land use types were classified into seven categories: forestland, cultivated land, grassland, water bodies, artificial land, bare land, and reservoirs.
Runoff data were obtained from the Yanbian State Water Resources Bureau. They include measured monthly runoff from six hydrological stations within the TRB (Table 1), interpolated and corrected. The runoff data collected are from 1956–2023.
In order to ensure the reliability and consistency of the runoff series, the data were analyzed for homogeneity and mutation point detection in this paper. Pettitt’s test was used to identify the effect of station relocation on runoff. It was found that for the two hydrological stations that had been relocated, Hunchun station and Longjing station, the mutation points were not correlated with the time of relocation. This indicates that the station relocation did not significantly affect the runoff data. The runoff series in the TRB can be considered to have good homogeneity.
The meteorological data are sourced from the Yanbian Meteorological Bureau, including daily precipitation, maximum temperature, and minimum temperature, from six meteorological stations within the TRB. The meteorological data collected are from 1956 to 2023. Details of the meteorological stations are as follows (Table 2).
Potential evapotranspiration was calculated using the Hargreaves Equation formula, which is simple and widely applicable, especially in areas with more adequate temperature data. The formula is as follows:
P E T = 0.0023 × ( T m a x T m i n ) 0.5 × ( T mean + 17.8 ) × R a
In the above formula, Tmax is the maximum daily temperature, Tmin is the minimum daily temperature, Tmean is the average daily temperature, and Ra is the external radiation (MJ/m2-day), that is, the total energy radiated from the sun to the ground per unit of time. It is usually estimated based on geographic latitude, date (or solar altitude angle), and elevation.
Extreme weather indices were calculated using the RClimdex model, and 10 extreme temperature indices and 10 extreme precipitation indices were selected from the table of 27 extreme climate indices recognized by the WMO (Table 3) as an indication of climate change.

2.3. Methodology

2.3.1. Moving Average

The moving average method is a commonly used technique for time series forecasting and analysis [31]. It does this by averaging a certain number of consecutive data points and using this average as the predicted value for the next point in time. The formula is as follows:
M A t = 1 N i t N + 1 t x i
In the above formula, i t N + 1 t x i denotes the sum of data points from t − N + 1 to t.

2.3.2. Mann–Kendall Test

The Mann–Kendall test is a non-parametric test for identifying trends and mutation points in time series data and is widely used in the fields of environmental science, meteorology, and hydrology and water resources [32].
Prior to applying the Mann–Kendall test for change-point detection, the lag-1 autocorrelation of the extreme climate indices was assessed. The results indicated that most of the time series did not exhibit significant autocorrelation (p > 0.05), thereby satisfying the assumption of independence required for the Mann–Kendall test. As a result, no pre-whitening was deemed necessary.

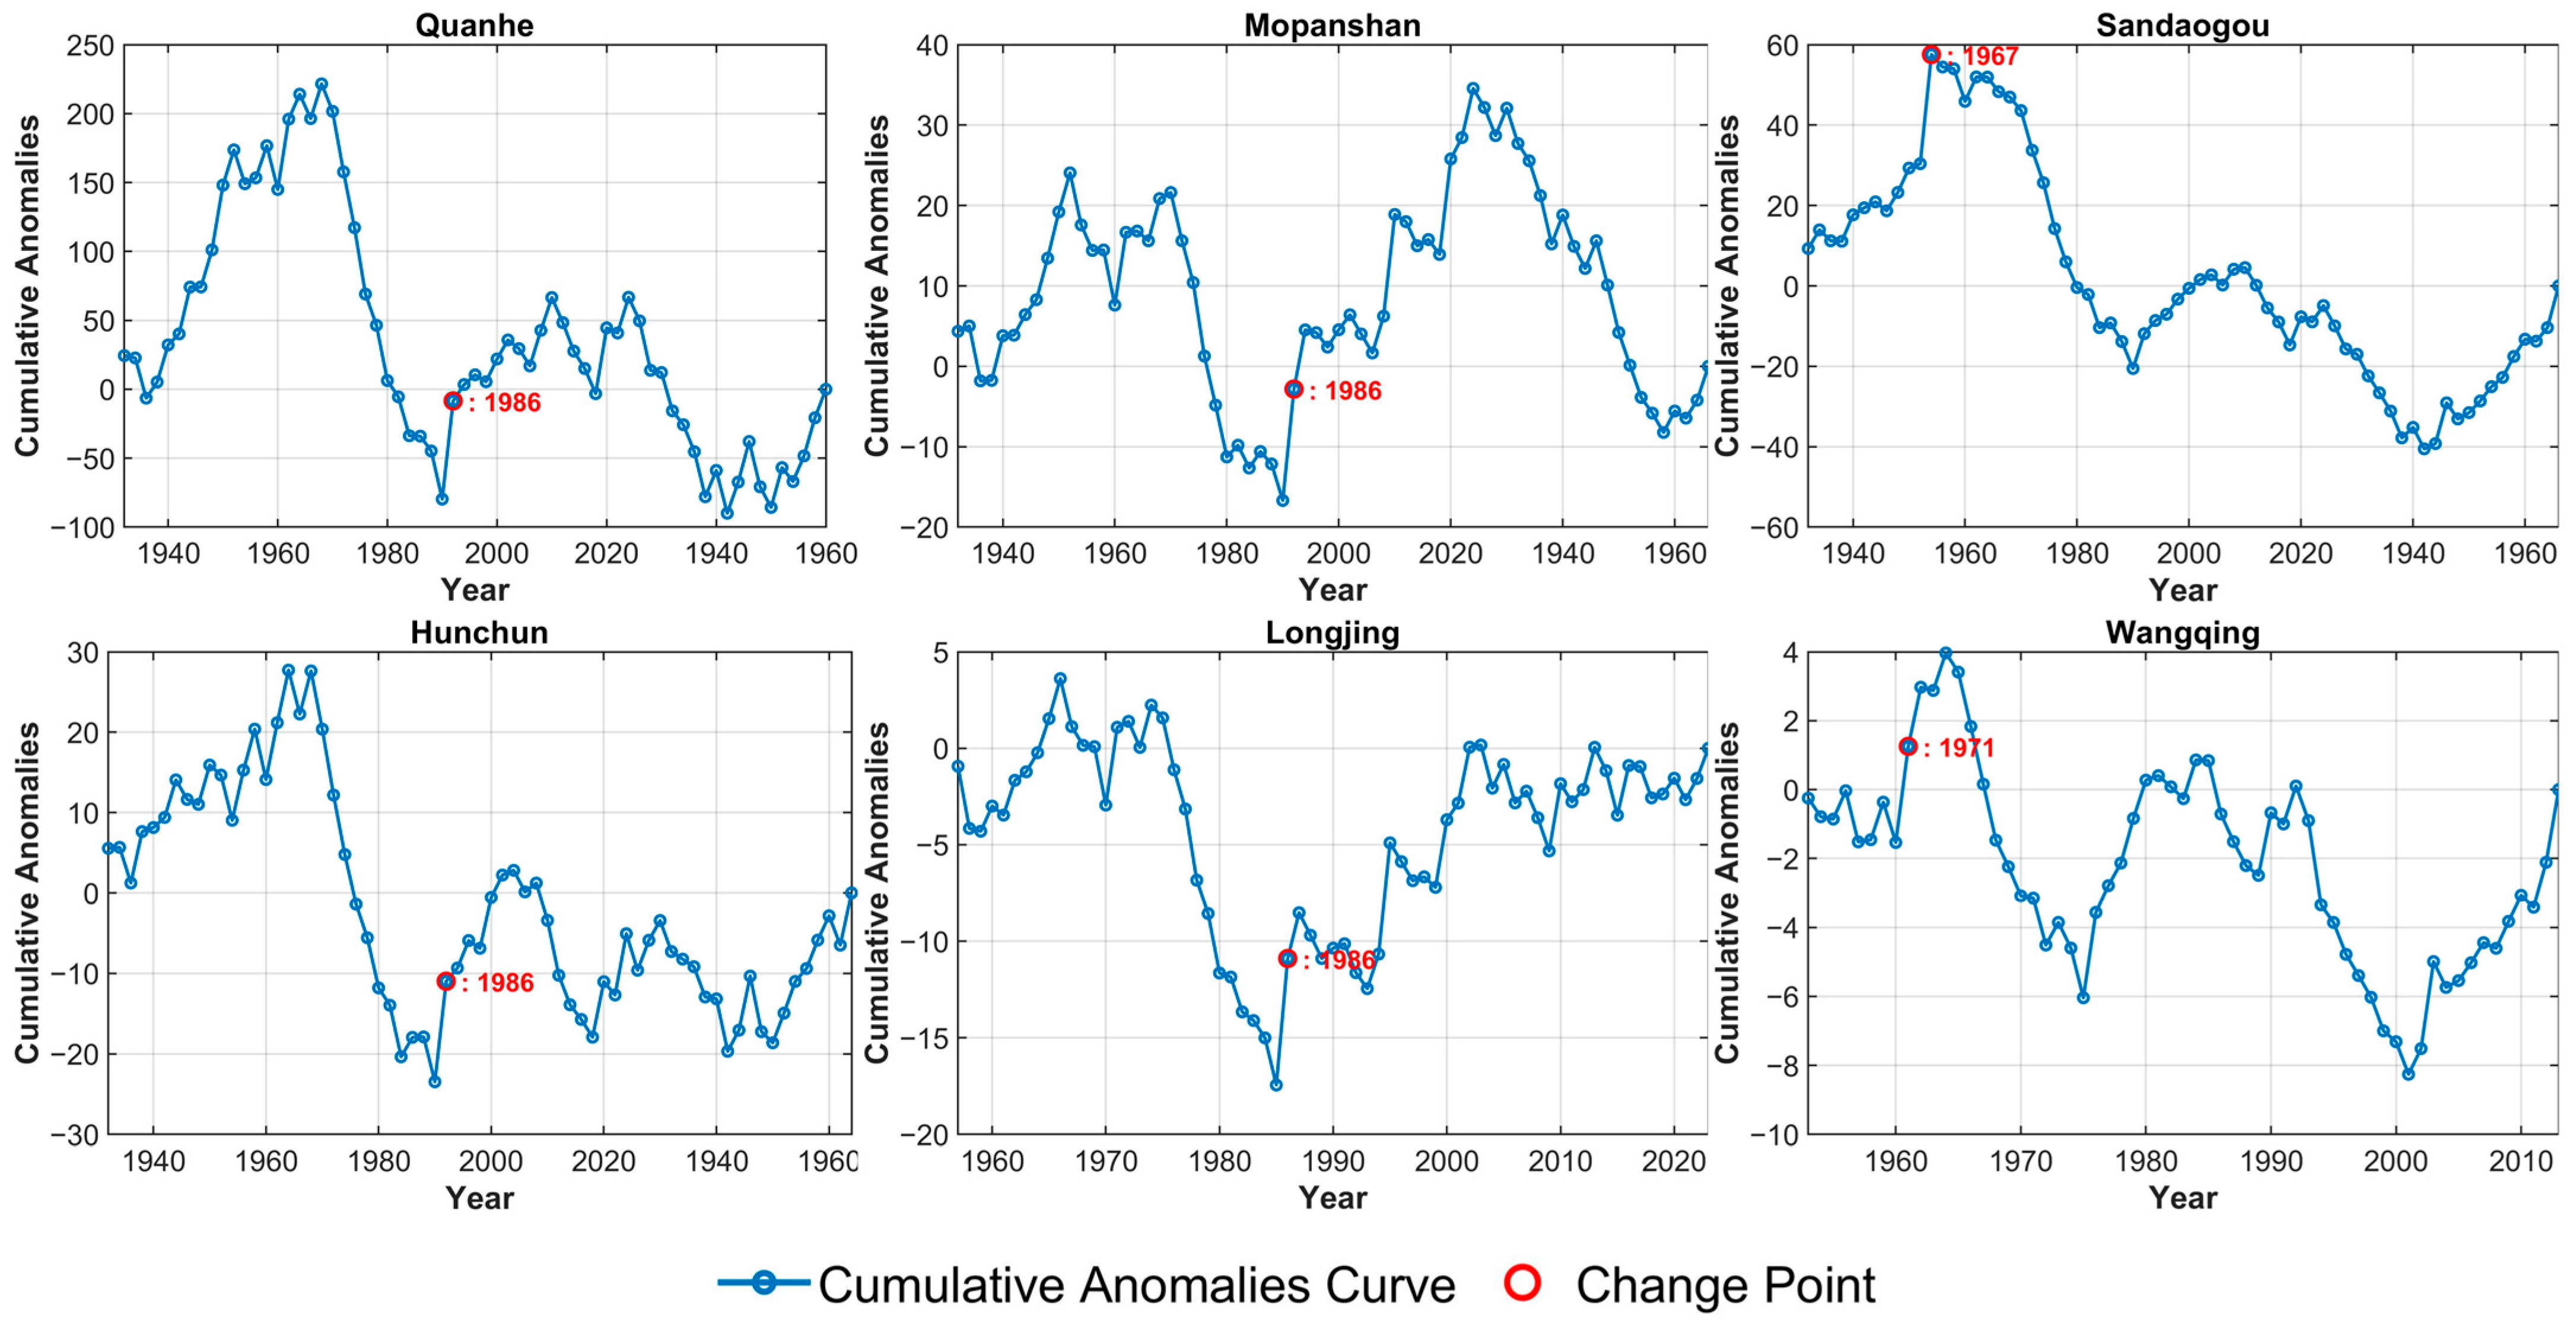
2.3.3. Cumulative Anomaly Method

The Cumulative Anomaly Method is an important technique for analyzing trend changes and change points in time series. This method reveals the cumulative change characteristics of the data by calculating the cumulative deviation of the sequence, thereby identifying potential trend changes, periodic features, or change points within the time series. Let the time series be X1, X2,…, Xn; its multi-year average is:
X ¯ = 1 n i = 1 n X i
The cumulative anomaly value at the k-th time point is expressed as follows:
S k = i = 1 k ( X i X ¯ ) ( k = 1,2 , , n )

2.3.4. Runoff Elasticity

According to Budyko’s theory, the runoff elasticity coefficient method is employed to quantify the effects of climate change and human activities on runoff. The Budyko model assumes that P/ET0 remains relatively stable over the long-term average. The Budyko framework includes multiple formulas. This study adopts the Choudhury–Yang function model [33].
P R = P × E T 0 P n + E T 0 n 1 / n
In the equation, ET0 represents potential evapotranspiration, and n is the watershed surface parameter, which includes the combined effects of topography, vegetation, soil, reservoir construction, and other human activities. By taking the partial derivatives of the above formula, the sensitivity of annual runoff to P, ET0, and n can be obtained.
ε P = R P P R ε E T 0 = R E T 0 E T 0 R ε n = R n n R
When the elasticity coefficient is positive, the runoff depth increases with the rise in the value of the influencing factor. Conversely, when the elasticity coefficient is negative, the runoff depth decreases as the value of the influencing factor decreases. The amount of change in runoff from precipitation and potential evapotranspiration can be calculated from the above equation:
Δ R x = ε x Δ x x R
Δ R T = R 1 R 2
In the above formula, R1 is the annual average runoff depth during the baseline period; and R2 is the annual average runoff depth during the period affected by human activities. The contribution rate of climate change to runoff is as follows:
n x = Δ R x Δ R T × 100 %
The total contribution of climate to runoff variations is the sum of the effects of precipitation and potential evapotranspiration on runoff variations:
n c = n p + n E T 0
The contribution of human activities to changes in runoff is as follows:
n h = 1 n c

3. Results

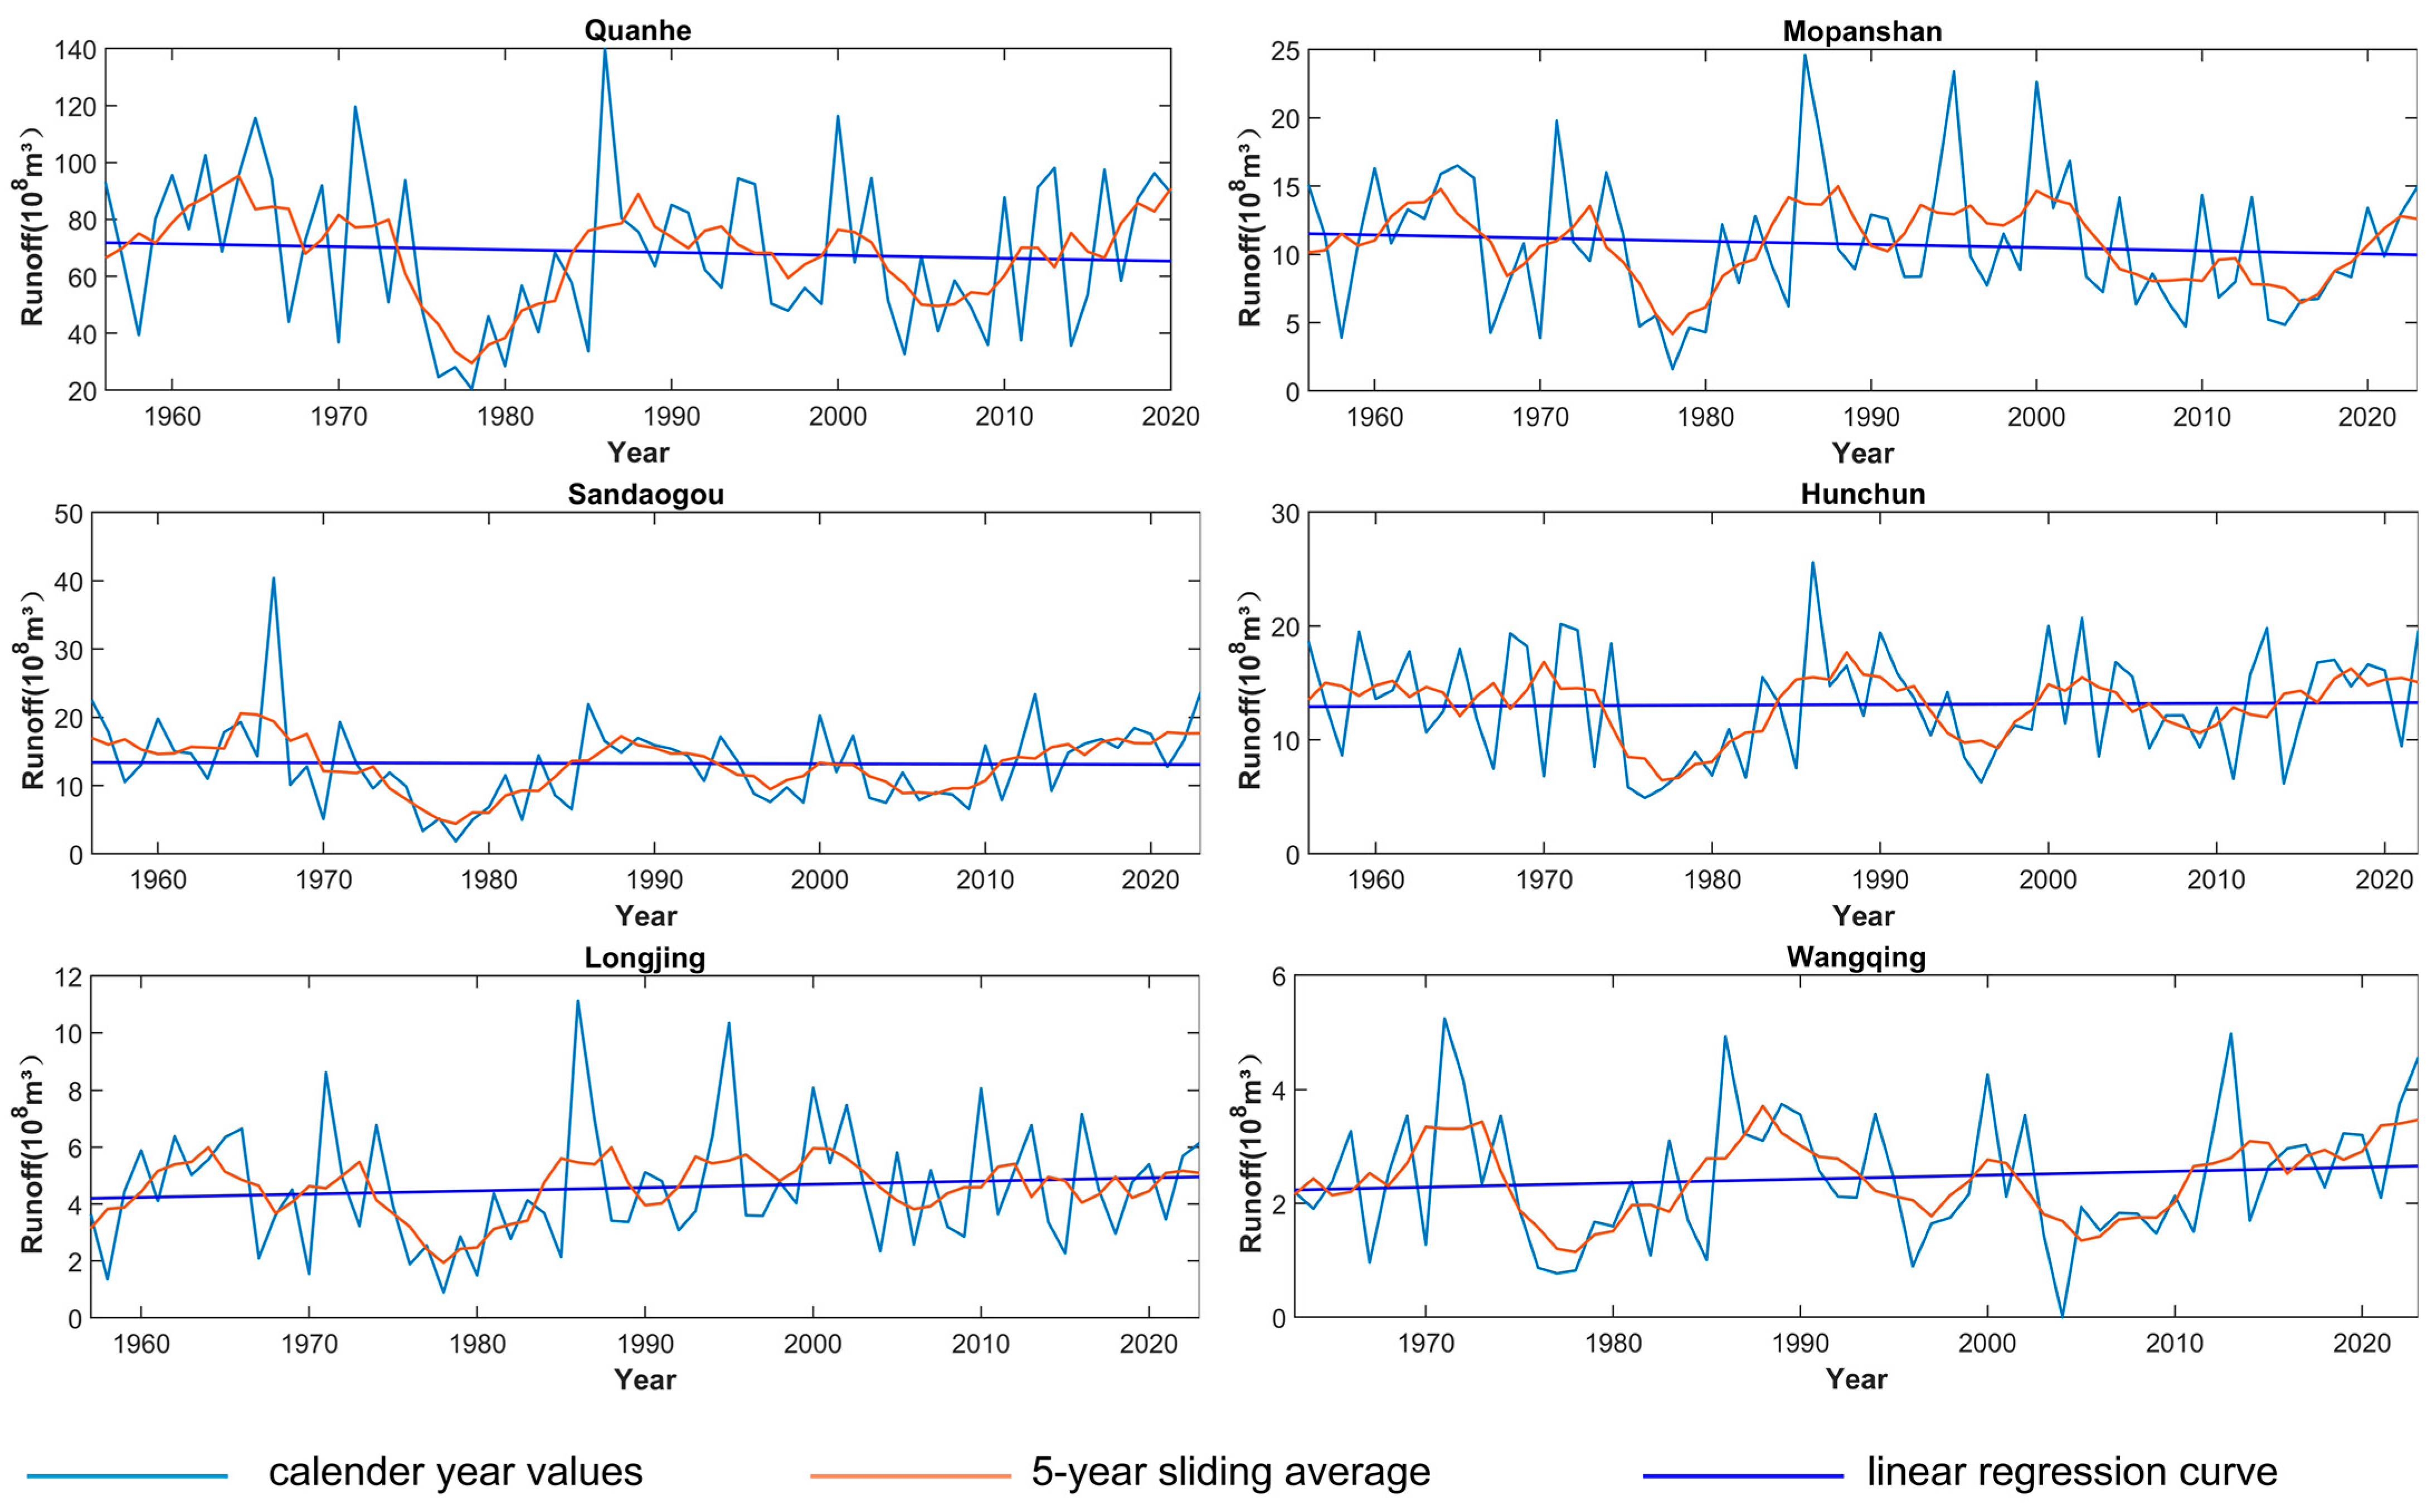
3.1. Runoff Variation Analysis

The characteristics of runoff variations in the main stream and major tributaries of the TRB are shown in Table 4. Among them, the Quanhe Hydrological Station is located in the main stream of the lower basin of the Tumen River, with a multi-year average runoff of 685.8 million cubic meters and the largest average runoff of 1398.9 million cubic meters in 1986. As can be seen from the linear trend graph (Figure 2), the runoff variations in the main stream of the Tumen River, the Burkhartong River Basin, and the Gaya River Basin, which have large catchment areas, show a decreasing trend. Runoff from the Hunchun, Hailan, and Wangqing river basins, which have small catchment areas, shows an upward trend. At the downstream-most Quanhe station, runoff in the TRB shows a slight downward trend. From the five-point sliding average plot (Figure 2), the average annual runoff at the six hydrologic stations showed a decreasing trend until 1980 and then a fluctuating upward trend thereafter. This upward trend has become more pronounced, especially after 2010.
An M-K test of runoff volume at the six sites showed multiple mutation points. To further clarify the year of mutation, the cumulative distance profile test was adopted (Figure 3). Quanhe, Mopanshan, Hunchun, and Longjing stations showed mutation points in 1986, while the mutation year was 1967 for Sandougou station and 1971 for Wangqing station.

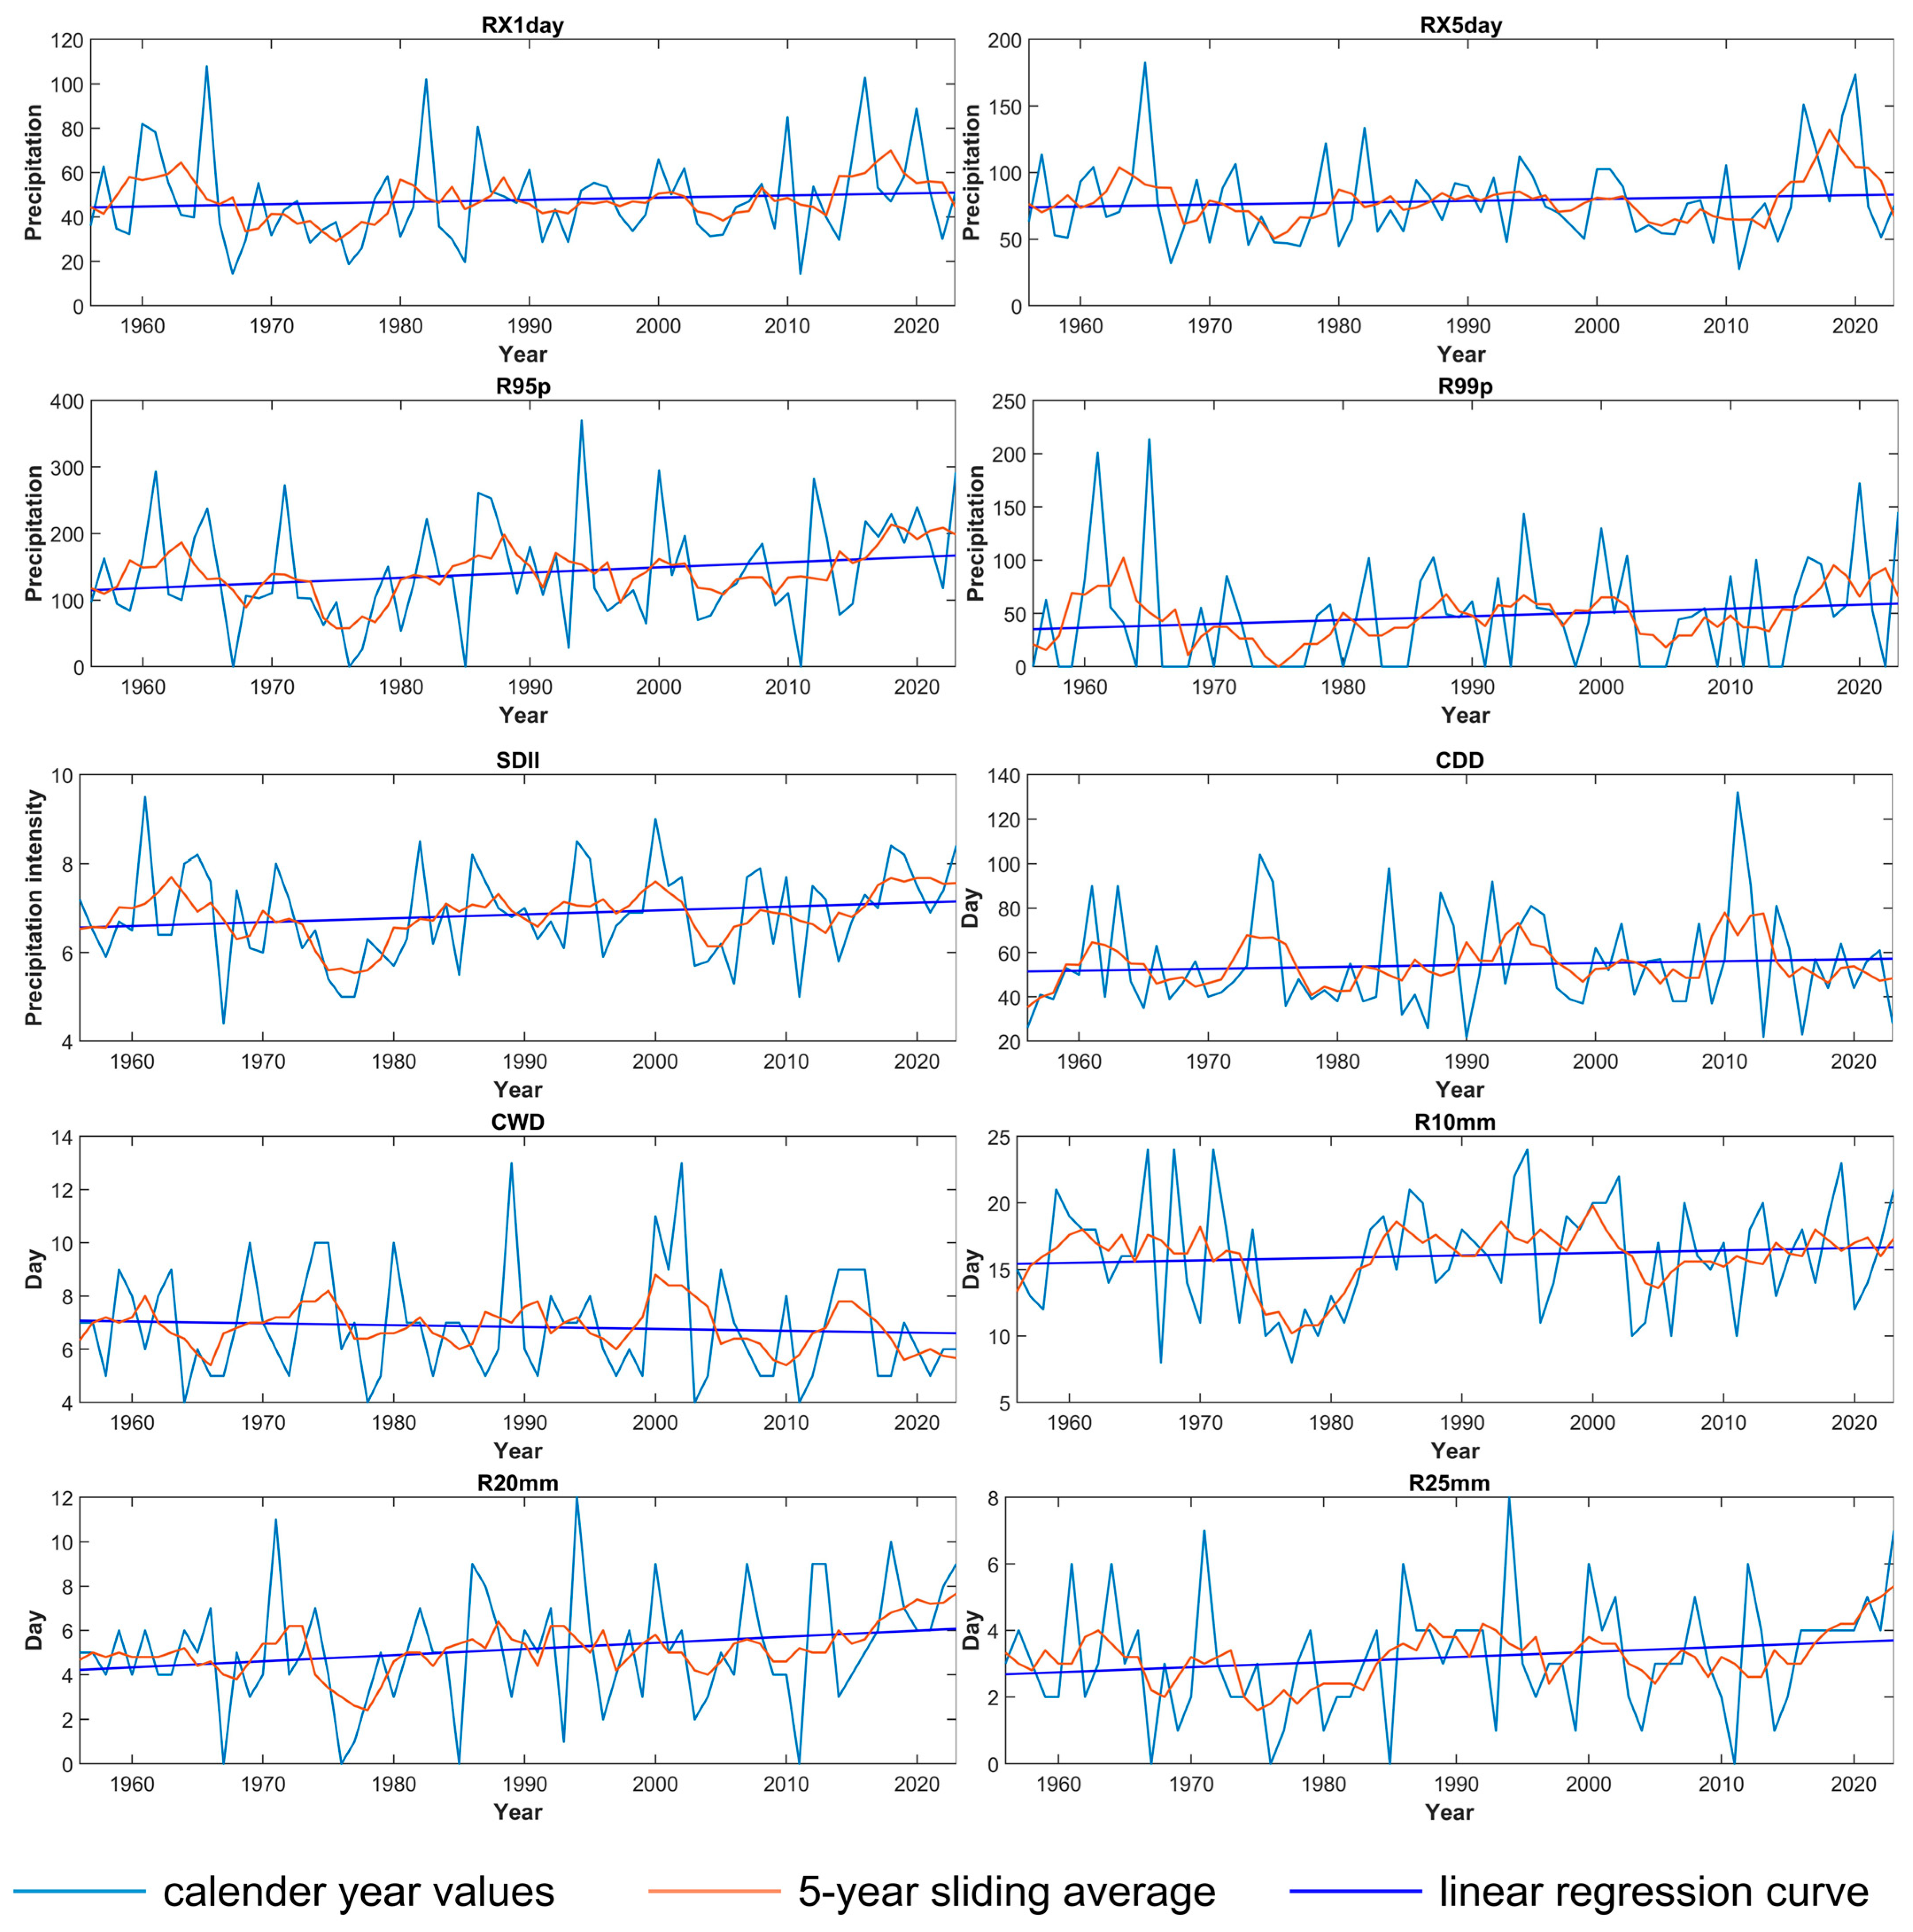
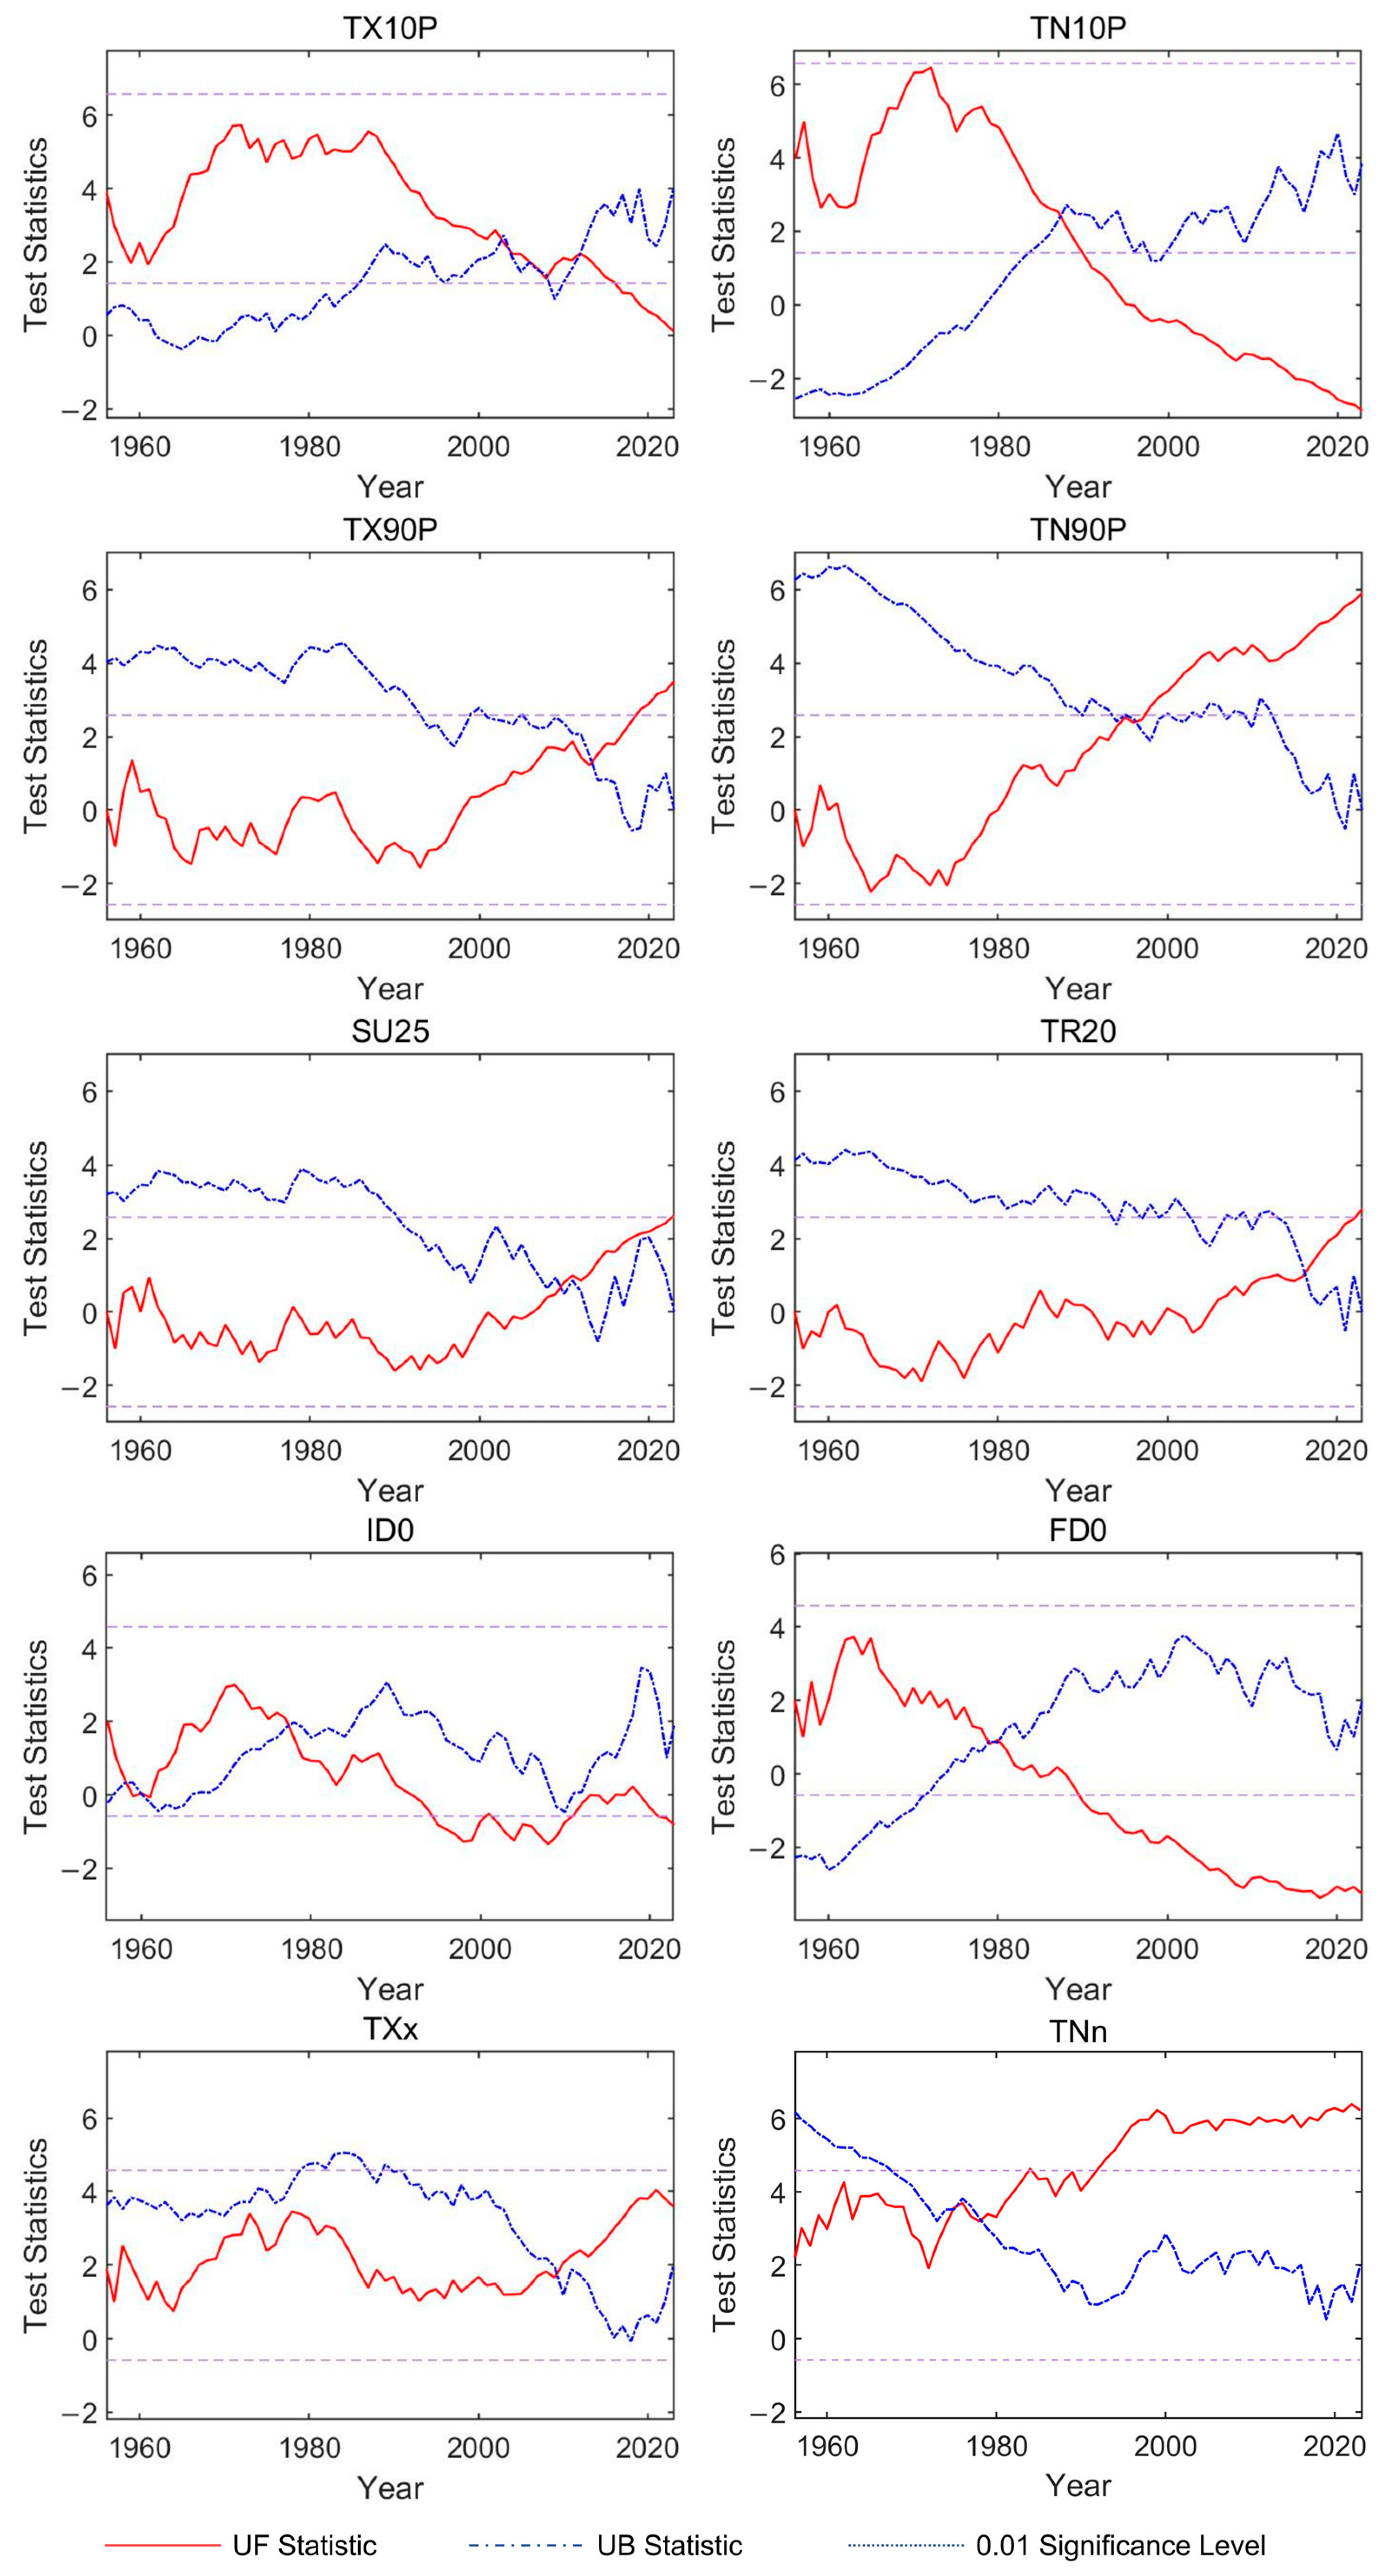
3.2. Climatic Element Analysis

In this paper, linear regression and sliding average methods were adopted to analyze the trends of meteorological factors such as extreme temperatures and precipitation indices in the TRB over 68 years. Detailed information can be found in Appendix A. The significance of the trend in extreme climate indices was analyzed by calculating the p-value of the linear regression equation. In the extreme temperature indices of the TRB, the extreme warm index, indicating high temperatures, shows a clear upward trend, with the temperature fluctuation increasing more significantly in the late 1980s. The extreme cold indices, such as TX10p and TN10p, which indicate low temperatures, show a clear downward trend. The maximum values of the daily maximum temperature and the minimum values of the daily minimum temperature both show an upward trend. The results show that, in the linear trend analysis, the p-values of all extreme temperature indices except for TXx are less than 0.05, indicating a significant warming trend in the TRB since 1956 (Figure 4).
Statistical analysis of precipitation data from 1956 to 2023 in the TRB in this study show (Figure 5) that the annual precipitation in the region generally showed an increasing trend during the study period, but the significance level of the trend (p > 0.05) does not meet the criterion of statistical significance, indicating that the trend of increase in precipitation is relatively weak. However, in terms of the extreme precipitation day index, the mean and extreme values of CDD are much higher than other extreme precipitation day indices, and CWD shows a decreasing trend. The decreasing number of precipitation days in the TRB is accompanied by increasing precipitation, which indicates that precipitation is more concentrated in this region. Concentration of precipitation may lead to an increased risk of flooding in the basin and also poses a challenge to water resource management and disaster prevention and control in the basin.
The M-K mutation test shows that the mutation year for extreme temperature indices began in 1977 (Figure 6). Indices such as ID0, FD0, TNn, TN10p, and TN90p underwent mutations between 1977 and 1995. Indices such as TXx, SU25, and TX90p underwent mutations around 2010. The Z-values corresponding to the Mann–Kendall change-point test were calculated. For the indices TX10P, TN90P, and ID0, ∣Z∣ > 1.96, indicating that the trends are significant at a 95% confidence level. Since the trend changes in extreme precipitation indices are not significant, no mutation test was performed for them.

3.3. Land Utilization Transformation Analysis

Remote sensing images of the TRB from 1976, 1986, 1996, 2006, and 2017 were used for visual interpretation and reclassification. From the perspective of land use distribution, forestland is the dominant land use type in the TRB, followed by cultivated land, while bare land accounts for the smallest proportion. Comparing the five phases of land use by calculating the Single Land Use Dynamic Degree and the Comprehensive Land Use Dynamic Degree in the TRB (Table 5), it can be seen that cropland and woodland remained virtually unchanged; artificial surfaces continued to increase between 1976 and 2006, but the dynamics turned negative after 2006; the area of watersheds and grasslands shows a decreasing trend year by year; reservoirs and bare land are significantly affected by human activities, and the area of reservoirs and ponds decreased only during the period of 1986–1996, while the rest of the period showed an increasing trend; and the area of bare land changed most frequently, showing overall fluctuating downward trend changes, from 10.9 km2 in 1976 to 6.2 km2 in 2017. The overall change in land use in the TRB from 1976 to 2017 in terms of the attitude of comprehensive land use dynamics in the region is relatively small.

3.4. Analysis of Runoff Variations Attribution

Based on the calculation of runoff mutation points, the runoff variations in the mainstem and major tributaries of the Tumen River are divided into a baseline period and an anthropogenic period. The hydrological characteristics and elasticity coefficients for the two periods are calculated using the elasticity coefficient method (Table 6). The analysis reveals that the potential evapotranspiration in the human activity periods of each sub-basin in the TRB has increased. Except for the Gaya River Basin, precipitation and runoff have increased in the other basins, with a positive correlation between precipitation and runoff. The runoff coefficient remains relatively stable.
From the elasticity coefficients of each basin, the changes in runoff are positively correlated with precipitation and surface characteristic parameters and negatively correlated with potential evapotranspiration. Furthermore, the impact of changes in potential evapotranspiration on runoff is minimal. Comparing the two time periods, the precipitation elasticity coefficient increases from 0.35 to 0.379 in the Burhattan River Basin, indicating that for the same 10% increase in precipitation, runoff increases by 3.5% during the baseline period and by 3.79% during the human activity period, proving that the effect of precipitation on runoff variations is further enhanced during the human activity period. Similarly, when the surface characteristic parameter increases by 10%, the runoff in the Bulaheton River Basin increases by 4.07% during the baseline period and by 3.44% during the human activity period. A comparison of the absolute values of εp, εET0, and εn shows that among the six sub-basins, the elasticity coefficients of precipitation are larger, proving that runoff in the basin is more sensitive to changes in precipitation.
The elasticity coefficient method based on the Budyko framework calculates the contribution of climate change and land surface conditions to runoff variability (Table 7). Since the long-term trend of average multi-year runoff in the TRB is relatively stable, there is little difference in the contribution of precipitation and land surface changes to runoff variations between the baseline and anthropogenic periods. Calculated changes in runoff due to changes in potential evapotranspiration in the watershed are minimal and are therefore not discussed.
In the mainstem of the Tumen River, the Burkhartong River Basin, and the Hailan River Basin, changes in precipitation were the main factor influencing changes in runoff, contributing 66.79%, 93.8%, and 64.29%, respectively, to the changes in runoff. In the Gaya River Basin, Hunchun River Basin, and Wangqing River Basin, surface characteristics were the primary factors influencing runoff variations, with contribution rates to runoff variation of 65.64%, 66.55%, and 73.67%, respectively. Based on the attribution analysis of runoff variations in the main stream and major tributary basins of the Tumen River, the runoff in the TRB is influenced by a combination of changes in precipitation and surface characteristics.

4. Discussion

4.1. Runoff Response in the TRB Under Changing Environments

In recent years, the intensification of global climate change has led to an increased frequency of extreme climate events, compounded by the growing intensity of human activities, putting enormous pressure on water security. Especially in mountainous watersheds, which are relatively small in size and have complex topography, the hydrological response mechanisms are more sensitive, and the water cycle and the sustainable utilization of water resources face many challenges. In this study, linear trend analysis and moving average methods were employed to examine long-term trends, while the cumulative anomaly method and the Mann–Kendall test were used to detect abrupt change points. The elasticity coefficient method based on the Budyko framework was applied to quantify the respective impacts of climate change and human activities on runoff variations in the TRB.
In terms of long-term trends, the runoff in the TRB shows a non-significant downward trend. Temperatures in the basin have increased significantly, and precipitation has shown a non-significant increasing trend. Especially after 1980, the trend of increasing temperature and precipitation in the basin is more obvious. This study shows that precipitation contributes to the vast majority of runoff variations in the upper and middle reaches of the watershed, demonstrating that climate change is the main driver of total runoff reduction in the watershed in this area [34]. Similar results were observed by Li et al. [35]. By analyzing the sensitivity of runoff variations to climate in the Changbai Mountain region, it was concluded that precipitation is the main trigger for runoff variations in this region, both during snowmelt and snow-free periods.
In the middle and lower reaches of the basin, where human activities are more intensive, changes in underlying surface conditions have an increasingly significant impact on runoff. In the calculations of the Budyko model, the subsurface parameter reflects the changes in vegetation in a watershed [36]. The underlying surface parameter across most areas of the TRB exhibits a declining trend. This indicates a reduction in the proportion of precipitation converted into evapotranspiration, primarily due to decreased vegetation cover resulting from early agricultural expansion and urban development. The land surface influences the amount of runoff in the watershed by intercepting precipitation and altering infiltration and sink paths [37]. As the TRB is located in the Changbai Mountain region, the forest cover is very high, and large areas of forests not only increase precipitation but also play a role in regulating runoff in the basin. This reduces the frequency and intensity of flooding and enhances water conservation while stabilizing runoff.
According to the land use dynamics analysis, the largest percentage of change in land use is in the reservoir ponds. In particular, from 1996 to 2006, the TRB saw the addition of new large and medium-sized reservoirs, such as the Wudao Reservoir, the Mantai River Power Station, the Songyue Reservoir, and the Longshan Reservoir, which led to a significant increase in the area of reservoirs and ponds. The construction of water projects directly impacts changes in runoff [38]. Anthropogenic regulation of reservoirs dampens the response of runoff to precipitation to some extent, thereby reducing the sensitivity of runoff to climate change [39]. The combination of these factors keeps the runoff in the TRB stable over an extended period of time.

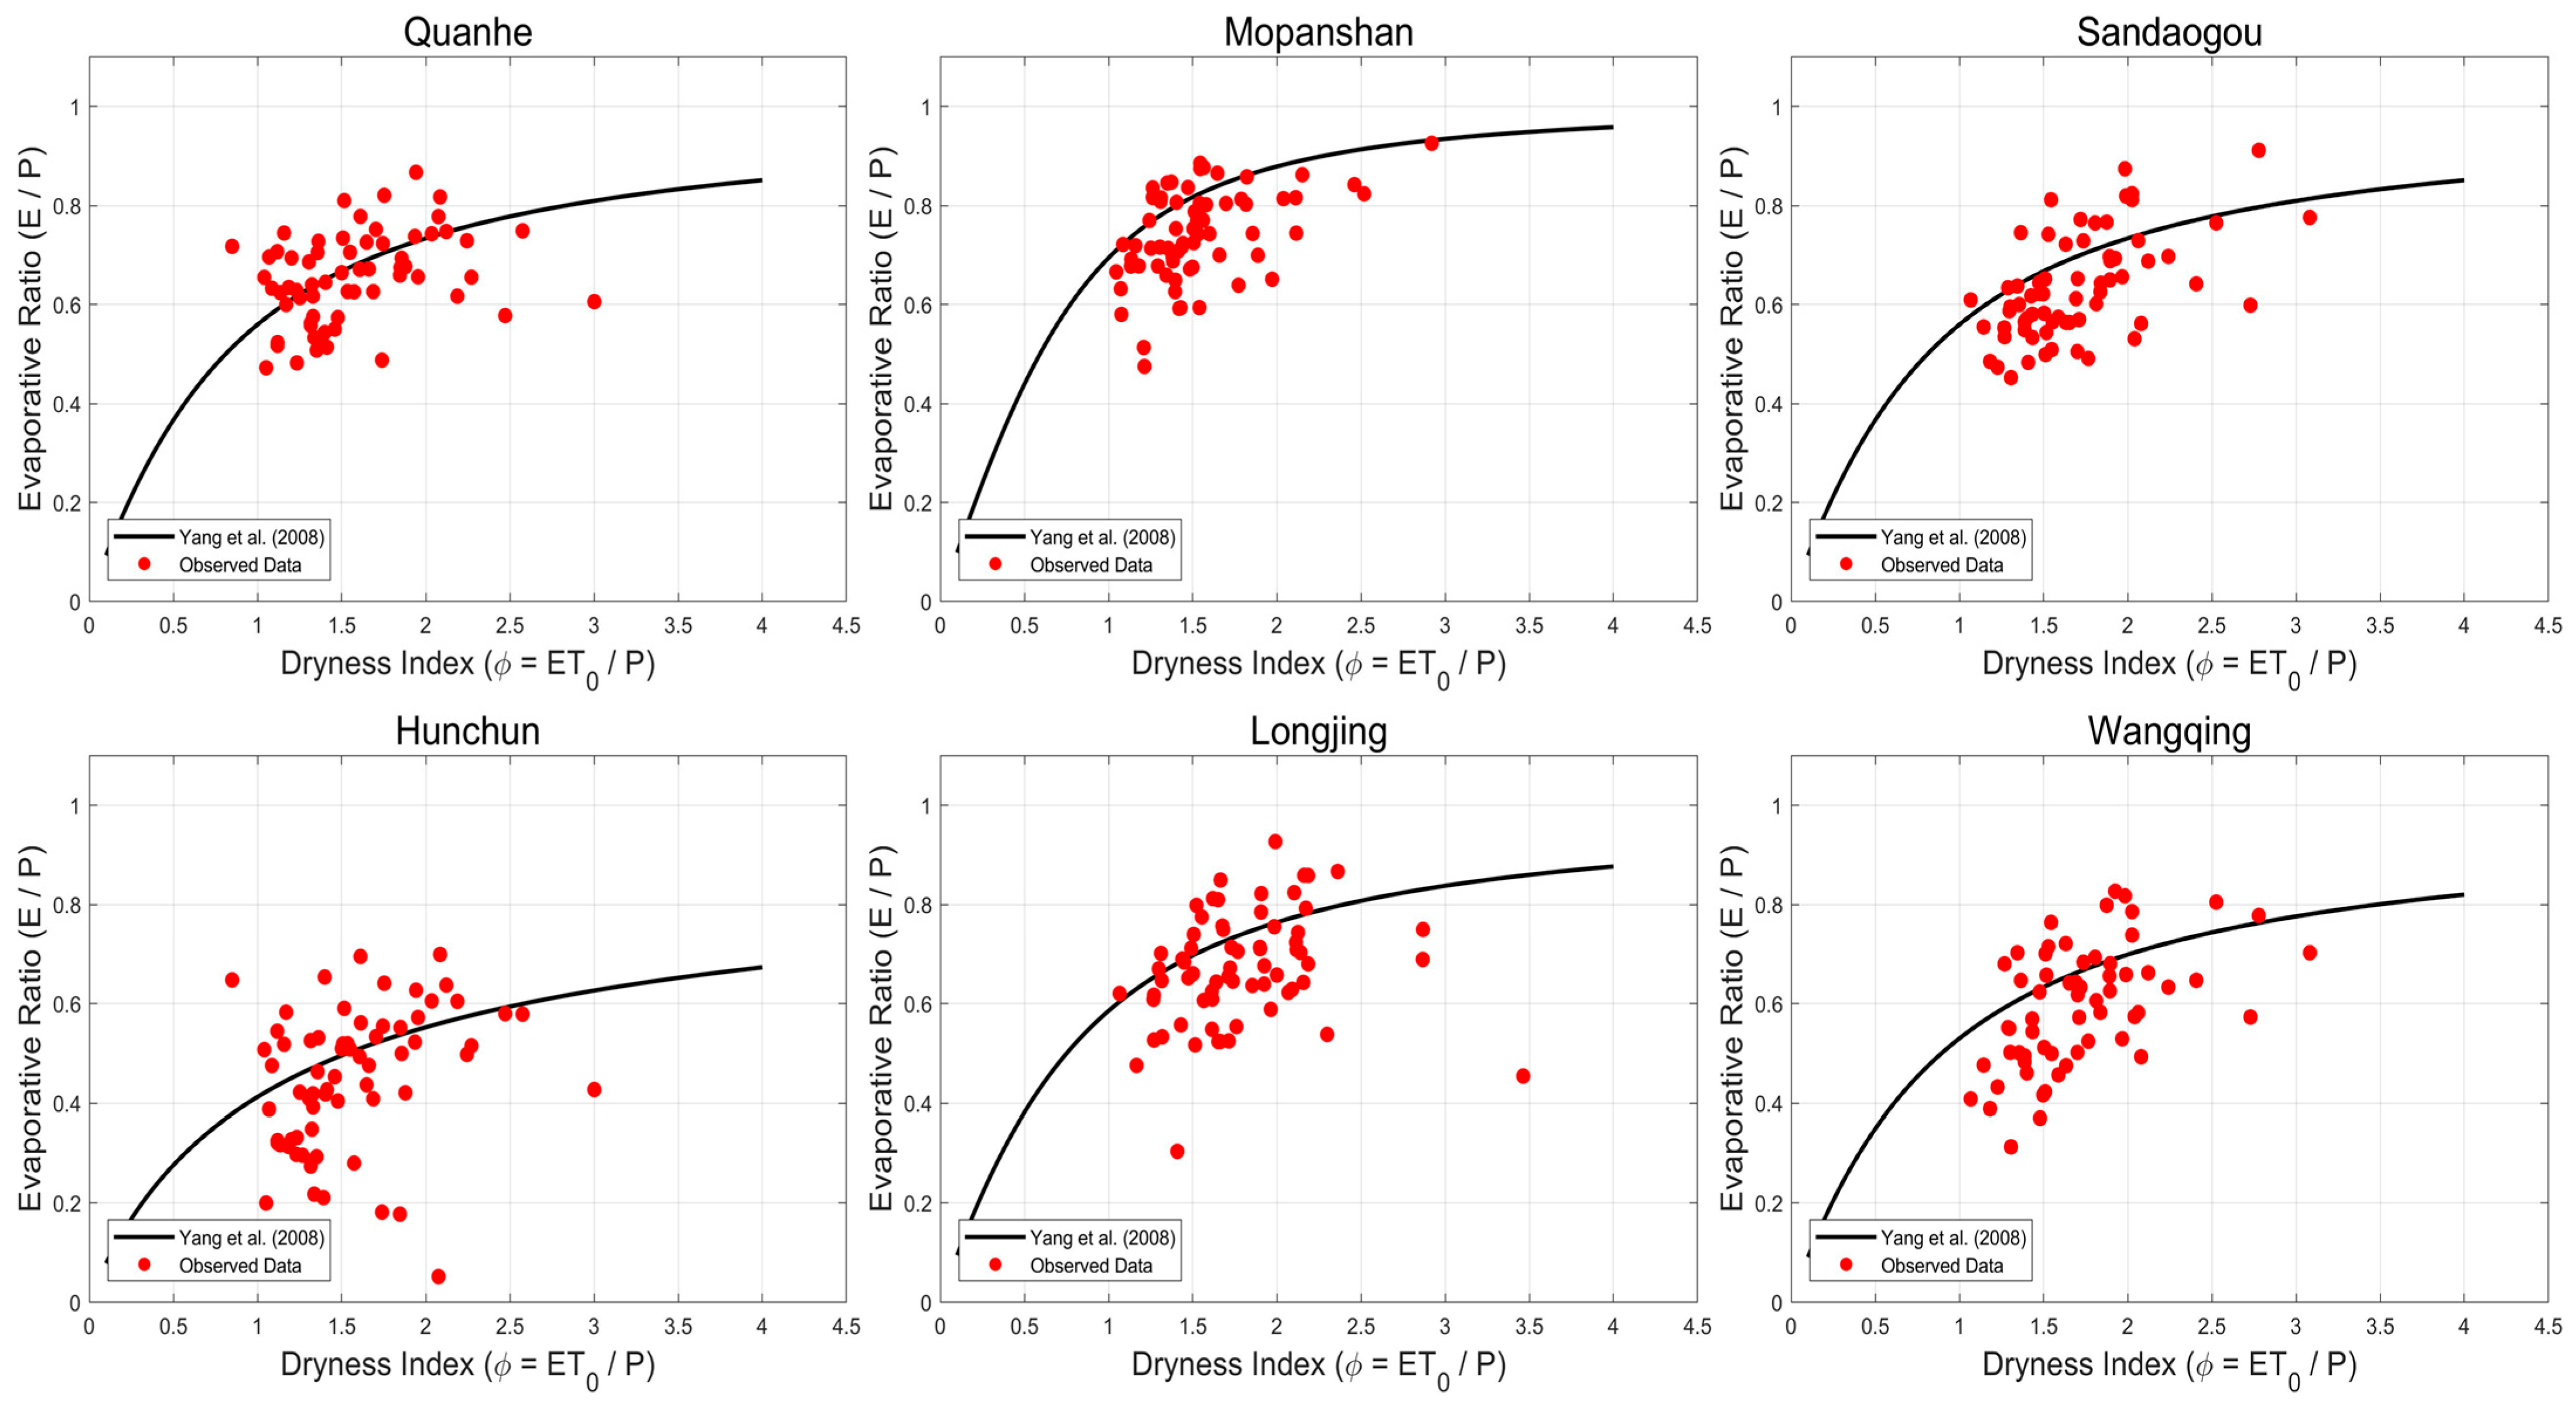
4.2. Applicability and Limitations of the Budyko Framework in the TRB

To assess the applicability of the Budyko framework in the TRB, Budyko plots were constructed for six hydrological stations within the basin (Figure 7). To minimize the modeling error, the Budyko parameters were calibrated according to the spatial heterogeneity of station locations and variations in underlying surface characteristics [40]. As shown in the figure, the observed data points are generally well clustered and predominantly distributed around the theoretical Budyko curve, indicating a good overall fit of the model in this region. However, certain data points deviate from the curve and are located below the Budyko line. This may be attributed to the substantial reduction in actual evapotranspiration caused by soil freeze conditions during winter in Northeast China, as well as anthropogenic modifications of runoff processes through interventions such as reservoir construction and flow regulation [41].
To investigate the seasonal coupling between precipitation (P) and potential evapotranspiration (ET0) in the TRB, this study selected the Quanhe station, located on the mainstem of the river, as a representative site. The multi-year monthly averages of P and ET0 were calculated, and correlation and cross-correlation analyses were performed. The results indicate that the Pearson correlation coefficient between P and ET0 is 0.8699, suggesting a strong intra-annual relationship between the two variables. Further cross-correlation function analysis reveals that the maximum correlation occurs at a lag of zero months, indicating that precipitation and potential evapotranspiration are largely in phase on a seasonal scale [42]. This synchrony supports the assumption of water–energy balance in the Budyko framework, confirming its suitability and enhancing the reliability of its application in the TRB.
There are still some limitations in the conduct of this study. First, as a result of limitations in the scope and accuracy of data collection, a relatively simplified Hargreaves–Samani formula was adopted for estimation in the calculation of potential evapotranspiration. Despite the high applicability of this method in the absence of data, it may be difficult to fully reflect the real situation of potential evapotranspiration in the study area compared to the more complex Penman–Monteith formula, which may have some impact on the accuracy of the calculation of the elasticity coefficient of potential evapotranspiration [43].
Secondly, most meteorological stations selected in the TRB are located in low-altitude areas, which may lead to an underestimation of precipitation due to the insufficient representation of orographic precipitation in mountainous regions [44]. Furthermore, situated in Northeast China, the basin experiences prolonged winters, and a considerable portion of runoff is derived from snowmelt. This seasonal delay in runoff generation can result in the underestimation of effective precipitation within the Budyko framework [45]. These factors collectively contribute to the uncertainties and deviations observed in the model outputs.
As a transboundary river between China and North Korea, the TRB exhibits distinct international watershed characteristics. However, the absence of meteorological and hydrological observations from the North Korean side introduces a degree of uncertainty in the assessment of basin-wide runoff variations. Future research should prioritize the integration of multi-source data and the enhancement of cross-border collaboration to improve the accuracy and applicability of the findings.

5. Conclusions

In this study, we analyzed the trends of runoff and extreme climate indices in the TRB using annual runoff data from six hydrological stations in the mainstem and major tributaries of the basin, as well as daily precipitation and temperature data from six meteorological stations from 1956 to 2023. The study shows that climate warming is evident in this region, with increasing trends in temperature and precipitation and a higher frequency of extreme weather events. Runoff in four sub-basins changed abruptly in 1986, while in the remaining two sub-basins, the abrupt changes occurred in 1967 and 1971, thus delineating the baseline and anthropogenic periods of runoff. We used remote sensing data to analyze changes in land use types in the TRB. The results show that between 1976 and 2017, the land use structure of the TRB was generally stable, dominated by forested land and cropland, with a slight increase in artificial surfaces and a decreasing trend in water bodies and grasslands. The area of reservoirs and ponds is influenced by the construction and abandonment of reservoirs, with an overall increasing trend.
In this study, we used the elasticity coefficient method to separate the effects of climate change and human activities on runoff, and climate change was the dominant factor in the fluctuating changes in runoff in the TRB. The contribution of climate change to runoff variations was greater in the middle and upper reaches of the basin. In particular, in the Burkhartong River basin, the contribution of climate change reached 93.8%. The results of the study will provide a scientific basis for rational development and ecological protection of water resources in the basin and offer data support for the response to climate change and the sustainable development of the region.

Author Contributions

Conceptualization, W.Z.; data curation, J.W. and Y.Y.; formal analysis, D.H.; investigation, D.H.; methodology, C.Z.; project administration, C.Z.; resources, Y.Y.; software, R.J.; supervision, J.Z.; validation, J.W.; visualization, D.H.; writing—original draft, D.H.; writing—review and editing, C.Z. All authors have read and agreed to the published version of the manuscript.

Funding

This research was funded by the National Natural Science Foundation of China, grant number 42461016, and the Joint Funds of the National Natural Science Foundation of China, grant number U24A20585.

Data Availability Statement

The datasets presented in this article are not readily available because the data are part of an ongoing study. And because the study area is a special border area, some of the measured data are confidential and cannot be shared.

Conflicts of Interest

The authors declare no conflicts of interest.

Appendix A

Table A1. Trends in the evolution of extreme temperature indicators in the TRB.
Extreme
Temperatures
AverageMaxYearMinYearTrend Rate/10aTrendSignificance (p)
TX10P37.09771969141961−2.67Decline<0.05
TN10P36.8196196981994−6.83Decline<0.05
TX90P37.666720191120122.72Rise<0.05
TN90P37.46782021819655.86Rise<0.05
FD0179.0019819621591998−2.25Decline<0.05
ID088.001141956691995−1.58Decline<0.05
SU2564.948419774419862.04Rise<0.05
TR207.65232021019571.23Rise<0.05
TNn−26.64−21.521996−31.9419720.64Rise<0.05
TXx33.5436.73201030.4419570.15Rise>0.05
Table A2. Trends in the evolution of extreme precipitation indicators in the TRB.
Extreme
Precipitation
AverageMaxYearMinYearTrend Rate/10aTrendSignificance (p)
Rxlday47.65107.89196514.3920110.99Rise>0.05
Rx5day78.68182.62196527.620111.42Rise>0.05
R95p140.98369.9199425.819777.79Rise>0.05
R99p47.2213.61965019563.59Rise>0.05
SDII6.869.519614.419670.09Rise>0.05
CDD5413220112219900.86Rise>0.05
CWD713198941964−0.07Decline>0.05
R10mm16241966819670.19Rise>0.05
R20mm5121994019670.28Rise>0.05
R25mm381994019670.15Rise>0.05

References

  1. Linnenluecke, M.K.; Smith, T. A Primer on Global Environmental Change. Abacus 2019, 55, 810–824. [Google Scholar] [CrossRef]
  2. Farsi, N.; Mahjouri, N. Evaluating the contribution of the climate change and human activities to runoff change under uncertainty. J. Hydrol. 2019, 574, 872–891. [Google Scholar] [CrossRef]
  3. Neelin, J.D.; Martinez-Villalobos, C.; Stechmann, S.N.; Ahmed, F.; Chen, G.; Norris, J.M.; Kuo, Y.-H.; Lenderink, G. Precipitation extremes and water vapor: Relationships in current climate and implications for climate change. Curr. Clim. Change Rep. 2022, 8, 17–33. [Google Scholar] [CrossRef]
  4. Zhang, Z.; Wan, L.; Dong, C.; Xie, Y.; Yang, C.; Yang, J.; Li, Y. Impacts of Climate Change and Human Activities on the Surface Runoff in the Wuhua River Basin. Sustainability 2018, 10, 3405. [Google Scholar] [CrossRef]
  5. Du, Y.; Bao, A.; Zhang, T.; Ding, W. Quantifying the impacts of climate change and human activities on seasonal runoff in the Yongding River basin. Ecol. Indic. 2023, 154, 110839. [Google Scholar] [CrossRef]
  6. The Water Cycle|U.S. Geological Survey [EB/OL]. Available online: https://www.usgs.gov/media/images/shuixunhuan-water-cycle-simplified-chinese-png (accessed on 5 November 2022).
  7. Tang, G.P.; Li, X.B.; Liu, Y.H. Vulnerability of water resources to global climate change and its assessment methods. Prog. Earth Sci. 2000, 15, 5. [Google Scholar] [CrossRef]
  8. Yang, D.; Yang, Y.; Xia, J. Hydrological cycle and water resources in a changing world: A review. Geogr. Sustain. 2021, 2, 115–122. [Google Scholar] [CrossRef]
  9. Tan, X.; Tan, X.; Liu, B.; Huang, Z. Contribution of changes in vegetation composition and climate variability on streamflow across the global watersheds. Catena 2023, 232, 107394. [Google Scholar] [CrossRef]
  10. Su, J.; Zhang, P.; Deng, X.; Ren, C.; Zhang, J.; Chen, F.; Long, A. Predicting Runoff from the Weigan River under Climate Change. Appl. Sci. 2024, 14, 541. [Google Scholar] [CrossRef]
  11. Zare, M.; Samani, A.A.N.; Mohammady, M. The impact of land use change on runoff generation in an urbanizing watershed in the north of Iran. Env. Earth Sci. 2016, 75, 1279. [Google Scholar] [CrossRef]
  12. Sajikumar, N.; Remya, R.S. Impact of land cover and land use change on runoff characteristics. J. Environ. Manag. 2015, 161, 460–468. [Google Scholar] [CrossRef] [PubMed]
  13. Ahmed, N.; Wang, G.; Booij, M.J.; Sun, X.; Hussain, F.; Nabi, G. Separation of the impact of landuse/landcover change and climate change on runoff in the upstream area of the Yangtze River, China. Water Resour. Manag. 2022, 36, 181–201. [Google Scholar] [CrossRef]
  14. Wang, T.; Shi, R.; Yang, D.; Yang, S.; Fang, B. Future changes in annual runoff and hydroclimatic extremes in the upper Yangtze River Basin. J. Hydrol. 2022, 615, 128738. [Google Scholar] [CrossRef]
  15. Wang, D.L.; Feng, H.M.; Zhang, B.Z.; Wei, Z.; Tian, Y.L. Quantifying the impacts of climate change and vegetation change on decreased runoff in China’s yellow river basin. Ecohydrol. Hydrobiol. 2022, 22, 310–322. [Google Scholar] [CrossRef]
  16. Tang, J.; Wang, W.; Cheng, H.; Jin, H.; Zhao, T.; Xie, Y. Changes in runoff and sediment discharge along with their driving factors in the Pearl River basin from 1961 to 2018. Int. J. Sediment Res. 2024, 39, 386–400. [Google Scholar] [CrossRef]
  17. Liu, H.; Liu, J.; Chen, W. Effects of climate and land use change on runoff of the Second Songhua River Basin guided by SWAT model. Water Supply 2024, 24, 707–722. [Google Scholar] [CrossRef]
  18. Li, Z.; Wu, Y.; Li, J.; Qi, P.; Sun, J.; Sun, Y. Attribution Analysis of Runoff Variation in the Second Songhua River Based on the Non-Steady Budyko Framework. Water 2023, 15, 451. [Google Scholar] [CrossRef]
  19. Carmona, A.M.; Renner, M.; Kleidon, A.; Poveda, G. Uncertainty of runoff sensitivity to climate change in the Amazon River basin. Ann. N. Y. Acad. Sci. 2021, 1504, 76–94. [Google Scholar] [CrossRef]
  20. Yin, S.; Gao, G.; Li, Y.; Xu, Y.J.; Turner, R.E.; Ran, L.; Wang, X.; Fu, B. Long-term trends of streamflow, sediment load and nutrient fluxes from the Mississippi River Basin: Impacts of climate change and human activities. J. Hydrol. 2023, 616, 128822. [Google Scholar] [CrossRef]
  21. Melesse, M.B.; Demissie, Y. Hydrology and droughts in the nile: A review of key findings and implications. Water 2024, 16, 2521. [Google Scholar] [CrossRef]
  22. Pekárová, P.; Halmová, D.; Sabová, Z.; Pekár, J.; Miklánek, P.; Mitková, V.B.; Prohaska, S.; Kohnová, S.; Garaj, M. Sensitivity of runoff due to changes in the characteristics of the water balance in the Danube River region. J. Hydrol. Hydromech. 2023, 71, 399–412. [Google Scholar] [CrossRef]
  23. Tsarouchi, G.; Buytaert, W. Land-use change may exacerbate climate change impacts on water resources in the Ganges basin. Hydrol. Earth Syst. Sci. 2018, 22, 1411–1435. [Google Scholar] [CrossRef]
  24. Zhai, R.; Tao, F. Contributions of climate change and human activities to runoff change in seven typical catchments across China. Sci. Total Environ. 2017, 605, 219–229. [Google Scholar] [CrossRef] [PubMed]
  25. Zhang, Y.; Jin, R.; Zhu, W.; Zhang, D.; Zhang, X. Impacts of Land Use Changes on Wetland Ecosystem Services in the Tumen River Basin. Sustainability 2020, 12, 9821. [Google Scholar] [CrossRef]
  26. Shi, J.; Jin, R.; Zhu, W.; Tian, L.; Lv, X. Effects of multi-scale landscape pattern changes on seasonal water quality: A case study of the Tumen River Basin in China. Environ. Sci. Pollut. Res. 2022, 29, 76847–76863. [Google Scholar] [CrossRef]
  27. Zhang, P.; Liu, X.; Zhu, W.; Li, C.; Jin, R.; Yan, H.; Gu, C.; Wang, J. Spatio-temporal changes in water conservation ecosystem service during 1990–2019 in the Tumen River Basin, Northeast China. Chin. Geogr. Sci. 2023, 33, 102–115. [Google Scholar] [CrossRef]
  28. Zheng, X.J.; Sun, P.; Zhu, W.H.; Xu, Z.; Fu, J.; Man, W.D.; Li, H.L.; Zhang, J.; Qin, L. Landscape dynamics and driving forces of wetlands in the Tumen River Basin of China over the past 50 years. Landsc. Ecol. Eng. 2017, 13, 237–250. [Google Scholar] [CrossRef]
  29. Lian, Y.; Sun, M.; Wang, J.; Luan, Q.; Jiao, M.; Zhao, X.; Gao, X. Quantitative impacts of climate change and human activities on the runoff evolution process in the yanhe river basin. Phys. Chem. Earth 2021, 122, 102998. [Google Scholar] [CrossRef]
  30. Jin, L.; Zhang, Z. Assessing Environmental Sustainability in the Transnational Basin of the Tumen River Based on Remote Sensing Data and a Geographical Detector. Sustainability 2024, 16, 8121. [Google Scholar] [CrossRef]
  31. Chatfield, C.; Xing, H. The Analysis of Time Series: An Introduction with R; Chapman and Hall/CRC: Boca Raton, FL, USA, 2019. [Google Scholar]
  32. Mann, H.B. Nonparametric tests against trend. Econom. J. Econom. Soc. 1945, 13, 245–259. [Google Scholar] [CrossRef]
  33. Xu, X.; Yang, D.; Yang, H.; Lei, H. Attribution analysis based on the Budyko hypothesis for detecting the dominant cause of runoff decline in Haihe basin. J. Hydrol. 2014, 510, 530–540. [Google Scholar] [CrossRef]
  34. Zhang, S.; Liu, J.; Li, C.; Yu, F.; Jing, L.; Sun, J. Analyzing the Impact of Climate Change and Human Activities on Surface Runoff in the Changbai Mountain Area, Northeast China. Water 2021, 13, 3473. [Google Scholar] [CrossRef]
  35. Li, X.; He, H.S.; Li, N.; Yu, H.; Zong, S.; Wu, Z.; Du, H. Season-dependent climate sensitivity of the surface runoff of major rivers in Changbai Mountain. J. Hydrol. 2024, 643, 131936. [Google Scholar] [CrossRef]
  36. He, Y.; Song, J.; Hu, Y.; Tu, X.; Zhao, Y. Impacts of different weather conditions and landuse change on runoff variations in the Beiluo River Watershed, China. Sustain. Cities Soc. 2019, 50, 101674. [Google Scholar] [CrossRef]
  37. Zhang, J.; Yu, X. Analysis of land use change and its influence on runoff in the Puhe River Basin. Environ. Sci. Pollut. Res. 2021, 28, 40116–40125. [Google Scholar] [CrossRef]
  38. Ngwira, S.; Damazio, C. Quantification of the effects of climatic factors and anthropogenic activities on streamflow: A systematic review. Discov. Water 2025, 5, 31. [Google Scholar] [CrossRef]
  39. Chen, L.; Yang, M.; Liu, X.; Lu, X. Attribution and sensitivity analysis of runoff variation in the yellow river basin under climate change. Sustainability 2022, 14, 14981. [Google Scholar] [CrossRef]
  40. Shen, Q.; Cong, Z.; Lei, H. Evaluating the impact of climate and underlying surface change on runoff within the Budyko framework: A study across 224 catchments in China. J. Hydrol. 2017, 554, 251–262. [Google Scholar] [CrossRef]
  41. Demeke, G.G.; Huang, J.C.; Chen, Y.Y. Runoff Generation Signaled by Deviations from the Budyko Framework. Water Resour. Manag. 2024, 39, 2133–2148. [Google Scholar] [CrossRef]
  42. Wu, C.; Yeh, P.J.F.; Zhou, J.; Li, J.; Zhong, L.; Wang, S.; Gong, Z.; Shi, M.; Ju, J.; Huang, G. Controlling factors of evapotranspiration predictability under diverse climates with the effects of water storage change in the Budyko framework. Water Resour. Res. 2024, 60, e2023WR034499. [Google Scholar] [CrossRef]
  43. Talebmorad, H.; Ahmadnejad, A.; Eslamian, S.; Ostad-Ali-Askari, K.; Singh, V.P. Evaluation of uncertainty in evapotranspiration values by FAO56-Penman-Monteith and Hargreaves-Samani methods. Int. J. Hydrol. Sci. Technol. 2020, 10, 135–147. [Google Scholar] [CrossRef]
  44. Prudhomme, C.; Reed, D.W. Relationships between extreme daily precipitation and topography in a mountainous region: A case study in Scotland. Int. J. Climatol. A J. R. Meteorol. Soc. 1998, 18, 1439–1453. [Google Scholar] [CrossRef]
  45. Feng, M.; Zhang, W.; Zhang, S.; Sun, Z.; Li, Y.; Huang, Y.; Wang, W.; Qi, P.; Zou, Y.; Jiang, M. The role of snowmelt discharge to runoff of an alpine watershed: Evidence from water stable isotopes. J. Hydrol. 2022, 604, 127209. [Google Scholar] [CrossRef]
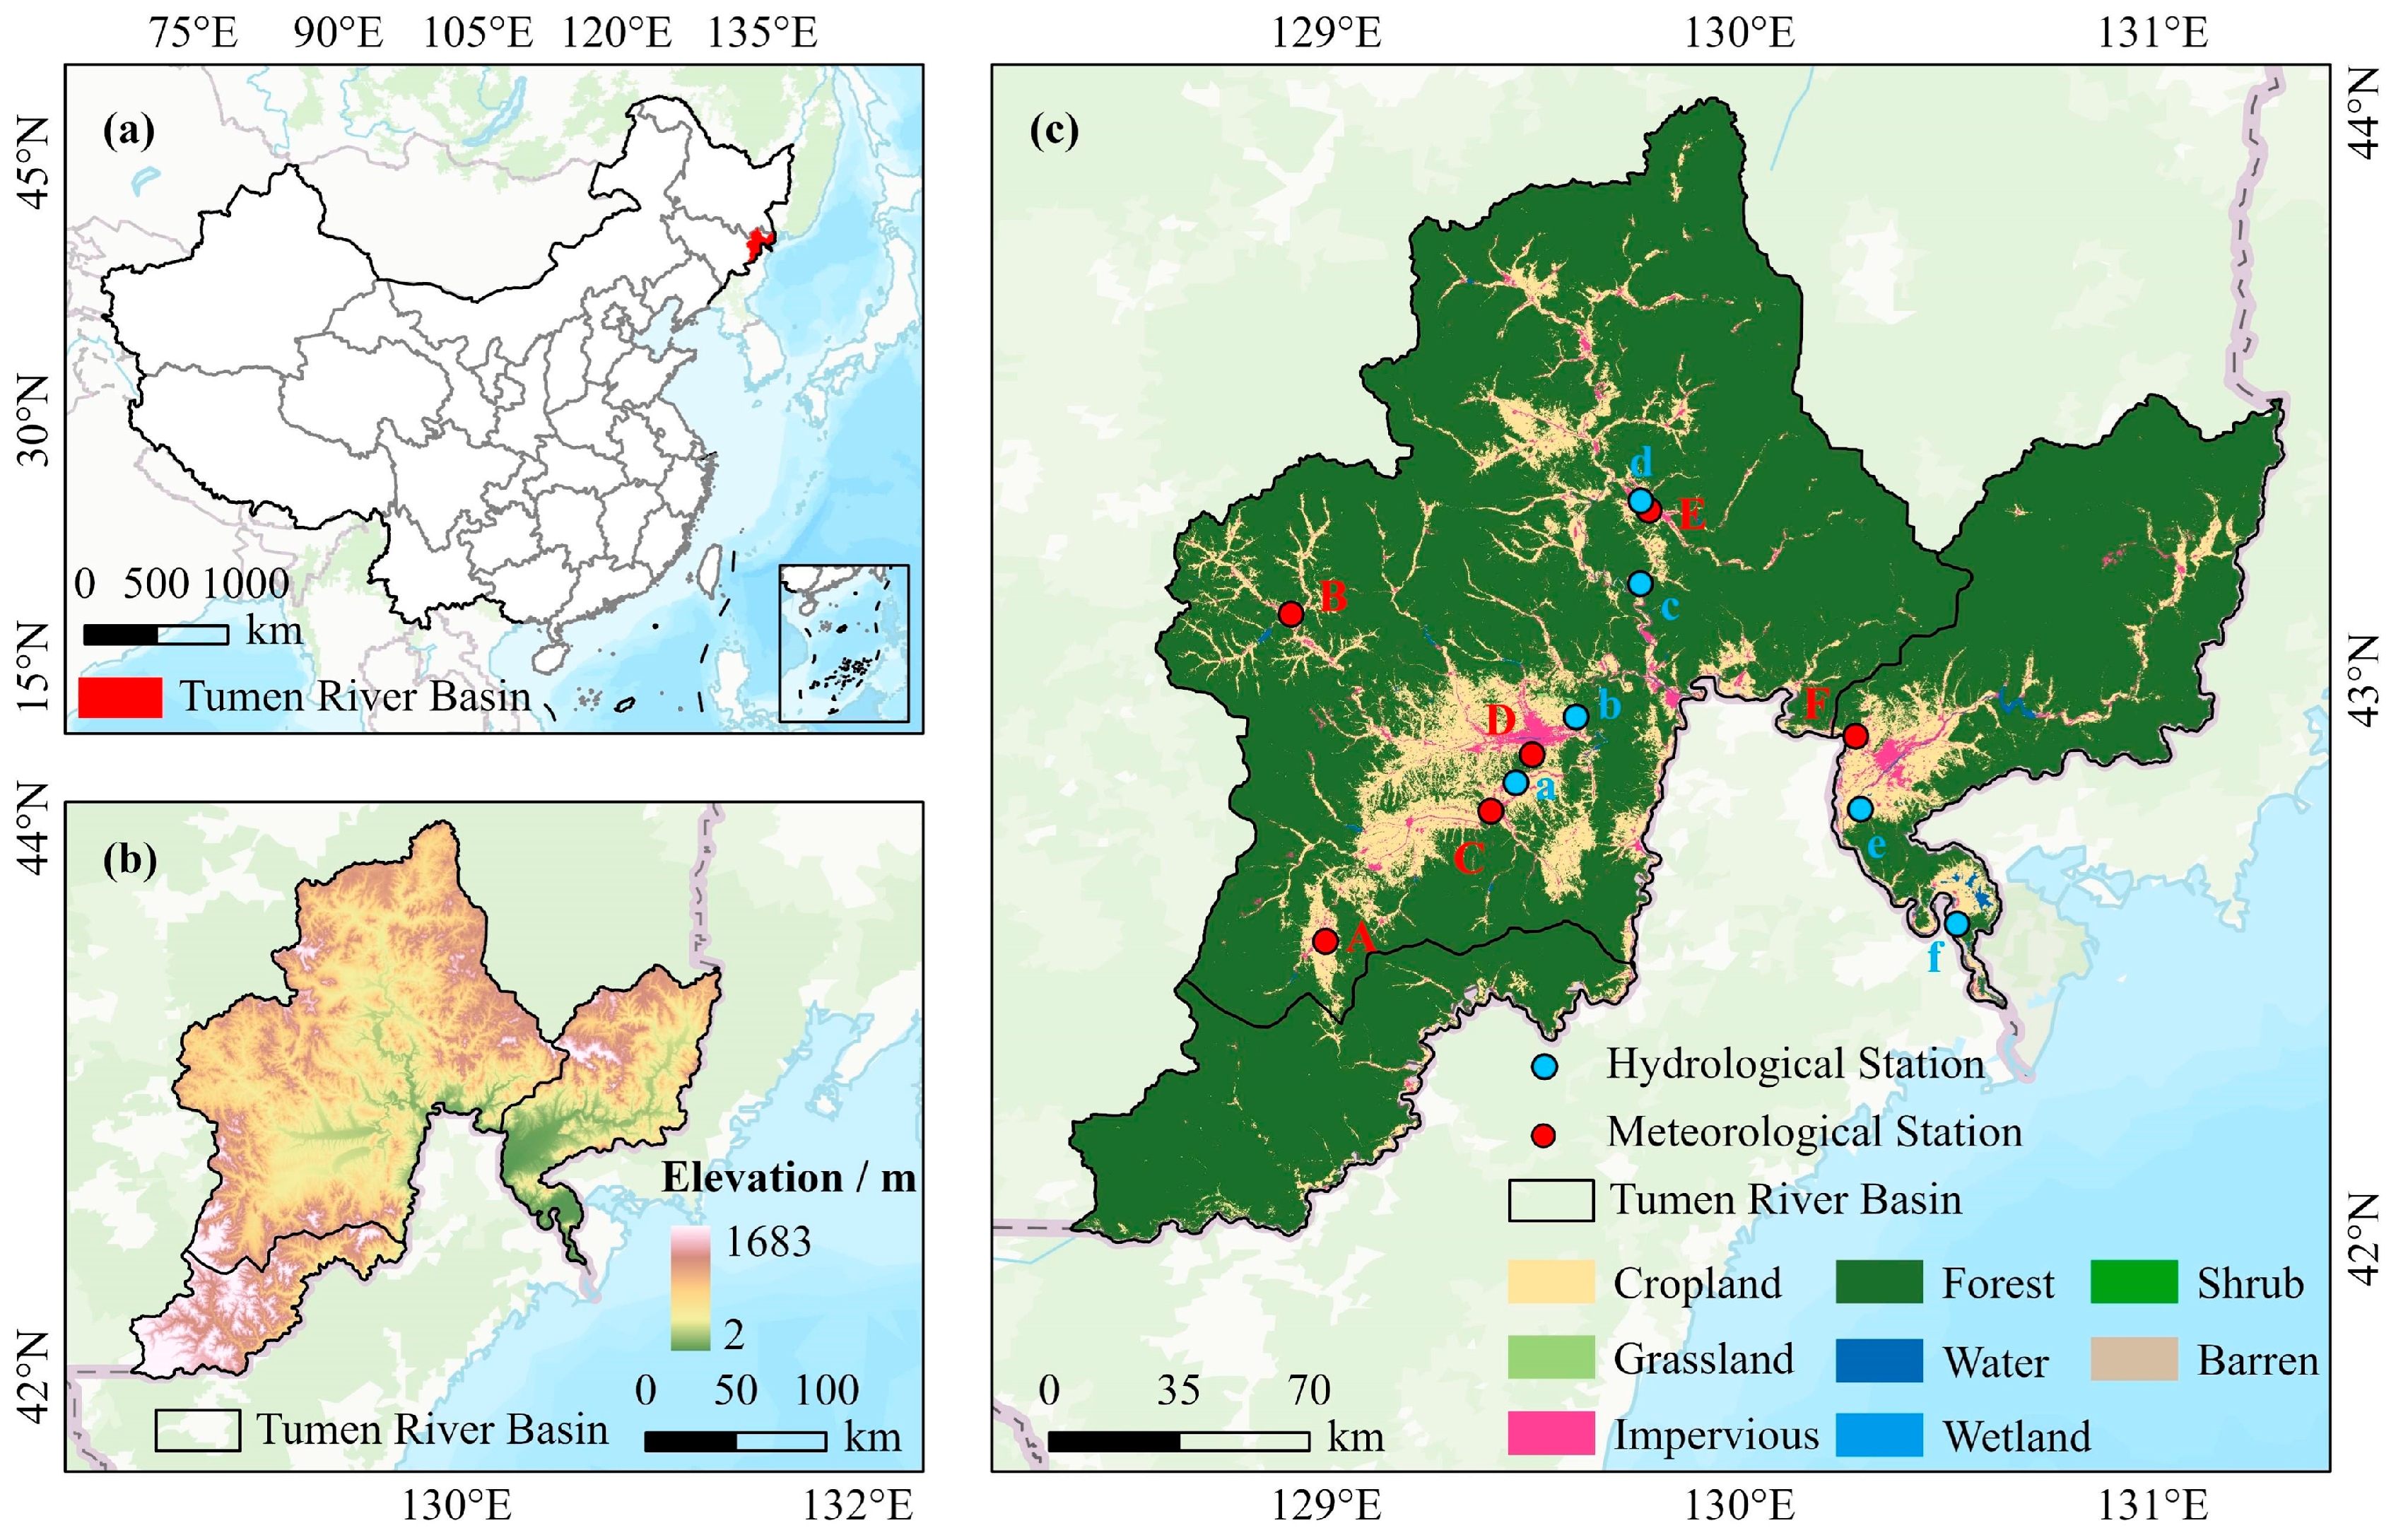
Figure 1. (ac) Study area (Tumen River Basin in Jilin Province).
Hydrology 12 00122 g001
Figure 2. Trends in runoff in the Tumen River Basin.
Hydrology 12 00122 g002
Figure 3. Cumulative anomaly curve in the Tumen River Basin.
Hydrology 12 00122 g003
Figure 4. Trends in extreme temperature indicators in the Tumen River Basin.
Hydrology 12 00122 g004
Figure 5. Trends in extreme precipitation indicators in the Tumen River Basin.
Hydrology 12 00122 g005
Figure 6. M-K test for extreme temperatures in the Tumen River Basin.
Hydrology 12 00122 g006
Figure 7. Budyko relationships for the six hydrological stations in the Tumen River Basin.
Hydrology 12 00122 g007
Table 1. Information on the main hydrological stations in the TRB.
Site NameSerial NumberLongitudes (E)Latitude (N)
Longjinga129.4642.82
Mopanshanb129.6142.93
Sandaogouc129.7643.17
Wangqingd129.7643.32
Hunchune130.2942.77
Quanhef130.5342.56
Table 2. Information on the main meteorological stations in the TRB.
Site NameSerial NumberLongitudes (E)Latitude (N)
HelongA12942.53
AntuB128.9243.12
LongjingC129.442.77
YanjiD129.542.87
WangqingE129.7843.3
HunchunF130.2842.9
Table 3. List of ETCCDMI core Climate Indices.
IDIndicator NameDefinitionsUNITS
FD0Frost daysAnnual count when TN (daily minimum) < 0 °CDays
SU25Summer daysAnnual count when TX (daily maximum) > 25 °CDays
ID0Ice daysAnnual count when TX (daily maximum) < 0 °CDays
TR20Tropical nightsAnnual count when TN (daily minimum) > 20 °CDays
GSLGrowing season lengthAnnual (1 January to 31 December in NH, 1 July to 30 June in SH) count between first span of at least 6 days with TG > 5 °C and first span after 1 July (1 January in SH) of 6 days with TG < 5 °CDays
TXxMax TmaxMonthly maximum value of daily maximum temp°C
TNxMax TminMonthly maximum value of daily minimum temp°C
TXnMin TmaxMonthly minimum value of daily maximum temp°C
TNnMin TminMonthly minimum value of daily minimum temp°C
TN10pCool nightsPercentage of days when TN < 10th percentileDays
TX10pCool daysPercentage of days when TX < 10th percentileDays
TN90pWarm nightsPercentage of days when TN > 90th percentileDays
TX90pWarm daysPercentage of days when TX > 90th percentileDays
WSDIWarm spell duration indicatorAnnual count of days with at least 6 consecutive days when TX > 90th percentileDays
CSDICold spell duration indicatorAnnual count of days with at least 6 consecutive days when TN < 10th percentileDays
DTRDiurnal temperature rangeMonthly mean difference between TX and TN°C
RX1dayMax 1-day precipitation amountMonthly maximum 1-day precipitationMm
Rx5dayMax 5-day precipitation amountMonthly maximum consecutive 5-day precipitationMm
SDIISimple daily intensity indexAnnual total precipitation divided by the number of wet days (defined as PRCP ≥ 1.0 mm) in the yearMm/day
R10Number of heavy precipitation daysAnnual count of days when PRCP ≥ 10 mmDays
R20Number of very heavy precipitation daysAnnual count of days when PRCP ≥ 20 mmDays
RnnNumber of days above nn mmAnnual count of days when PRCP ≥ nn mm; nn is user-defined thresholdDays
CDDConsecutive dry daysMaximum number of consecutive days with RR < 1 mmDays
CWDConsecutive wet daysMaximum number of consecutive days with RR ≥ 1 mmDays
R95pVery wet daysAnnual total PRCP when RR > 95th percentilemm
R99pExtremely wet daysAnnual total PRCP when RR > 99th percentilemm
PRCPTOTAnnual total wet-day precipitationAnnual total PRCP on wet days (RR ≥ 1 mm)mm
Table 4. Characteristics of runoff variations in the Tumen River Basin.
BasinStationCatchment Area
(km2)
Runoff Amount
(billion m3)
Runoff Depth
(mm)
Slope
(mm/10a)
Trendsp-Value
MainstemQuanhe31,80068.58215.67−1.01decline>0.05
Burgharton RiverMopanshan684710.74166.04−0.23decline>0.05
Gaya RiverSandaogou608213.23217.49−0.04decline>0.05
Hunchun RiverHunchun383613.28341.370.05upward>0.05
Hyland RiverLongjin25674.58178.430.11upward>0.05
Wangqing RiverWangqing10902.44227.620.07upward>0.05
Table 5. Amount of hydrometeorological changes in the Tumen River Basin.
Type1976–19861986–19961996–20062006–2017
Single Land Use Dynamic DegreeArtificial surfaces0.37%0.42%2.04%−0.15%
Reservoirs9.32%−2.17%16.17%8.18%
Cropland0.19%−0.09%−0.06%−0.03%
Woodland0.00%0.05%−0.02%0.01%
Watersheds−1.88%−1.44%−1.27%−0.47%
Grasslands−0.21%−1.32%−1.28%−0.71%
Bare land4.90%−2.11%6.75%−6.40%
Comprehensive Land Use Dynamic Degree0.04%0.05%0.05%0.02%
Table 6. Amount of hydrometeorological changes in the Tumen River basin.
BasionPeriodsP/mmR/mmET0/
mm
nElasticity
εPTrendsεET0εnTrends
MainstemBase589.82204.38888.871.2230.445−0.00050.420
Human activity622.50222.83906.651.2020.448−0.00050.376
Burgharton RiverBase488.69206.23910.980.9970.35−0.00130.407
Human activity542.79226.39915.570.9430.379−0.00110.344
Gaya RiverBase588.22252.22880.230.9450.406−0.0010.372
Human activity542.56198.24894.261.0980.428−0.00130.253
Hunchun RiveBase589.82315.29888.870.7690.422−0.00080.309
Human activity623.64357.90907.000.7190.433−0.00070.295
Hyland RiverBase487.93154.99903.831.1740.327−0.00160.354
Human activity569.28196.31921.991.1590.364−0.00130.265
Wangqing RiverBase531.91206.89882.121.0230.373−0.00120.315
Human activity546.67230.75894.900.9640.383−0.00110.310
P: average annual precipitation; R: average annual runoff depth; ET0: potential evapotranspiration; n: land surface characteristics parameters; εp, εET0, εn: elasticity coefficients of precipitation, potential evapotranspiration, and land surface characterization parameters.
Table 7. Contribution rate of runoff variations under the elasticity coefficient method.
BasindRP/mmdRET0/mmdRn/mmdR/mmnP/%nET0/%nh/%
Mainstem12.33−0.026.1518.4566.79%−0.12%33.33%
Burgharton River18.91−0.031.2620.1693.8%−0.02%6.23%
Gaya River−18.53−0.01−35.43−53.9834.33%0.02%65.64%
Hunchun River14.27−0.0128.3642.6133.48%−0.03%66.55%
Hyland River26.56−0.0314.7941.3264.29%−0.07%35.78%
Wangqing River6.29−0.0117.5823.8726.36%−0.01%73.65%
dRP: changes in runoff from rainfall; dRET0: changes in runoff from potential evapotranspiration; dRn: changes in runoff from land surface; dR: changes in runoff depth; np: contribution rate of precipitation to runoff variations; nET0: contribution rate of potential evapotranspiration to runoff variations; nh: contribution rate of human activities to runoff variations.
Disclaimer/Publisher’s Note: The statements, opinions and data contained in all publications are solely those of the individual author(s) and contributor(s) and not of MDPI and/or the editor(s). MDPI and/or the editor(s) disclaim responsibility for any injury to people or property resulting from any ideas, methods, instructions or products referred to in the content.

