1. Introduction
Climate change exerts immense pressure on the environment, primarily through rising temperatures. The Mediterranean region is warming 20% faster than the global average, leading to more frequent extreme weather events, such as droughts and floods [
1]. These changes have profound consequences, including increased energy demand, negative impacts on public health, the disruption of ecosystems, and greater strain on water resources [
2,
3,
4]. The growing issue of water scarcity highlights the urgent need for more efficient water management strategies and enhanced protection of water resources.
The recharge of groundwater with tertiary treated wastewater is a sustainable method of preventing both saline water intrusion and groundwater shortages. Different studies have examined the use of infiltration lakes to affect the chemical composition of the underlying aquifer [
5,
6,
7,
8]. Some studies have shown that managed aquifer recharge (MAR) improves water quality by decreasing salinity [
5,
9] and nitrate levels during the infiltration phase [
7]. Soil aquifer treatment (SAT), under carefully designed operation, effectively removes organics, heavy metals, and toxic elements by chemical precipitation and adsorption [
10]. MAR systems can also remove pollutants including most heavy metals,
E. coli, and dissolved organic carbon, but the removal efficiency can vary with MAR design and site conditions (i.e., porosity, grain size distribution) [
11]. The recharge flow path may involve geochemical processes that mitigate the pollutants from the tertiary treated wastewater [
8,
9]. The recovered groundwater (after the SAT) may have adequate quality for agricultural use [
5,
8,
12]. A deep understanding of hydrogeological site conditions and efficient scheme management are critical for the success of MAR [
13].
Regarding recharge water, the suspended solids must be kept below 10 mg/L to obtain the optimal infiltration rates [
14]. High values of suspended sediment cause clogging, which affects infiltration [
7,
14]. The frequent purification of the bottom of recharge ponds can almost completely restore their infiltration capacity [
8,
15].
The leaching of pollutants depends on the soil type, hydraulic conductivity, precipitation, evapotranspiration, and the velocity of water in the unsaturated zone [
16,
17,
18,
19]. In the unsaturated zone, many processes, such as biodegradation, mechanical filtration, chemical reactions, volatilization, and dispersion, occur. The flow path is often strongly influenced by the presence of cracks, whereas the depth of groundwater affects the amount of material through which the pollutant passes [
20].
Concerning pesticides, they originate from both point and nonpoint (diffuse) sources, including agricultural and urban land, seepage to groundwater in areas where pesticides are used, atmospheric deposition, sewage treatment plants, industrial discharge, and waste disposal [
21], and enter the environment as herbicides, insecticides, fungicides, rodenticides, and algicides. The fate and transport of pesticides in the soil are influenced mostly by the pivotal processes of adsorption, degradation, and mobility [
22].
MAR systems may use a variety of water sources, including surface water, tertiary treated wastewater, and stormwater, all of which can contain a variety of enteric pathogens [
23]. Protozoa are indicators of surface water contamination because, due to their large size, they are transported only short distances through groundwater systems. In contrast, smaller bacteria and viruses such as total coliform bacteria,
Escherichia coli, Enterococci, and coliphages (viruses that infect coliform bacteria) can be transported to groundwater. Still, their survival in such environments is minimal due to the conditions [
24]. It is important to note that pathogen reduction depends critically on the long-term sustained activity of MAR mechanisms [
23]. Pathogens, including antibiotic-resistant bacteria and viruses and pharmaceutical products, contaminate treated wastewater, most likely due to ingestion and the subsequent excretion from patients and hospital wastewater [
25,
26]. The active forms of some pharmaceutical products and their metabolites can be ecotoxicologically hazardous to the environment [
25].
Hannappel and colleagues in 2014 [
27,
28] compiled an inventory featuring 224 operational managed aquifer recharge (MAR) sites with various recharge techniques (spreading method, induced bank filtration, well, shaft, and borehole recharge, in-channel modifications, and runoff harvesting) across 23 European nations [
28,
29,
30,
31]. Additionally, environmental, human health, social, economic, technical, and legislative risks are addressed [
32]. Rodríguez et al. (2018) structured these risks into technical and non-technical categories [
33]. Nandha et al. (2015) offered insights into process-oriented facets of MAR-related risks, differentiating them into strategic risks during MAR planning, water pretreatment, recharge, aquifer storage, groundwater recovery, and water post-treatment [
32,
34]. Additionally, in the framework of monitoring, a total of 38 parameters were organized into specific categories, encompassing general site information (including operator name, MAR type, and location), water quality monitoring (such as the schedule for bulk chemistry monitoring), operational details (ranging from the operational scale to the number of abstraction wells), and hydrogeological characteristics (such as aquifer type and hydraulic conductivity) [
26]. In Europe, MAR is primarily used to produce domestic water, and much less for agriculture and industry [
28].
Cyprus, an island facing significant challenges due to climate change, has experienced rising temperatures and an increase in extreme events like droughts [
35]. In response, the country launched the Water Master Plan in the late 1960s, a forward-looking strategy designed to address the diverse water needs of its population and sustainably safeguard the environment. The primary goals of this plan are to augment water availability and curb water demand [
8].
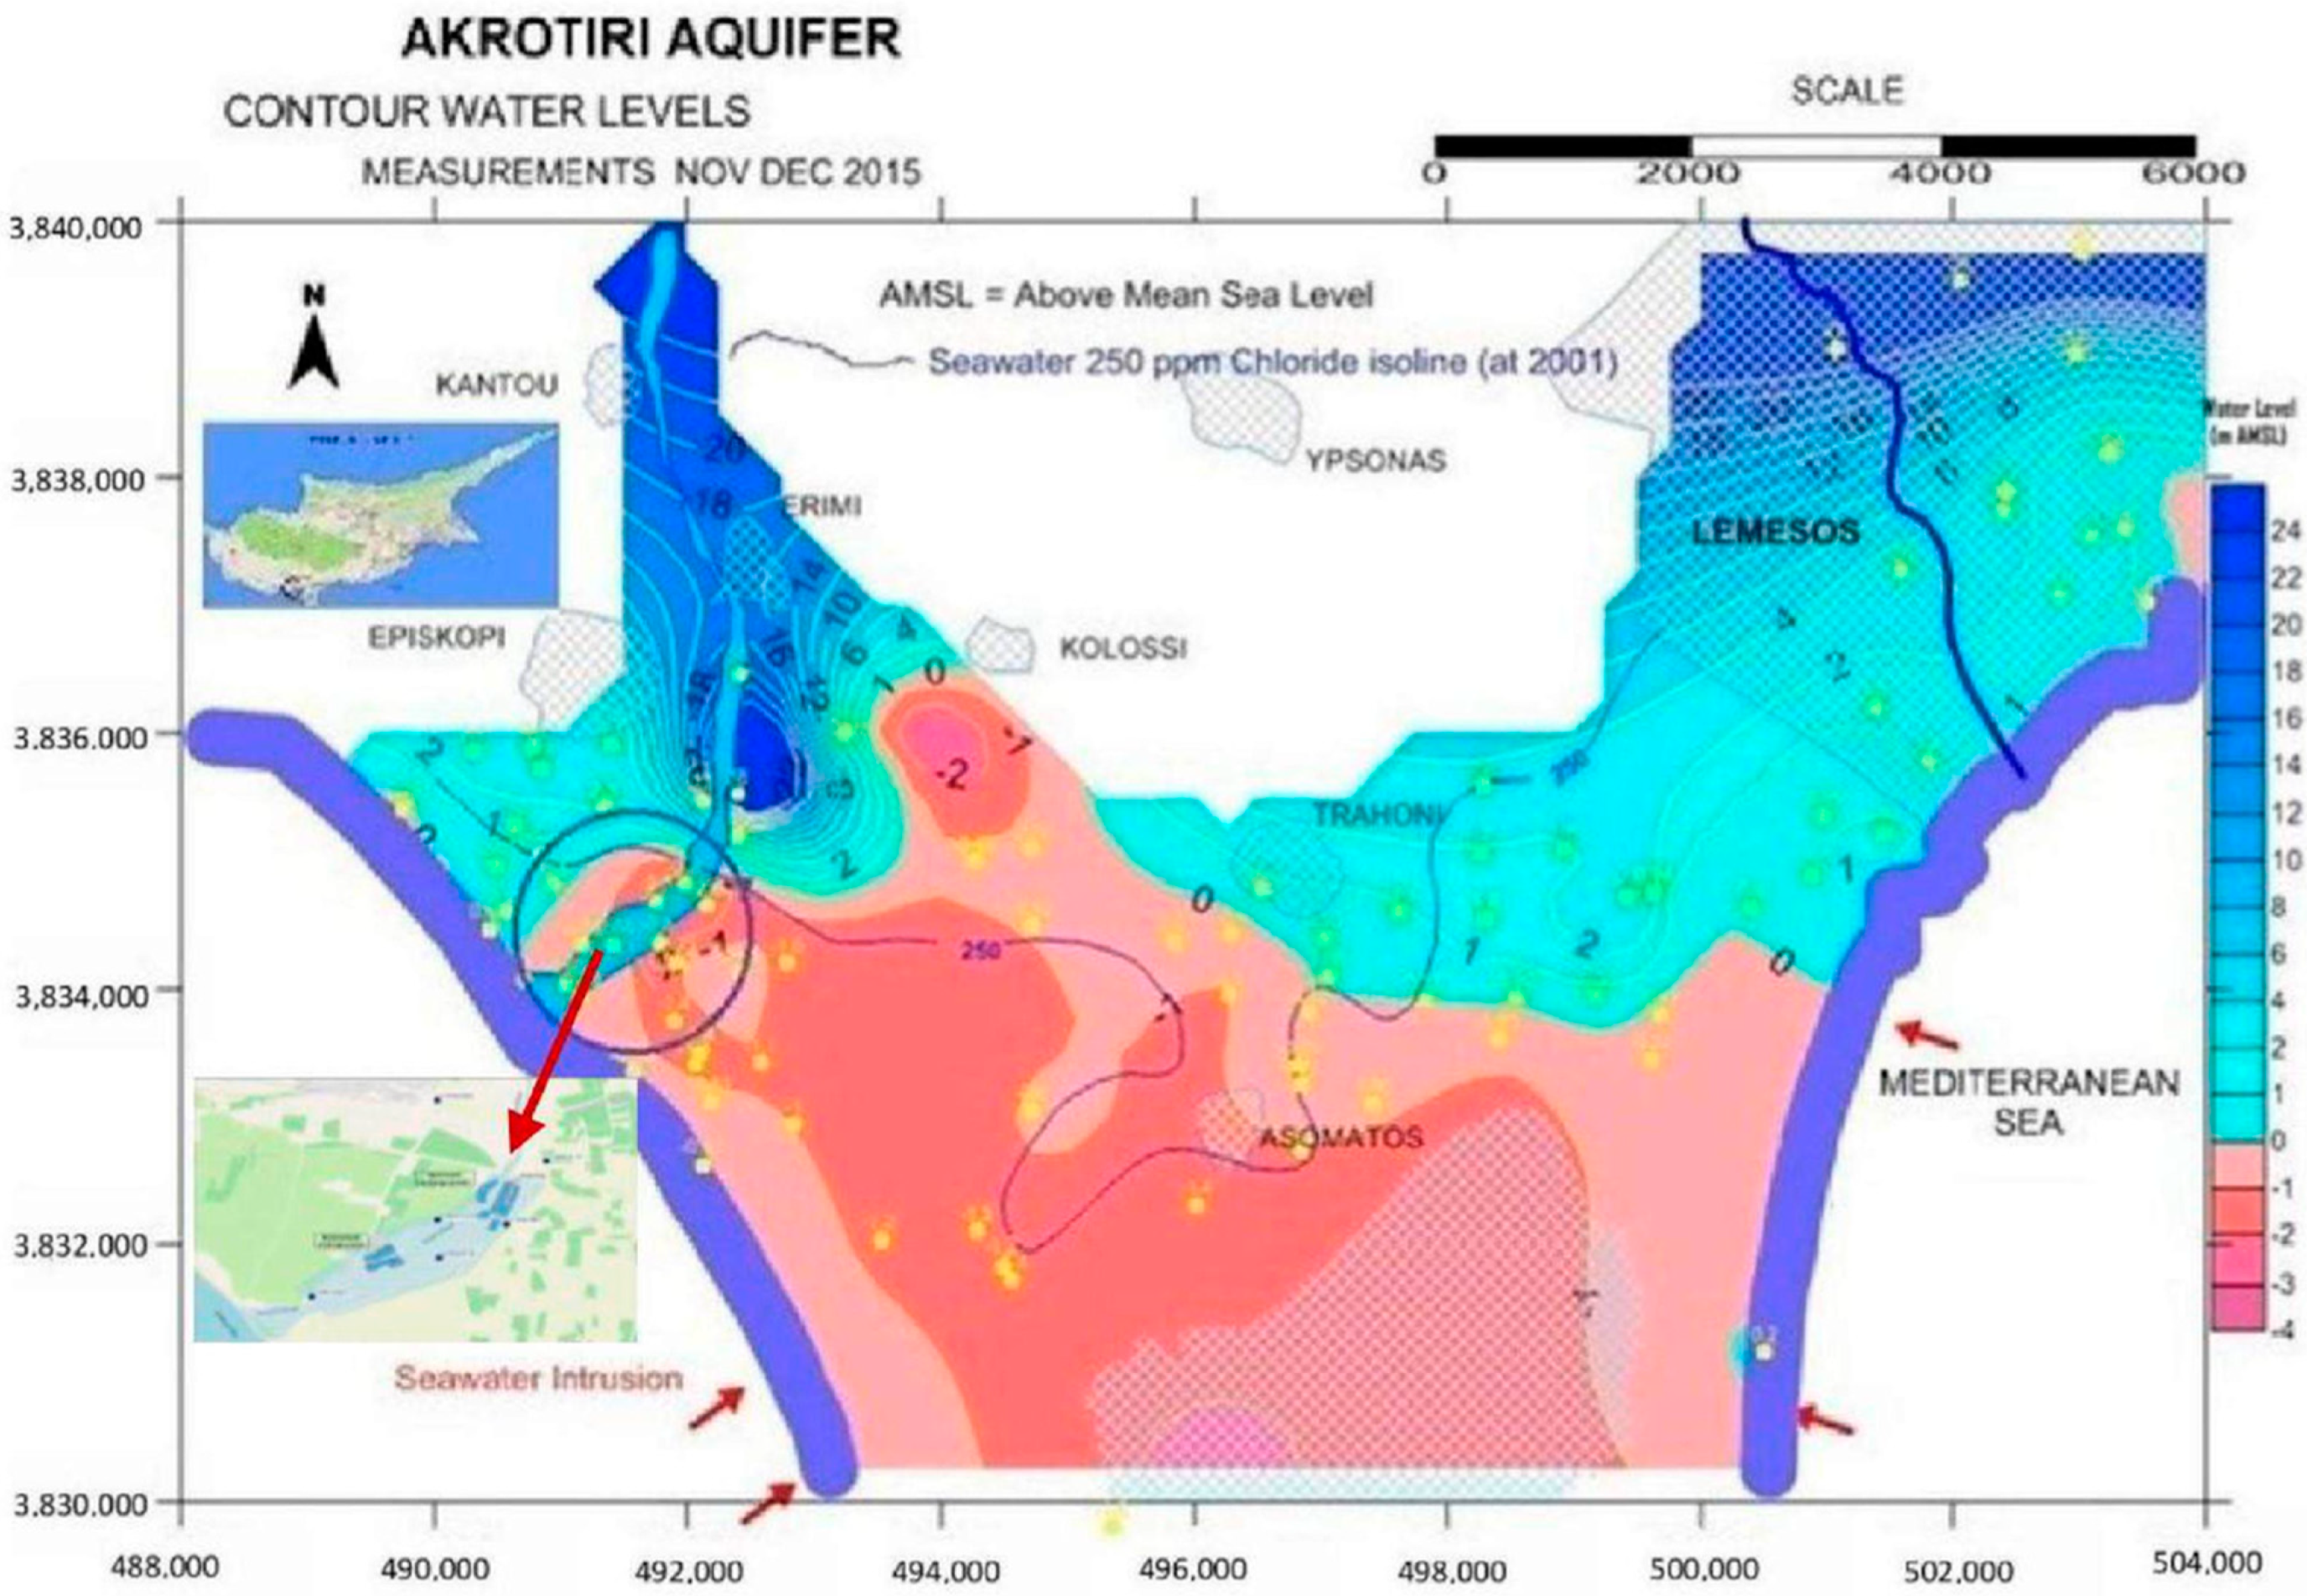
In addition to using treated effluent from urban wastewater treatment facilities for irrigation, Cyprus has expanded this practice to include the recharging of aquifers, further increasing water availability and reducing demand. During the winter months, aquifers serve as reservoirs, storing water that is later extracted for agricultural use during the irrigation phase. Like many other countries in the European Union and worldwide, Cyprus has increasingly turned to innovative solutions such as MAR to address water scarcity and climate change impacts. MAR, using tertiary treated wastewater, is recognized as an effective adaptation measure to replenish water reserves, reduce environmental impacts, and promote sustainable water management. In Cyprus, two notable pilot projects are underway: one at the Akrotiri Aquifer near Limassol and another at the Ezousa Aquifer near Paphos. These projects represent an important evolution of the Water Master Plan and provide a model for future water resource management in the country following the circular economy, especially as Cyprus continues to face the challenges posed by climate change. The Akrotiri MAR project, for instance, is a response to the adverse effects of excessive groundwater extraction, which have led to aquifer salinization due to seawater intrusion.
The existing MAR systems are rarely studied, and the absence of a complete monitoring framework drives misoperation and clogging phenomena. The processes involved in the vadose zone and the variation in the infiltration rate are barely understood. The main objective of the current study refers to the analysis and evaluation of several water quality data items such as physicochemical and nutrients parameters, metals, pesticides, pharmaceuticals and fecal indicator bacteria, before, during, and after recharge, to understand the MAR system’s response. The ultimate goal is to halt salt intrusion and keep nutrient levels low during wastewater recycling. In the Akrotiri MAR system, the current monitoring effort provides a significant data set regarding size and the variety of parameters that is unique, and is the most detailed in the world compared to other MAR systems [
9,
36]. Datasets of lower frequency and with fewer parameters were used to study the processes in the vadose zone in a MAR in Australia, and to evaluate the response of an agricultural alluvial aquifer resulting from MAR operation in Northeast Arkansas [
9,
36]. This study provides recommendations for improved monitoring, and demonstrates what parameters should be selected for the proper operation of the alluvial Mediterranean coastal aquifers, which suffer from salinization and nitrate pollution. This knowledge can be transferred to similar coastal alluvial MAR systems.
The structure of this study is organized as follows: In the
Section 2, we describe the location and the geological and hydrological characteristics of the Akrotiri Aquifer and the study area (MAR system). We describe the monitoring conducted in the study area, along with the sample analysis and quality control procedures implemented. Additionally, we record and analyze the quantities and types of recharged water, as well as the volumes of pumped water in the study area. In the
Section 3, we analyze the quantitative and qualitative parameters and present the main results regarding their status in the aquifer and in the recharged water. The
Section 4 includes a discussion of the results, followed by the main conclusions of the study.
3. Results
Most of the precipitation in the Akrotiri area falls in winter. The mean (2016–2021) annual precipitation recorded at the Kouris Dam meteorological station is 413 mm.
Limnatis, Kryos, and Kouris are the three main tributaries of the Kouris River and flow into the bay of Episkopi. The Kouris Dam is in the area where the three tributaries join (see
Figure S9 in the Supporting Information). The ranges of the mean annual flow (Q) in the river were, for the first monitoring point in Kryos near Alasa (r9-6-2-90), 0.087–1.630 m
3/s; for the second monitoring point in Kouris Alassa New Weir (r9-6-4-92), 0.90–0.265 m
3/s; and for the third monitoring point at the Limnatis Zygos U/S Kouris Dam (r9-6-7-70), 0.0596–1.151 m
3/s, for the period 2016 to 2020 (including).
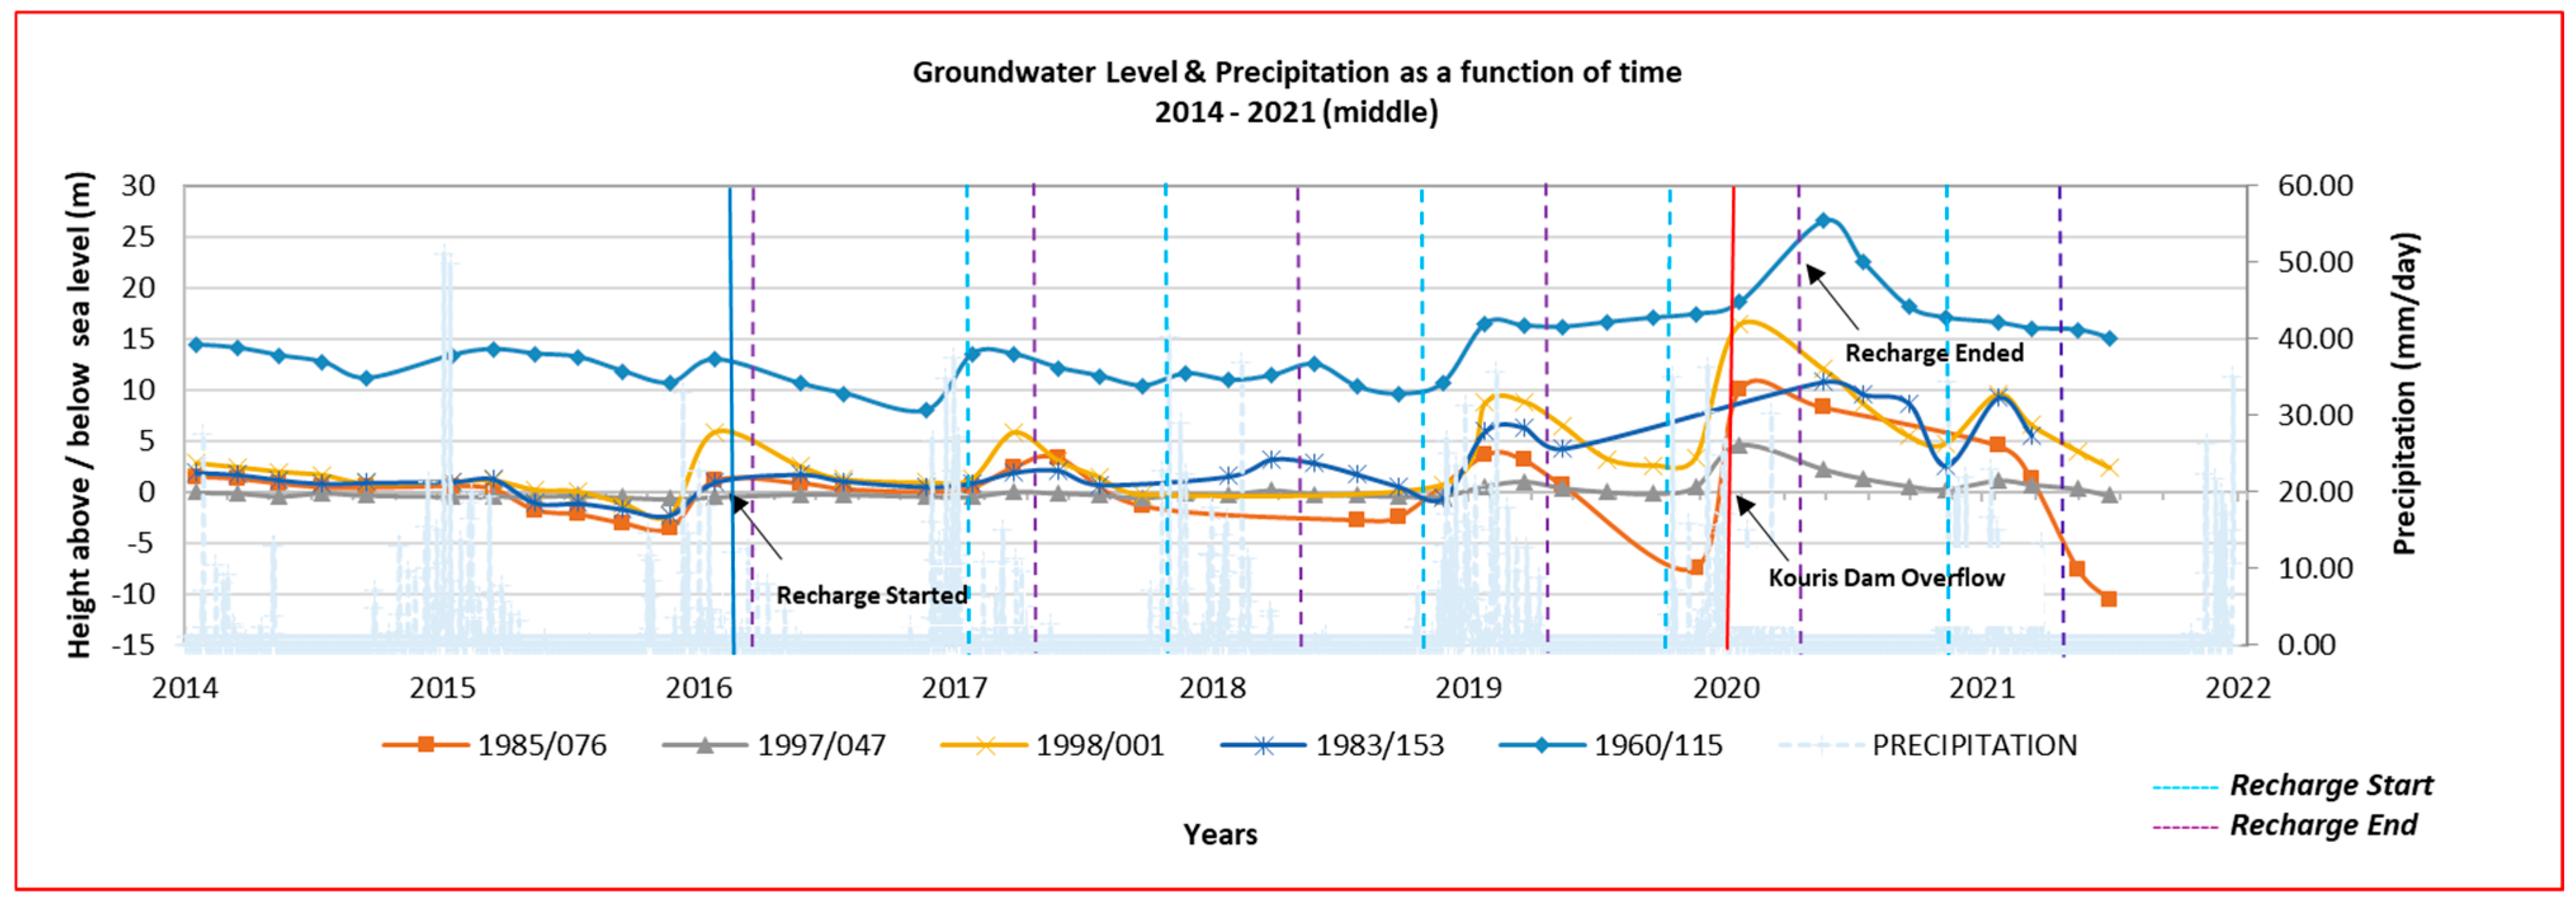
The groundwater level rises during winter due to increased recharge, and decreases in the summer period due to the use of water for irrigation and evapotranspiration and the absence or lower level of groundwater recharge. Before the initialization of the MAR system, groundwater levels decreased, even to below sea level.
As shown in
Figure 4, the situation improved due to the increased amount of rainfall and the overflow of the Kouris dam on 7 January 2020, and hence the greater amount of recharge water, but there was still a long-term downward trend, mostly for one borehole. The latest measurements of March 2021 and July 2021 show that, in general, there was a quantitative improvement in the monitoring boreholes 1983/153, 1998/001, and 1960/115, with levels at 5.56 m, 2.32 m, and 15.08 m, respectively, but not in borehole 1985/076 (−10.64 m), where the groundwater level decreased significantly (below sea level) due to overpumping. The water level in borehole 1998/001 showed the largest fluctuation, and in borehole 1997/047, little change was seen due to its proximity to the sea (see
Figure S7 in the Supporting Information).
For further and faster qualitative and quantitative improvements of the aquifer, but also to derive a clearer picture of the effects and benefits of managed aquifer recharge, the ideal would be to have no pumping at all during summer in and near the recharge area, or at least as little as possible. Additionally, the measurements now miss important peaks in water levels because the frequency of groundwater level measurements is too low. More frequent (automated) monitoring is needed, and the ideal approach is to install automatic water level recording systems in all monitoring boreholes where daily water recording will occur.
3.1. Salinization Parameters
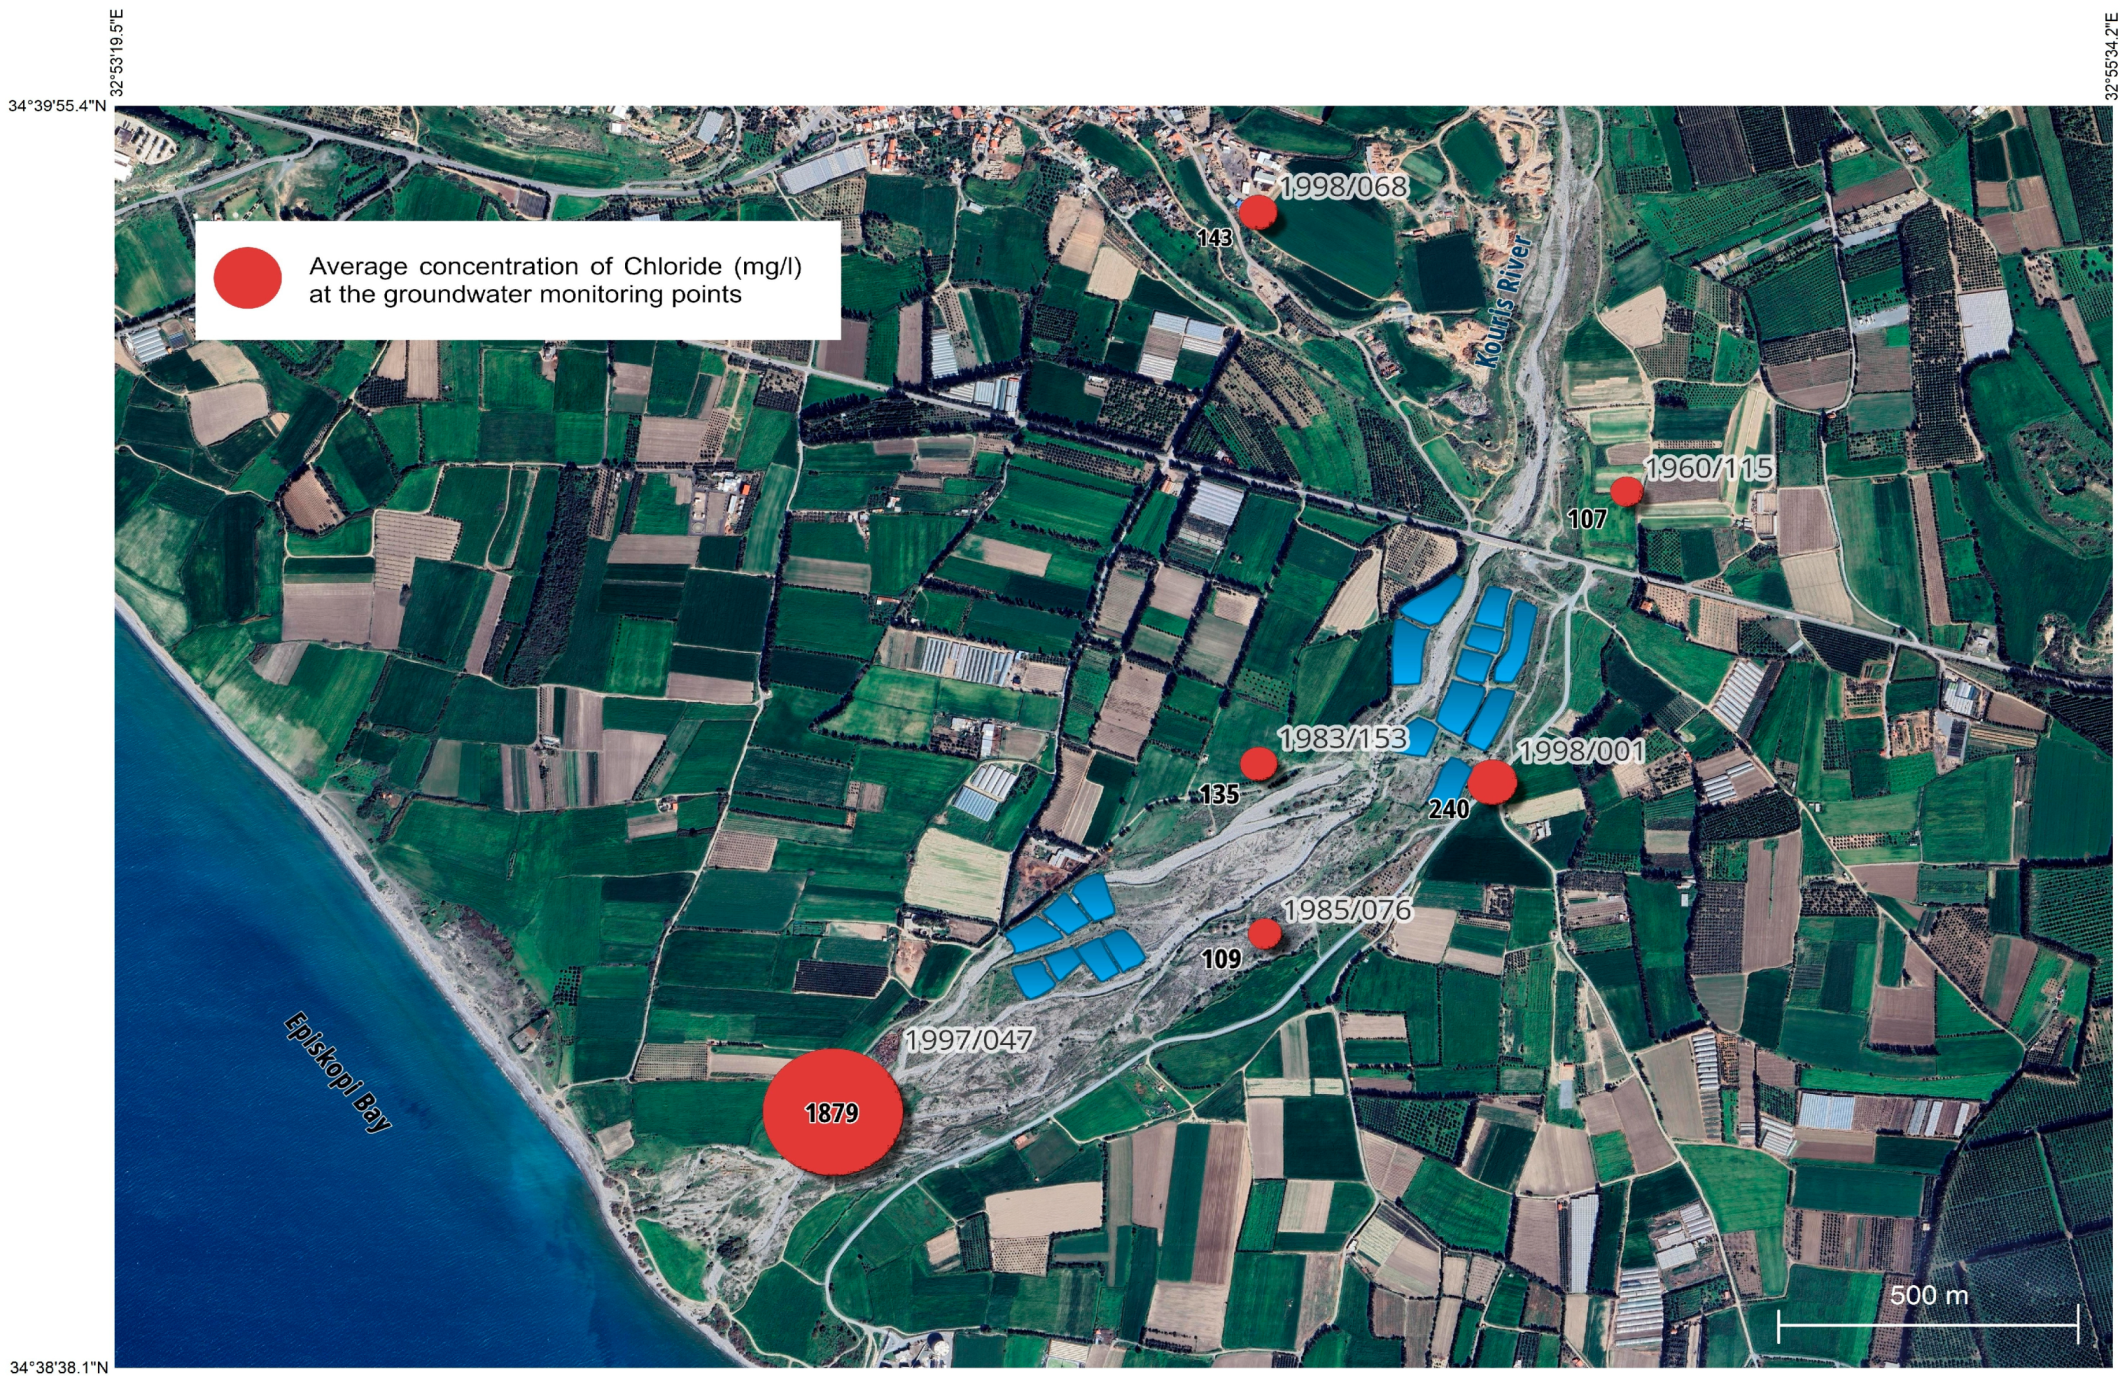
The results show that the closest borehole to the sea in 1997/047 exceeded the highest acceptable values established for the CY9 aquifer for the parameters of Cl, EC, and SO
4 (250 mg/L, 2500 μS/cm, and 250 mg/L respectively) due to over-abstraction and seawater intrusion (see
Table S2 in the Supporting Information). The borehole closest to the recharge ponds in 1998/001 exceeded the highest acceptable values only for the average value of Cl before recharge and for the maximum value (830 mg/L). Additionally, the maximum value (7020 mg/L) of EC for the borehole 1985/076 is above the highest acceptable value (see
Table S2 in the Supporting Information).
The reduction in the amount of chloride in an aquifer is affected by recharge and rainfall. Due to the overflow of the Kouris dam on the 7th of January 2020 after a large amount of rainfall (end 2019–middle 2020), the Kouris river received large amounts of fresh water, and a significant reduction in chlorides was observed in some of the boreholes downstream of the Kouris river and the first 10 recharge ponds, especially in boreholes 1998/001 and 1983/153 (
Figure 5 and
Figure 6).
Upstream of the Kouris Dam, the average chloride concentrations in the 2016–2020 period were 213, 45, and 33 mg/L at monitoring points r9–6–4–92, r9–6–7–70, and r9–6–2–60, respectively. In the deepest point of the Kouris dam, the mean chloride concentration was 66 mg/L (monitoring point d9-6-9-10_DLP). There are no chloride measurements for point r9-6-9-90 in Erimi, and there are no monitoring points in the Kouris River downstream of the Kouris Dam for this period (see
Figure S9 in the Supporting Information).
From 2016 to 2020, approximately 9.5 million m
3 of wastewater was processed annually by the SBLA. About 75% was domestic and 25% came from industrial sources, including businesses. The latter was responsible for the increased chloride concentrations (>300 mg/L) in the tertiary treated wastewater (see
Table S1 and Text S2 in the Supporting Information). The values of chloride in the recharge pond were mostly due to the occasional increase in the chlorine concentration in the tertiary treated wastewater. The comparison of these results with the results of the analysis of the data for water that flows from the outlet of the pipe to the recharge pond for these specific years (2019–2020) shows similar values (see
Figure S8 in the Supporting Information).
The tertiary treated wastewater utilized for the recharging of the aquifer between 2015 and 2020 exceeded, during certain periods, the highest acceptable values of 15 mg/L for total nitrogen (TN), 10 mg/L for total phosphorus (TP), and 250 mg/L for chloride (Cl), as specified in the waste disposal permit of SBLA for recharging the aquifer (see
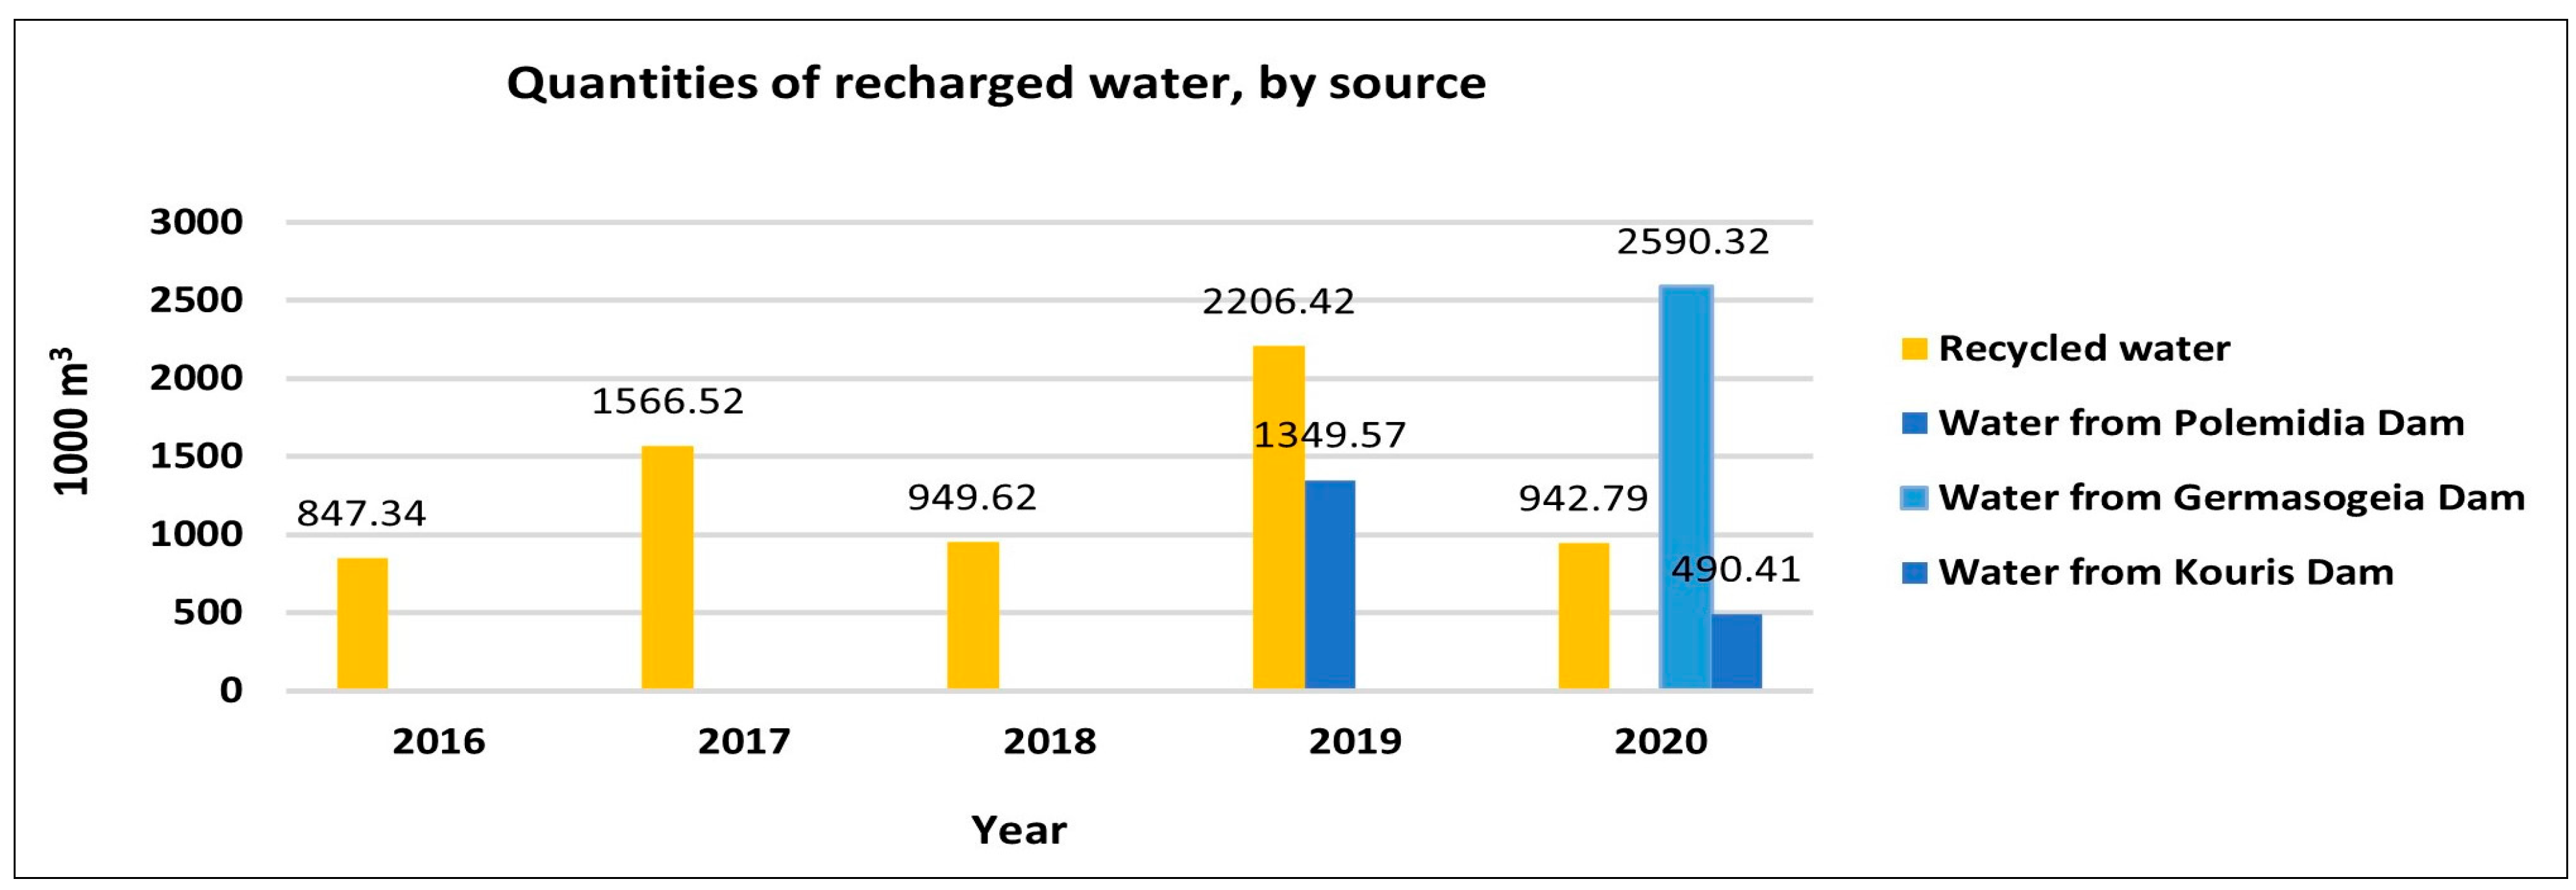
Table S1 in the Supporting Information). In contrast, the quality of the freshwater that was diverted from the reservoirs (in the year 2019 from the Polemidia dam and the year 2020 from the Kouris and Germasogeia dams) to the MAR system was good, as the analyses, which were carried out within the framework of the Water Framework Directive 2000/60/EC, show.
3.2. Water and Chloride Budget Analysis of the MAR System
The dissolved chloride (Cl), which can be present at the level of natural traces due to its conservative nature, is used in the current study to better define and understand the concentration changes in the groundwater where the MAR operation is taking place.
The mass balance of chloride can be described by Equation (1),
Here, the following pertains:
MCl—Total mass of chloride in the aquifer (kg);
—Rate of change of chloride mass over time;
InputCl—Chloride mass flux into the aquifer (e.g., from recharge, lateral inflow);
OutputCl—Chloride mass flux out of the aquifer (e.g., discharge, pumping).
Under steady state (no change in mass over time),
where QMAR and CMAR are the recharge volume and chloride concentrations of treated wastewater (m
3/year, kg/m
3), QPREC and CPREC are the recharge volume and chloride concentrations of precipitation (m
3/year, kg/m
3), QPUMP and CPUMP are the recharge volume and chloride concentrations of pumping water (m
3/year, kg/m
3), Qin and Qout are the groundwater flow rates in and out of the aquifer (m
3/year), and Cin and Cout are the chloride concentrations of inflow and outflow water (Kg/m
3).
The Chloride Budget in the MAR system area is calculated for the year 2018, selecting a control area of the MAR system. In the case of Akrotiri MAR, the control area is estimated to be equal to 0.61 km2, and has been selected to have an upstream boundary at the discharge ponds and a downstream boundary at the pumping wells.
In order to estimate the water volume and the chloride mass inside the control volume, it was considered that the average depth of the control volume is equal to the water level fluctuation of the aquifer for one year. Since the borehole’s water level data recordings were limited for the year 2018, we considered the water level for both years 2017 and 2018. The changes in groundwater levels for the upstream borehole with hydrological number 1960/115 and the downstream borehole with hydrological number 1997/047, in 2017 and 2018, were used to estimate an average depth of 2.32 m, and consequently, the control area covers 0.61 km
2. With a porosity of 30% (0.3), as per the literature for gravel [
41], the volume of water in the control volume can be calculated using Equation (3),
The following values of dissolved chloride concentrations as well as water volumes are taken into account in order to estimate the water mass balance and the chloride mass balance (see
Figures S10 and S11 in the Supporting Information). The average chloride value in the recharge ponds is estimated to be equal to 32 mg/L Cl, and the volume of tertiary treated wastewater is equal to 0.95 Mm
3, which is recharged into the aquifer through the recharge ponds. Concerning the pumping wells, only two (wells names 1985/076, 1983/153) of the five had more reliable data, and these have been used to estimate the average chloride value of 132 mg/L. However, the total water volume pumped from all five boreholes was 1.3 Mm
3 for the year 2018. Regarding the precipitation water, the average chloride value has been taken as 30.09 mg/L [
42] and the volume of precipitation water falling directly on the MAR system is estimated to be 0.25 Mm
3. The mean precipitation value is 413 mm/yr, that is, 80% subject to evapotranspiration (330.4 mm/yr). There are lateral inflows into the MAR system from the aquifer; however, their estimation is out of the scope of the current work.
Resulting from the above estimations, the mass Cl in tons for the recharge, pumping, and precipitation components of the chloride mass balance is estimated as equal to 220.4 tn, −171.6 tn, and 7.5 tn, respectively.
The mass of Cl (chlorides) in tons (Qout × Cout) that annually exits the control volume, when considering its Cl concentration as equal to the average concentration of pumping water (132 mg/L), is 55.4 tn Cl.
Since the chloride mass from lateral inflow and the inflow/outflow from/to the sea cannot be calculated directly, it is estimated indirectly as the remaining chloride mass difference, and has been found to be approximately −0.9 tn (see
Figure S11 in the Supporting Information). Considering the small size of the control volume, we can accept the small quantity of the lateral inflows. Consequently, the Cl mass balance indicates that considerable amounts of Cl (55.4 tn Cl) exit the control volume.
3.3. Eutrophication Parameters
All values of NH
4 exceeded the highest acceptable value of 0.5 mg/L in the upstream borehole 1998/068. In addition, the upstream borehole 1960/115 has a maximum value, which is also above the limit of 0.5 mg/L due to intensive farming in the region and the excessive use of fertilizers and manure by farmers (see
Table S3 in the Supporting Information). Cypriot farmers use mostly manure to fertilize crops, and often store manure in inappropriate facilities, resulting in the spreading of biological and chemical pollutants [
43]. Also, the small crop farms and medium-sized livestock farms, managed by low-educated elderly farmers, might exhibit unsustainable agricultural practices, suggesting they might hold the view that the use of organic fertilizers is excessive, being a common practice but irrational [
44].
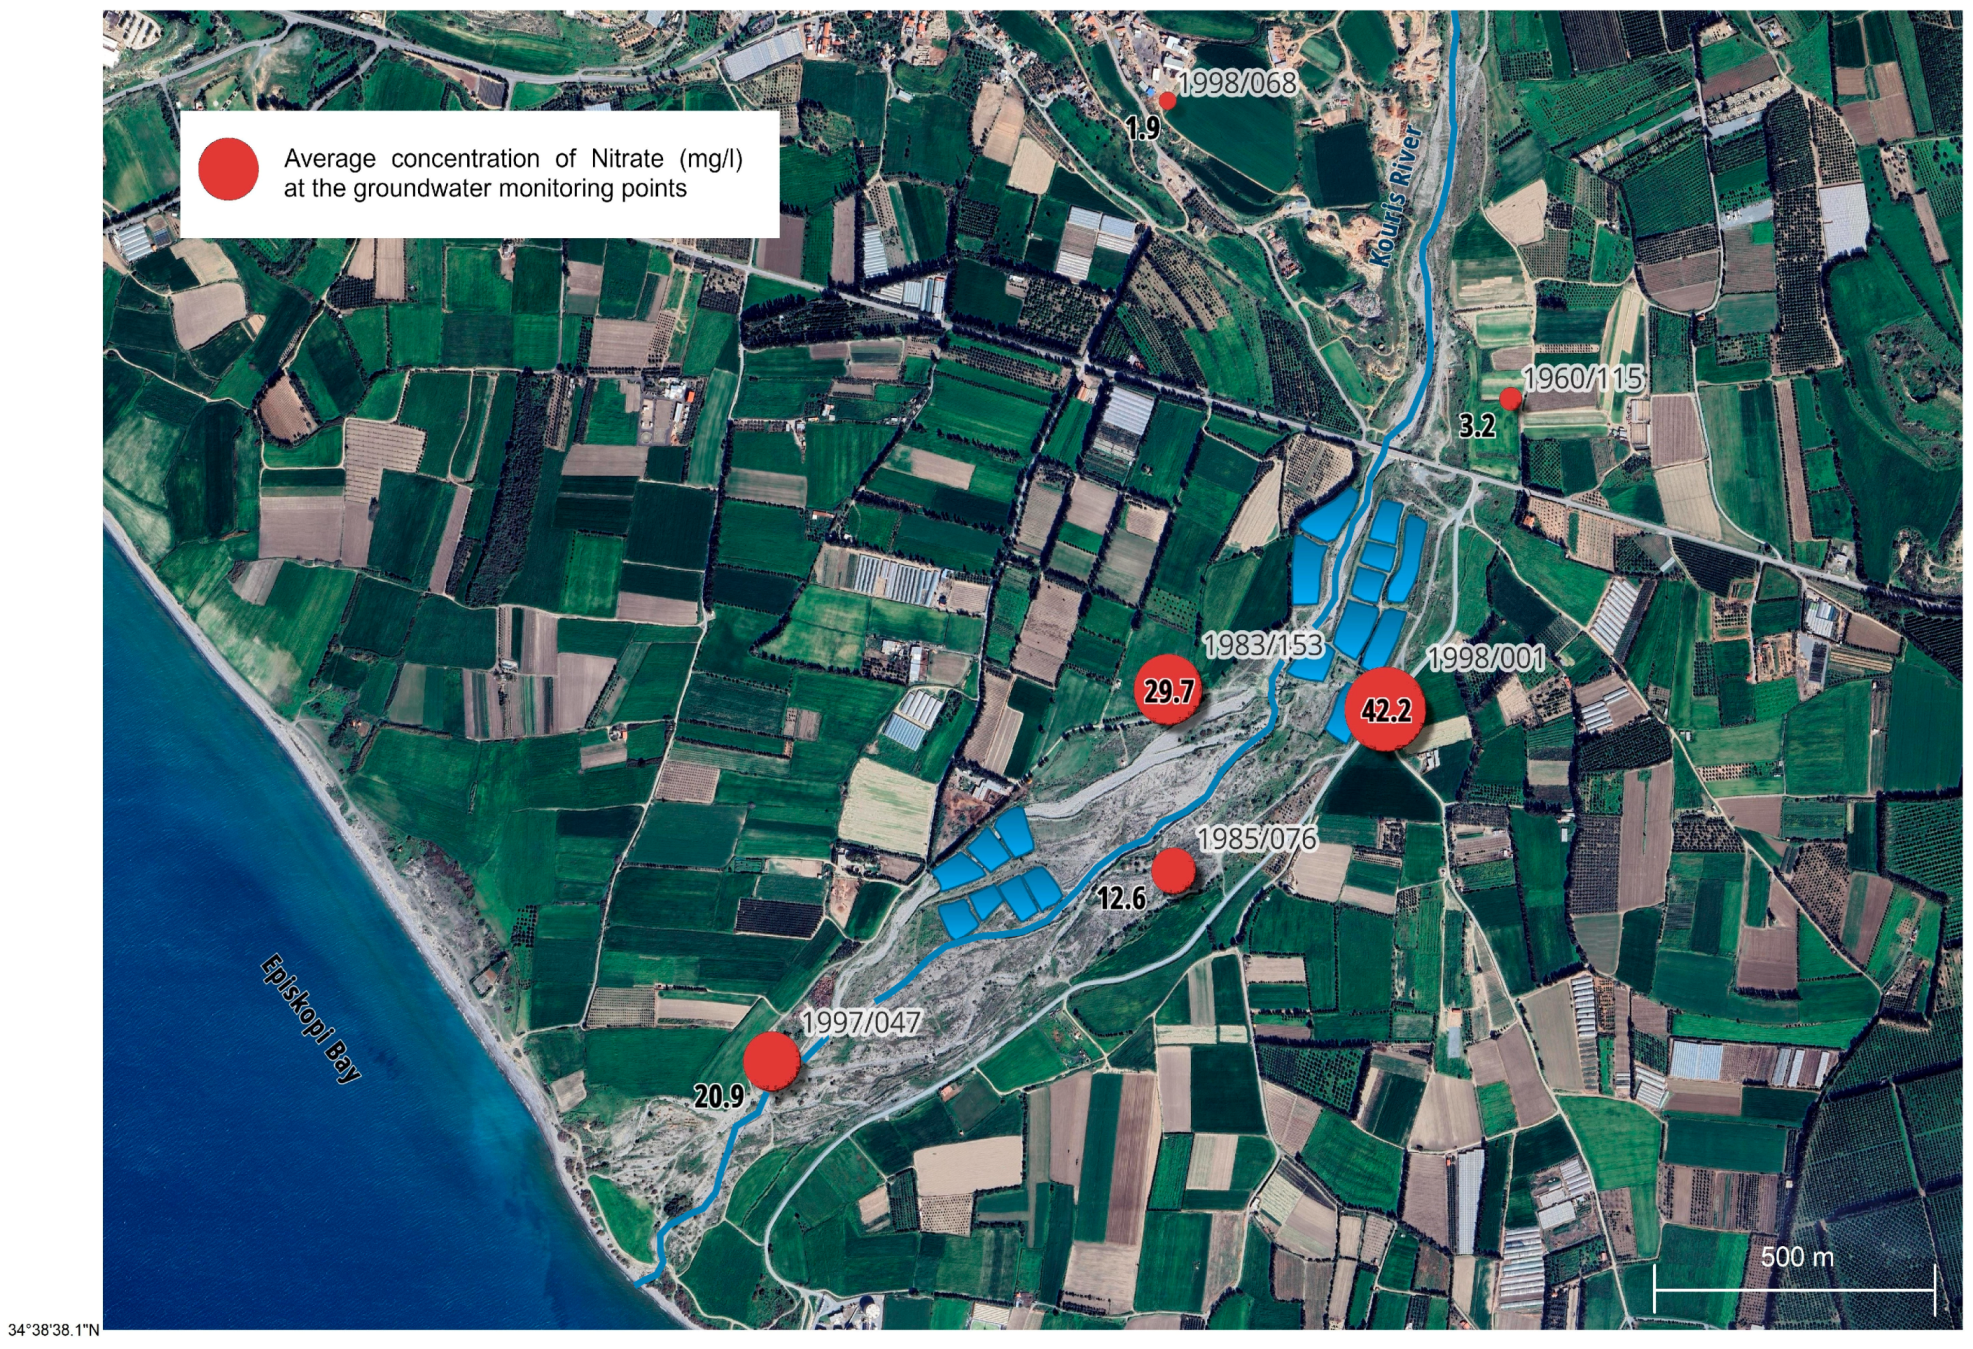
The TN concentration sometimes exceeded the allowed value of 15 mg/L in the tertiary treated wastewater of the SBLA. Thereafter, the water with high TN values infiltrates through the unsaturated zone, reacts with oxygen, and generates nitrate, which then leads to increased values in the aquifer that are higher than the NO
3 values of the recharge pond. Additionally, increased values of NO
3 and TN have been detected at the nearest borehole (1998/001), which are above the limits but also higher than the values in the water of the recharge pond and the most downstream groundwater monitoring points. These values are related to the position of monitoring point 1998/001, which is the borehole closest to the recharge pond and close to the fertilized crops (see
Figure 7 and
Figure S12 in the Supporting Information). Additionally, most of the downstream monitoring points have crops nearby, and due to the uncontrolled use of fertilizers by farmers and the direct use of tertiary treated wastewater to irrigate the crops, these monitoring points also show increased nitrate values in the aquifer (see
Table S3 in the Supporting Information).
In addition to tertiary treated wastewater, nitrogen can be found in many different organic and inorganic forms in our environment (air, soil, etc.). Nitrates in the soil are the form of nitrogen that is most used by plants for proper growth and development, but can also be generated by nitrogen fertilizers and manure. Nitrate is a form of nitrogen that can enter groundwater because it does not attach to soil particles such as ammonium, but is easily moved by water and is highly soluble [
16]. In cases where nitrate levels exceed the capacity for plant uptake, the surplus nitrate moves with irrigation water and percolates through the soil to the underlying aquifers [
45]. Rivers typically exhibit low nitrate concentrations; consequently, low concentrations of nitrates are found in the groundwater, which directly recharge from these rivers [
46]. Some aquifers contain organic material that breaks down or decays over time, consuming all the available oxygen (reducing’ conditions). When nitrate is exposed, under such circumstances, oxygen is removed, and nitrate is converted to nitrogen gas through a process known as denitrification [
46]. It has been demonstrated that water quality can be enhanced during infiltration for managed recharge, even in cases of rapid infiltration, through the introduction of carbon-rich soil amendments [
47]. Furthermore, nitrification occurs during the drying phases, while a combination of denitrification and dissimilatory nitrate reduction to ammonium (DNRA) occurs during wetting phases [
48].
When nitrate-nitrogen is converted to ammonium, it persists within the system as ammonium or subsequently undergoes nitrification and is converted back into nitrate. Experimental findings indicate that certain ionic nitrogen masses may be removed through nitrification during drying periods and denitrification during wetting periods. Additionally, their duration determines how much nitrogen mass is conserved in the MAR system [
48].
Recent research has proposed that certain microorganisms possess the ability to engage in nitrate-reducing processes, with the ultimate outcome being primarily governed by environmental conditions rather than the specific microbial species involved. A consensus among most researchers is that higher carbon-to-nitrogen (C:N) ratios tend to favor nitrate reduction. In certain soil types, a significant portion of nitrogen is present in a mineralizable form and is accessible to soil microbes for its conversion into ammonium [
49,
50]. Soils that were amended with a carbon source increased the quantity and pace of denitrification across flow rates [
51]. In certain MAR applications, nitrate remains in recharge water [
9], whereas in others, the addition of a reactive, organic-rich surface layer has proven effective in mitigating nitrate levels [
48,
52].
To reduce nitrates in the aquifer, recharge ponds must be managed more correctly (with proper cleaning), and the recharge water must always adhere to the quality characteristics determined by the discharge permit for the SBLA in cases where the water enriches the Akrotiri aquifer.
3.4. Toxic Metals
Heavy metals are among the most serious environmental contaminants. In contrast to organic toxic substances, heavy metals and their compounds are not degraded, but remain or accumulate in the environment for a long time. The area of the Akrotiri Aquifer faces no serious pollution problems with metals. The committee that is responsible for the implementation in Cyprus of Directives 2006/118/EC and 2014/80/EE of the European Parliament on the protection of groundwater against pollution and deterioration has set the highest acceptable values for elements in the Akrotiri Aquifer (CY9).
The metals in tertiary treated wastewater from water treatment plants may have several origins. They originate from products that are consumed by the population, industrial discharge, and the corrosion of materials within water distribution and treatment systems [
53]. The recharge water in the recharge pond had lower concentrations of metals (As, Cd, Pb, Hg, Ni, Cu, and Cr) than the recharge water from the Limassol water treatment plant from 2016 to 2020 (see
Table S4 in the Supporting Information). Worldwide, it is sometimes observed that the concentrations of these metals are greater in the recharge water of recharge ponds than in the tertiary treated wastewater from treatment plants due to the absorption, accumulation, and prevailing conditions of recharge ponds (eutrophication, clogging), which results in the degradation of water quality and an increase in metal concentrations [
54,
55,
56]. In the Akrotiri Area, although the conditions of the recharge ponds are not the best since there are eutrophication and clogging phenomena, the average and absolute values of the metal concentrations are lower compared to those of the tertiary treated wastewater of the SBLA for the years 2016–2020. The average maximum and minimum values of the metals As, Cd, and Hg in the surface water of the recharge pond (rp_9-6-9_A2a) were below the limit of quantification (LOQ) and equal to the highest acceptable values of the waste disposal permit of SBLA (Cd and Hg). At this point, it should be mentioned that higher acceptable values must be determined for arsenic (As) in waste disposal permits for the tertiary treated wastewater to have a more accurate correlation with the results for the aquifer. Some values of Cu and Pb, but mostly for Ni and Cr, were lower compared to those of the tertiary treated wastewater and the acceptable values of the waste disposal permit of the SBLA (see
Table S4 in the Supporting Information). The observed lower concentrations are likely due to the overflow of the dams during the wet years 2019 and 2020, which resulted in higher water volumes being transported from the dams via a pipeline, and discharged into the recharge ponds in the delta region (1.35 Mm
3 of water from the Polemidia dam, and 0.34 Mm
3 of water from the Germasogeia dam). Additionally, both the high precipitation volumes and Kouris dam overflow in the area brought in substantial amounts of fresh water, which may ultimately have caused the metals in the groundwater to become diluted and initiated other geochemical processes. The influx of recharge water, which is rich in nutrients and organic substances, initiates the formation of novel redox conditions within the system [
53,
57,
58]. The competition among metals (namely, As, Cd, Pb, Hg, Ni, Cu, and Cr) hinges on both the metal ions and the characteristics of the oxide surface [
59].
As a result of the geochemical processes occurring along the recharge flow path, a decrease in the concentration of most of the metals in the aquifer was observed [
8]. The flow of water from an infiltration pond in the aquifer involves soil aquifer treatment (SAT), which effectively eliminates a broad spectrum of heavy metals and toxic elements through chemical precipitation and adsorption [
8]. The concentrations of most of the metals decreased at all downstream groundwater points (1985/076, 1997/047, and 1983/153), except for borehole 1998/001 for the metals Ni and Cu, probably due to the specific geological conditions of this borehole, the impact of agricultural effluents, and its location (closest borehole to the rp_9-6-9_A2a recharge pond). The upstream groundwater points (1960/115, 1998/068) had similar values of Ni and Cu to those of the boreholes downstream, and during recharge, most of these metals increased but not significantly, which shows that these metals may be of geogenic origin and are hardly affected by recharge. In some isolated cases, an increase in metal value is observed, mainly due to the combined effect of fertilizers used for agricultural purposes and the tertiary treated wastewater used directly on the land for irrigation. Cr is an exception because it was detected in the upstream boreholes (1998/068, 1960/115) and increased significantly at all downstream groundwater monitoring points during recharge, which shows that recharging in combination with the geology of the area and agriculture significantly increased the Cr concentration. The average, maximum, and minimum values of As, Cd, Pb, and Hg are below the LOQ of the analytical method, and are also below the highest acceptable values for all the groundwater sampling points (boreholes). There is an exception for As in borehole 1997/047, where the values were higher, probably due to seawater intrusion or other geogenic reasons (see
Table S4 in the Supporting Information).
Although in some cases there was an increasing trend, no exceedances were observed in the groundwater based on the higher acceptable values set for the Akrotiri Aquifer or in the surface water of the recharge pond based on the discharge permit limit of the SBLA. However, if the values were assessed based on more stringent standards, such as drinking water limits, there would occasionally be exceedances.
3.5. Pharmaceutical Substances
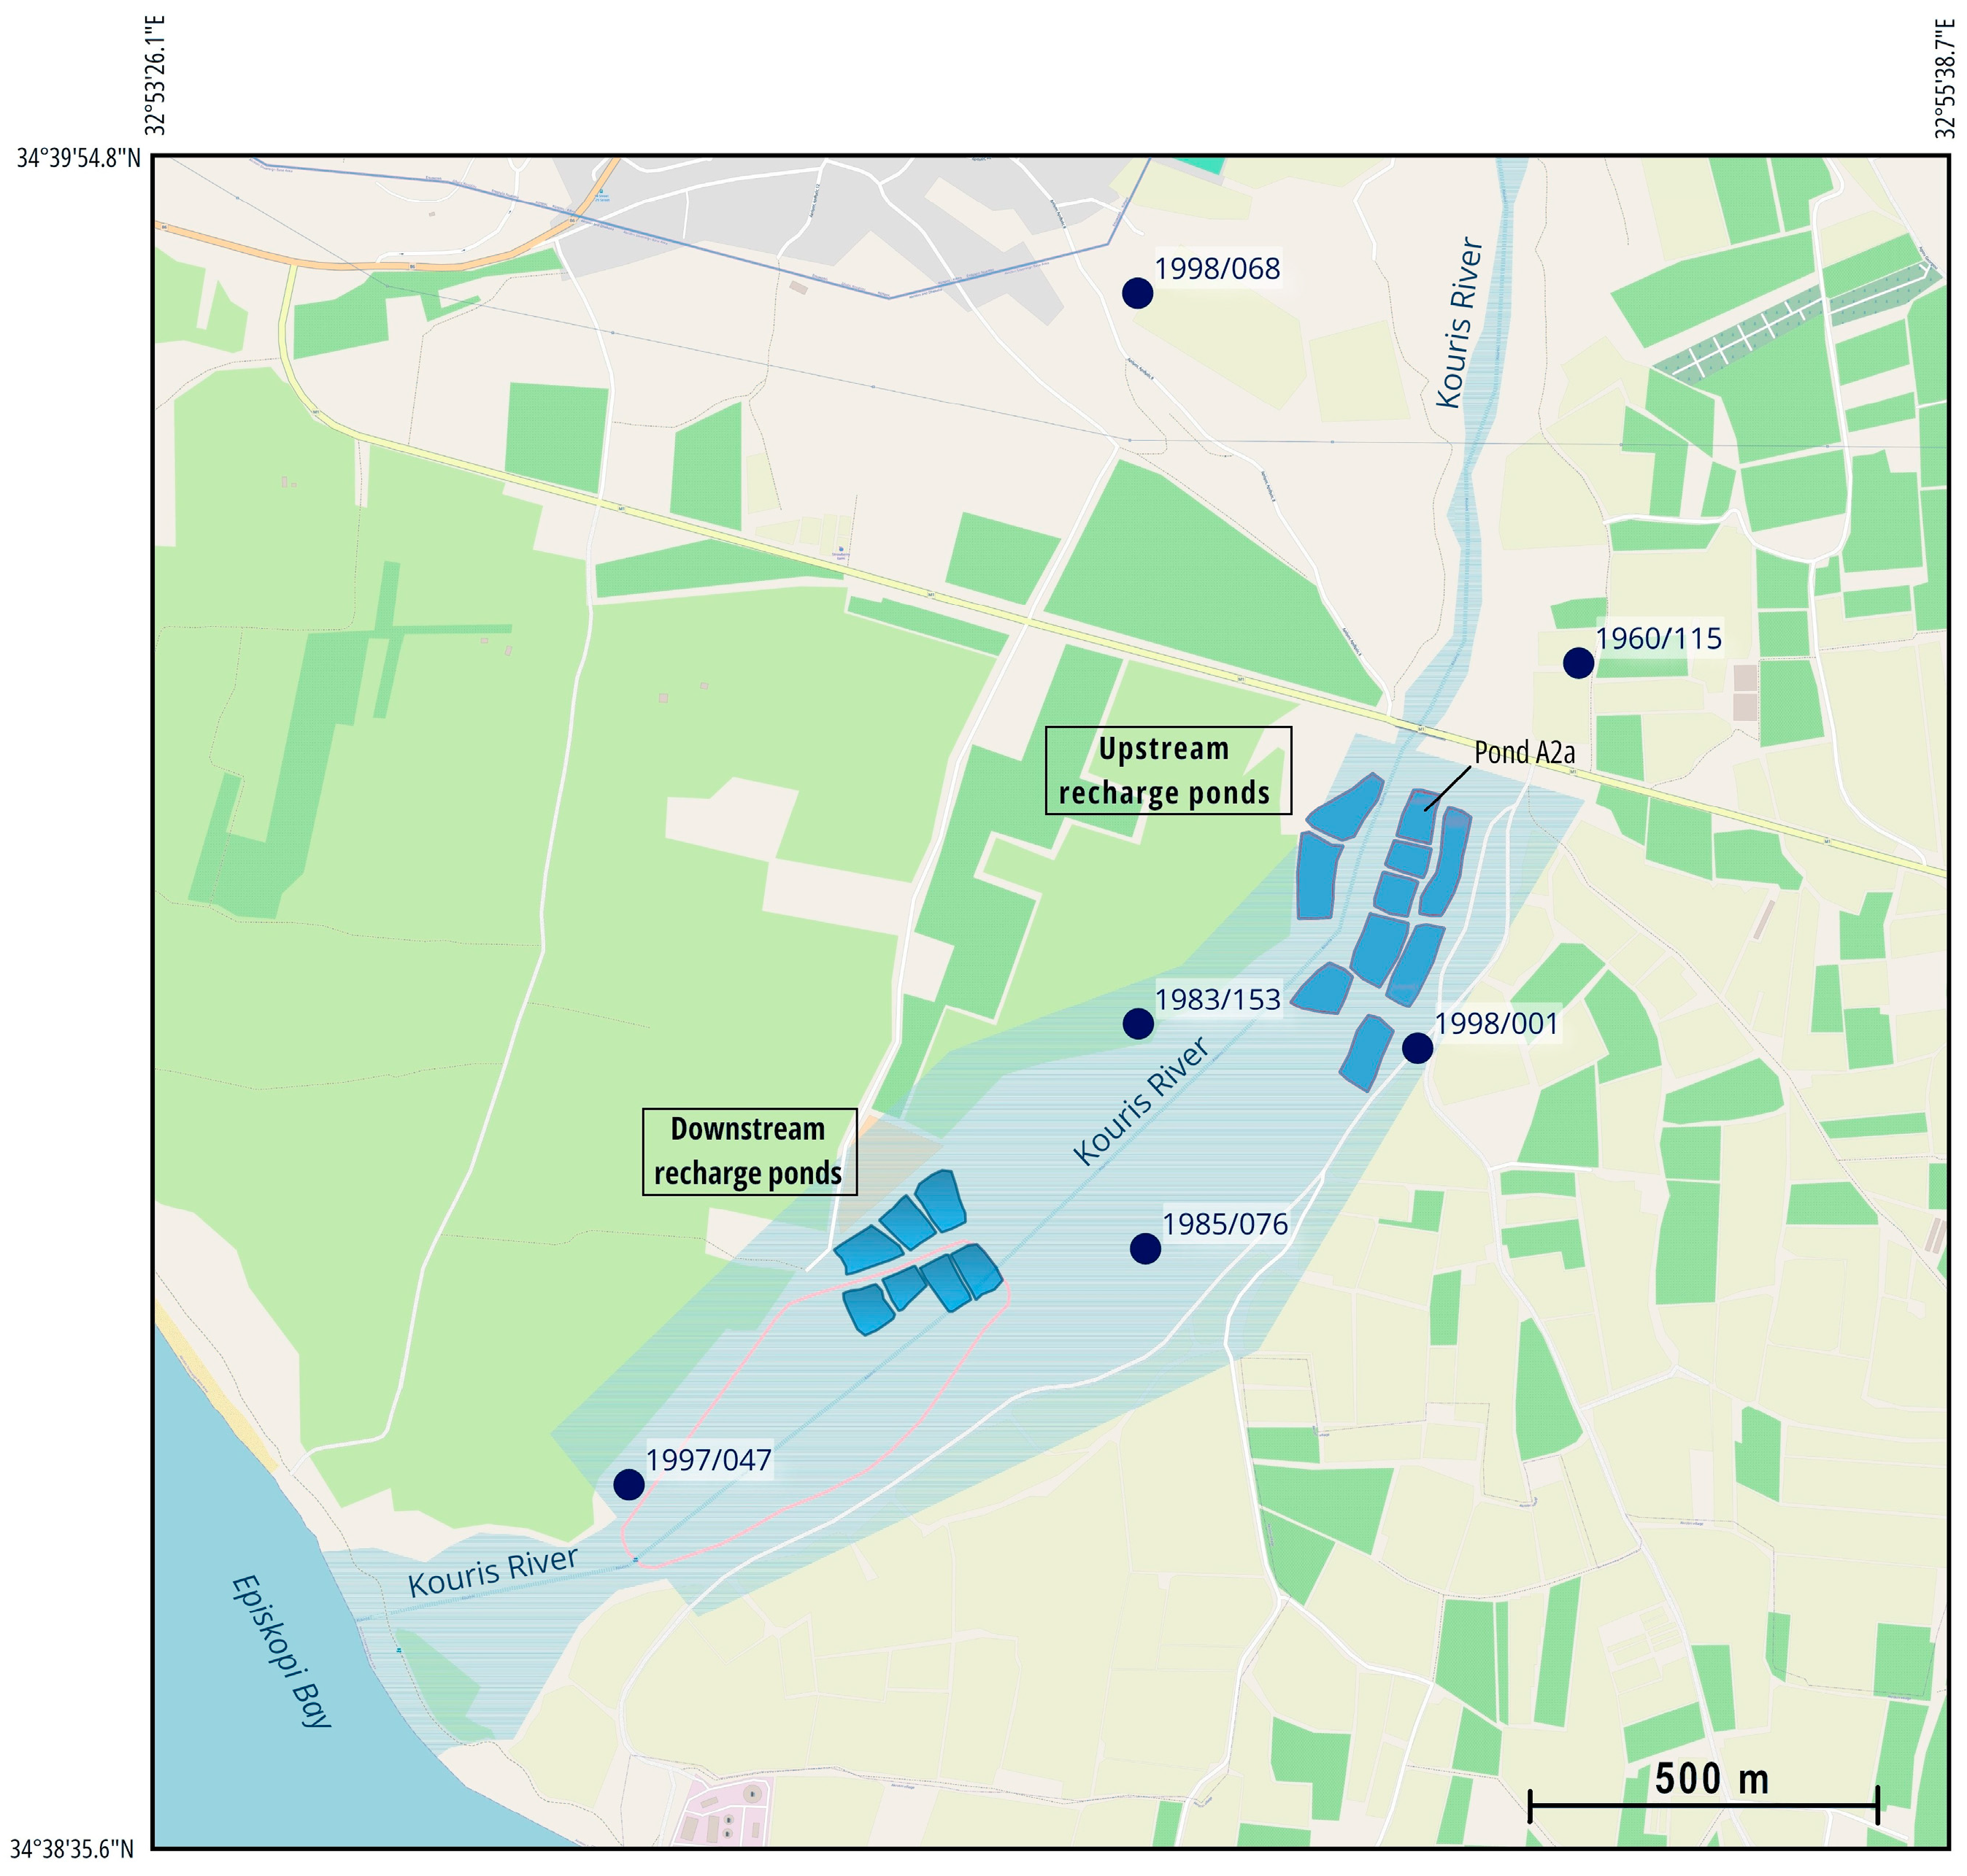
The dataset includes 20 pharmaceutical substances that have been monitored at six monitoring points in the Akrotiri aquifer from 2018 onwards. Four samples were taken per year, one (1) before recharge, two (2) during recharge, and one (1) after recharge. At the beginning of the project (2016 and 2017), pharmaceutical substances were only monitored at three points,—1983/153, 1997/047, and rp_9-6-9_A2a. In rp_9-6-9_A2a, which is the recharge pond, only a few pharmaceutical substances were detected between 2017 and November 2020—sulfamethoxazole, ofloxacin, acetaminophen, carbamazepine, bezafibrate, diclofenac, and metoprolol were above the LOQ (see
Table S5 in the Supporting Information). The existence of micropollutants, such as pharmaceuticals, in both treated wastewater and the surface waters into which they flow must be acknowledged. Specifically, there is a substantial likelihood that native groundwater will be contaminated by direct MAR techniques that use such water sources. Consequently, extensive pretreatment or prolonged retention times within the aquifer may be necessary before recovery. Indirect MAR techniques demonstrate that natural attenuation processes can markedly enhance water quality, although the ability to retain pollutants varies significantly based on the hydraulic and geochemical characteristics unique to each site. However, the ability to retain pollutants varies significantly based on the hydraulic and geochemical characteristics unique to each site [
60].
At five groundwater monitoring points, carbamazepine, trimethoprim, and ofloxacin were detected; one upstream (1998/068) and four downstream (1983/153, 1997/047, 1998/001, 1985/076) from the recharge ponds (see
Table S5 in the Supporting Information). Ofloxacin was the pharmaceutical substance that showed the greatest increase in abundance in recharge pond rp_9-6-9_A2a due to the persistence of this substance in wastewater treatment plants (four times in 2019 and once in 2020). The infiltration of recharge water through the unsaturated zone of the recharge pond in the aquifer reduces the values of Ofloxacin at the groundwater monitoring points. Specifically, the infiltration of surface water into groundwater systems and water passage through aquifer media causes improvements in water quality through a set of processes, including sorption, redox processes, and biodegradation [
61]. The removal of pharmaceutical substances from an aquifer depends on the hydraulic and geochemical factors at each specific site, the depth of the unsaturated zone, the chemical composition of the recharge water, the travel time of the surface water in the aquifer, and the removal rates of the pharmaceutical substances. The removal rates depend on the location of the sampling point (distance and travel time), but are also different for specific parameters. For example, increased values of bezafibrate, diclofenac, metoprolol, and sulfamethoxazole were detected in some periods in the recharge water of the recharge pond, but not at the upstream and downstream groundwater monitoring points of the aquifer (see
Table S5 in the Supporting Information).
The pharmaceutical substances Atenolol, Azithromycin, Clarithromycin, Ei, EE2, Erythromycin, Famotidine, Ibuprofen, and Propanol were below the limit of detection (LOD) and the LOQ in the recharge water of the recharge pond for all years (see
Table S5 in the Supporting Information). Therefore, the results in the table for those substances are half of the LOQ given by the method according to Directive 2009/90/EU. On the other hand, some other pharmaceutical substances, such as carbamazepine, were detected at higher concentrations at some groundwater monitoring points in the aquifer (1998/001, 1983/153) than in the surface water of the recharge pond, probably because the conditions in the aquifer help to conserve the concentrations of those specific substances. Carbamazepine (CBZ) is an antiepileptic medication that persists within wastewater treatment facilities and the surrounding environment. It has been detected in plants after irrigation with treated wastewater [
62]. The Akrotiri Aquifer area has intense agricultural activity, and farmers use tertiary treated wastewater to irrigate their plants, mostly during the summer, which increases the value of carbamazepine at these specific monitoring points.
The pharmaceutical substances E2, trimethoprim, and ciprofloxacin were detected at higher concentrations at some monitoring groundwater points during some periods than in the recharge water of the recharge pond (see
Table S5 in the Supporting Information). Like many pharmaceutical substances, trimethoprim enters the environment through various pathways, including human excretion into wastewater and the improper disposal of unused medications in toilets, sinks, or landfills. It can also be released through agricultural runoff [
63]. Trimethoprim was detected at all downstream groundwater monitoring points (1983/153, 1997/047, 1985/076, 1998/001) and one upstream groundwater monitoring point (1998/068) in June 2020. This probably originated from agricultural activities; irrigation with treated wastewater has led to the infiltration of trimethoprim.
E2 was detected at two downstream groundwater monitoring points (1998/001 and 1997/047) and one upstream monitoring point (1998/068) in 2018 and 2019, respectively. In the recharge pond, E2 was detected in 2019 (0.06 μg/L) at a value between the LOD and the LOQ. The contributions of recharge water and agricultural runoff increased the levels of this substance at the two downstream monitoring points, and agricultural runoff was the sole cause of the increase in this specific substance in the upstream borehole (1998/068). Ciprofloxacin was detected only at the downstream monitoring point 1998/001, mostly due to agricultural runoff. In 2018, the abundance of acetaminophen was greater in the aquifer (1997/047, 1998/001, and 1985/076) than in the recharge pond (rp_9-6-9_A2a) due to agricultural runoff. In 2019, acetaminophen was detected in the enrichment pond (rp_9-6-9_A2a). At most of the downstream groundwater monitoring points, this substance decreased due to the infiltration of water into the soil, and during the same period, at some other groundwater points (1985/076), it did not change (see
Table S5 in the Supporting Information).
3.6. Pesticides
The monitoring of pesticides in tertiary treated wastewater at the exit of a wastewater treatment plant started in 2019 and was performed only for selected pesticides. The monitored pesticides were chlorpyrifos, dieldrin, aldrin, naphthalene, and diuron. In 2019, only for the pesticides chlorpyrifos and naphthalene were the individual and mean values above or within the quantification limit of 0.005 μg/L. In 2020, the values were above the quantification limit except for those of chlorpyrifos, dieldrin, aldrin, and diuron in October. Dieldrin and aldrin were banned in Europe in 1981 and 1991, respectively, due to their toxicity to human health and the environment, but they are still being detected. Chlorpyrifos was banned in the EU in 2020 due to epidemiological evidence that this chemical harms brain development. Diuron approval in the EU expired in 2020, and naphthalene has been banned in the European Union since 2008 due to the danger it poses to human health and the environment [
64].
It is difficult to compare and evaluate the values for 2019 and 2020 because only a few (one or two) samples were taken in 2019. In one of two samples taken in 2019, we detected traces of imidacloprid, imazalil, boscalid, chlorpyrifos, and DDE-pp. DEET < 0.045 μg/L was between the LOD and the LOQ, and pyrimethanil 0.05 μg/L and climbazol 0.16 μg/L were above the LOQ. In addition, in the other sample, we detected traces of boscalid < 0.045 μg/L, which was between the LOD and the LOQ. In 2020, these pesticides were not detected. Climbazole was banned in the EU in 2014 due to concerns about its potential to disrupt the endocrine system, and the approval of imidacloprid in the EU expired at the end of 2020 [
64].
In the surface water of the recharge pond above the Akrotiri Aquifer, we detected the pesticide chlorpyrifos from 2016 to 2018, and traces of the pesticide diuron in 2016 and 2017. Simazine and diazinon were detected only in 2017, and iprodione was detected only in 2018. No pesticides were detected in 2019 or 2020 in water from the following dams: the Polemidia dam in 2019 and the Germasogeia and Kouris dams in 2020. The use of simazine in agriculture has been banned in the European Union since 2004 due to its potential endocrine-disrupting action, which can lead to reproductive disorders. Diazinon was banned in 2006 due to its ability to damage the nervous system, and the approval of iprodione in the EU expired in 2017 [
64].
Traces of the pesticide simazine were detected at downstream groundwater monitoring points—1983/153 in 2016, 2017, 2019, and 2020; 1985/076 in 2017, 2019 and 2020; and 1997/047 in 2018 and 2019. Traces of the pesticide diuron were detected only at downstream groundwater monitoring points 1998/001 and 1983/153 in 2017 and 2020, respectively, and the pesticide metribuzin was detected only at the upstream groundwater monitoring point 1998/068 in 2019. Traces of naphthalene were detected at 1998/068 in 2018 and 2020 and in the downstream groundwater monitoring point 1997/047 in 2016 and 2018. The concentrations of these pesticides at the groundwater monitoring points were below the limit of 0.1 μg/L, which is the maximum permissible value and is equal to the drinking water standard for pesticides and their metabolites per individual substance in groundwater, as indicated in the 2006/118/EC and 2014/80/ΕΕ groundwater directives.
The occurrence of simazine and naphthalene is probably more related to runoff from agricultural areas where pesticides are used and to the deposition of pesticides from the atmosphere, and less to tertiary treated wastewater, which recharges the aquifer. The detection of diazinon, iprodione, chlorpyrifos, and diuron was mostly related to the tertiary treated wastewater from the sewage treatment plant that recharged the aquifer through the ponds. The detection of the pesticide metribuzin is related to agricultural runoff.
3.7. Faecal Indicator Bacteria
E. coli and “total coliforms” indicate the degree of pollution and the sanitary quality of the water, respectively. This set of indicators is used as a quick scan, as a comprehensive test for all fecal indicator bacteria is usually too expensive [
65]. Total coliforms describe a group of bacteria commonly found in the environment (soil, vegetation, intestines of mammals, etc.). Their presence does not cause illness but indicates that the water supply may be vulnerable to contamination by more harmful microorganisms [
65].
Escherichia coli (
E. coli) is a member of the enterobacterial family [
66]. Fecal coliforms (a group of total coliforms), such as
E. coli, and other types of harmful bacteria are found in animal and human wastes, and when detected, they are indicators of water supply contamination [
67]. Enterococci thrive within the gastrointestinal tracts of both humans and animals as part of their normal flora [
68]. The detection of Enterococcus species in water and food products serves as an indicator of contamination originating from the fecal matter of both animal and human sources [
68,
69,
70,
71]. Additionally, enterococci do not multiply in water, and although sensitive to chlorination, they are more resistant than coliforms and most fecal indicator bacteria [
72,
73]. Analyses of
E. coli in tertiary treated wastewater of the SBLA showed that infrequent chlorination was insufficient—
E. coli was present at high levels at the outlet (see
Table S6 in the Supporting Information). The minimum and maximum values below the LOD and the LOQ (0.01 CFU/mL) of the method (ISO 9308-2: 2012) are shown in the table as <LOQ values. The table shows the maximum value above the high acceptable value of 5 MPN/100 mL in red. Specifically, in 2015 and 2016, all the samples were 100% within the specification. In 2017, 1 sample (2420 MPN/100 mL > 5 MPN/100 mL) out of 15 samples was out of the range of specification, resulting in 93% of the samples being within the specifications. In 2018, all the samples were below the LOD and LOQ of the method, except for one sample (3 MPN/100 mL), which was above the LOD and the LOQ of the method but below the highest acceptable value of 5 MPN/100 mL (3 MPN/100 mL < 5 MPN/100 mL), meaning 100% of the samples were within the specification. In 2019 and 2020, out of 17 and 12 samples analyzed, 2 (100 MPN/100 mL, 16 MPN/100 mL > 5 MPN/100 mL) and 5 (2400 MPN/100 mL, 2400 MPN/100 mL, 1200 MPN/100 mL, 34 MPN/100 mL, 17 MPN/100 mL > 5 MPN/100 mL), respectively, were above the highest acceptable value and thus out of specification, resulting in 88% and 58% of the samples being within the specifications.
Total coliforms and Enterococcus (/100 mL) should be added to the monitoring system for comparison with the parameters monitored in the aquifer. The somatic coliphages move to the groundwater, and this is dangerous for the environment and health, so tracking this virus in the monitoring sampling points is also recommended.
The monitoring of microbiological parameters in the recharge area of the Akrotiri Aquifer started in 2018, and the monitoring of them at the outlet of the pipe started in 2019. The values were low for all fecal indicator bacteria, but the water quality degraded even more in the recharge pond. The recharge of the aquifer with fresh water from the dams in 2019 and 2020 resulted in improved water quality. The water quality degraded (the concentrations of fecal indicator bacteria increased). The infiltration of water into the unsaturated zone and then into the aquifer leads to an improvement in the recharge water’s quality, mostly for the parameters Enterococcus and
Escherichia coli (/100 mL), due to the SAT (see
Tables S7 and S8 in the Supporting Information). At some locations in the aquifer, the total coliform content is shown higher due to other factors (e.g., recharge, soil type, irrigation activity). There were two cases of high enterococci levels (25 CFU/100 mL, 99 CFU/100 mL) for two different dates (31.01.2018, 08.05.2019) at the upstream monitoring point 1998/068. The location is near an animal farm and irrigated crop fields, which is most probably the reason for the high abundance of enterococci. Borehole 1998/001 had the highest values due to its location, which is the closest to the rp_9-6-9_A2a recharge pond (see
Table S7 in the Supporting Information).
The values of the parameter of E. coli in the recharge water coming from the outlet of the pipe that flows to the recharge pond were minimal (2019–2020), so we cannot form a reliable evaluation, but the results thus far show, on one hand, that the values of E. coli were reduced compared to the tertiary treated wastewater of the SBLA, and on the other hand that they were increased compared to the water in the recharge pond. On the dates on which the samples were taken during recharge, the water discharged to the aquifer was water from the dams, so for this reason, the water that flows from the outlet of the pipe had lower E. coli concentrations than the tertiary treated wastewater.
4. Discussion
MAR, which involves the use of tertiary treated wastewater, is widely recognized as a sustainable strategy for mitigating the impacts of climate change and ensuring long-term water security. The two MAR pilot projects in Cyprus represent the first steps toward broader implementation [
74]. The current study analyzes a significant dataset of qualitative and quantitative parameters that describe the Akrotiri MAR system. By estimating the pressures in the area, it aims to understand the water quality processes that are dominant in the MAR operation located in an alluvial coastal floodplain. The findings highlight the key parameters to prioritize when monitoring alluvial Mediterranean coastal aquifers affected by salinization and nitrate pollution. At the same time, in the same area, other researchers developed a groundwater model to evaluate the spatial and temporal impacts of MAR on the environment [
75]. This model was based on previous models created by Milnes (2011) and Papanikos (2018) using Feflow [
40,
41]. It also considers scenarios of future changes in the area, such as land use modifications, urban expansion, and climate variability. These research findings can be helpful in designing the future of the MAR system, and can be an integrated into the MAR management package.
It is important to note that, in many cases, the concentrations of various substances are significantly reduced in the aquifer compared to their levels in the recharge pond due to the soil aquifer treatment (SAT) process and other natural processes occurring in the unsaturated zone. However, in some instances, the opposite phenomenon has been observed, where substantial quantities of substances enter the aquifer and accumulate, even though they are subject to various chemical processes and transformations. For example, the chloride balance shows that a significant portion of chloride remains in the aquifer, increasing its groundwater concentration due to the operation of MAR.
A comparison of the quality of the water in the recharge pond with the quality of the water that flows from the pipe to the recharge pond revealed that the quality deteriorated in the recharge pond. This may occur due to physical clogging in the recharge pond, resulting in an increase in nutrients and the creation of eutrophic conditions (eutrophication). These blockages are due to physical, chemical, or biological factors, and can be adjusted by flood and drainage cycles, as well as by the mechanical removal of the layers when they form. In the case of biological agents, the increase in organic carbon and various environmental conditions, such as the temperature of the tertiary treated wastewater in the recharge pond, may lead to an increase in microbiological activity and the creation of redox conditions, and ultimately biodegradation into simpler substances through the action of bacteria and fungi, and the degradation of the water quality in the recharge pond [
76].
The overflow of recharge ponds during recharge generally results in a suboptimal operation of both the feeder pond and the recharge system, with the following effects: suboptimal pond operating depth, inability to clean the ponds, drying and excavation during operation, inability to control the filtration location, inability to use the ponds independently, inability of biodegradation mechanisms to operate inside the ponds, plant growth, and further reduction in permeability. In very few cases is the exact behaviour of the ponds known, even in those cases where recharge has already taken place. This is due to the lack of monitoring experience regarding some of the ponds, as well as the lack of an ability to monitor the filtration rates. The practice of overflows makes it more difficult to monitor [
40].
Due to the soil aquifer treatment of the recharge water through the unsaturated zone, the values for nitrates at some downstream monitoring points, but also for all the other parameters in Akrotiri MAR, decreased (see
Table S3 in the Supporting Information). The quantity of nitrates entering groundwater can be further reduced by improving farm management practices. One key practice is the timing of fertilizer application, which must coincide with the active growth phase of crops, reducing the amount of nitrate in the soil system and thus the amount that could be leached [
16].
Most of the pesticides that were detected in the surface water of the recharge pond from period to period ended up in the aquifer with reduced concentrations due to the SAT process, and others were detected in higher concentrations in groundwater or detected only in groundwater, mostly due to agricultural runoff (metribuzin) and the deposition of pesticides from the atmosphere.
Several investigations have documented the occurrence of diverse pharmaceuticals in treated wastewater [
77,
78], so these substances should be monitored directly in the SBLA station. The efficacy of wastewater treatment plants in removing pharmaceuticals and their metabolites varies based on the drug’s properties and the treatment techniques employed [
79,
80]. Additionally, the removal of pharmaceuticals does not equate to their destruction, as they may transform into active by-products [
78,
81]. Most pharmaceutical substances were here detected in higher concentrations in the recharge pond than in the groundwater. An exception was observed for some pharmaceutical substances, such as carbamazepine, which was detected at increased levels in groundwater, probably because the special geochemical conditions in the aquifer helped the transport and the accumulation of those substances. Generally, the mobility of pharmaceutical products can be reduced by using indirect injection methods because the presence of an unsaturated zone enhances the removal of these pollutants by biodegradation, adsorption, and other processes [
25,
53].
The effective management and treatment of pathogens, such as those found in wastewater discharge, residual waste treatment sludges, and septic tank effluents, are important for preventing groundwater contamination. Nevertheless, the detection of nonpoint sources of pathogen contamination is often difficult [
82]. Due to the serious difficulties met in accurately determining pathogen concentrations and the high analytical costs, regulations for the protection of public health demand only the periodic monitoring of microorganisms such as
E. coli, total or fecal coliform (FC), and Enterococcus [
70,
82]. Furthermore, investigations are needed to identify indicators that are representative of other pathogen sources, transport, and fate [
82,
83].
5. Conclusions
The MAR system in the Akrotiri Basin, Cyprus, operates in a fragile area that is negatively impacted by nitrification and salinization. Managed aquifer recharge in infiltration ponds has significantly improved specific water quality parameters, mostly in the very wet years when recharge was the highest. The concentrations of most water quality parameters, including NH
4, NO
2, TP, total coliforms, Enterococci, and
E. coli, decreased in the aquifer due to the SAT process. On the other hand, the conductivity, chloride, and nitrate levels increased (see
Table S8 in the Supporting Information). Unfortunately, since the MAR system began operation in 2016, no significant reversal of the saline intrusion phenomenon has been observed. This emphasizes the need to optimize recharge volumes and manage groundwater abstraction more effectively. Agriculture and livestock activities continue to exert considerable pressure on the aquifer.
Continuous, the high-frequency monitoring of groundwater levels and water quality parameters will help us to draw more accurate conclusions, to optimize recharge performance, and to ensure effective aquifer replenishment. The MAR systems are efficient but complex systems. The complexity of the MAR system requires integrated management and a thorough analysis of all influencing variables and factors to optimize its performance. Indirect methods of managed aquifer recharge through ponds, such as the MAR system of Akrotiri, have a SAT capability, and the water quality improves significantly as it moves through the soil. While MAR systems with SAT capability can significantly enhance water quality, their effectiveness relies on regular monitoring, proper maintenance, and adaptive management.
The pressures imposed by climate change on Mediterranean countries are expected to worsen challenges such as water scarcity and increased salinization. These effects will further strain the functioning of MAR systems and necessitate adaptive management strategies to ensure their effectiveness in sustaining water resources.
Recommendations
Increase recharge volumes of the MAR system in combination with a proper reduction in the groundwater abstraction in the area to maximize MAR effectiveness.
Control and drastically restrict the agriculture and animal husbandry pressure sources in the aquifer area through regulatory measures and sustainable land use practices.
Establish a maintenance and assessment protocol that includes the regular monitoring and cleaning of recharge ponds—particularly at the beginning and end of recharge phases—to enhance infiltration efficiency and prevent clogging, as well as the routine performance of infiltration tests to detect variations in infiltration rates and mitigate clogging phenomena.
Improve chlorination processes and monitor total coliforms and Enterococci levels in treated wastewater, and generally ensure that the quality of the tertiary treated wastewater used for groundwater recharge is always within the quality standards of the discharge permit.
Conduct the continuous monitoring of pesticides, heavy metals, somatic coliphages, and pharmaceuticals in the outflow of the pipeline that flows to the recharge pond and at all monitoring points, and install and utilize high-frequency groundwater level sensors to monitor groundwater levels. Recognize MAR as a complex system requiring the integrated analysis of hydraulic, chemical, and operational variables to optimize performance.
Adopt adaptive management approaches that account for climate-related pressures and enhance the MAR system’s resilience.


