


The Impact of Expanding Eucalyptus Plantations on the Hydrology of a Humid Highland Watershed in Ethiopia
 , ,
, , 
Abstract
1. Introduction
2. Materials and Methods
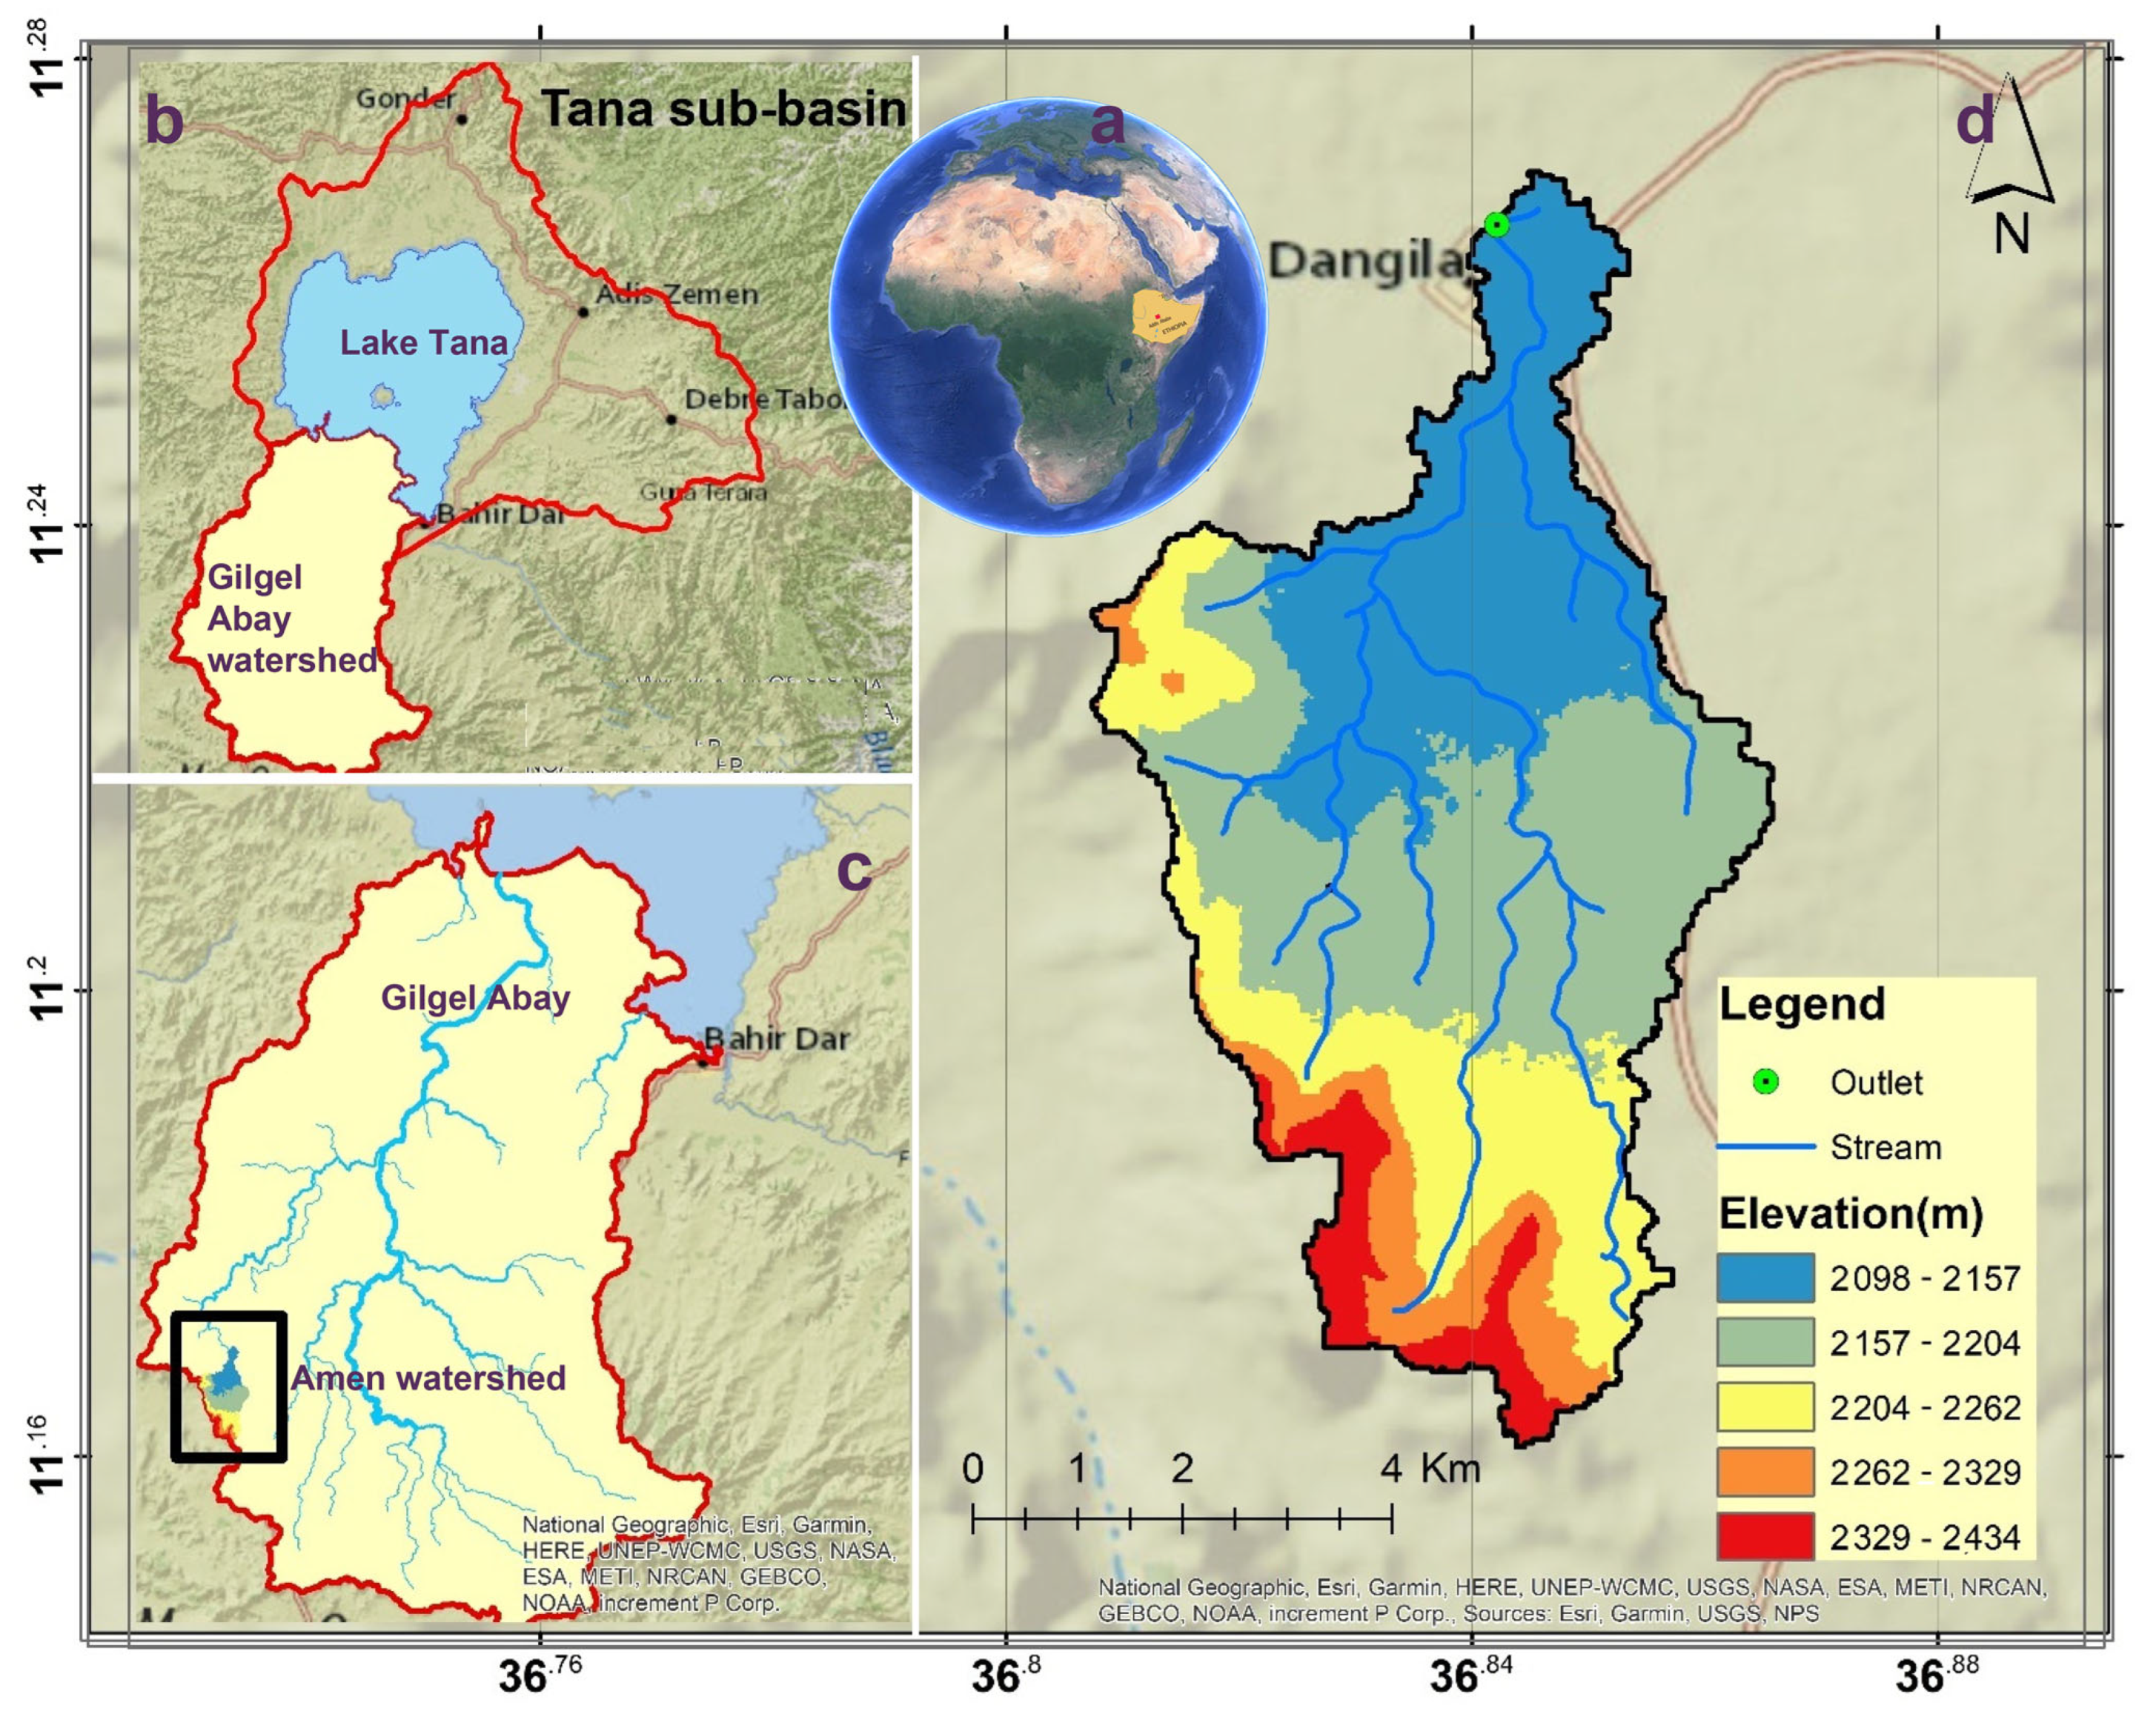
2.1. Description of the Amen Watershed
2.2. Remote Sensing
2.2.1. Land Cover Analysis
2.2.2. Accuracy Assessment
2.3. Hydro-Meteorology
2.3.1. Precipitation
2.3.2. Streamflow
2.3.3. Base Flow
2.3.4. Actual Evapotranspiration (AET)
3. Results
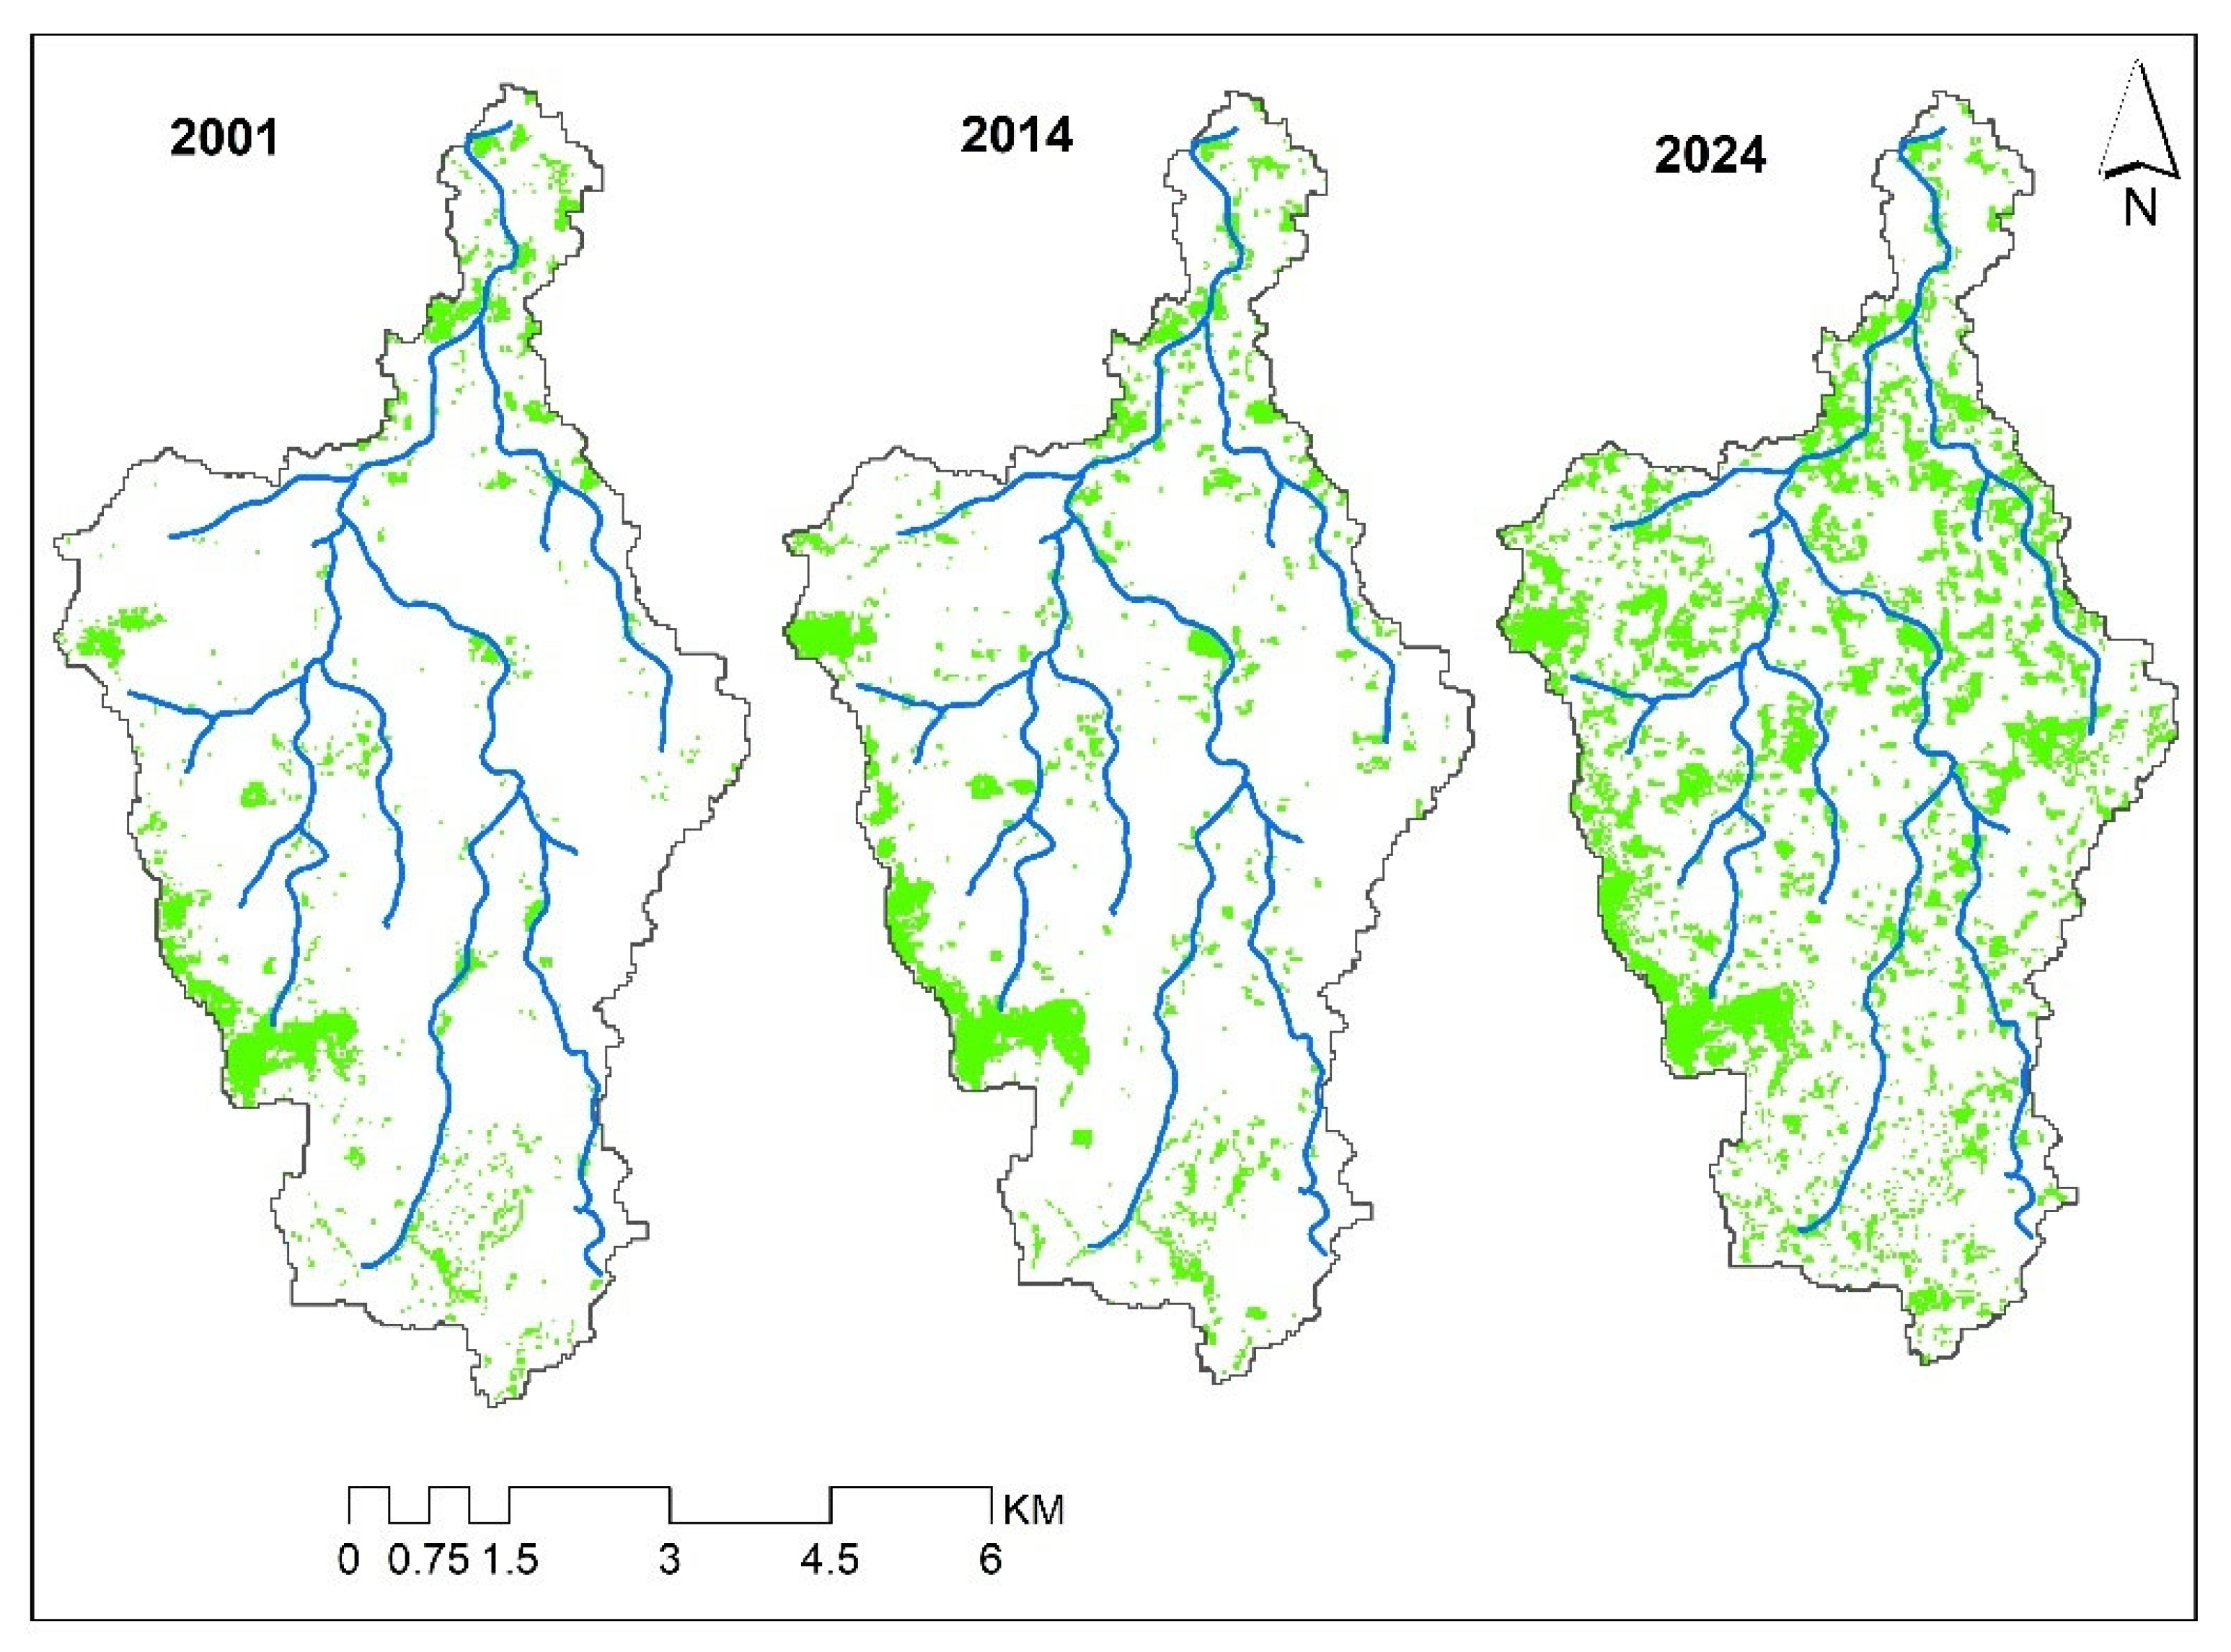
3.1. Land Use
3.2. Watershed Hydrology
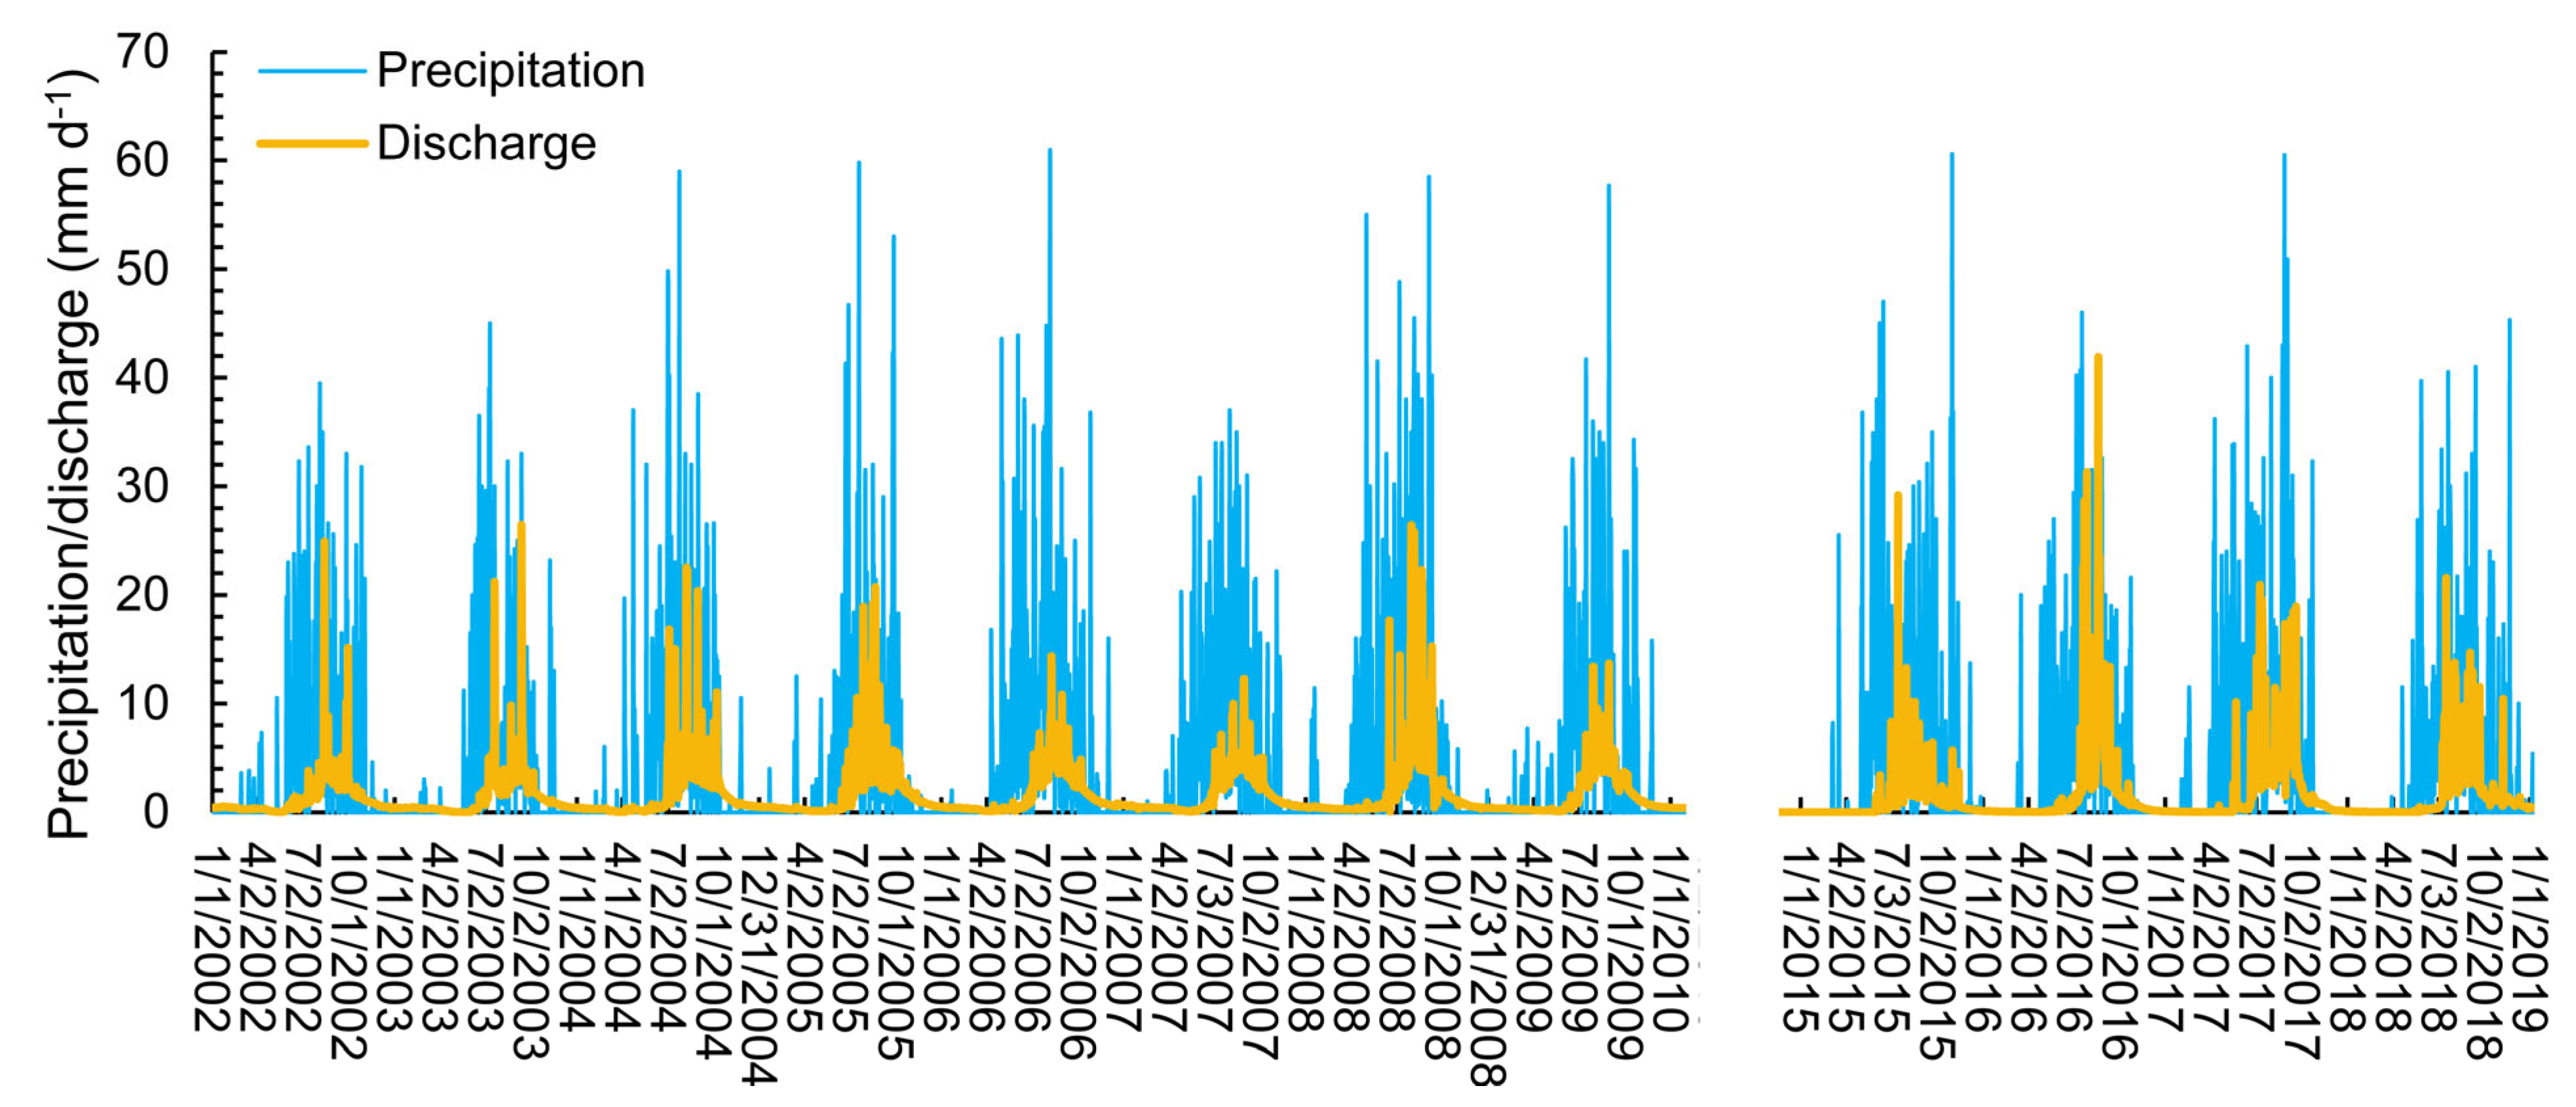
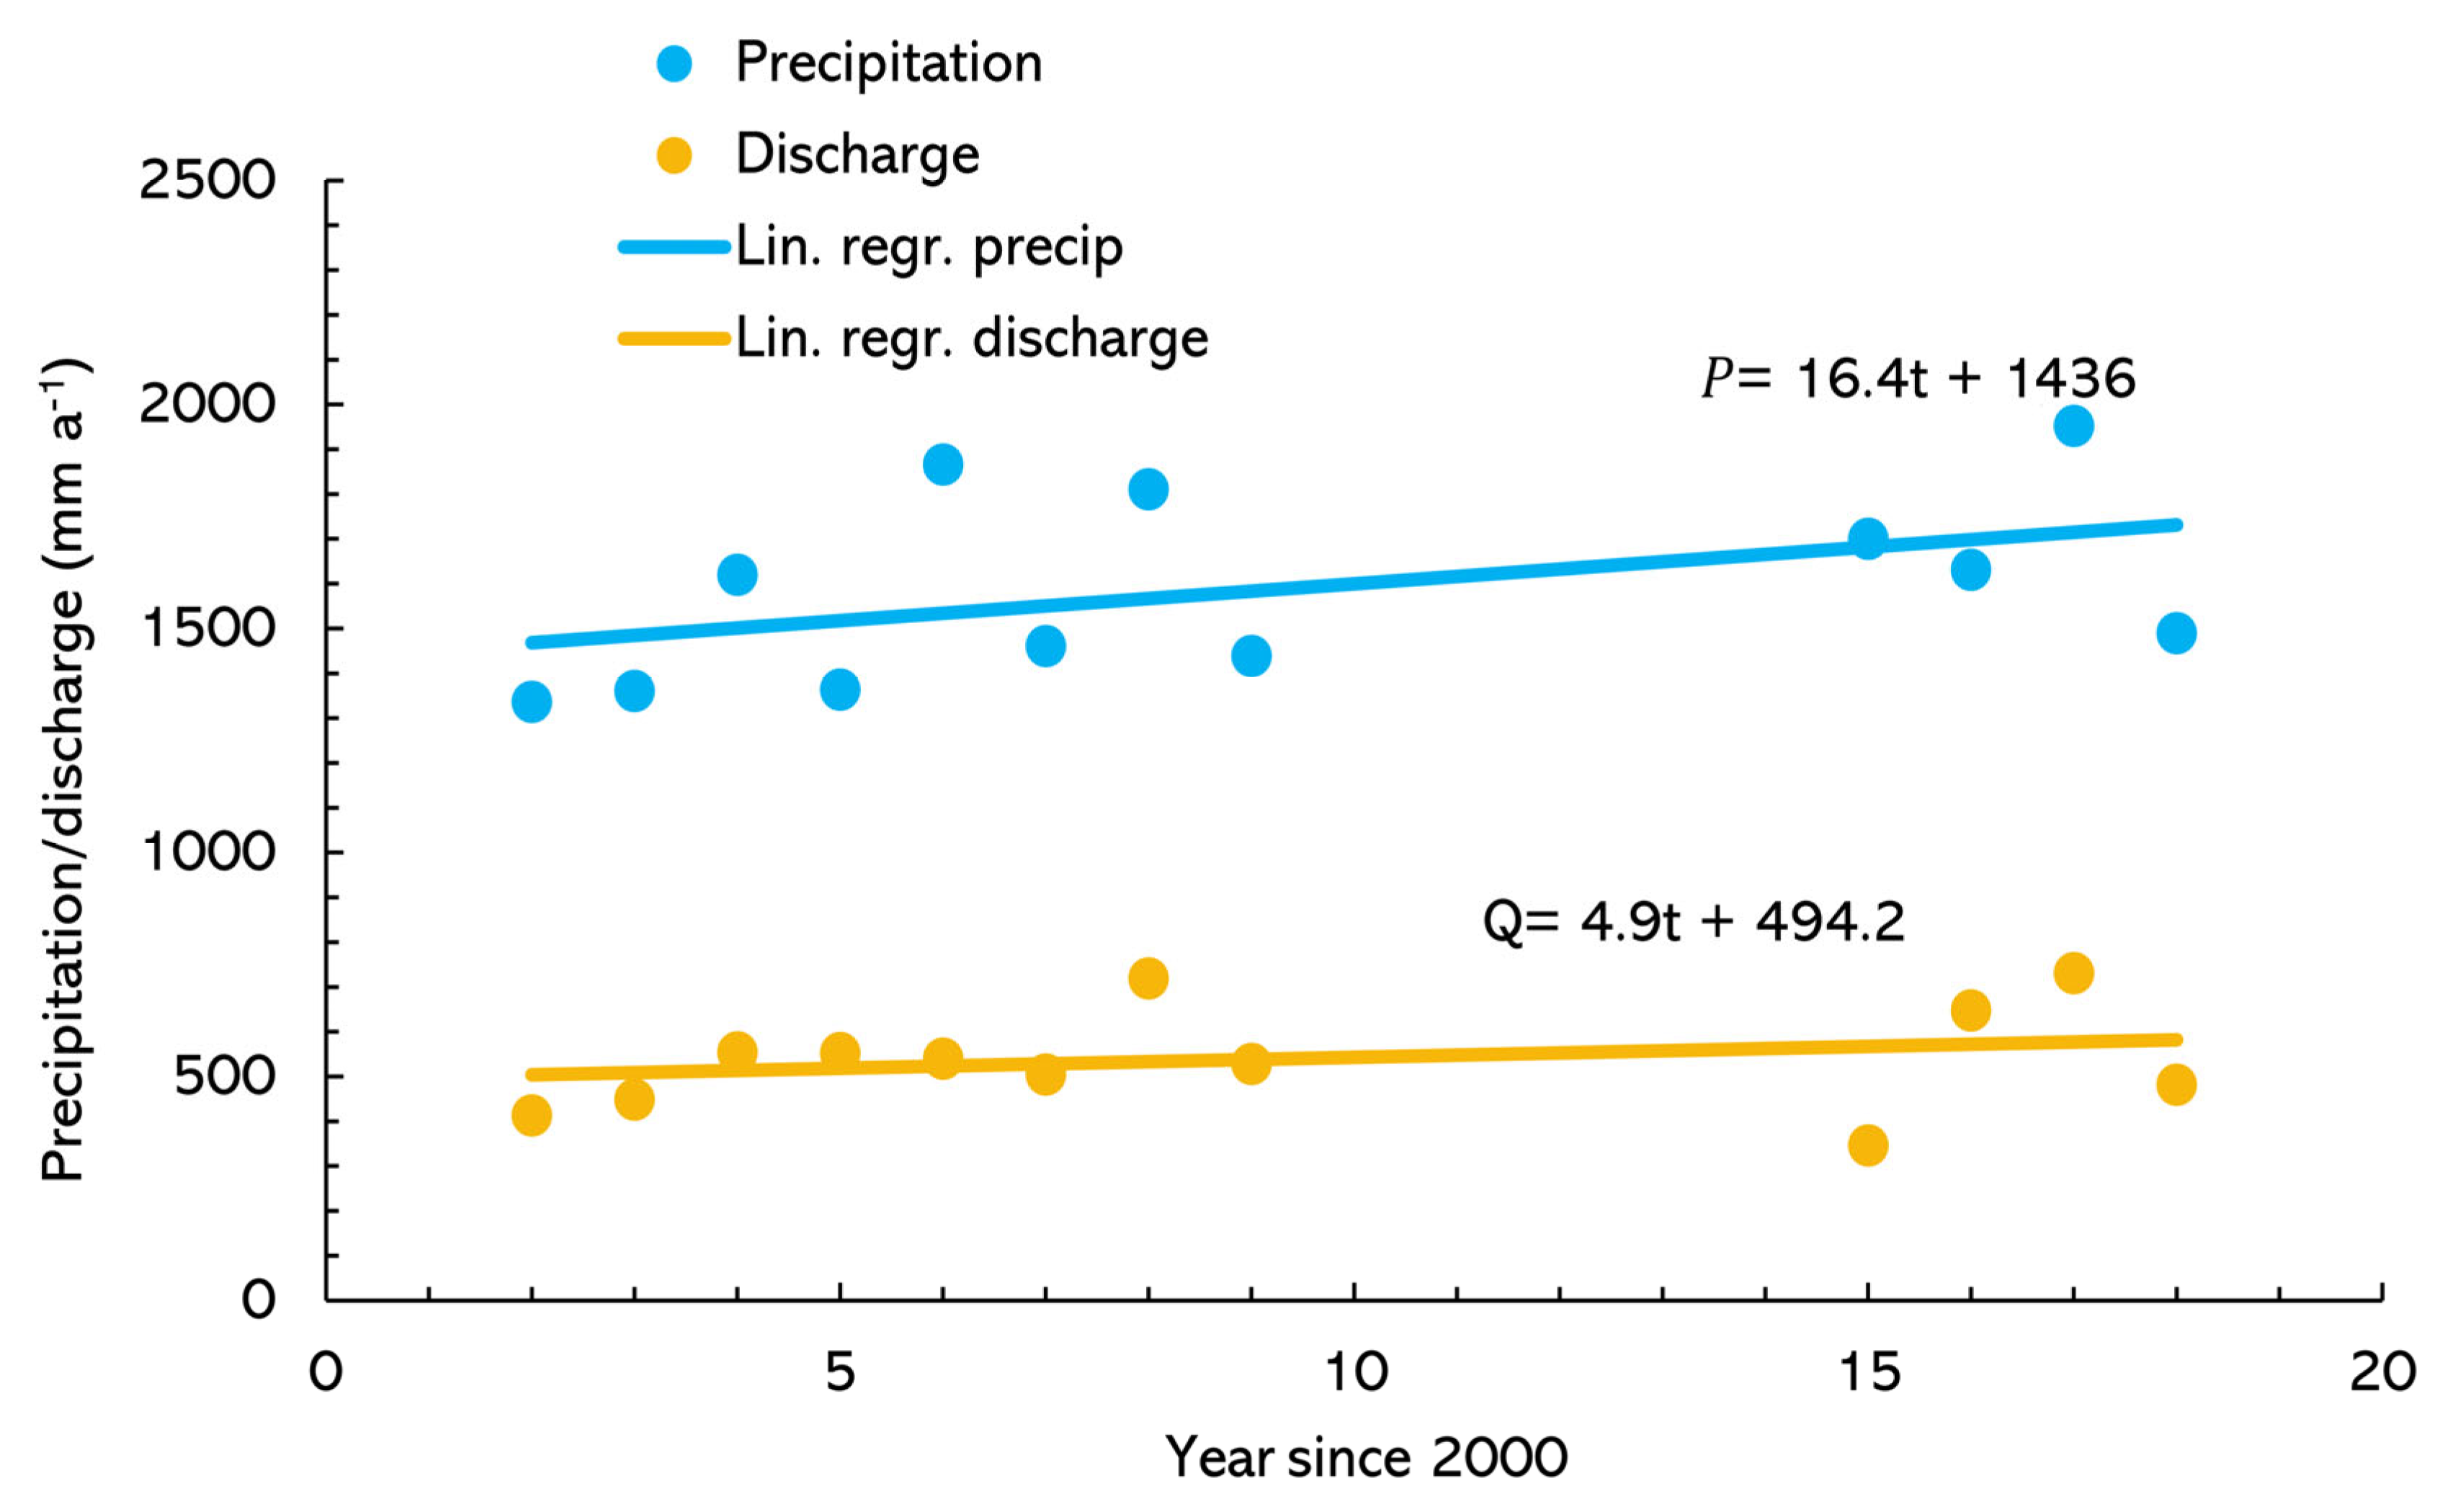
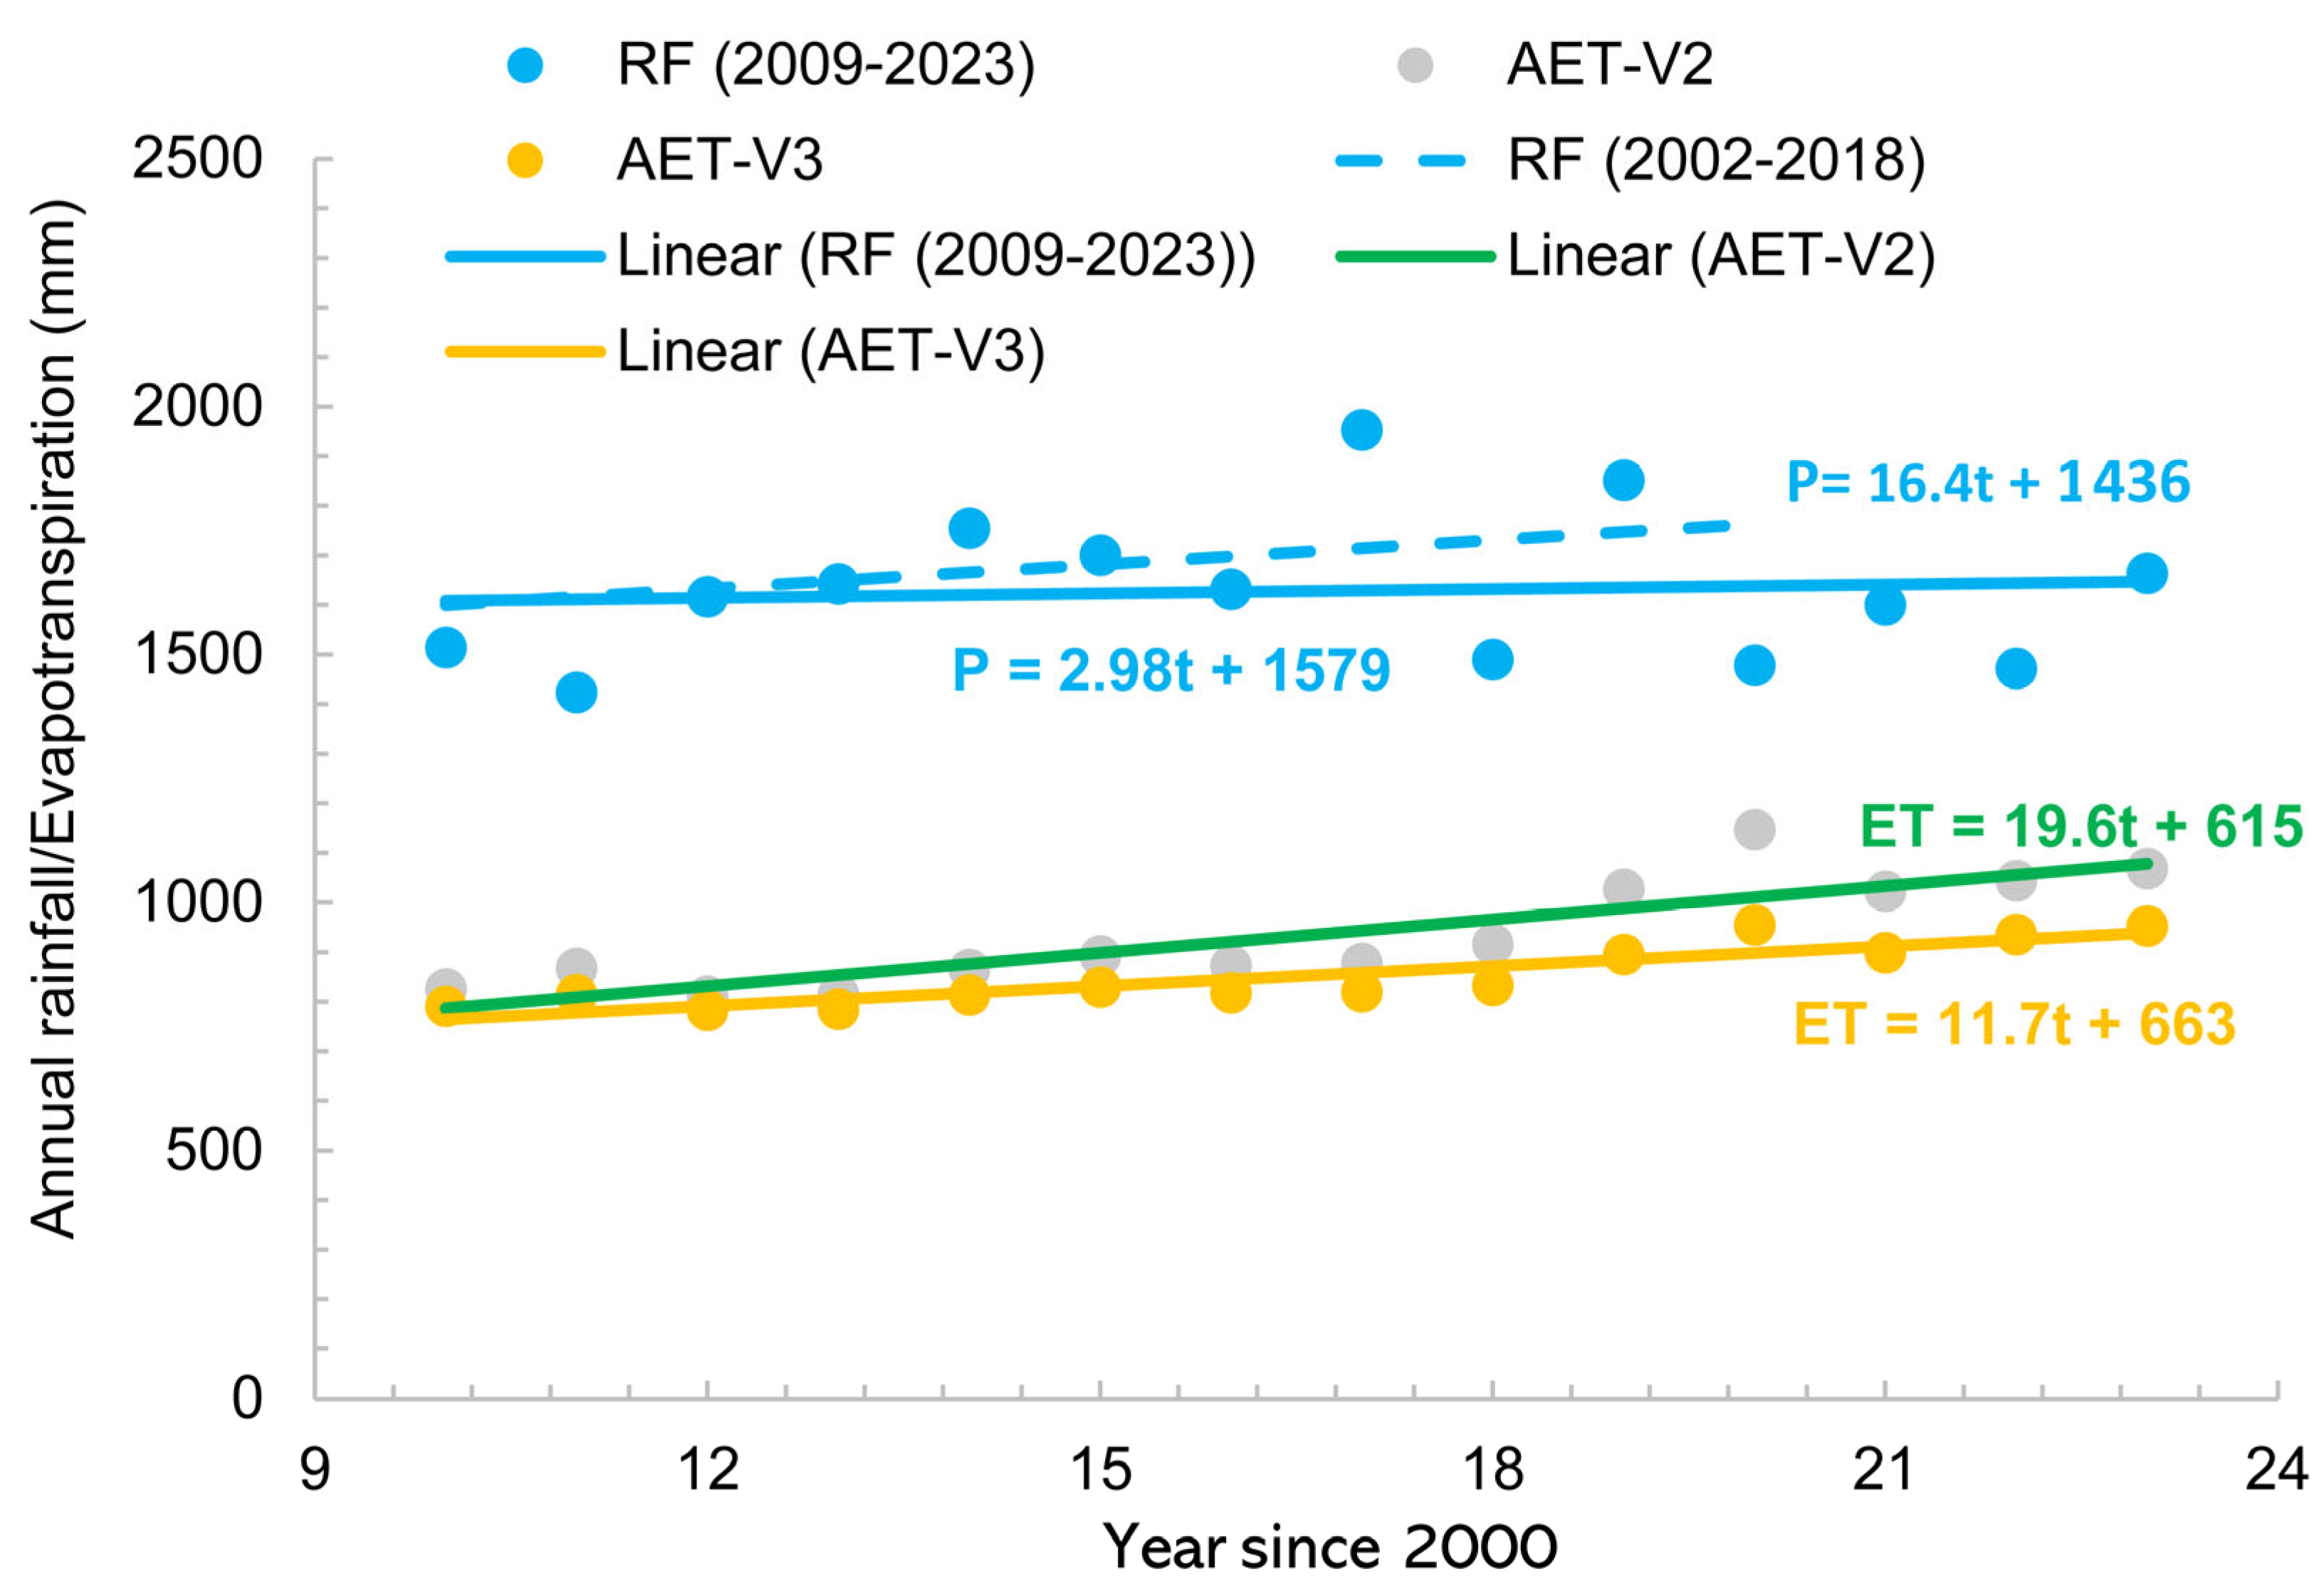
3.2.1. Precipitation
3.2.2. Streamflow
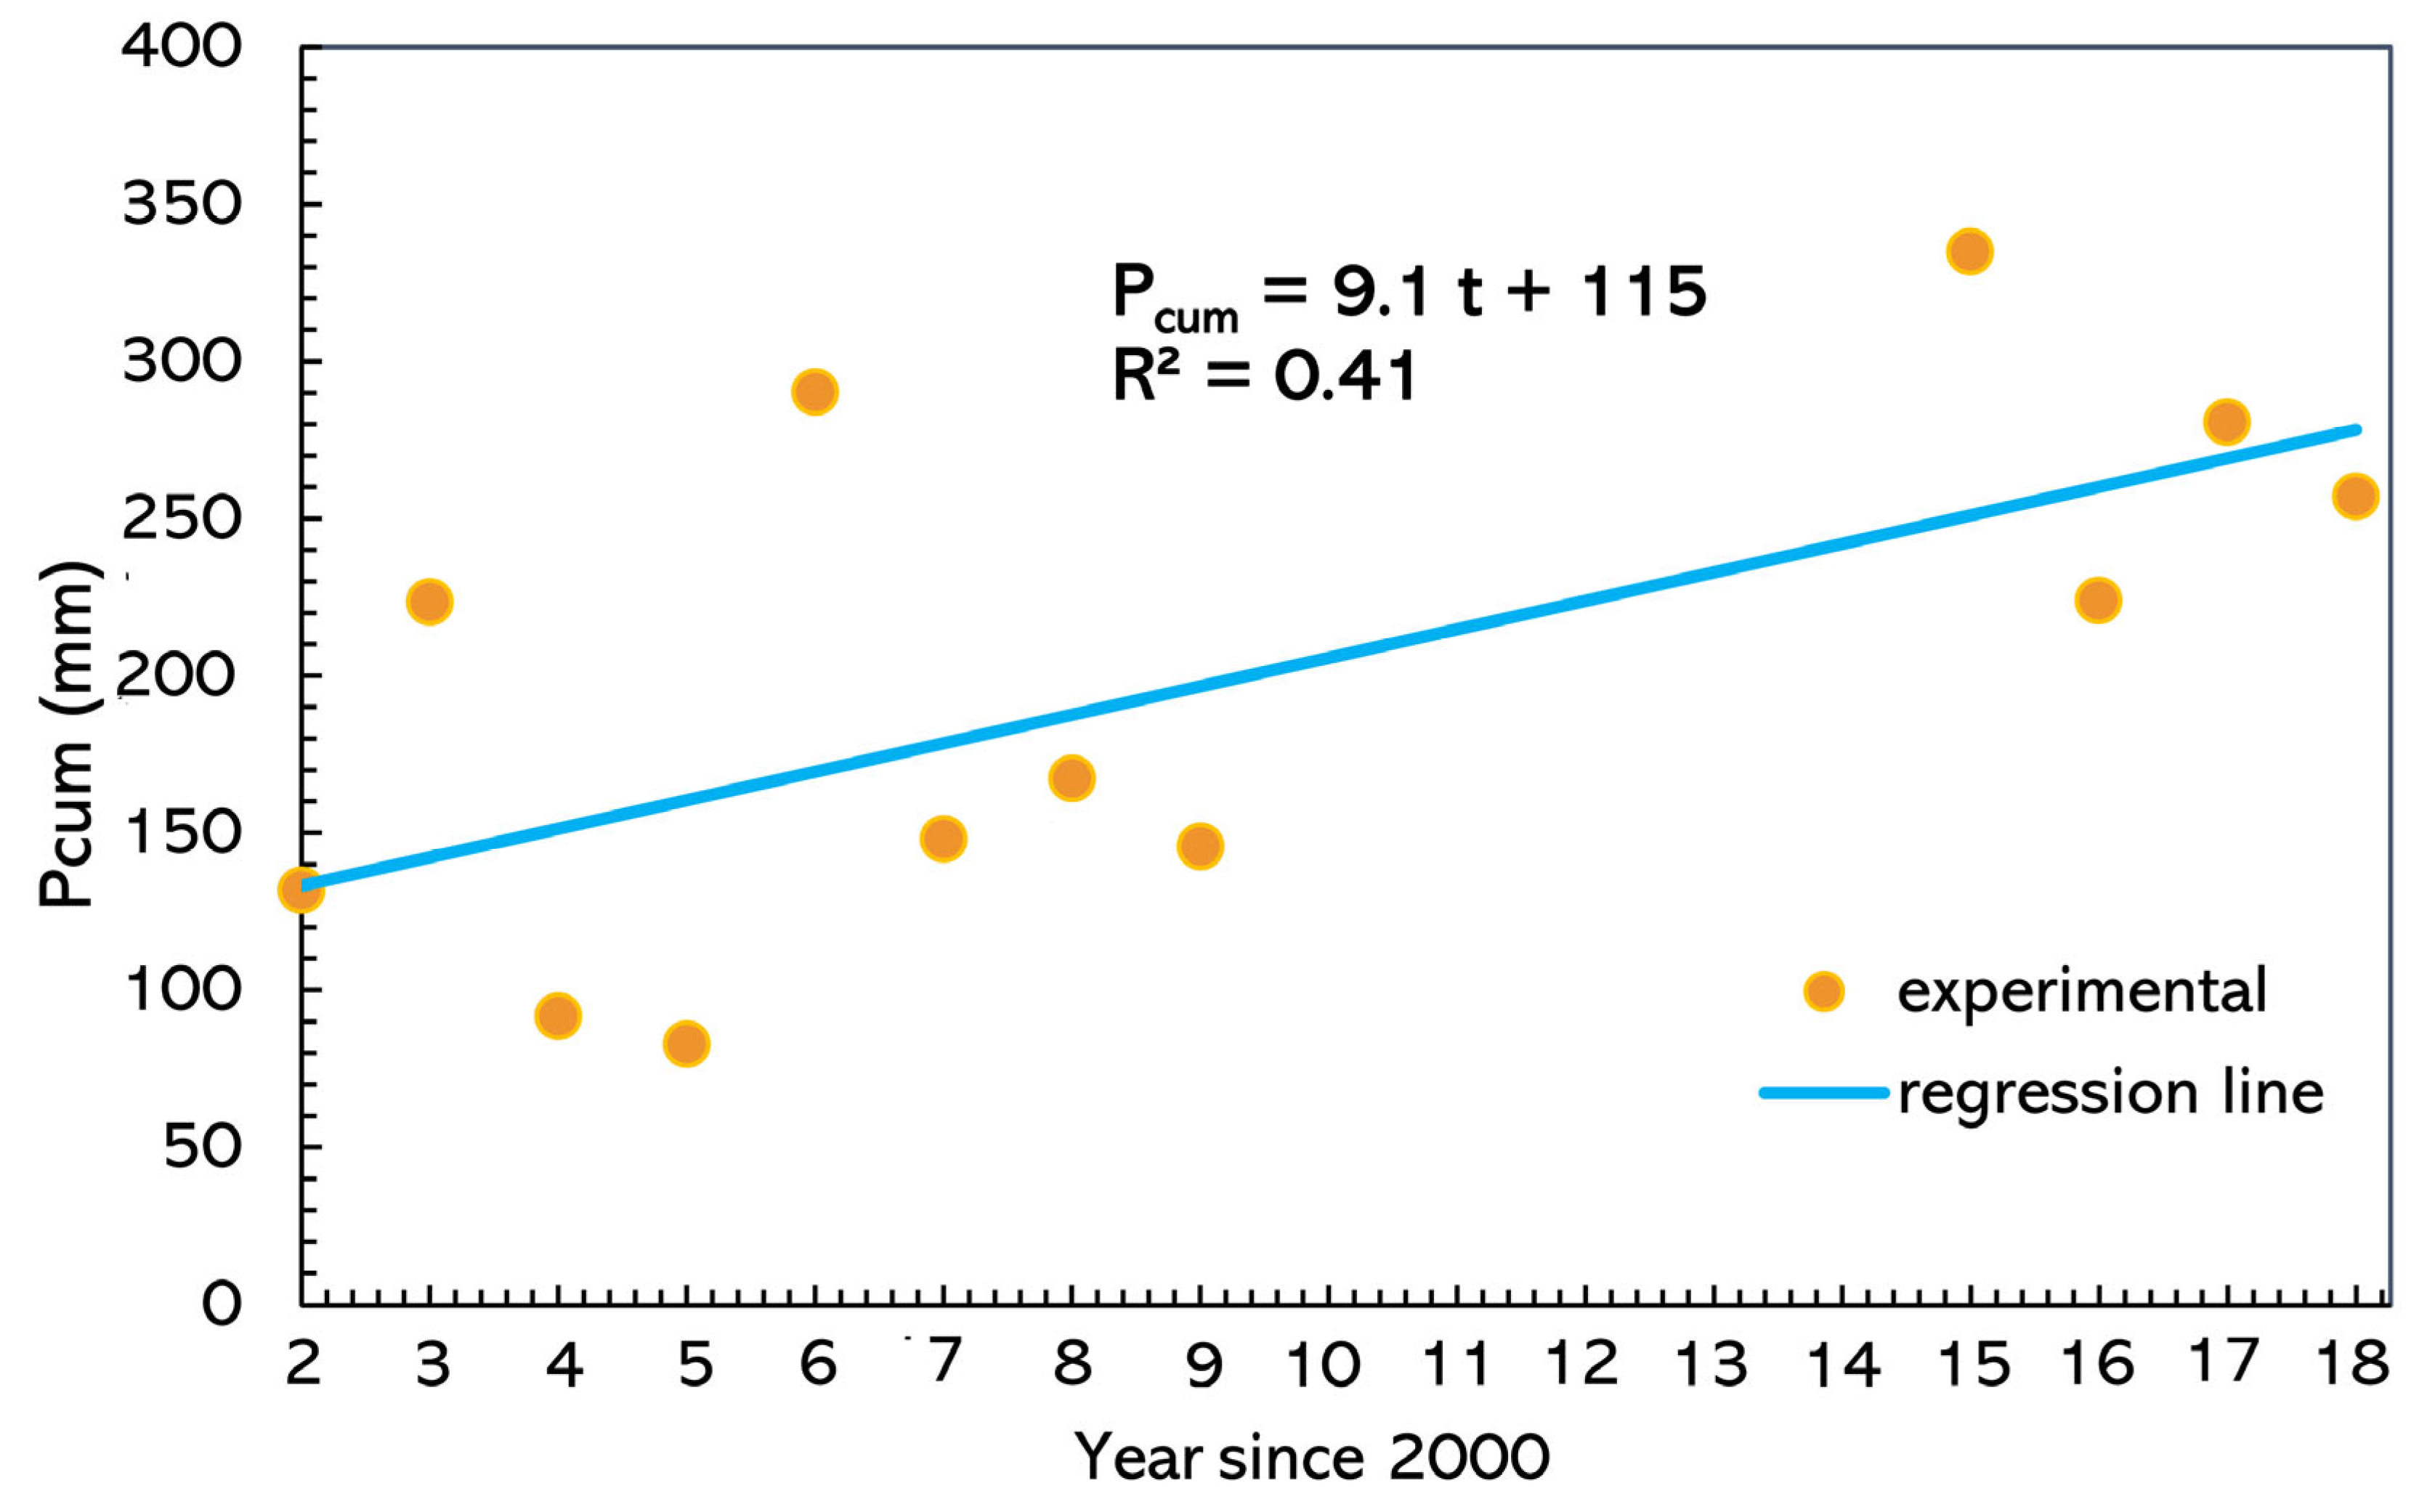
3.2.3. Delay in Runoff
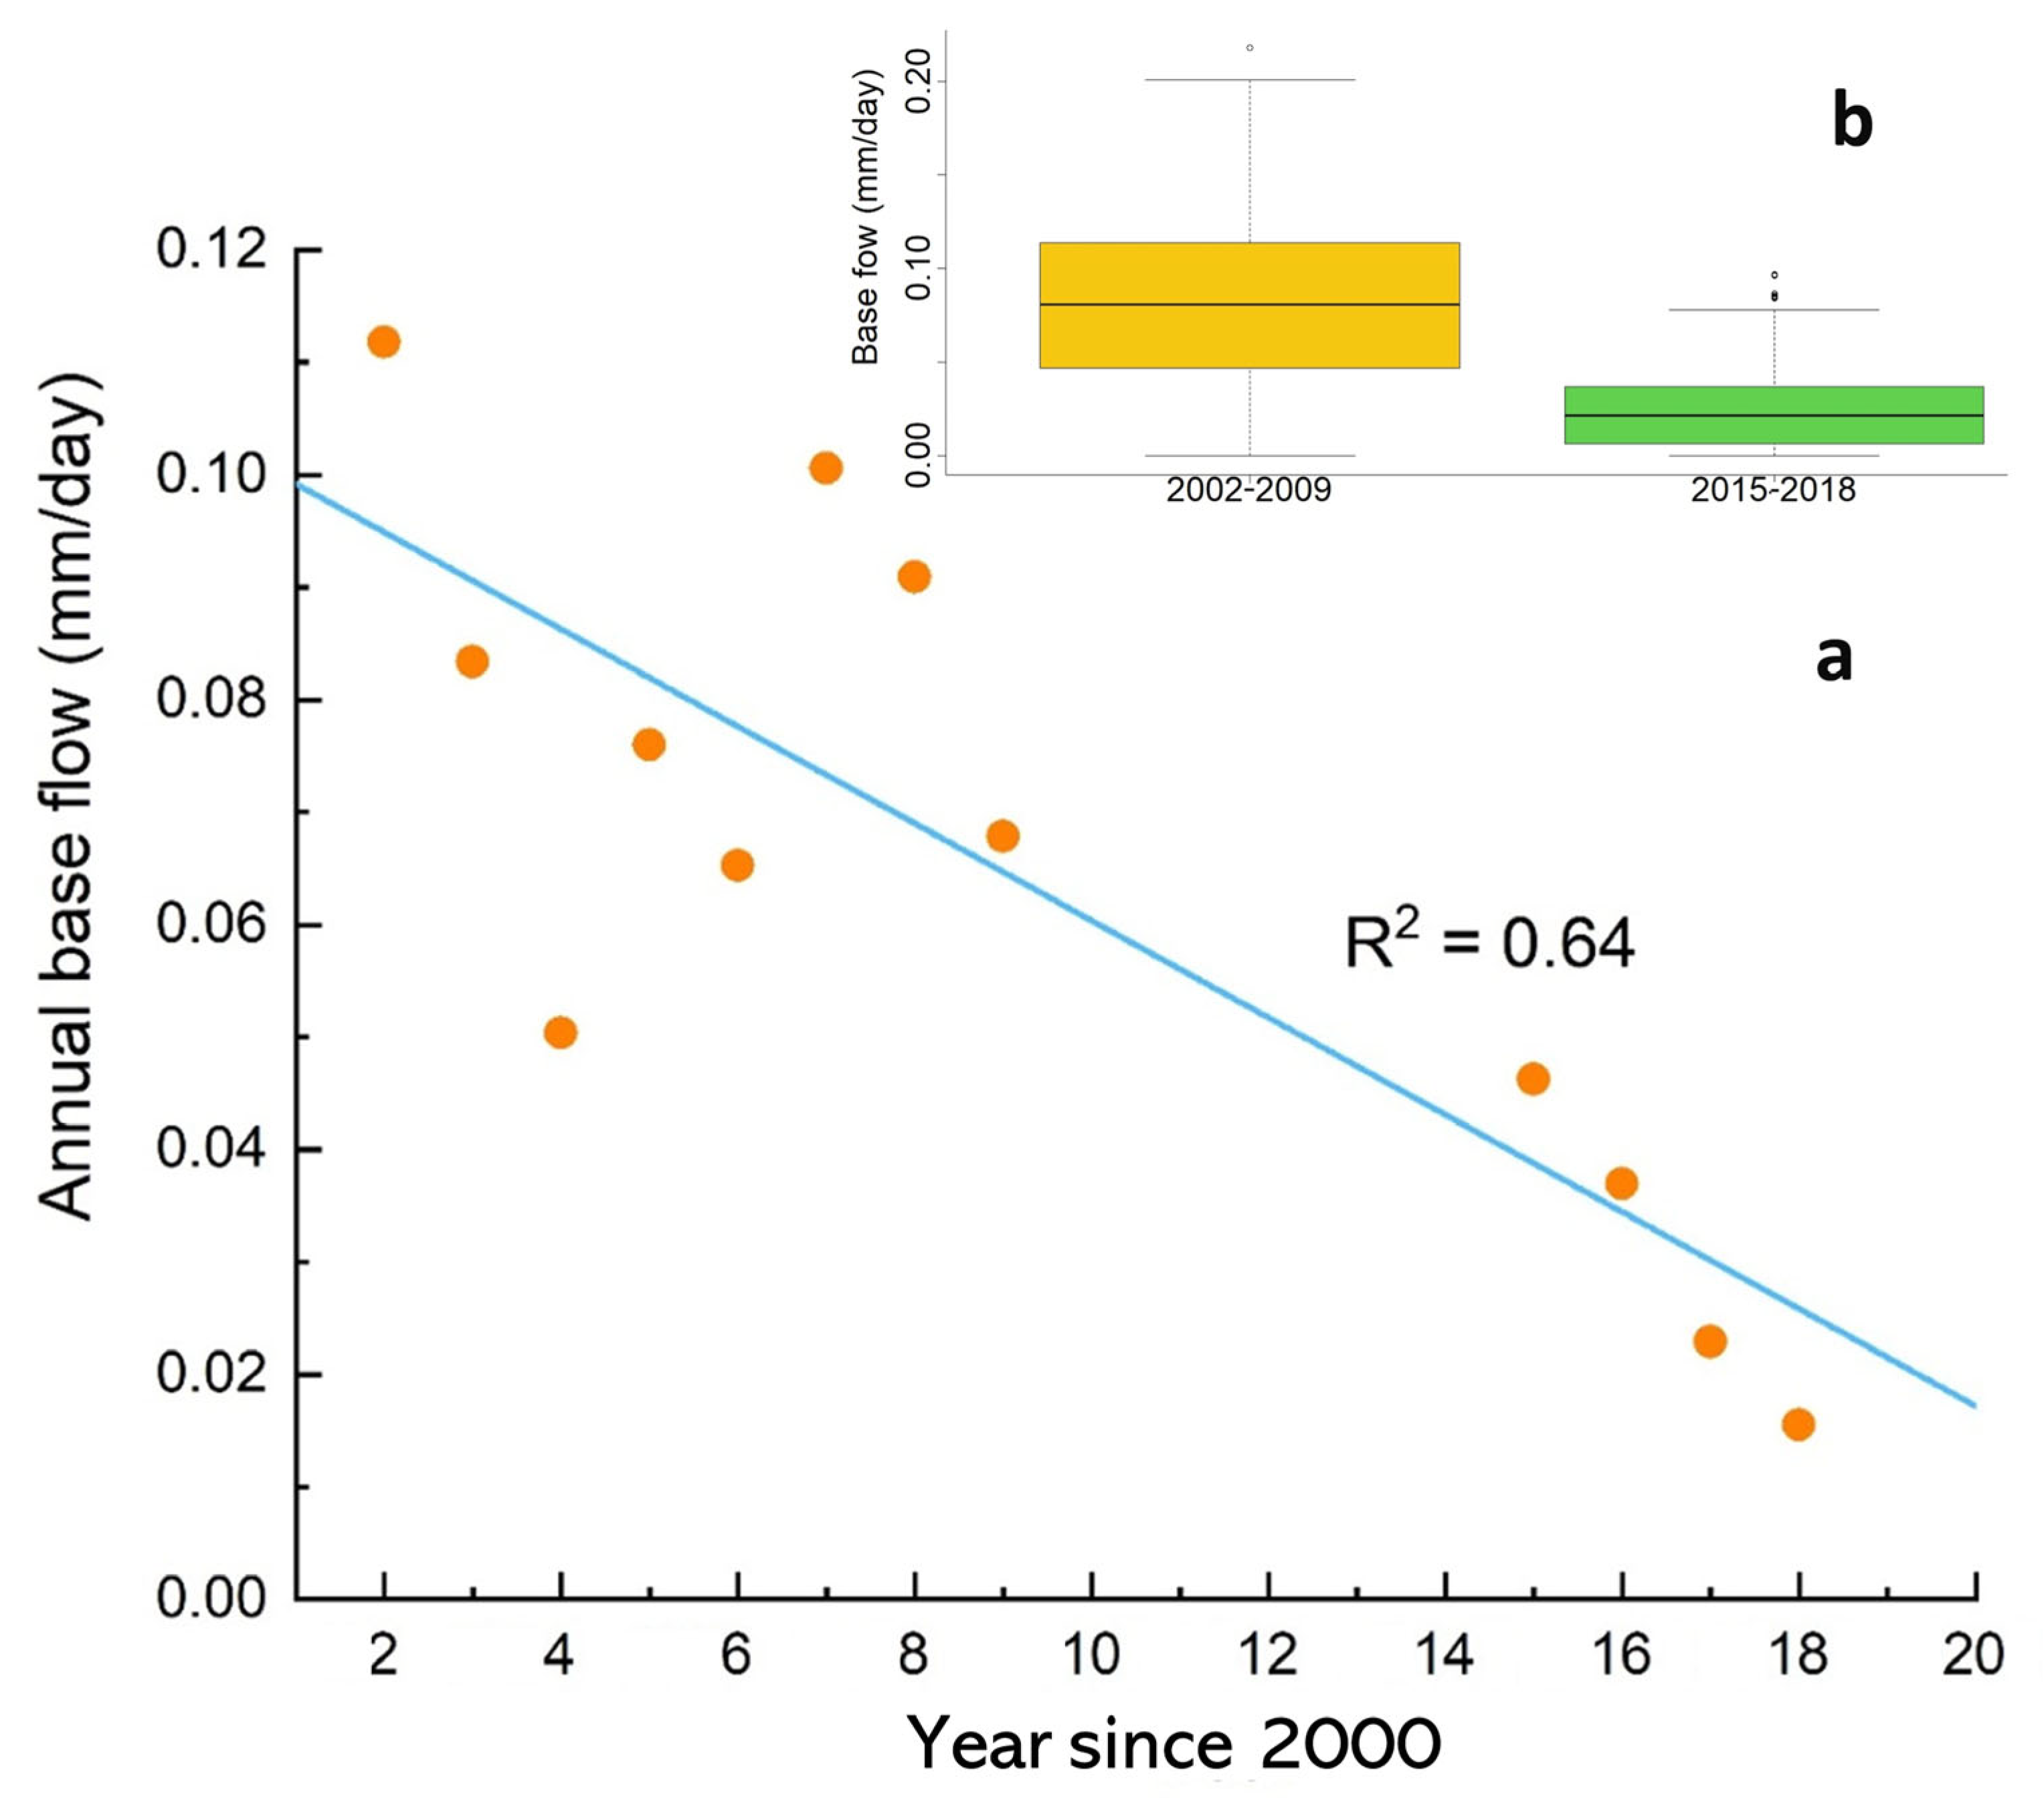
3.2.4. Base Flow Analysis
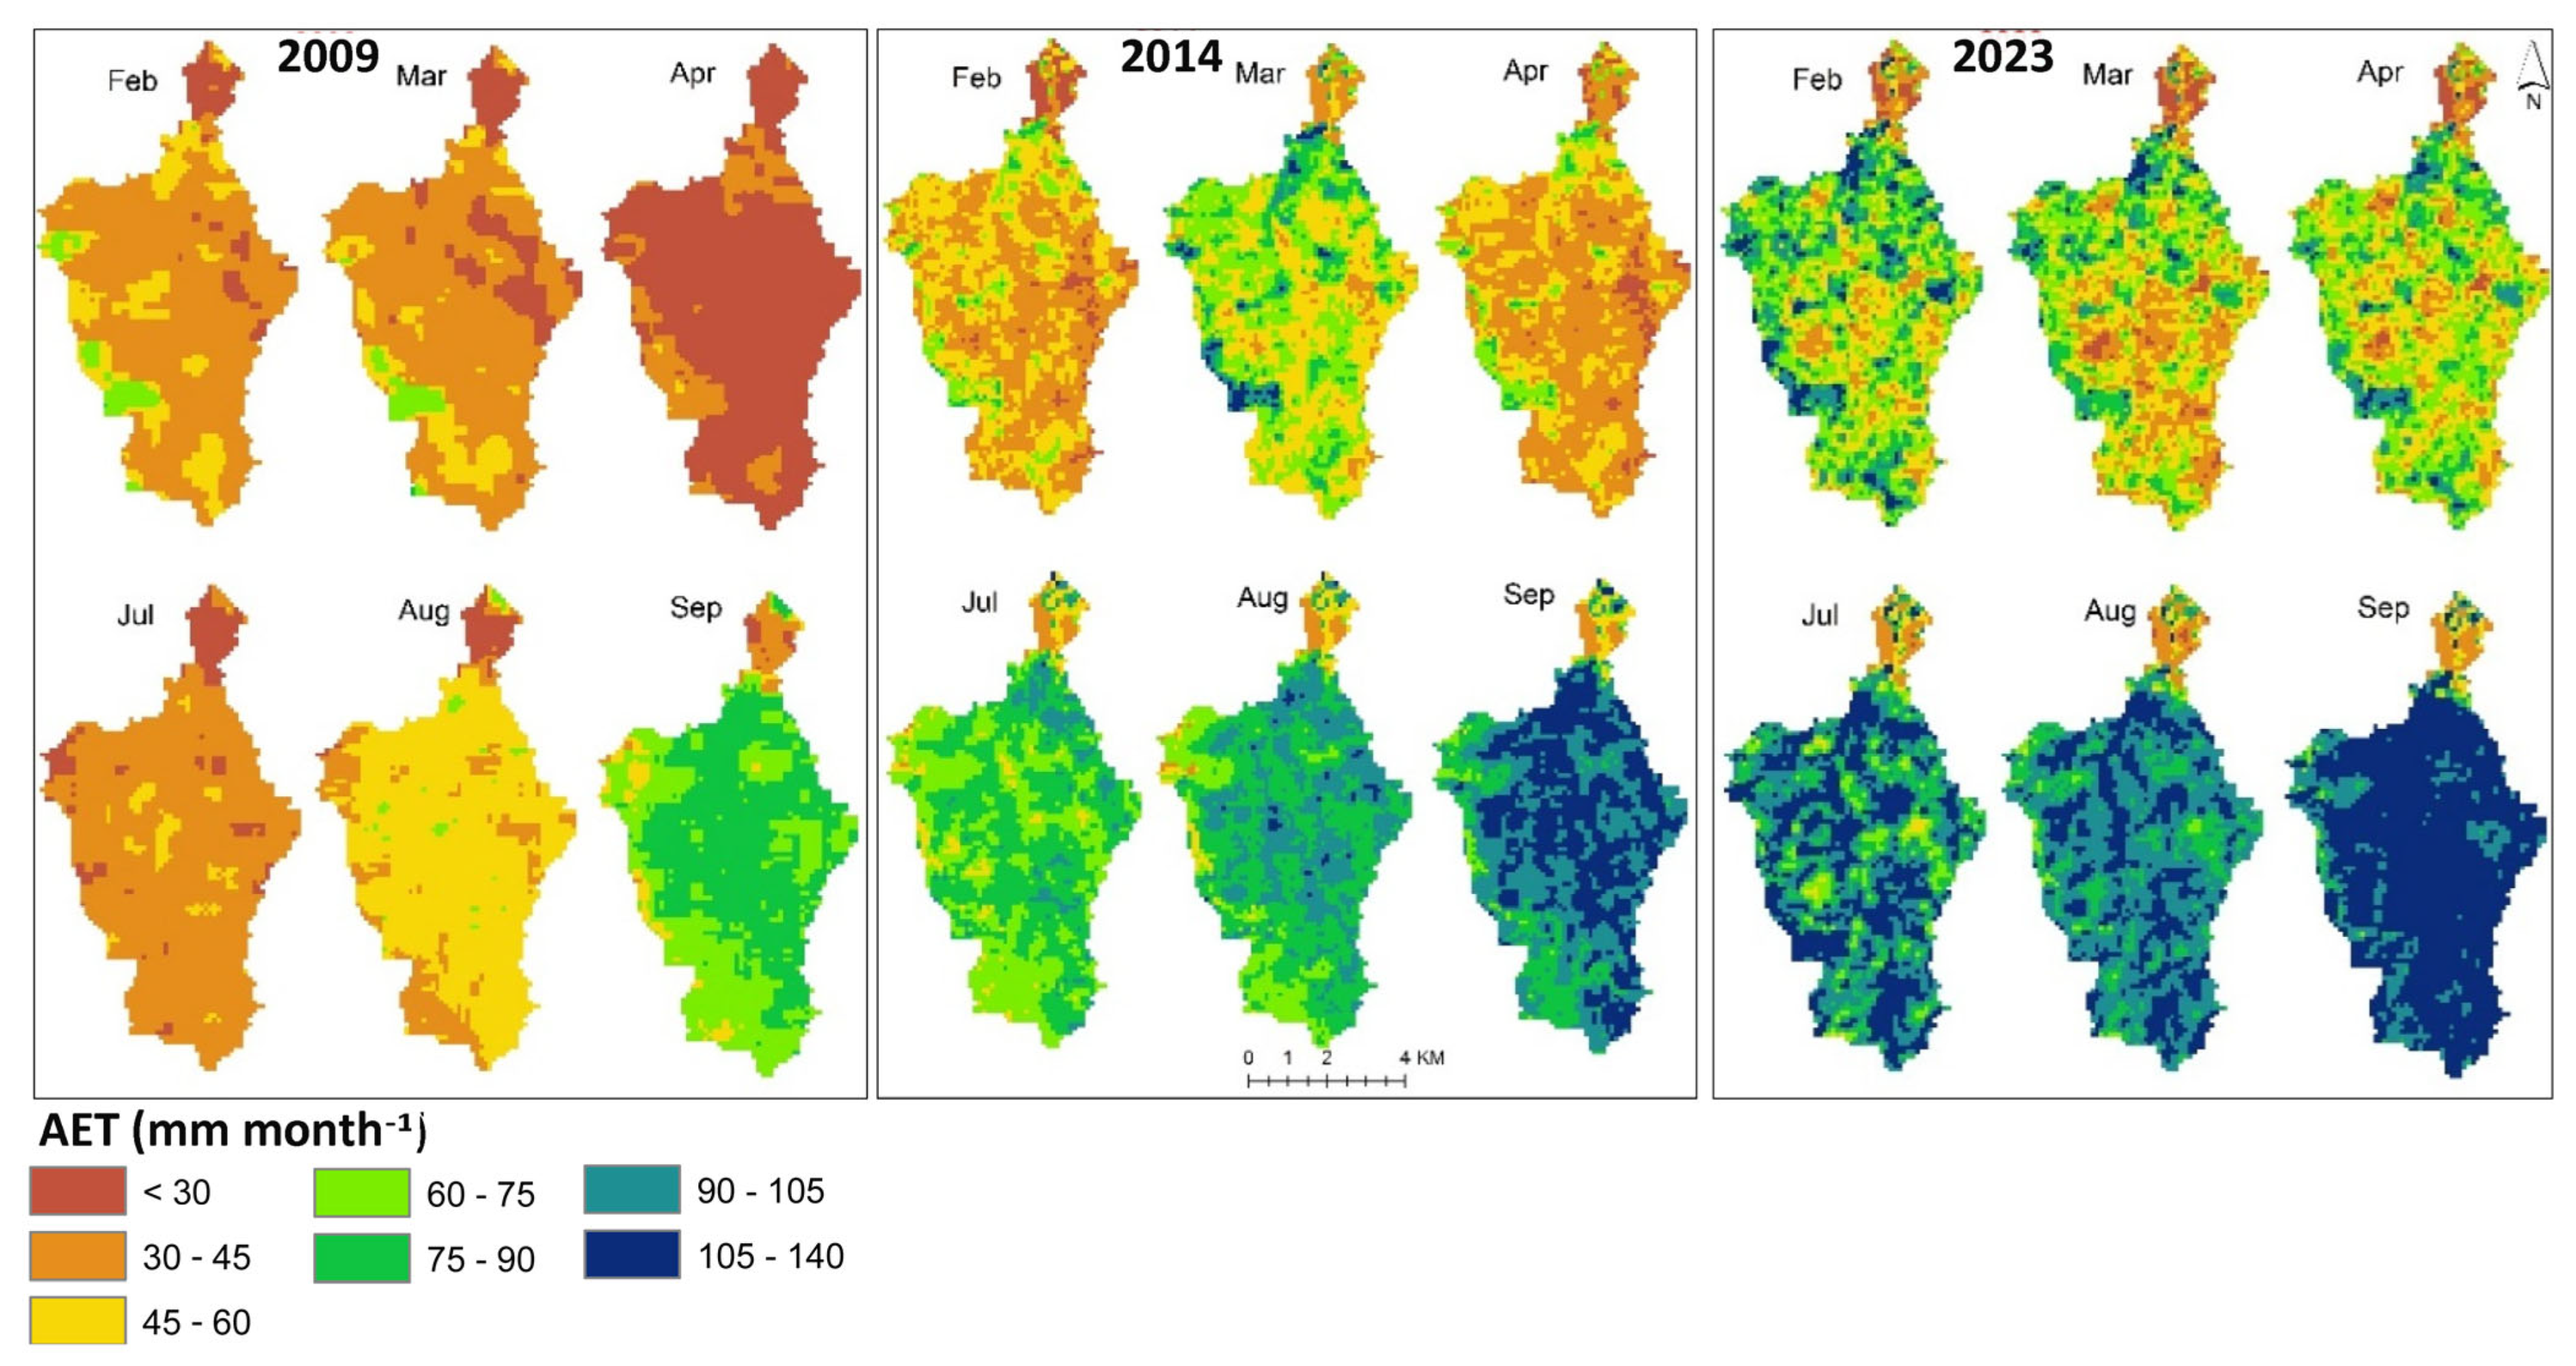
3.3. Spatial-Temporal Variation of AET
3.4. Eucalyptus Response to AET
4. Discussion
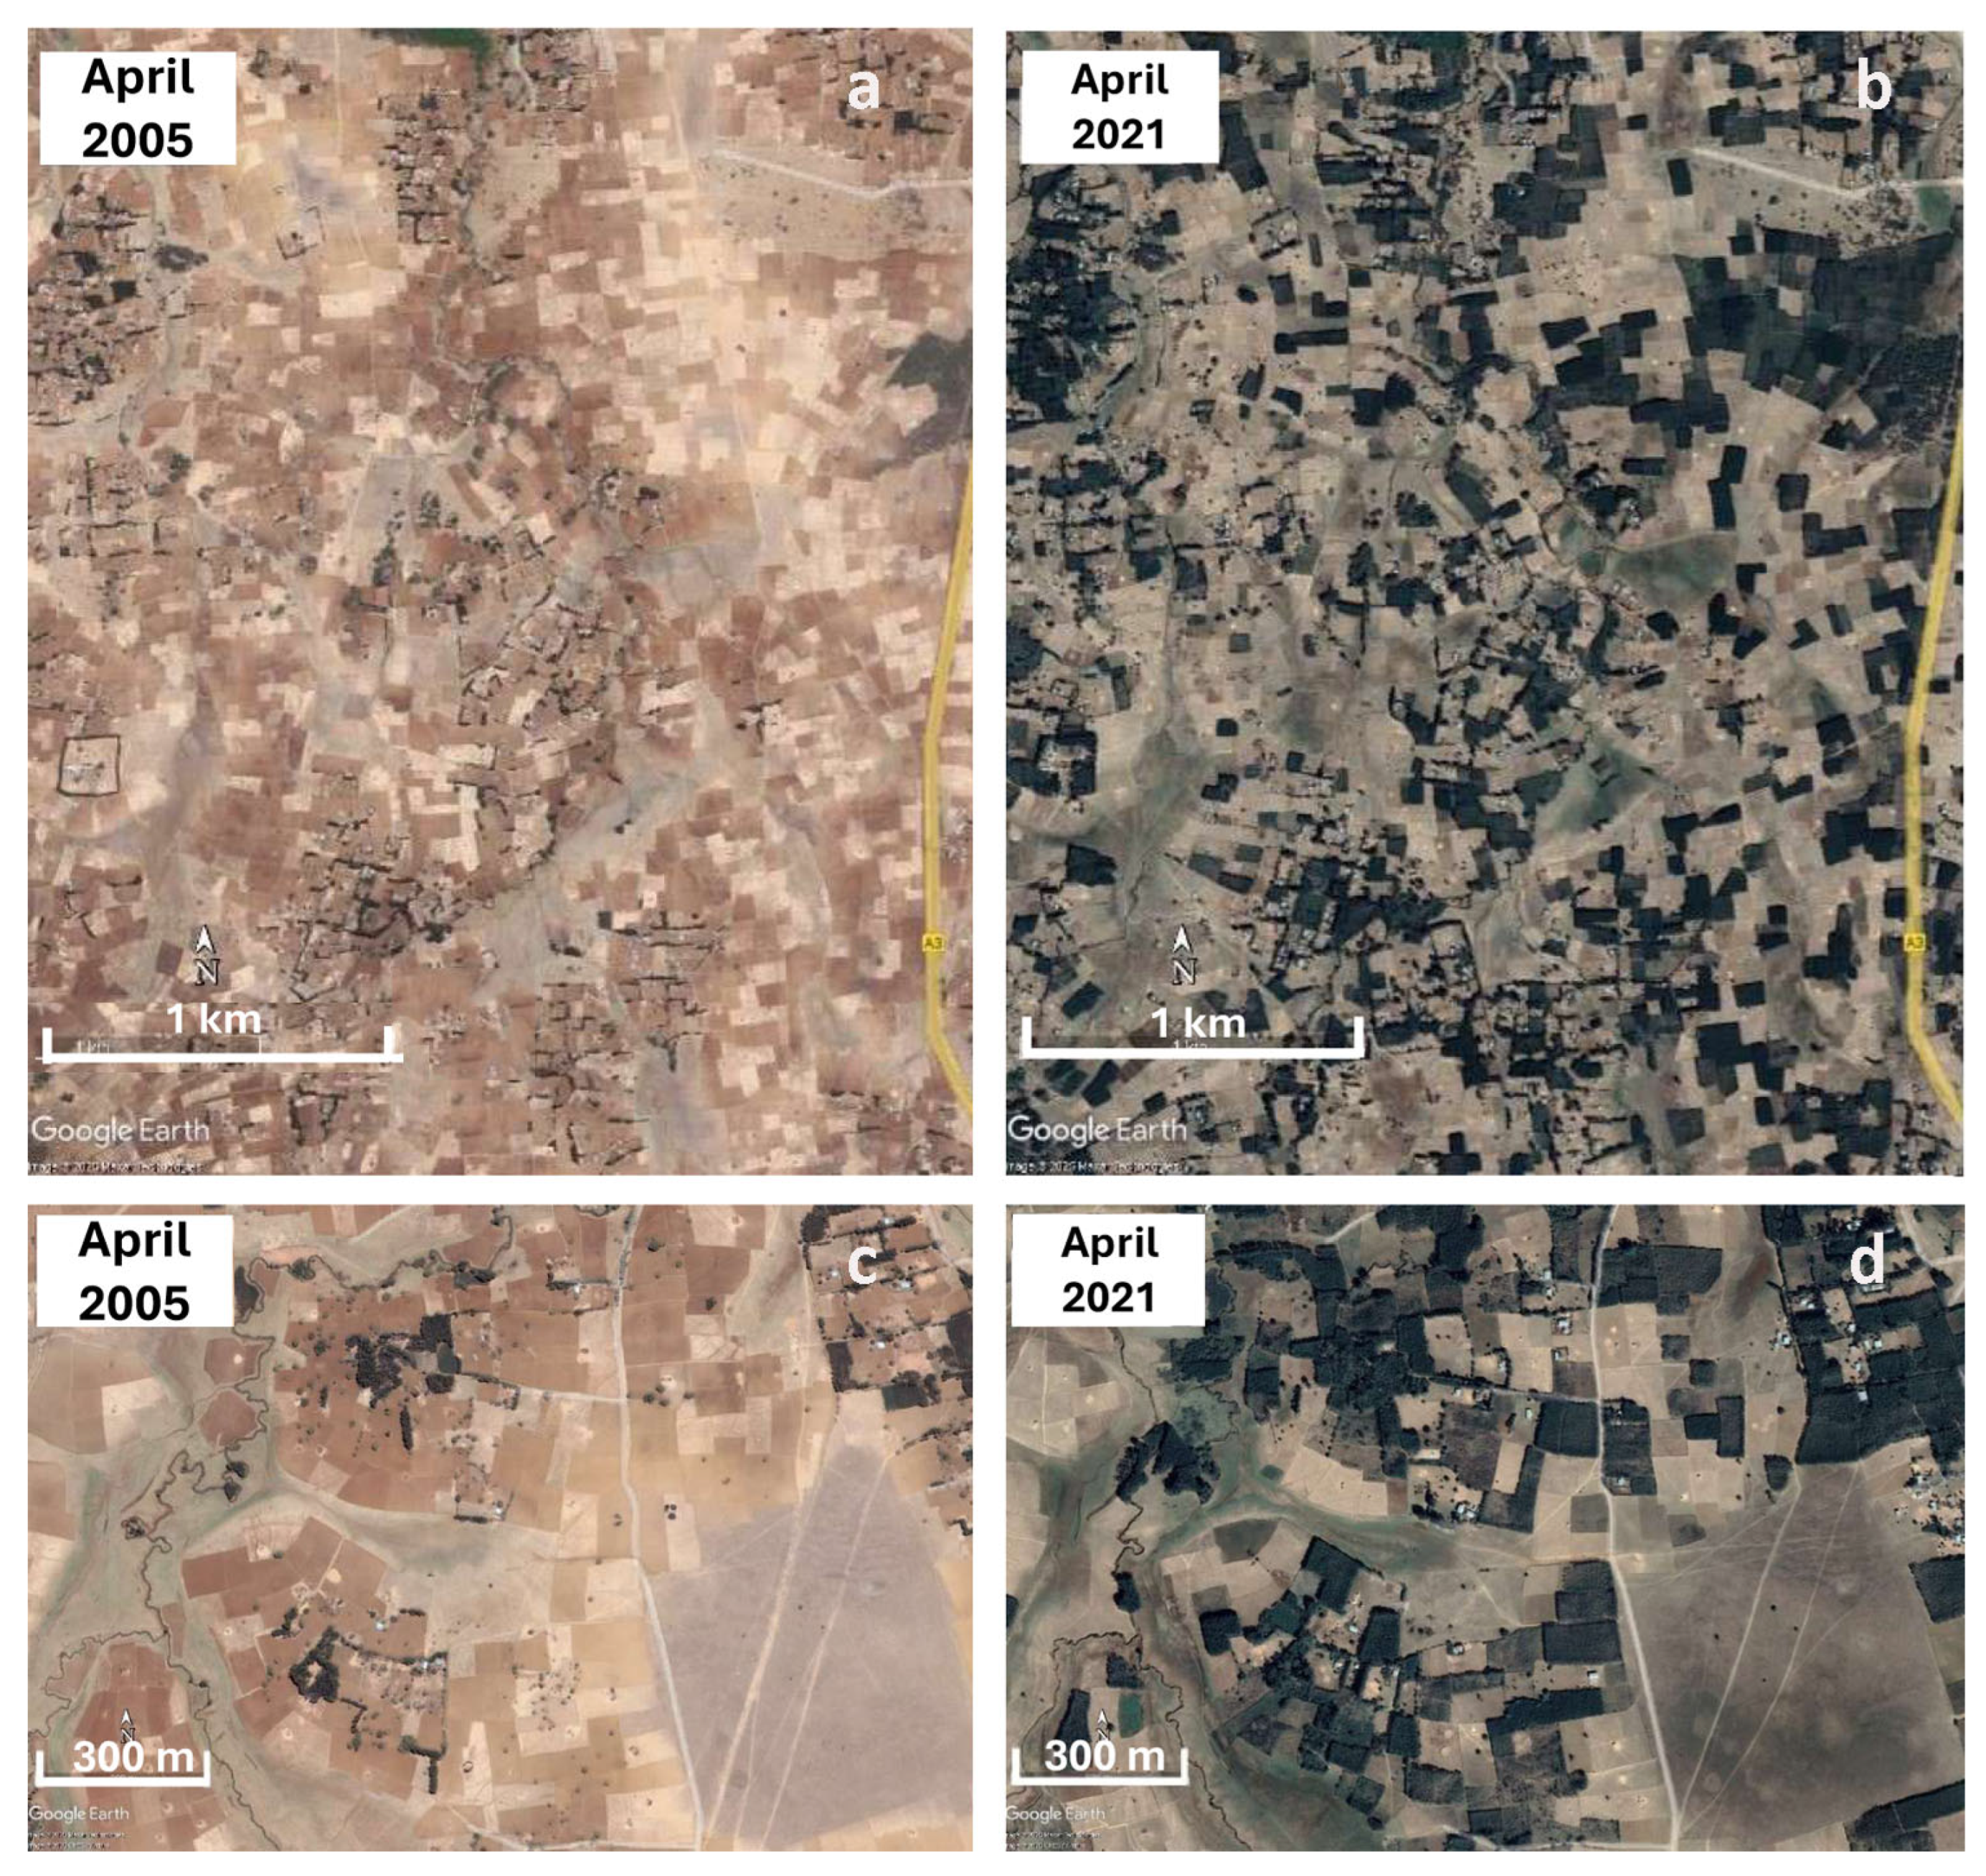
4.1. Eucalyptus Expansion
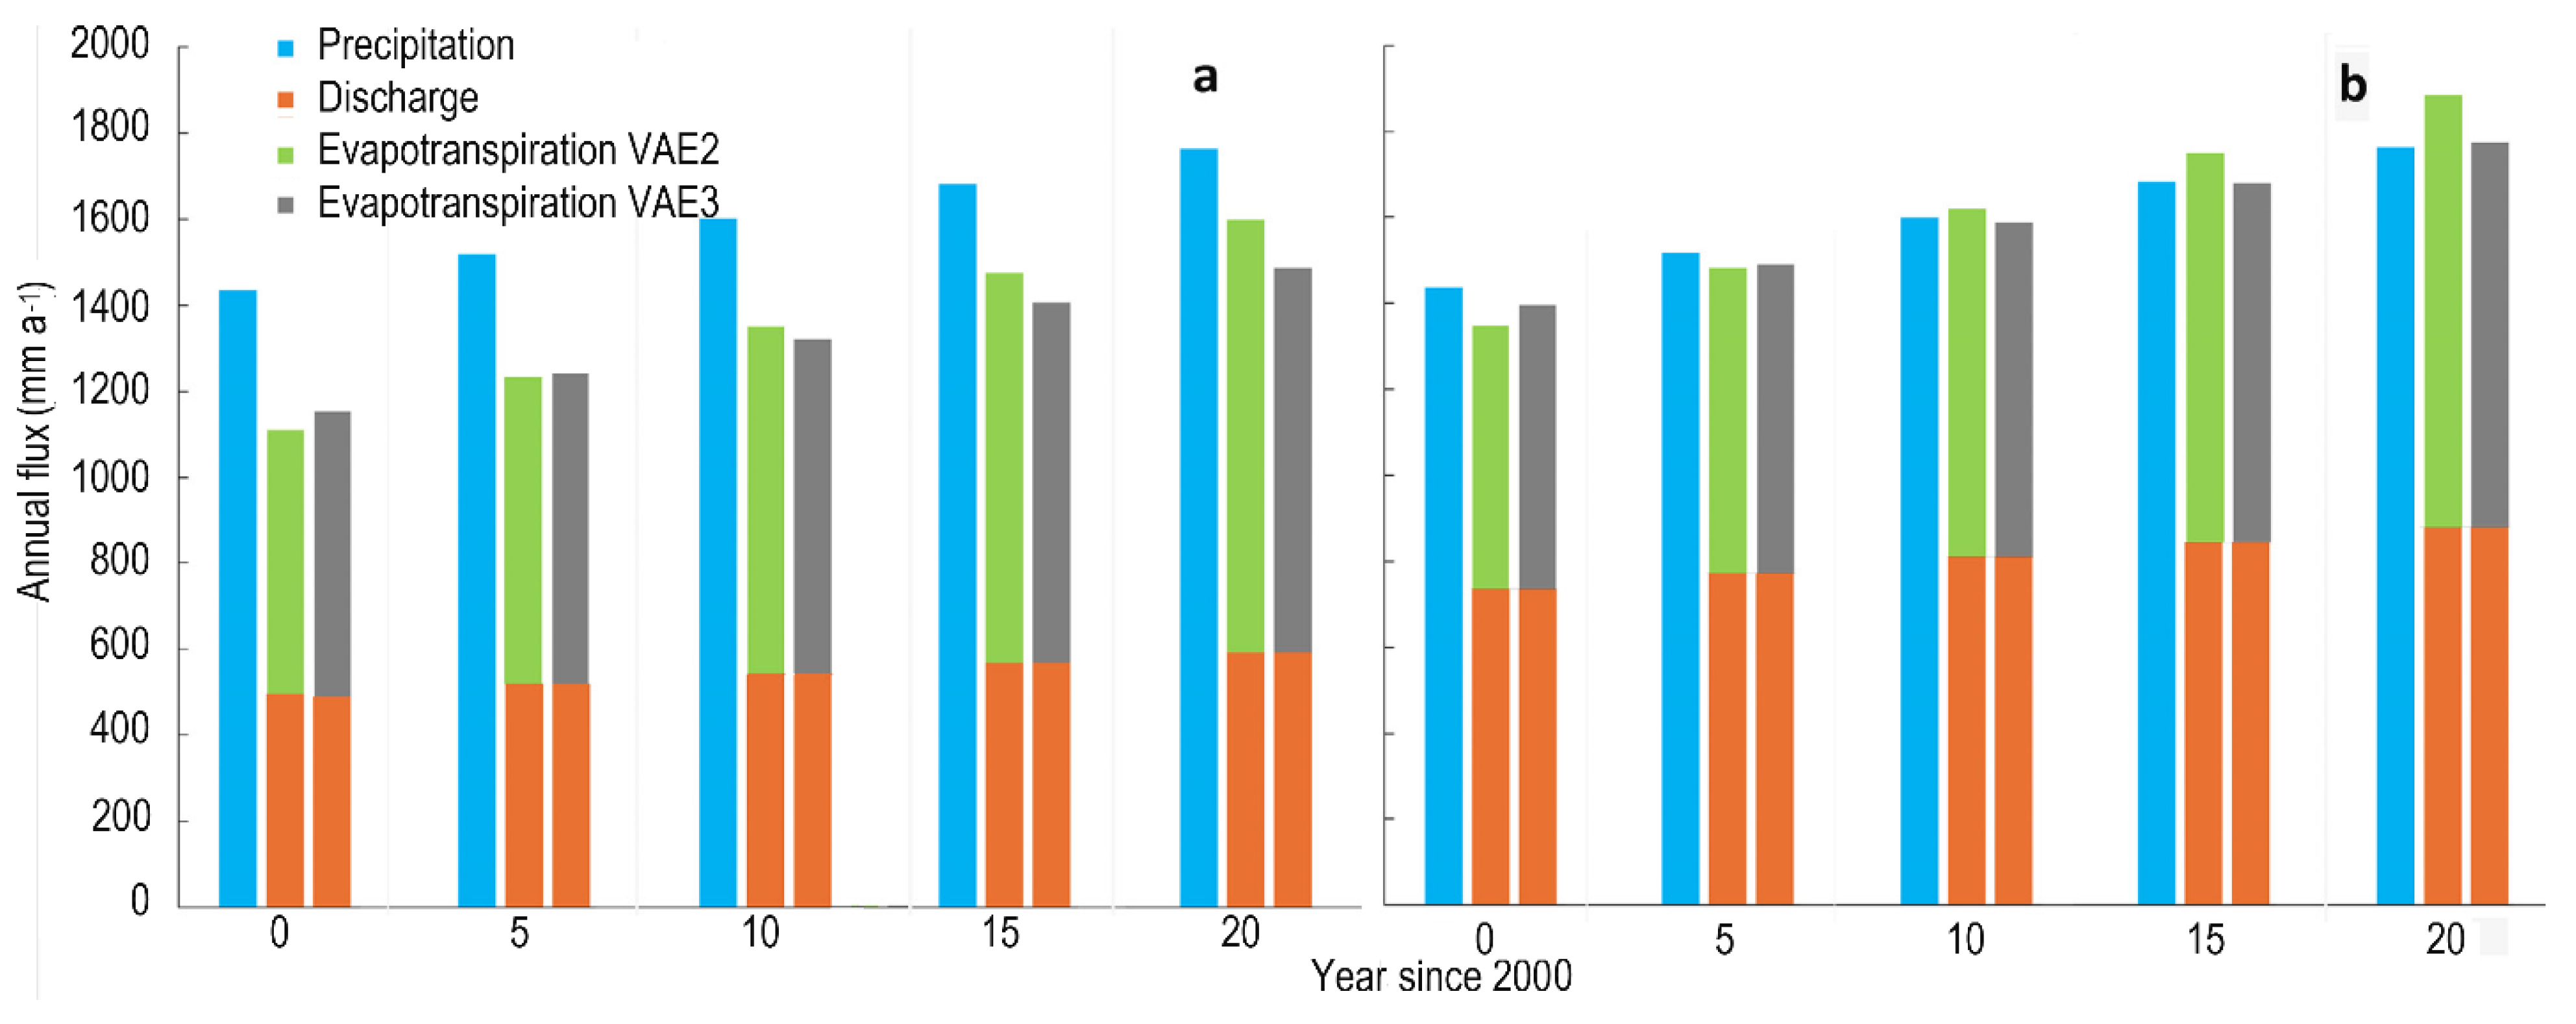
4.2. Mass Balance
4.3. Comparison with Other Studies and Management Options
5. Conclusions
Supplementary Materials
Author Contributions
Funding
Data Availability Statement
Acknowledgments
Conflicts of Interest
Appendix A

| 2001–2014 | 2014–2024 | 2001–2024 | |||||
|---|---|---|---|---|---|---|---|
| Area (ha) | % | Area (ha) | % | Area (ha) | % | Rate | |
| Built-up | 14 | 22 | 51 | 68 | 65 | 105 | 3 |
| Shrubs | −59 | −13 | −256 | −64 | −315 | −69 | −14 |
| Eucalyptus | 97 | 41 | 464 | 138 | 561 | 235 | 24 |
| Grassland | 95 | 61 | 44 | 17 | 1440 | 89 | 6 |
| Cultivated | −148 | −5 | −304 | −111 | −451 | −15 | −20 |
| Months | Mean RF (mm) | Monthly Rainy Days | ZMK | Slope | p-Value | Difference % |
|---|---|---|---|---|---|---|
| Jan | 1 | 2 | −0.78 | 0.02 | 0.43 | 49 |
| Feb | 10 | 2 | 0.14 | 0.11 | 0.89 | 38 |
| Mar | 34 | 4 | −0.57 | −0.31 | 0.57 | −30 |
| Apr | 46 | 5 | 0.34 | 0.20 | 0.74 | 14 |
| May | 111 | 15 | −0.37 | −0.31 | 0.71 | −9 |
| Jun | 233 | 22 | −0.65 | −0.73 | 0.51 | −10 |
| Jul | 358 | 24 | 1.92 | 2.97 | 0.05 | 27 |
| Aug | 336 | 25 | −0.97 | −0.71 | 0.33 | −7 |
| Sep | 237 | 20 | 0.45 | 0.87 | 0.64 | 12 |
| Oct | 116 | 15 | −0.02 | −0.65 | 0.98 | −18 |
| Nov | 54 | 5 | 0.53 | 1.14 | 0.59 | 70 |
| Dec | 9 | 3 | 0.39 | 0.15 | 0.69 | 55 |
| Annual | 1554 | 140 | 0.85 | 2.74 | 0.39 | 5.8 |
| Elements | AET-V2 | AET-V3 |
|---|---|---|
| Data sources and period | MODIS (2009–2013), PROBA-V (2014–current) | PROBA-V and Copernicus Sentinel-2 (2018 onwards) |
| Resolution | 100 m (resampled from 250 m) | 100 m |
| Data type | Decadal (10 days) | Decadal (10 days) |
| Input layers | NDVI, albedo, fAPAR | NDVI, albedo, fAPAR |
| AET calculation | Penman–Monteith equation corrected for water stress | Penman–Monteith equation corrected for water stress. |
| Year | Precipitation mm a−1 | Discharge mm a−1 | Actual Evap. mm a−1 | Cum. Eff. Precip. mm |
|---|---|---|---|---|
| 2002 | 1337 | 413 | 923 | 132 |
| 2003 | 1361 | 449 | 912 | 224 |
| 2004 | 1620 | 554 | 1066 | 92 |
| 2005 | 1364 | 553 | 812 | 83 |
| 2006 | 1866 | 540 | 1326 | 290 |
| 2007 | 1461 | 504 | 957 | 148 |
| 2008 | 1811 | 719 | 1092 | 167 |
| 2009 | 1439 | 528 | 911 | 146 |
| 2015 | 1701 | 346 | 1355 | 335 |
| 2016 | 1632 | 647 | 984 | 224 |
| 2017 | 1953 | 731 | 1222 | 281 |
| 2018 | 1490 | 482 | 1008 | 257 |
References
- UN-Water. Water Scarcity; United Nations: New York, NY, USA, 2021. [Google Scholar]
- Gosling, S.N.; Arnell, N.W. A global assessment of the impact of climate change on water scarcity. Clim. Change 2016, 134, 371–385. [Google Scholar] [CrossRef]
- Jiménez Cisneros, B.E.; Oki, T.; Arnell, N.W.; Benito, G.; Cogley, J.G.; Doll, P.; Jiang, T.; Mwakalila, S.S. Freshwater Resources; Cambridge University Press: Cambridge, UK, 2014. [Google Scholar]
- Weiss, M.I. A perfect storm: The causes and consequences of severe water scarcity, institutional breakdown and conflict in Yemen. Water Int. 2015, 40, 251–272. [Google Scholar] [CrossRef]
- Selby, J.; Hoffmann, C. Beyond scarcity: Rethinking water, climate change and conflict in the Sudans. Glob. Environ. Change 2014, 29, 360–370. [Google Scholar] [CrossRef]
- Nasr, H.; Neef, A. Ethiopia’s challenge to Egyptian hegemony in the Nile River Basin: The case of the grand Ethiopian Renaissance Dam. Geopolitics 2016, 21, 969–989. [Google Scholar] [CrossRef]
- Gari, Y.; Block, P.; Steenhuis, T.S.; Mekonnen, M.; Assefa, G.; Ephrem, A.K.; Bayissa, Y.; Tilahun, S.A. Developing an approach for equitable and reasonable utilization of international rivers: The Nile River. Water 2023, 15, 4312. [Google Scholar] [CrossRef]
- Abate, D.; Borges, J.G.; Marques, S.; Bushenkov, V. An ecological-economic approach to assess impacts of the expansion of eucalyptus plantations in agroforest landscapes of northern Ethiopia. Forests 2022, 13, 686. [Google Scholar] [CrossRef]
- Messerli, B.; Viviroli, D.; Weingartner, R. Mountains of the world: Water towers for the twenty-first century? In Managing Water Resources in a Time of Global Change; Routledge: London, UK, 2009; pp. 27–47. [Google Scholar]
- Yirgu, A.; Anjulo, A. First record of Glycaspis brimblecombei Moore (hem.: Psyllidae) on Eucalyptus camaldulensis in Ethiopia. Phytoparasitica 2019, 47, 67–70. [Google Scholar] [CrossRef]
- Jaleta, D.; Mbilinyi, B.; Mahoo, H.; Lemenih, M. Eucalyptus expansion as relieving and provocative tree in Ethiopia. J. Agric. Ecol. Res. Int. 2016, 6, 1–12. [Google Scholar] [CrossRef]
- Bekele, M.; Girmay, Z. Reading Through the Charcoal Industry in Ethiopia: Production, Marketing, Consumption and Impact; Forum for Social Studies: Addis Ababa, Ethiopia, 2014. [Google Scholar]
- Woldemarim, A.; Getachew, T.; Chanie, T. Long-term trends of river flow, sediment yield and crop productivity of Andit Tid watershed, central highland of Ethiopia. All Earth 2023, 35, 3–15. [Google Scholar] [CrossRef]
- Alemneh, T.; Zaitchik, B.F.; Simane, B.; Ambelu, A. Changing patterns of tree cover in a tropical highland region and implications for food, energy, and water resources. Front. Environ. Sci. 2019, 7, 1. [Google Scholar] [CrossRef]
- Farley, K.A.; Jobbágy, E.G.; Jackson, R.B. Effects of afforestation on water yield: A global synthesis with implications for policy. Glob. Change Biol. 2005, 11, 1565–1576. [Google Scholar] [CrossRef]
- Stape, J.L.; Binkley, D.; Ryan, M.G. Eucalyptus production and the supply, use and efficiency of use of water, light and nitrogen across a geographic gradient in Brazil. For. Ecol. Manag. 2004, 193, 17–31. [Google Scholar] [CrossRef]
- Enku, T.; Melesse, A.M.; Ayana, E.K.; Tilahun, S.A.; Abate, M.; Steenhuis, T.S. Groundwater use of a small Eucalyptus patch during the dry monsoon phase. Biologia 2020, 75, 853–864. [Google Scholar] [CrossRef]
- Weldegebriel, L.; Thompson, S.; Tilahun, S.; Guzman, C. Tolerance to waterlogging determines the effectiveness of biodrainage in mitigating runoff in hillslope-scale simulations. Catena 2024, 243, 108149. [Google Scholar] [CrossRef]
- Zerga, B.; Warkineh, B.; Teketay, D.; Woldetsadik, M. The sustainability of reforesting landscapes with exotic species: A case study of eucalypts in Ethiopia. Sustain. Earth 2021, 4, 5. [Google Scholar] [CrossRef]
- Chanie, T.; Collick, A.S.; Adgo, E.; Lehmann, C.J.; Steenhuis, T.S. Eco-hydrological impacts of Eucalyptus in the semi humid Ethiopian Highlands: The Lake Tana Plain. J. Hydrol. Hydromech. 2013, 61, 21–29. [Google Scholar] [CrossRef]
- Alemayehu, T.; McCartney, M.; Kebede, S. The water resource implications of planned development in the Lake Tana catchment, Ethiopia. Ecohydrol. Hydrobiol. 2010, 10, 211–221. [Google Scholar] [CrossRef]
- Conway, D. The climate and hydrology of the Upper Blue Nile River. Geogr. J. 2000, 166, 49–62. [Google Scholar] [CrossRef]
- Abdo, K.; Fiseha, B.; Rientjes, T.; Gieske, A.; Haile, A. Assessment of climate change impacts on the hydrology of Gilgel Abay catchment in Lake Tana basin, Ethiopia. Hydrol. Process. Int. J. 2009, 23, 3661–3669. [Google Scholar] [CrossRef]
- Wale, A.; Rientjes, T.; Dost, R.; Gieske, A. Hydrological Balance of Lake Tana Upper Blue Nile Basin, Ethiopia; ITC: Enschede, The Netherlands, 2008. [Google Scholar]
- Breiman, L. Random forests. Mach. Learn. 2001, 45, 5–32. [Google Scholar] [CrossRef]
- Rodriguez-Galiano, V.F.; Ghimire, B.; Rogan, J.; Chica-Olmo, M.; Rigol-Sanchez, J.P. An assessment of the effectiveness of a random forest classifier for land-cover classification. ISPRS J. Photogramm. Remote Sens. 2012, 67, 93–104. [Google Scholar] [CrossRef]
- Oshiro, T.M.; Perez, P.S.; Baranauskas, J.A. How many trees in a random forest? In Proceedings of the Machine Learning and Data Mining in Pattern Recognition: 8th International Conference, MLDM 2012, Berlin, Germany, 13–20 July 2012; pp. 154–168. [Google Scholar]
- Gizachew, B.; Solberg, S.; Næsset, E.; Gobakken, T.; Bollandsås, O.M.; Breidenbach, J.; Zahabu, E.; Mauya, E.W. Mapping and estimating the total living biomass and carbon in low-biomass woodlands using Landsat 8 CDR data. Carbon Balance Manag. 2016, 11, 13. [Google Scholar] [CrossRef]
- Belgiu, M.; Csillik, O. Sentinel-2 cropland mapping using pixel-based and object-based time-weighted dynamic time warping analysis. Remote Sens. Environ. 2018, 204, 509–523. [Google Scholar] [CrossRef]
- Eshetie, A.A.; Wubneh, M.A.; Kifelew, M.S.; Alemu, M.G. Application of artificial neural network (ANN) for investigation of the impact of past and future land use–land cover change on streamflow in the Upper Gilgel Abay watershed, Abay Basin, Ethiopia. Appl. Water Sci. 2023, 13, 209. [Google Scholar] [CrossRef]
- Landis, J.R.; Koch, G.G. An application of hierarchical kappa-type statistics in the assessment of majority agreement among multiple observers. Biometrics 1977, 33, 363–374. [Google Scholar] [CrossRef]
- Miralles, D.G.; Holmes, T.; De Jeu, R.; Gash, J.; Meesters, A.; Dolman, A. Global land-surface evaporation estimated from satellite-based observations. Hydrol. Earth Syst. Sci. 2011, 15, 453–469. [Google Scholar] [CrossRef]
- Honaker, J.; King, G.; Blackwell, M. Amelia II: A program for missing data. J. Stat. Softw. 2011, 45, 1–47. [Google Scholar] [CrossRef]
- Sen, P.K. Estimates of the regression coefficient based on Kendall’s tau. J. Am. Stat. Assoc. 1968, 63, 1379–1389. [Google Scholar] [CrossRef]
- Negatu, T.A.; Zimale, F.A.; Steenhuis, T.S. Establishing Stage–Discharge Rating Curves in Developing Countries: Lake Tana Basin, Ethiopia. Hydrology 2022, 9, 13. [Google Scholar] [CrossRef]
- Tilahun, S.A.; Ayana, E.K.; Guzman, C.D.; Dagnew, D.C.; Zegeye, A.D.; Tebebu, T.Y.; Yitaferu, B.; Steenhuis, T.S. Revisiting storm runoff processes in the upper Blue Nile basin: The Debre Mawi watershed. Catena 2016, 143, 47–56. [Google Scholar] [CrossRef]
- Bayabil, H.K.; Tilahun, S.A.; Collick, A.S.; Yitaferu, B.; Steenhuis, T.S. Are runoff processes ecologically or topographically driven in the (sub) humid Ethiopian highlands? The case of the Maybar watershed. Ecohydrology 2010, 3, 457–466. [Google Scholar] [CrossRef]
- Mhiret, D.A.; Dersseh, M.G.; Guzman, C.D.; Dagnew, D.C.; Abebe, W.B.; Zimale, F.A.; Zaitchik, B.F.; Tilahun, S.A.; Walraevens, K.; Steenhuis, T.S. Topography impacts hydrology in the sub-humid Ethiopian Highlands. Water 2022, 14, 196. [Google Scholar] [CrossRef]
- Guerschman, J.P.; McVicar, T.R.; Vleeshower, J.; Van Niel, T.G.; Peña-Arancibia, J.L.; Chen, Y. Estimating actual evapotranspiration at field-to-continent scales by calibrating the CMRSET algorithm with MODIS, VIIRS, Landsat and Sentinel-2 data. J. Hydrol. 2022, 605, 127318. [Google Scholar] [CrossRef]
- Blatchford, M.L.; Mannaerts, C.M.; Njuki, S.M.; Nouri, H.; Zeng, Y.; Pelgrum, H.; Wonink, S.; Karimi, P. Evaluation of WaPOR V2 evapotranspiration products across Africa. Hydrol. Process. 2020, 34, 3200–3221. [Google Scholar] [CrossRef]
- Smakhtin, V.U. Low flow hydrology: A review. J. Hydrol. 2001, 240, 147–186. [Google Scholar] [CrossRef]
- Buttle, J.M. Mediating stream baseflow response to climate change: The role of basin storage. Hydrol. Process. 2018, 32, 363–378. [Google Scholar] [CrossRef]
- Lemenih, M.; Kassa, H. Re-greening Ethiopia: History, challenges and lessons. Forests 2014, 5, 1896–1909. [Google Scholar] [CrossRef]
- Steenhuis, T.S.; Alemie, T.C.; Muche, H.; Tilahun, S.A.; Zimale, F.A.; Mhiret, D.A. Effect of eucalyptus on blue and green water availability and discharge in the tropical highlands: An interpretation of available literature. J. Hydrol. Hydromech. 2023, 71, 221–230. [Google Scholar] [CrossRef]
- Adem, A.A.; Addis, G.G.; Aynalem, D.W.; Tilahun, S.A.; Mekuria, W.; Azeze, M.; Steenhuis, T.S. Hydrogeology of volcanic highlands affects prioritization of land management practices. Water 2020, 12, 2702. [Google Scholar] [CrossRef]
- Kaptein, N.D.; Clulow, A.D.; Everson, C.S.; Toucher, M.L.; Germishuizen, I. The influence of different tree species and age on the surface water balance of a small commercial forestry catchment. J. Hydrol. Reg. Stud. 2024, 54, 101893. [Google Scholar] [CrossRef]
- Lara, A.; Jones, J.; Little, C.; Vergara, N. Streamflow response to native forest restoration in former Eucalyptus plantations in south central Chile. Hydrol. Process. 2021, 35, e14270. [Google Scholar] [CrossRef]
- Alonso, J.; Silveira, L.; Vervoort, R.W. Assessing effects of afforestation on streamflow in Uruguay: From small to large basins. Hydrol. Process. 2024, 38, e15272. [Google Scholar] [CrossRef]
- Ferreto, D.O.C.; Reichert, J.M.; Cavalcante, R.B.L.; Srinivasan, R. Water budget fluxes in catchments under grassland and Eucalyptus plantations of different ages. Can. J. For. Res. 2021, 51, 513–523. [Google Scholar] [CrossRef]
- Alemie, T.C.; Tilahun, S.A.; Ochoa-Tocachi, B.F.; Schmitter, P.; Buytaert, W.; Parlange, J.Y.; Steenhuis, T.S. Predicting shallow groundwater tables for sloping highland aquifers. Water Resour. Res. 2019, 55, 11088–11100. [Google Scholar] [CrossRef]
- Tilahun, S.A.; Yilak, D.L.; Schmitter, P.; Zimale, F.A.; Langan, S.; Barron, J.; Parlange, J.Y.; Steenhuis, T.S. Establishing irrigation potential of a hillside aquifer in the African highlands. Hydrol. Process. 2020, 34, 1741–1753. [Google Scholar] [CrossRef]
- Addisie, M.B.; Ayele, G.K.; Hailu, N.; Langendoen, E.J.; Tilahun, S.A.; Schmitter, P.; Parlange, J.-Y.; Steenhuis, T.S. Connecting hillslope and runoff generation processes in the Ethiopian Highlands: The Ene-Chilala watershed. J. Hydrol. Hydromech. 2020, 68, 313–327. [Google Scholar] [CrossRef]
- Smethurst, P.J.; Almeida, A.C.; Loos, R.A. Stream flow unaffected by Eucalyptus plantation harvesting implicates water use by the native forest streamside reserve. J. Hydrol. Reg. Stud. 2015, 3, 187–198. [Google Scholar] [CrossRef]
- Smethurst, P.J.; Petrone, K.C.; Langergraber, G.; Baillie, C.C.; Worledge, D.; Nash, D. Nitrate dynamics in a rural headwater catchment: Measurements and modelling. Hydrol. Process. 2014, 28, 1820–1834. [Google Scholar] [CrossRef]
- Jaleta, D.; Mbilinyi, B.P.; Mahoo, H.F.; Lemenih, M. Effect of Eucalyptus expansion on surface runoff in the central highlands of Ethiopia. Ecol. Process. 2017, 6, 1. [Google Scholar] [CrossRef]
- Fenta, H.M.; Aynalem, D.W.; Malmquist, L.; Haileslassie, A.; Tilahun, S.A.; Barron, J.; Adem, A.A.; Adimassu, Z.; Zimale, F.A.; Steenhuis, T.S. A critical analysis of soil (and water) conservation practices in the Ethiopian Highlands: Implications for future research and modeling. Catena 2024, 234, 107539. [Google Scholar] [CrossRef]
- Davidson, J. The Eucalypt Dilemma: Arguments for and Against Eucalypt Planning in Ethiopia; The Forestry Research Centre Seminar Note Series No. 1. A. A. Forestry Research Center: Addis Abeba, Ethiopia, 1989. [Google Scholar]
- Teshome, T. Is Eucalyptus ecologically hazardous tree species? Ethiop. e-J. Res. Innov. Foresight (Ee-JRIF) 2009, 1, 128–134. [Google Scholar]

| Land Use | 2001 | 2014 | 2024 | |||
|---|---|---|---|---|---|---|
| Area (ha) | % | Area (ha) | % | Area (ha) | % | |
| Built-up | 62 | 1.6 | 75 | 1.9 | 127 | 3.3 |
| Shrubs | 457 | 11.8 | 398 | 10.3 | 142 | 3.7 |
| Eucalyptus | 238 | 6.1 | 336 | 8.7 | 800 | 20.7 |
| Grassland | 158 | 4.1 | 253 | 6.5 | 297 | 7.7 |
| Cultivated | 2961 | 76.4 | 2813 | 72.6 | 2509 | 64.7 |
| Total | 3876 | 100 | 3876 | 100 | 3876 | 100 |
| Accuracy statistics | ||||||
| Overall accuracy | 82 | 84 | 88 | |||
| Kappa coefficient | 0.75 | 0.78 | 0.83 | |||
| Producer accuracy | 88 | 91 | 95 | |||
| User accuracy | 84 | 86 | 89 |
| Months | Mean ± SD | Slope | Zmk | |||
|---|---|---|---|---|---|---|
| AET-V2 | AET-V3 | AET-V2 | AET-V3 | AET-V2 | AET-V3 | |
| Jan | 69 ± 16 | 65 ± 17 ** | 2.2 | 3.2 ** | 0.37 | 0.58 |
| Feb | 60 ± 11 | 57 ± 15 * | 1.6 * | 2.6 * | 0.43 | 0.49 |
| Mar | 65 ± 11 | 62 ± 15 ** | 1.5 * | 2.9 ** | 0.41 | 0.66 |
| Apr | 58 ± 17 | 55 ± 17 ** | 2.0 | 2.8 ** | 0.37 | 0.58 |
| May | 73 ± 17 | 64 ± 15 ** | 2.5 ** | 2.3 ** | 0.52 | 0.58 |
| Jun | 85 ± 13 | 68 ± 9 | 1.1 | −0.1 | 0.26 | 0.03 |
| Jul | 69 ± 16 | 56 ± 8 | 1.5 | 0.6 | 0.26 | 0.16 |
| Aug | 75 ± 14 | 62 ± 8 | 1.5 | 0.8 | 0.33 | 0.31 |
| Sep | 95 ± 11 | 77 ± 7 | 0.9 | −0.4 | 0.2 | −0.16 |
| Oct | 107 ± 12 | 90 ± 8 | 0.3 | −0.1 | 0.07 | −0.05 |
| Nov | 95 ± 11 | 82 ± 11 | 1.5 * | 1.6 * | 0.41 | 0.51 |
| Dec | 81 ± 14 | 73 ± 15 | 2.3 ** | 2.6 ** | 0.54 | 0.54 |
Disclaimer/Publisher’s Note: The statements, opinions and data contained in all publications are solely those of the individual author(s) and contributor(s) and not of MDPI and/or the editor(s). MDPI and/or the editor(s) disclaim responsibility for any injury to people or property resulting from any ideas, methods, instructions or products referred to in the content. |
© 2025 by the authors. Licensee MDPI, Basel, Switzerland. This article is an open access article distributed under the terms and conditions of the Creative Commons Attribution (CC BY) license (https://creativecommons.org/licenses/by/4.0/).
Share and Cite
Fenta, H.M.; Steenhuis, T.S.; Negatu, T.A.; Zimale, F.A.; Cornelis, W.; Tilahun, S.A. The Impact of Expanding Eucalyptus Plantations on the Hydrology of a Humid Highland Watershed in Ethiopia. Hydrology 2025, 12, 121. https://doi.org/10.3390/hydrology12050121
Fenta HM, Steenhuis TS, Negatu TA, Zimale FA, Cornelis W, Tilahun SA. The Impact of Expanding Eucalyptus Plantations on the Hydrology of a Humid Highland Watershed in Ethiopia. Hydrology. 2025; 12(5):121. https://doi.org/10.3390/hydrology12050121
Chicago/Turabian StyleFenta, Habtamu M., Tammo S. Steenhuis, Teshager A. Negatu, Fasikaw A. Zimale, Wim Cornelis, and Seifu A. Tilahun. 2025. "The Impact of Expanding Eucalyptus Plantations on the Hydrology of a Humid Highland Watershed in Ethiopia" Hydrology 12, no. 5: 121. https://doi.org/10.3390/hydrology12050121
APA StyleFenta, H. M., Steenhuis, T. S., Negatu, T. A., Zimale, F. A., Cornelis, W., & Tilahun, S. A. (2025). The Impact of Expanding Eucalyptus Plantations on the Hydrology of a Humid Highland Watershed in Ethiopia. Hydrology, 12(5), 121. https://doi.org/10.3390/hydrology12050121