1. Introduction
Water covers 72% of the Earth’s surface, yet only 2.8% of this is freshwater. This vital resource is subject to a multitude of pressures arising from human activities. This degradation, impacting both quantity and quality, exerts a detrimental effect on the environment and human health. Arid and semi-arid regions are particularly vulnerable to the escalating threat of drought.
A case in point is Burkina Faso, a Sahelian country, where the development of mining activity, marked by the opening of over a hundred artisanal, semi-industrial and industrial sites (see
Figure 1), has been ongoing since the 2000s [
1].
Gold is the mineral most commonly found in industrial metallurgical extraction, but other minerals such as zinc, manganese and silver are also present. In certain localities, the advent of this “gold rush” has precipitated an influx of predominantly youthful demographics, concomitantly giving rise to a redefinition of economic activities [
2]. These changes are accompanied not only by an increase in population density but also in waste production. This waste is sometimes discharged into the environment without pre-treatment, posing a risk of environmental contamination. Specifically, groundwater, which constitutes the primary source of potable water through wells and boreholes, is subject to monitoring for potential contamination. The assessment of monitoring results is typically conducted in accordance with the standards established by the World Health Organization (WHO).
A plethora of regional guides and guidelines have been developed for the purpose of assessing the quality of drinking water [
3,
4,
5]. These proposals set threshold values for physico-chemical and bacteriological components, applicable to drinking water, surface water and industrial wastewater. The traditional approach involves individual comparisons of each result to set standards. This procedure is useful for identifying non-compliance for one parameter but becomes tedious for multiple parameters. Furthermore, this approach incurs significant costs, and the resulting classification systems may not permit the delineation of water types in a hierarchical manner. Numerous tools have been developed worldwide to quantify quality levels in a simple way. Some of these tools use indirect methods, such as the specific pollutant sensitivity index, the generic diatomic index, the cumulative toxic pressure index and biomarkers [
6,
7,
8,
9]. These alternative methods are optimally applied to surface waters and wetlands. However, they do not always reflect all potential impacts on humans and the environment.
Classification methods based on water characteristics were developed in England in the 1850s [
10]. It was not until 1965 that Horton proposed a water quality index (WQI) [
11]. Other indices will subsequently be developed and adapted to different contexts [
12,
13,
14,
15,
16,
17]. More than 25 WQI models have been identified, with over a hundred contextual applications [
18]. The general approach comprises four steps. Firstly, there is the selection of parameters. Secondly, there is the production of indices. Thirdly, there is the identification of weights. Finally, there is the aggregation of data. The distinguishing factor between the indices is the methodology employed at each stage (cf.
Table 1).
After these various stages, the data is classified. The literature review identified two classification approaches that are closely linked to the aggregation function (cf.
Table 2). The first approach involves a direct relationship between index and quality, with higher indices corresponding to better quality. In contrast, the second approach is characterised by an inverse relationship between index and quality, whereby higher indices are associated with poorer quality.
The most widely used indices for surface waters are the Canadian Council of Ministers of Environment (CCME) water quality index and the index developed by Brown: NSF [
18,
30,
34]. They exhibit a general bias towards physical and chemical parameters over biological metrics. In general, surface water is the focus of greater studies (cf.
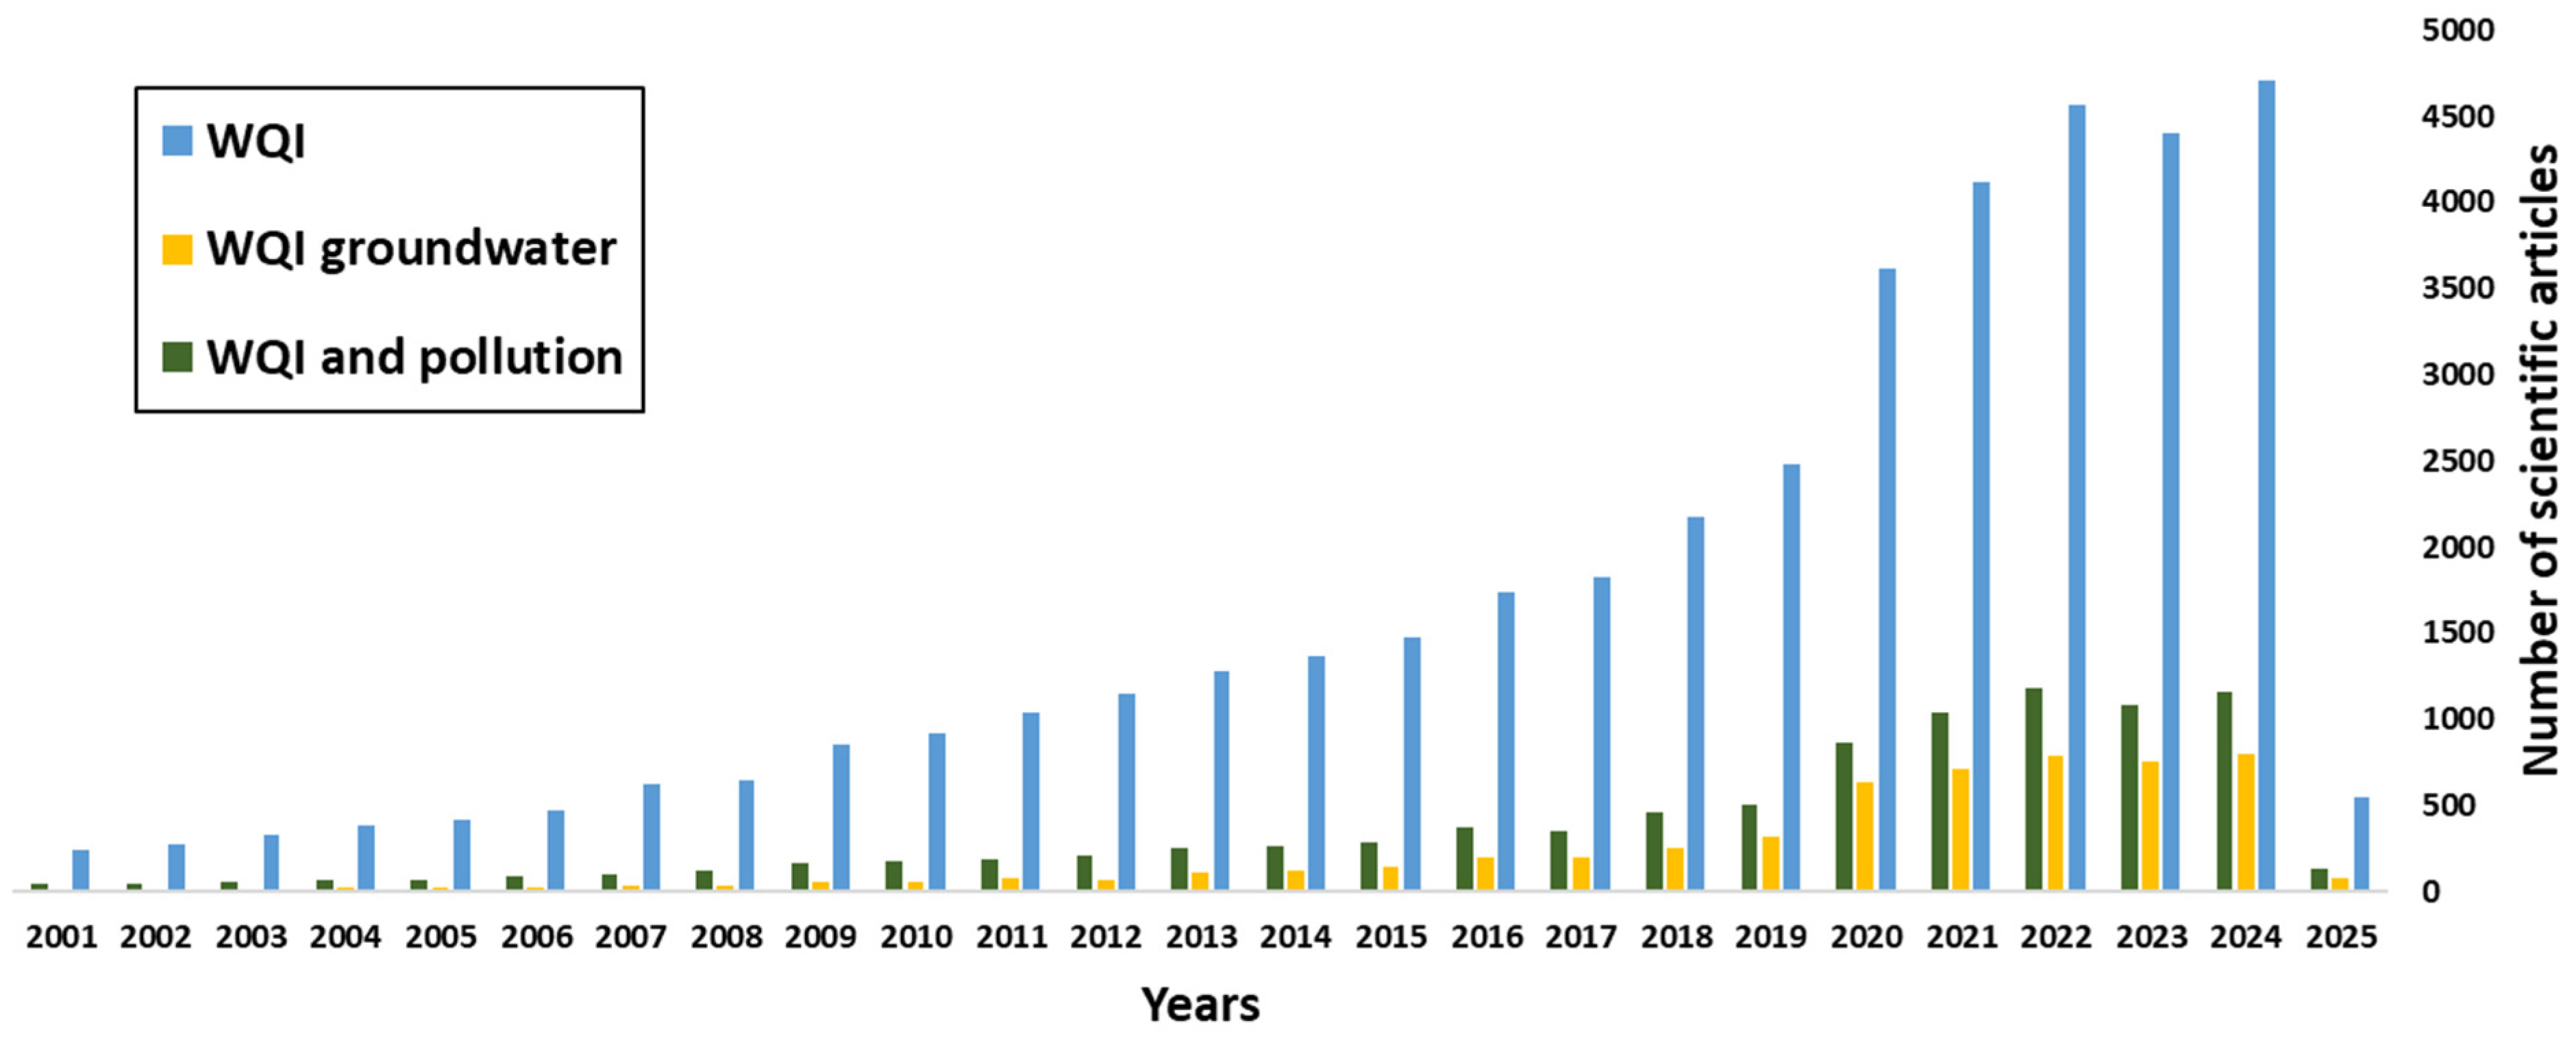
Figure 2). The issue of pollution is addressed in a diffuse manner, with no direct link established to its source. Recent years have seen an increased consideration of this aspect in a number of revised indices with pollution problems linked to industrial activities, but more specifically mining and the exposure of groundwater (the Taiwanese Liou Index, the WAWQI, the Metal Pollution Index (MPI), the Chemical Pollution Index (CPI), the NIP, the LWQI developed in Senegal and the PIG) [
20,
24,
32,
35,
36].
Despite advantages of these parameters, the literature has identified certain limitations, notably in the following:
The parameter selection and the specific weights, which are highly subjective. However, they are associated with water use (aquatic environment protection, human consumption, irrigation and recreative).
The aggregation and reduction of data. They can obscure a substantial proportion of the data and compromise the identification of the constituent elements impacting quality, the identification of the contamination source and the implementation of appropriate corrective measures [
18,
25,
30].
Several studies attempted to resolve or reduce the eclipse and cover shortcomings, but they remain specific and limited in complex sites [
37,
38,
39,
40,
41].
In Burkina Faso, the quality of groundwater requires special monitoring given that it is mainly used in rural areas for supplying drinking water. While the quality of groundwater and surface water evolves according to the geological context, mining activity exacerbates this evolution. Furthermore, the conditions in which mining waste is deposited in this context are conducive to the spread of contaminants. The novelty lies in the determination of key parameters and the use of the index. Geospatial techniques and geochemical diagrams were used to detect the key parameters that have evolved alongside changes in land use and to reduce the aforementioned shortcomings in the selection of these parameters. The objective of this study is to propose a quality index that is specific to a mining area. It is built on the physical and chemical major and minor concentrations of surface water and groundwater, as well as on trace metals. This index could function as a monitoring tool for water quality, as well as serving as an alert system to encourage more effective management of associated mining infrastructures (e.g., pits, stopes, tailings dams and heap leaching zones).
2. Materials and Methods
2.1. Site Location and Climate
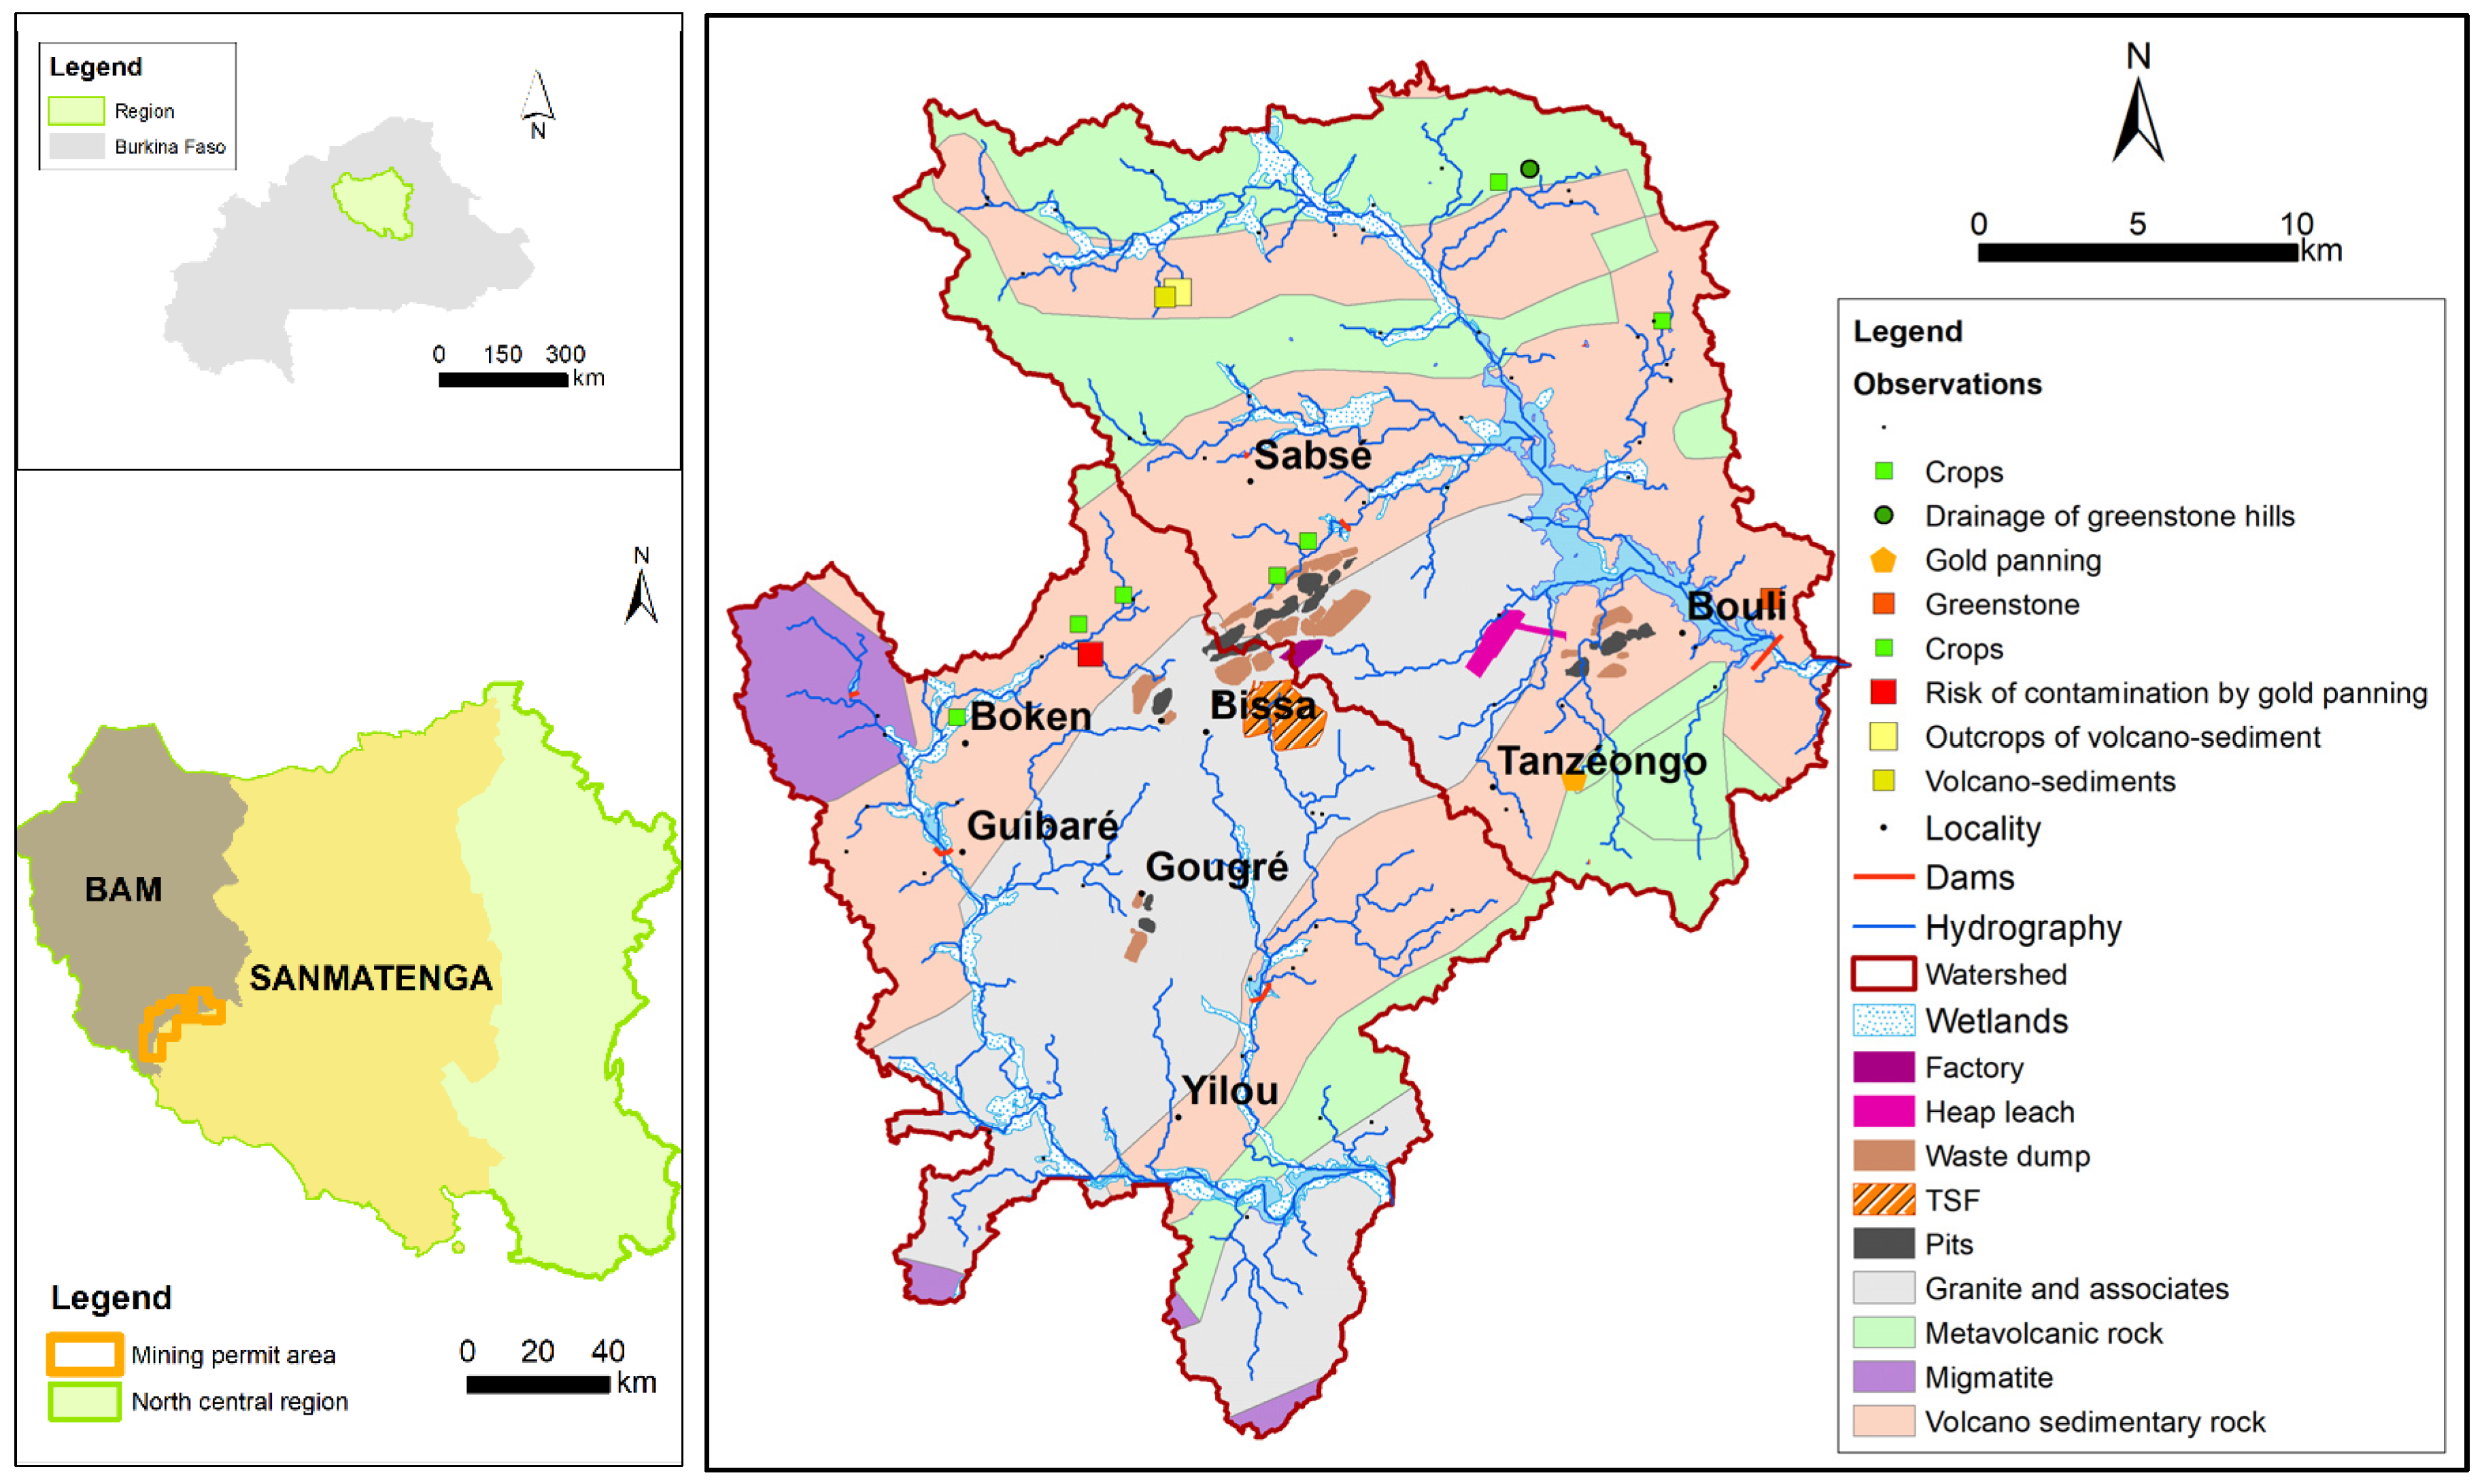
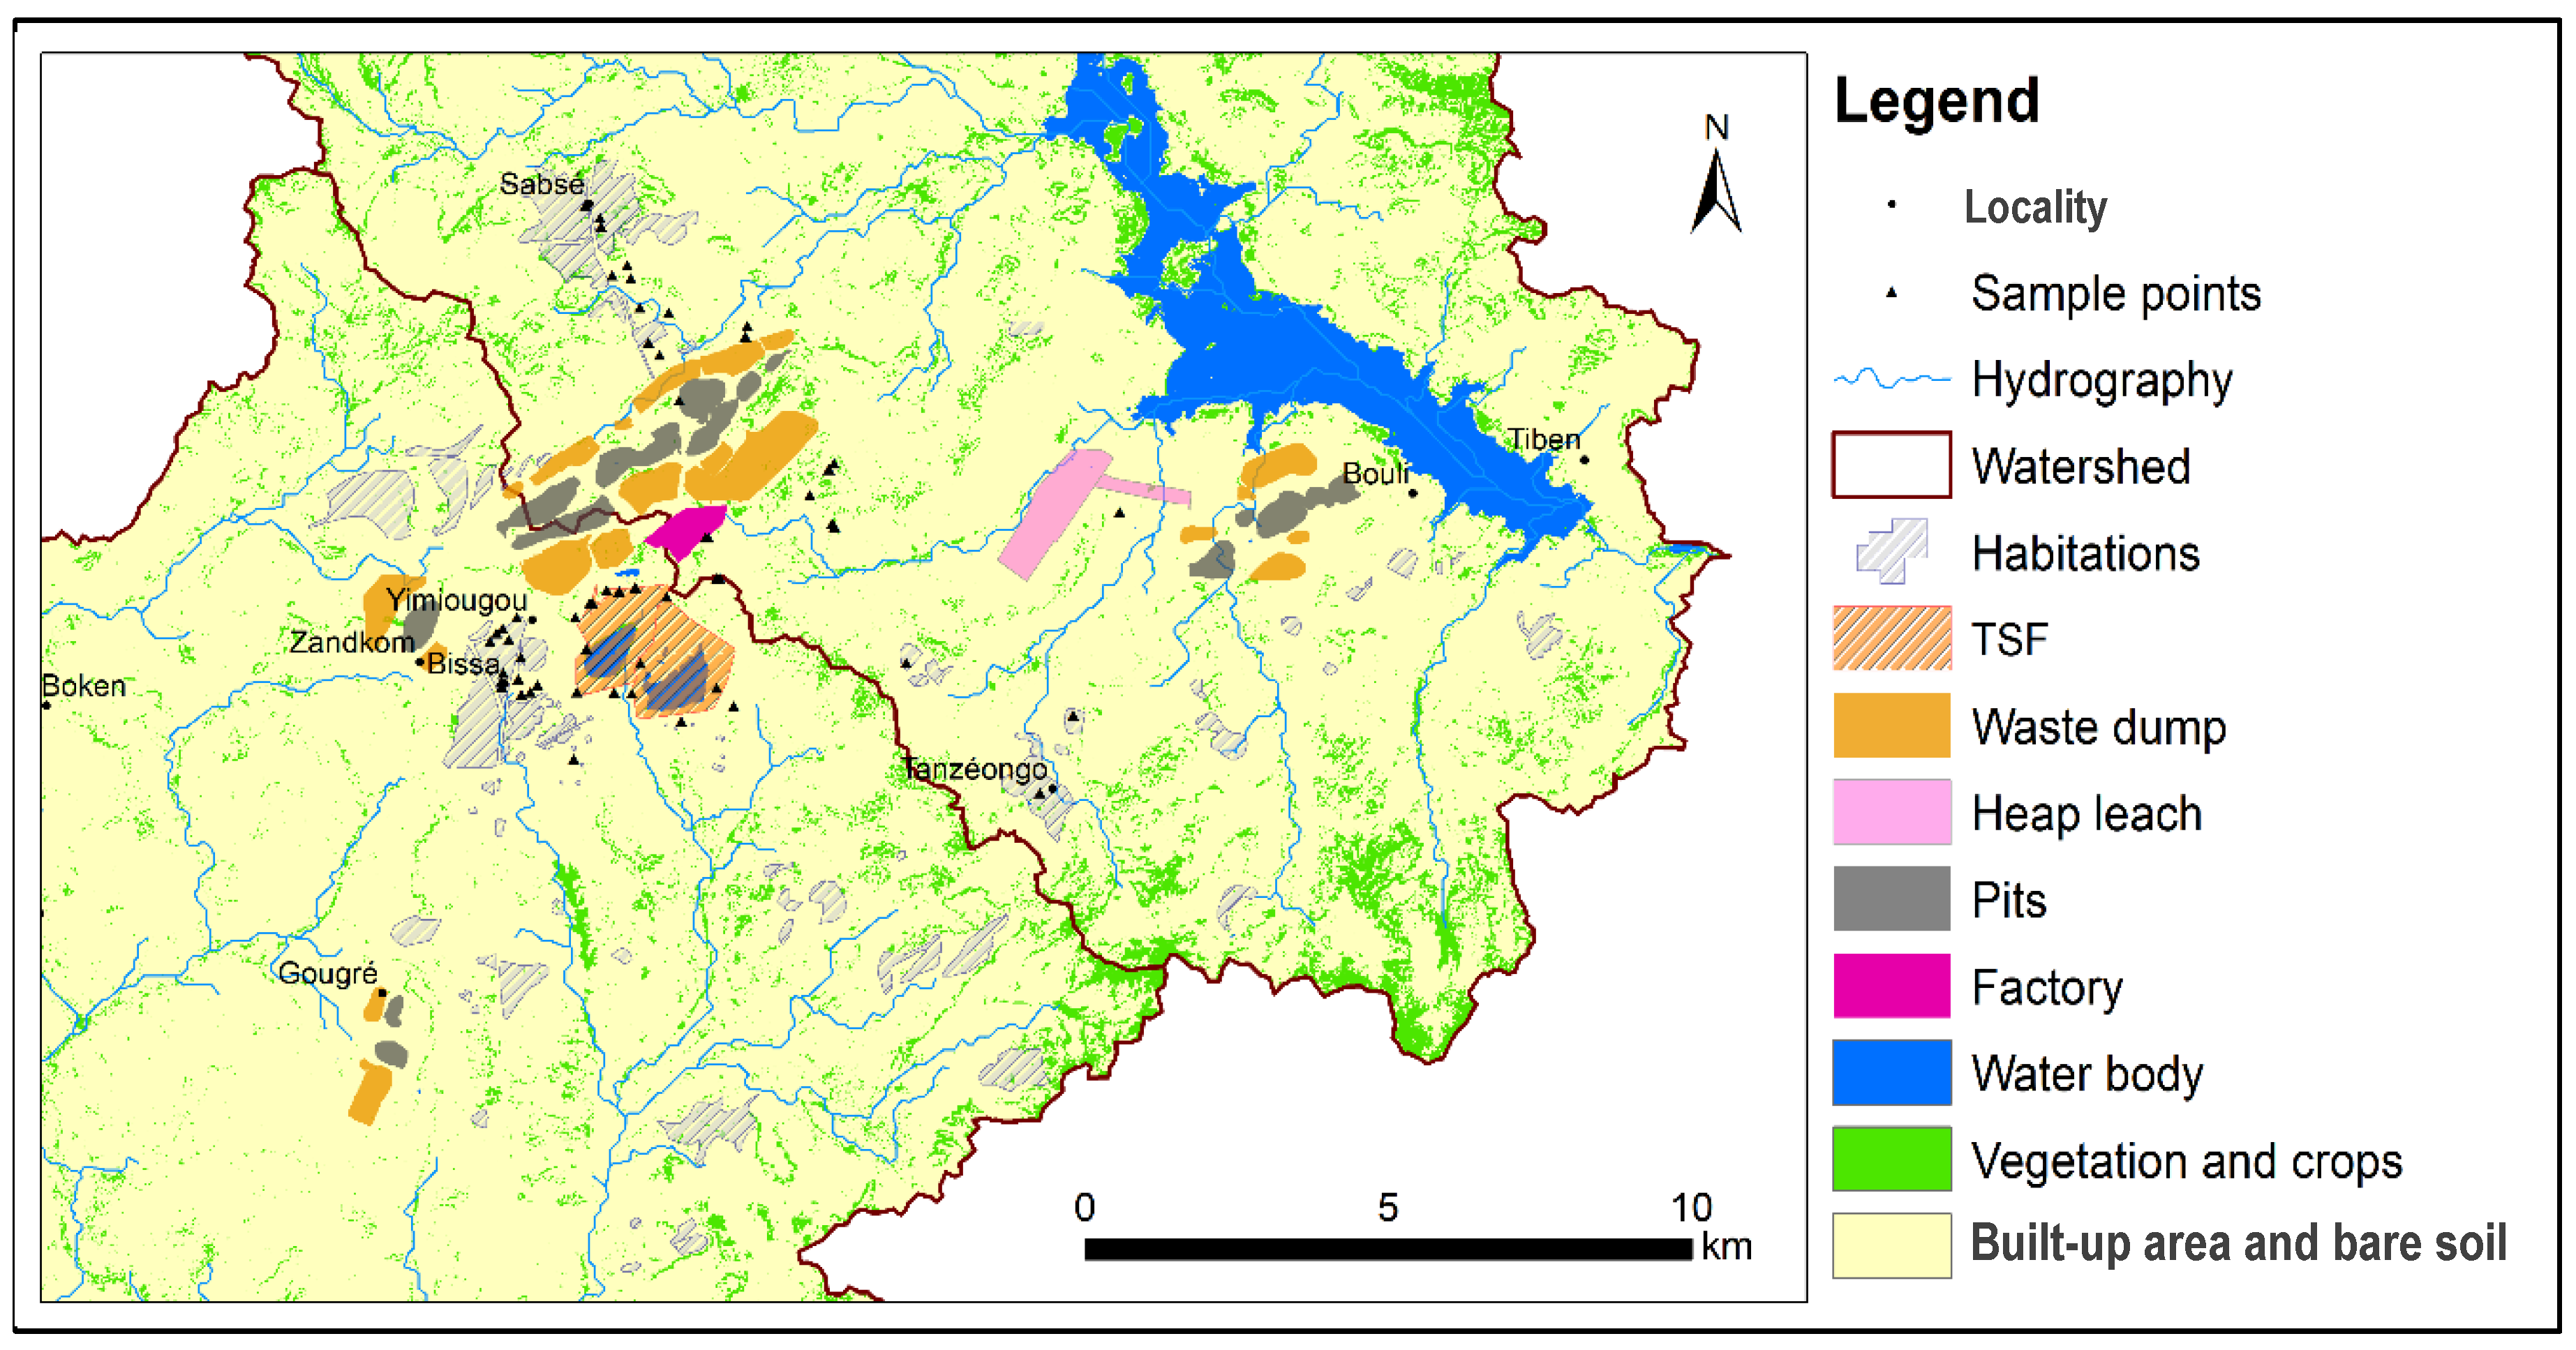
The geographical area under scrutiny (cf.
Figure 3) is situated in the north–central region of Burkina Faso, a country in West Africa. It is situated within the boundaries of two provinces: Bam and Sanmatenga.
The region’s climate is classified as sub-Saharan, occupying a transitional zone between the Sudanian and Sahelian climates. In common with the remainder of the country, it is distinguished by the presence of two distinct seasons, and the average annual rainfall fluctuates between 600 and 500 mm. First is a long dry season that persists for a period of November to May (7months), characterised by elevated temperatures (in excess of 40 °C) and the presence of a dry wind, the harmattan. Second is a short rainy season that extends for a duration of 5 months (June to October) [
42]. The combination of high temperatures and low vegetation cover means that the average annual evaporation rate exceeds 2000 mm. The arid climate is characterised by sparse tree and savannah vegetation, with gallery forests along watercourses. It is located in the upper Nakanbé basin, the most extensive watershed of the country, a sub-basin of the Volta River.
Despite this arid climate, more than 80% of the population derives its income from agriculture, with the majority of crops being cultivated during the rainy season. Irrigation for off-season crops is facilitated by dams.
2.2. Geological–Hydrogeological Context
The study area is located at the north-eastern edge of the Boromo greenstone belt, which is one of the Lower Proterozoic (Birimian) greenstone belts. The region is characterised by the north-east-trending Sabcé shear zone, which is a prominent tectonic structure. This shear zone is seen to extend through a volcano-sedimentary sequence located along the north-western margin of the Kogkoundi granodiorite. The zone is distinguished by the presence of basic to intermediate volcanic rocks and clastic sedimentary rocks. The major geological units of the mining permit show that the Birimian terrains were deposited and emplaced between 2.2 and 2.1 Ga [
43].
The presence of gold mineralisation is closely associated with the presence of organised networks of quartz veins, which contain subordinate carbonates, tourmaline and sulphides. Gold is found in association with sulphides disseminated in highly deformed alteration zones. The geology at the pit reveals the presence of meta-andesite, schistose meta-andesite, diorite and transition zones, in association with sediments such as arkose, sandstone and argillite.
The watercourses are temporary and dependent on rainfall, and a dozen or so water bodies of varying size have been identified. The utilisation of these resources is primarily for the purpose of irrigation and the provision of water for animal consumption.
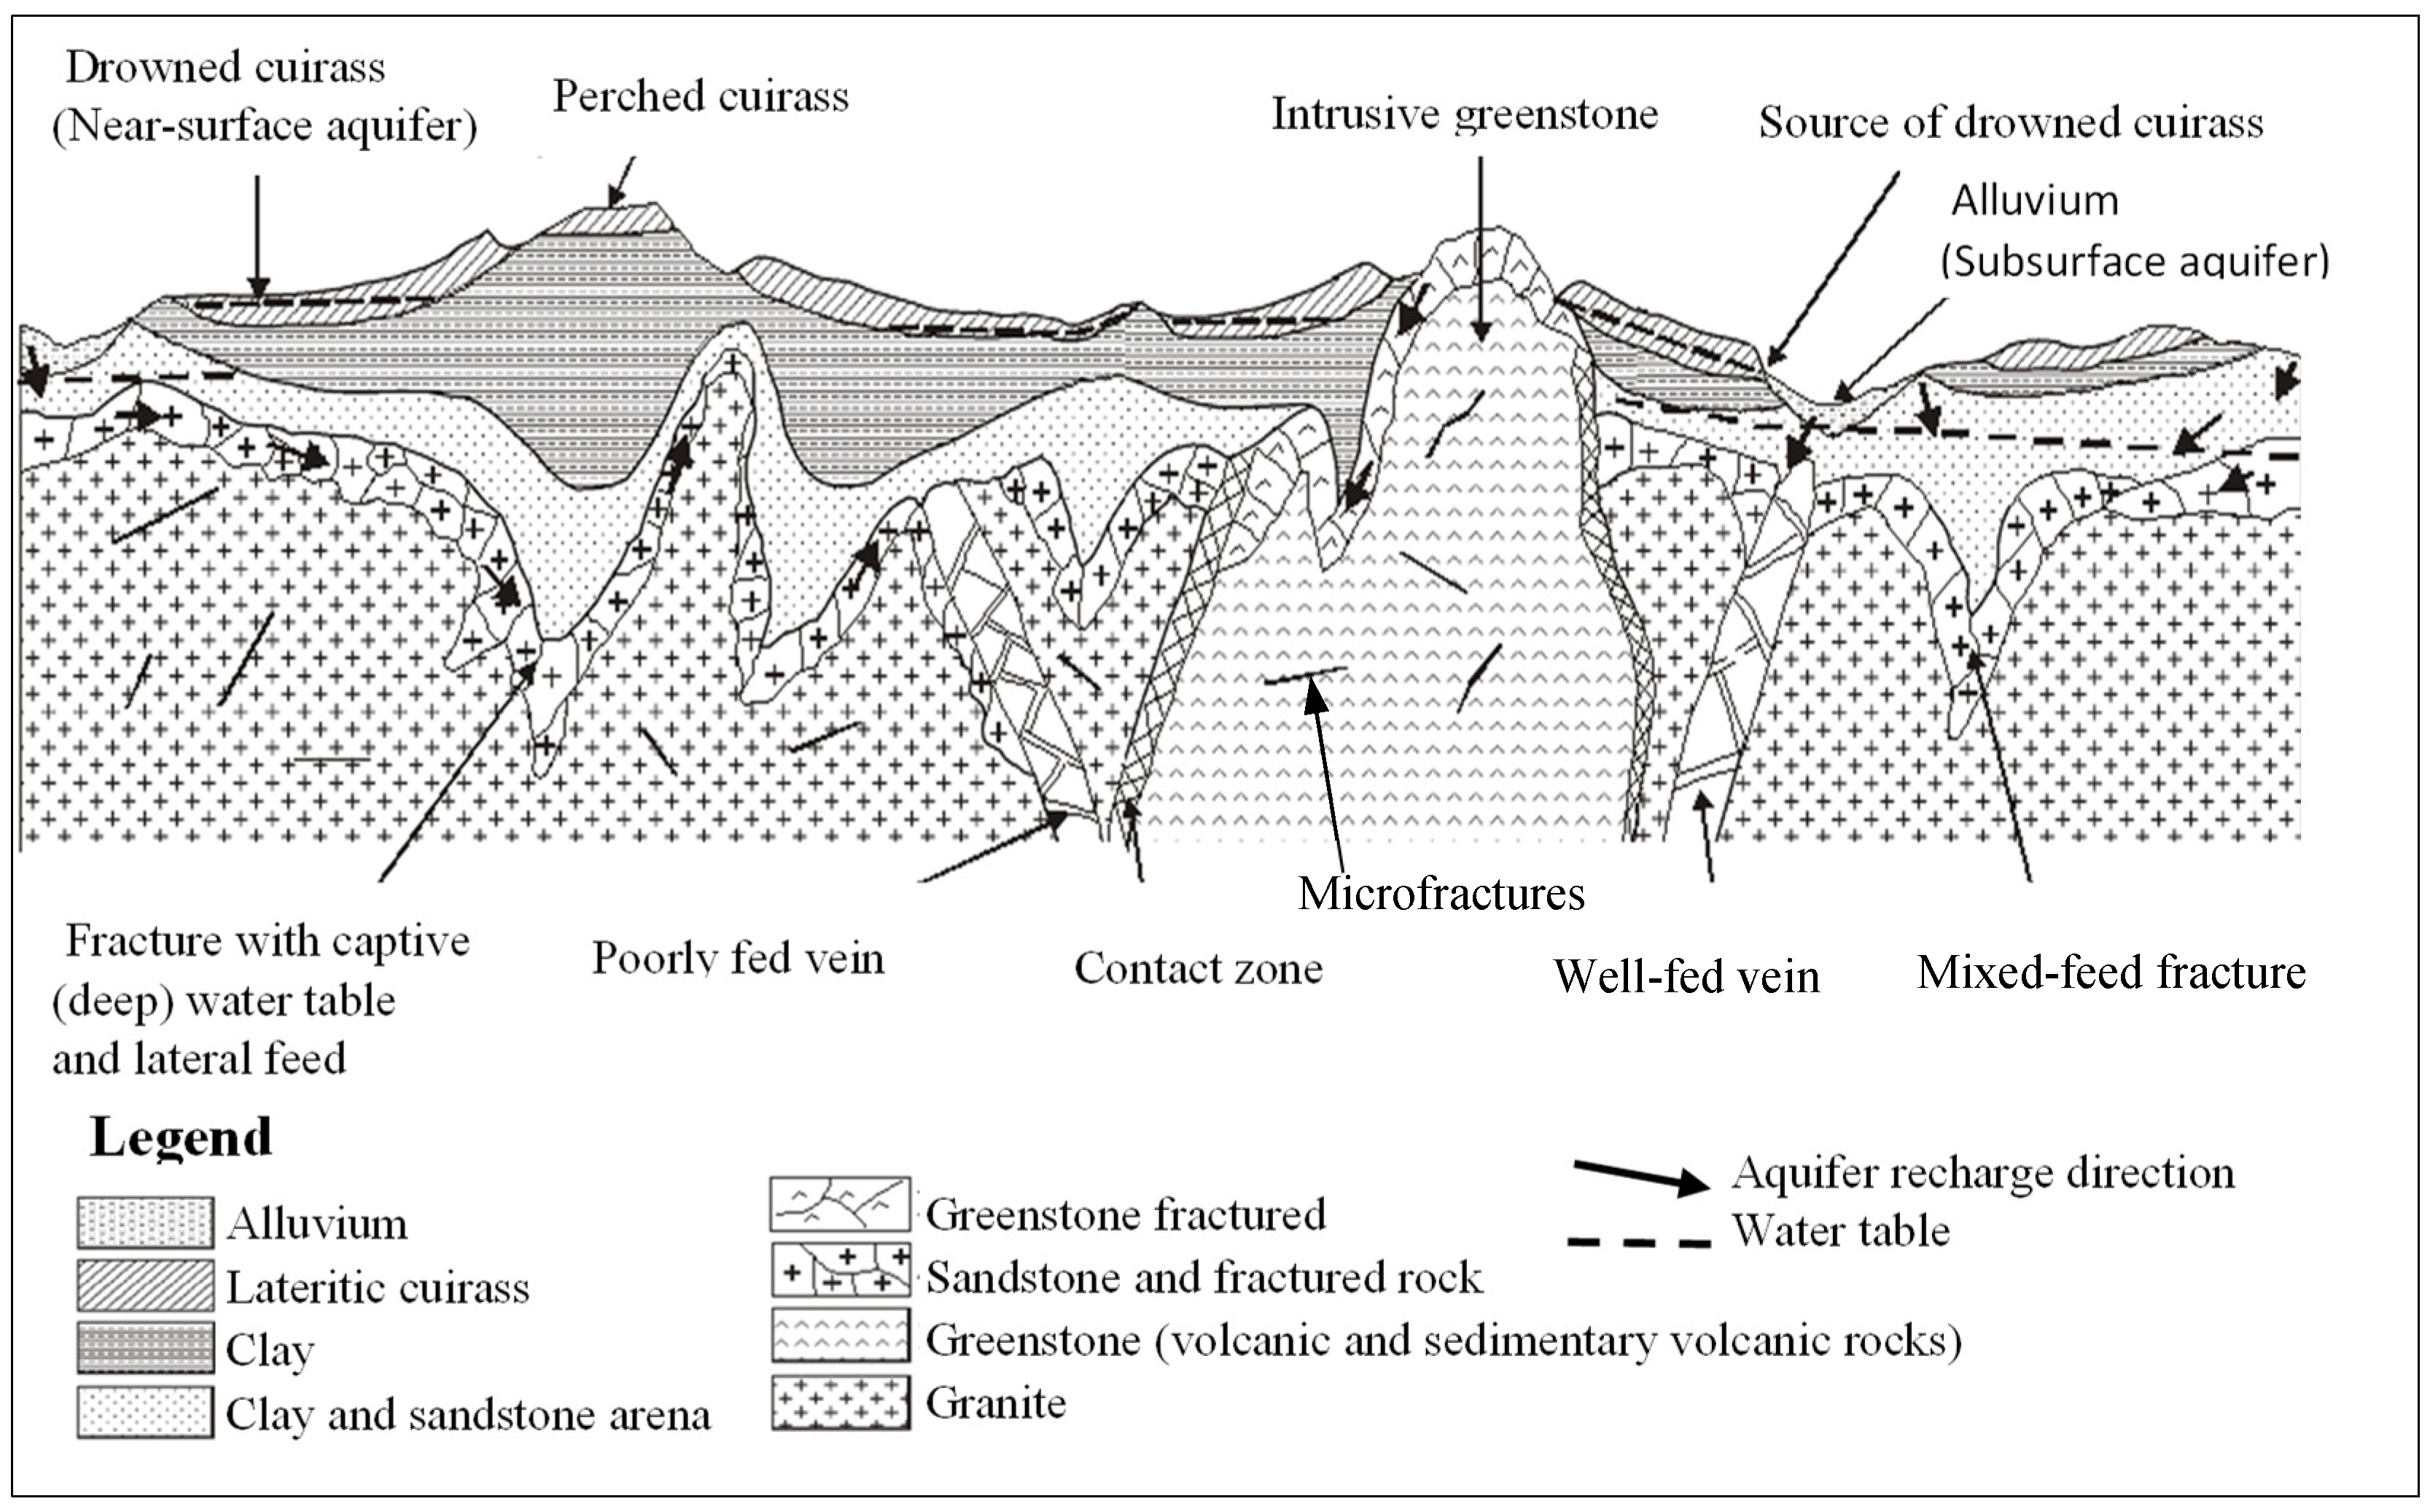
The population’s water supply is primarily derived from groundwater captured by boreholes and wells. Three (03) aquifer types have been identified (cf.
Figure 4), which are linked to major hydrogeological complexes [
44,
45].
The development of the two subsurface aquifers (the alluvial water table in the axis of the river beds and the water table at the base of the lateritic cuirass, the more or less clayey alterite arena water table) has been facilitated by the construction of shallow, large-diameter wells (more than a hundred wells have been counted by Burkina Faso’s General Directorate for Water Resources [DGRE]). The deep-water table, located in the fissured fringe of the rock, is tapped by boreholes that are necessarily equipped with hydraulic pumps.
In the study area, artisanal gold mining has been in development for approximately thirty years and represents a source of income that sustains many young people and farmers during the dry season. Over the past fifteen years, an industrial mine has been established, with significant socio-economic and environmental consequences. This is an open-pit mine, where the excavated material is processed to extract the gold. The extraction process utilised in this study is the CIL (carbon in leach) method, in conjunction with heap leaching. Since gold is associated with sulphides, it requires pre-treatment (autoclaving, roasting and roasting of ores, smelting and refining), which induces oxidation reactions that are exothermic [
46].
2.3. Mapping and Modelling Data
Spatial modelling was employed to illustrate land use and identify the distance from population centres and cultivated areas. It was also used to extract groundwater flow directions and assess geo-environmental vulnerability in relation to the location of the structures.
The land use map was constructed after calculating spectral indices (NDVI, NDWI, SAVI and NDBI) and digitising specific mine infrastructures (tailings ponds and heap leach zones). It shows a high concentration of industrial mining infrastructure (pits, waste rock piles, tailings facilities and heap leaching zones) alongside cultivated areas and villages and scattered settlements. The land cover map was created using November 2023 Sentinel 2 satellite images after calculating spectral indices such as NDVI, NDWI and SAVI and digitising specific infrastructures.
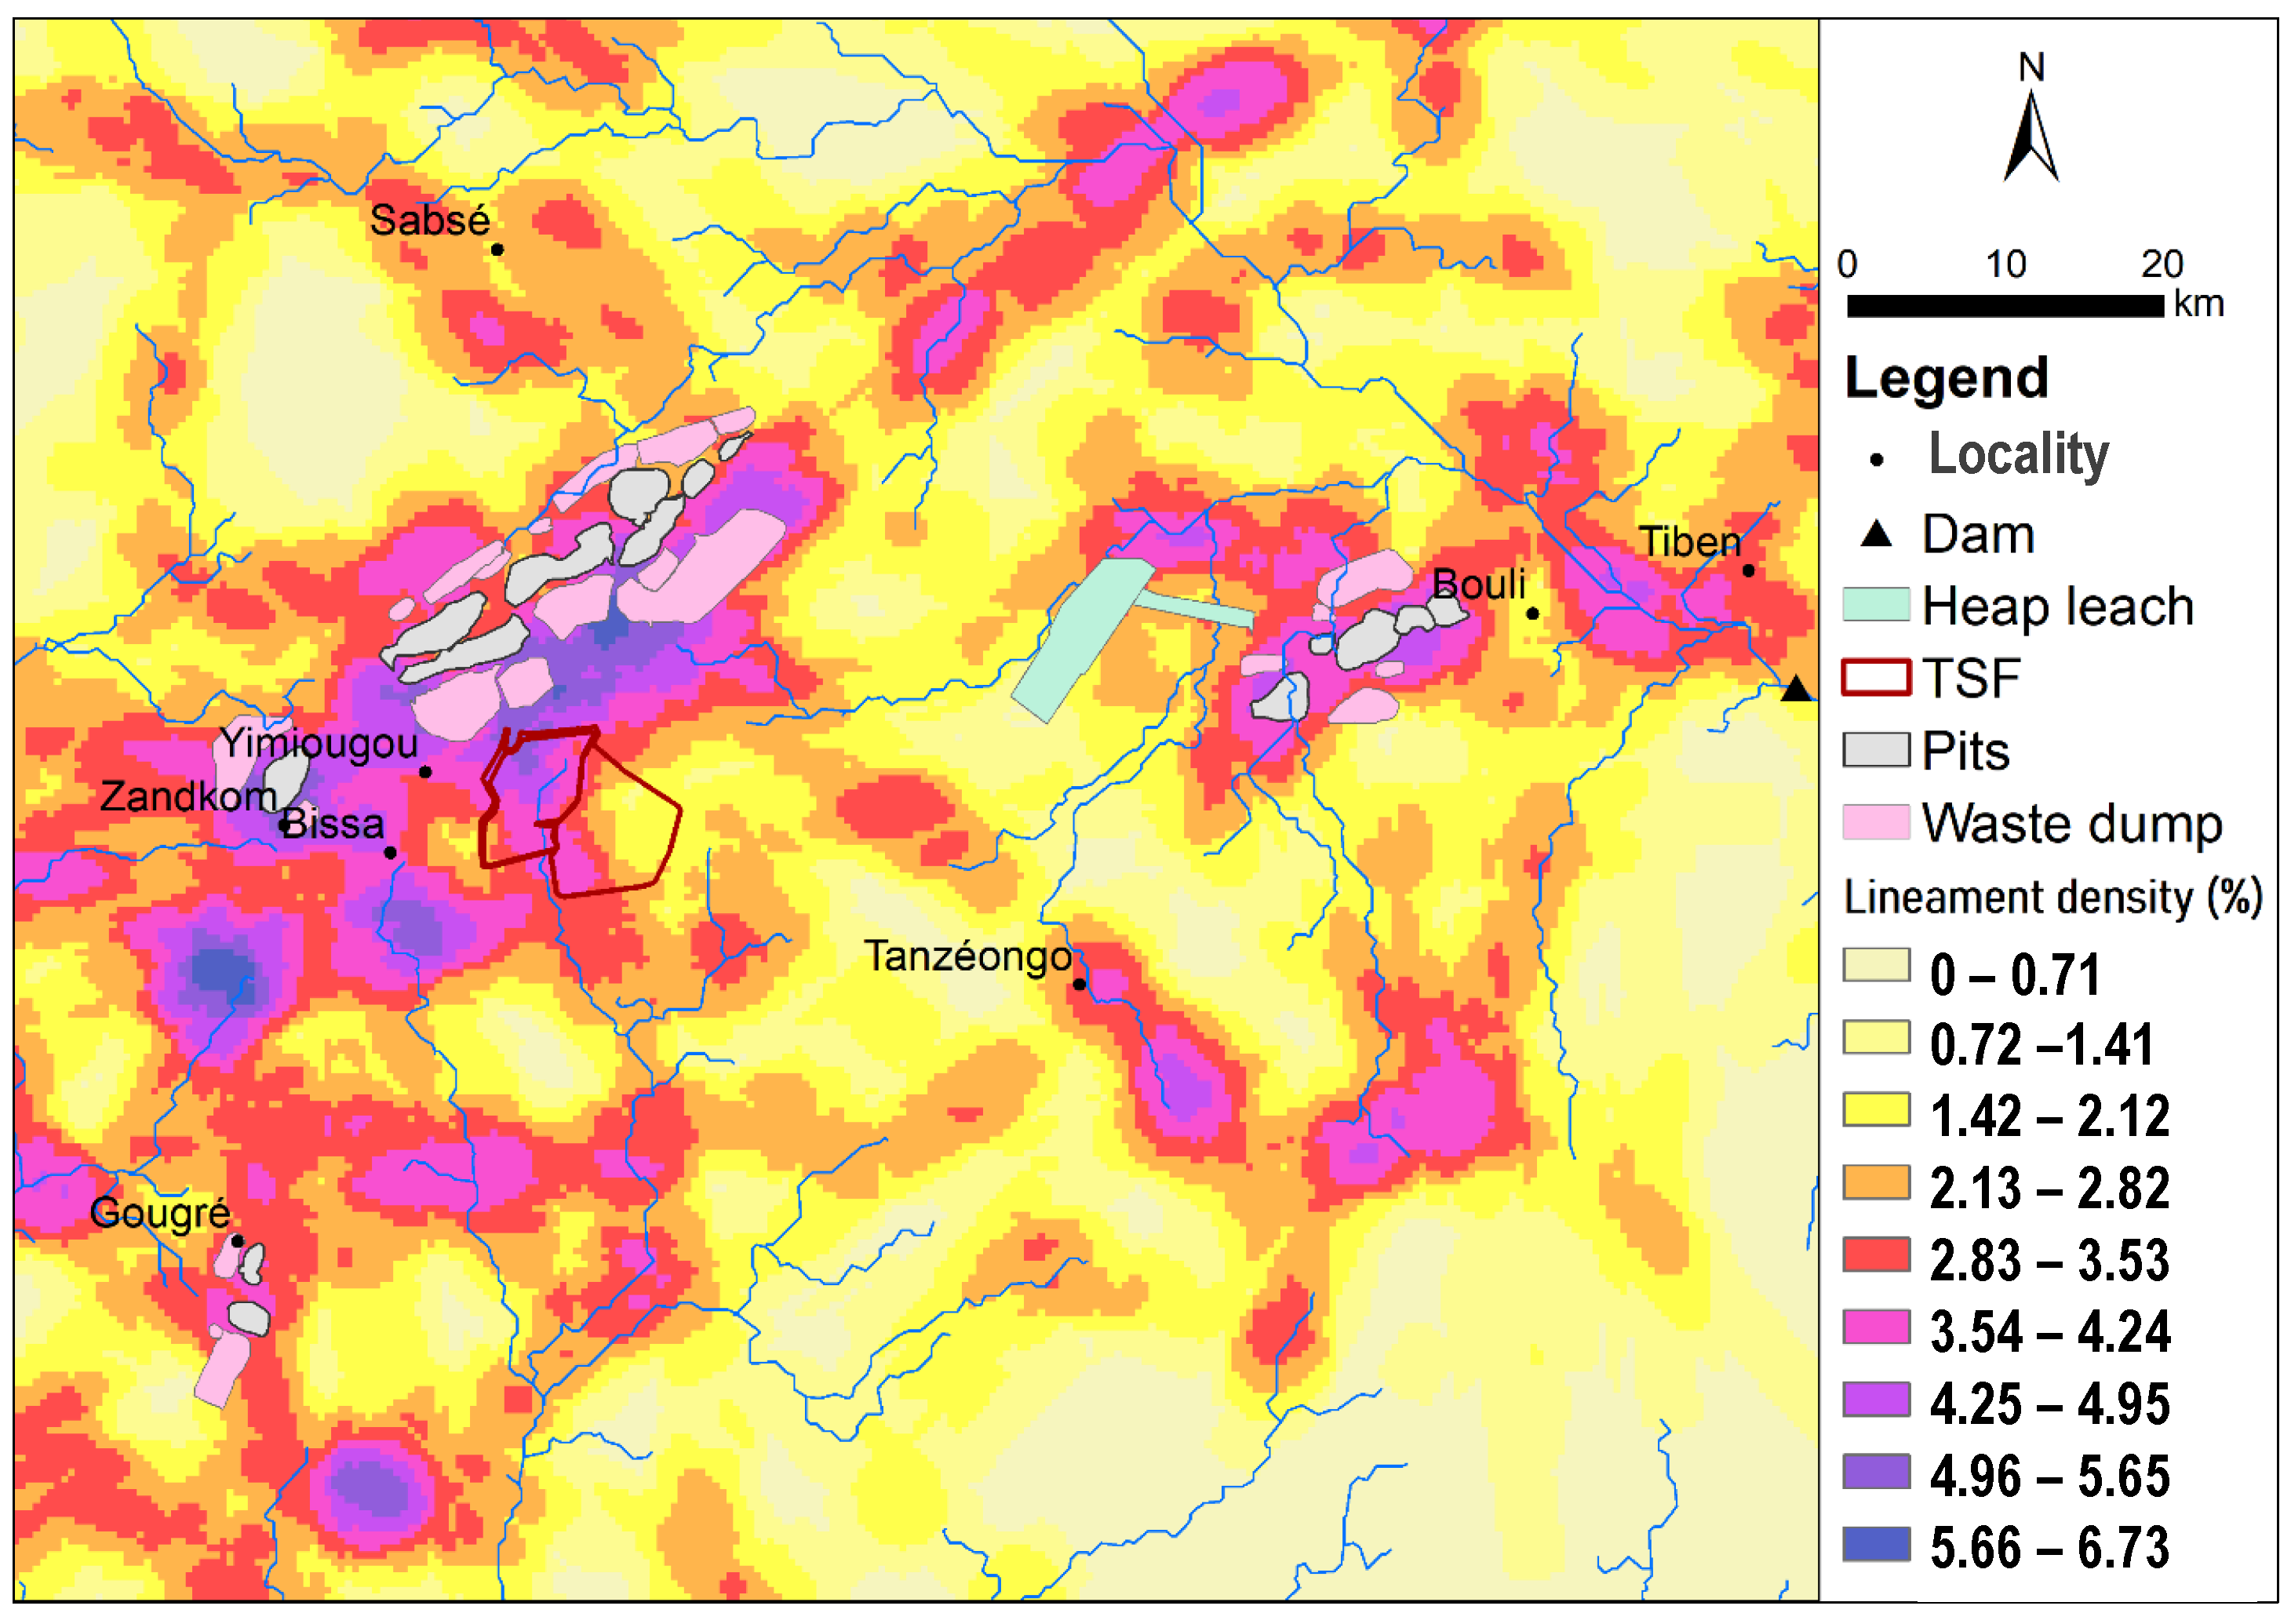
Extracts from Landsat 7 satellite imagery from October 2000 and Alos Palsar data were used to delimit the catchment areas and to extract the hydrographic network and the lineaments. The results obtained were processed to obtain the density of the lineaments and to identify their main directions.
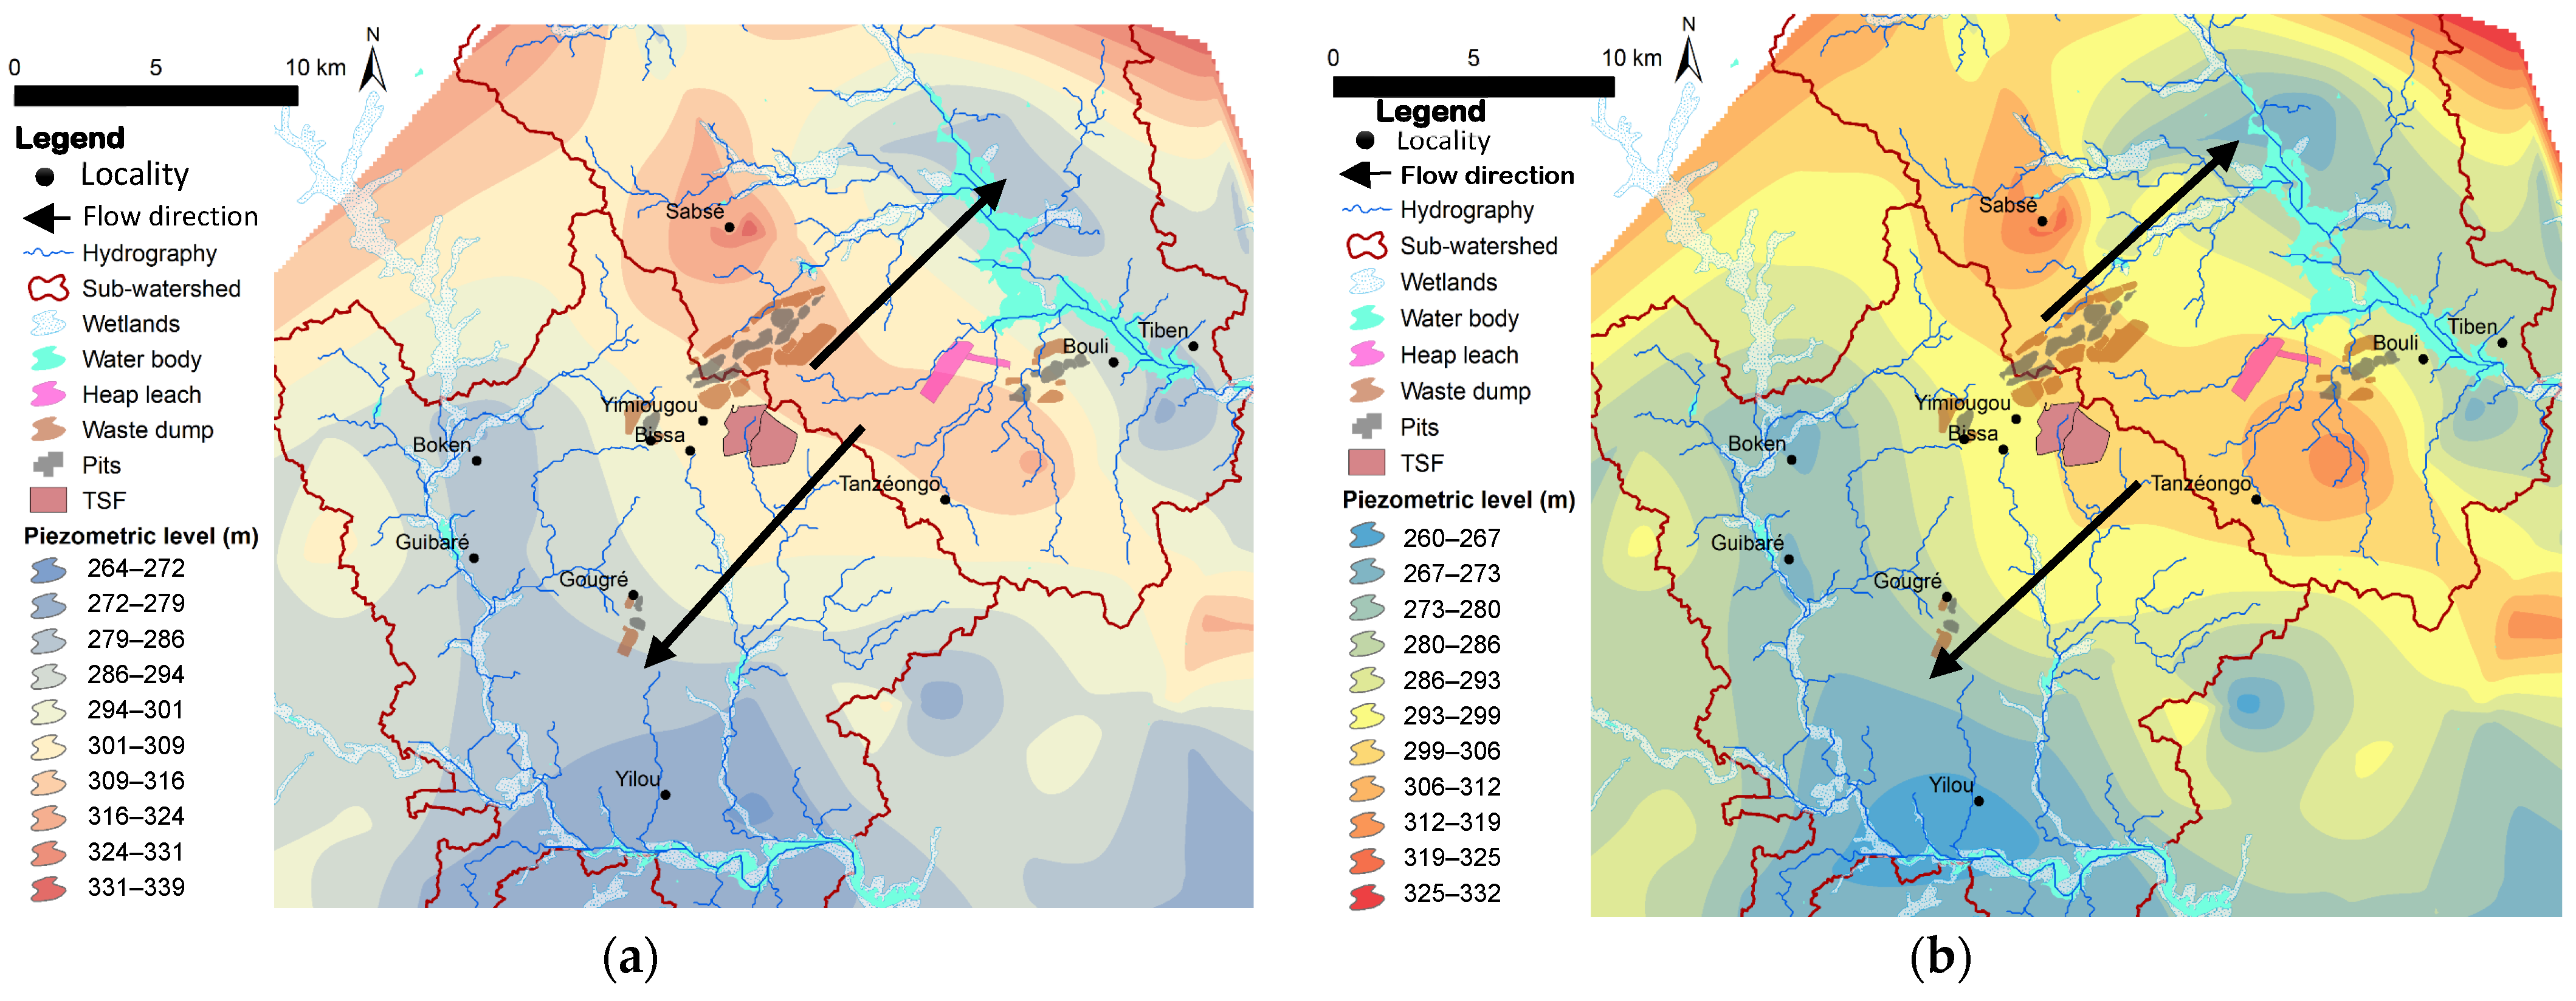
A total of 80 well data points pertaining to water levels were retrieved from the DGRE’s INOH (Inventaire National des Ouvrages Hydrauliques) database and subsequently extracted from the Shuttle Radar Topography Mission (SRTM) Digital Elevation Model of 2013 [
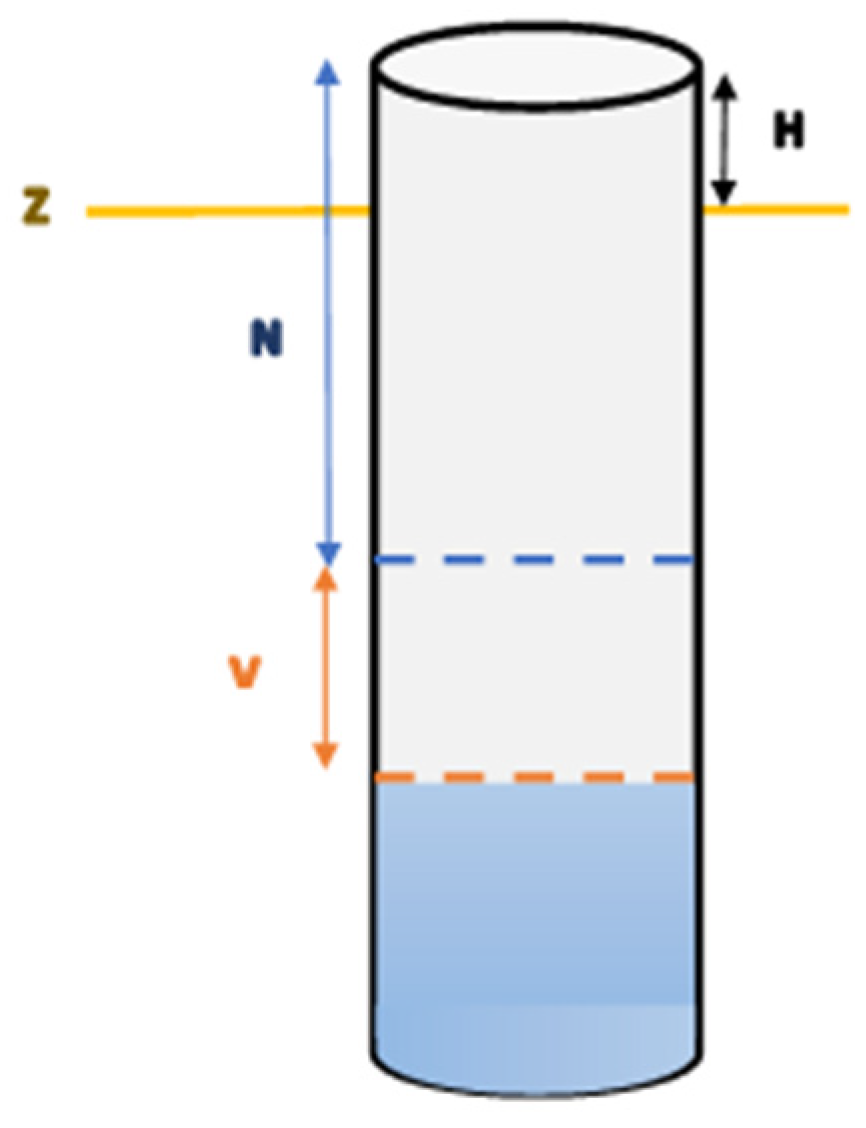
47], with 90 m geometric precision. These data were used to extract the preferential direction of groundwater flow during periods of high and low water levels, distinguishing between dry and wet seasons. The piezometric levels (high and low, cf.
Figure 5) were calculated:
Z = MNT rating (m) (30 m resolution);
N = high water level;
V = maximum variations in groundwater depths;
H = coping height.
The piezometric data was then interpolated using the nearest neighbour method. The topography obtained can be used to deduce shallow groundwater flow lines. This approach facilitates the identification of areas that may be susceptible to groundwater contamination.
2.4. Water Sample Collection and Analysis
Two types of data were used: primary data collected on site in 2023 and 2024 and secondary data collected in reports and in the documentation of the industrial mine. It concerns surface water bodies (dams and gullies), rejects and groundwater. Samples were collected from various locations within the villages in the vicinity of the mining area, as well as from specific infrastructure such as tailings dams. The results of analyses of 06 rejects and 165 water samples taken from dams (04), boulis (04), wells (04), piezometers (08), the mine’s water distribution system (15) and boreholes (117) between 2021 and 2024 were used. Fifteen specific points are identified for the annual monitoring. The following methodologies (cf.
Table 3) are employed in the analyses.
2.5. Water Sample Data Analysis
The water samples gathered were analysed in labs, and we obtained important quality data on water quality. These data were analysed and organised in specific diagrams, and specific indices were calculated to understand the inter-relationship between the various parameters and the relationship with the mining reject and to compare the index with common indices used to assess water quality based on its intended use.
2.5.1. Statistical Analysis of Data
Furthermore, the samples were grouped by monitoring period year by year. In a second method, the analytic data were classified by water type (SW and GW): groundwater, surface water and treated water. A grouping by type of water (surface water, subsurface groundwater (wells), deep water (boreholes) and piezometers (which concern all groundwater) and treated water for mine supply) made it possible to link the physico-chemical parameters through the bivariate covariance matrix in order to highlight the links between the different variables and possibly identify the origin of certain parameters.
The covariance matrix is expressed as
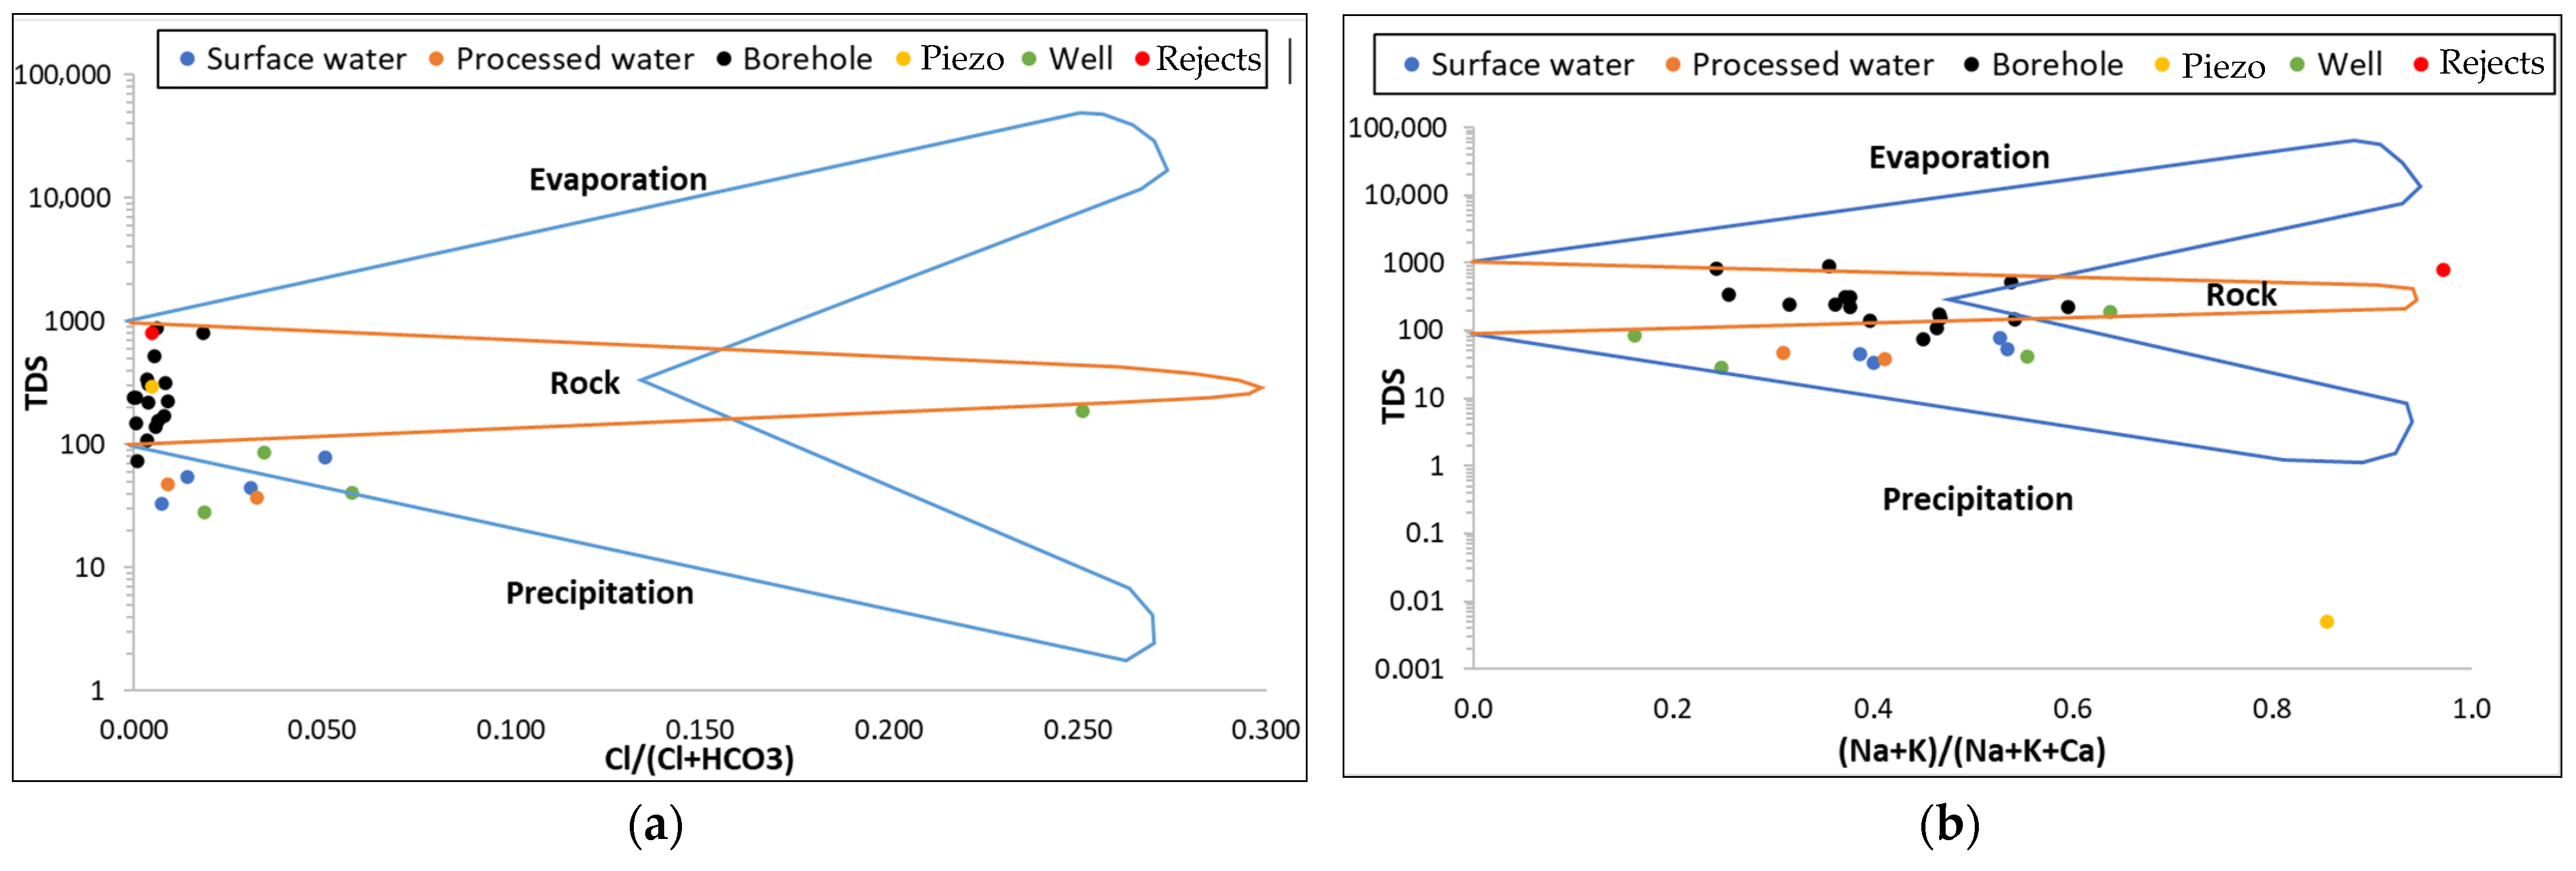
2.5.2. Chemical Water Types and Water Mineralisation Processes
Although initially designed to characterise the origin of surface water, the Gibbs diagram is now frequently used in the scientific literature to characterise the mineralisation of groundwater [
48]. It is used to determine the predominance of natural phenomena impacting water chemistry: evaporation, precipitation and water–rock interactions. Gaillardet diagrams have been used to improve interpretation, given that they do not reflect the origin of certain major ions such as sulphates and magnesium in groundwater [
48,
49,
50].
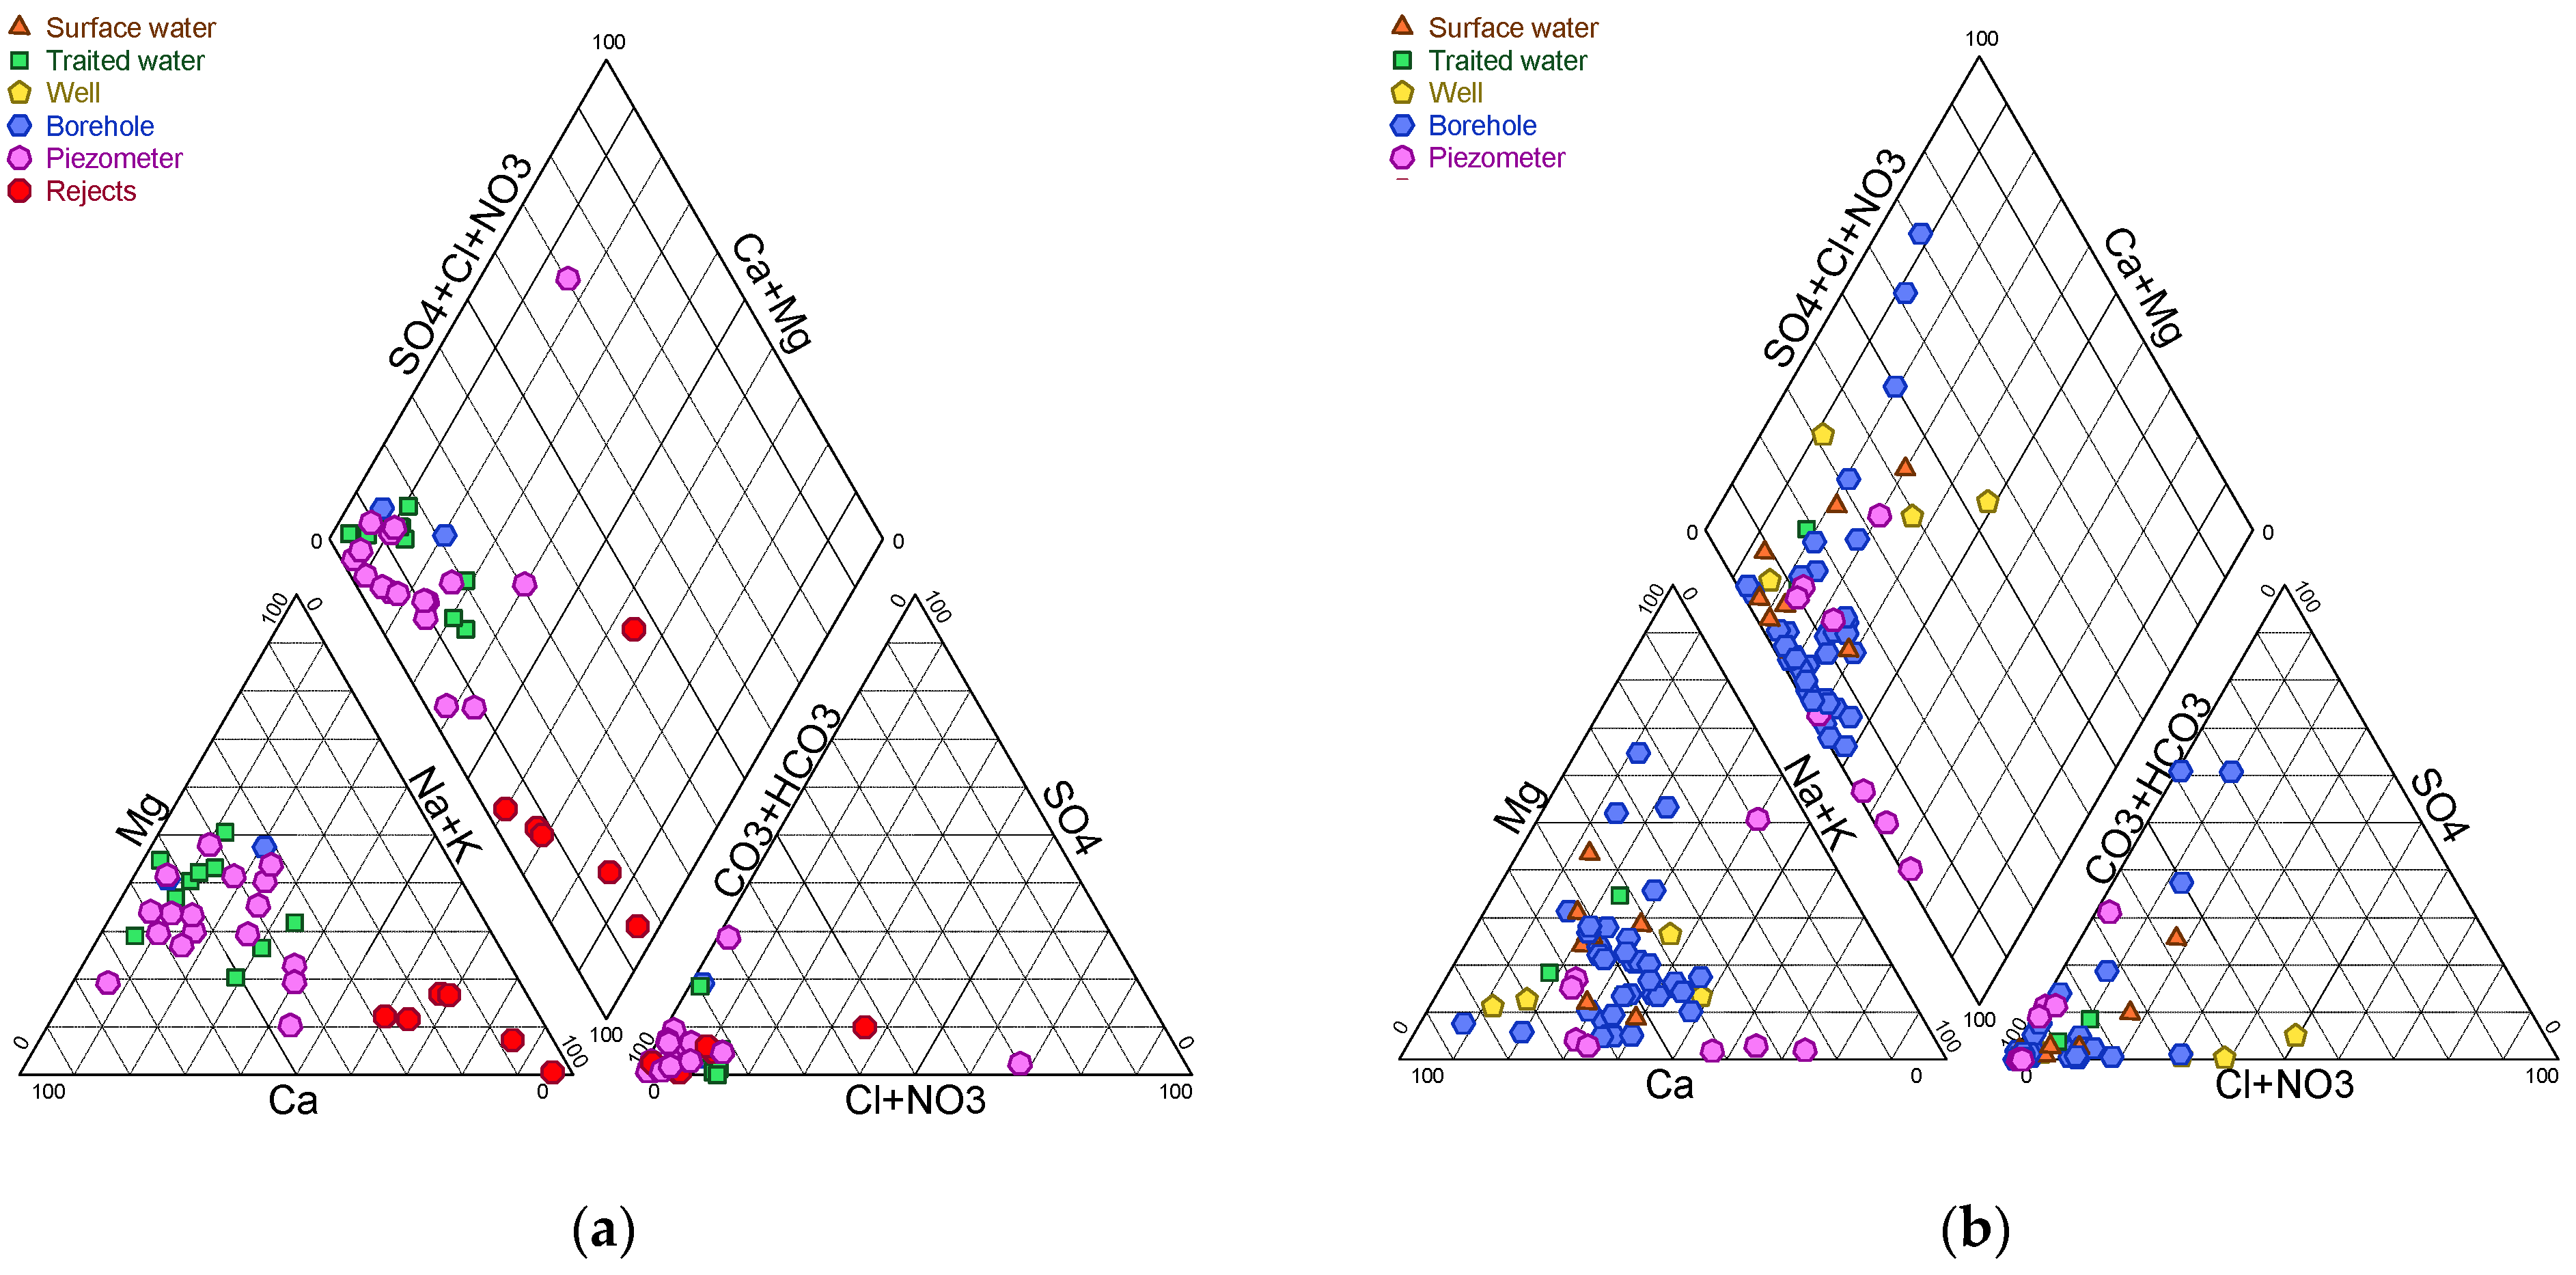
In order to identify the changes that have occurred as a result of the evolution of mining activity in the locality, a comparison was made between the physico-chemical facies and the facies presented during the projection of the mine’s extension in the commune of Bokin. For the purpose of this study, the Schoeler and Berkaloff–Piper diagrams, as well as the Stiff diagram, were used.
2.5.3. Suitability for Irrigation
A variety of indices are utilised for the assessment of the suitability for irrigation of the diverse waters sampled. The
SAR (Sodium Absorption Rate) diagram, alternatively designated as the salinisation/alkalinity risk index, is a classification system that assigns a quantitative value to the suitability of water for irrigation. This methodology is also employed by the Wilcox diagram.
where
Ca2+ = calcium concentration (mg/L),
Mg2+ = magnesium concentration (mg/L),
Na+ = sodium concentration (mg/L), and
K+ = potassium concentration (mg/L).
2.5.4. Risks for Borehole Infrastructures
The Ryznard index (
RI) is utilised to evaluate the aggressiveness of water towards water collection and distribution infrastructures.
pH = measured hydrogen potential;
pHS = saturation hydrogen potential of calcium carbonate with
where
Ca2+ = calcium concentration,
Mg2+ = magnesium concentration,
Na+ = sodium concentration,
C = empirical parameter as a function of temperature, and
D = empirical parameter as a function of
TDS (
).
2.5.5. Potability of Water
To assess the potability of the water, the parameters analysed were compared with the 2017 WHO guidelines. The present study focuses on indices linked to pollution associated with human activities and more specifically mining activity with regard to the potability of the water.
The
NPI has been modified to account for the cumulative effect of nitrates and nitrites.
where
concentration of nitrates (mg/L),
concentration of nitrites (mg/L), 50 mg/L corresponds to the threshold value for nitrates recommended by the WHO and 3 mg/L corresponds to the nitrites.
To classify water into three levels (good, average and poor), we based our approach on the Sanad et al. [
39] proposal, which set a threshold value of 20 mg/L for nitrates. We obtain the following results: good,
NPI less than 20/50; medium,
NPI between 20/50 and 50/50 (at risk for vulnerable people); and dirty water,
NPI greater than 50/50.
- 2.
Construction of Index
In order to identify an index adapted to our context (namely, industrial and artisanal mines, basement rocks and gold), we constructed a multiparametric index following the four steps identified in the construction of a similar index.
Parameter selection: the parameters identified for the creation of this index are based on changes in the physical and chemical properties of water, the identification of pollution sources and the correlation between these parameters and the composition of discharges/the nature of contaminants introduced by mining activity, such as mercury and cyanide. We selected parameters that may pose a risk to human health and the environment.
Sub-index: the calculation of individual indices is based on measured concentrations and the WHO threshold values for drinking water.
Si = threshold value in drinking water quality standards [
4];
Ci = concentration of the parameter in the sample.
It is able to be made dimensionless by removing the units. It is a function that increases as one moves away from the threshold value and is easy to assess.
Qi = 100: concentration at the threshold value;
Qi > 100: concentration above standard;
Qi ˂ 100: concentration below standard.
Weight: the identification of weights was based on the importance of the potential impact of each element on the environment and human health (adults and children). It is based on five criteria: (i) change factor associated with mining activity; (ii) risk to human health/environment; (iii) significant specific risk to the health of pregnant women/children; (iv) toxicity/cumulative nature in the environment; (v) heavy metals, non-volatile/low reactivity or induces the presence of other unidentified contaminants. The weights are noted from 1 to 5 and are brought back to a nominal value such as
This function is a linear function, increasing with homogeneous parameters.
This is the aggregation method proposed by Brown and used in several case studies related to groundwater (low Ci values). In this form of aggregation, the WQI is more sensitive to the highest Wj/Sj (weighting, reference threshold). This function reduces the contribution of each element to its Qi.
It assumes a cumulative toxic effect, even though in practice some combinations are more toxic.
Five (5) classes of IQWs are distinguished by an inverse relationship between index and quality, whereby higher indices are associated with poorer quality: excellent [0–25], good [25–50], poor [50–75], very poor [75–100] and improper [100–+∞].
4. Discussion
Land use and land cover (LULC) in our study area shows that potential sources of surface water and groundwater pollution are (i) residential areas (domestic water, latrines, domestic waste and livestock); (ii) seasonal crop areas (fertilisers, pesticides, herbicides and livestock); (iii) mining areas (rom pad, waste from the extraction process for small-scale and industrial mining) [
73]. The high density of fracturing in deposition areas, the presence of rocky outcrops, the partial protection of the tailings dams against infiltration and the composition of the stored tailings are factors that favour the transfer of contaminants to groundwater. Indeed, in fractured bedrock areas, fracturing plays an important role in infiltration processes [
74]. This result is consistent with that of Podorski, who showed using tritium as an indicator that aquifers in the Sahel region (which includes Burkina Faso) are more vulnerable to pollution from recent recharge [
75]. This risk is exacerbated by low ore grades, which cause significant ground movement. Erosion of extracted soil stored in spoil heaps, exposure of rock in open pits and the leaching zone all contribute to the transport of contaminants to surface water.
The local geochemical context is marked by a natural anomaly in metalloids and trace metals. Gold mineralisation is closely associated with sulphide materials (pyrite, chalcopyrite, arsenopyrite, etc.) enriched in arsenic. These conditions can produce acid drainage. Combined with other pollutants, they pose a major risk due to the location of infrastructure upstream of the Nakanbe River and on piezometric domes.
In 2010, at the time of the mine’s installation, groundwater analyses revealed concentrations of arsenic and antimony that exceeded the WHO-1993-1998a guideline values (As 0.01 mg/L and Sb 0.005 mg/L). Other heavy metals were below the detection limit of the method. Studies in the north of the country and in our study area show the geogenic nature of arsenic [
53,
76,
77]. The physical and chemical parameters of borehole water in 2013 indicated good quality [
78]. However, with the development of mining activities promoting chemical processing and the release of heavy metals into the environment, conditions are created for an increase in the concentration of arsenic and heavy metals in both surface water and groundwater. It has been determined that the rainy season is the most conducive period to the transport and spread of contaminants [
79]. This finding is supported by monitoring extending over several months.
In recent years, mercury concentrations have been detected in the region, indicating contamination linked to artisanal mining activities. Mercury is mainly used in artisanal and small gold mining extraction processes, as confirmed by the results of Donkor, Esdaile, Mulenga and Mason [
80,
81,
82,
83]. It has also been shown that West Africa has the highest level of aquatic Hg contamination on the continent, with a contribution of 50.2% [
83].
Monitoring of the levels of physico-chemical parameters and trace metals in water has identified non-compliance with WHO guidelines. These exceptional levels are thought to be linked to the development of industrial and artisanal mining activities. The parameters identified include iron, cadmium, cyanide, lead and manganese [
70,
84]. Indeed, the correlation matrix enabled distinguishing the parameters associated with mercury and cyanide originating specifically from mining activity. These results are similar to the non-compliance in heavy metal and turbidity recorded in Senegal in mining areas and Ghana mining areas [
36,
85]. The Pipper, Gibbs and Gaillardet diagrams facilitated the differentiation between distinct types of water (surface water, groundwater and discharges) and enabled the observation of the influence of discharges on various groundwater. This investigation has identified a parameter that is rarely considered in the impact of mining activity on water resources: sodium. This parameter is often linked to the WQI used for agriculture [
25]. The transfer of these elements into the water resulted in surpluses that precipitated changes in the facies of the groundwater. Indeed, such changes are frequently associated with external inputs that disrupt pre-existing internal balances [
86,
87,
88]. The new sodium and potassium bicarbonate facies are influenced by anthropogenic activities but more specifically by mining activities. A comparable observation of sodium anomalies is made in the work of Djahadi and Nikièma [
89,
90] in wells in the Tikaré area north of the study area and in Niger, demonstrating the impact of anthropogenic activities on water quality. This anomaly, as observed in the composition of mining waste in tailings dams, is associated with the use of sodium cyanide (
NaCN), which releases sodium in ionic form into the stored tailings. The reaction of gold with
NaCN is presented by the following equation:
These results are reinforced by those presented in the Gibbs and Gaillardet diagrams, which show an upward trend in the ratio (Na
+ + K
+)/(Na
+ + K
+ + Ca
2+). This phenomenon indicates a reverse ion exchange between Ca
2+ and Na
+ associated with clay aquifers and/ or chemical contamination [
91,
92,
93]. However, the waters of piezometer 2023B05, which exhibit a low TDS indicative of minimal alteration, suggest a recent infiltration of waters stored in the tailings pond. This finding suggests that the presence of Na
+ may be attributable to the presence of chemical substances employed during the ore processing procedure (CIL and heap leaching methods). Recent studies in Burkina Faso have revealed the presence of widespread contamination by cyanide in artisanal mining areas [
94].
In a similar manner, the transition towards chlorinated and sulphated facies is accompanied by the presence of a group of anions, namely
, which are found in remarkably elevated concentrations as a consequence of anthropogenic activities (household waste, agricultural waste and livestock farming). These anions are also associated with the arid climate, which results in the formation of evaporites in situ. Indeed, as demonstrated by Kabore et al. despite the general improvement in rainfall in the country after the droughts of the 1970s and 1980s, significant spatial disparities remain, with some localities (such as Kongoussi since 2005 in the study area) still experiencing severe drought [
42]. Furthermore, sulphates are specifically linked to the hydrolysis of silicates and, on the other hand, to sulphides in gold ore. The high nitrate concentrations recorded, reflected in the high NPI values, are associated with several natural and anthropogenic factors (domestic waste, agriculture and waste from mining sites) [
95,
96,
97].
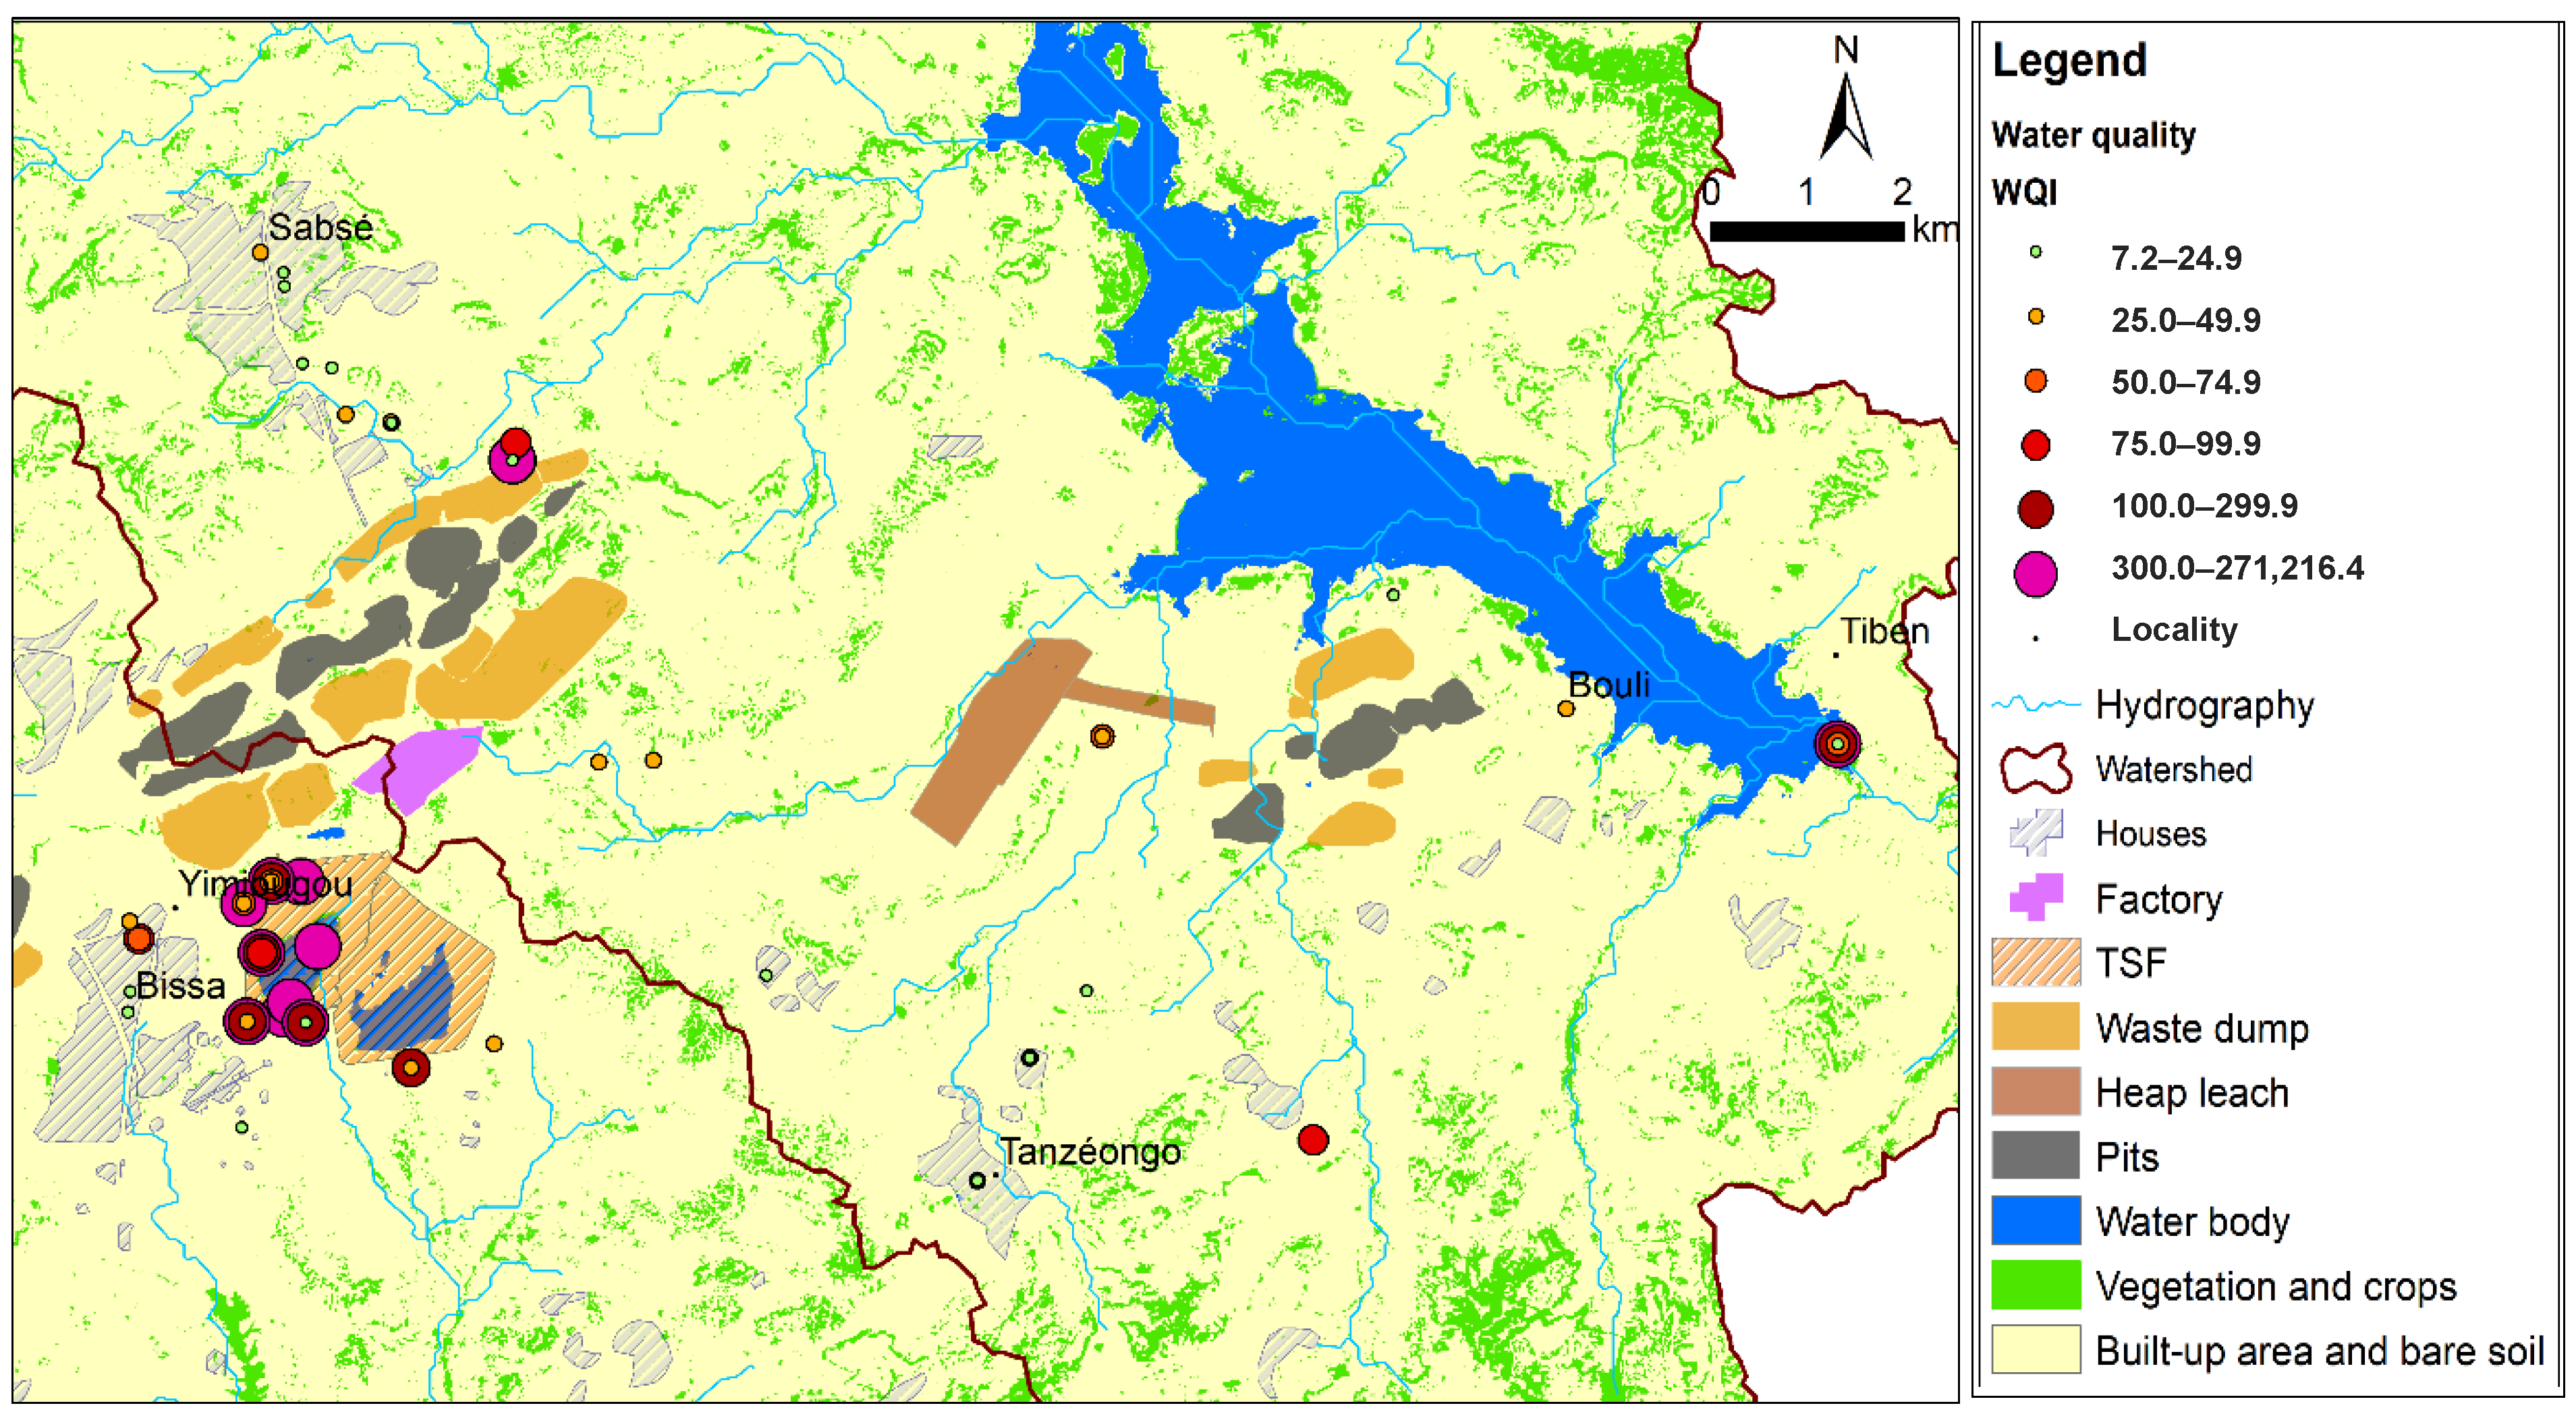
The spatial distribution of the WQI presents index values of
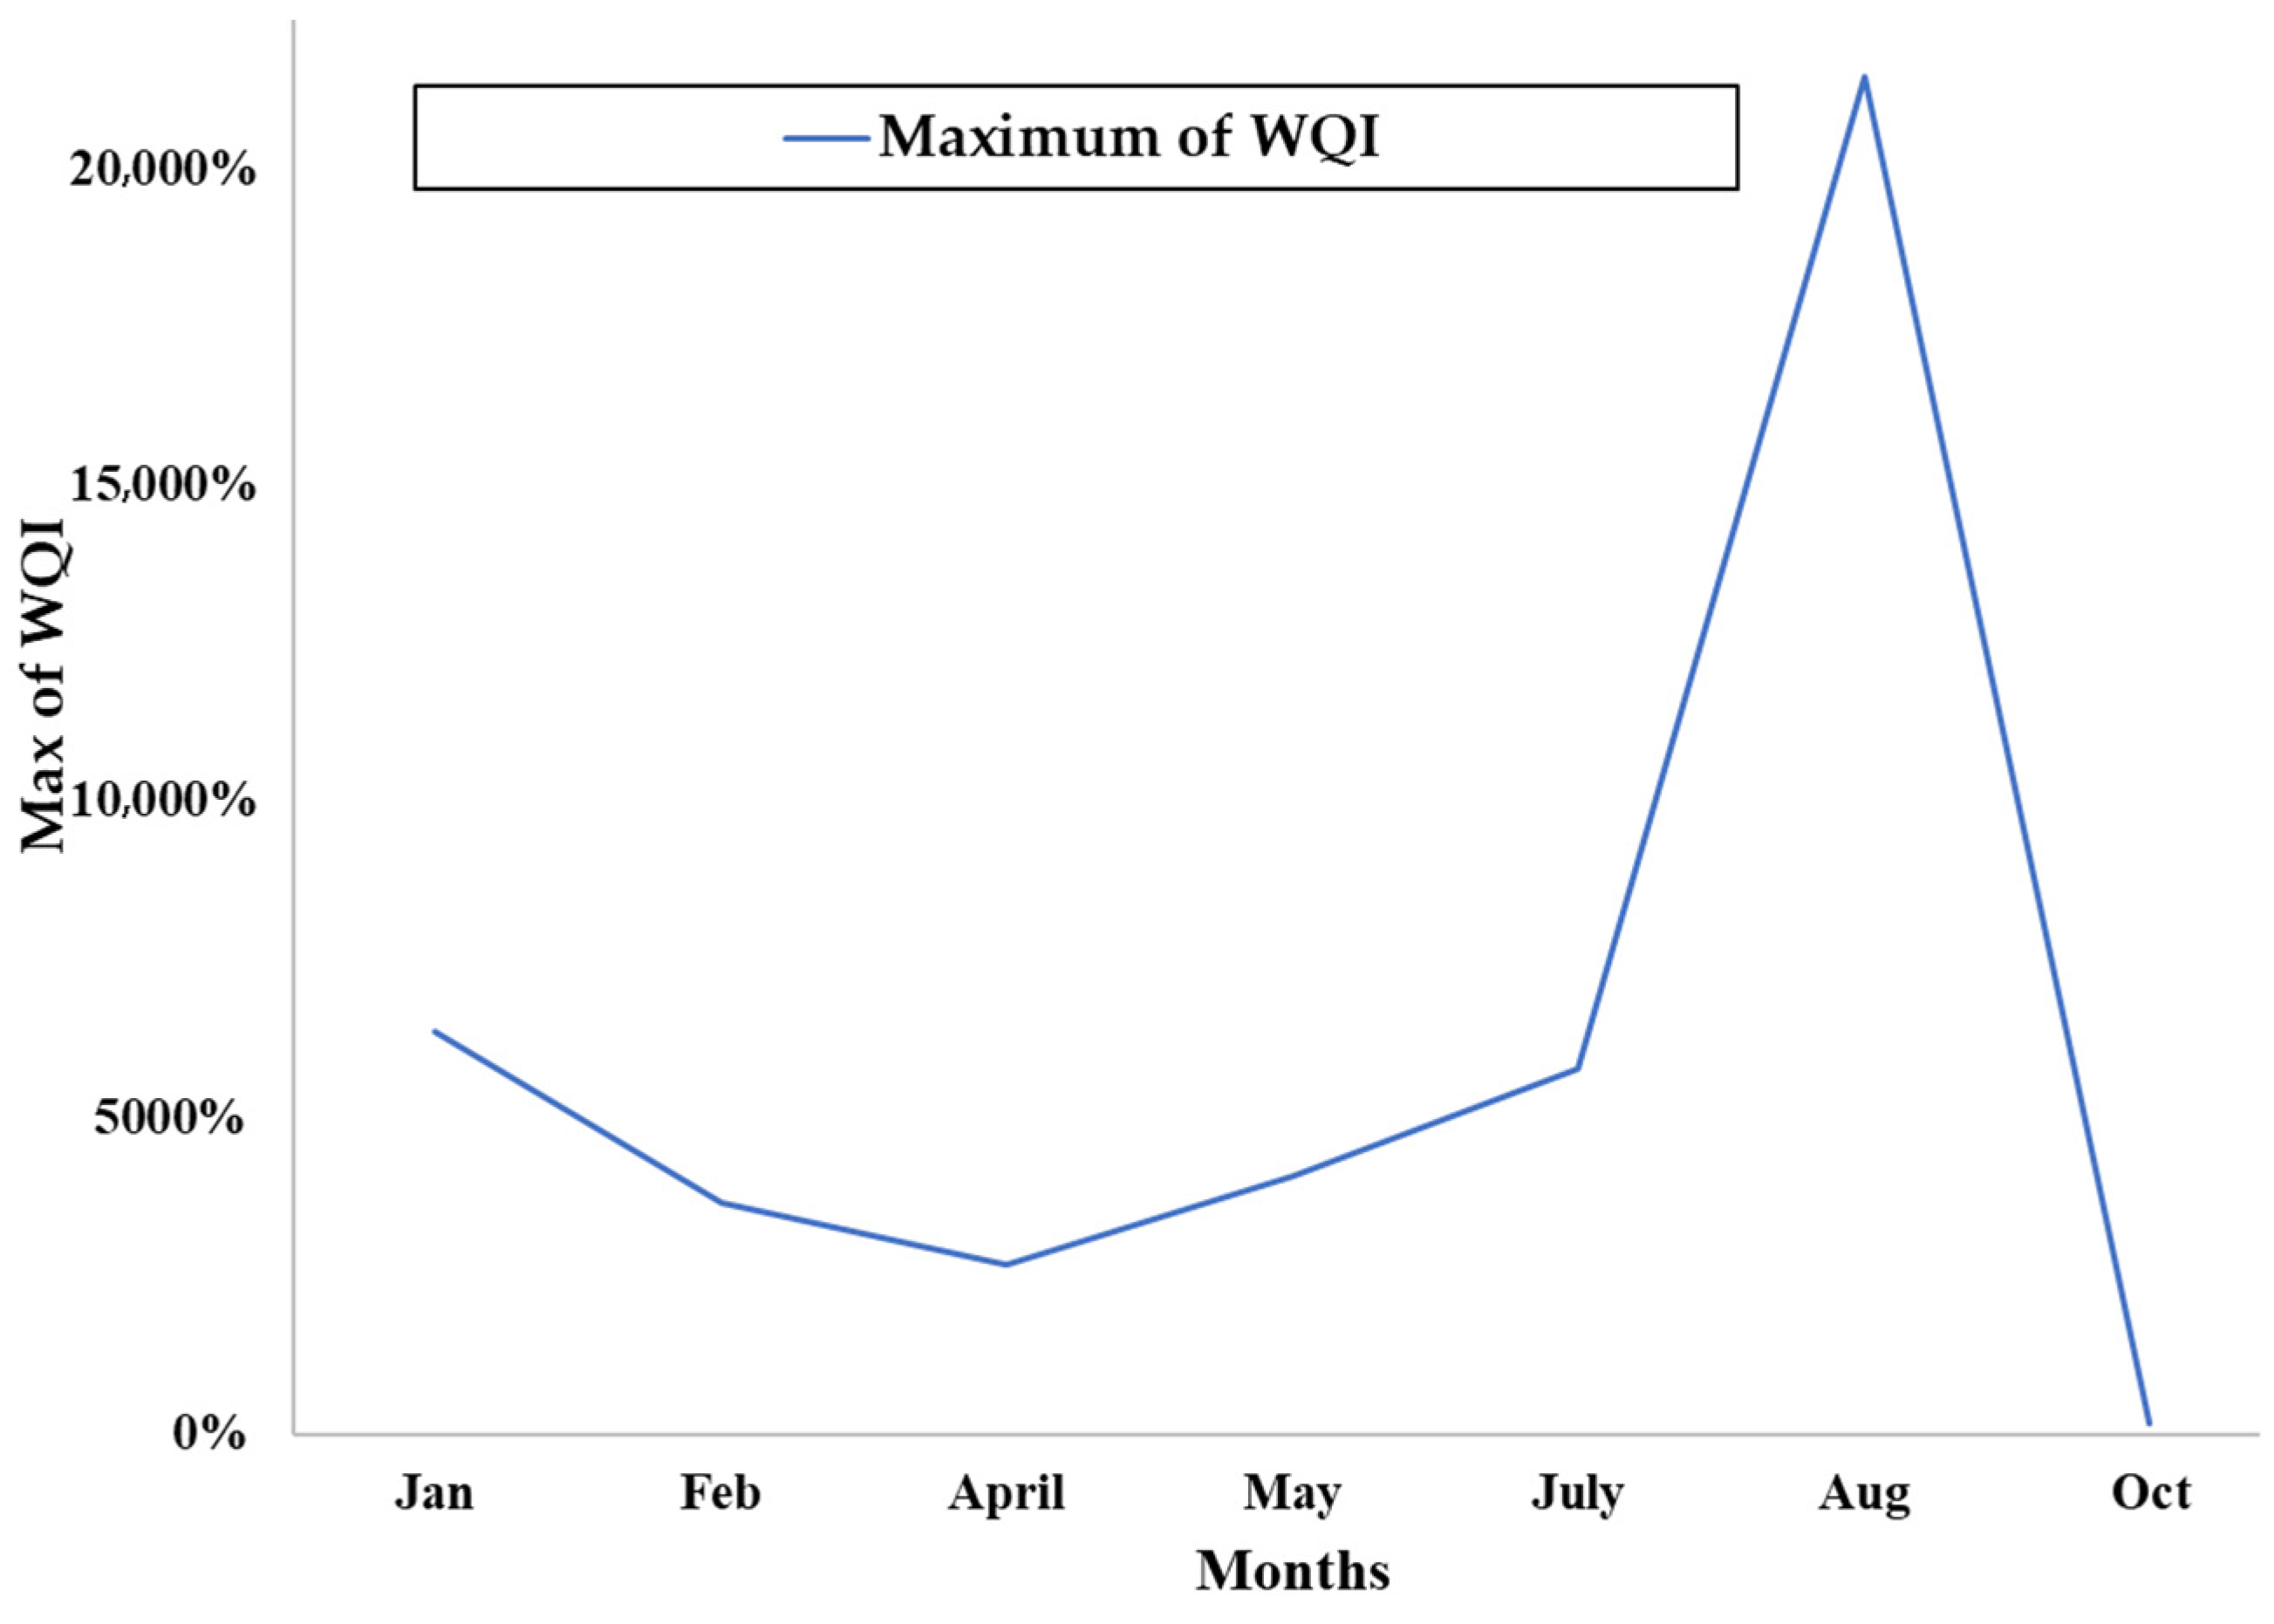
rejects > surface water > piezometer water > well water > borehole water. These results are consistent with the potential origins of the contaminants identified and confirm the hydrogeological buffer effect associated with the soil matrix, which naturally mitigates the migration of contaminants. Its evolution over time, rapid for surface water (one year) and slower for subsurface water and deep water, highlights the vulnerability of surface water and the significant risks associated with its use [
98]. Work carried out in Mexico, based on indicators (contamination degree factor, Metal Evaluation Index, Pollutant Load Index and Ecological Risk Index) relating to surface water, sediments and groundwater, also demonstrates the vulnerability of surface water compared to deep water [
40]. The WQI developed on a river in Thailand to assess the impact of heavy metals on aquatic life shows significant variability in the index depending on the season. It took a period of 10 years to identify a general trend in the evolution of surface water quality and propose protective measures to be taken [
99]. The findings of Faye [
100] on the spread of contaminants in fractured bedrock corroborate IQW behaviour in different aquifers. They also justify the improvement in water quality based on the distance from potential sources of contamination. Moreover, the time and space lag in the recording of heavy metals is also explained by the difference in mobility linked to their atomic radius and high atomic mass compared to other chemical elements. However, the anomaly observed at certain groundwater points has poor, high and very high IQW values. These correspond to an area of confluence of subsurface water from the heap leach zone and the tailing facility, suggesting a transfer. This result is reinforced by a localised facies change.
The synthesis (see
Table 7) of the individual sensitivity results by sample indicates that two parameters are influential, but their impact depends on the context (high standard deviation). The data indicates that turbidity drives the WQI for surface waters. In contrast, lead and arsenic are the dominant factors for discharges.
In the comparison with two WQIs, taking into account our identified parameters, we obtain the following:
For equal weighting, we observe a clear underestimation in certain contexts. For example, the waters of B082024, B012023, and B202022 are classified as excellent with three non-compliances.
The Nemerrow index gives roughly the same results but with a tendency NIP > WQI. This can be explained by the use of the maximum in the calculation formula:
However, the more sensitive scale of the novel WQI allows samples such as 2023B09, 2023B04 and 2023B18 (excellent results for NIP) to show the onset of degradation linked to salinity.
The values of indexes of the novel WQI calculated with regard to the sources of contaminant dispersion enable the identification of monitoring actions (level and frequency) and treatments appropriate to the context (see
Table 8).
Currently, the pH values of recorded rejects (above 7.5 but below 9) limit the transfer of metals from the solid phase to the aqueous phase. This type of alkaline environment reduces the mobility of some heavy metals (lead, copper, zinc, cadmium, nickel, cobalt, iron, manganese, aluminium and chromium) [
88,
101]. These conditions are favourable for the non-diffusion of contaminants. However, a change in physical conditions (temperature, pH and salinity) over time may remobilise these heavy metals [
102].
5. Conclusions
This study was conducted in a gold mining area located near villages and agricultural activities in the north–central region of Burkina Faso. This area has been exploited industrially and gone through informal gold panning for more than twenty years. Geological conditions make the availability of drinking water critical, especially in the event of contamination, and justify the need to monitor the physical and chemical characteristics of surface water and groundwater in order to prevent possible direct and indirect exposure of populations to contaminants. The results of the analyses of subsurface and deep groundwater have shown that several parameters (pH, turbidity, nitrates, sulphates, total iron, aluminium, arsenic, cadmium, cyanide and total and faecal coliforms) do not comply with WHO standards for potability. The factors contributing to water degradation include domestic and agricultural discharges, as well as those from industrial and artisanal mining. Two pollution axes emerge depending on the flows and are visible in the Piper diagram, with some waters tending towards chlorination and others towards sodium and potassium.
The temporal evolution of the characteristics of these waters reveals that the development of mining activity contributes to the gradual deterioration in their quality. Although individual contaminant concentrations remain low overall, their cumulative effects can lead, in the long term, to significant repercussions on the environment and human health. Several indices, such as the NPI, SAR, RI and NIP, can be used to assess water quality in relation to its intended use. The results show that water quality decreases from the surface to deeper waters. The aggregation, via a mathematical formula, of data relating to the physico-chemical parameters linked to mining activity has made it possible to obtain an index that summarises the evolution and could be an effective tool for monitoring changes in water quality. The novelty lies in the determination of key parameters and the use of the index. Twelve parameters combining ETMs and specific parameters associated with mining discharges and general water quality degradation (Na, pH and NO3) were combined. The index obtained accurately reflects the evolution of the impact of mining activity on both surface water and groundwater. Monitoring measures can thus be associated with it in order to prevent any anomalies. When combined with a land use map showing potential sources of contamination, it enables the implementation of appropriate corrective measures to be taken to curb the spread of contaminants. Such an index functions as an early warning system, facilitating the rapid implementation of corrective measures on the associated mining infrastructure. The utilisation of a deep water isopiezic map, which serves to identify deep water flow and contamination pathways, facilitates the adaptation of targeted actions for the decontamination of groundwater. This index could be used by the Burkinabe government to identify areas highly impacted by mining activity based on data collected annually across the country. Depending on the results obtained, appropriate measures could be taken at various surface water and groundwater points to either reassure or protect consumer populations.

