Abstract
Understanding urbanization and its impact on flooding and flood risk is crucial to better manage flood risk in the future. This study analyzed land use/land cover changes and how urbanization would impact flooding and flood risk in Kathmandu Valley of Nepal, and assessed flood risk by integrating flood hazards based on hydrologic–hydraulic modeling with the Analytic Hierarchy Process-based Multi-Criteria Decision Analysis (AHP-MCDA) approach. Land cover maps for past years were generated using Landsat satellite images, and land use/land cover maps for future years were projected based on machine learning techniques. Flood simulations were conducted using a rainfall runoff inundation model with land cover maps for different flood scales to analyze the impact of urbanization and land cover changes on flood runoff, flood inundation extent, and flood inundation volume. Then, we comprehensively assessed flood risk by integrating hazard conditions simulated under different land cover conditions using a hydrologic–hydraulic model and the AHP-MCDA approach. The results showed that the flood inundation extent and the peak inundation volume for a 200-year flood may increase in the future by 10.66% and 15.04%, respectively, as a result of urbanization. The results also highlighted that urbanization may lead to an expansion of high-risk and very-high-risk areas in the future by 3.2% and 9.4%, respectively, indicating an increase in the valley’s flood vulnerability and greater severity of flood hazards.
1. Introduction
Recently, extreme flood events have been occurring in different parts of the developing world, causing significant property damage and loss of lives. Unplanned urbanization and development have worsened the situation, particularly in urbanized areas of developing countries. The increasing level of flood risk due to social change, climate change, and rapid urbanization and development has also been reported in the recent literature [1,2]. Therefore, it is crucial to understand urbanization and its impact on flooding and flood risk to implement more effective preventive and adaptation measures.
Flood prediction and flood risk assessment are important to plan and implement practical flood disaster risk reduction measures [3]. Accurately understanding flood characteristics and flood risk levels while considering potential urbanization and land use and land cover (LULC) changes provides useful information to effectively carry out future flood management and establish land use regulations. In addition, urbanization and LULC changes may have significant impacts on hydrological responses in the watershed (e.g., impact on river runoff and flood inundation) [4,5].
Urbanization and LULC changes can be analyzed using satellite-based images [6,7]. Today, the Google Earth Engine (GEE) platform provides easy access to massive satellite imagery and geospatial data, allowing users to perform large-scale geospatial analysis. Numerous studies have focused on the analysis of LULC impact on hydrological responses [4,5,6,8,9,10,11]. However, most of them mainly focused on the analysis of LULC impact on river runoff or stream flow, and limited research has been conducted on its impact on flood inundation [6]. Understanding the impact of LULC changes while considering potential changes in future land use is crucial for better land use management practices and provides useful information for policy- and decision-makers to identify flood risk levels and plan and implement appropriate land use regulations.
Flood risk is generally defined as a combination of the probability and negative consequences of flooding [12]. Past studies proposed several approaches for flood risk assessment that involve various geographic and environmental factors [13]. Flood risk assessment usually involves three key components: (i) hazard, (ii) exposure, and (iii) vulnerability [14]. Recently, the importance of flood risk assessment incorporating different indicators has been reported in the literature because they provide a comprehensive understanding of flood vulnerability, leading to developing more effective mitigation and management strategies [15,16,17]. Assessing flood risk by incorporating different indicators helps identify areas at high risk, understand the factors contributing to flooding, and inform decisions about land use, infrastructure development, and emergency preparedness.
Several approaches that incorporate different indicators into an integrated tool for flood risk assessment and management have been reported in the literature [18,19,20,21,22,23,24,25]. The Analytic Hierarchy Process-based Multi-Criteria Decision Analysis (AHP-MCDA) methods have been widely used for flood risk assessment incorporating different indicators [18,19,20,21]. Flood risk mapping using the AHP involves integrating multiple factors, such as rainfall, topography, land use, and hydrology, with expert weights to create susceptibility maps. Seejata et al. [19] assessed flood hazards using the AHP process in the lower Yom basin, Thailand, and mapped flood hazard zones based on the weights. Aichi et al. [20] used Geographic Information System (GIS) and AHP for the Dades Wadi watershed, Morocco. They identified potential flood zones by evaluating a flood hazard index that considers various factors and ranked them hierarchically based on their degree of risk exposure. Malla and Ohgushi [26] also used GIS and AHP for assessing flood-prone areas in the Bagmati River basin of Nepal. Mokhtari et al. [21] assessed flood risk for the Cheliff-Ghrib watershed, Algeria, using the AHP approach and indicator-based flood-hazard and vulnerability maps. Wang et al. [15] performed flood risk assessment using grid-unit spatial analysis data and flood risk maps for cities in South Korea. Pham et al. [3] presented a method for flood risk mapping in Quang Nam Province, Vietnam, combining flood susceptibility assessment using a hybrid artificial intelligence model and flood consequences using the MCDA method. Saikh and Mondal [27] and Singha et al. [28] employed machine learning and geospatial data for flood hazard assessment in regions of India, based on an influencing indicator selected for flood susceptibility mapping. Zhang [29] also presented a machine learning approach for flood hazard and risk assessment. Saber et al. [30] proposed another machine learning-based approach for flood susceptibility mapping and validated a flood susceptibility map developed for Vu Gia-Thu Bon, Vietnam, with the results obtained from a hydrological model. Geospatial analysis and the AHP approach were often used for flood risk assessment in previous studies [18,23,24,25]. Most of them used indicator-based flood susceptibility maps in assessing flood risk, and some of them employed machine-learning tools in assessing flood maps. Recently, some studies have attempted to assess flood risk based on results obtained from a hydrological or hydraulic model. Sun et al. [31] used the AHP approach and a hydrodynamic model for the China–Pakistan Economic Corridor, and Duy et al. [32] used hydrodynamic modeling coupled with machine learning and the AHP approach. Gacu et al. [22] assessed flood risk for Odiongan, the Philippines, using AHP and considering risk indicator factors. They also considered flood depth calculated using a hydrologic–hydraulic model. However, these studies give limited attention to the effects of urbanization on flood hazards and the dynamic changes in LULC.
Limited studies have focused on the analysis of urban growth and the assessment of flood susceptibility and risk mapping for the Kathmandu Valley (KTM valley), Nepal. The current trend of flood risk assessment for the valley has been mainly based on indicator-based flood susceptibility mapping using the AHP approach and GIS. Chaudhary et al. [33] assessed flood hazards and risk using the AHP method. They also employed indicators, such as rainfall, elevation, slope, and a topographic wetness index, to identify hazard zones. Chaulagain et al. [34] focused on flood susceptibility mapping using GIS-based multi-criteria decision analysis, considering rainfall and other topographical factors as key influencing factors for flood susceptibility. Mest et al. [35] investigated spatial relationships between flood hazards, urban growth, and social vulnerability. They assessed social vulnerability using indicator data at the municipality level, without considering the effects of urbanization on flood hazards. Lamichhane and Shakya [36] investigated the impact of LULC on runoff, groundwater recharge, and water scarcity in the KTM valley, using the Conversion of Land Use and its Effects at Small regional extent (CLUE-S) model for future LULC projection; the GIS for spatial data management and analysis; and AHP to estimate appropriate weights for factors that influence groundwater recharge. Acharya et al. [37] also investigated the impact of LULC on surface runoff and groundwater in the valley using the Soil and Water Assessment Tool (SWAT) model and projected a future LULC map based on the trend change of historical maps. However, Lamichhane and Shakya [36] and Acharya et al. [37] did not analyze the spatiotemporal impact of LULC on flood hazards and risk. Shrestha et al. [38] investigated the trend of LULC and the variation in ecosystem service values in the KTM valley using remote sensing data for historical years. However, they did not consider future LULC in their analysis. Some other studies only focused on LULC change trend analysis [39,40,41,42]. Bharti and Biswas [39] analyzed urbanization change for the KTM valley using Quantum GIS (QGIS) with the Modules of Land Use Change Evaluation (MOLUSCE) plugin to forecast urban growth based on the change trend in historical years. Although previous studies made some efforts to analyze LULC changes and assess flood risk in the KTM valley, the impact of LULC on flood inundation and hazards remained unconsidered. In addition, flood susceptibility or risk mapping was mainly based on influencing indicator factors using GIS and the AHP approach. Moreover, previous studies give limited attention to the flood hazard prediction considering future LULC and the effects of LULC change on flood risk mapping. Therefore, comprehensive flood risk assessment, considering LULC changes, including future LULC maps, accurate modeling of flooding due to unpredictable rainfall and rapid LULC changes, analysis of spatial data, and risk modeling, is crucial for the KTM valley.
The aim of this study was to develop a novel approach that integrates flood hazard simulation using a hydrologic–hydraulic model considering the effects of urbanization, land use change dynamics, and an AHP-MCDA approach for assessing flood risk in the KTM valley. Land cover maps for past years were generated using Landsat satellite images in the GEE Platform. Analysis of LULC changes and the projection of the maps for the future were conducted using QGIS plugin called MOLUSCE. After preparing land cover maps, flood simulations were conducted using a distributed hydrologic–hydraulic model named the Rainfall-Runoff-Inundation (RRI) model with land cover maps for different years. Flood inundation was simulated for different flood scales. Then, we analyzed how changes in urbanization or land cover would affect flood runoff, flood inundation, and flood inundation volume. Finally, we comprehensively assessed flood risk for the KTM Valley based on hydrologic–hydraulic modeling outputs and an AHP-MCDA approach by integrating hazard, exposure, and vulnerability factors. This study presented a comprehensive study of flood risk assessment considering effect of LULC changes, LULC change dynamics, and the effects of LULC on flooding, and highlighted valuable insights in the relationship between LULC changes, flooding, and flood risks, making it a significant contribution to the field of flood risk management. In rapid urbanization areas, flood risk assessment combining hydrologic–hydraulic modeling, machine learning techniques, and the AHP-MCDA method can provide valuable information on the dynamics of LULC and their effects on flooding and risk level for decision and policy making. This study provided evidence-based information for establishing flood prevention and adaptation measures as well as for establishing land use regulation in the areas to control rapid urbanization. The findings of this study are also beneficial for policymakers and communities to implement more effective policies for flood risk management by providing information on how urbanization affects flood risk.
2. Materials and Methods
This study has two main components: (i) analysis of urbanization and LULC changes and their impacts on flooding, and (ii) assessment of flood risk by more reliably integrating flood hazards based on hydrologic–hydraulic modeling and AHP-MCDA, considering future urbanization. The details of the study area, materials, and methods are described in the following subsections.
2.1. Study Area
This study focused on the KTM valley, which is located in the upper part of the Bagmati River basin of Nepal (Figure 1). Kathmandu, the capital city, lies in this valley. The size of the study catchment is approximately 671.85 km2. The elevation, based on the HydroSHEDS digital elevation model (DEM), ranges from 1088 to 2717 m. The annual average precipitation over the KTM valley is approximately 1583 mm, based on the basin average data from 1976 to 2024.
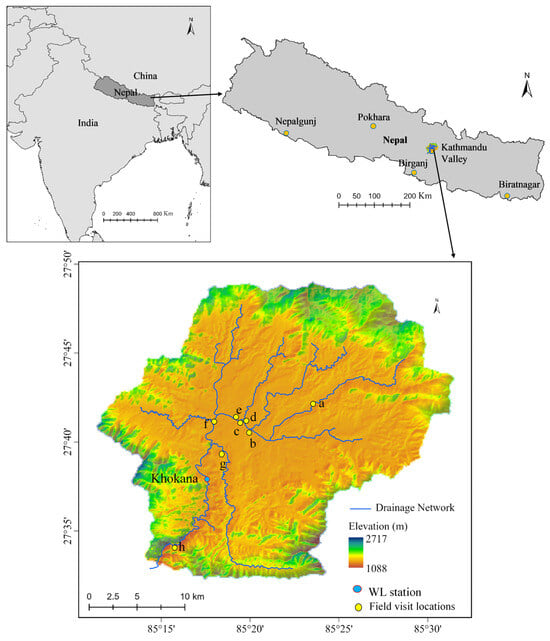
Figure 1.
Location and elevation distribution of the Kathmandu Valley based on the HydroSHEDS digital elevation model (https://www.hydrosheds.org/products/hydrosheds, accessed on 10 June 2024).
The KTM valley, which consists of the three major cities of Nepal (i.e., Kathmandu, Patan, Bhaktapur), is important in terms of economic activities, rich history and culture, and numerous religious and architectural landmarks. However, recently, this valley has been experiencing unexpected flood events, for example, one in September 2024. Extreme rainfall amounts in the KTM Valley show large variability; however, a recent flood event in September 2024, which received rainfall of 250–350 mm in 24 h, caused major flooding in the KTM valley. Two-day heavy precipitation on 27 and 28 September 2024 caused severe flooding, which caused massive damage to private properties and public infrastructure, as well as human loss, across the country, including the KTM valley. Figure 2 shows photos of houses, roads, and other infrastructure damaged by the September 2024 flood in the KTM valley.
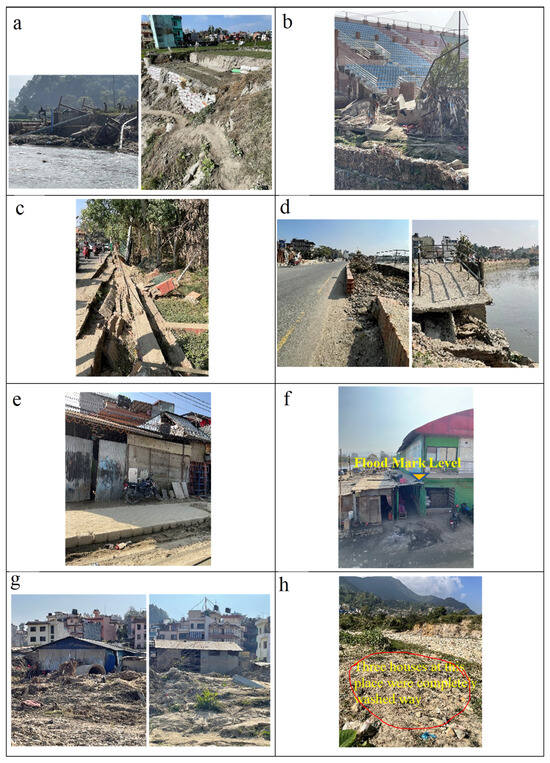
Figure 2.
Damage to houses and infrastructure by the September 2024 flood in the KTM valley (a–h indicate the location of the photos on the map in Figure 1).
2.2. Analysis of Urbanization and Projection for Future Maps
To analyze the urban growth, land cover maps for past years (2014, 2019, 2024) were generated for the Bagmati River basin using Landsat 8 surface reflectance images (USGS Landsat 8 Level 2, Collection 2, Tier 1) of 30 m spatial resolution (1 arc-second) in the GEE Platform. This study used Level 2 Landsat 8 surface reflectance images available in GEE, which has already been processed and corrected for atmospheric effects. The land cover map for 2004 was also generated for calibrating hydrologic–hydraulic model simulations. The images were collected with less than 4% cloud cover.
Since the supervised land classification method is widely used for land cover mapping to generate more reliable maps based on ground truth training data [6,43,44], this study also used the supervised classification method, in which training sites have to be developed. The land cover categories in the basin were classified into six classes: (1) Bodies of Water, (2) Forest, (3) Vegetation, (4) Bare land, (5) Cropland, and (6) Built-up areas. For making training and validation samples, the true color and false color composites of Landsat 8 images were created as reference images. The true color composites of Landsat 8 images use a combination of RGB bands 432 to show the natural colors, while false color composites use RGB bands 543 to show non-natural colors. The training and validation samples for each land cover class for 2014, 2019, and 2024 were randomly created, as many as possible, throughout the entire image based on composite images and Google Earth images. Total number of selected training samples for land cover class for 2014, 2019, and 2024 was about 800, 812, and 885, respectively (Table 1), while the total selected validation samples were 180 for 2014, 184 for 2019, and 215 for 2024. We considered bands SR_B2, SR_B3, SR_B4, SR_B5, SR_B6, and SR_B7 for generating land cover maps. The random forest classifier available in GEE was used to generate a land cover map from the training samples. Accuracy assessment was conducted using the validation samples for each generated map. The spatial resolution of the generated land cover maps for past years was up-scaled from 1 arc-second to 3 arc-second, which is the same resolution as the hydrologic–hydraulic model simulation.

Table 1.
Training and validation sample sizes for generation of LULC maps.
A QGIS plugin MOLUSCE in QGIS 3.4 was used to analyze land cover changes and project future land cover areas. The MOLUSCE plugin can estimate potential changes in each land cover class and project land cover maps, and it is widely used by numerous researchers for this purpose [45,46,47,48,49,50]. The cellular automata-artificial neural network (CA-ANN) model in the MOLUSCE, which has been reported as a reliable tool for predicting land cover changes in the future [50], was used for projecting future land cover maps. Previous studies often used the change trends in LULC for historical years and driving variables (e.g., elevation, slope, aspects, distance from the river, and distance from the road) in the projection of future LULC, because of a lack of data on urbanization plans and policies for the future [45,46,47,48,49,50]. This study, thus, also determined future LULC changes based on the historical change trends in LULC and driving variables. The transition matrix and change map of the land cover maps between 2014 and 2019 and static variables presented in Figure 3 (digital elevation model (DEM), slope, aspect, distance from the river, and distance from the major road) were used to train the artificial neural network (ANN) model. The DEM data of 3 arc-second spatial resolution was downloaded from the HydroSHEDS (https://www.hydrosheds.org/products/hydrosheds, accessed on 10 June 2024). The slope and aspect were calculated using DEM in GIS. To calculate the distance from the river, the river network in the shape file was delineated by referring to Google Earth images in GIS. The distance from the major road was calculated using the road data downloaded from the Humanitarian Data Exchange of UN-OCHA (https://data.humdata.org/, accessed on 7 July 2025), which was developed by the Overture Maps Organization. Cellular automata (CA) simulations were conducted to project the land cover map for 2024 for validating the projected map. The projected land cover map for 2024 was validated using the generated (or actual) land cover map for 2024 within the MOLUSCE plugin’s validation module, which calculates accuracy statistics like overall accuracy and the Kappa values to assess model performance. The model demonstrated satisfactory performance, achieving an overall accuracy of 77% and a kappa value of 0.65. After validating the trained model with satisfactory performance, future land cover maps (years: 2039 and 2049) were projected.
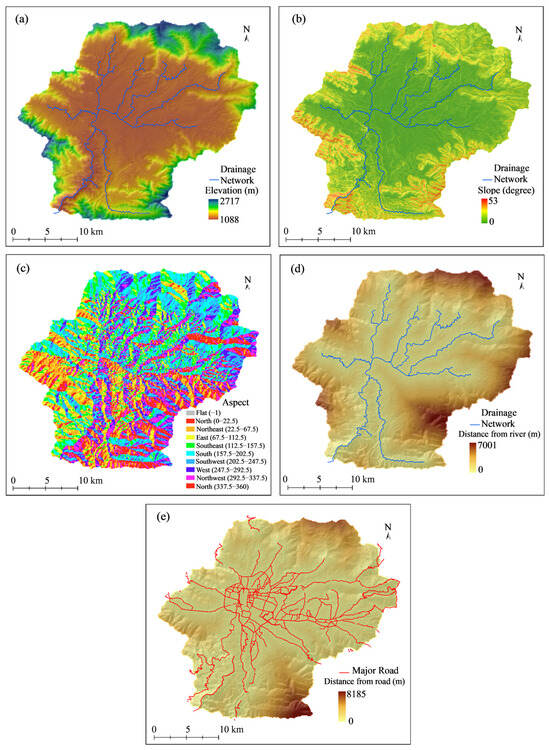
Figure 3.
Variables used for potential transition analysis: (a) digital elevation model, (b) slope, (c) aspect, (d) distance from the river, and (e) distance from the major road.
2.3. Impact Analysis of Urbanization on Flooding
This study used the RRI model developed by Sayama et al. [51] for flood simulation considering land cover classes to analyze the impact of urbanization on flooding and assess flood risk. The RRI model is a two-dimensional hydrologic–hydraulic model capable of simulating rainfall-runoff, infiltration process, and flood inundation simultaneously [51]. The RRI model calculates flow on the slopes with two-dimensional diffusive wave model and flow in the river channels with the one-dimensional diffusive wave model. The width and depth of the river channel were approximately calculated using empirical equations [51]. The RRI model is suitable for simulating surface runoff and flood inundation considering LULC changes because its parameters can be assigned based on land cover classes. The momentum equations under the diffusion wave approximation for unsteady flow in x- and y-directions can be described as follows [51].
where, and are the unit width discharge in and directions, respectively; is the height of the water from the local surface; is the height of the water from the datum; is the Manning’s roughness coefficient; and is the signum function.
The mass balance equation can be described as follows [51].
where, is the rainfall intensity, is the infiltration rate.
The momentum and continuity equations of one-dimensional diffusion wave model for calculating river flow are same as Equations (1) and (3), but one-dimensional (i.e., = 0) [51].
The RRI model was set up for the KTM Valley with a DEM of 3 arc-second (approximately 90 m spatial resolution), which was downloaded from the HydroSHEDS. The computational efficiency of the RRI model depends on the number of calculation grids. This study considered the entire catchment of the KTM valley for RRI model simulation, and appropriate grid size, approximately 90 m, was used for efficient and smooth computation. The parameters of the RRI model were calibrated and validated by comparing the calculated discharges for past flood events with observed discharges at the Khokana station, using the daily ground gauge rainfall data for 16 stations obtained from the Department of Hydrology and Meteorology, Nepal. The flood event in June-July 2004 was used for calibration, and the flood events in June-August 2002 and July-August 2014 were used for validation of the RRI model. The key parameters for calibrating the RRI model include roughness coefficients for river and slope, and soil characteristics, such as soil depth, porosity, and vertical and horizontal hydraulic conductivity. The commonly used metrics measures such as Nash–Sutcliffe efficiency (NSE) and r-squared (R2) values were used to evaluate the model performance.
To analyze the impact of urbanization, rainfall-runoff and inundation processes were simulated using the RRI model for the severe flood event in September 2024 (approximately 128-year flood) and a 200-year flood event using the current land cover for 2024 and the projected future land cover for 2039 and 2049. Flood frequency analysis was conducted using the basin average 2-day annual maximum rainfall data from 1976 to 2024 (Figure 4). Gringorten plotting position formula was used to plot the position of the historical time series data in Figure 4 [52]. By visual comparison, the frequency curves calculated using Generalized Extreme Value (GEV) distribution matches well with the data plots than the frequency curves calculated using Gumbel distribution. The rainfall intensity for the 200-year flood was thus estimated using a GEV distribution, which is a standard statistical model for extreme value analysis [52]. For flood simulation, the rainfall for the 200-year flood was designed using the spatial and temporal distribution patterns of the September 2024 flood, which was a recent severe flood event in the area. The rainfall for 200-year flood was estimated by multiplying the rainfall data of the September 2024 flood by a conversion factor. The conversion factor for the 200-year flood was calculated as the ratio of the corresponding rainfall of the return period based on a frequency curve and the 2-day annual maximum rainfall of 2024 flood [53].
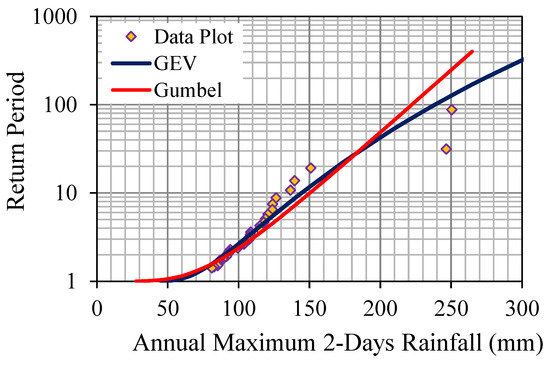
Figure 4.
Rainfall intensity verses return periods.
2.4. Flood Risk Assessment Integrating Hydrologic–Hydraulic Model and AHP
This study used the AHP-MCDA approach, which uses pairwise comparisons to determine the weights of different criteria and alternatives by integrating the flood inundation output from the hydrologic–hydraulic model and exposure and vulnerability factors. Figure 5 shows the overall process of the AHP-MCDA approach and the considered indicators. As the hazard indicator, this study used flood extent and inundation depth for a 200-year flood (higher flood scale than the flood event in 2024), which were calculated using a hydrologic–hydraulic model considering future urbanization conditions. Based on spatial data availability, the exposure and vulnerability indicators presented in Table 2 were considered for assessing flood risk. Figure 6 shows the population density and the number of buildings exposed to flooding, which were used to assess flood risk. The distance from the river and the distance from the major road are presented in Figure 3d,e. The land use and land cover maps, which were generated in this study, were used to assess flood risk.
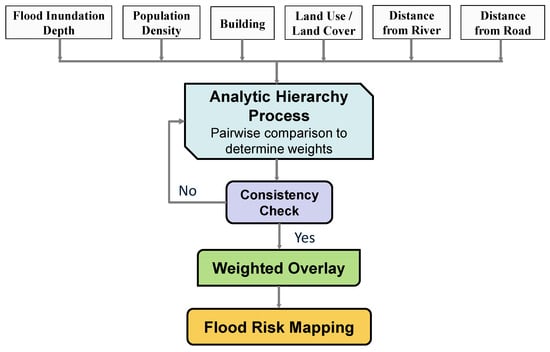
Figure 5.
Overall process of the AHP-MCDA approach and considered indicators.

Table 2.
Considered parameters for assessing flood risk.
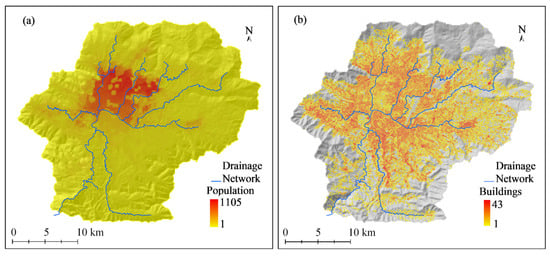
Figure 6.
(a) Population based on the WorldPop 2020 data (https://www.worldpop.org/datacatalog/, accessed on 5 May 2025) and (b) the number of buildings based on Microsft building footprint data for 2022 (downloaded from Google Earth Engine, and also available at https://github.com/microsoft/GlobalMLBuildingFootprints, accessed on 15 May 2025).
The considered variables were categorized into five risk levels: very low, low, medium, high, and very high, using classified tools in ArcGIS Pro 3.3.0. The flood risk index was calculated as follows:
where is the flood risk index, is the standarized rank classes for the indicator parameter, is the relative weight of the indicator parameter, and is the total number of indicator parameters.
Each indicator parameter was standardized with rank classes from 1 to 5 (ranking from very low to very high susceptibility). Then, AHP-MCDA was conducted using the AHP Excel template developed by Goepel [54] to determine the relative weights of different criteria and alternatives. This study assigned scores of the relative importance of one criterion over another in the AHP pairwise comparison to determine the weights, based on expert judgment. Pairwise comparisons were conducted with a score of a scale between 1 (equal importance) and 9 (extreme importance), as shown in Table 3 [55]. Table 4 shows the comparison matrix of the parameters in AHP process.

Table 3.
Score of each scale and their descriptions for AHP.

Table 4.
Pairwise comparision matrix for the paramters in AHP.
To ensure the logical judgements in AHP process, the Consistency Ratio () was used to evaluate the consistency of the eigenvector matrix created in the AHP as follows [18,19,20]:
where CI is the consistency index, and RI (=1.24 in this study case, based on the size of the matrix) is the random index. The CI was calculated using the following equation [18,19,20]:
where is the largest eigenvalue of the pairwise comparison matrix, which was calculated to be 6.08, and (=6 in this study) is the number of criteria. The calculated value of CR was 0.013, which is less than 0.1. The CR value less than or equal to 0.1 (≤10%) is considered acceptable with a reasonable level of consistency in the pairwise comparisons of the criteria [19,20]. The relative weight of each factor was computed through the AHP process of pairwise comparisons and eigenvector calculation, with the satisfying consistency ratio criteria (CR < 0.10). Table 5 summarizes the considered parameters and their classes with rating and final relative weights based on AHP-MCDA.

Table 5.
Summary of the parameters, classification, rating, and relative wights.
3. Results
3.1. Urbanization and Projection for Future
Urbanization and LULC changes were analyzed using Landsat images. Figure 7 shows the generated land cover maps for 2014, 2019, and 2024. Table 6 shows the estimated area of each land cover class for 2014, 2019, and 2024. The table also shows the changes in area between 2014–2019, 2019–2024, and 2014–2024. The cropland area rapidly decreases, while the built-up area rapidly expands in the KTM valley. These results indicate that the cropland areas are mainly converted to built-up areas. The forest area decreased from 261.58 km2 to 252.36 km2 from 2014 to 2019. However, because of recent reforestation and conservation efforts, the forest area increased from 252.36 km2 to 275.39 km2 from 2019 to 2024. The cropland area in 2014 was 323.12 km2, which decreased to 288.98 km2 in 2019 and to 235.70 km2 in 2024, while the built-up area in 2014 was 79.83 km2, which increased to 113.94 km2 in 2019 and to 145.94 km2 in 2024. The percentage of cropland area decreased by 27.05% from 2014 to 2024, while the percentage of built-up area increased by 82.81% from 2014 to 2024.
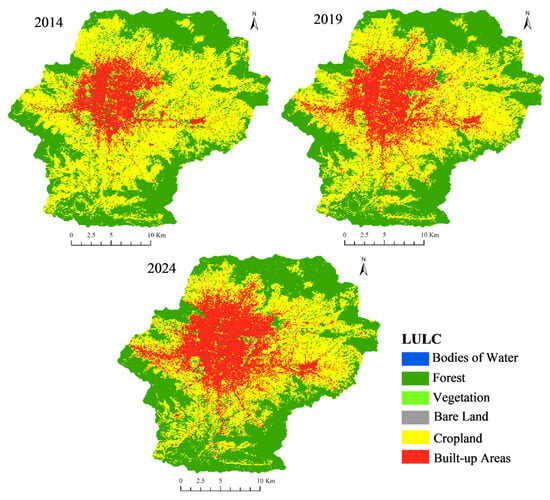
Figure 7.
Generated land cover maps for 2014, 2019, and 2024.

Table 6.
Area of land cover classes for past years and changes in area.
Figure 8 shows the projected land cover maps for 2039 and 2049, and Table 7 shows the estimated area of each land cover class for these future years. The cropland area is estimated to be 116.16 km2 in 2039 (a decrease of 50.71% compared with the 2024 cropland area) and 89.45 km2 in 2049 (a decrease of 62.04%). In contrast, the built-up area is estimated to be 218.25 km2 in 2039 (an increase of 49.54%) and 231.6 km2 in 2049 (an increase of 58.69%). The loss of cropland areas in the future might be attributed mainly to the conversion to built-up, forest, and vegetation areas. The results also indicate that the urbanization in the KTM valley is comparatively faster before 2039 than between 2039 and 2049. Urbanization might take place at a slower pace after 2039, as most cropland areas are likely to have been converted to built-up areas by that time.
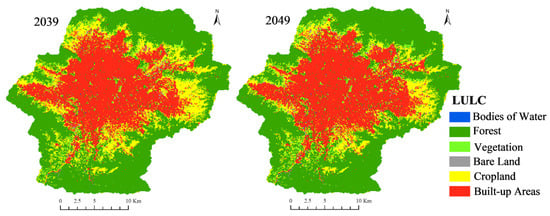
Figure 8.
Projected future land cover maps for 2039 and 2049.

Table 7.
Projected area of land cover classes for future and changes in area.
3.2. Urbanization Impact on Flooding
The hydrologic–hydraulic model was calibrated for the 2004 flood event and validated with the 2002 and 2014 floods. Figure 9 shows the comparison between calculated and observed discharges at the Khokana station. The RRI model parameters were calibrated and validated for the entire duration presented in the figures. The NSE and R2 values were 0.86 and 0.92 for the 2004 flood (calibration), 0.79 and 0.83 for the 2002 flood (validation), and 0.53 and 0.58 for the 2014 flood (validation). The calculated discharges reasonably agree with the observed discharges with acceptable NSE and R2 values. Although lower NSE and R2 values were observed for 2014 flood, which was possibly due to flood simulation using daily rainfall data that does not capture the characteristics of the short-duration rainfall events. Figure 10 shows the calculated discharges and water levels at the same station for the September 2024 flood event. The observed water level data are also shown in the figure for the period before the observation instruments were washed away. The calculated peak discharge during the September 2024 flood was about 1584 m3/s.
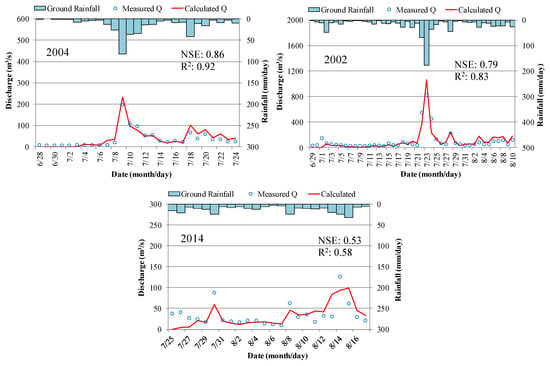
Figure 9.
Calculated and observed discharges at the Khokana station for past flood events (daily time series data).
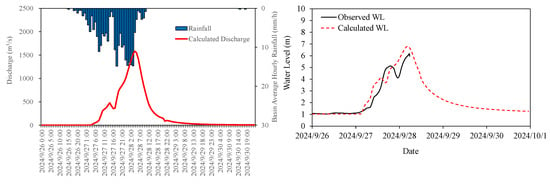
Figure 10.
Calculated flood discharges and water levels at the Khokana station for the September 2024 flood (flood simulation was conducted using hourly rainfall).
After calibration and validation of the model, this study simulated rainfall-runoff and flood inundation for the flood scale of the severe flood event in 2024 (approximately 128-year flood) and a 200-year flood event, with different years’ land cover maps. Figure 11 shows the comparison of time-series discharges using LULC in 2024 and 2049 for the 2024 flood and the 200-year flood. The figure clearly indicates an increase in river runoff due to urbanization. The peak discharge of the 2024 flood using the 2024 LULC was 1584.06 m3/s, while approximately 1664.76 m3/s using the 2039 LULC (an increase of 5.1%) and 1678.42 m3/s using the 2049 LULC (an increase of 6%). Similarly, the calculated peak discharge for the 200-year flood using the 2024 LULC was 1745.02 m3/s, while about 1820.97 m3/s using the 2039 LULC (an increase of 4.4%) and 1833.22 m3/s using the 2049 LULC (an increase of 5.1%).

Figure 11.
Calculated time-series discharges at the Khokana station using land cover maps for 2024 and 2049 (plotted using hourly outputs).
Figure 12 shows the spatial distribution of flood inundation depth using LULC in 2024 and 2049 for both flood scale cases. The figure shows the expansion of flood inundation area and increases in flood volume due to urbanization along the upper Bagmati River, which runs through the central part of the KTM valley. The results indicate that some areas may be flooded with a flood depth greater than 3.0 m due to urbanization. Figure 13 shows the time-series flood inundation volume. The results find that the increase in urbanization leads to higher river discharge and inundation volume not only during peak flow but also during non-peak flow periods, which is particularly due to the increase in impervious surfaces in the valley.
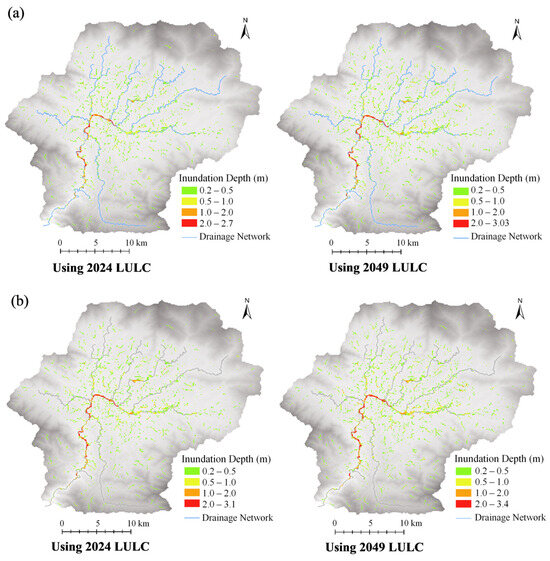
Figure 12.
Calculated flood inundation extent area and depth: (a) 2024 September flood and (b) 200-year flood.

Figure 13.
Calculated time-series inundation volume using land cover maps for 2024 and 2049 (plotted using hourly outputs).
Table 8 compares the calculated inundation area and peak inundation volume using land cover maps for 2024, 2039, and 2049 for flood scales of the 2024 flood and a 200-year flood. The results indicate that the flood inundation area and volume may increase in the future due to urbanization in the KTM valley. The increases in inundation area and peak inundation volume using the 2039 land cover map for the 2024 flood are 9.38% and 14.14%, respectively, and 11.56% and 17.48% using the 2049 land cover map. In the case of a 200-year flood, they are 8.46% and 12.18% using the 2039 land cover map, and 10.66% and 15.04% using the 2049 land cover map. The increases in calculated inundation area and flood inundation volume using the 2049 LULC for the 2024 flood scale are 1.98% and 2.93%, compared with those calculated using the 2039 LULC, while they are 2.03% and 2.52% for the 200-year flood case.

Table 8.
Calculated inundation area and peak inundation volume under current and future land use and land cover conditions.
3.3. Flood Risk Assessment
In this study, flood risk was assessed for KTM valley, combining the flood hazard conditions simulated using the hydrologic–hydraulic model, land use change dynamics, and exposure and vulnerability factors. Figure 14a shows the calculated flood risk levels with different flood hazard conditions under the 2024 LULC, using the 2024 LULC map as one of the considered exposure indicators. Figure 14b shows the calculated flood risk levels using the future land cover map for 2049 (for both flood hazard and exposure indicators). The areas along the river (red-colored areas) were identified as areas at very high flood risk. The wide low-land areas (orange-colored areas) were identified as areas at high flood risk. The estimated areas at high risk and very high risk under the current LULC condition were 93.39 and 2.42 km2, respectively, while about 96.36 and 2.65 km2 under the future LULC condition (2049 LULC). The increases in high-risk and very-high-risk areas under the future LULC are projected to be 3.2% and 9.4%, respectively, compared with those areas under the current LULC. The medium-risk area is estimated to decrease by 6.73% under the future LULC condition, as such areas are predicted to be converted primarily to high- and low-risk areas. The low-risk area increases by 3.66% under the future LULC condition, possibly due to an increase in forest and vegetation areas, indicating that continuous reforestation and conservation efforts can lead to risk reduction to some extent in the future.
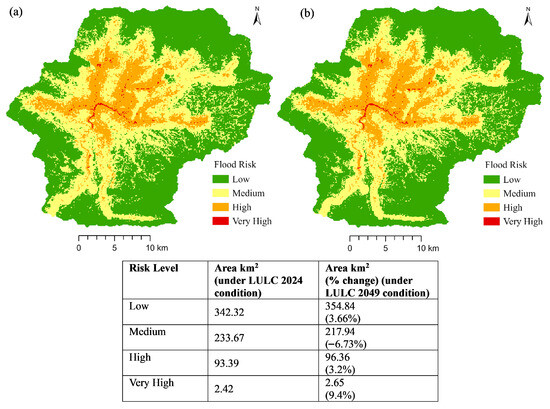
Figure 14.
Calculated risk maps and risk levels (a) under current LULC (2024) and (b) future LULC (2049) conditions, with the 200-year flood scale case.
The locations of the damage photos presented in Figure 2 were identified as areas with a high- or very high-risk level, which validate the results of risk assessment presented in this study. The infrastructure and houses along the main Bagmati River and its tributaries were severely damaged or affected during the September 2024 flood. Field observations and discussions with local residents in the flood-affected areas in the KTM valley revealed that the houses along these rivers were directly affected by floodwaters, and that the household contents were more significantly affected than the house structures. The September 2024 flood caused widespread flooding, leading to significant loss of household belongings, furniture, and other valuables within homes. Though some houses were damaged or destroyed, the impact on household contents was more widespread and devastating for many residents. The infrastructure, such as roads, bridges, and fences, was also severely damaged along the main river and its tributaries during the September 2024 flood in the KTM valley. The field investigation also found that the cropland areas in the KTM valley were significantly damaged during the September 2024 flood.
This study used expert judgement for scoring in the AHP process to determine the relative weights, and a sensitivity analysis would be beneficial to understand the uncertainty associated with the scores derived from expert judgement in the AHP process. Therefore, this study also analyzed the changes in risk areas with changes in relative weight of each factor, which were determined by changing scores of the relative importance of one criterion over another in the AHP pairwise comparison. Table 9 shows the determined relative wights for different cases of pairwise comparisons. Table 10 shows the estimated area of each risk level for different cases of relative weights (under the future 2049 LULC condition). The results indicated that the areas of high or very high-risk significantly increase when the relative weights of exposure or vulnerability factors are increased. Increasing the importance of exposure or vulnerability directly magnifies the overall risk score for the area, leading to a higher risk classification.

Table 9.
Determined relative wights for different cases of pairwise comparisons.

Table 10.
Estimated areas of each risk level for different cases of relative weights.
4. Discussion
This study presented the impact of urbanization on flooding and flood risk in the KTM valley, integrating a hydrologic–hydraulic model, machine learning technology, and AHP-MCDA. AHP-MCDA is a widely used method for creating static flood susceptibility maps by combining expert-weighted factors like topography and land use, while hydrologic–hydraulic models offer more dynamic, event-based hazard insights by simulating flood behavior for specific rainfall scenarios. By combining both these methods and considering LULC dynamics can lead to more comprehensive risk assessments, offering more detailed insights into flood risk mapping considering flood hazard conditions for specific rainfall-runoff events. Urbanization, the increasing concentration of population in cities, is one of the significant global issues, presenting both opportunities and challenges. As the population continues to grow in urban areas, cities are facing rising risks due to rapid, often unplanned, urbanization. The KTM valley is one example, threatened by the increasing risk of severe flooding. The two-day intense rainfall on 27–28 September 2024 caused a devastating flood in the valley, with other factors, such as rapid, unplanned urbanization, lack of preparedness, and inadequate early warning systems, worsening the situation. Flood risk management in the KTM valley needs to be improved by understanding the impact of urbanization on flooding and flood risk, identifying risk levels, and combining a hydrologic–hydraulic model, machine learning technology, and AHP-MCDA.
Rapid, unplanned urbanization is a highly challenging issue in the KTM valley over the past two decades. The built-up area in the valley has expanded significantly from 79.8 km2 in 2014 to 113.94 km2 in 2019 and to 145.94 km2 in 2024. Lamichhane and Shakya [36] estimated the built-up area to be approximately 138.15 km2 in 2018. Based on the projected LULC maps for future in this study, the built-up area is expected to expand to 218.25 km2 by 2039 (an increase of 49.54% compared with the built-up area in 2024) and to 231.60 km2 by 2049 (an increase of 58.69%). Bharti and Biswas [39] estimated that the built-up area in the KTM valley was approximately 143.0 km2 in 2013 and 156.64 km2 in 2021, and is projected to be approximately 169.68 km2 in 2041. Lamichhane and Shakya [36] also projected that the built-up area may increase by 130.57 km2 from 143.44 km2 in 2020 to 274.01 km2 in 2050. The estimated built-up area in 2050 based on an annual growth rate by Mesta et al. [35] was 352 km2, which is comparatively higher than the estimated value in this study and some previous studies. The built-up areas in the KTM valley were primarily converted from cropland areas. The cropland area in the future is expected to decrease by 62.04% by 2049, compared with the area in 2024. Previous studies also reported significant decreases in cropland area due to rapid urbanization in the study area [35,37]. Because of recent reforestation and conservation efforts, the forest area has increased and may further increase in the future. The increasing trend of forest area has also been reported in Bharti and Biswas [39].
Urbanization in the KTM valley may lead to an increase not only in river runoff but also in flood inundation extent and inundation volume. Further urbanization leads to higher river discharge and inundation volume during both peak and non-peak flow periods. This study also investigated increases in flood inundation extent with greater flood depth due to increases in built-up areas. The results highlighted that the increases in inundation area and peak inundation volume using the 2049 land cover map for the 2024 flood scale were approximately 11.56% and 17.48%, respectively, while they were about 10.66% and 15.04% for a 200-year flood. The increasing rate of flood inundation volume due to urbanization is comparatively higher than that of inundation extent, indicating larger inundation extent with greater flood depth may occur in the future. The KTM valley’s geographical characteristics include a bowl-shaped topography, surrounded by mountains, with alluvial and flood plains along the main Bagmati River and its tributaries. Because of KTM valley’s bowl-like shape topography, rainwater is channeled into the low-lying areas during heavy rainfall, increasing the flood volume. Flooding mainly occurs along the river and low land areas, and spreading of flood depends on topographical features. The intensity of rainfall and extreme weather events is increasing due to a combination of human-induced climate change and rapid urbanization, leading to more severe floods [36,37,38]. The KTM valley has experienced significant growth in built-up areas, leading to increased river channel encroachment and a higher risk of flooding. The expansion of settlement in flood-prone areas increases the exposure of people and assets to flood damage. Moreover, a significant reduction in forests and cropland has further worsened the flooding situation.
Urbanization significantly alters flooding characteristics, increasing both the frequency and magnitude of flood events [56,57] because of the conversion of natural landscapes to impervious surfaces that reduce water infiltration and increase surface runoff. As a result, the flood risk level will also change. Urbanization leads to a higher flood risk level in the KTM valley. This study highlighted that high-risk and very-high-risk areas may increase by 3.2% and 9.4%, respectively, by 2049 due to urbanization in the future. The study by Chaulagain et al. [34] for Kathmandu Metropolitan City (KMC) (part of the KTM valley) showed that about 56% of KMC is in the moderate flood potential zone, while 32% and 11% are in high and low flood potential zones, respectively. Mesta et al. [35] estimated that approximately 29% of the built-up areas will be in socially vulnerable areas in 2050. Chaudhary et al. [33] reported that around 80% of the KTM valley is in moderate to low flood susceptibility zones, and that about 14% is identified as highly flood susceptible. The very-high-risk areas are mainly along the Bagmati River or its tributaries in the central part of the valley. The central part of the valley is also prone to flooding due to the channeling and narrowing of the river width, which reduces the capacity of the river to carry the flow caused by heavy rainfall. Chaulagain et al. [34] also identified high and very high flood susceptibility areas along and near the rivers, while Chaudhary et al. [33] identified highly flood susceptibility zones in the southern part of the valley along the river and moderate flood susceptibility zones in the central part of the urban areas.
The previous study for the KTM valley by Chaudhary et al. [33] and Chaulagain et al. [34] primarily considered rainfall, topographical, and geological factors as hazard indicators. Moreover, these studies give limited attention to the effects of urbanization on flood hazards and the dynamic changes in LULC. However, this study considered flood depth and extent areas as key hazard factors. Flood depth and extent areas were simulated using hydrologic–hydraulic model considering the effects of urbanization, and the dynamic changes in LULC were also considered in assessing flood risk. The methodological framework presented in this study, which combines hydrologic–hydraulic model, machine learning techniques, and AHP-MCDA, provides detailed insights into flood risk mapping considering the effects of urbanization on flood hazards and the dynamic changes in LULC.
This study primarily focused on investigating the impact of urbanization on flooding and flood risk in the KTM valley. However, changes in LULC and urbanization also alter groundwater recharge areas, as reported in Lamichhane and Shakya [36]. This study showed that the cropland area in the valley may decrease by 62.04% by 2049 compared with that in 2024. The conversion of rechargeable land (e.g., cropland) to impervious land (e.g., built-up areas) due to urban expansion causes water scarcity in the KTM valley, as a significant portion of households in the valley rely on groundwater for their domestic use [36,37].
Preventing floods in the KTM Valley requires a comprehensive approach to managing it, including urban planning and infrastructure improvements like upgrading drainage systems, and implementing nature-based solutions like green spaces and permeable surfaces. Comprehensive flood risk management and spatial planning, combined with evidence-based assessment of the impact of urbanization on flooding and flood risk, as presented in this study, would help better manage future flood risk in the KTM valley. This approach involves combination of hazard analysis with vulnerability and exposure factors to formulate strategies, including disaster risk reduction, adaptation options, and effective policy for resilient urban development. The river channel encroachment is one of the key factors that makes the areas more prone to flooding; therefore, land use planning to restrict human interventions in flood plain areas can also help to reduce the flood impact in the valley. Moreover, effective impact-based early warning systems coupled with awareness raising and preparedness activities are crucial to mitigate flood disasters in the KTM valley. It can be implemented effectively by integrating risk knowledge, fostering coordination, data sharing with line agencies, monitoring and forecasting, dissemination of timely warnings, and preparedness and response measures.
5. Conclusions
This study focused on the analysis of LULC changes and the impact of urbanization on flooding and flood risk in the KTM valley of Nepal. Flood risk was assessed by integrating flood hazards based on hydrologic–hydraulic modeling and the AHP-MCDA approach. Satellite-based images are important for understanding changes in land systems, and how such changes impact flooding and flood risk can be assessed using hydrologic–hydraulic models. It is crucial to consider model-based hazard information in assessing flood risk, particularly for generating more reliable risk information. This study assessed risk levels under different LULC scenarios (i.e., the 2024 LULC and 2049 LULC), using flood hazard conditions simulated using a hydrologic–hydraulic model.
Urbanization in the KTM valley is rapidly expanding, primarily converting cropland areas to built-up areas, and may further expand in the future. Interestingly, an increasing trend of forest areas was also observed, which is due to reforestation and conservation efforts. The findings of this study showed that rapid urbanization increases flooding and flood risk in the KTM valley, indicating the necessity of effective protection measures. The expansion of built-up areas will increase both the extent and volume of flood inundation. The flood inundation extent and the peak inundation volume for a 200-year flood may increase in the future by 10.66% and 15.04%, respectively, due to rapid urban growth. This study also highlighted new insights into how risk levels and information change with urbanization or LULC changes. The findings of this study indicated that urbanization may lead to an expansion of high and very high flood-risk areas in the future by 3.2% and 9.4%, respectively, indicating the worsening of the valley’s vulnerability and the escalation of flood disaster severity. This highlights the impact of urban growth on flood risk. The combination of increased flood inundation extent and volume, with the concentration of people and infrastructure in the urban areas, results in greater exposure to flood hazards.
The results and findings presented in this study provide useful information for establishing land use regulations and flood prevention and adaptation measures. The assessment of urbanization impact on flooding and flood risk provides a basis for identifying areas at risk, which can be useful for planners and decision-makers to plan and implement flood prevention actions and land use regulations while taking into account the risk areas. The comprehensive risk assessment approaches presented in this study can provide a valuable framework for flood risk assessment in other areas. By combining hazard simulation using hydrologic–hydraulic model, LULC dynamics, and various machine-learning techniques can lead to comprehensive risk assessment, allowing for the analysis of LULC dynamics and the effects of urbanization on flooding and risk. The methodological framework presented in this study can be adapted to different regions to identify risk level considering LULC dynamics and analyze spatial patterns of flood exposures and risk, and also to provide actionable insights for urban planning and risk management.
The RRI model uses a diffusive wave approximation to perform flood dynamic simulations efficiently. For complex flood dynamic simulations, further improvements are needed in the model to produce more reliable results by considering detailed urban drainage networks and building structures, and also considering combinations of drainage or sewerage networks in urban areas. This study used globally available topographical data at 3 arc-second spatial resolution in the model for flood simulations for the entire catchment of the KTM valley, and the reliability of the flood inundation depth and extent areas can be further improved by incorporating ground-based elevation data, and detailed flood inundation simulation with finer spatial resolution can be beneficial. Because the river cross sectional data can hardly be obtained, this study used regime equations to calculate river depth and width. However, incorporation of river cross sectional data with the actual geometry shape of a river cross-section in a model simulation can further enhance the reliability of the flood simulation results.
This study predicted future urbanization or LULC based on change trends in LULC for historical periods, and further study should consider future policies on land use regulation or restriction zones or socio-economic factors in predicting urbanization growth and future LULC. This study used population density, buildings, land use and land cover, distance from rivers, and distance from major roads as exposure and vulnerability indicators, based on spatial data availability. However, future work should also consider other indicators, such as socioeconomic status, education and awareness, and age-related factors. In addition, it highlighted the impact of urbanization on flooding and flood risk, and did not take into account potential future impact of climate change. However, the combination of urbanization and climate change may further exacerbate flooding and flood risk in the future in the KTM valley, which needs to be investigated in future work. Therefore, further study should investigate the combined effects of climate change and LULC change on runoff and flood inundation to more accurately assess flood risk. Moreover, consideration of different climate and LULC scenarios to reflect potential future conditions and their combined effect on flooding events can be more beneficial.
Author Contributions
Conceptualization, B.B.S., M.R. and K.T.; methodology, B.B.S., M.R. and D.K.; validation, B.B.S.; formal analysis, B.B.S.; investigation, B.B.S.; data curation, B.B.S.; writing—original draft preparation, B.B.S.; writing—review and editing, B.B.S., M.R., K.T., S.J. and D.K.; visualization, B.B.S. All authors have read and agreed to the published version of the manuscript.
Funding
This work was supported by the Japan Society for the Promotion of Science (JSPS), KAKENHI Research Grant Number 24K07692.
Data Availability Statement
The sources data that support the findings of this study are available from the related organizations and the sources mentioned in this article.
Acknowledgments
The authors would like to thank the Department of Hydrology and Meteorology, Ministry of Energy, Water Resources and Irrigation, Government of Nepal, for providing the hydro-meteorological data.
Conflicts of Interest
The authors declare no conflicts of interest.
References
- Zhai, G.; Fukuzono, T.; Ikeda, S. Modeling flood damage: Case of Tokai Flood 2000. J. Am. Water Resour. Assoc. 2005, 41, 77–92. [Google Scholar] [CrossRef]
- Ranger, N.; Hallegatte, S.; Bhattacharya, S.; Bachu, M.; Priya, S.; Dhore, K.; Rafique, F.; Mathur, P.; Naville, N.; Henriet, F.; et al. An assessment of the potential impact of climate change on flood risk in Mumbai. Clim. Change 2011, 104, 139–167. [Google Scholar] [CrossRef]
- Pham, B.T.; Luu, C.; Phong, T.V.; Nguyen, H.D.; Le, H.V.; Tran, T.Q.; Ta, H.T.; Prakash, I. Flood risk assessment using hybrid artificial intelligence models integrated with multi-criteria decision analysis in Quang Nam Province, Vietnam. J. Hydrol. 2021, 592, 125815. [Google Scholar] [CrossRef]
- Martínez-Retureta, R.; Aguayo, M.; Stehr, A.; Sauvage, S.; Echeverría, C.; Sánchez-Pérez, J.-M. Effect of land use/cover change on the hydrological response of a southern center basin of Chile. Water 2020, 12, 302. [Google Scholar] [CrossRef]
- Besha, K.Z.; Demissie, T.A.; Feyessa, F.F. Effects of land use/land cover change on hydrological responses of a watershed in the Central Rift Valley of Ethiopia. Hydrol. Res. 2024, 55, 83. [Google Scholar] [CrossRef]
- Shrestha, B.B. Approach for analysis of land-cover changes and their impact on flooding regime. Quaternary 2019, 2, 27. [Google Scholar] [CrossRef]
- Yuliyanto, F.; Prasasti, I.; Pasaribu, J.M.; Fitriana, H.L.; Zylshal Haryani, N.S.; Sofan, P. The dynamics of land use/land cover change modeling and their implication for the flood damage assessment in the Tondano watershed, North Sulawesi, Indonesia. Model. Earth Syst. Environ. 2016, 2, 47. [Google Scholar] [CrossRef]
- Zope, P.E.; Eldho, T.I.; Jothiprakash, V. Impacts of land use-land cover change and urbanization on flooding: A case study of Oshiwara River basin in Mumbai, India. Catena 2016, 145, 142–154. [Google Scholar] [CrossRef]
- Kimoro, T.A.; Tachikawa, Y.; Takara, K. Distributed hydrologic simulations to analyze the impacts of land use changes on flood characteristics in the Yasu River basin in Japan. J. Nat. Disaster Sci. 2005, 27, 85–94. [Google Scholar]
- Banjara, M.; Bhusal, A.; Ghimire, A.B.; Karla, A. Impact of land use and land cover change on hydrological processes in urban watersheds: Analysis and forecasting for flood risk management. Geosciences 2024, 14, 40. [Google Scholar] [CrossRef]
- Wudineh, F.A. Land-use and land-cover change and its impact on flood hazard occurrence in Wabi Shebele River basin of Ethiopia. Hydrol. Res. 2023, 54, 756. [Google Scholar] [CrossRef]
- Löschner, L.; Herrnegger, M.; Apperl, B.; Senoner, T.; Seher, W.; Nachtnebel, H.P. Flood risk, climate change and settlement development: A micro-scale assessment of Austrian municipalities. Reg. Environ. Change 2017, 17, 311–322. [Google Scholar] [CrossRef]
- Tabasi, N.; Fereshtehpour, M.; Roghani, B. A review of flood risk assessment frameworks and the development of hierarchical structures for risk components. Discov. Water 2025, 5, 10. [Google Scholar] [CrossRef]
- Yu, J.; Zou, L.; Xia, J.; Chen, X.; Wang, F.; Zuo, L. A multi-dimensional framework for improving flood risk assessment: Application in the Han River basin, China. J. Hydrol. Reg. Stud. 2023, 47, 101434. [Google Scholar] [CrossRef]
- Wang, W.-J.; Kim, D.; Han, H.; Kim, K.T.; Kim Kim, H.S. Flood risk assessment using an indicator based approach combined with flood risk maps and grid data. J. Hydrol. 2023, 627, 130396. [Google Scholar] [CrossRef]
- Tu, Y.; Tang, Z.; Lev, B. Regional flood risk grading assessment considering indicator interactions among hazard, exposure, and vulnerability: A novel FlowSort with DBSCAN. J. Hydrol. 2024, 639, 131587. [Google Scholar] [CrossRef]
- Joo, H.; Choi, W.; Jeon, C. Selection of representative indicators for flood risk assessment using marginal entropy and mutual information. J. Flood Risk Manag. 2024, 17, e12976. [Google Scholar] [CrossRef]
- Kabenla, R.; Ampofo, S.; Owusu, G.; Atulley, J.A.; Ampadu, B. Application of analytical hierarchy process (AHP) and multi-criteria evaluation (MCE) for a case study and scenario assessment of flood risk in the White Volta basin of the Upper Eart Region, Ghana. Discov. Water 2024, 4, 90. [Google Scholar] [CrossRef]
- Seejata, K.; Yodying, A.; Wongthadam, T.; Mahavik, N.; Tantanee, S. Assessment of flood hazard areas using Analytical Hierarchy Process over the Lower Yom Bain, Sukhothai, Province. Procedia Eng. 2018, 212, 340–347. [Google Scholar] [CrossRef]
- Aichi, A.; Ikirri, M.; Haddou, M.A.; Quesada-Roman, A.; Sahoo, S.; Singha, C.; Sajinkumar, K.S.; Abioui, M. Integrated GIS and analytic hierarchy process for flood risk assessment in the Dades Wadi watershed (Central High Atlas, Morocco). Results Earth Sci. 2024, 2, 100019. [Google Scholar] [CrossRef]
- Mokhtari, E.; Mezali, F.; Abdelkebir, B.; Engel, B. Flood risk assessment using analytical hierarchy process: A case study from the Cheliff-Ghrib watershed, Algeria. Water Clim. Change 2023, 14, 694. [Google Scholar] [CrossRef]
- Gacu, J.G.; Monjardin, C.E.E.; Senoro, D.B.; Tan, F.J. Flood risk assessment using GIS-based analytical hierarchy process in the municipality of Odiongan, Romblon, Philippines. Appl. Sci. 2022, 12, 9456. [Google Scholar] [CrossRef]
- Ullah, N.; Tariq, A.; Qasim, S.; Panezai, S.; Uddin, M.G.; Wadud, M.A.-A.; Ullah, S. Geospatial analysis and AHP for flood risk mapping in Quetta, Pakistan: A tool for disaster management and mitigation. Appl. Water Sci. 2024, 14, 236. [Google Scholar] [CrossRef]
- Zhran, M.; Ghanem, K.; Tariq, A.; Alshehri, F.; Jin, S.; Das, J.; Pande, C.B.; Pramanik, M.; Hasher, F.F.B.; Mousa, A. Exploring a GIS-based analytic hierarchy process for spatial flood risk assessment in Egypt: A case study of the Damietta branch. Environ. Sci. Eur. 2024, 36, 184. [Google Scholar] [CrossRef]
- Ghosh, A.; Kar, S.K. Application of analytical hierarchy process (AHP) for flood risk assessment: A case study in Malda district of West Bengal, India. Nat. Hazards 2018, 94, 349–368. [Google Scholar] [CrossRef]
- Malla, S.; Ohgushi, K. Flood vulnerability map of the Bagmati River basin, Nepal: A comparative approach of the analytical hierarchy process and frequency ratio model. Smart Constr. Sustain. Cities 2024, 2, 16. [Google Scholar] [CrossRef]
- Saikh, N.I.; Mondal, P. GIS-based machine learning algorithm for flood susceptibility analysis in the Pagla river basin, Eastern India. Nat. Hazards Res. 2023, 3, 420–436. [Google Scholar] [CrossRef]
- Singha, C.; Rana, V.K.; Pham, Q.B.; Nguyen, D.C.; Lupikasza, E. Integrating machine learning and geospatial data analysis for comprehensive flood hazard assessment. Environ. Sci. Pollut. Res. 2024, 31, 48497–48522. [Google Scholar] [CrossRef]
- Zhang, J. A flood hazard prediction and risk assessment model based on machine learning approach. Highlights Sci. Eng. Technol. 2025, 136, 112–120. [Google Scholar] [CrossRef]
- Saber, M.; Boulmaiz, T.; Guermoui, M.; Abdrabo, K.I.; Kantoush, S.A.; Sumi, T.; Boutaghane, H.; Tomoharu, H.; Binh, D.V.; Nguyen, B.Q.; et al. Enhancing flood risk assessment through integration of ensemble learning approaches and physical-based hydrological modeling. Geomat. Nat. Hazards Risk 2023, 14, 2203798. [Google Scholar] [CrossRef]
- Sun, X.; Jin, K.; Tao, H.; Duan, Z.; Gao, C. Flood risk assessment based on hydrodynamic model-a case of the China-Pakistan Economic Corridor. Water 2023, 15, 4295. [Google Scholar] [CrossRef]
- Duy, N.H.; Pham, L.T.; Linh, N.X.; Trung, T.V.; Dang, D.K.; Hai, T.Q.; Bui, Q.-T. Flood risk assessment using machine learning, hydrodynamic modelling, and the analytic hierarchy process. J. Hydroinform. 2024, 26, 1852. [Google Scholar] [CrossRef]
- Chaudhary, U.; Shah, M.A.R.; Shakya, B.M.; Aryal, A. Flood susceptibility and risk mapping of Kathmandu valley watershed, Nepal. Sustainability 2024, 16, 7101. [Google Scholar] [CrossRef]
- Chaulagain, D.; Rimal, P.R.; Ngando, S.N.; Nsafon, B.E.K.; Suh, D.; Huh, J.-S. Flood susceptibility mapping of Kathmandu metropolitan city using GIS-based multi-criteria decision analysis. Ecol. Indic. 2023, 154, 110653. [Google Scholar] [CrossRef]
- Mesta, C.; Cremen, G.; Galasso, C. Urban growth modelling and social vulnerability assessment for a hazardous Kathmandu Valley. Sci. Rep. 2022, 12, 6152. [Google Scholar] [CrossRef]
- Lamichhane, S.; Shakya, N.M. Alteration of groundwater recharge areas due to land use/cover change in Kathmandu Valley, Nepal. J. Hydrol. Reg. Stud. 2019, 26, 100635. [Google Scholar] [CrossRef]
- Acharya, S.; Hori, T.; Karki, S. Assessing the spatio-temporal impact of landuse landcover change on water yield dynamics of rapidly urbanizing Kathmandu valley watershed of Nepal. J. Hydrol. Reg. Stud. 2023, 50, 101562. [Google Scholar] [CrossRef]
- Shrestha, S.; Poudyal, K.N.; Bhattarai, N.; Dangi, M.B.; Boland, J.J. An assessment of the impact of land use and land cover change on the degradation of ecosystem service values in Kathmandu valley using remote sensing and GIS. Sustainability 2022, 14, 15739. [Google Scholar] [CrossRef]
- Bharti, P.; Biswas, A. Predicting urban growth of Kathmandu Valley using artificial intelligence. J. Geovisualization Spat. Anal. 2024, 8, 40. [Google Scholar] [CrossRef]
- Aryal, A.; Bhatta, K.P.; Adhikari, S.; Baral, H. Scrutinizing urbanization in Kathmandu using google earth engine together with proximity-based scenario modelling. Land 2023, 12, 25. [Google Scholar] [CrossRef]
- Devkota, P.; Dhakal, S.; Shrestha, S.; Shrestha, U.B. Land use land cover changes in the major cities of Nepal from 1990 to 2020. Environ. Sustain. Indic. 2023, 17, 100227. [Google Scholar] [CrossRef]
- Wang, S.W.; Gebru, B.M.; Lamchin, M.; Kayastha, R.B.; Lee, W.-K. Prediction in the Kathmandu district of Nepal using remote sensing and GIS. Sustainability 2020, 12, 3925. [Google Scholar] [CrossRef]
- Reis, S. Analyzing land use/land cover changes using remote sensing and GIS in Rize, North-East Turkey. Sensors 2008, 8, 6188–6202. [Google Scholar] [CrossRef]
- Banjade, S.S.; Rai, N.; Subedi, B. Comparison of Supervised Classification Algorithms Using a Hyperspectral Image for Land Use/Land Cover Classification. Environ. Sci. Proc. 2024, 29, 59. [Google Scholar] [CrossRef]
- Abbas, Z.; Yang, G.; Zhong, Y.; Zhao, Y. Spatiotemporal change analysis and future scenario of LULC using the CA-ANN approach: A case study of the Greater Bay Area, China. Land 2021, 10, 584. [Google Scholar] [CrossRef]
- Baig, M.F.; Mustafa, M.R.U.; Baig, I.; Takaijudin, H.B.; Zeshan, M.T. Assessment of land use land cover changes and future predictions using CA-ANN simulation for Selangor, Malaysia. Water 2022, 14, 402. [Google Scholar] [CrossRef]
- Dawid, W.; Bielecka, E. GIS-based land cover analysis and prediction based on open-source software and data. Quaest. Geogr. 2022, 41, 75–86. [Google Scholar] [CrossRef]
- Muhammad, R.; Zhang, W.; Abbas, Z.; Guo, F.; Gwiazdzinski, L. Spatiotemporal change analysis and prediction of future land use and land cover changes using QGIS MOLUSCE plugin and remote sensing big data: A case study of Linyi, China. Land 2022, 11, 419. [Google Scholar] [CrossRef]
- Pandi, D.; Kothandaraman, S.; Kumarasamy, M.V.; Kuppusamy, M. Assessment of land use and land cover dynamics using geospatial techniques. Pol. J. Environ. Stud. 2022, 31, 2779–2786. [Google Scholar] [CrossRef]
- Kamaraj, M.; Rangarajan, S. Predicting the future land use and land cover changes for Bhavani basin, Tamil Nadu, India, using QGIS MOLUSCE plugin. Environ. Sci. Pollut. Res. 2022, 29, 86337–86348. [Google Scholar] [CrossRef]
- Sayama, T.; Ozawa, G.; Kawakami, T.; Nabesaka, S.; Fukami, K. Rainfall-runoff-inundation analysis of the 2010 Pakistan flood 2010 in the Kabul River basin. Hydrol. Sci. J. 2012, 57, 298–312. [Google Scholar] [CrossRef]
- Ologhadien, I. Study of unbiased plotting position formulae for the Generalized Extreme Value (GEV) distribution. Eur. J. Eng. Technol. Res. 2021, 6, 94–99. [Google Scholar] [CrossRef]
- Shrestha, B.B.; Perera, E.D.P.; Kudo, S.; Miyamoto, M.; Yamazaki, Y.; Kuribayashi, D.; Sawano, H.; Sayama, T.; Magome, J.; Hasegawa, A.; et al. Assessing flood disaster impacts in agriculture under climate change in the river basins of Southeast Asia. Nat. Hazards 2019, 97, 157–192. [Google Scholar] [CrossRef]
- Goepel, K.D. Implementing the Analytic Hierarchy Process as a standard method for Multi-Criteria Decision Making in corporate enterprises—A new AHP excel template with multiple inputs. In Proceedings of the International Symposium on the Analytic Hierarchy Process, Kuala Lumpur, Malaysia, 23–26 June 2013. [Google Scholar] [CrossRef]
- Saaty, T.L. Decision making with the analytic hierarchy process. Int. J. Serv. Sci. 2008, 1, 83–98. [Google Scholar] [CrossRef]
- Feng, B.; Zhang, Y.; Bourke, R. Urbanization impacts on flood risks based on urban growth data and coupled flood models. Nat. Hazards 2021, 106, 613–627. [Google Scholar] [CrossRef]
- Talbi, S.; Gherzouli, L.; Fezzai, S. Mapping land use change to analyze urbanization and its impact on urban floods in Tebessa City, Algeria. Int. Rev. Spat. Plan. Sustain. Dev. 2025, 13, 30–55. [Google Scholar] [CrossRef]
Disclaimer/Publisher’s Note: The statements, opinions and data contained in all publications are solely those of the individual author(s) and contributor(s) and not of MDPI and/or the editor(s). MDPI and/or the editor(s) disclaim responsibility for any injury to people or property resulting from any ideas, methods, instructions or products referred to in the content. |
© 2025 by the authors. Licensee MDPI, Basel, Switzerland. This article is an open access article distributed under the terms and conditions of the Creative Commons Attribution (CC BY) license (https://creativecommons.org/licenses/by/4.0/).