Article

Mechanisms of Soil Aggregate Stability Influencing Slope Erosion in North China

1
Experimental Center of Forestry in North China, Chinese Academy of Forestry, Beijing 102300, China
2
National Permanent Scientific Research Base for Warm Temperate Zone Forestry of Jiulong Mountain in Beijing, Beijing 102300, China
3
Institute of Ecological Conservation and Restoration, Chinese Academy of Forestry, Beijing 100091, China
*
Authors to whom correspondence should be addressed.
Hydrology 2025, 12(10), 267; https://doi.org/10.3390/hydrology12100267
Submission received: 18 August 2025 / Revised: 20 September 2025 / Accepted: 30 September 2025 / Published: 10 October 2025
(This article belongs to the Section Soil and Hydrology)

Abstract

Soil aggregate stability plays a central role in mediating slope erosion, a key ecological process in North China. This study aimed to investigate how aggregate structures (reflected by rainfall intensity and vegetation-type differences) influence the erosion process. Using wasteland as the control, we conducted artificial simulated rainfall experiments on soils covered by Quercus variabilis, Platycladus orientalis, and shrubs, with three rainfall intensity gradients. Key findings showed that Platycladus orientalis exhibited the strongest infiltration capacity and longest runoff initiation delay due to its high proportion of stable macroaggregates (>0.25 mm), while barren land readily formed surface crusts, leading to the fastest runoff. Increased rainfall intensity significantly exacerbated runoff and erosion. When the macroaggregate content exceeded 60%, sediment yield rates dropped sharply, with a significant negative exponential relationship between the mean weight diameter (MWD) and sediment yield; barren land (dominated by microaggregates) faced the highest erosion risk and fell into an erosion–fragmentation vicious cycle. Redundancy analysis revealed that microbial communities (e.g., Ascomycota) and fine roots were dominant erosion-controlling factors under heavy rainfall. Ultimately, the synergistic system of the macroaggregate architecture and root-microbial cementation enabled Platycladus orientalis and other tree stands to reduce soil erodibility via maintaining aggregate stability, whereas shrubs and barren land amplified rainfall intensity effects. barren landbarren landmm·h−1 mm·h−1 mm·h−1 barren land.

1. Introduction

As the fundamental unit of soil erosion, slope erosion is primarily driven by rainfall and runoff, involving the detachment, transport, and deposition of soil particles. Specifically, the process encompasses rainfall infiltration, raindrop detachment and transport, raindrop detachment–runoff transport, runoff detachment and transport, and in situ deposition [1,2,3]. This complex process is jointly regulated by rainfall factors (intensity, kinetic energy, and duration), soil factors (antecedent moisture, aggregate stability, texture, and porosity), and environmental factors (slope, vegetation cover, and surface mulch). Among these, rainfall characteristics—especially kinetic energy and intensity—and soil aggregate stability are widely recognized as the key determinants of slope erosion [4,5,6]. Recent global studies have further emphasized that the stability of these aggregates is not merely a physical property but is profoundly mediated by soil microbial ecology, particularly through the production of binding agents like extracellular polymeric substances (EPS) and fungal hyphae that reinforce the soil structure [7]. Raindrop impact directly acts on soil aggregates, causing their fragmentation. The resulting fine particles clog soil pores, promoting the formation of surface crusts. This significantly reduces soil infiltration rates, increases surface runoff, and ultimately enhances the flow’s capacity to detach and transport soil particles [8,9]. As rainfall intensity increases and the runoff depth deepens, soil erosion typically increases exponentially [10,11].
The intensity of slope erosion is fundamentally determined by the interaction between subsurface structural characteristics and rainfall properties. Rainfall serves as the source of runoff, and its intensity variations significantly influence surface water partitioning and erosion processes. Notably, within erosive rainfall events—typically defined as those exceeding 12.7 mm [12])—heavy-intensity rainfall and storm events often constitute the primary contributors to severe soil loss [13,14,15]. However, most existing models and mechanisms are derived from studies at low to moderate intensities (<60 mm·h−1), creating a predictive uncertainty under the extreme rainfall regimes that are becoming more frequent due to climate change. Therefore, it is both critical and urgent to conduct in-depth research on the impact of heavy-intensity rainfall (significantly exceeding the commonly studied 30 mm·h−1 threshold) on slope erosion. Among subsurface characteristics, topography, surface cover, and soil structure—particularly aggregates—collectively determine soil erosion resistance and infiltration properties. Under consistent conditions of topography and surface cover, soil aggregate architecture and particle composition become the core intrinsic factors governing variations in slope erosion [16,17,18]. Crucially, these aggregates are biogenic structures; their formation and stability are heavily dependent on soil organic carbon content and the activity of specific microbial communities, such as fungi, which can be drastically altered by vegetation-type practices [19]. The interaction between rainfall characteristics and subsurface soil properties—particularly aggregate structures—profoundly regulates the entire slope erosion process by altering surface micromorphology. The mountainous areas of Beijing serve as a critical ecological barrier for the city yet it suffers from severe soil erosion, with an average annual rainfall erosivity of 3465.06 MJ·mm·ha−1·h−1·yr−1 [20]. This erosivity is projected to increase in the future. Characterized by a fragmented topography and complex landforms, the region experiences concentrated rainfall during summer and autumn, leading to intensive slope erosion. In recent years, the increasing frequency of storm events has become the dominant contributor to Beijing’s total soil loss, accounting for 55–68% of erosion [20]. Beijing is facing greater potential pressure from soil erosion [21], making soil and water loss particularly severe in its rocky mountainous areas. This has led to topsoil thinning, thereby causing a decline in forest ecosystem productivity.
Based on the aforementioned background and research gaps, we propose the following research hypotheses: (1) Land-use types will exhibit significant differences in soil aggregate stability, with arbor-covered soils (Quercus variabilis and Platycladus orientalis) having higher macroaggregate (>0.25 mm) content, stronger infiltration capacity, and lower erosion rates compared to shrubland and barren land; (2) increased rainfall intensity will enhance runoff generation and sediment yield across all land uses, but the magnitude of this enhancement will be smaller in land uses with a higher aggregate stability (e.g., Platycladus orientalis); (3) under heavy rainfall (≥60 mm·h−1), microbial communities (e.g., Ascomycota) and fine roots will act as the dominant regulators of erosion by reinforcing aggregate stability, thereby mitigating the adverse effects of high-intensity rainfall on slope erosion.

2. Materials and Methods

2.1. Site Description

This study is located in Jiufeng National Forest Park (40°03′46″ N, 116°05′45″ E) in the mountainous region of northern China, covering a forested area of approximately 832.04 km2 (Figure 1). Situated in a warm-temperate, semi-humid to semi-arid monsoon climate zone, the Beijing area experiences four distinct seasons: Spring features rapid temperature rise, short duration, scarce rainfall, and intense evaporation, often accompanied by strong winds and significant diurnal temperature fluctuations; summer brings high temperatures and concentrated rainfall; autumn offers moderate temperatures but is brief with rapid cooling; and winter is characterized by prolonged cold, limited snowfall, dry conditions, and frequent strong winds. With an average elevation of 500 m, the region has a mean annual temperature of 11.6 °C and mean annual precipitation of 650 mm. Precipitation distribution is uneven, with over 85% concentrated between July and September when rainstorms occur frequently. Over the past 30 years, this area has exhibited declining total precipitation, increased frequency of extreme rainstorm events, and a persistent warming–drying climatic trend.
This study selected four typical vegetation types: Quercus variabilis (Q.var), Platycladus orientalis (P.lat), shrubland (Shr), and barren land (Bar), with an additional selection of other undeveloped barren land serving as the control. To eliminate interference from varying site conditions on soils across vegetation types, plots with relatively consistent topography and elevation were selected. Basic characteristics of these vegetation-type plots are presented in Table 1, with three replicate plots established for each vegetation type.

2.2. Field-Based Simulated Rainfall Experiment

This study employed the BX-1 portable field rainfall simulator independently developed by the College of Water Resources and Architectural Engineering, Northwest A&F University. The simulator adopts a downward-spraying copper nozzle design (nozzle aperture: 0.5 mm; spray angle: 30° fan-shaped distribution) to ensure that the falling speed of raindrops (approximately 7–9 m·s−1) and raindrop size distribution (dominated by 1.0–2.5 mm, accounting for 75% of total raindrops) are consistent with natural rainfall in the study area, thereby accurately simulating the kinetic energy of natural rainfall. The simulator was configured at three rainfall intensity gradients (30 mm·h−1, 80 mm·h−1, and 120 mm·h−1) based on the historical extreme rainfall data of Beijing’s mountainous areas. Before each experiment, rainfall intensity calibration was conducted: 9 standard rain gauges (caliber: 20 cm; precision: ±0.1 mm) were evenly arranged in a 3 × 3 grid within the 2 m × 5 m effective rainfall coverage of the simulator (to fully cover the smallest experimental plot, i.e., 2 m × 2 m for barren land), and rainfall was collected continuously for 10 min. The actual rainfall intensity was calculated by the average water depth in the rain gauges, with the calibration error controlled within ±5% to ensure the accuracy of the set intensity. The rainfall uniformity was strictly controlled above 80%, and the uniformity was rechecked every 15 min during the experiment to avoid deviations caused by nozzle blockage. The rainfall height was fixed at 6 m, which was determined by pre-experiments to ensure that raindrops could reach terminal velocity before hitting the soil surface, eliminating the influence of insufficient kinetic energy due to short falling distance. To minimize interference from wind and other environmental factors, experiments were conducted either during windless periods (wind speed < 1.5 m·s−1, monitored by a handheld anemometer) or with the installation of windbreak walls (material: high-density polyethylene; height: 6 m; and width: 4 m) along the predominant wind direction (northwest, consistent with the annual dominant wind direction of the study area). The windbreak walls were installed 3 m away from the upwind side of the plots to avoid affecting the airflow above the soil surface while blocking external wind. To ensure consistent effective rainfall coverage across all treatments, a custom 1 m × 1 m baffle was used to enclose the rainfall area, defining the actual wetted area as 1 m2. Meanwhile, a rain gauge (accuracy: 0.1 mm) was placed within the wetted area to calibrate rainfall uniformity in real time, ensuring it remained above 80%. Additionally, the same type of sprinkler head (dedicated to BX-1 simulator, Northwest A&F University, Xian, China) was used for all experiments, and rainfall height (6 m) was kept consistent, further eliminating the influence of total plot area differences on runoff and sediment yield measurements. To investigate the impact of soil aggregate stability on erosion, this simulated rainfall experiment excluded tree trunks from the rainfall exposure area (by wrapping trunks with waterproof plastic sheets) and removed aboveground portions of shrubs to minimize vegetation interception and ground cover effects on rainfall erosion; additionally, all slope erosion plots were uniformly set at a 15° gradient (adjusted by a laser level) to reduce variations attributable to slope differences. The total rainfall duration was set at 1 h, with runoff and sediment samples collected at 3 min intervals. To ensure experimental accuracy, three replicate trials were conducted for each rainfall event, resulting in 36 actual simulation runs. During rainfall, the time to runoff initiation was recorded (using a stopwatch, accurate to 1 s); after runoff commenced, runoff was collected every 3 min using a 10 L plastic bucket while simultaneously documenting runoff volumes (weighed by an electronic balance, precision: ±1 g). After weighing the samples, the soil–water mixtures were transferred to plastic bottles for laboratory sediment particle classification, following the same procedure as described earlier.

2.3. Laboratory Analysis

2.3.1. Soil Aggregate Stability

A modified wet sieving method described by [22] was used to quantify the proportion of water stable aggregates (WSA). For the control (CK) samples (undisturbed soil collected before rainfall simulation), air-dried soils were first passed through a 5 mm sieve to remove stones and plant residues, and aggregates in the 5–0.25 mm size range were selected to ensure consistency in initial aggregate sizes across treatments. A stack of sieves (5 mm, 2 mm, 1 mm, 0.5 mm, 0.25 mm, and 0.05 mm) was immersed in a water bucket. Approximately 50 g of the pre-treated CK aggregates (or air-dried soils for eroded sediment samples) were slowly wetted to avoid sudden rupture of the aggregates, then placed at the top of the sieve stack. The sieves were moved up and down in the water over a 3 cm cycle for 10 min to ensure that the surface of the sieves was completely soaked in the water. The stable soils on each sieve were transferred into an aluminum specimen box, oven-dried at 40 °C for 48 h, and weighed. The soil aggregate stability was expressed as a proportion of >0.25 mm water-stable aggregate (WSA0.25, mm) and mean weight diameter (MWD, mm) by wet sieving. The formula for calculating MWD is as follows:
M W D = i = 1 n W i × X i
where Wi is the mean diameter of aggregate fraction i, while Xi is the mass proportion of aggregate fraction i.

2.3.2. Physicochemical Properties

Soil samples for these physicochemical analyses were the same as those in Section 2.3.1 (undisturbed topsoil 0–10 cm depth before rainfall simulation) and used to analyze basic soil properties. Sand, silt, and clay contents: Determined using a Laser Particle Sizer (Malvem 3000, Microtrac, Great Malvern, UK). Soil organic carbon (SOC): Measured using a Multi N/C 3100 analyzer (Analytik Jena AG, Jena, Germany). Cation Exchange Capacity (CEC): Determined with a Kjeldahl distillation apparatus (KDY-9820, Beijing Century Science & Technology Development Co., Ltd., Beijing, China) via the ammonium acetate method (pH = 7.0). Soil pH: Measured using a pH meter (PHS-3C, Shanghai INESA Scientific Instrument Co., Ltd., Shanghai, China) with a soil–water ratio of 1:2.5 (mass–volume). Total nitrogen (Total N): Determined using a Kjeldahl distillation apparatus (KDY-9820, Beijing Century Science & Technology Development Co., Ltd., Beijing, China) via the Kjeldahl method. Total phosphorus (Total P): Measured using a spectrophotometer (UV-2600, Shimadzu, Kyoto, Japan) via the sulfuric acid–perchloric acid digestion-molybdenum antimony anti-spectrophotometric method.

2.3.3. High-Throughput DNA Sequencing and Analysis

DNA was extracted by a DNA extraction kit for the soil samples [23]. The NanoDrop One (Thermo Fisher Scientific, Massachusetts, USA) determined the purity and concentration. To enhance the V3-V4 hypervariable regions of the 16S rRNA gene for bacterial diversity used by the primers 806R (5′-GGACTAVVGGGTATCTAATC-3′) and 515F (5′- GTGCCAGCMGCCGCGG-3′) [24]. To enhance the ITS1 regions of the 18S rRNA gene for fungal diversity used by the primers ITS1F (5′- CTTGGTCATTTAGAGGAAGTAA-3′) and ITS2R (5′- GCTGCGTTC TTCATCGATGC-3′) [25]. According to the recommendations of manufacturer, the NEBNext® Ultra™ II DNA Library Prep Kit for Illumina® (New England Biolabs, Massachusetts, USA) was used to generate sequencing libraries, and index codes were added. A Qubit@ 2.0 Fluorometer (Thermo Fisher Scientific, Massachusetts, USA) was used to evaluate the library quality. At last, the Illumina Nova6000 platform was used for PE250 sequencing of the constructed amplicon library, and obtained 250 bp paired-end reads. Sequencing was performed at the Guangdong Magigene Biotechnology Co., Ltd. Guangzhou, China.

2.3.4. Vegetation Root Sampling

Root sampling was conducted in the same 3 replicate plots per vegetation type, focusing on fine roots (<2 mm diameter) (key for soil aggregate binding and erosion resistance). For each plot, 3 soil monoliths (10 cm × 10 cm × 20 cm, length × width × depth) were collected using a stainless steel root sampler at the 5-point sampling locations (randomly selecting 3 of the 5 points to reduce plot disturbance).
On-site processing steps include the following: (1) immerse the soil monolith in deionized water for 10 min to soften the soil matrix; (2) gently rinse the soil monolith under low-flow deionized water using a 0.5 mm mesh sieve to separate roots from soil particles (avoiding root breakage by controlling water flow velocity < 0.5 m·s−1); (3) manually pick out residual soil particles attached to roots with fine-tipped forceps (sterilized with 75% ethanol); (4) classify roots by diameter, retain fine roots (<2 mm) for subsequent analysis, and discard coarse roots (>2 mm); and (5) place fine roots in a labeled polyethylene bottle containing 50% ethanol solution (to preserve root structure) and transport to the laboratory for WinRhizo(Regent Instruments Inc, Quebec, Canada) scanning and mycorrhizal colonization determination.

2.3.5. Soil Sampling for Microbial Communities

Microbial samples were collected simultaneously with soil aggregate samples, following sterile operation protocols to avoid cross-contamination. At each 5-point sampling location, a sterile soil auger (autoclaved at 121 °C for 30 min, wiped with 75% ethanol before each use) was used to collect 0–20 cm soil. Each sub-sample (≈100 g) was immediately transferred to a sterile centrifuge tube (pre-labeled with plot ID, rainfall intensity, and sampling time).
To maintain microbial activity and avoid community structure changes, the centrifuge tubes were quickly placed in a portable liquid nitrogen tank (−196 °C) for cryopreservation on-site. After completing sampling for all plots, samples were transported to the laboratory within 4 h and stored at −80 °C until phospholipid fatty acid (PLFA) extraction. No freeze–thaw cycles were allowed during the entire process to prevent microbial cell lysis.

2.3.6. Root Length and Mycorrhizal Colonization

Total root length was scanned and analyzed using a WinRhizo Pro 2005 (Regent Instruments Inc., Québec City, QC, Canada). To quantify mycorrhizas structures, roots were stained in 10% ink and 10% acetic acid, then destained with lactoglycerol. Finally, the roots were observed at 200 magnification using an optical microscope, as described by Rillig et al., [26]. The colonization rate of mycorrhizas was calculated as follows:
Mycorrhizal   colonization   rate   ( F ,   % ) = ( Colonized   root   length / Totalroot   length ) × 100 %

2.4. Soil Erodibility Calculation

Soil erodibility was calculated using the Revised Universal Soil Loss Equation (RUSLE), with data derived from field-based simulated rainfall experiments.
K = A R L S C P
In the equation, A represents the soil loss rate (t·ha−1·min−1); R is the rainfall erosivity factor (MJ·mm·ha−1·min−1); L denotes the slope length factor; S is the slope steepness factor; P is the support practice factor; and C is the cover management factor, with both P and C set to 1.
The rainfall erosivity factor R was calculated using the formula from Foster et al., [27]:
E = i = 1 n e r P r
e r = 0.29 [ 1 0.72 e 0.082 I r ]
R = E I r
In the equation, E represents the rainfall energy per storm event (MJ·ha−1·min−1); Pr denotes the rainfall amount per minute (mm·min−1); er is the rainfall energy during the r-th minute (MJ·ha−1·min−1); and Ir stands for rainfall intensity during the r-th minute (mm·min−1).
To ensure consistency in slope length factor (L) calculation across all treatments, the length of all rainfall simulation plots along the slope direction was uniformly set to 4.6 m (width = 1 m). This plot length meets the application condition of the L factor formula recommended by Kinnell [28]; thus, when calculating the L factor, the following formula was used [28,29]:
L   =   ( 4.6 / 22.1 ) m
S   = 3.0 ( sin θ ) 0.8 + 0.56
In the equation, m is assigned a constant value of 0.50, and θ represents the slope gradient, set at 15°.

2.5. Statistical Analysis

Statistical analyses were performed using SPSS 20.0 (SPSS, Chicago, IL, USA). One-way analysis of variance (ANOVA) was used to test the significance of differences in key parameters (infiltration rate, runoff production rate, sediment yield, soil erodibility K-factor, mean weight diameter MWD, and water-stable macroaggregate content WSA0.25) among different vegetation types (Quercus variabilis, Platycladus orientalis, and shrubland) and non-vegetated land (barren land). Statistical significance was set at p < 0.05, and all results were presented as mean ± standard error. Redundancy analysis (RDA) was used to determine the correlation between soil aggregation and abiotic factors, biotic factors, and abiotic/biotic factors. Before analysis, the Monte Carlo permutation test was used to identify significant factors, and the analyses were performed using Canoco 5.0 for Windows (Microcomputer Power, Ithaca, NY, USA).

3. Results and Discussion

3.1. Variations in Infiltration and Runoff Generation Across Different Vegetation-Type Slopes

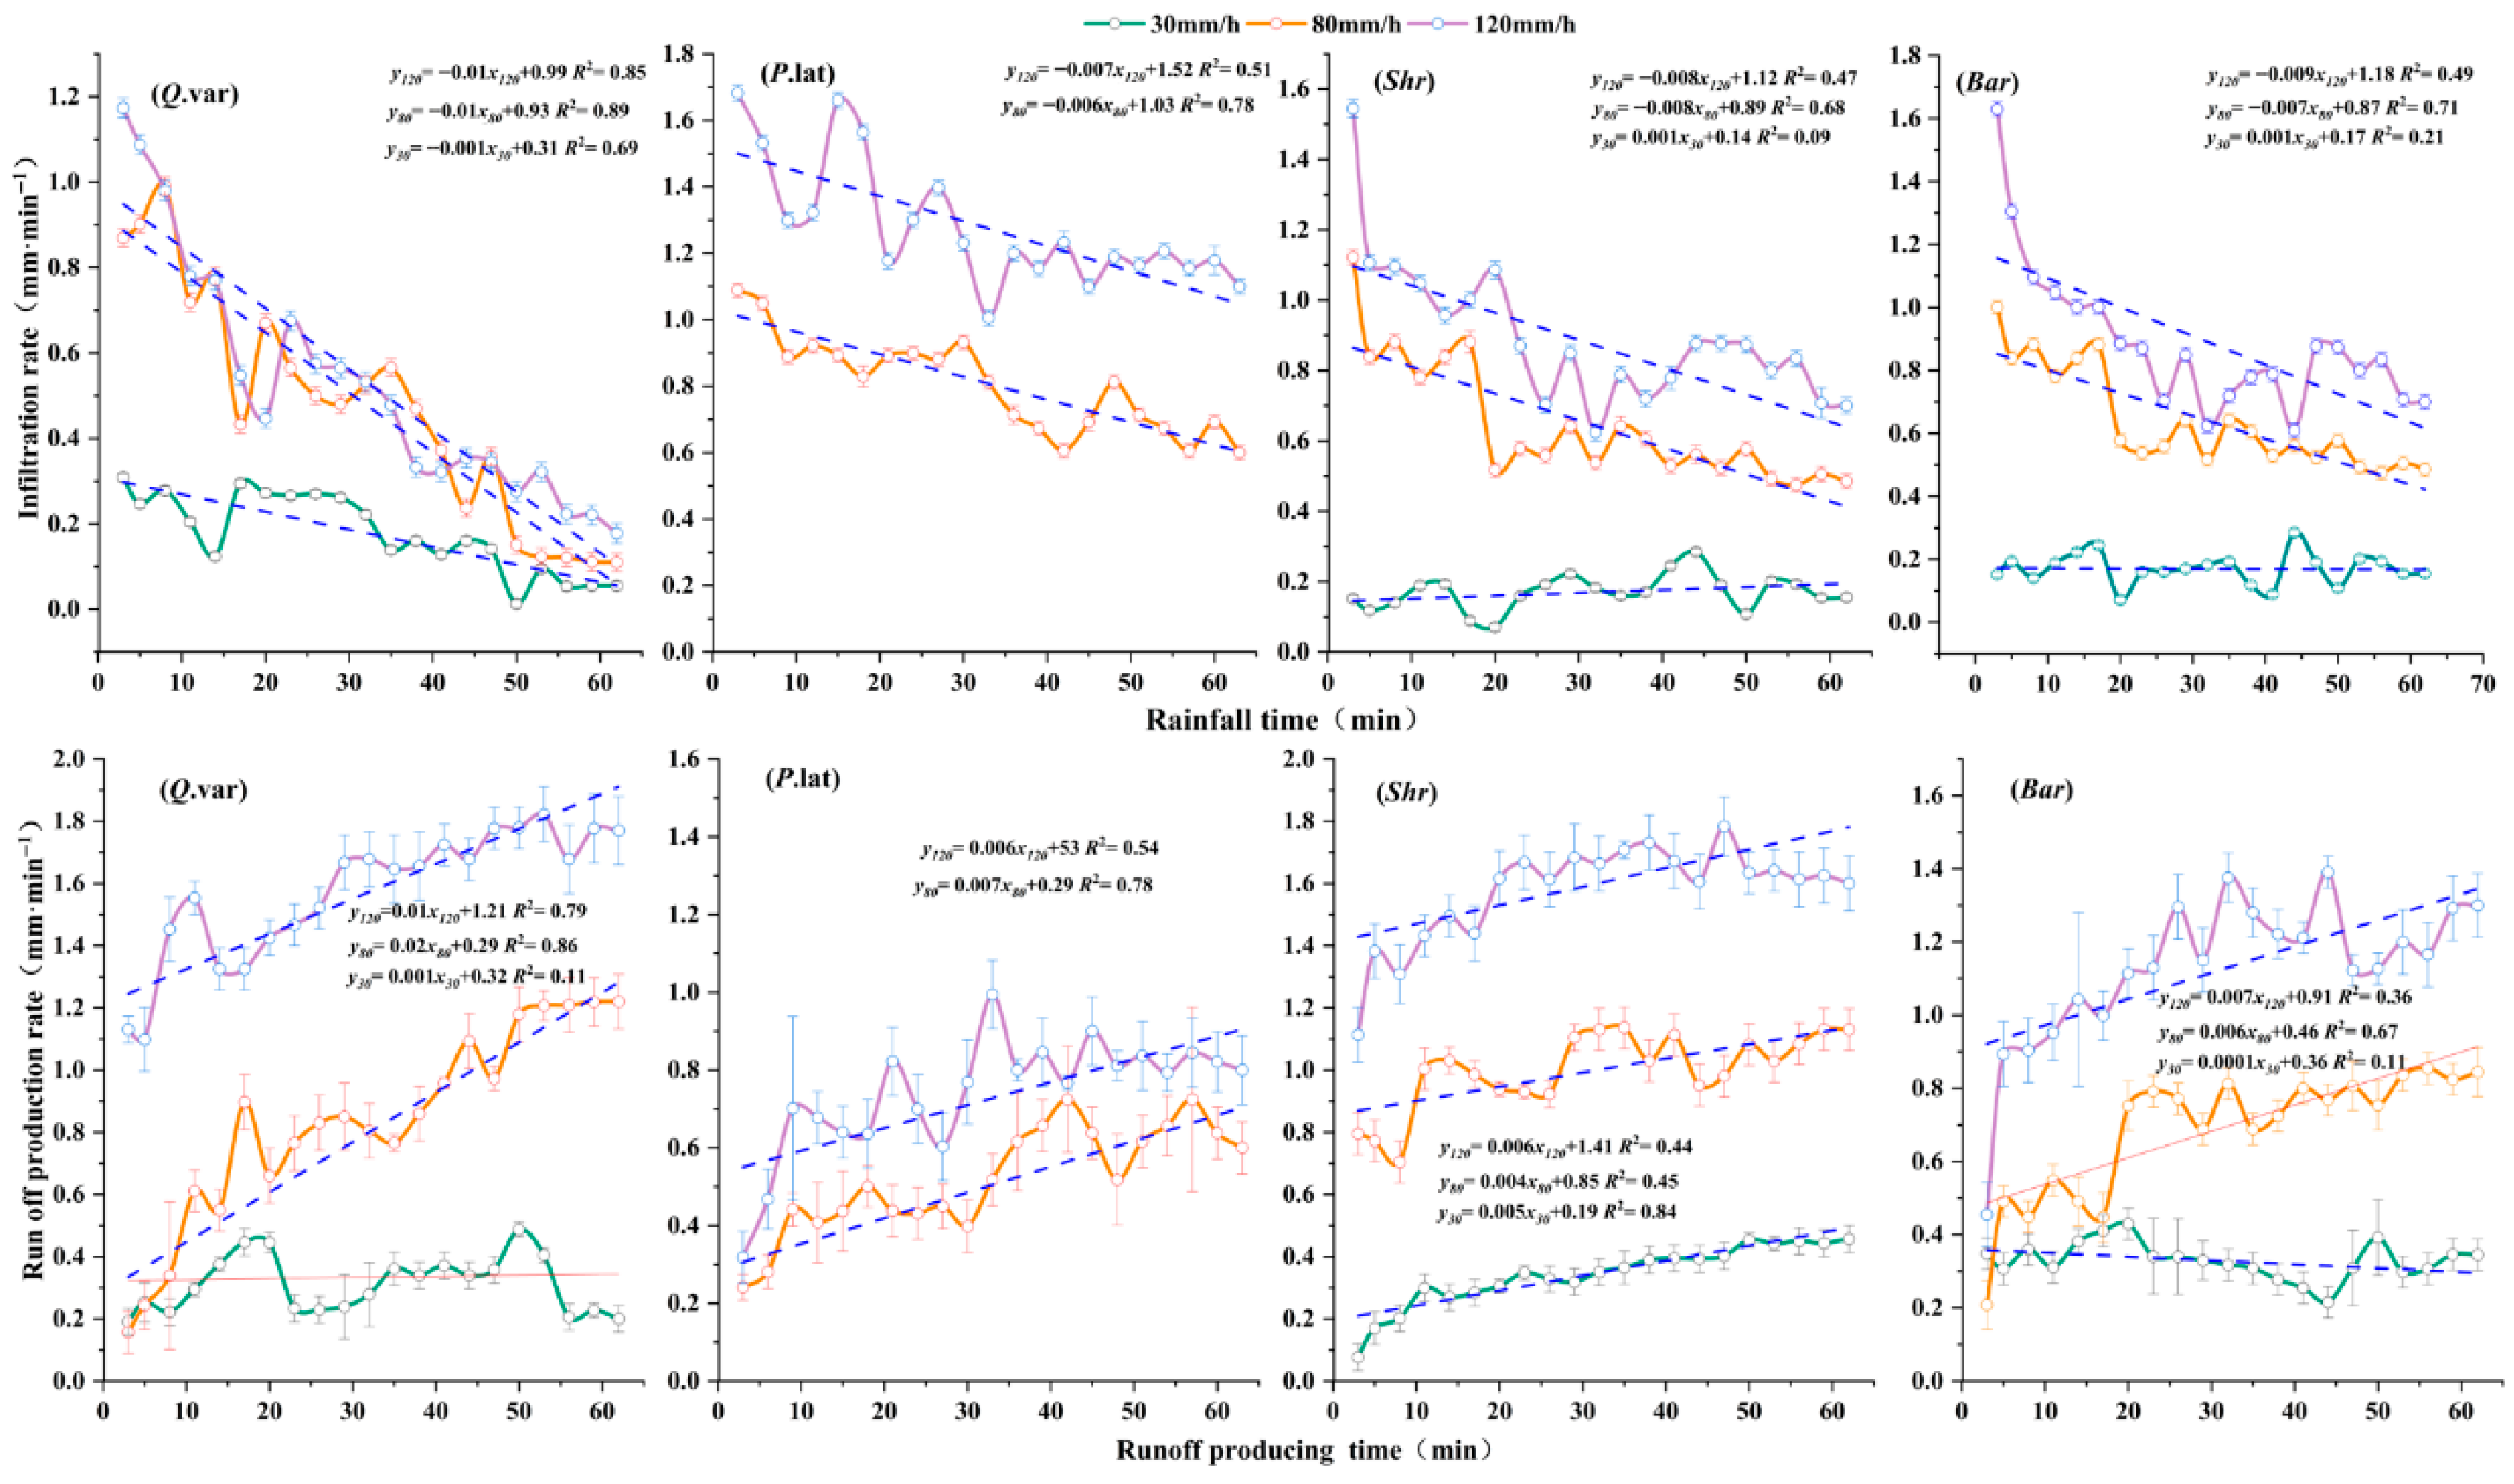
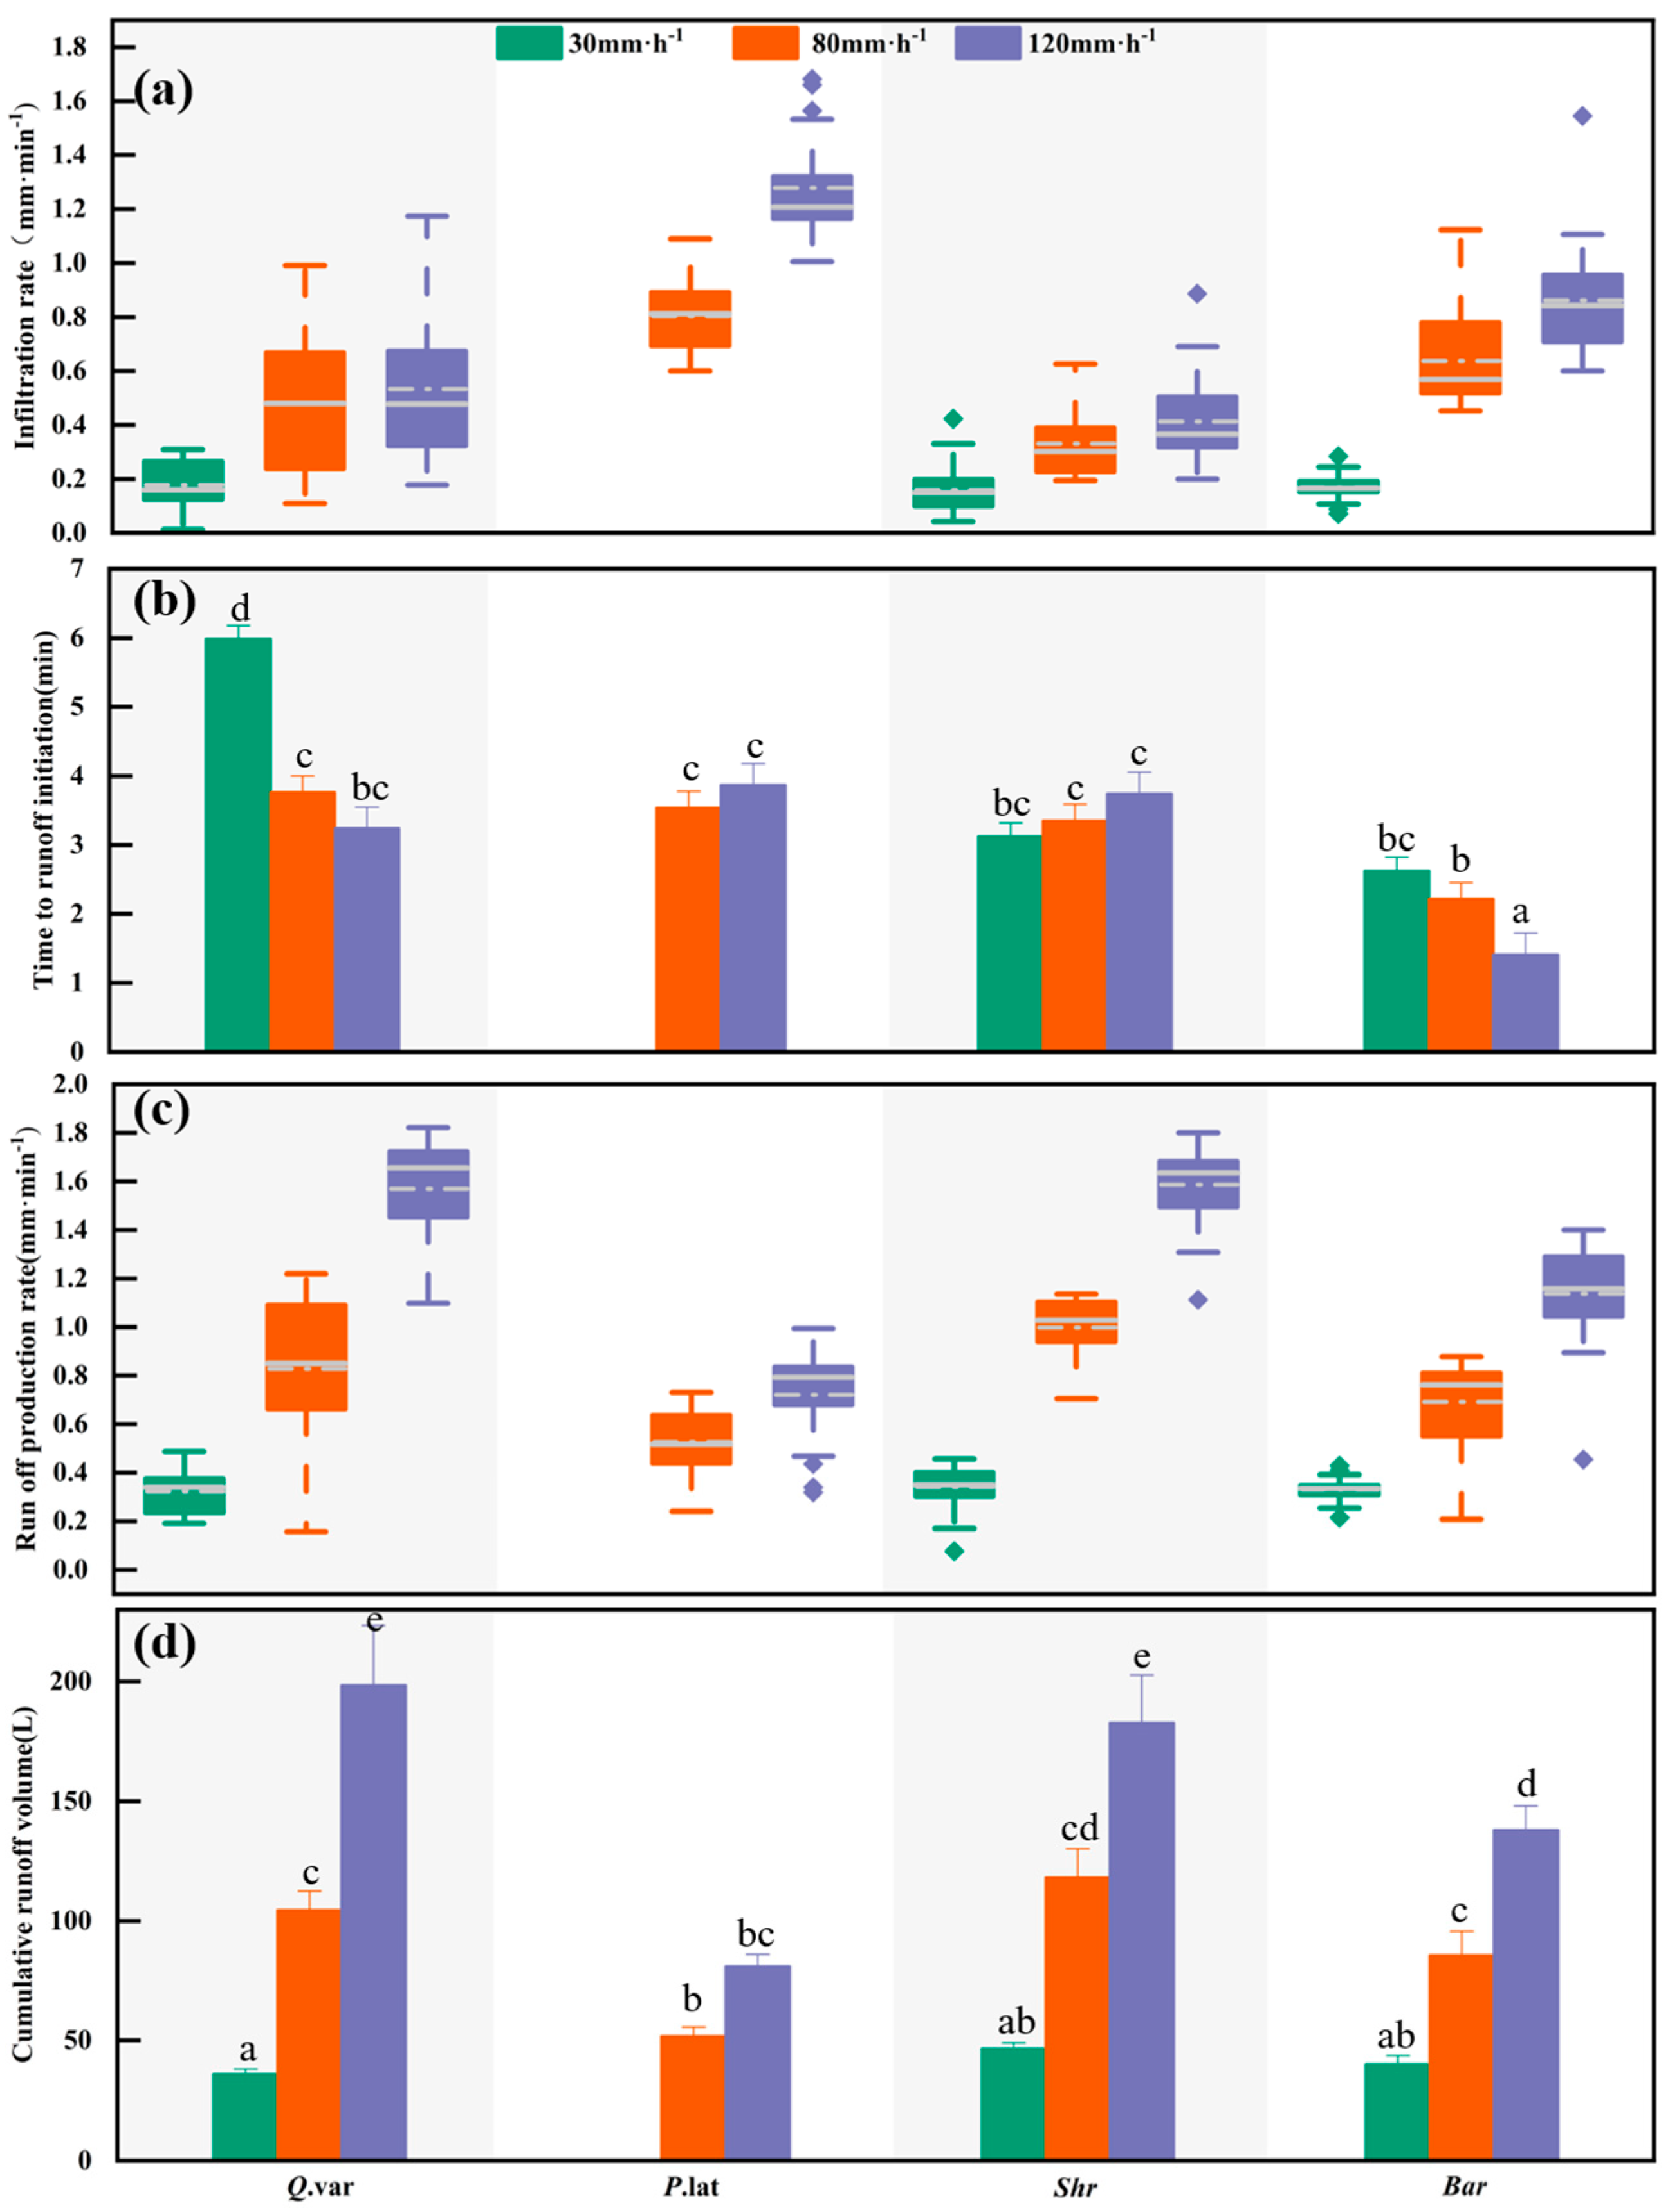
Soil aggregate stability governs the initial erosion response by modulating infiltration–runoff dynamics. Infiltration rates progressively decline during rainfall until stabilizing, with vegetation types ranked as: P.lat > Q.var > Bar > Shr. Under identical vegetation types, higher rainfall intensities accelerate stabilization (e.g., Q.var at 80 mm·h−1 stabilized 1.68× faster than at 30 mm·h−1; Bar at 120 mm·h−1 reached stability 5.10 times sooner than at 30 mm·h−1) (Figure 2 and Figure 3a). For Q.var and Bar, the runoff initiation time shortened with increasing rainfall intensity (120 > 80 > 30 mm·h−1). Conversely, P.lat and Shr exhibited the opposite trend. The overall runoff initiation timing ranked as follows: Bar > Shr > P.lat > Q.var (Figure 3b). This pattern is primarily attributed to differences in soil aggregate stability and the rainfall intensity’s effect on surface crust formation: high-intensity rainfall disrupts aggregates and accelerates crust development, reducing initiation time, while low-intensity conditions intensify the reliance on inherent aggregate stability [9,30]. Notably, no runoff occurred under 30 mm·h−1 rainfall for P.lat, likely due to its well-developed root system and larger pores facilitating rapid infiltration, combined with a rainfall intensity below the critical threshold for runoff generation. Runoff production rates exhibited an opposing trend to infiltration, starting low before increasing to stabilize. Vegetation types showed significant differences, which were particularly pronounced under high rainfall intensities (Figure 2 and Figure 3c). Increased rainfall intensity substantially elevated runoff rates, with Q.var at 120 mm·h−1 yielding a 3.88 times higher runoff than at 30 mm·h−1, primarily due to the enhanced flow turbulence, water depth, and detachment capacity under heavy rainfall [31,32,33]. The cumulative runoff volume increased markedly with the rising rainfall intensity: the totals at 80 mm·h−1 and 120 mm·h−1 were 1.68- and 5.03-fold higher than that at 30 mm·h−1 (Figure 3d). The primary reason is that intense storms readily create surface crusts, which sharply reduce infiltration [9]. The cumulative runoff volume ranked as Bar (361.79 L) > Shr (347.15 L) > Q.var (338.39 L) > P.lat (130.62 L) mainly reflect differences in surface characteristics such as soil structure and root development. Barren land is highly erodible, whereas P.lat benefits from extensive root systems and stable aggregates to resist erosion. Overall, the aggregate stability significantly enhances the infiltration capacity, delays runoff initiation, and reduces peak flow by preserving large pores and postponing crust formation—an effect most pronounced under low to moderate rainfall intensities.

3.2. Slope Soil Loss Mechanisms Under Different Vegetation Types

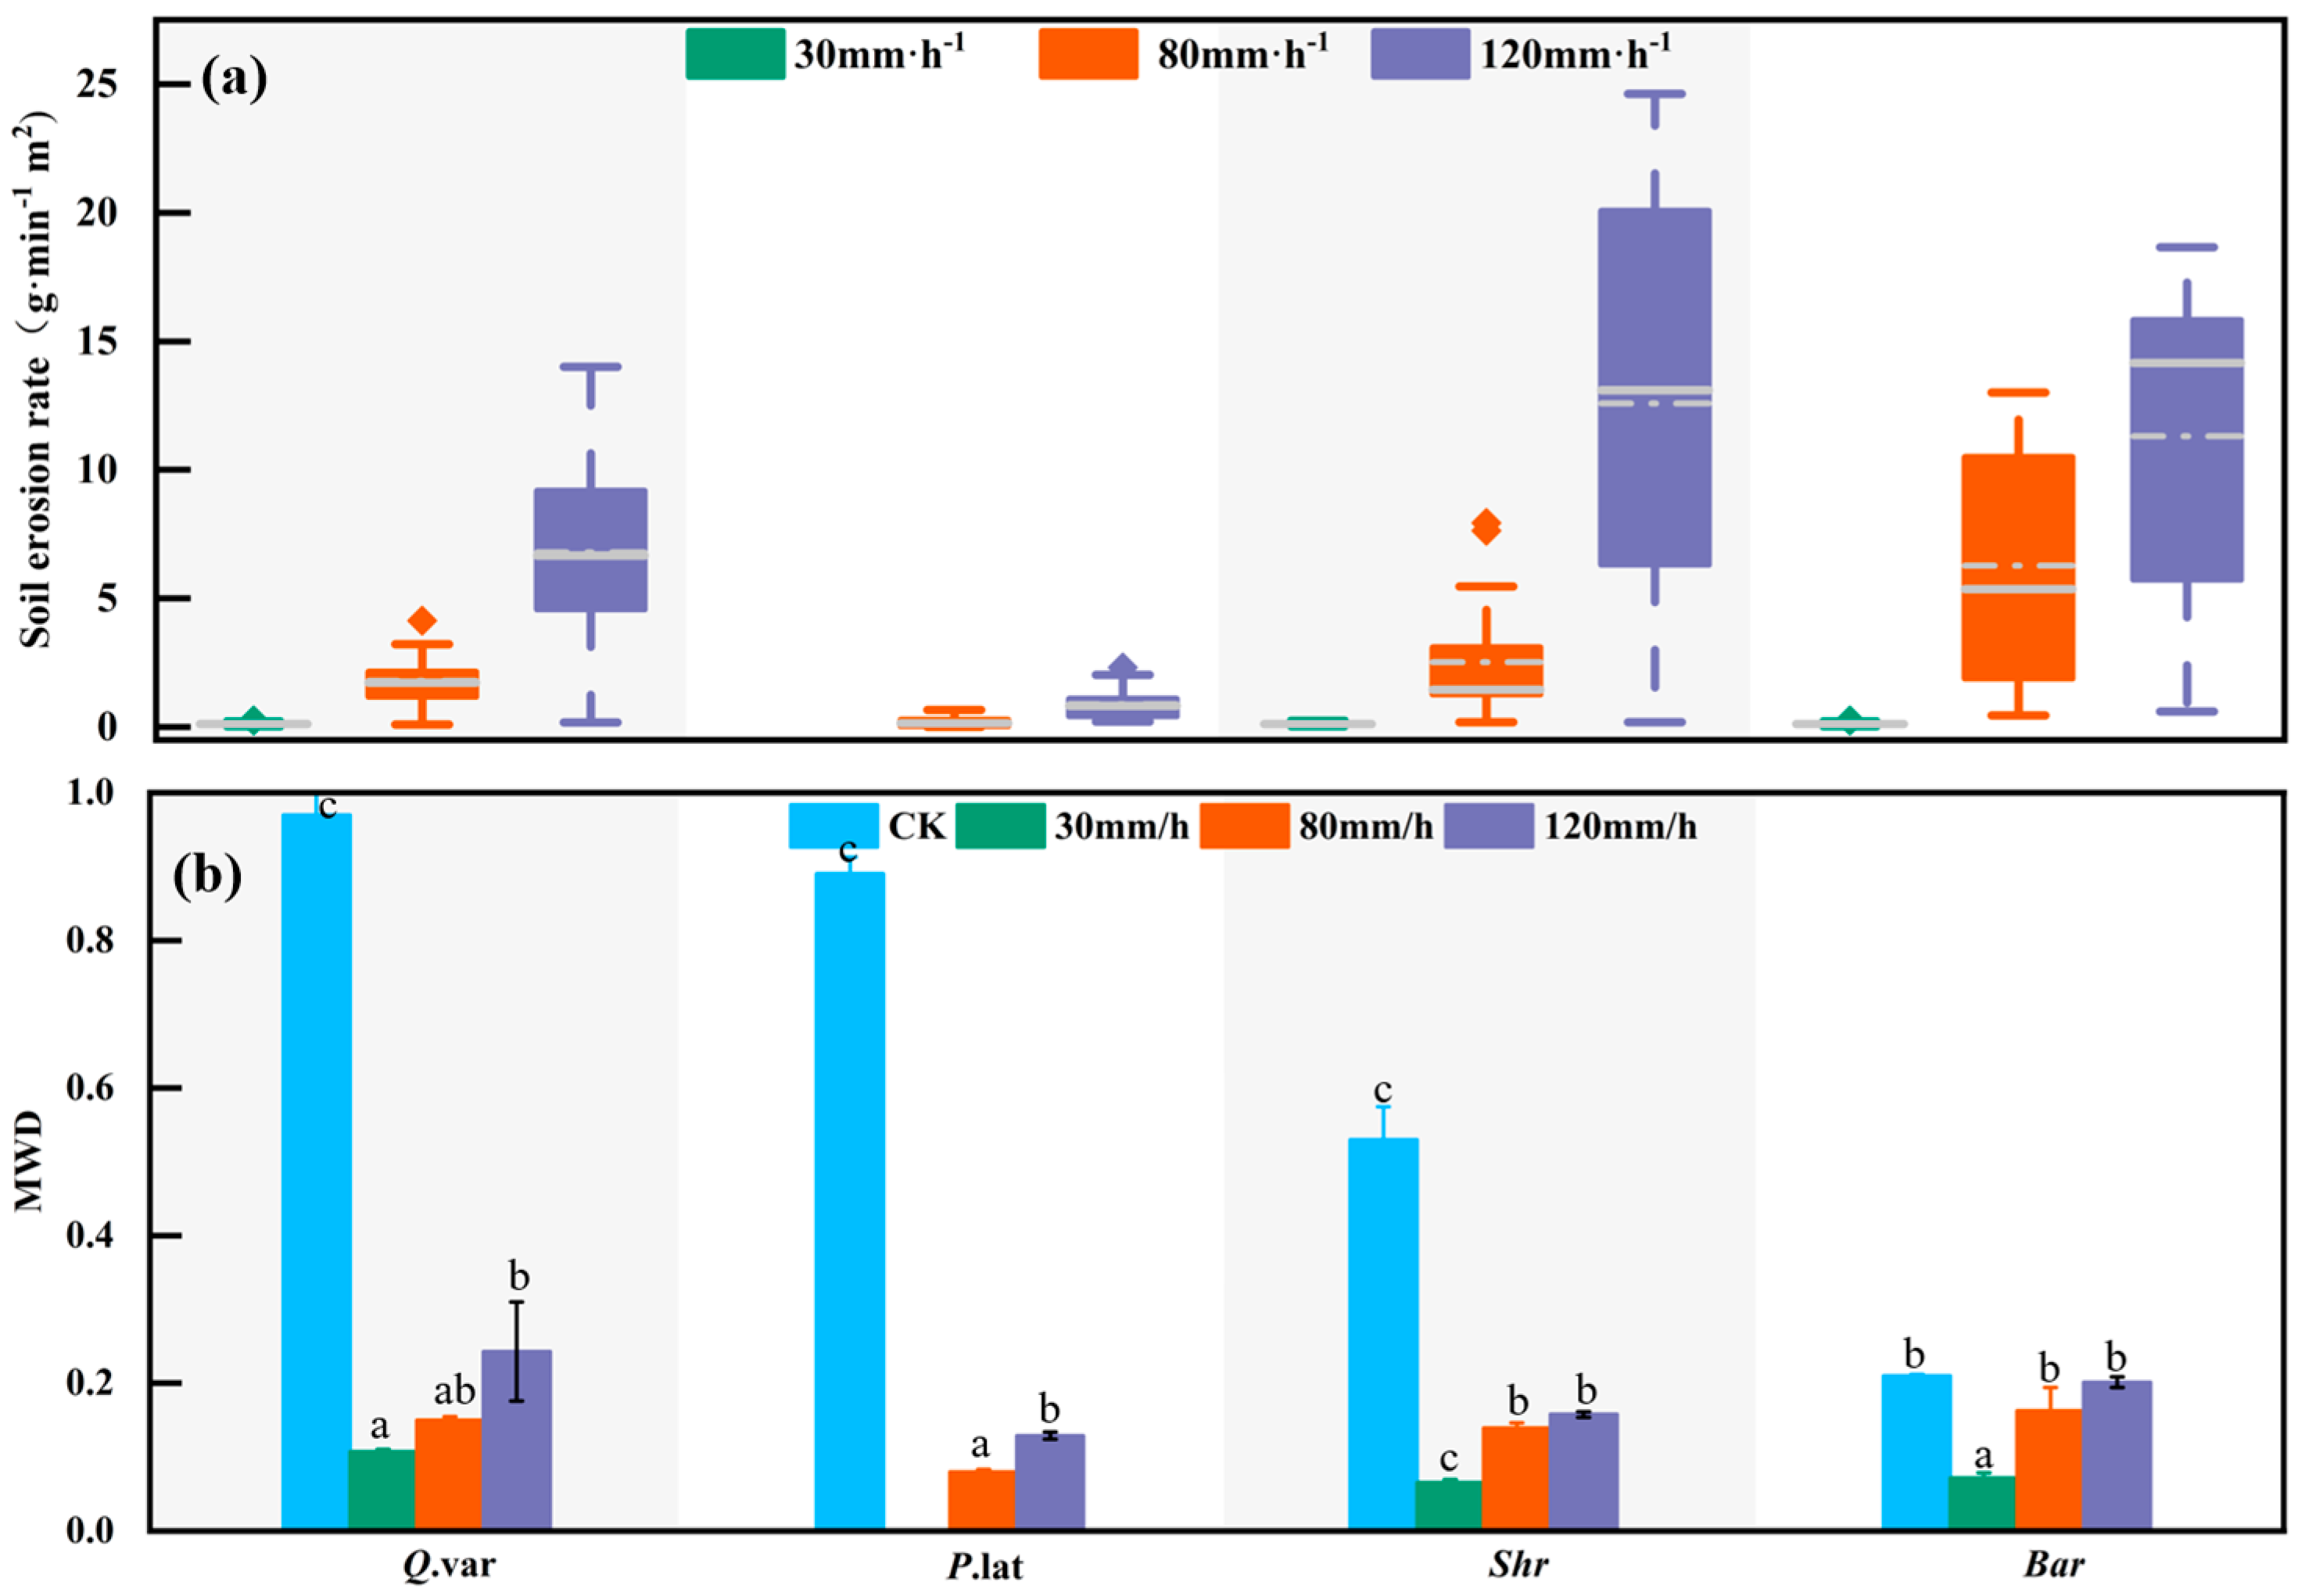
Soil erosion rates increased significantly with the rising rainfall intensity. Under 120 mm·h−1 rainfall, Shr exhibited an average sediment yield of 15.54 g·m−2·min−1—14.24 times higher than at 30 mm·h−1. In contrast, P.lat consistently remained below 1 g·m−2·min−1. The vegetation-type differences were pronounced: the average sediment yield ranked as Bar > Shr > Q.var > P.lat. Bar faced heightened erosion risks due to persistently high sediment yields (14–18 g·m−2·min−1) (Figure 4 and Figure 5a).
Results revealed that the proportion of macroaggregate loss increased with the rainfall intensity, reaching 64.00% for Bar under 120 mm·h−1. Microaggregate loss was modulated by vegetation types, peaking at 44.69% in Shr. Conversely, primary particle losses decreased with the rising rainfall intensity (Table 2). The MWD of eroded sediments revealed structural stability differences: barren land and Q.var exhibited the largest MWD (0.20 mm), while P.lat showed the smallest (0.053–0.25 mm). For Q.var soils, the CK aggregates—collected from undisturbed topsoil before rainfall simulation—exhibited a well-structured stability, with a mean weight diameter (MWD) of 0.85 mm. Even under extreme storm conditions (120 mm·h−1 rainfall intensity), the eroded sediments of Q.var still retained a relatively large MWD of 0.20 mm, which was significantly higher than that of barren land (Bar, 0.08 mm) under the same rainfall intensity. This indicates that the aggregates in Q.var soil possess a strong resistance to fragmentation caused by raindrop impact and runoff scouring. The stability of soil macroaggregates varies between stable and unstable forms. When microbial habitats deteriorate in the environment, binding agents like fungal hyphae—critical for macroaggregate integrity—become prone to rupture, leading to macroaggregate destabilization (Figure 5b) [34,35].
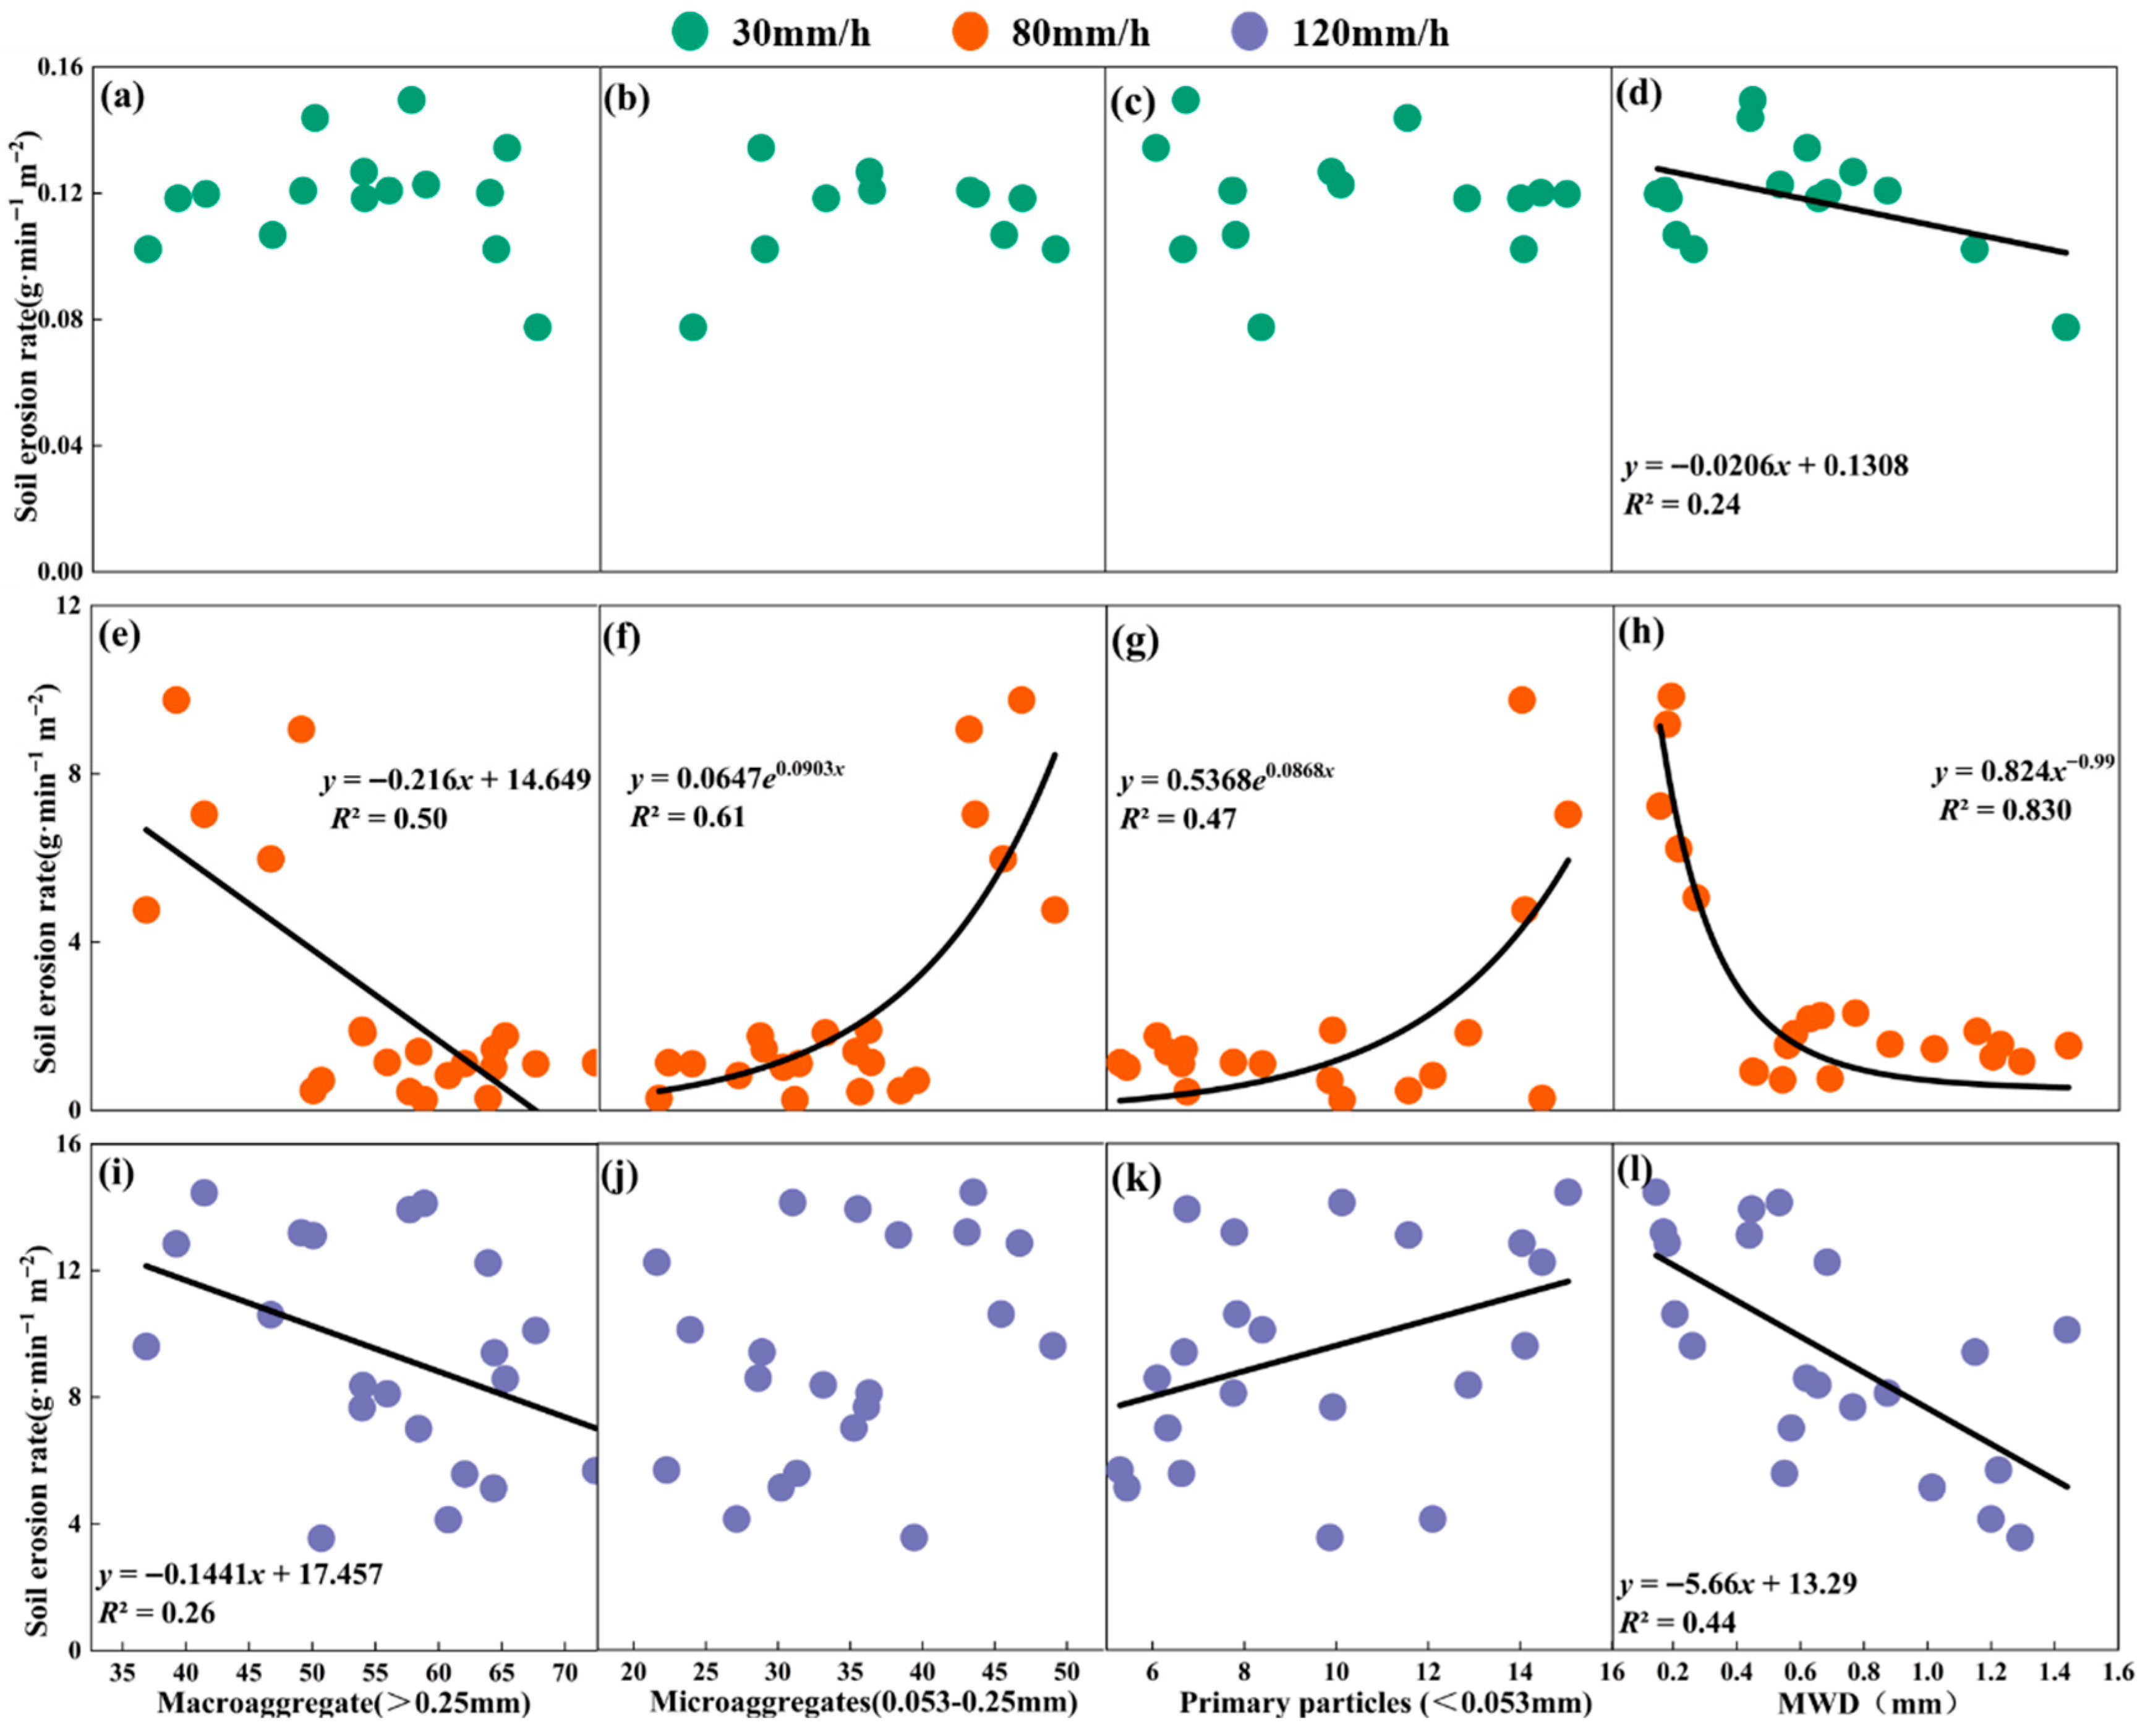
Quantitative analysis revealed a significant inverse exponential relationship between aggregate stability and sediment yield: under 80 mm·h−1 rainfall, sediment production reached its minimum (<1 g·m−2·min−1) when macroaggregate content exceeded 60%. MWD exhibited a robust negative exponential correlation with the sediment yield (y = 0.824x−0·99, R2 = 0.830), confirming that macroaggregate-dominated stability (reflected by a high MWD and strong resistance to fragmentation) exponentially suppresses erosion. Conversely, barren land entered a vicious cycle of escalating erosion and aggregate fragmentation due to structural degradation [36,37,38]. Microaggregates and primary particles exhibited exponential relationships with the slope sediment yield of y = A·eBx, indicating increased sediment production with higher proportions of these fine fractions (Figure 6). Overall, both the quality and quantity of aggregates significantly influenced the soil erosion rates. Higher macroaggregate abundance enhanced the aggregate stability, exponentially reducing sediment production across all rainfall intensities.

3.3. Impact of Aggregate Stability on Soil Erodibility Factor (K)

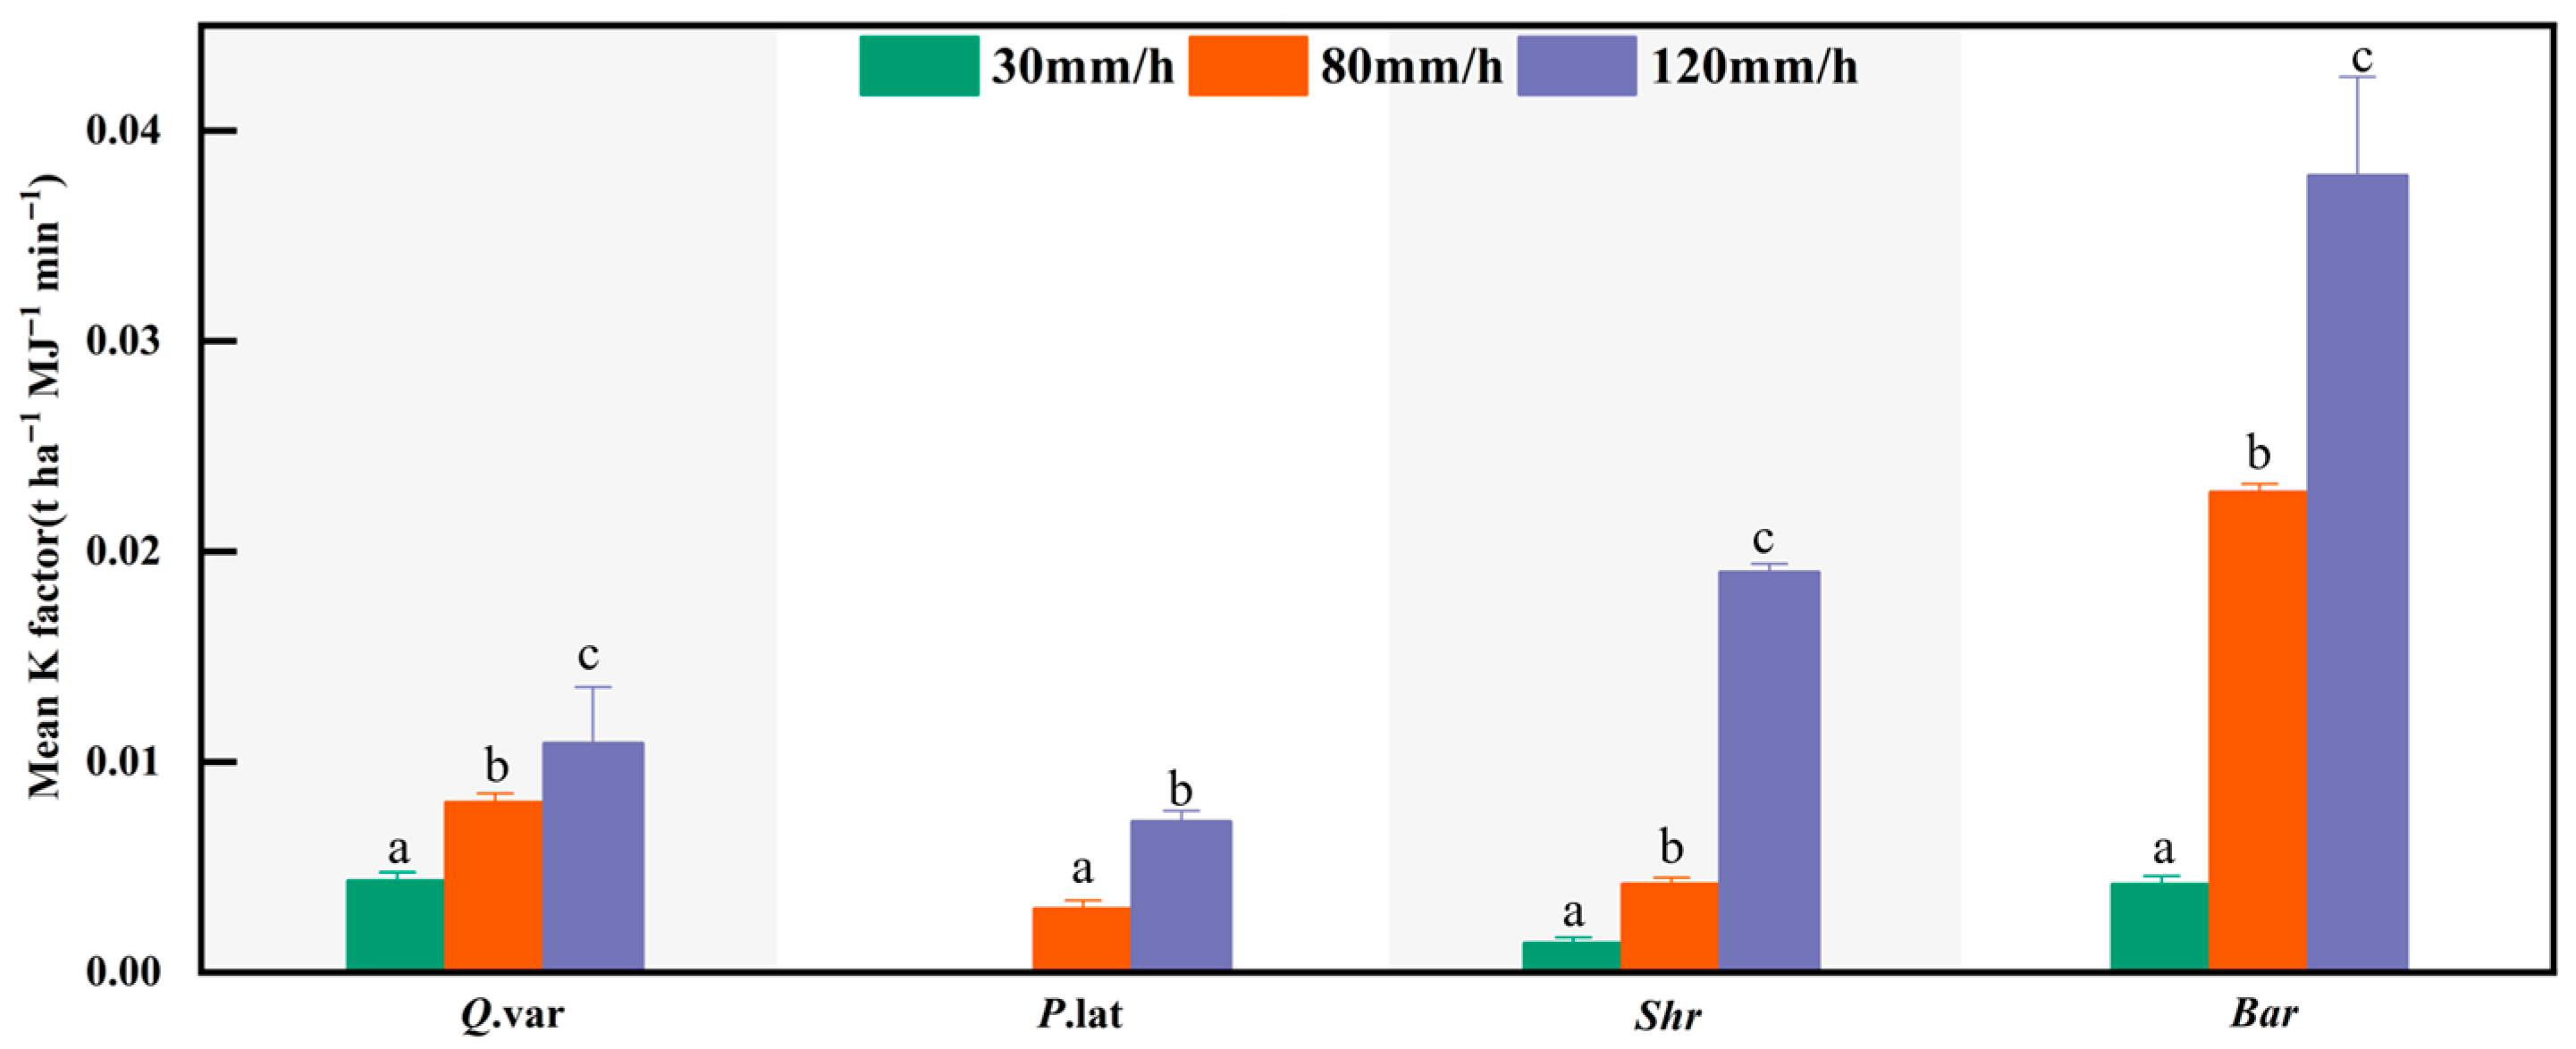
As shown in Figure 7, the average soil erodibility factor (K) differed significantly across the four vegetation types (p < 0.05). P.lat exhibited the lowest mean K-values (0.00043–0.016 t·ha·h·ha−1·MJ−1·mm−1), while Bar showed the highest (0.00014–0.094 t·ha·h·ha−1·MJ−1·mm−1). Notably, under heavy rainfall, Bar reached peak erodibility with a mean K-value of 0.038 t·ha·h·ha−1·MJ−1·mm−1. Across all vegetation types, mean K-values progressively increased with the escalating erosion severity.
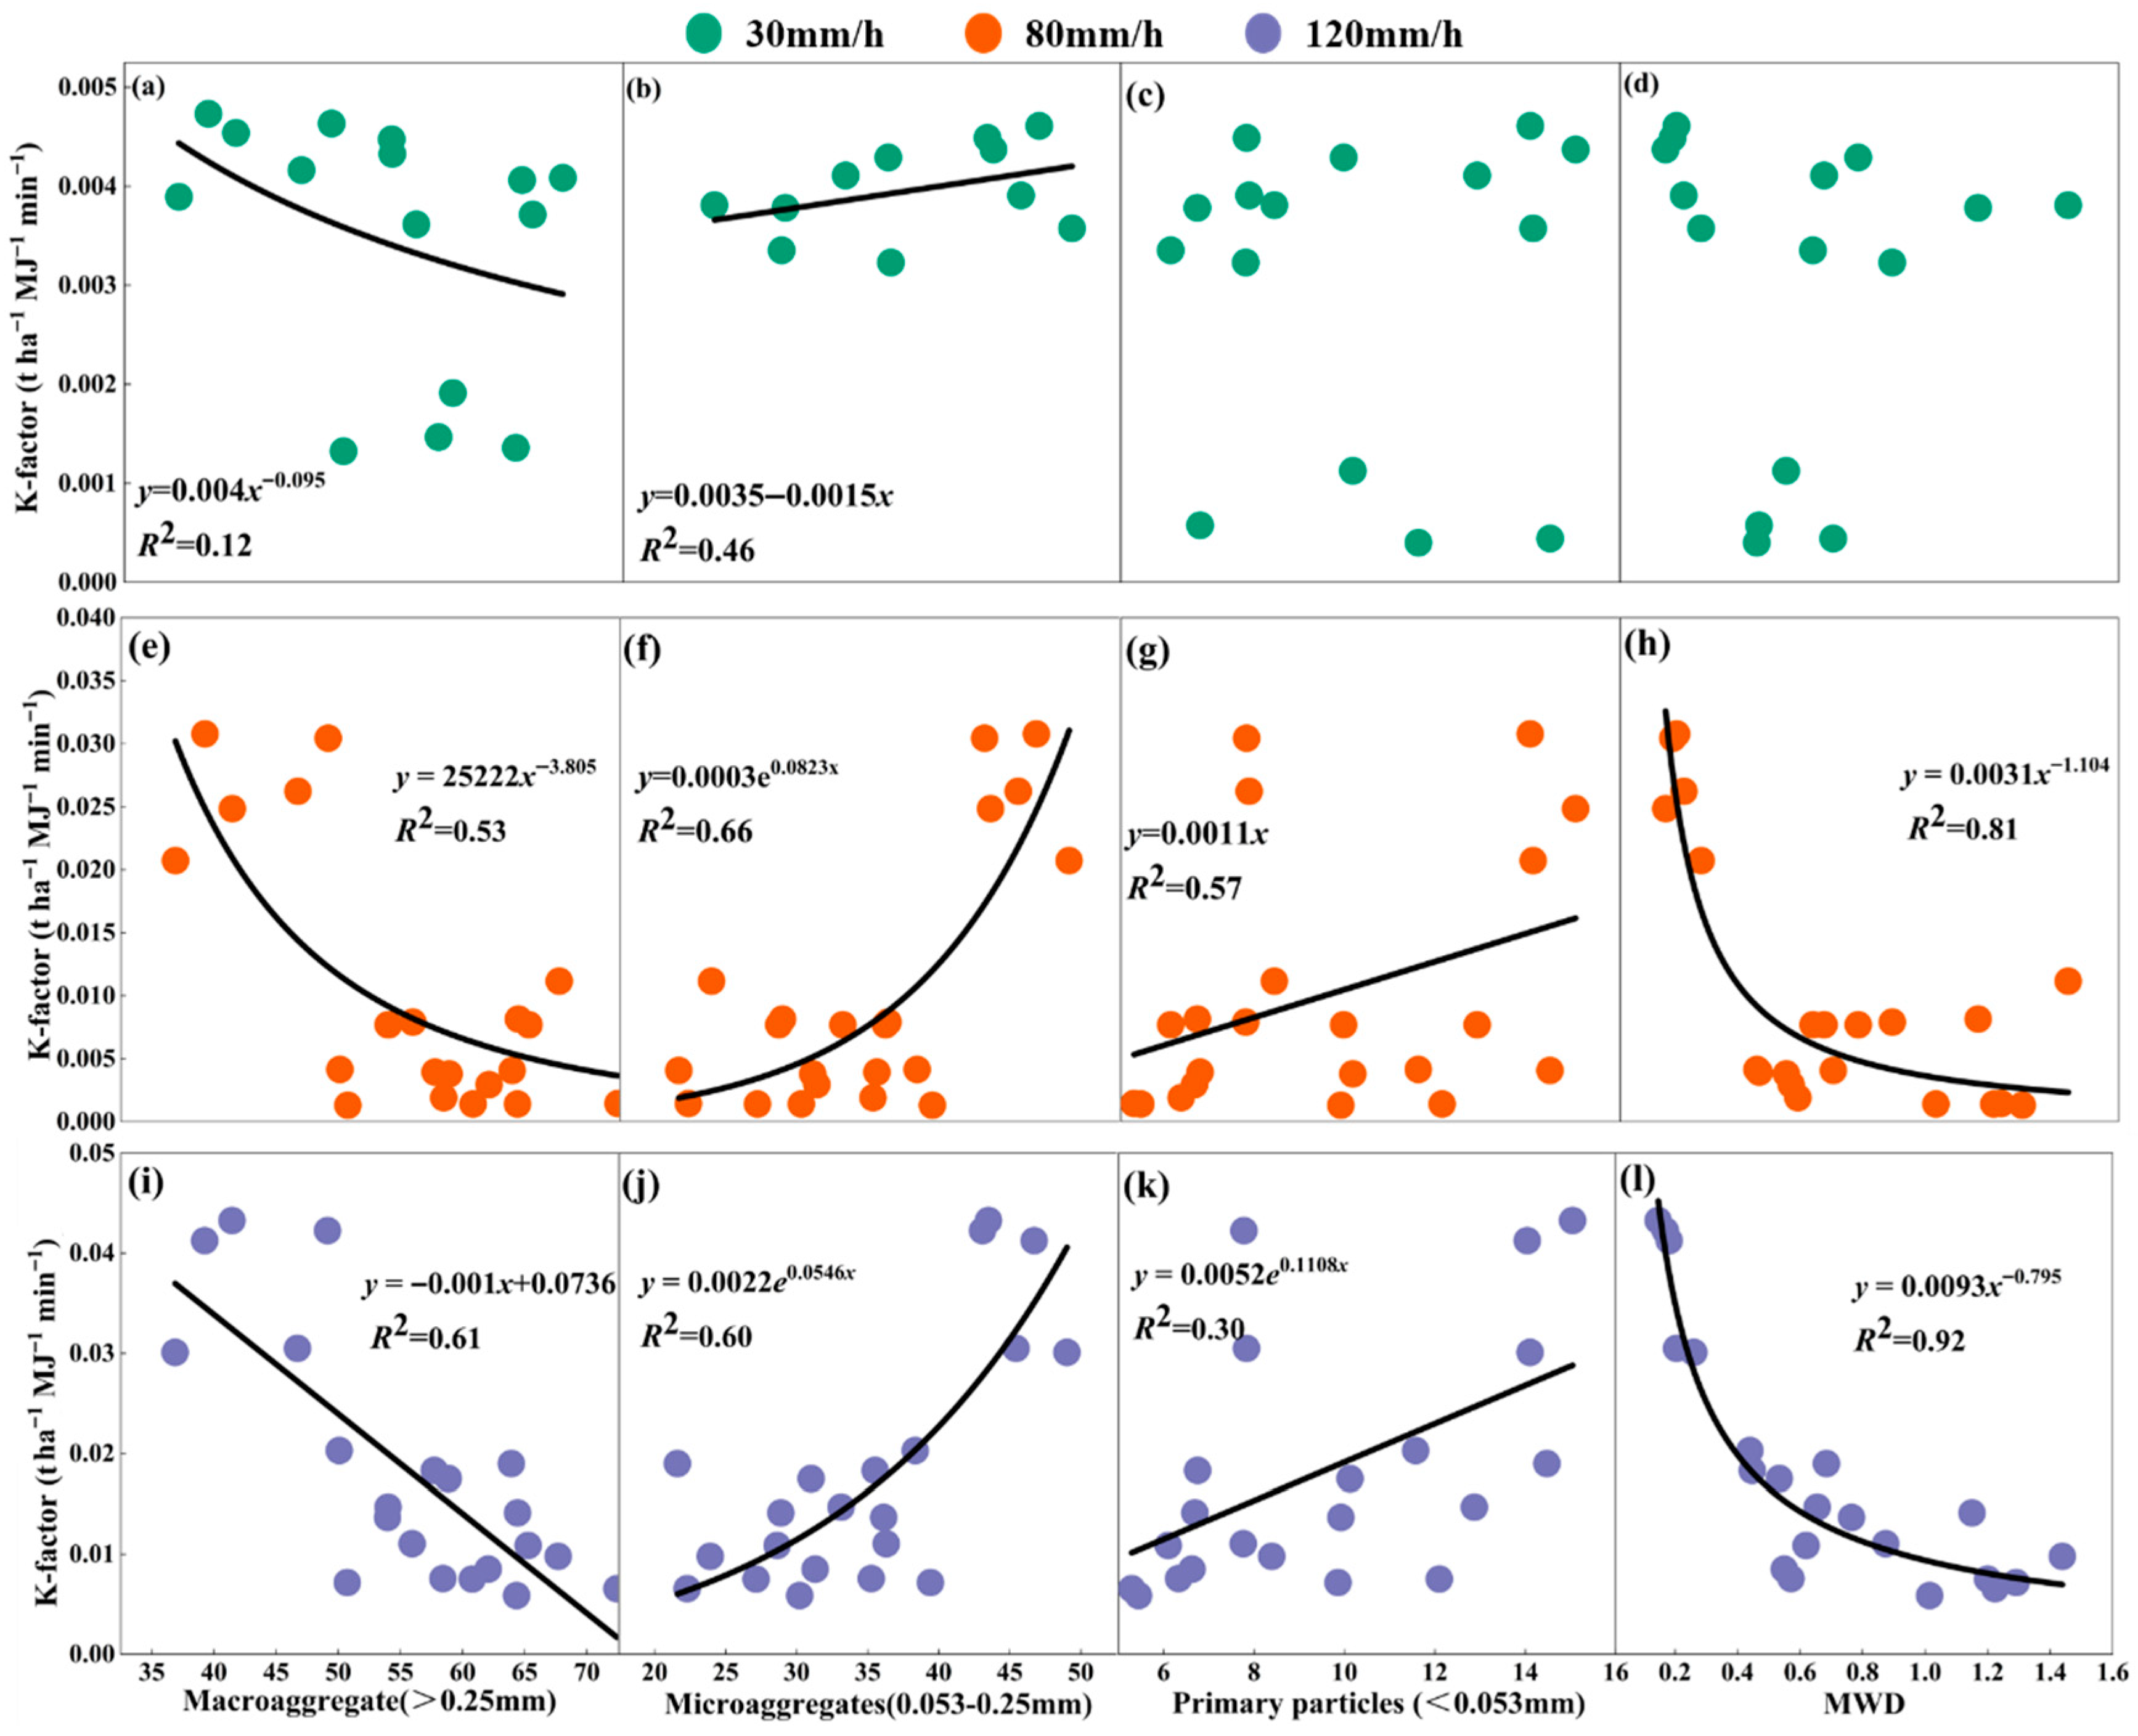
Figure 8 reveals that the inhibitory effect of aggregate stability metrics on the K varies with the rainfall intensity. At 30 mm·h−1, only microaggregates (0.053–0.25 mm) showed a significant positive linear correlation with the K-factor (y = 0.0035 − 0.0015x, R2 = 0.46). Macroaggregates (>0.25 mm) and MWD had no significant effect, indicating a limited structural disruption under low-intensity rainfall. At 80 mm·h−1, MWD and K exhibited a negative power function relationship (y = 0.0031 x−1.104, R2 = 0.81); every 10% increase in macroaggregate content reduced the K-factor by 35%, while microaggregates and primary particle fractions exponentially promoted the K-factor (y = 0.003 e0.0823). At 120 mm·h−1, MWD still follows a power law decline (y = 0.0093 x−0.795, R2 = 0.92) but with a gentler slope, revealing that extreme rainfall blunts the stabilizing advantage. In summary, aggregate stability reduces the K-factor through two pathways: (1) macroaggregate scaffolding inhibits particle detachment [39,40]; (2) organic-root-microbial cementation enhances the bulk shear strength [40,41]. This effect peaks in sensitivity at a moderate rainfall intensity (80 mm·h−1), while under storm conditions (120 mm·h−1), rainfall kinetic energy dominates, leading to diminishing marginal benefits of stability.

3.4. Key Microbial Community Characteristics After Rainfall Erosion

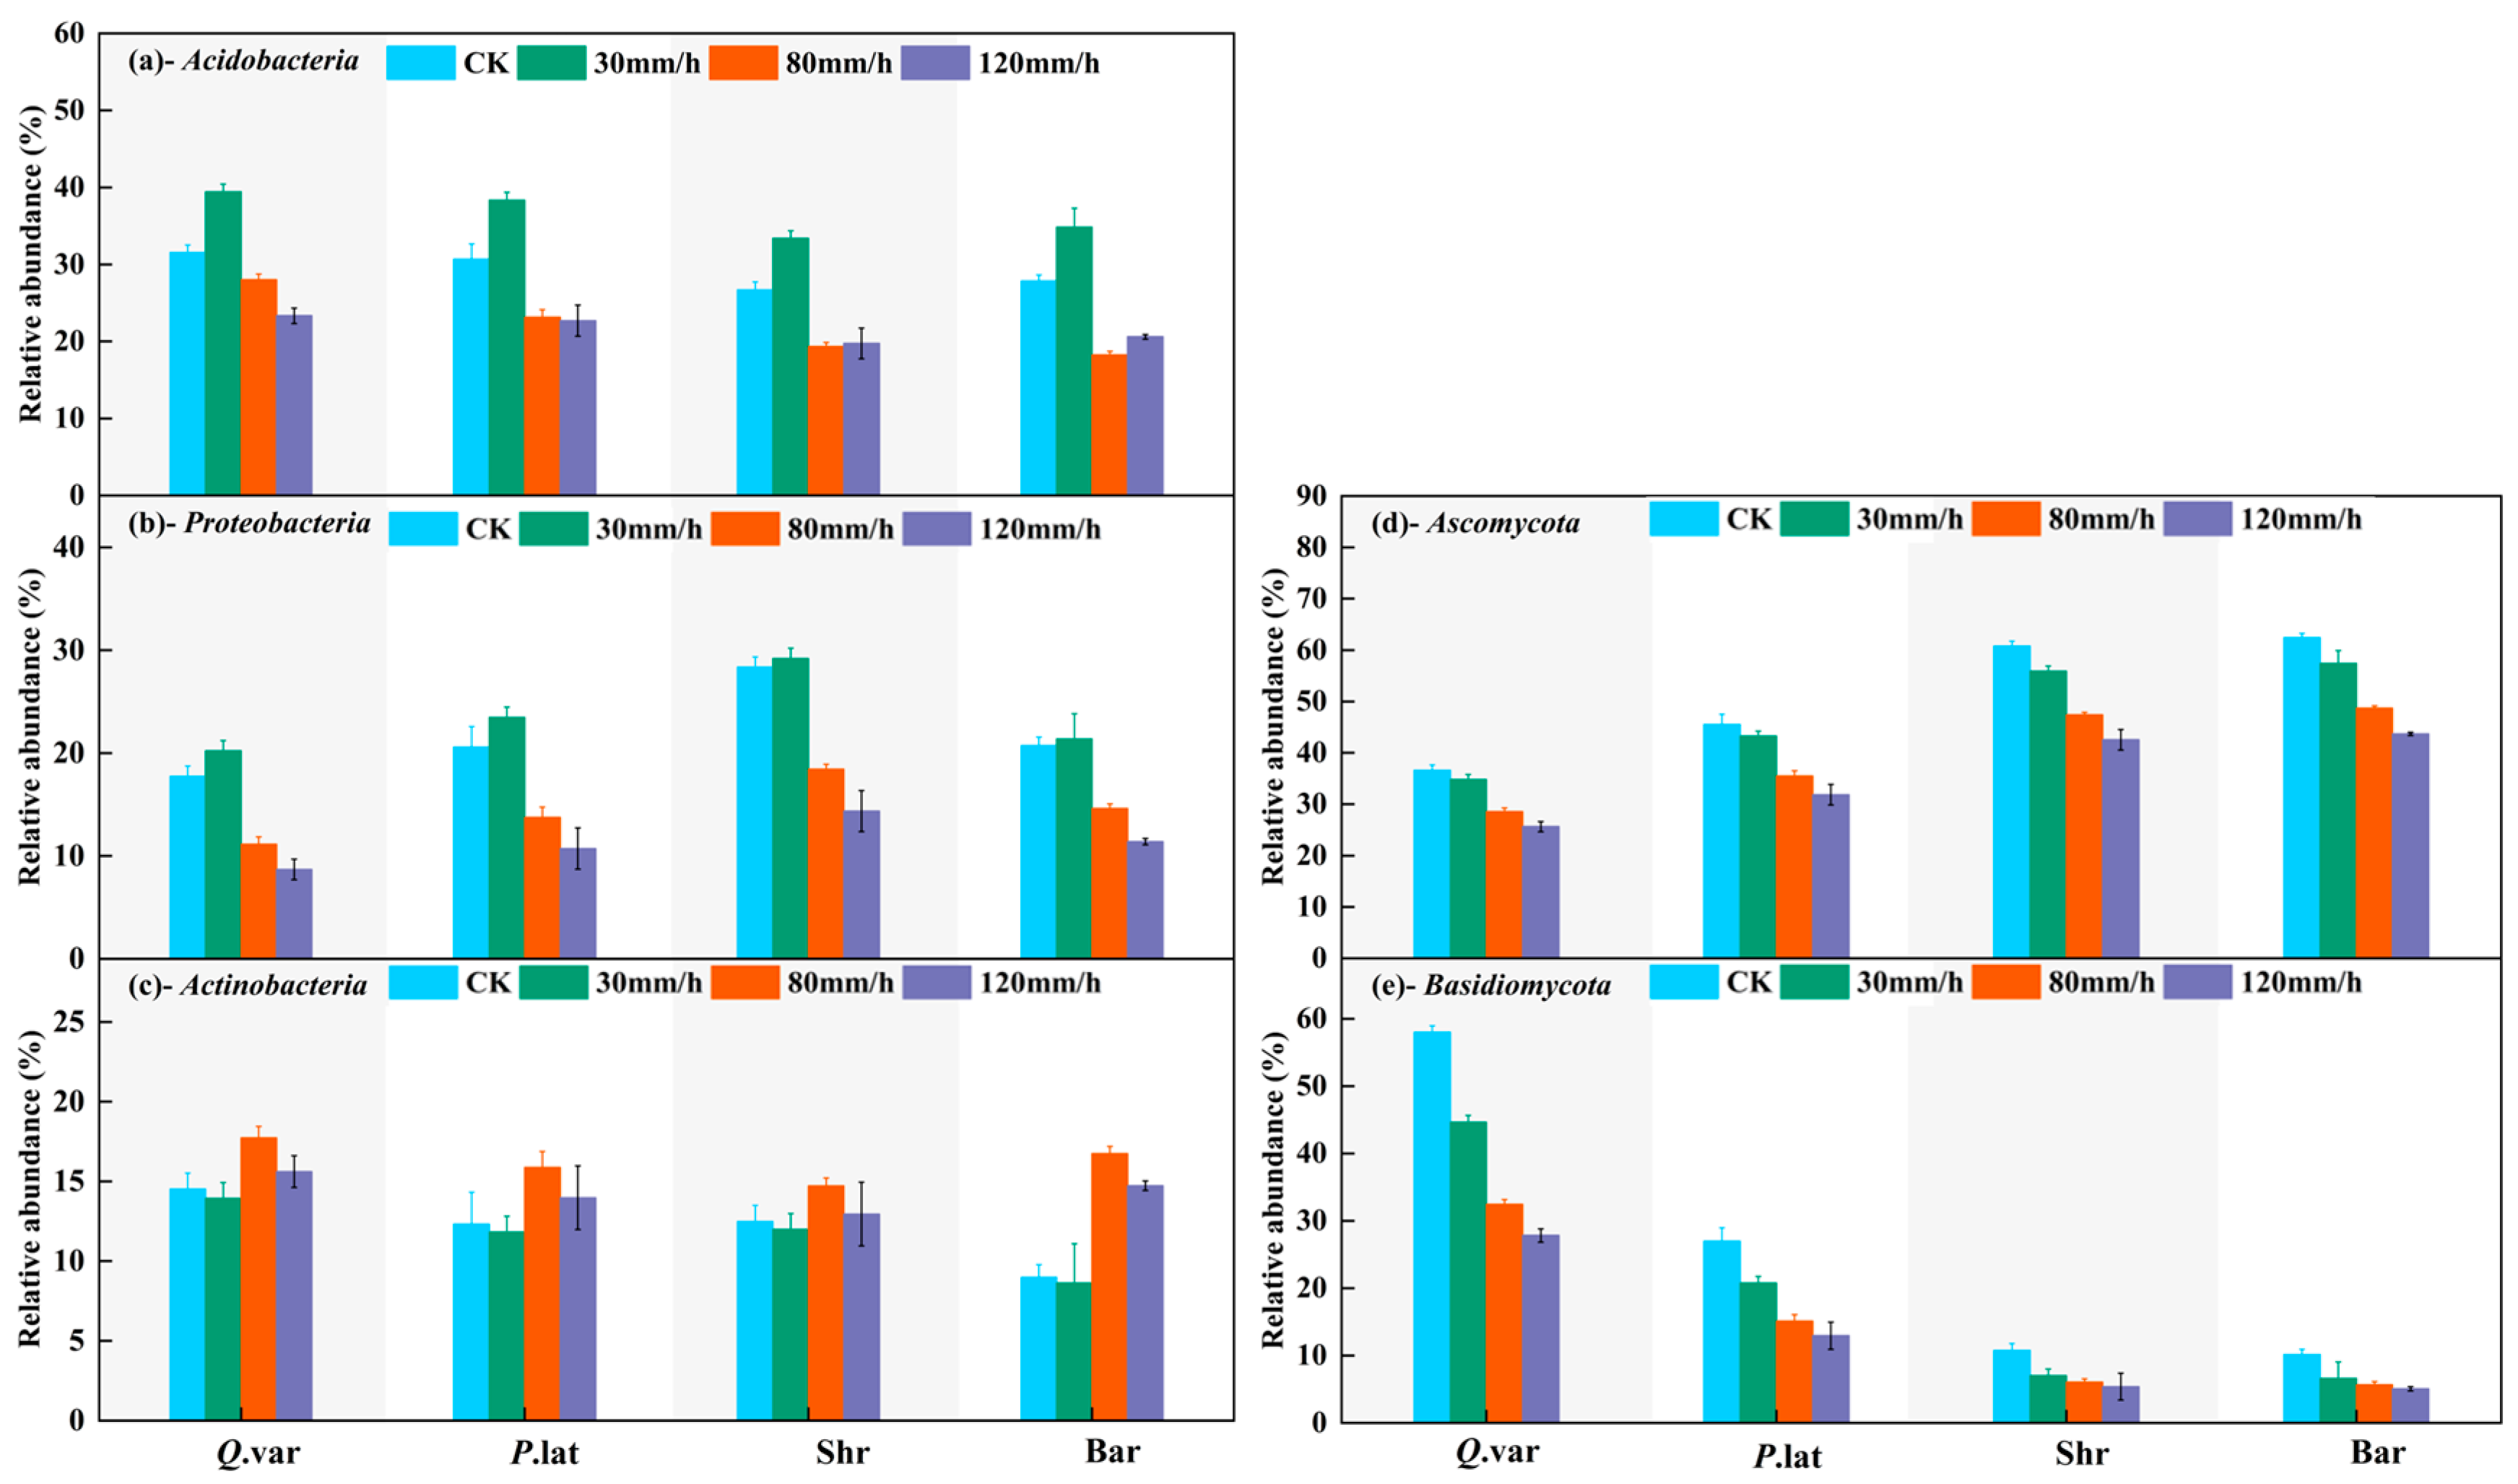
Rainfall erosion drives microbial community restructuring through dual pathways: runoff migration [42] and soil environmental perturbation, which alters nutrient content, moisture, pH, and the availability of organic carbon substrates [43,44]. After 30 mm·h−1 rainfall erosion, the relative abundances of Acidobacteria and Proteobacteria significantly increased by 12–18% (Figure 9a,b). In contrast, the Actinobacteria abundance decreased marginally by merely 5%. When the rainfall intensity increased to 80 mm·h−1, the abundances of Acidobacteria and Proteobacteria sharply declined by 35–42% (Figure 9c), primarily due to runoff scouring causing topsoil microbial communities to migrate and deplete as aggregates fragmented [45]. Under 120 mm·h−1 rainfall intensity, the abundances of both phyla continued to decrease but at a diminished rate (<8%).
Fungal communities exhibited a heightened sensitivity: Even at a 30 mm·h−1 rainfall intensity, Ascomycota and Basidiomycota abundances declined by 28–33% (Figure 9d,e), attributed to their primary colonization of aggregate surfaces [44]; at 120 mm·h−1 rainfall intensity, Basidiomycota abundance collapsed to only 50% of the control. Fungi were more vulnerable owing to their spatial exposure and heightened sensitivity to moisture stress [46]. [47] found that extreme rainfall events may be an important yet overlooked determinant of root-associated fungal community composition; under such conditions, both the abundance and relative abundance of ectomycorrhizal fungi collapsed by more than 50%, a result that aligns closely with the findings of the present study.

3.5. Analysis of Factors Influencing Slope Erosion Under Different Rainfall Intensities

A redundancy analysis (RDA) systematically revealed the synergistic control of biotic and abiotic factors on slope erosion. Under 30 mm·h−1 rainfall (Figure 10a), these factors jointly explained 90.16% of the variability in aggregate stability (89.07% on the first axis). Sand (52.6%), clay (47.2%), and macroaggregates (20.5%) were the dominant drivers. Sand exhibited a positive correlation with erosion parameters because its low specific surface area and weak water-holding capacity reduce soil cohesion; raindrops easily detach sand particles, and the resulting loose structure enhances runoff transport efficiency [48]. In contrast, macroaggregates (>0.25 mm) showed a negative correlation with erosion: their high water stability resists fragmentation, preserving soil pore networks to maintain infiltration and reduce surface runoff—this aligns with findings that macroaggregate-dominated soils have a lower erodibility due to structural resistance [49]. Clay mitigated erosion by improving soil water retention and particle cohesion, as its small particle size increases surface adhesion, reducing the detachment caused by raindrop impact [50]. Sand, soil texture units, bulk density, and Ascomycota were positively correlated with the runoff rate, soil loss rate, and the erodibility factor K, whereas clay, macroaggregates, MWD, organic carbon, fine root biomass, and Basidiomycota showed significant negative correlations in mm·h−1.
As rainfall intensity increased to 80 mm·h−1 (Figure 10b), the total explained variance rose to 94.2%. Microaggregates (67.7%), sand (64.1%), macroaggregates (62.8%), and Ascomycota (54.8%) dominated the erosion process. Microaggregates (0.053–0.25 mm) became a key driver of erosion because their low stability leads to rapid fragmentation under moderate rainfall; the resulting fine particles clog soil pores, accelerating surface crust formation and reducing infiltration [36]. Ascomycota, a dominant fungal phylum, showed a positive correlation with erosion parameters—this is attributed to the rainfall-induced fragmentation of fungal hyphae, which weakens their ability to bind soil particles; reduced hyphal entanglement increases aggregate vulnerability to detachment [51]. Fine root density mitigated erosion by physically anchoring soil aggregates and enhancing pore connectivity, as root exudates (e.g., polysaccharides) act as cementing agents to improve aggregate stability [34]. Sand, microaggregates, and Ascomycota were positively correlated with erosion parameters, whereas clay, MWD, fine root density, and SOC were negatively correlated.
At the 120 mm·h−1 storm intensity (Figure 10c), the model explained 90.4% of the variance (89.73% on the first axis). Sand (69.3%), Ascomycota (35.4%), and clay (34.2%) emerged as the key drivers. Sand, Ascomycota, and primary particles were positively correlated with erosion parameters, whereas clay, MWD, SOC, and Basidiomycota were negatively correlated, clearly showing that Bar and Shr were significantly less erosion-resistant than Q.var and P.lat. This gradient shift highlights the pivotal role of microorganisms: bacteria such as Agrobacterium radiobacter, Pseudomonas fluorescens, and Bacillus polymyxa promote macroaggregate formation through polysaccharide bridging [49,52], and their inoculation can reduce soil loss [53] while their community composition serves as an erosion indicator [54]. Fungi physically bind particles via hyphal networks [51,55], and their sharp decline (>50% under storms) directly erodes aggregate stability.

4. Conclusions

Slope erosion on the North China brown soils is jointly controlled by rainfall intensity and aggregate stability: high-energy raindrops first shatter the surface microstructure, triggering crust formation and pore-network closures that set infiltration–runoff thresholds. A framework of macroaggregate scaffolds cemented by root–microbial binding constitutes an erosion-resistant system whose effectiveness increases non-linearly with rainfall intensity.
During erosion, changes in sediment particle size distribution follow a progression from small-scale particle fragmentation to large-scale particle transport, where aggregates with a poorer stability are more prone to detachment as intact units. Soil erosion likely promotes the redistribution of slope microbial communities, with microaggregates and fungal hyphae being synchronously depleted. Extreme rainfall triggers catastrophic declines in ectomycorrhizal fungi (>50% reduction). Under rainfall scouring, bacterial communities undergo a three-phase response: initial activation, followed by migration, and finally reduction due to environmental stress. This process demonstrates how microbe–soil structure interactions shape erosion outcomes.
Woody forests significantly reduce slope erodibility by maintaining macroaggregate abundance through an elevated SOC, well-developed root systems, and dominant fungal communities. In contrast, shrubs and barren land amplify the rainfall intensity effects due to structural fragility, highlighting that vegetation restoration should prioritize enhancing aggregate stability.
Given this study’s reliance on short-term simulated rainfall experiments and a fixed 15° slope gradient, future research could establish long-term observation plots to track seasonal changes in soil aggregates and microbial communities under natural rainfall, clarifying the long-term erosion adaptation mechanisms of different vegetation types; use high-resolution imaging (e.g., scanning electron microscopy) to explore the microscale synergistic mechanism of fine roots and microorganisms in enhancing aggregate stability; and set multiple slope gradients to study the interactive effects of slope, aggregate stability, and rainfall intensity, providing comprehensive data for soil and water conservation in North China’s mountainous areas.

Author Contributions

Y.Y.: Investigation, Writing—original draft. S.Z.: Funding acquisition, Writing—review and editing. X.D.: Data analysis. L.W.: Investigation. W.Y. and Z.L.: Writing—original draft. All authors have read and agreed to the published version of the manuscript.

Funding

This research was funded by [Fundamental Research Funds for the Central Non-profit Research Institution of CAF] grant number [CAFYBB2022MA009].

Data Availability Statement

The datasets generated during the current study are available from the corresponding author on reasonable request. The source observational data are not publicly available due to legal restrictions.

Acknowledgments

The authors sincerely thank the anonymous reviewers and academic editor for their constructive comments and suggestions.

Conflicts of Interest

The authors declare that they have no known competing financial interests or personal relationships that could have appeared to influence the work reported in this paper.

References

  1. Mahmoodabadi, M.; Sajjadi, S.A. Effects of Rain Intensity, Slope Gradient and Particle Size Distribution on the Relative Contributions of Splash and Wash Loads to Rain-Induced Erosion. Geomorphology 2016, 253, 159–167. [Google Scholar] [CrossRef]
  2. Ran, Q.; Su, D.; Li, P.; He, Z. Experimental Study of the Impact of Rainfall Characteristics on Runoff Generation and Soil Erosion. J. Hydrol. 2012, 424–425, 99–111. [Google Scholar] [CrossRef]
  3. Wang, B.; Steiner, J.; Zheng, F.; Gowda, P. Impact of Rainfall Pattern on Interrill Erosion Process. Earth Surf. Process. Landf. 2017, 42, 1833–1846. [Google Scholar] [CrossRef]
  4. Asadi, H.; Moussavi, A.; Ghadiri, H.; Rose, C.W. Flow-Driven Soil Erosion Processes and the Size Selectivity of Sediment. J. Hydrol. 2011, 406, 73–81. [Google Scholar] [CrossRef]
  5. Kinnell, P.I.A. Raindrop-Impact-Induced Erosion Processes and Prediction: A Review. Hydrol. Process. 2005, 19, 2815–2844. [Google Scholar] [CrossRef]
  6. Wirtz, S.; Seeger, M.; Ries, J.B. Field Experiments for Understanding and Quantification of Rill Erosion Processes. CATENA 2012, 91, 21–34. [Google Scholar] [CrossRef]
  7. Kheirfam, H.; Sadeghi, S.H.; Darki, B.Z. Soil Conservation in an Abandoned Agricultural Rain-Fed Land through Inoculation of Cyanobacteria. Catena 2020, 187, 104341. [Google Scholar] [CrossRef]
  8. Gabet, E.J.; Dunne, T. Sediment Detachment by Rain Power. Water Resour. Res. 2003, 39, ESG 1-1–ESG 1-12. [Google Scholar] [CrossRef]
  9. Zhang, X.C.J.; Wang, Z.L. Interrill Soil Erosion Processes on Steep Slopes. J. Hydrol. 2017, 548, 652–664. [Google Scholar] [CrossRef]
  10. Bryan, R.B. Soil Erodibility and Processes of Water Erosion on Hillslope. Geomorphology 2000, 32, 385–415. [Google Scholar] [CrossRef]
  11. Wei, H.; Nearing, M.A.; Stone, J.J.; Guertin, D.P.; Spaeth, K.E.; Pierson, F.B.; Nichols, M.H.; Moffet, C.A. A New Splash and Sheet Erosion Equation for Rangelands. Soil Sci. Soc. Am. J. 2009, 73, 1386–1392. [Google Scholar] [CrossRef]
  12. Wischmeier, W.H.; Smith, D.D. Predicting Rainfall Erosion Losses: A Guide to Conservation Planning; Department of Agriculture, Science and Education Administration: Washington, DC, USA, 1978. [Google Scholar]
  13. Cai, F.; Li, R.; Yan, B.; Zhang, W.; Jing, J.; Xue, C.; Yi, Z. Rainfall Predominantly Governs Soil Organic Carbon Loss, Exceeding the Contribution of Vegetation Carbon Sequestration in Karst Watersheds. Land Degrad. Dev. 2025, ldr.70085. [Google Scholar] [CrossRef]
  14. Wei, P.; Du, J.; Bahadur, A.; Zhang, H.; Wang, S.; Wu, T.; Chen, S. Soil Erosion and Risk Assessment on the Qinghai-Tibetan Plateau. Commun. Earth Environ. 2025, 6, 365. [Google Scholar] [CrossRef]
  15. Zhang, Q.; Zhang, Y.; Chen, D.; Wang, X.; Zhu, Y.; Yin, Z.; Shang, W.; Luo, H. Effect of Rainfall Intensity and Gravel Content on Hydraulic Characteristics and Hydraulic Parameters on Soil Erosion of Spoil Heaps: Laboratory Experiments with Simulated Rainfall. Int. Soil Water Conserv. Res. 2025, 13, 301–318. [Google Scholar] [CrossRef]
  16. Annabi, M.; Raclot, D.; Bahri, H.; Bailly, J.S.; Gomez, C.; Le Bissonnais, Y. Spatial Variability of Soil Aggregate Stability at the Scale of an Agricultural Region in Tunisia. CATENA 2017, 153, 157–167. [Google Scholar] [CrossRef]
  17. Bradford, J.M.; Ferris, J.E.; Remley, P.A. Interrill Soil Erosion Processes: I. Effect of Surface Sealing on Infiltration, Runoff, and Soil Splash Detachment. Soil Sci. Soc. Am. J. 1987, 51, 1566–1571. [Google Scholar] [CrossRef]
  18. Sun, L.; Zhou, J.L.; Cai, Q.; Liu, S.; Xiao, J. Comparing Surface Erosion Processes in Four Soils from the Loess Plateau under Extreme Rainfall Events. Int. Soil Water Conserv. Res. 2021, 9, 520–531. [Google Scholar] [CrossRef]
  19. Lehmann, J.; Hansel, C.M.; Kaiser, C.; Kleber, M.; Maher, K.; Manzoni, S.; Nunan, N.; Reichstein, M.; Schimel, J.P.; Torn, M.S. Persistence of Soil Organic Carbon Caused by Functional Complexity. Nat. Geosci. 2020, 13, 529–534. [Google Scholar] [CrossRef]
  20. Wang, W.; Yin, S.; Xie, Y.; Liu, B.; Liu, Y. Effects of Four Storm Patterns on Soil Loss from Five Soils under Natural Rainfall. CATENA 2016, 141, 56–65. [Google Scholar] [CrossRef]
  21. Li, Y.; He, Y.; Zhang, Y.; Jia, L. Spatiotemporal Evolutionary Analysis of Rainfall Erosivity during 1901–2017 in Beijing, China. Environ. Sci. Pollut. Res. 2022, 29, 2510–2522. [Google Scholar] [CrossRef]
  22. Kemper, W.D.; Rosenau, R.C. Aggregate Stability and Size Distribution. In SSSA Book Series; Klute, A., Ed.; Soil Science Society of America, American Society of Agronomy: Madison, WI, USA, 1986; pp. 425–442. ISBN 978-0-89118-864-3. [Google Scholar]
  23. Qiu, L.; Zhang, Q.; Zhu, H.; Reich, P.B.; Banerjee, S.; Van Der Heijden, M.G.A.; Sa-dowsky, M.J.; Ishii, S.; Jia, X.; Shao, M.; et al. Erosion Reduces Soil Microbial Diversity, Net-work Complexity and Multifunctionality. ISME J. 2021, 15, 2474–2489. [Google Scholar] [CrossRef]
  24. Sinclair, L.; Osman, O.A.; Bertilsson, S.; Eiler, A. Microbial Community Composition and Diversity via 16S rRNA Gene Amplicons: Evaluating the Illumina Platform. PLoS ONE 2015, 10, e0116955. [Google Scholar] [CrossRef] [PubMed]
  25. Mueller, R.C.; Paula, F.S.; Mirza, B.S.; Rodrigues, J.L.M.; Nüsslein, K.; Bohannan, B.J.M. Links between Plant and Fungal Communities across a Deforestation Chronosequence in the Amazon Rainforest. ISME J. 2014, 8, 1548–1550. [Google Scholar] [CrossRef] [PubMed]
  26. Rillig, M.C.; Wright, S.F.; Allen, M.F.; Field, C.B. Rise in Carbon Dioxide Changes Soil Structure. Nature 1999, 400, 628. [Google Scholar] [CrossRef]
  27. Foster, G.; Yoder, D.; Weesies, G.; McCool, D.; McGregor, K.; Bingner, R. Revised Universal Soil Loss Equation Version 2; Draft Science Documentation; USDA-Agricultural Research Service: Washington, DC, USA, 2005. [Google Scholar]
  28. Kinnell, P.I.A. Runoff Dependent Erosivity and Slope Length Factors Suitable for Modelling Annual Erosion Using the Universal Soil Loss Equation. Hydrol. Process. 2007, 21, 2681–2689. [Google Scholar] [CrossRef]
  29. Renard, K.G. Predicting Soil Erosion by Water: A Guide to Conservation Planning with the Revised Universal Soil Loss Equation (RUSLE); US Department of Agriculture, Agricultural Research Service: Washington, DC, USA, 1997; ISBN 0-16-048938-5. [Google Scholar]
  30. Vaezi, A.R.; Sadeghi, S.H.R.; Bahrami, H.A.; Mahdian, M.H. Modeling the USLE K-Factor for Calcareous Soils in Northwestern Iran. Geomorphology 2008, 97, 414–423. [Google Scholar] [CrossRef]
  31. Han, D.; Deng, J.; Gu, C.; Mu, X.; Gao, P.; Gao, J. Effect of Shrub-Grass Vegetation Coverage and Slope Gradient on Runoff and Sediment Yield under Simulated Rainfall. Int. J. Sediment Res. 2021, 36, 29–37. [Google Scholar] [CrossRef]
  32. Li, R.; Gao, J.; He, M.; Jing, J.; Xiong, L.; Chen, M.; Zhao, L. Effect of Rock Exposure on Runoff and Sediment on Karst Slopes under Erosive Rainfall Conditions. J. Hydrol. Reg. Stud. 2023, 50, 101525. [Google Scholar] [CrossRef]
  33. Luan, Q.; Zhang, C.; Tong, J.; Wu, S.; Pang, T.; Wang, L. Experimental Study on the Mechanism of Artificial Runoff Generation on Typical Slopes in Farmland of North China. Hydrol. Process. 2025, 39, e70078. [Google Scholar] [CrossRef]
  34. Gale, W.J.; Cambardella, C.A.; Bailey, T.B. Root-Derived Carbon and the Formation and Stabilization of Aggregates. Soil Sci. Soc. Am. J. 2000, 64, 201–207. [Google Scholar] [CrossRef]
  35. Márquez, C.O.; Garcia, V.J.; Cambardella, C.A.; Schultz, R.C.; Isenhart, T.M. Aggregate-Size Stability Distribution and Soil Stability. Soil Sci. Soc. Am. J. 2004, 68, 725–735. [Google Scholar] [CrossRef]
  36. Barthès, B.; Roose, E. Aggregate Stability as an Indicator of Soil Susceptibility to Runoff and Erosion; Validation at Several Levels. CATENA 2002, 47, 133–149. [Google Scholar] [CrossRef]
  37. Erktan, A.; Cécillon, L.; Graf, F.; Roumet, C.; Legout, C.; Rey, F. Increase in Soil Aggregate Stability along a Mediterranean Successional Gradient in Severely Eroded Gully Bed Ecosystems: Combined Effects of Soil, Root Traits and Plant Community Characteristics. Plant Soil 2016, 398, 121–137. [Google Scholar] [CrossRef]
  38. Wang, H.; Zhang, G.; Li, N.; Zhang, B.; Yang, H. Variation in Soil Erodibility under Five Typical Land Uses in a Small Watershed on the Loess Plateau, China. CATENA 2019, 174, 24–35. [Google Scholar] [CrossRef]
  39. Le Bissonnais, Y. Aggregate Stability and Assessment of Soil Crustability and Erodibility: I. Theory and Methodology. Eur. J. Soil Sci. 1996, 47, 425–437. [Google Scholar] [CrossRef]
  40. Six, J.; Bossuyt, H.; Degryze, S.; Denef, K. A History of Research on the Link between (Micro) Aggregates, Soil Biota, and Soil Organic Matter Dynamics. Soil Tillage Res. 2004, 79, 7–31. [Google Scholar] [CrossRef]
  41. Assouline, S.; Ben-Hur, M. Effects of Rainfall Intensity and Slope Gradient on the Dynamics of Interrill Erosion during Soil Surface Sealing. Catena 2006, 66, 211–220. [Google Scholar] [CrossRef]
  42. Abu-Ashour, J.; Lee, H. Transport of Bacteria on Sloping Soil Surfaces by Runoff. Environ. Toxicol. 2000, 15, 149–153. [Google Scholar] [CrossRef]
  43. Kuhn, N.J.; Hoffmann, T.; Schwanghart, W.; Dotterweich, M. Agricultural Soil Erosion and Global Carbon Cycle: Controversy Over? Earth Surf. Process. Landf. 2009, 34, 1033–1038. [Google Scholar] [CrossRef]
  44. Liu, S.; Bliss, N.; Sundquist, E.; Huntington, T.G. Modeling Carbon Dynamics in Vegetation and Soil under the Impact of Soil Erosion and Deposition. Glob. Biogeochem. Cycles 2003, 17, 2002GB002010. [Google Scholar] [CrossRef]
  45. Turner, B.L.; Driessen, J.P.; Haygarth, P.M.; Mckelvie, I.D. Potential Contribution of Lysed Bacterial Cells to Phosphorus Solubilisation in Two Rewetted Australian Pasture Soils. Soil Biol. Biochem. 2003, 35, 187–189. [Google Scholar] [CrossRef]
  46. Gordon, H.; Haygarth, P.M.; Bardgett, R.D. Drying and Rewetting Effects on Soil Microbial Community Composition and Nutrient Leaching. Soil Biol. Biochem. 2008, 40, 302–311. [Google Scholar] [CrossRef]
  47. Barnes, C.J.; Van Der Gast, C.J.; McNamara, N.P.; Rowe, R.; Bending, G.D. Extreme Rainfall Affects Assembly of the Root-associated Fungal Community. New Phytol. 2018, 220, 1172–1184. [Google Scholar] [CrossRef]
  48. Gabet, E.J.; Dunne, T. A Stochastic Sediment Delivery Model for a Steep Mediterranean Landscape. Water Resour. Res. 2003, 39, 2003WR002341. [Google Scholar] [CrossRef]
  49. Rillig, M.C.; Mummey, D.L. Mycorrhizas and Soil Structure. New Phytol. 2006, 171, 41–53. [Google Scholar] [CrossRef]
  50. Annabi, M.; Houot, S.; Francou, C.; Poitrenaud, M.; Bissonnais, Y.L. Soil Aggregate Stability Improvement with Urban Composts of Different Maturities. Soil Sci. Soc. Am. J. 2007, 71, 413–423. [Google Scholar] [CrossRef]
  51. Lehmann, A.; Rillig, M.C. Understanding Mechanisms of Soil Biota Involvement in Soil Aggregation: A Way Forward with Saprobic Fungi? Soil Biol. Biochem. 2015, 88, 298–302. [Google Scholar] [CrossRef]
  52. Redmile-Gordon, M.; Gregory, A.S.; White, R.P.; Watts, C.W. Soil Organic Carbon, Extracellular Polymeric Substances (EPS), and Soil Structural Stability as Affected by Previous and Current Land-Use. Geoderma 2020, 363, 114143. [Google Scholar] [CrossRef]
  53. Kheirfam, H.; Sadeghi, S.H.; Zarei Darki, B.; Homaee, M. Controlling Rainfall-Induced Soil Loss from Small Experimental Plots through Inoculation of Bacteria and Cyanobacteria. CATENA 2017, 152, 40–46. [Google Scholar] [CrossRef]
  54. Guida, G.; Palmeri, V.; Settanni, L.; Gaglio, R.; Tolone, M.; Ferro, V. Ability of Soil Bacterial Composition as an Indicator of Levels of Soil Erosion in a Badland. Int. J. Sediment Res. 2022, 37, 493–504. [Google Scholar] [CrossRef]
  55. Duchicela, J.; Sullivan, T.S.; Bontti, E.; Bever, J.D. Soil Aggregate Stability Increase Is Strongly Related to Fungal Community Succession along an Abandoned Agricultural Field Chronosequence in the B Olivian A Ltiplano. J. Appl. Ecol. 2013, 50, 1266–1273. [Google Scholar] [CrossRef]
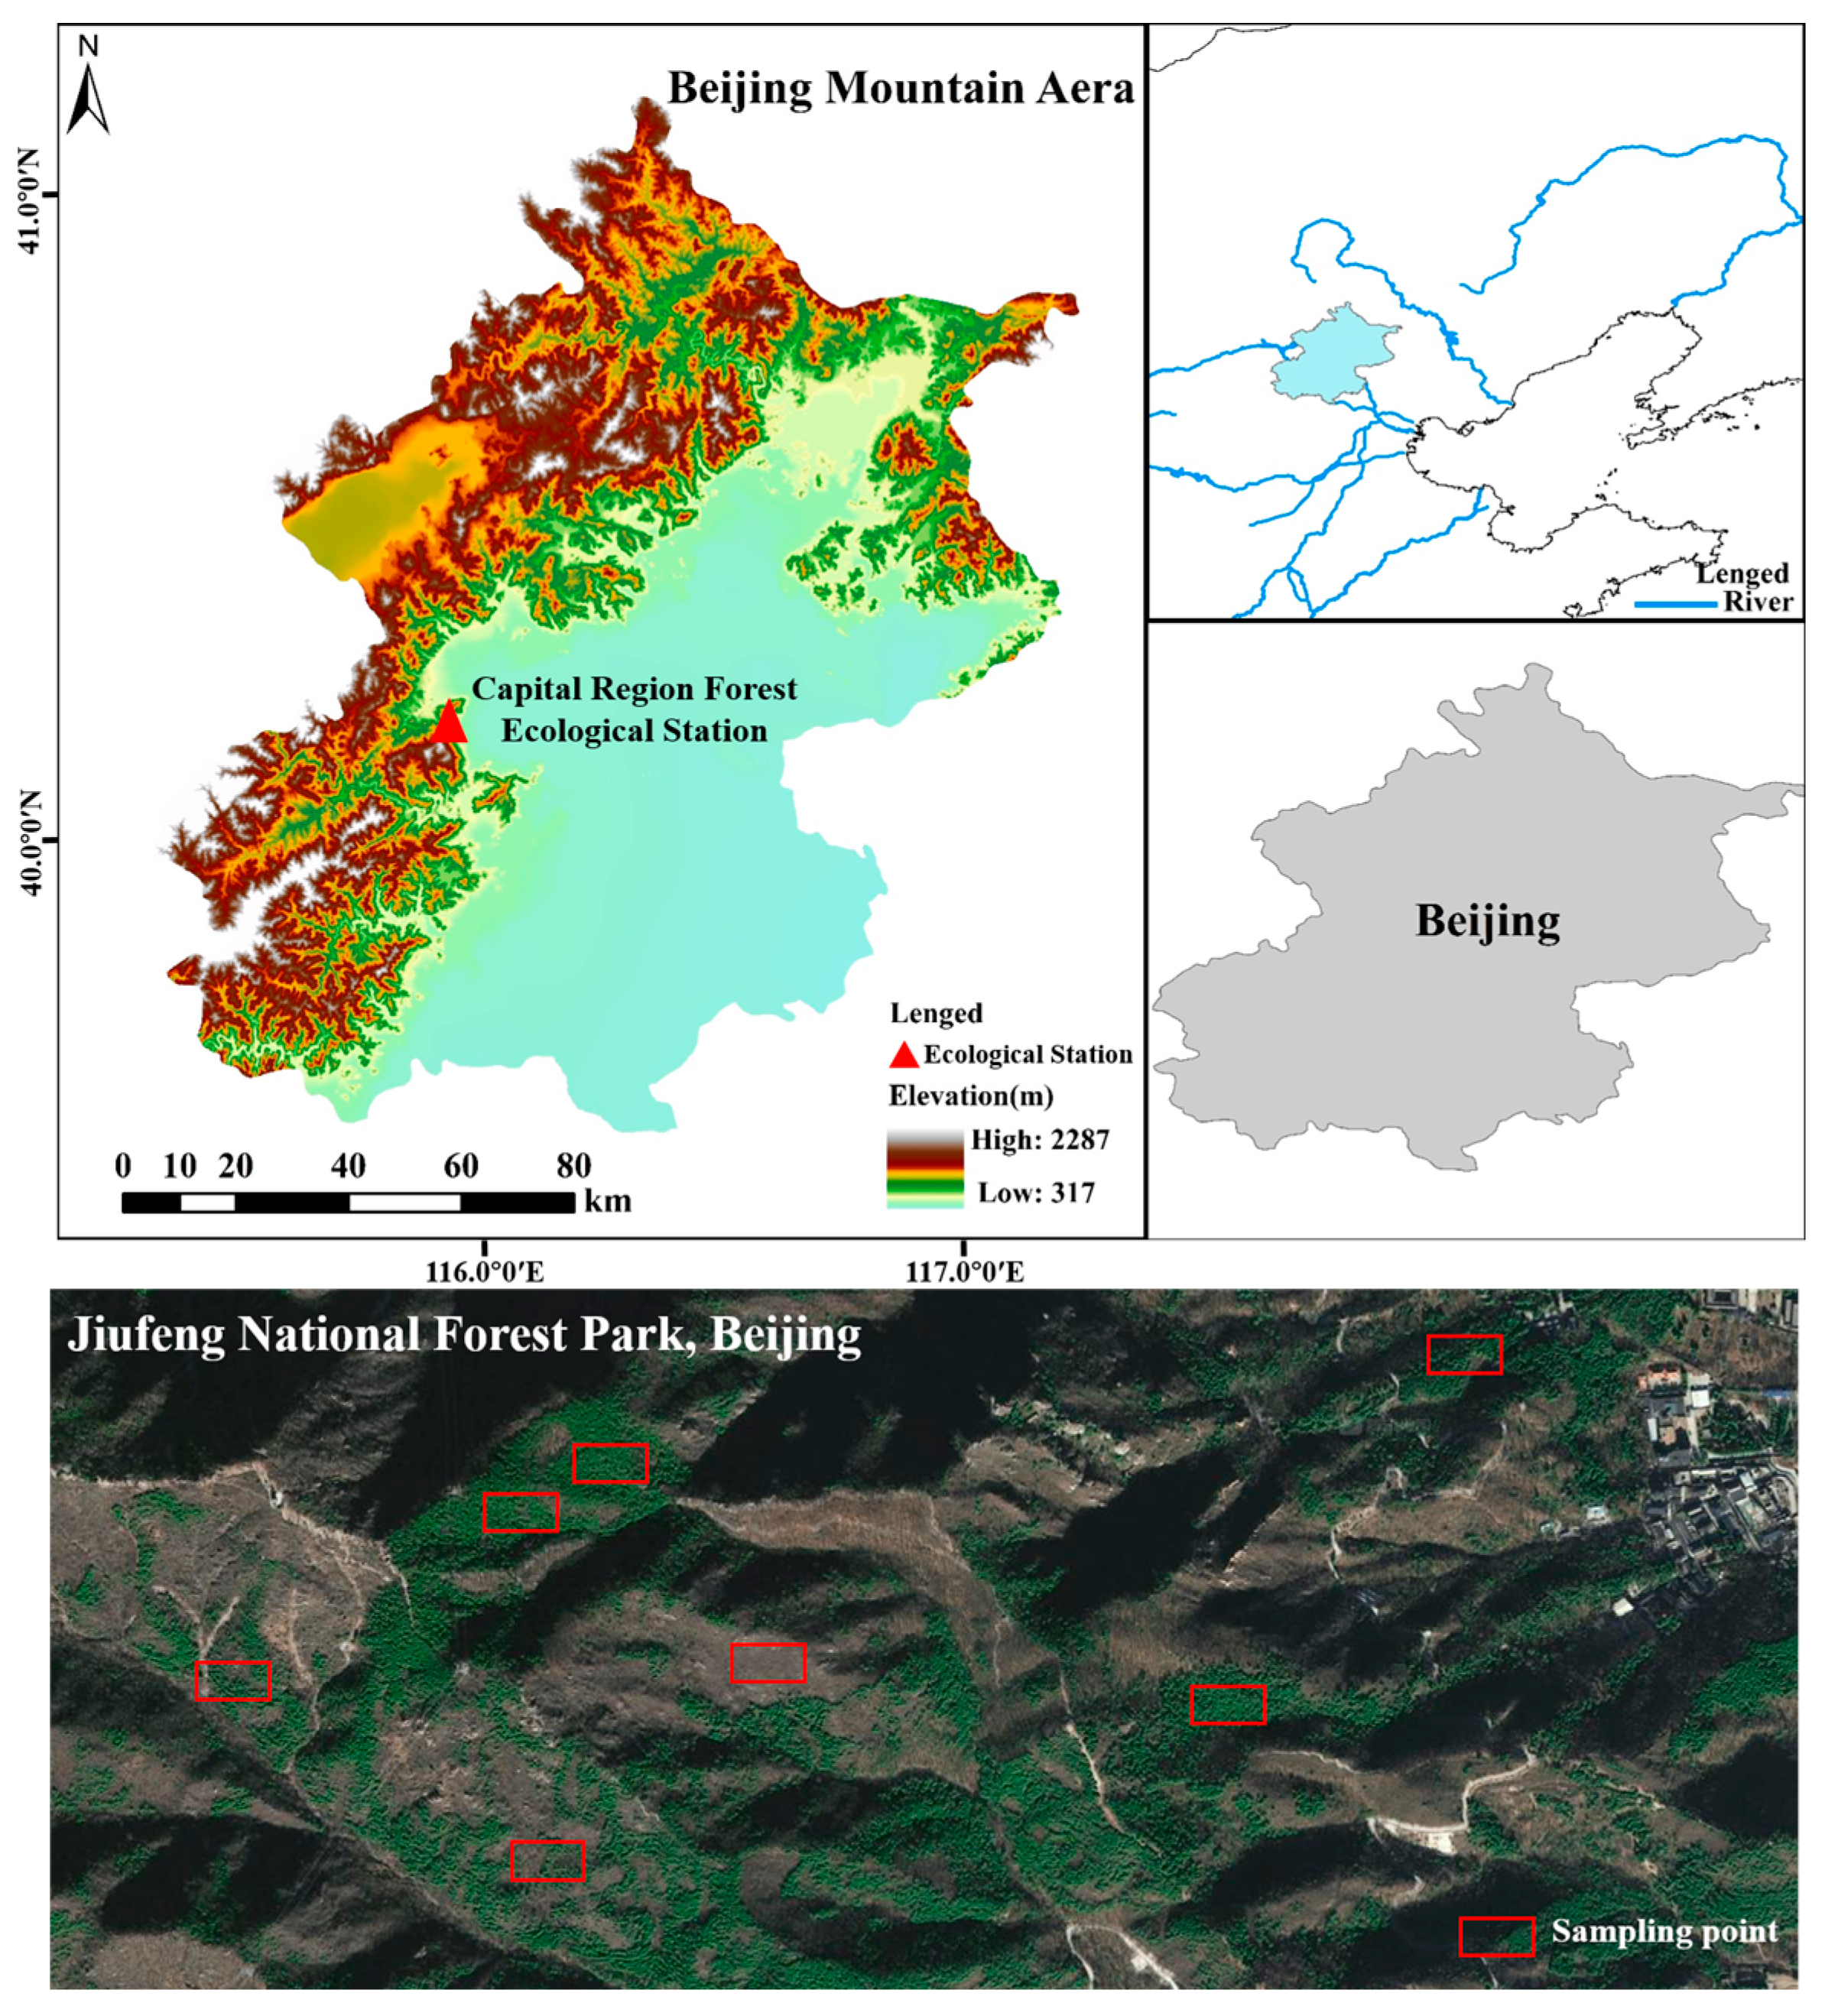
Figure 1. Study area.
Hydrology 12 00267 g001
Figure 2. The curves of infiltration and runoff production over time, with the blue dashed line representing the linear fit. The blue dashed line is the linear fit line.
Hydrology 12 00267 g002
Figure 3. Infiltration–runoff dynamics under varying rainfall intensities and vegetation-type conditions. (a) Infiltration rate, (b) time to runoff initiation, (c) runoff production rate, and (d) cumulative runoff volume.
Hydrology 12 00267 g003
Figure 4. The variation in soil erosion rates with time.
Hydrology 12 00267 g004
Figure 5. Comparison of slope soil erosion characteristics under different rainfall intensities. (a) Soil erosion rate; (b) Mean weight diameter (MWD) between control soils (CK) and eroded sediments. Note: For CK samples (control soils), air-dried undisturbed soils were pre-treated by passing through a 5 mm sieve (to remove stones and plant residues) and selecting 5–0.25 mm aggregates before wet sieving, to standardize the initial aggregate size.
Hydrology 12 00267 g005
Figure 6. Relationships between aggregate-related properties and soil erosion rate under different rainfall intensities: (ad) macroaggregate content, microaggregate content, primary particle content, and mean weight diameter (MWD) vs. soil erosion rate at 30 mm·h−1; (eh) the same properties vs. soil erosion rate at 80 mm·h−1; (il) the same properties vs. soil erosion rate at 120 mm·h−1.
Hydrology 12 00267 g006
Figure 7. The variations in average soil erodibility K-factors under different rainfall intensities and vegetation types.
Hydrology 12 00267 g007
Figure 8. Relationships between aggregate-related properties and K-factor under different rainfall intensities: (ad) macroaggregate content, microaggregate content, primary particle content, and mean weight diameter (MWD) vs. K-factor at 30 mm·h−1; (eh) the same properties vs. K-factor at 80 mm·h−1; (il) the same properties vs. K-factor at 120 mm·h−1.
Hydrology 12 00267 g008
Figure 9. Relative abundance of major microbial taxa under different rainfall intensities and vegetation types: (a) Acidobacteria; (b) Proteobacteria; (c) Actinobacteria; (d) Ascomycota; (e) Basidiomycota.
Hydrology 12 00267 g009
Figure 10. Redundancy analysis (RDA) analyzed the relationship between biotic /abiotic factors and slope soil erosion at 30mm·h−1 rain intensity. (a) At 30 mm·h−1, sand/clay/macroaggregates drive erosion; P.lat is least erodible. (b) At 80 mm·h−1, microaggregates/sand/Ascomycota dominate; Bar is most erodible. (c) At 120 mm·h−1, sand/Ascomycota are key; Bar/Shr are less erosion-resistant.
Hydrology 12 00267 g010
Table 1. The basic characteristics of different vegetation types.
Vegetation TypesPlot Area (m2)Elevation
(m)
Density
(Tree·hm−2)
DBH
(cm)
Tree Height (m)Slope Gradient (°)AspectSand Content (%)Silt Content (%)Clay Content (%)SOC (g·kg−1)pHTotal N (g·kg−1)Total P (g·kg−1)
Q.var20 × 20319.29198317.2110.920shaded slope42.3 ± 3.138.5 ± 2.719.2 ± 1.812.5 ± 1.36.8 ± 0.21.12 ± 0.110.65 ± 0.08
P.lat20 × 20142.43205012.779.4215shaded slope45.6 ± 2.935.2 ± 2.419.2 ± 1.511.8 ± 1.16.9 ± 0.31.05 ± 0.090.62 ± 0.07
Shr5 × 20152.5159002.230.9815shaded slope51.2 ± 3.532.8 ± 2.616.0 ± 1.48.3 ± 0.97.2 ± 0.20.78 ± 0.080.45 ± 0.06
Bar2 × 2160.49--0.2715shaded slope58.5 ± 4.228.3 ± 3.113.2 ± 1.63.2 ± 0.57.8 ± 0.30.35 ± 0.050.28 ± 0.04
Note: “Plot area” refers to the total boundary area of the field sampling plot (for overall vegetation and topographic investigation). During the simulated rainfall experiment, the actual wetted area of the rainfall simulator was uniformly controlled at 1 m2 across all vegetation-type treatments to eliminate the impact of total plot area differences on experimental results.
Table 2. Comparison of aggregate component loss under different rain intensities and different vegetation types. Note: Eroded sediments were collected at 3 min intervals during rainfall simulation; data represent mean values of three replicates.
Vegetation TypesRainfall Intensity (mm·h−1)MacroaggregatesMicroaggregatesPrimary Particles
g%g%g%
Q.var300.89 c22.410.54 c13.782.52 c63.81
8089.04 b39.4153.89 b23.8583.00 b36.74
120345.49 a41.29168.83 a20.18322.33 a38.53
P.lat802.17 b9.711.09 b4.8619.09 a85.44
1207.68 a24.463.94 a12.5519.77 a62.99
Shr303.53 c21.682.44 c14.9810.33 b63.34
8018.76 b41.3819.25 b42.447.34 b16.18
120912.97 a48.96273.93 a44.69677.84 a16.35
Bar304.17 c41.523.26 c32.442.61 c26.04
80504.09 b54.18214.83 a23.09211.50 b22.73
120873.12 a64.00168.79 b12.37322.33 a23.63
Note: Different lowercase letters (a, b, c) within the same column indicate significant differences (p < 0.05) among groups based on multiple comparison tests.
Disclaimer/Publisher’s Note: The statements, opinions and data contained in all publications are solely those of the individual author(s) and contributor(s) and not of MDPI and/or the editor(s). MDPI and/or the editor(s) disclaim responsibility for any injury to people or property resulting from any ideas, methods, instructions or products referred to in the content.