Article

Projected Runoff Changes and Their Effects on Water Levels in the Lake Qinghai Basin Under Climate Change Scenarios

1
Institute of Geographical Science, Henan Academy of Science, Zhengzhou 450052, China
2
Key Laboratory of Remote Sensing and Geographic Information Systems in Henan Province, Zhengzhou 450052, China
3
Institute for Ecological Research and Pollution Control of Plateau Lakes, School of Ecology and Environmental Science, Yunnan University, Kunming 650500, China
4
Southwest United Graduate School, Kunming 650500, China
*
Authors to whom correspondence should be addressed.
Hydrology 2025, 12(10), 259; https://doi.org/10.3390/hydrology12100259
Submission received: 15 August 2025 / Revised: 24 September 2025 / Accepted: 30 September 2025 / Published: 2 October 2025
(This article belongs to the Special Issue Runoff Modelling under Climate Change)

Abstract

Lake Qinghai, the largest closed-basin lake on the Qinghai–Tibet Plateau, plays a crucial role in maintaining regional ecological stability through its hydrological functions. In recent decades, the lake has exhibited a continuous rise in water level and lake area expansion, sparking growing interest in the mechanisms driving these changes and their future evolution. This study integrates the Soil and Water Assessment Tool (SWAT), simulations under future Shared Socioeconomic Pathways (SSPs) and statistical analysis methods, to assess runoff dynamics and lake level responses in the Lake Qinghai Basin over the next 30 years. The model was developed using a combination of meteorological, hydrological, topographic, land use, soil, and socio-economic datasets, and was calibrated with the sequential uncertainty fitting Ver-2 (SUFI-2) algorithm within the SWAT calibration and uncertainty procedure (SWAT–CUP) platform. Sensitivity and uncertainty analyses confirmed robust model performance, with monthly R2 values of 0.78 and 0.79. Correlation analysis revealed that runoff variability is more closely associated with precipitation than temperature in the basin. Under SSP 1-2.6, SSP 3-7.0, and SSP 5-8.5 scenarios, projected annual precipitation increases by 14.4%, 18.9%, and 11.1%, respectively, accompanied by temperature rises varying with emissions scenario. Model simulations indicate a significant increase in runoff in the Buha River Basin, peaking around 2047. These findings provide scientific insight into the hydrological response of plateau lakes to future climate change and offer a valuable reference for regional water resource management and ecological conservation strategies.

1. Introduction

Lakes, as pivotal nodes in the global water cycle and sentinels of climate change, play a crucial role in regional water security and ecosystem stability through their dynamic transformations [1]. On the Tibetan Plateau, often referred to as the Asian Water Tower, high-altitude lakes are particularly responsive to global warming, making them ideal natural laboratories for studying climate hydrology interactions [2,3]. Under the dual pressures of global climate change and intensifying regional human activities, elucidating the driving mechanisms of these complex factors on watershed hydrological processes has become a central research frontier in hydrology and Earth system science [4,5]. This endeavor holds profound scientific value and practical importance for the formulation of proactive, sustainable water resource management strategies [6].
Lake Qinghai, the largest inland lake on the Tibetan Plateau, serves as a critical ecological barrier for the region [7]. Over recent decades, its hydrological regime has undergone a profound transformation, most notably characterized by a sustained water level increase since 2004, rising at an average rate of 0.21 m yr−1 [8,9]. This reversal has garnered significant scientific attention, yet its primary drivers remain a subject of debate [10,11]. Some studies have emphasized the role of climatic factors, such as rising temperatures and altered precipitation patterns [12,13], while others point to the contributions of human activities, including land use/cover change (LUCC) and grassland degradation [14,15]. Disentangling the relative contributions of these interconnected factors remains a core challenge [16,17]. The hydrological responses to climate change and human activities vary regionally, and research methodologies primarily include paired catchment studies, statistical analyses, quantitative and empirical models, and hydrological simulations [18]. Traditional statistical and quantitative analyses provide a foundational framework for quantifying the contributions of various driving factors, but they are inherently limited in their ability to elucidate complex physical mechanisms [19]. In parallel, emerging space-based observation techniques, such as the integration of ICESat–2 satellite altimetry with high-precision geoid models (TG20), have significantly enhanced the accuracy of instantaneous water level monitoring. Nevertheless, these observational methods are constrained by the relatively short time series available since the satellite’s mission inception, which hinders their capacity to independently explain the underlying drivers of water level dynamics [20]. With the growing emphasis on watershed resource management and ecological conservation, the role of hydrological models in understanding and predicting hydrological processes has become increasingly prominent [21], particularly for accurately simulating runoff dynamics in high-altitude lake basins to inform water resource allocation and ecological protection [22]. Hydrological models like the Geomorphology-Based Ecohydrological Model (GBEHM), when driven by future climate scenarios from Global Climate Models (GCMs), enable the systematic simulation and assessment of long-term changes in watershed hydrological processes and their impact on lake levels [23]. However, when applied at the watershed scale, these types of models suffer from low resolution, introducing inherent uncertainties and limitations that compromise the accuracy of simulation and prediction outcomes.
To unravel these complex relationships, distributed hydrological models such as the Soil and Water Assessment Tool (SWAT) have proven indispensable for simulating basin-scale processes in Lake Qinghai [24]. Numerous previous studies have employed the SWAT model to project future runoff in the basin, providing valuable foundational insights into the region’s hydrological trends [25]. A key limitation of these studies, however, lies in their reliance on climate projections from the now-superseded Coupled Model Intercomparison Project Phase 5 (CMIP5) [26]. As the latest global climate model ensemble, CMIP 6 offers significant advancements over CMIP 5, including improved representation of physical processes, enhanced spatial resolution, and more sophisticated simulation of key feedback mechanisms [27]. Critically, CMIP 6 introduces the new and more granular Shared Socioeconomic Pathways (SSPs) framework, which links diverse narratives of future socioeconomic development with a range of radiative forcing levels, thereby providing more comprehensive and plausible future climate scenarios [28].
While recent studies have begun to apply CMIP 6 projections at the macro-scale of the Tibetan Plateau, generally confirming a continued warming trend but showing greater uncertainty in precipitation patterns [29], a critical research gap persists. Specifically, a high-resolution hydrological impact assessment for the Lake Qinghai basin that couples a finely calibrated SWAT model with the latest CMIP6 multi-model ensembles is urgently needed. Such an analysis is crucial for accurately projecting the frequency and intensity of future hydrological extremes and the consequent changes in the lake’s water level, area, and storage. The core innovation of this study, therefore, is to conduct a systematic assessment of the future hydrological dynamics of the Lake Qinghai basin by coupling a rigorously calibrated and validated SWAT model with the latest multi-model ensemble projections from CMIP6. We selected three representative scenarios SSP1-2.6 (a low-emission scenario following a sustainable path), SSP3-7.0 (a medium-high emission scenario characterized by regional rivalry), and SSP5-8.5 (a high-emission scenario driven by fossil-fuel development) to comprehensively span a range of plausible future trajectories. The specific objectives of this research are: (1) to develop and validate a high-fidelity SWAT model for the Lake Qinghai basin using long-term historical data; (2) to project trends in key climate variables (i.e., temperature and precipitation) through 2050 under the selected SSP scenarios; (3) to simulate and quantify the corresponding runoff dynamics, with a focus on the primary tributary, the Buh River; and (4) to forecast the integrated impacts on the water level, area, and storage of Lake Qinghai through 2050, thereby providing a critical scientific basis for proactive and sustainable water resource planning in this iconic high-altitude watershed.

2. Materials and Methods

2.1. Study Region

The Lake Qinghai Basin is located between 36°17′–38°40′ N and 97°52′–101°45′ E in the northeastern part of the Tibetan Plateau, with a basin area of 29,645 km2 (Figure 1), and Lake Qinghai is the largest inland lake in China [30]. As China’s largest inland lake, Lake Qinghai serves as a crucial climate regulator in the northeastern Qinghai–Tibet Plateau and functions as a vital ecological barrier against desertification. Its closed basin characteristics render its hydrological system exceptionally sensitive to climate fluctuations, making it an ideal site for studying the impacts of climate change on high-altitude water resources [31]. Lake Qinghai is fed by over 70 rivers, with the Buha River being the primary source, supplying over 60% of the lake’s annual runoff. The basin’s hydrology is highly seasonal, with 60% to 80% of runoff occurring during the flood season from July to September. The lake’s annual freeze thaw cycle begins freezing in mid-December and complete thaw occurs by mid-April [32]. The climate features distinct spatial variations: annual average temperatures are higher in the eastern and southern parts (0.3 °C to 1.1 °C) and lower in the western and northern areas (−0.8 °C to 0.6 °C). Annual precipitation is low and unevenly distributed, ranging from 327 mm to 423 mm.

2.2. Methodology

2.2.1. SWAT Water Balance Equation

The Soil and Water Assessment Tool (SWAT) is designed to predict the long-term impacts of management practices on water quantity and quality. It is specifically applied to large, complex watersheds characterized by varied soils, land use, and management conditions [33]. The main process is to use the prepared data to classify the precipitation, temperature and insolation of each unit according to its location, calculate the runoff of each hydrologic response unit (HRU), and finally find the total runoff. The simulation of the land phase of the hydrologic cycle is governed by the water balance equation:
S W t = S W 0 + i = 1 t R d a y Q s u r f E a W s e e p Q g w
where SWt is the final soil water content (mm H2O), SWo is the initial soil water content (mm H2O), t is the time (days), Rday is the amount of precipitation on day i (mm H2O), Qsurf is the amount of surface runoff on day i (mm H2O), Ea is the amount of evapotranspiration on day i (mm H2O), Wseep is the amount of percolation and bypass flow exiting the soil profile bottom on day i (mm H2O), and Qgw is the amount of return flow on day i (mm H2O).

2.2.2. Calculation of Surface Runoff

The daily simulation of surface runoff, which accounts for various land uses and soil types, is a fundamental component of the model. As a core process, its accuracy is critical to the overall success of the simulation [34]. The equations are as follows:
Q surf = R day I a 2 R day I a + S
where Qsurf is the daily accumulated surface runoff (mm), including initial losses like puddle filling and canopy interception; Rday is the daily precipitation (mm); Ia represents the initial abstractions (mm), which includes all water lost before runoff begins (e.g., surface storage, interception, and initial infiltration); S is the retention parameter (mm). This parameter is a function of the soil type, land use, and slope, and it varies spatially and changes with soil moisture content over time. The retention parameter (S) can be derived from the following equation:
S = 2.54 1000 CN 10
where CN is the number of curves, usually, Ia = 0.2S, so the SCS curve equation can be simplified as:
Q surf = R day 0.2 S 2 R day + 0.8 S
where the SCS curve number is a function of soil permeability, land use type and pre-existing soil moisture content.

2.2.3. Calculation of Evaporation

Evapotranspiration includes water surface evaporation, bare ground evapotranspiration and vegetation evapotranspiration, whilst soil water evapotranspiration and plant evapotranspiration were modeled separately, and the Penman-Monteith formula was adopted in this study based on the needs of the model and the consideration of input data [35]. The formula is given below:
λ E = H net G + ρ air c p e z 0 e z / r a + Υ 1 + r c / r a
where λE is the latent heat flux density (MJ/m2d); E is the evaporation expressed in depth (mm/d); ∆ is the slope of the saturated water vapor pressure-temperature curve de/dT (kPa/°C); Hent is the net radiation (MJ/m2d); G is the surface heat flux density (MJ/m2d); ρair is the density of air (kg/m3); cp is the air at standard atmospheric pressure specific heat (MJ/Kg°C); e z 0 is the saturated water vapor pressure of air at height Z (Kpa); ez is the water vapor pressure of air at height Z (Kpa); γ is the Psychronmetric Humidity Constant (Kpa/°C); rc is the Vegetation Canopy Impedance (s/m); ra is the Aerodynamic Impedance (s/m).

2.2.4. Lake Water Balance

According to the above lake water balance formula, combined with the measured hydrological and meteorological data of the Lake Qinghai Basin, the relationships between lake evaporation and precipitation as well as temperature obtained via multiple regression are given in the following formula:
E = 1920.4421 + 9.3196 T mx + T mn 0.7221 P
where E represents the evaporation from the lake surface (mm), Tmx and Tmn represent the average maximum and minimum temperatures at the lake surface (°C), respectively, and P represents the precipitation at the lake surface (mm).
V 2 V 1 = R + 1.7378 P + 9.3196 T mx + T mn 1083.9464 / A
H 2 H 1 = 1.7378 P 9.3196 T mx + T mn 1083.9464 + R / A
where V2, V1 and H2, H1, respectively, indicate the end of the year and the beginning of the lake water storage and water level changes. A is the lake area caused by changes in lake water volume changes in the lake area, which can be based on the known lake water volume and area changes in the establishment of the lake water volume–area relationship deduction; E is the lake surface evaporation; P is the lake surface precipitation; R is the flow into the lake (surface and subsurface runoff). Equation (7) will be substituted into the lake water volume (water level) equation, and can be obtained in the next 30 years of Lake Qinghai water volume (water level) changes.

2.2.5. Simulation Accuracy and Applicability Evaluation

In this study, the following statistical criteria were used to verify the accuracy of the simulation results for assessing the applicability of the SWAT model in the Lake Qinghai Basin. The coefficient of determination (R2), Nash and Sutcliffe model efficiency coefficient (NSE), percent bias (PBIAS) and RMSE-observations standard deviation ratio (RSR) [36] were obtained via equations. When the structure and input parameters of the model are initially determined, it needs to be calibrated and validated. In this study, the following statistical criteria were used to verify the accuracy of the simulation results for assessing the applicability of the SWAT model in the Lake Qinghai Basin.
R 2 = i = 1 n Q o b s , i Q ¯ o b s Q s i m , i Q ¯ s i m i = 1 n Q o b s , i Q ¯ o b s 2 i = 1 n Q s i m , i Q ¯ s i m 2
where Qobs,i is the observation for the constituent being evaluated and where Qsim,i is the simulated value for the constituent being evaluated. The Qsim mean is the mean of the observed data for the constituent being evaluated, and n is the total number of observations.
The NSE model efficiency coefficient is used to assess the predictive ability of hydrological models; it varies from −∞–1, with better values in the range of 0.5–1. NSE determines the relative magnitude of the residual variance in comparison with the observed data variance. When the values for Ens and R2 are equal to one, the model prediction is considered “perfect”.
N S E = 1 i = 1 n Q o b s , i Q s i m , i 2 i = 1 n Q o b s , i Q ¯ o b s 2
where Qobs,i is the observed discharge, Qsim,i is the simulated discharge, Q ¯ o b s is the mean of the observed data for the constituent being evaluated, and n is the total number of observations.
The PBIAS measures the average tendency of the simulated values to be larger or smaller than their observed counterparts. PBIAS values must approach 0 or should be less than 25% for the model to be considered good. Positive values indicate underestimation of the model, and negative values indicate overestimation of the model.
P B I A S = i = 1 n Y i o b s Y i s i m × 100 i = 1 n Y i o b s
where Y i o b s is the observed discharge and Y i s i m is the simulated discharge.
The RSR is an error index that standardizes the root mean square error using the standard deviation of the observations. It may take values from 0 to ∞, with values less than 0.7 indicating good simulation. The RSR can be calculated via the following equation:
R S R = i = 1 n Y i o b s Y i s i m 2 i = 1 n ( Y i o b s Y ¯ i o b s ) 2
where n is the length of the simulations and evaluation periods, Y i o b s is the evaluation series, Y ¯ i o b s is the mean observed variable, and Y i s i m is (one of) the simulation series.

2.2.6. Selection of Climate Scenarios

To provide a comprehensive assessment of the potential impacts of future climate change on hydrological processes within the watershed, this study selected three distinct scenarios from the CMIP6 Shared Socioeconomic Pathways (SSPs): SSP1-2.6 (representing a low-emission scenario with a sustainable development pathway characterized by high mitigation challenges), SSP3-7.0 (a medium-to-high emission scenario marked by regional competition and posing significant challenges for both mitigation and adaptation), and SSP5-8.5 (a high-emission scenario driven by fossil fuel-intensive development, representing the worst-case warming trajectory). The scenarios were selected not only to span a broad range of plausible futures from optimistic to pessimistic, but also to enable the conversion of high resolution, multi-model climate projections from CMIP6 into basin-scale runoff, evapotranspiration, and water resource changes coupled with the SWAT hydrological model. The SSPs framework of CMIP6 reflects the combined impacts of socioeconomic development and emission pathways, ensuring hydrological simulations encompass the most plausible climate trajectories. Concurrently, the SWAT model enables quantification of climate change effects on the water cycle, clarifying the mechanisms underlying hydrological responses.

2.3. SWAT Model Construction Process

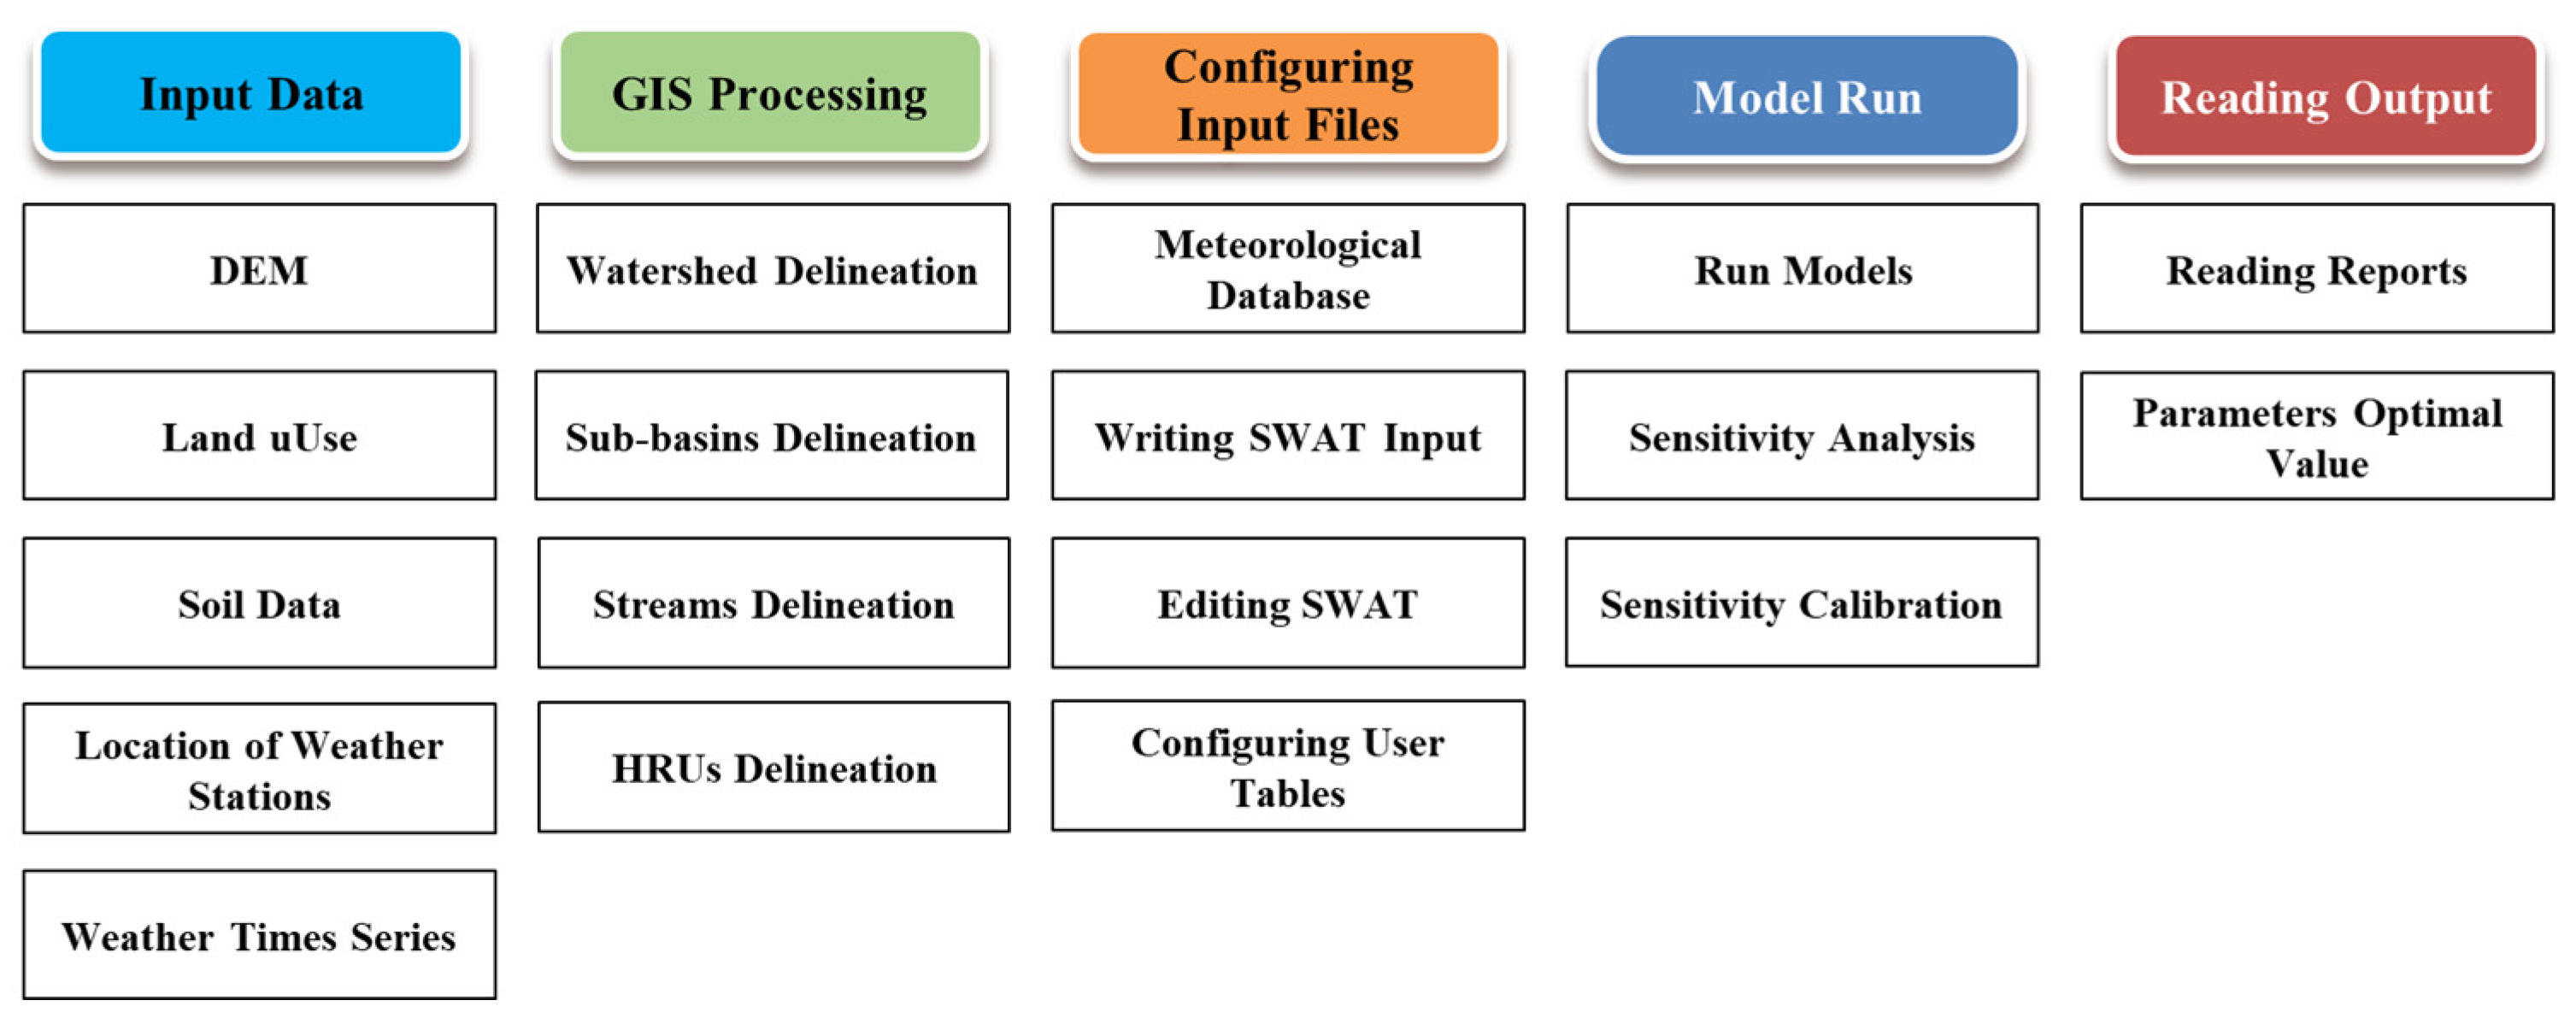
Simulating the hydrological processes of the Lake Qinghai Basin with the SWAT model requires specific input and validation datasets. The necessary input data includes a Digital Elevation Model (DEM), land use maps, soil type information, and meteorological records. Validation data consists of measured runoff. All datasets must be processed before the model can be run (Figure 2). Ultimately, the goal of this study is to simulate the runoff changes in the Lake Qinghai Basin over recent decades and to analyze and discuss the results.

2.3.1. Database Construction

The input data for the SWAT model of the Lake Qinghai basin mainly included the following contents. (1) Digital Elevation Model (DEM) data: This forms the basis for delineating subbasins and extracting key topographic features. This information is essential for analyzing the watershed’s hydrological characteristics. (2) Land use data: A map detailing the land use types within the Lake Qinghai Basin was used (Figure 3a). (3) Soil data: This dataset included soil type distribution maps, index tables, and a database of physical soil properties. These data are critical for simulating water movement within each Hydrologic Response Unit (HRU) (Figure 3b).

2.3.2. Subbasin Delineation and Hydrological Response Units (HRUs)

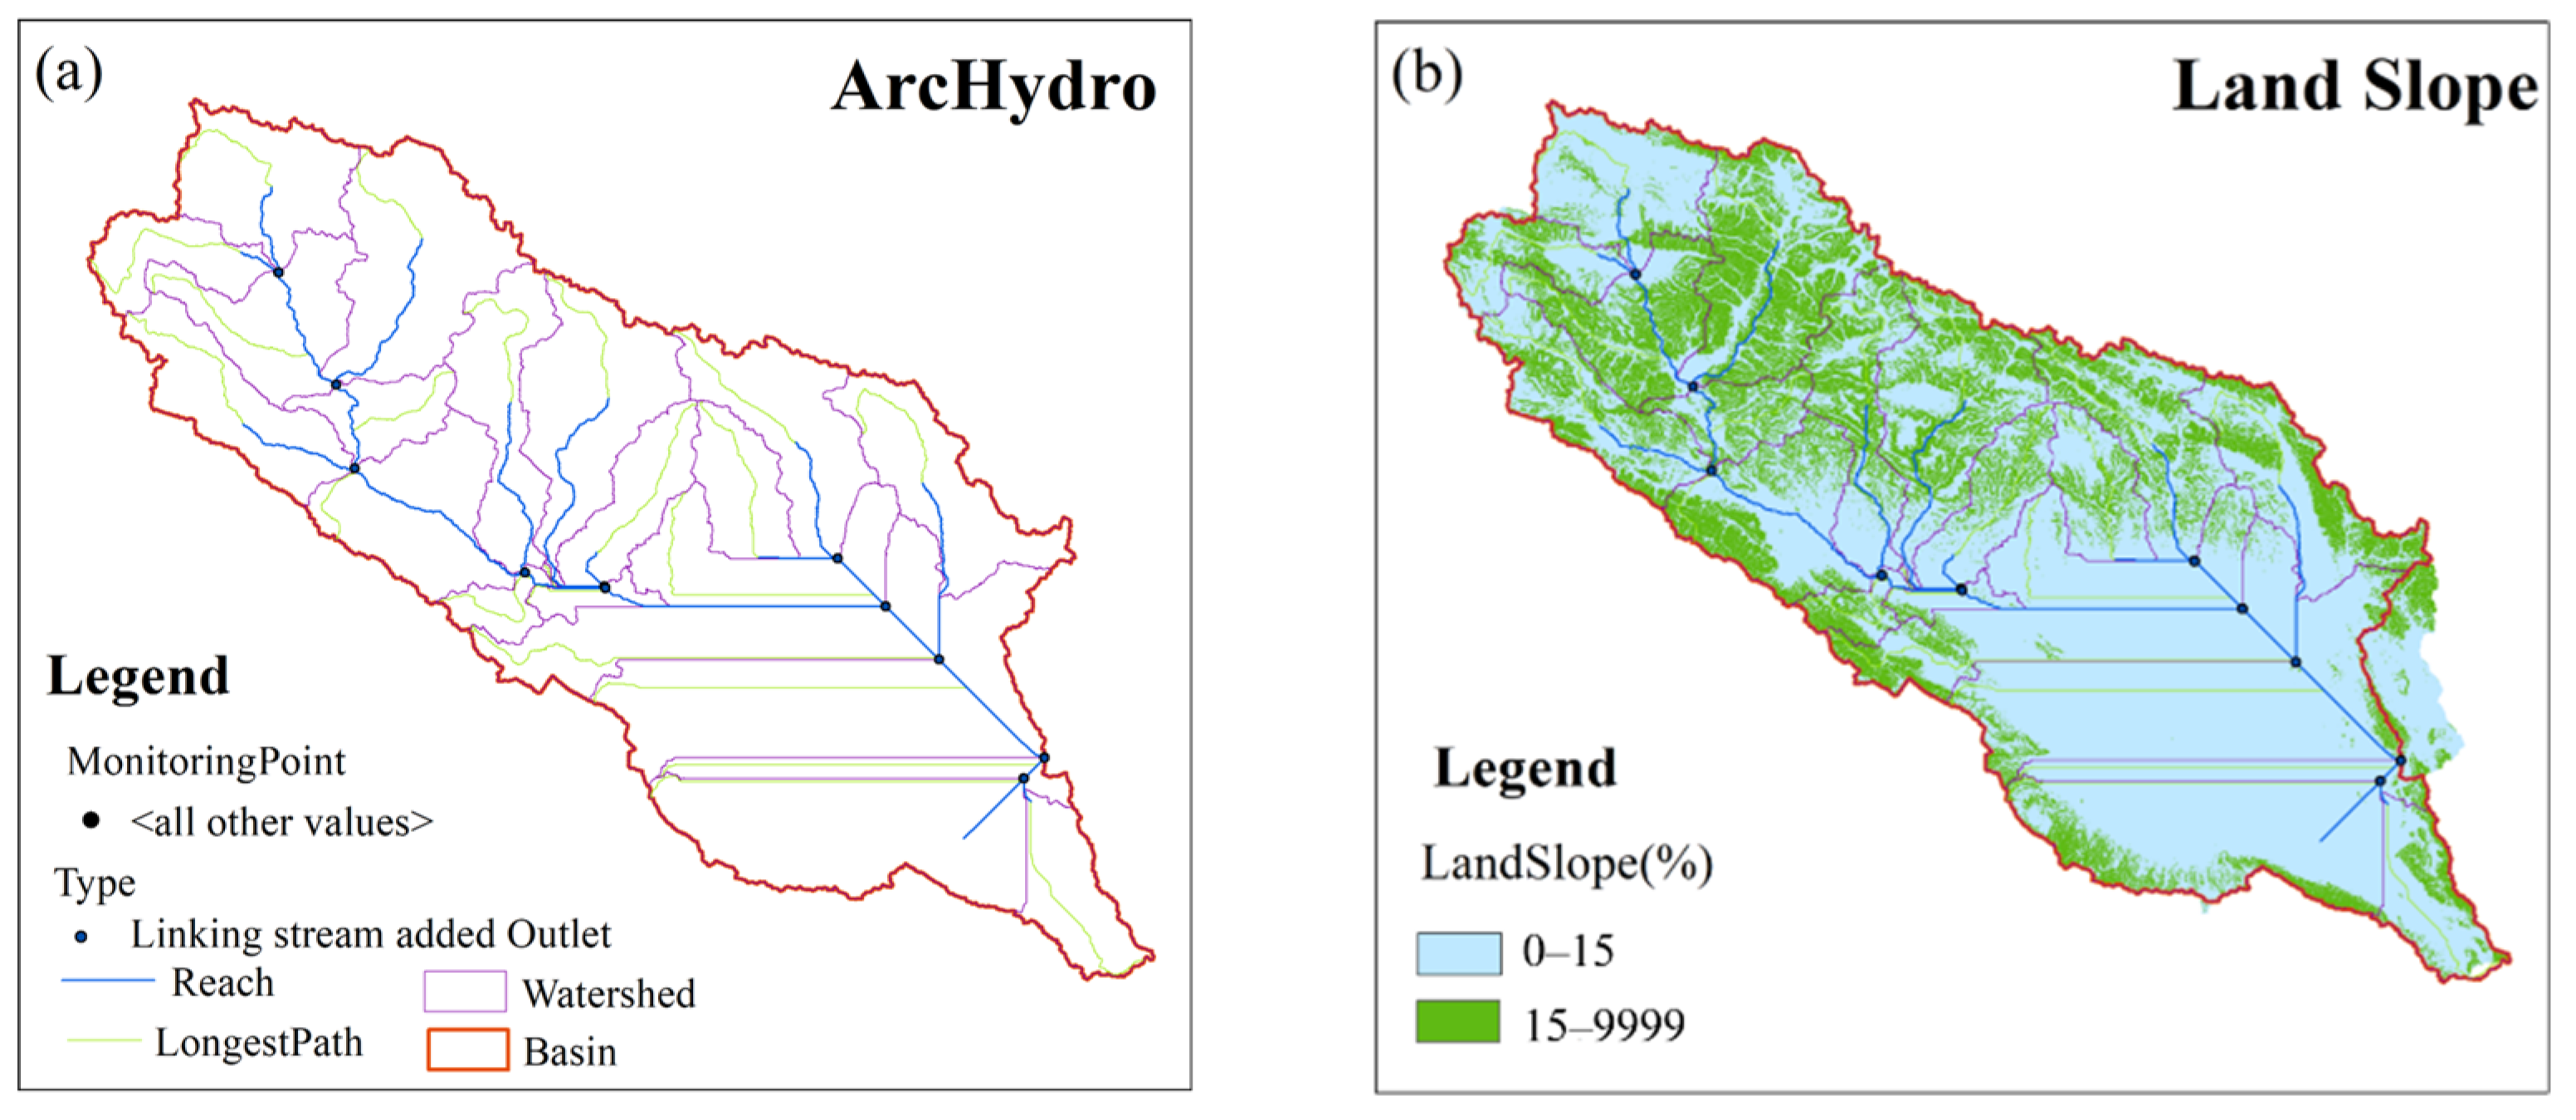
First, using the DEM, the Lake Qinghai Basin was delineated into subbasins. Within each subbasin, Hydrologic Response Units (HRUs) were then defined based on unique combinations of land use, soil type, and slope. To improve computational efficiency and simplify the model, a thresholding method was applied. The minimum area thresholds for land use, soil type, and slope were set to 20%, 15%, and 10%, respectively. Any land use, soil, or slope class covering an area smaller than its respective threshold within a subbasin was eliminated. The areas of these eliminated classes were then reapportioned among the remaining classes to ensure that 100% of the subbasin area was simulated. This process resulted in the division of the 290,681 km2 watershed into 25 subbasins and 176 HRUs. The total runoff for the basin was then calculated by aggregating the simulated runoff from each individual HRU (Figure 4).

2.4. Data Sources and Collection

The SWAT model requires specific information such as a digital elevation model (DEM), weather, soil properties and land use type. DEM data were downloaded from the USGS (https://www.usgs.gov, accessed on 16 May 2022) and Geospatial Data Cloud (http://www.gscloud.cn, accessed on 11 April 2021) with a spatial resolution of 30 m. Some of the land use data were obtained from the national land use and land cover dataset of the Resource and Environment Science Data Center of the Chinese Academy of Sciences (http://www.resdc.cn/, accessed on 3 June 2022) with a spatial resolution of 30 m and a time of 1980 to 2020. The Soil map of the study area from the Soil database was accessed through the China Soil Database (http://vdb3.soil.csdb.cn/extend/jsp/introduction, accessed on 20 October 2020) and downloaded from Cold and Arid Regions Science Data Center (http://westdc.westgis.ac.cn/, accessed on 21 March 2020). The meteorological dataset was obtained from the China Meteorological Center (http://data.cma.cn, accessed on 16 September 2021), which includes daily minimum temperature, maximum temperature, precipitation, and evaporation data from 10 monitoring stations from 1956 to 2021, with a total of 65 a. Additionally, runoff data (1956–2020) measured by the Buha River and Gangcha hydrological stations were collected, and the data were obtained from the Qinghai Provincial Hydrological Station (http://slt.qinghai.gov.cn/, accessed on 25 September 2022). These methods were used mainly to analyze the changes in surface runoff and to calibrate and validate the SWAT model. Future meteorological data to analyze the spatial and temporal variations of surface air temperature and precipitation in the Lake Qinghai Basin under different climate scenarios modeled (SSP 1-2.6, SSP 2-4.5, SSP 3-7.0, and SSP 5-8.5) are referenced to the official website of CMIP 6 (https://pcmdi.llnl.gov/CMIP6/, accessed on 22 July 2022).

3. Results

3.1. Calibration and Verification of the Simulations

3.1.1. Simulation Calibration and Verification

Sensitivity analysis of SWAT model parameters improves model calibration efficiency and reduces model uncertainty by adjusting the initial values or the range of values of model parameters to ensure that the simulated values of the model are near the measured values [33]. In this work, the sensitivity of model parameters was compared using both global and one-at-a-time analysis techniques to identify the most critical parameters within the Lake Qinghai watershed. The SUFI-2 algorithm in SWAT–CUP was employed for parameter sensitivity analysis and calibration. The degree to which parameter uncertainty accounts for total model uncertainty was quantified by the P-factor, representing the 95% prediction uncertainty (95PPU). For the simulation, the model was run on a monthly scale from 1962 to 2017, using in situ runoff data from the Buha River and Gangcha hydrological stations. The files Part_inf, File, and SUFI-2 swEdit were subsequently edited separately, and 21 parameters related to runoff were selected for rate determination (CN2, ESCO, EPCO, CNCOEF, SOL_ZMX, ALPHA_BF, GW_DELAY, GWQMN, GW_REVAP, RCHRG_DP, EVLAI, CH_N(2), CH_K(2), SURLAG, SLSUBBSN, SFTMP, SMTMP, SMFMX, SOL_AWC, SMFMN, and TIMP) to set their parameter ranges (Table 1). The results of the parameter sensitivity analysis reveal that for the Lake Qinghai Basin, the parameters GW_DELAY, CH_N2, EPCO, GWQMN, REVAPMN, GW_REVAP, and SLSUBBSN are somewhat sensitive to runoff. Among them, GW_DELAY is the groundwater delay time, which controls the time and size of groundwater discharge into runoff and is the most sensitive to runoff in the Lake Qinghai Basin (Figure 5). Second, the sensitivity analyses revealed that streamflow was sensitive to Manning’s roughness coefficient for the main channel (CH_N2). The main purpose of CH_N2 is to adjust the water balance of the watershed and achieve a refined validation of the monthly runoff data by correcting the runoff curve for peaks and valleys and for runoff during dry periods. The plant water uptake compensation factor (EPCO), which appropriately reflects the plant uptake scenarios under different climatic conditions in the Lake Qinghai Basin, was thus sensitive to runoff. GWQMN is the threshold water depth of the shallow aquifer, and runoff is always highly correlated with this parameter.
After the range of model parameters is determined, to minimize the error between the simulated and measured values, multiple rate determinations are needed so that the simulation results are like the measured values. At each calibration step, a coarse calibration was determined using annual data, and then a further calibration was determined using monthly data. We executed 100–500 iterations of the simulation using the parameters until the simulation results were satisfactory. Finally, the predictions of the model were considered “good” when the relative error between the measured and simulated values was within ±20%, Ens ≥ 0.6, R2 ≥ 0.7, PBILAS ≤ ±25% and RSR ≤ 0.7 [23,37]. The sensitive parameters adjusted by the SWAT model and the final adjustment results are presented in Table 1.

3.1.2. Runoff Calibration and Validation

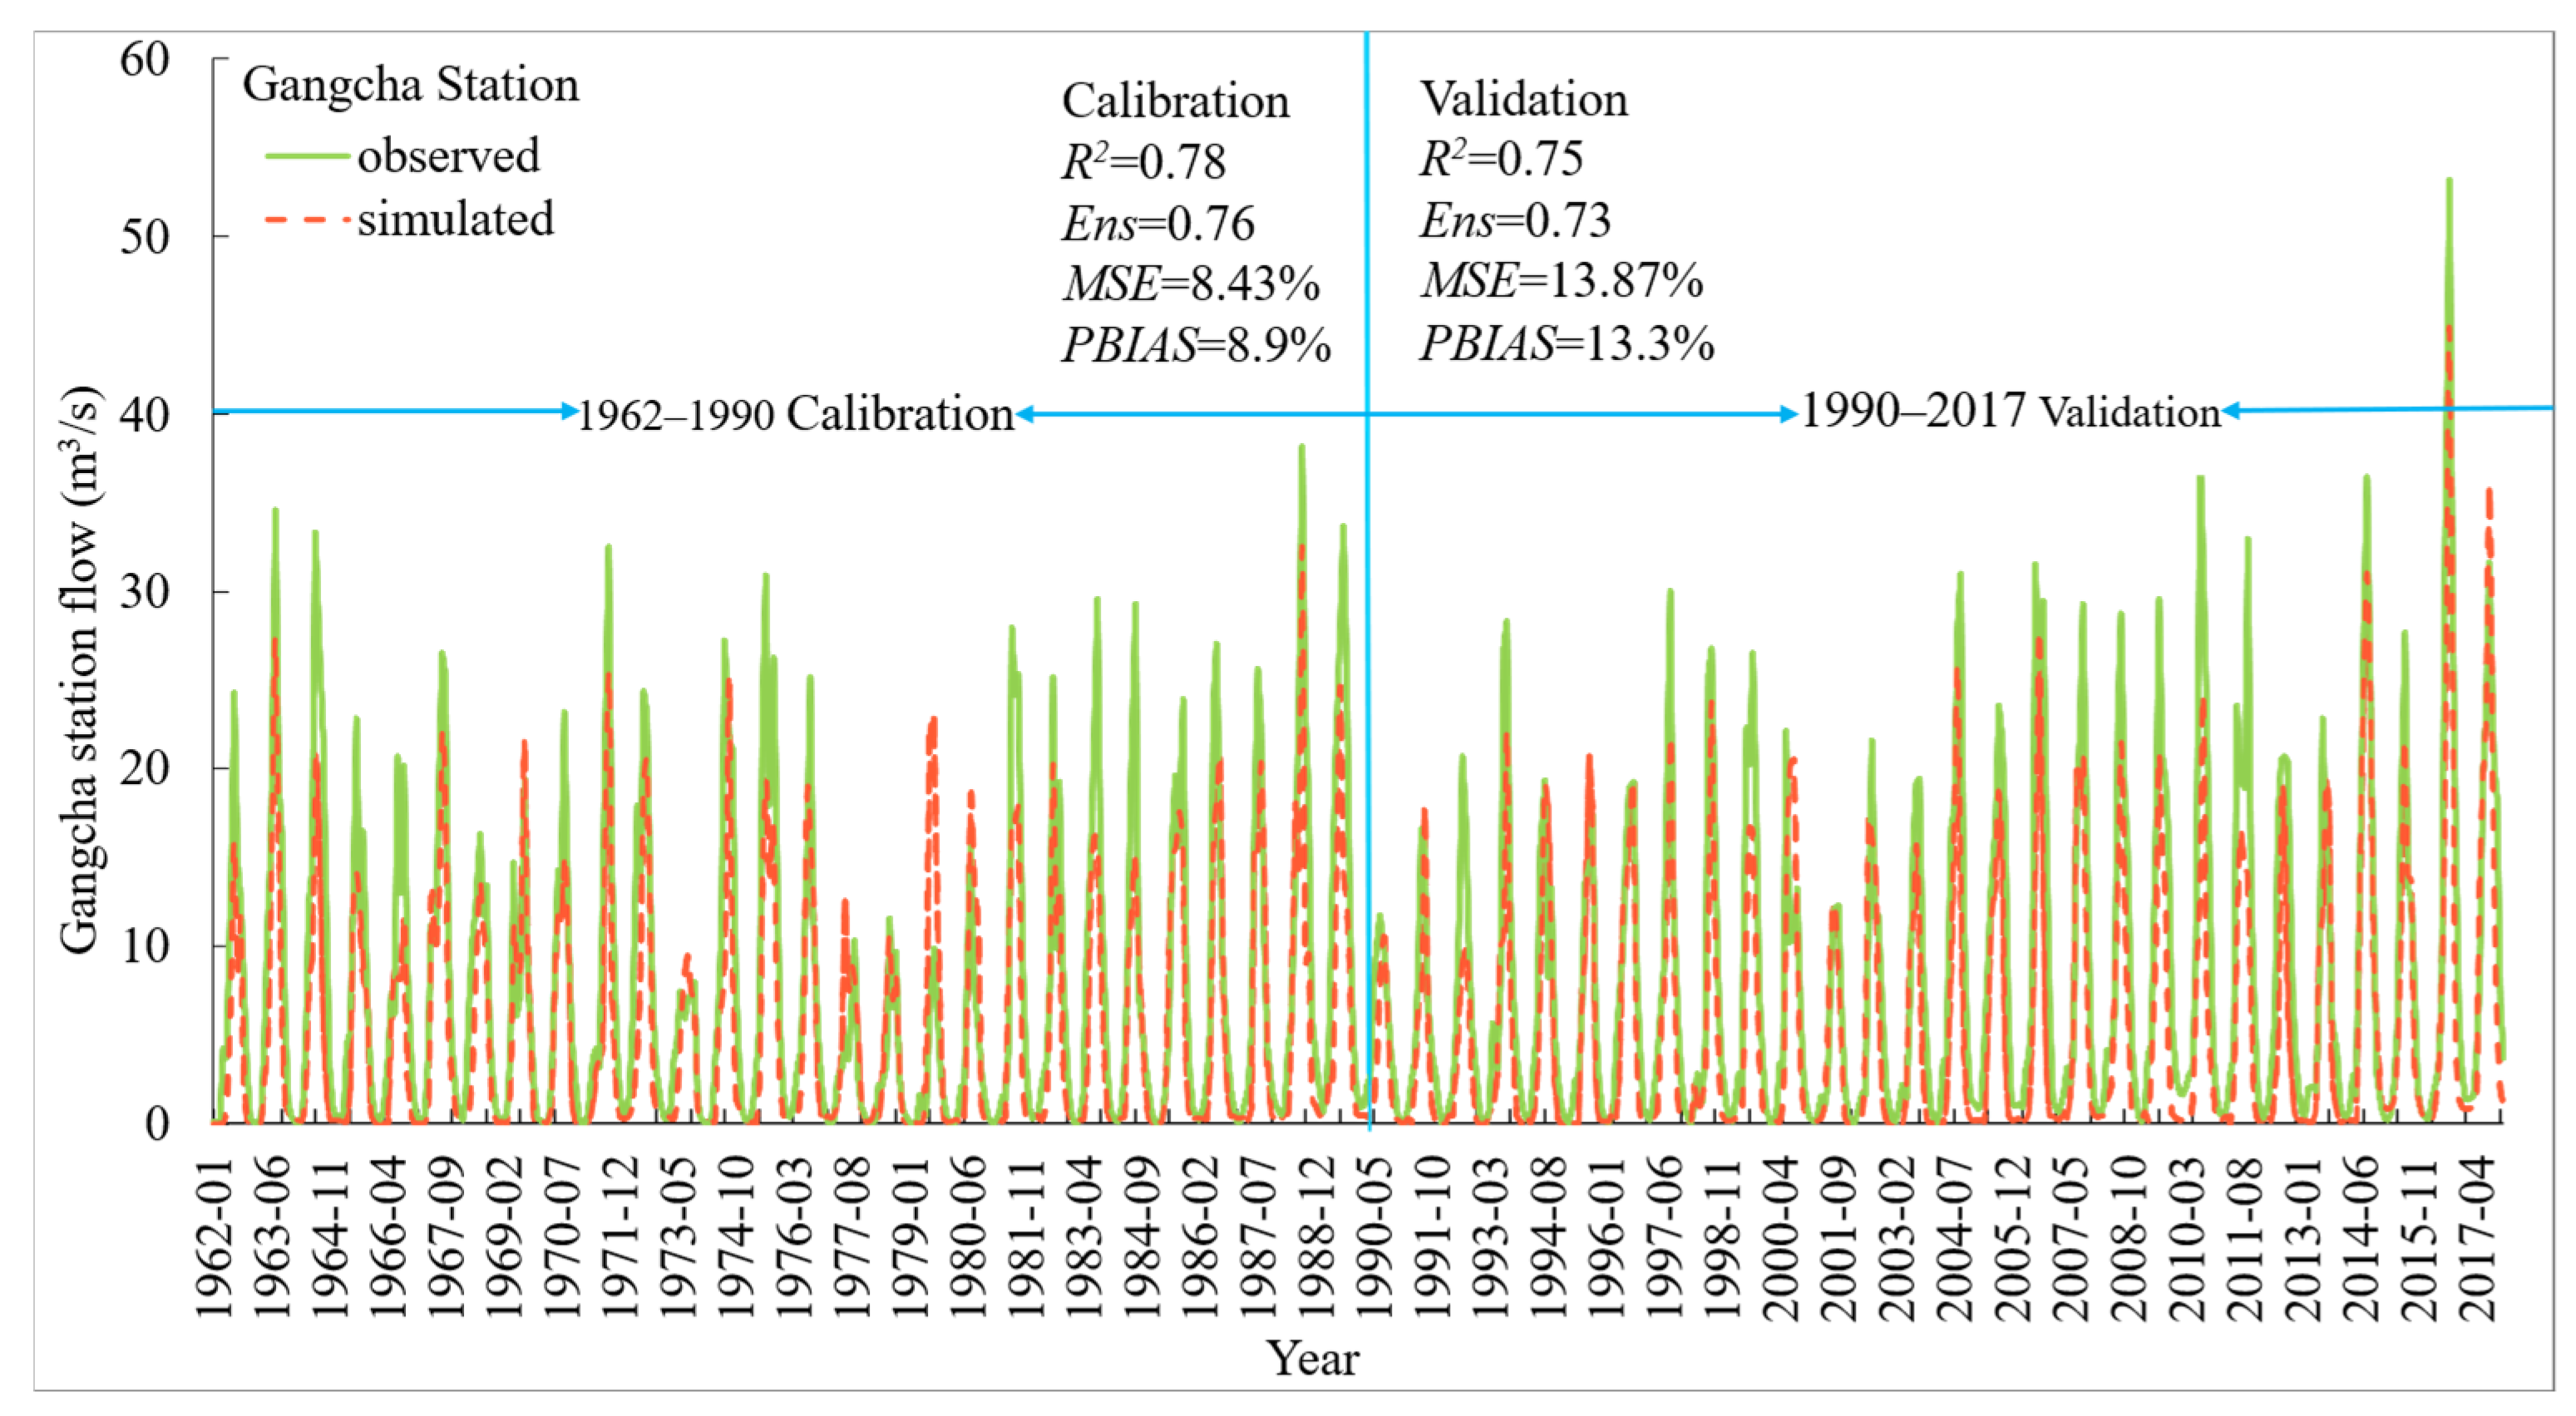
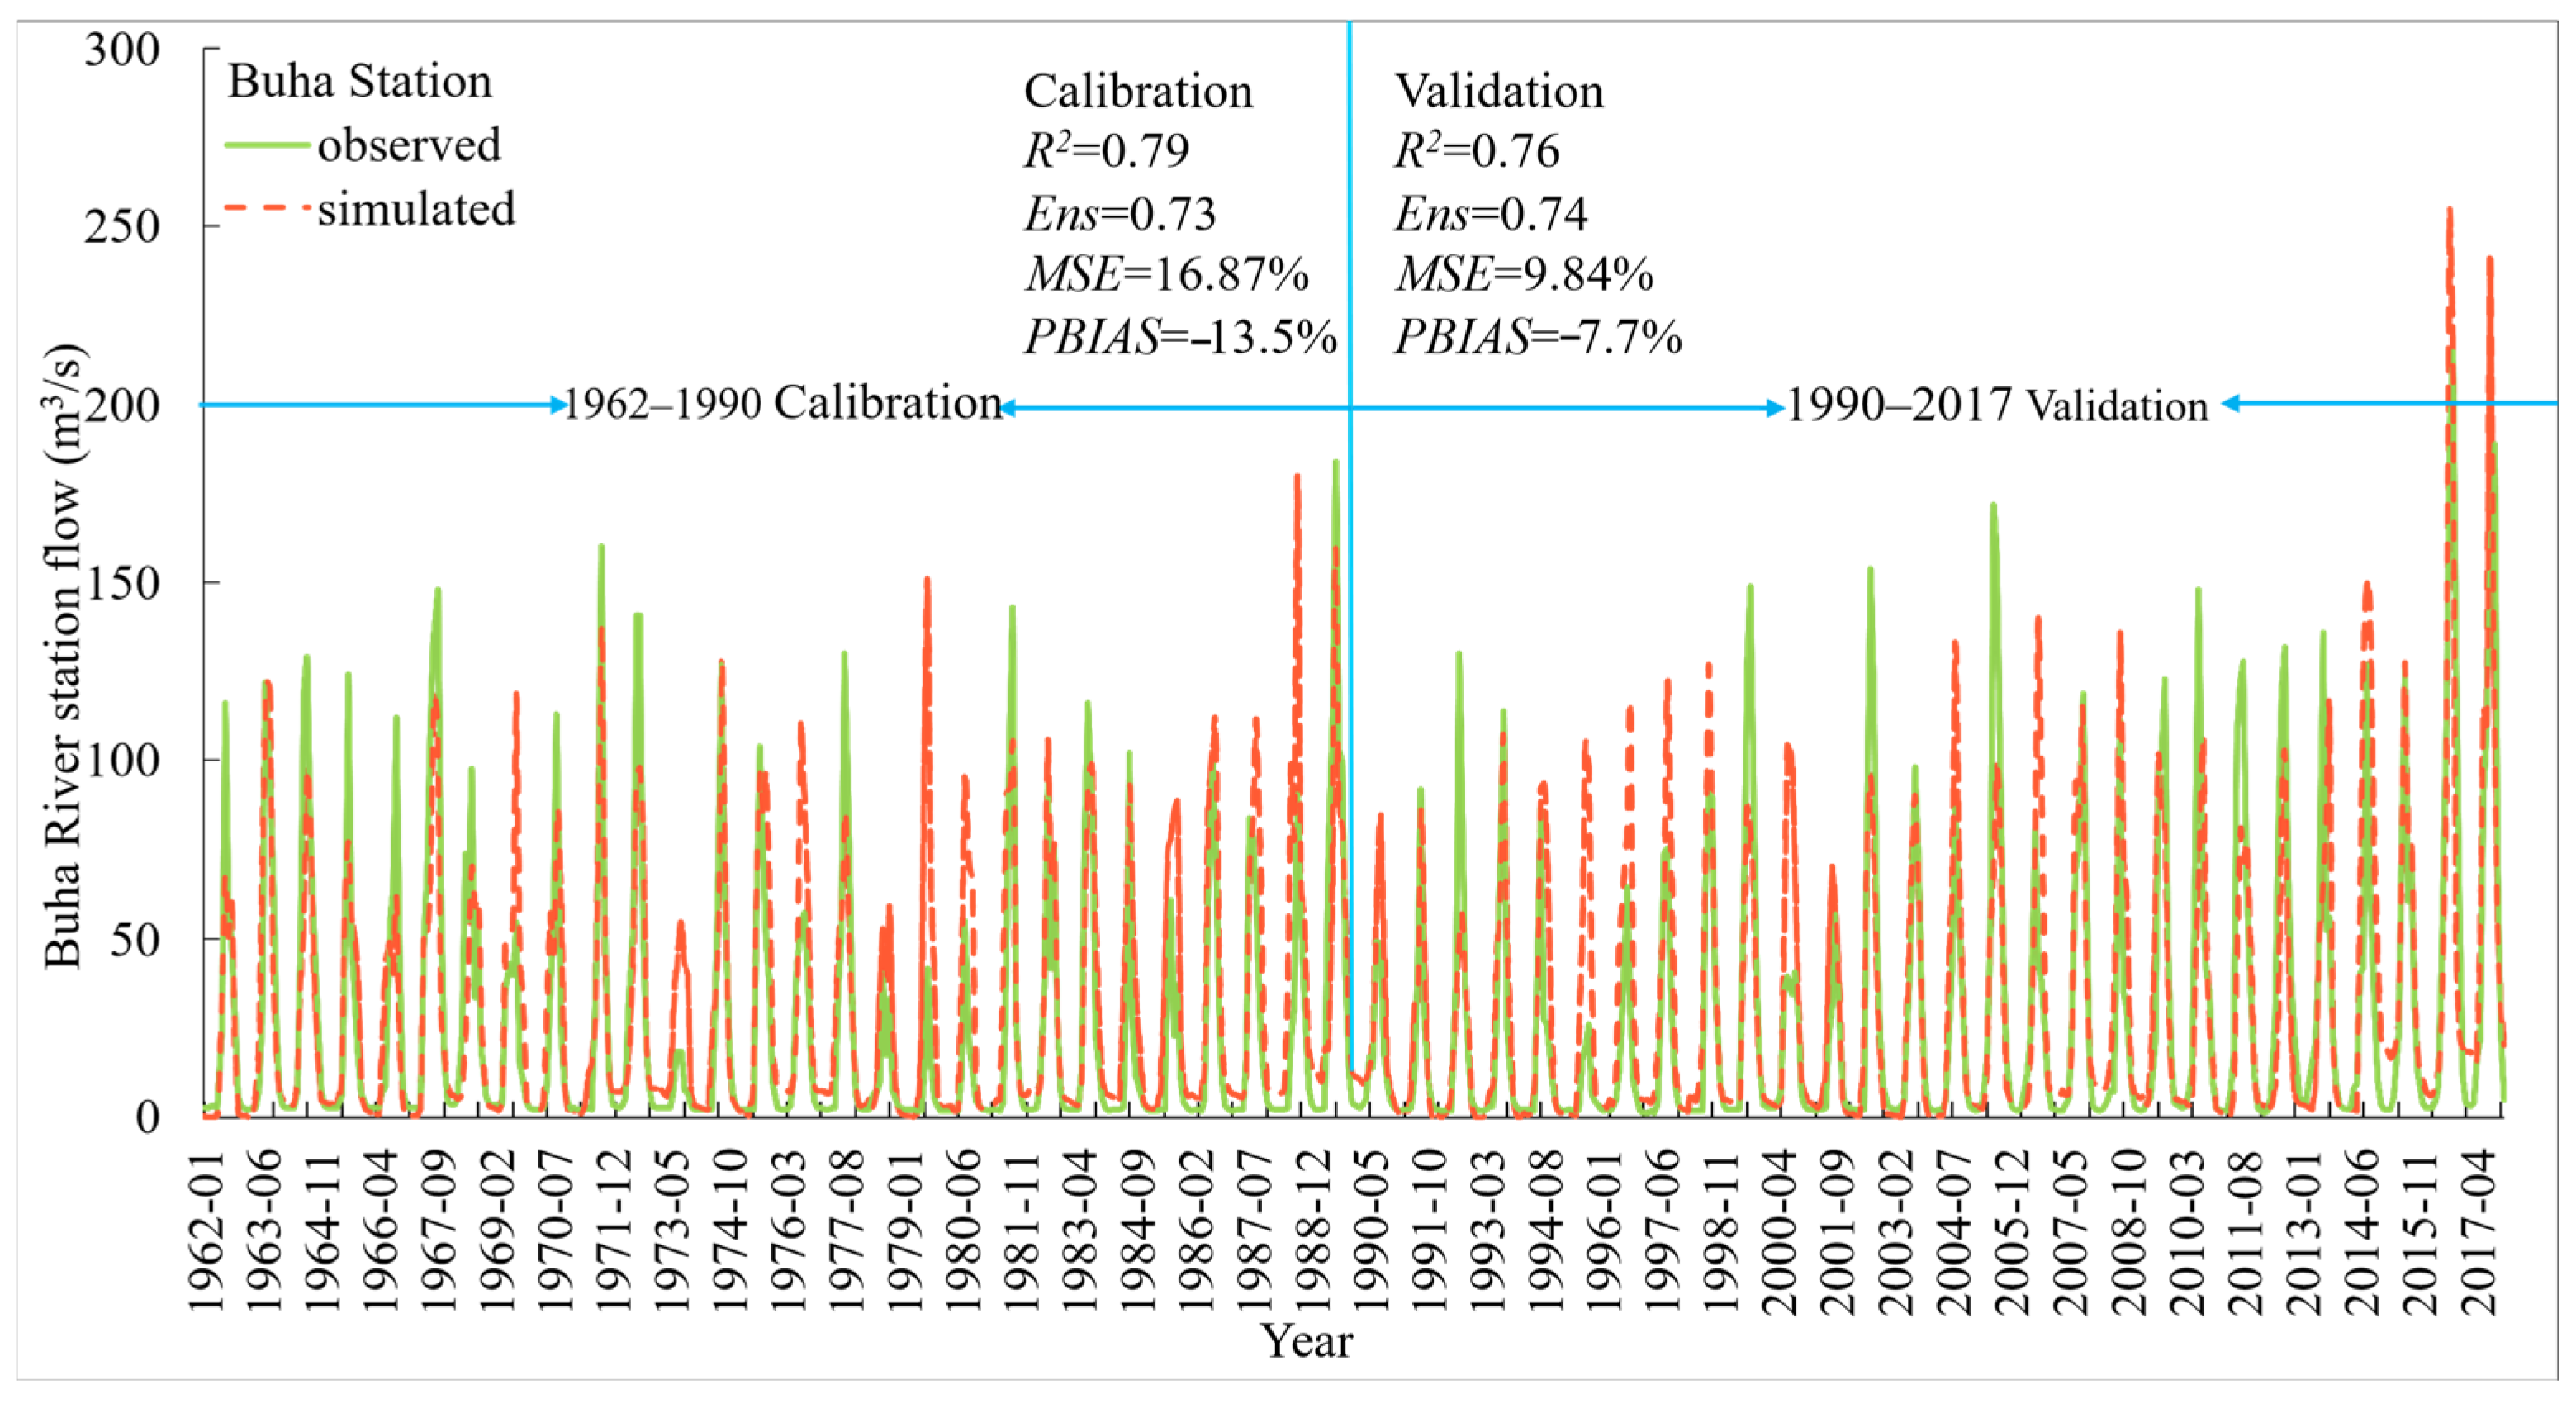
When the model structure and input parameters are preliminarily determined, the model needs to be calibrated and validated. In the runoff simulation process, 1960–1961 was used as the model warm-up period, 1962–1990 as the model calibration period, and 1991–2017 was used as the model validation period (Figure 6 and Figure 7). Both the measured and simulated runoff values at the Buha River and Gangcha hydrological stations agreed well during the rate and validation periods. This indicated that the SWAT model operated relatively stable and could simulate the hydrological processes of the basin more realistically. The simulation results of the Gangcha hydrological station revealed good simulation performance during both the rate and validation periods. The R2 value of Gangcha runoff was 0.78, the Ens value was 0.76 in the rate period, the R2 value was 0.75, and the Ens value was 0.73 in the validation period. The simulation results for the Buha station showed “good” performance, with an R2 value of 0.79 and an Ens of 0.76 in the rate period and an R2 value of 0.76 and an Ens of 0.74 in the validation period. It is evident that SWAT simulated runoff is more accurate, and the simulation of the Buha River Basin is slightly better. For the initial simulated values and slopes based on general land use, soil and slope data, the measured values were closer to the simulated values, and the regression slope was greater than 0.7. This finding indicates that the model was able to capture the runoff well.

3.2. Changes in Future Climate Scenarios

3.2.1. Changes in Surface Air Temperature and Precipitation

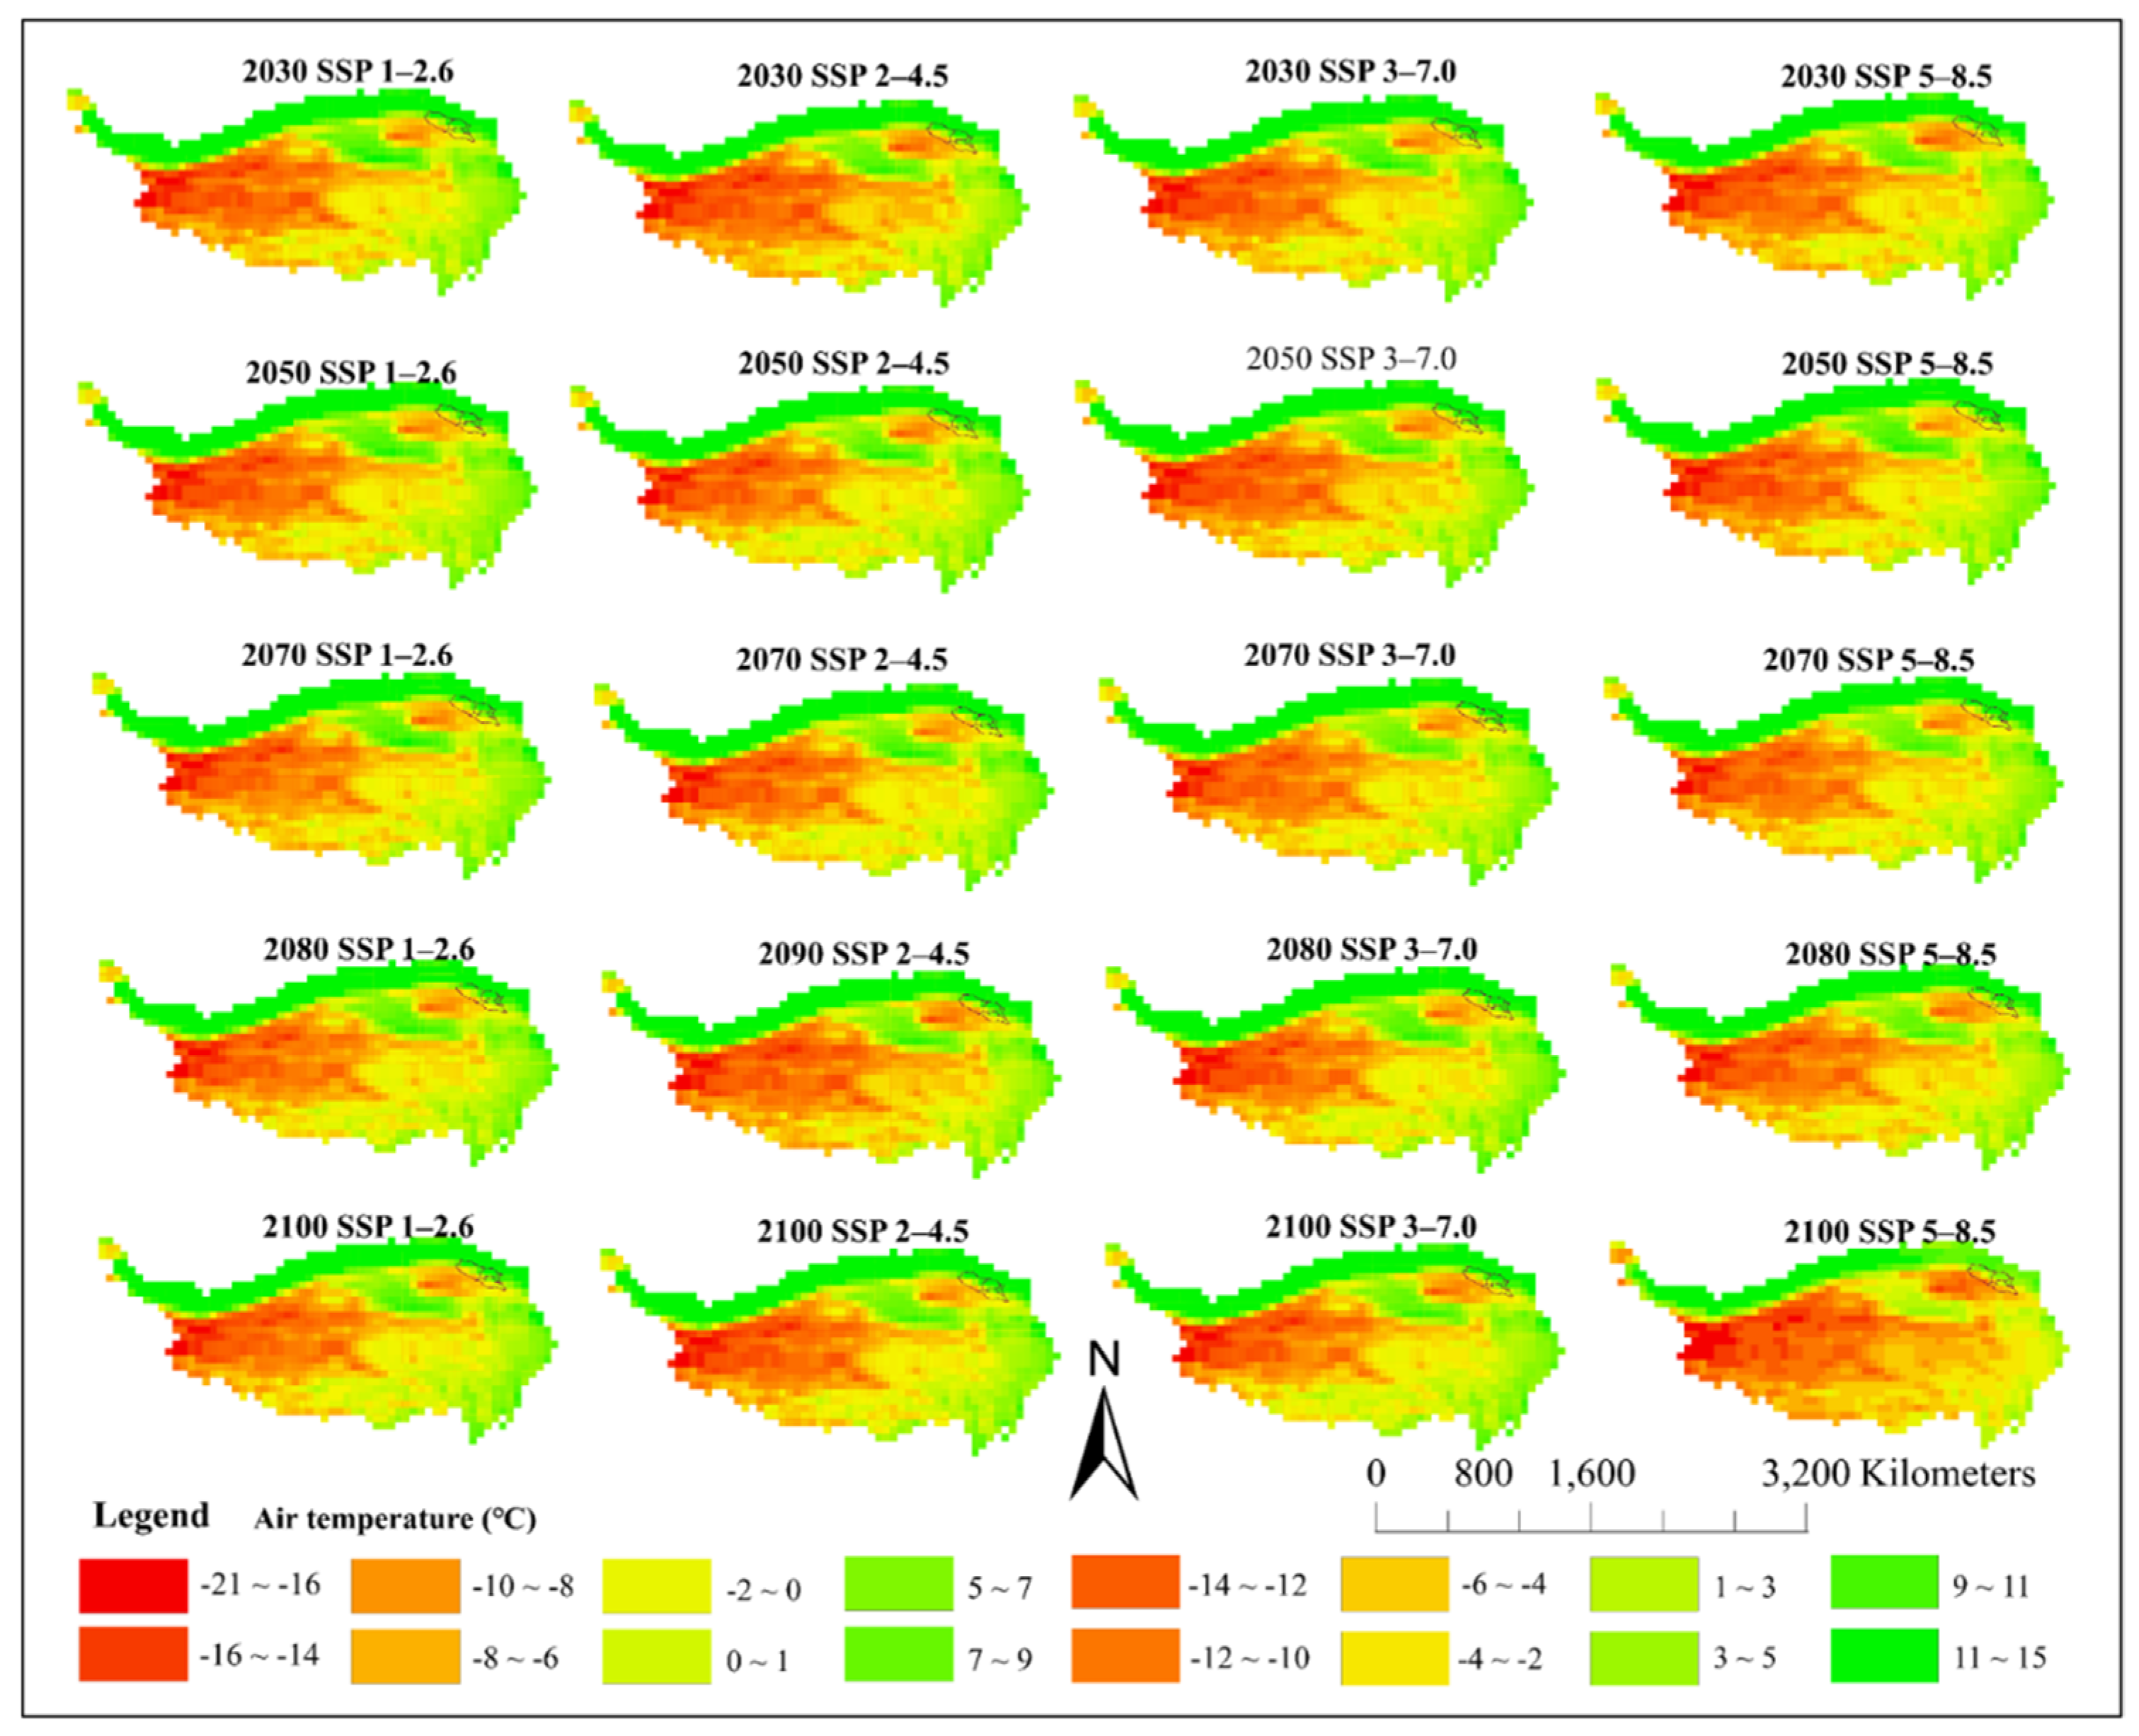
This study utilizes data from the CMIP6 climate models and employs a multi-model ensemble approach, integrating historical simulations (Historical) with four Shared Socioeconomic Pathways (SSPs) and Representative Concentration Pathways (RCPs) scenarios (SSP 1–2.6, SS P2–4.5, SSP 3–7.0, and SSP 5–8.5) [38]. It analyzes the spatiotemporal distribution characteristics of surface air temperature and precipitation in the Lake Qinghai Basin from 2030 to 2100. For the Lake Qinghai Basin, surface air temperature generally shows an increasing trend under all four future scenarios. Under the SSP 1–2.6 scenario, surface temperature exhibits a fluctuating but overall upward trend, with an increase rate of 0.026 °C per decade (Figure 8). Under SSP 2–4.5, the temperature shows a more pronounced rising trend with an increase of 0.278 °C per decade. In the SSP 3–7.0 scenario, temperature increases linearly at a rate of 0.572 °C per decade, although the rate of warming slows after 2090. The SSP 5–8.5 scenario shows the most significant warming trend, with an increase rate of 1.024 °C per decade. These results indicate that the greatest warming occurs under SSP 5–8.5, followed by SSP 3–7.0, SSP 2–4.5, and the least under SSP 1–2.6, i.e., SSP 5–8.5 > SSP 3–7.0 > SSP 2–4.5 > SSP 1–2.6.
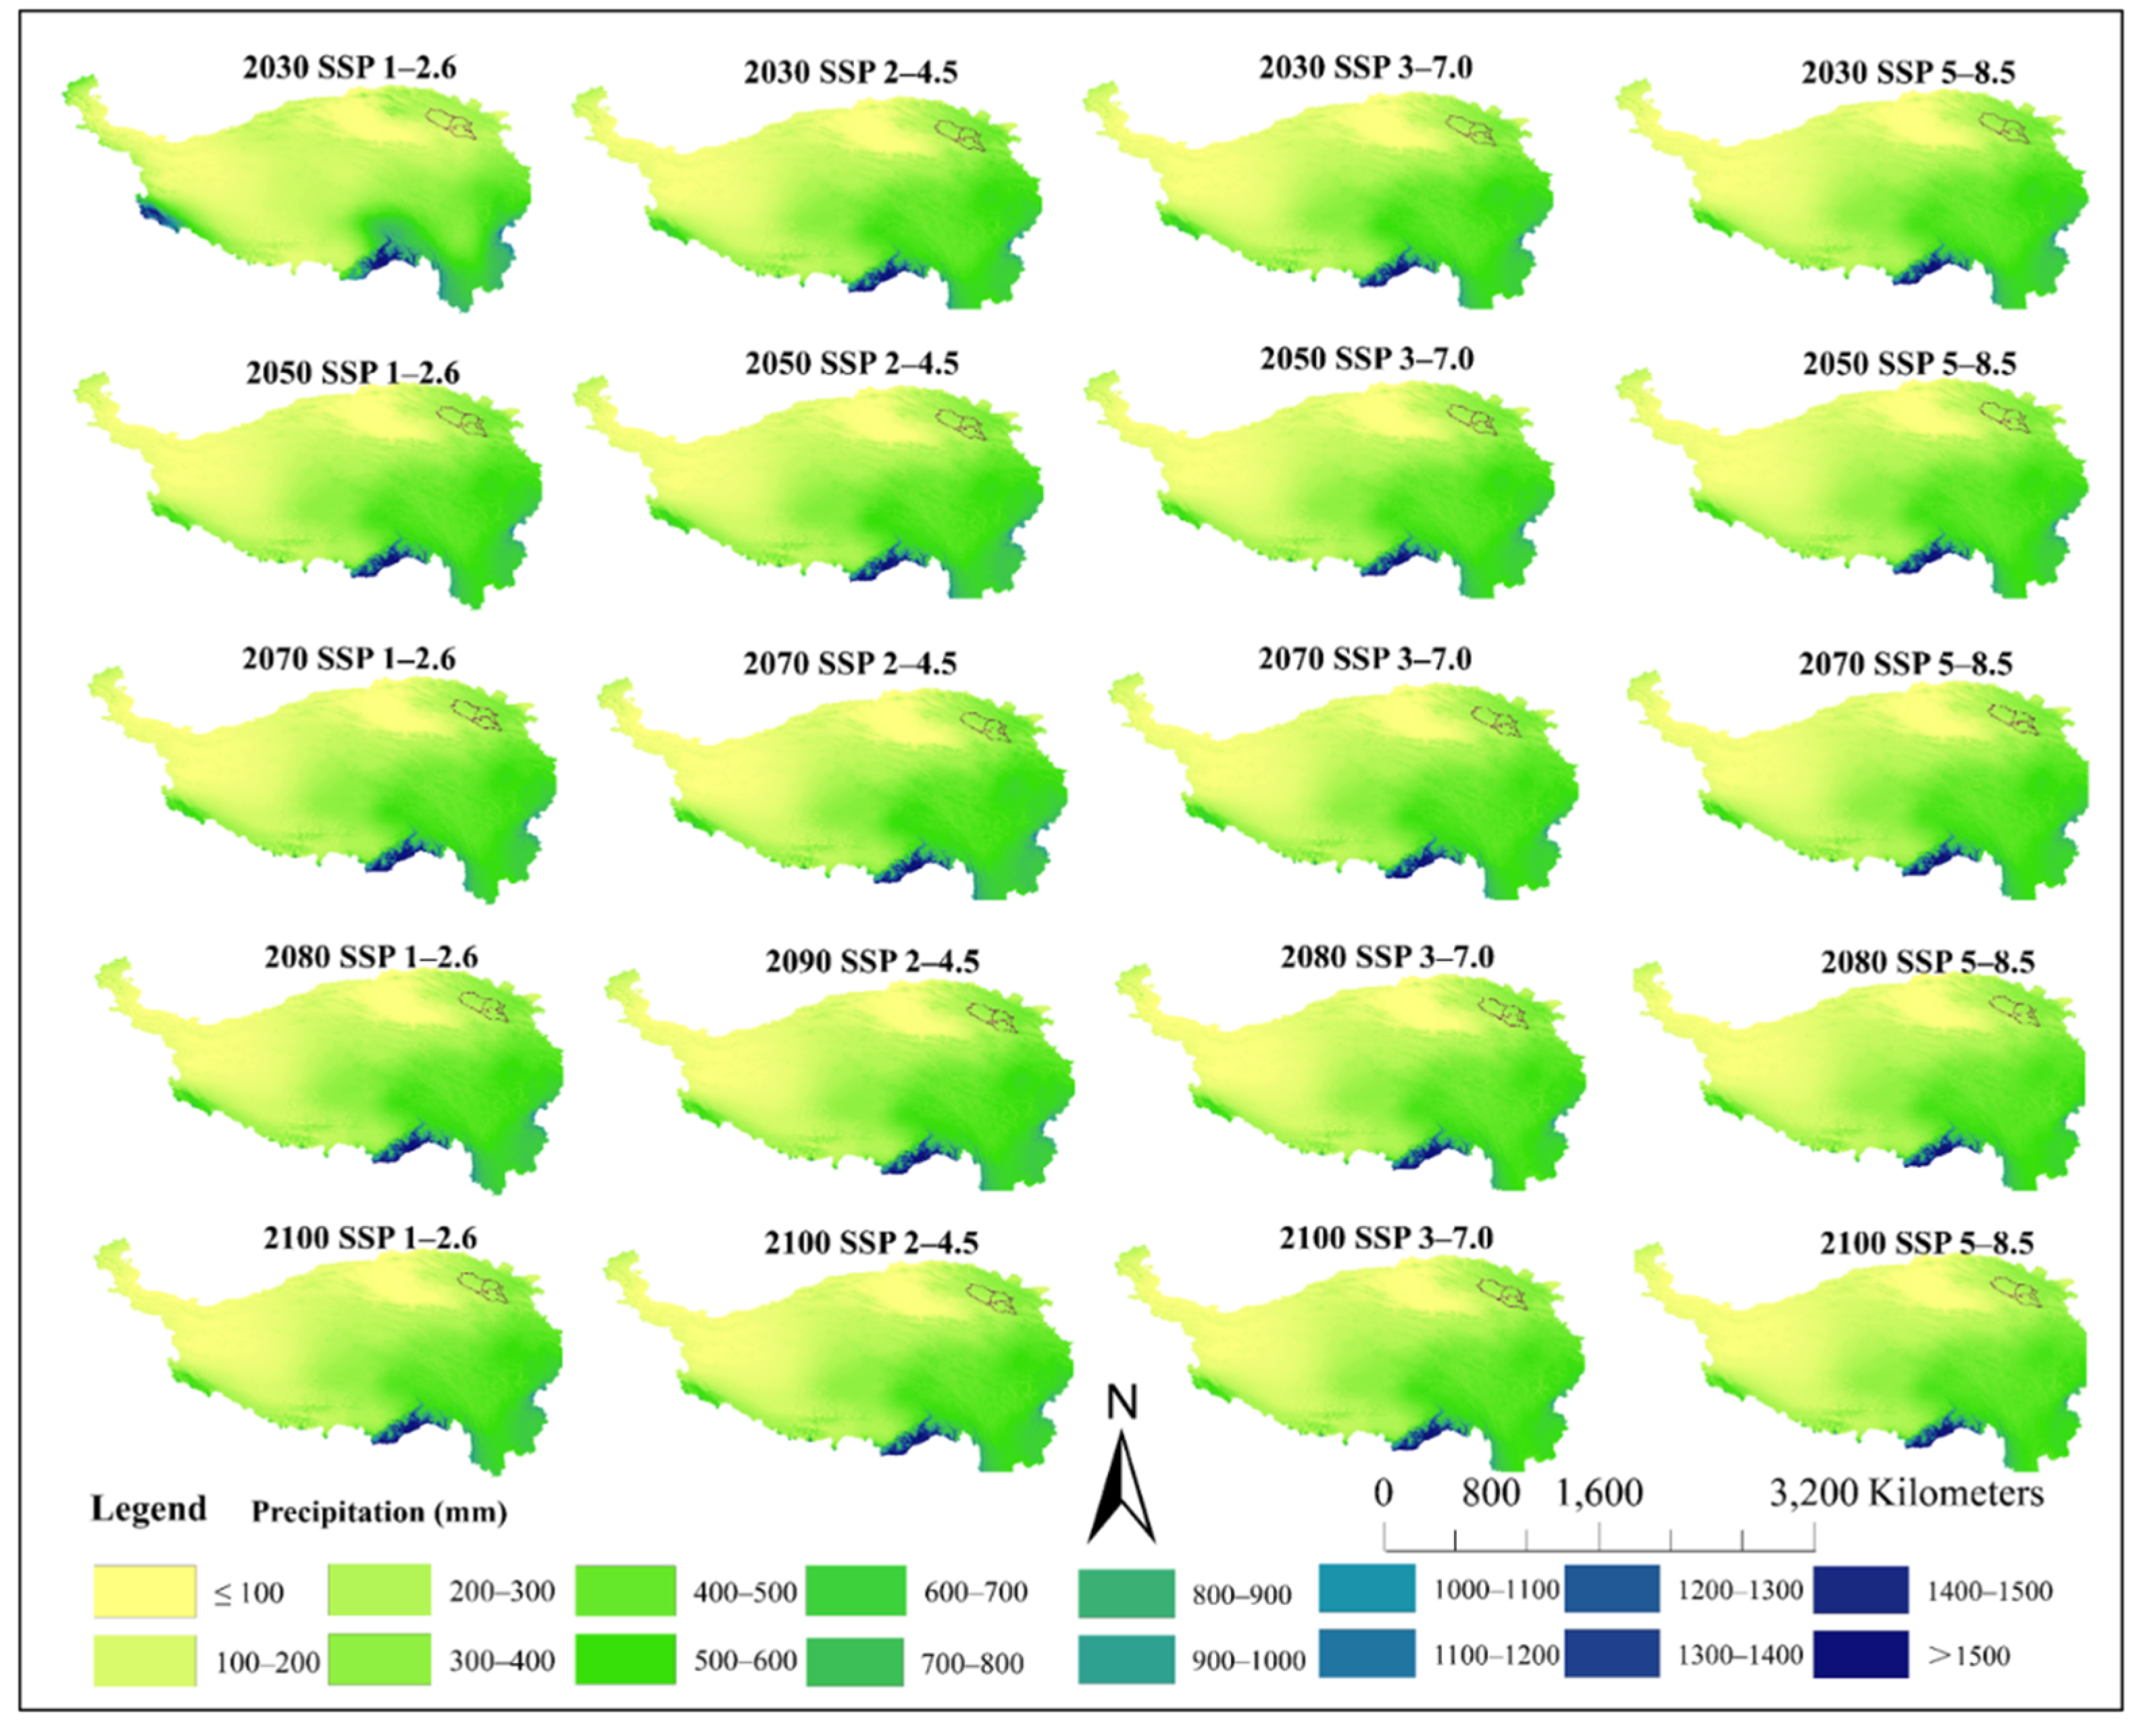
Precipitation in the Lake Qinghai Basin also shows an increasing trend from 2030 to 2100 under all four scenarios (Figure 9). The decadal increases in precipitation are 7.9 mm (SSP 1–2.6), 2.02 mm (SSP 2–4.5), 9.55 mm (SSP 3–7.0), and 6.27 mm (SSP 5–8.5). Correspondingly, the annual mean precipitation increases by 14.4%, 18.9%, and 11.1% under SSP 1–2.6, SSP 3–7.0, and SSP 5–8.5, respectively, while the increase is minimal under SSP 2–4.5 at just 0.03%. These trends suggest that the most significant increase in precipitation occurs under SSP 3–7.0, followed by SSP 1–2.6, SSP 5–8.5, and lastly SSP 2–4.5, i.e., SSP 3–7.0 > SSP 1–2.6 > SSP 5–8.5 > SSP 2–4.5. Spatially, precipitation increases from the northwest to the southeast of the Lake Qinghai Basin, with the southeastern region receiving more precipitation than the northwestern areas. Notably, the northeastern and southeastern regions of the basin experience higher levels of precipitation, whereas the western region remains relatively dry.

3.2.2. Changes in Extreme Temperatures and Precipitation

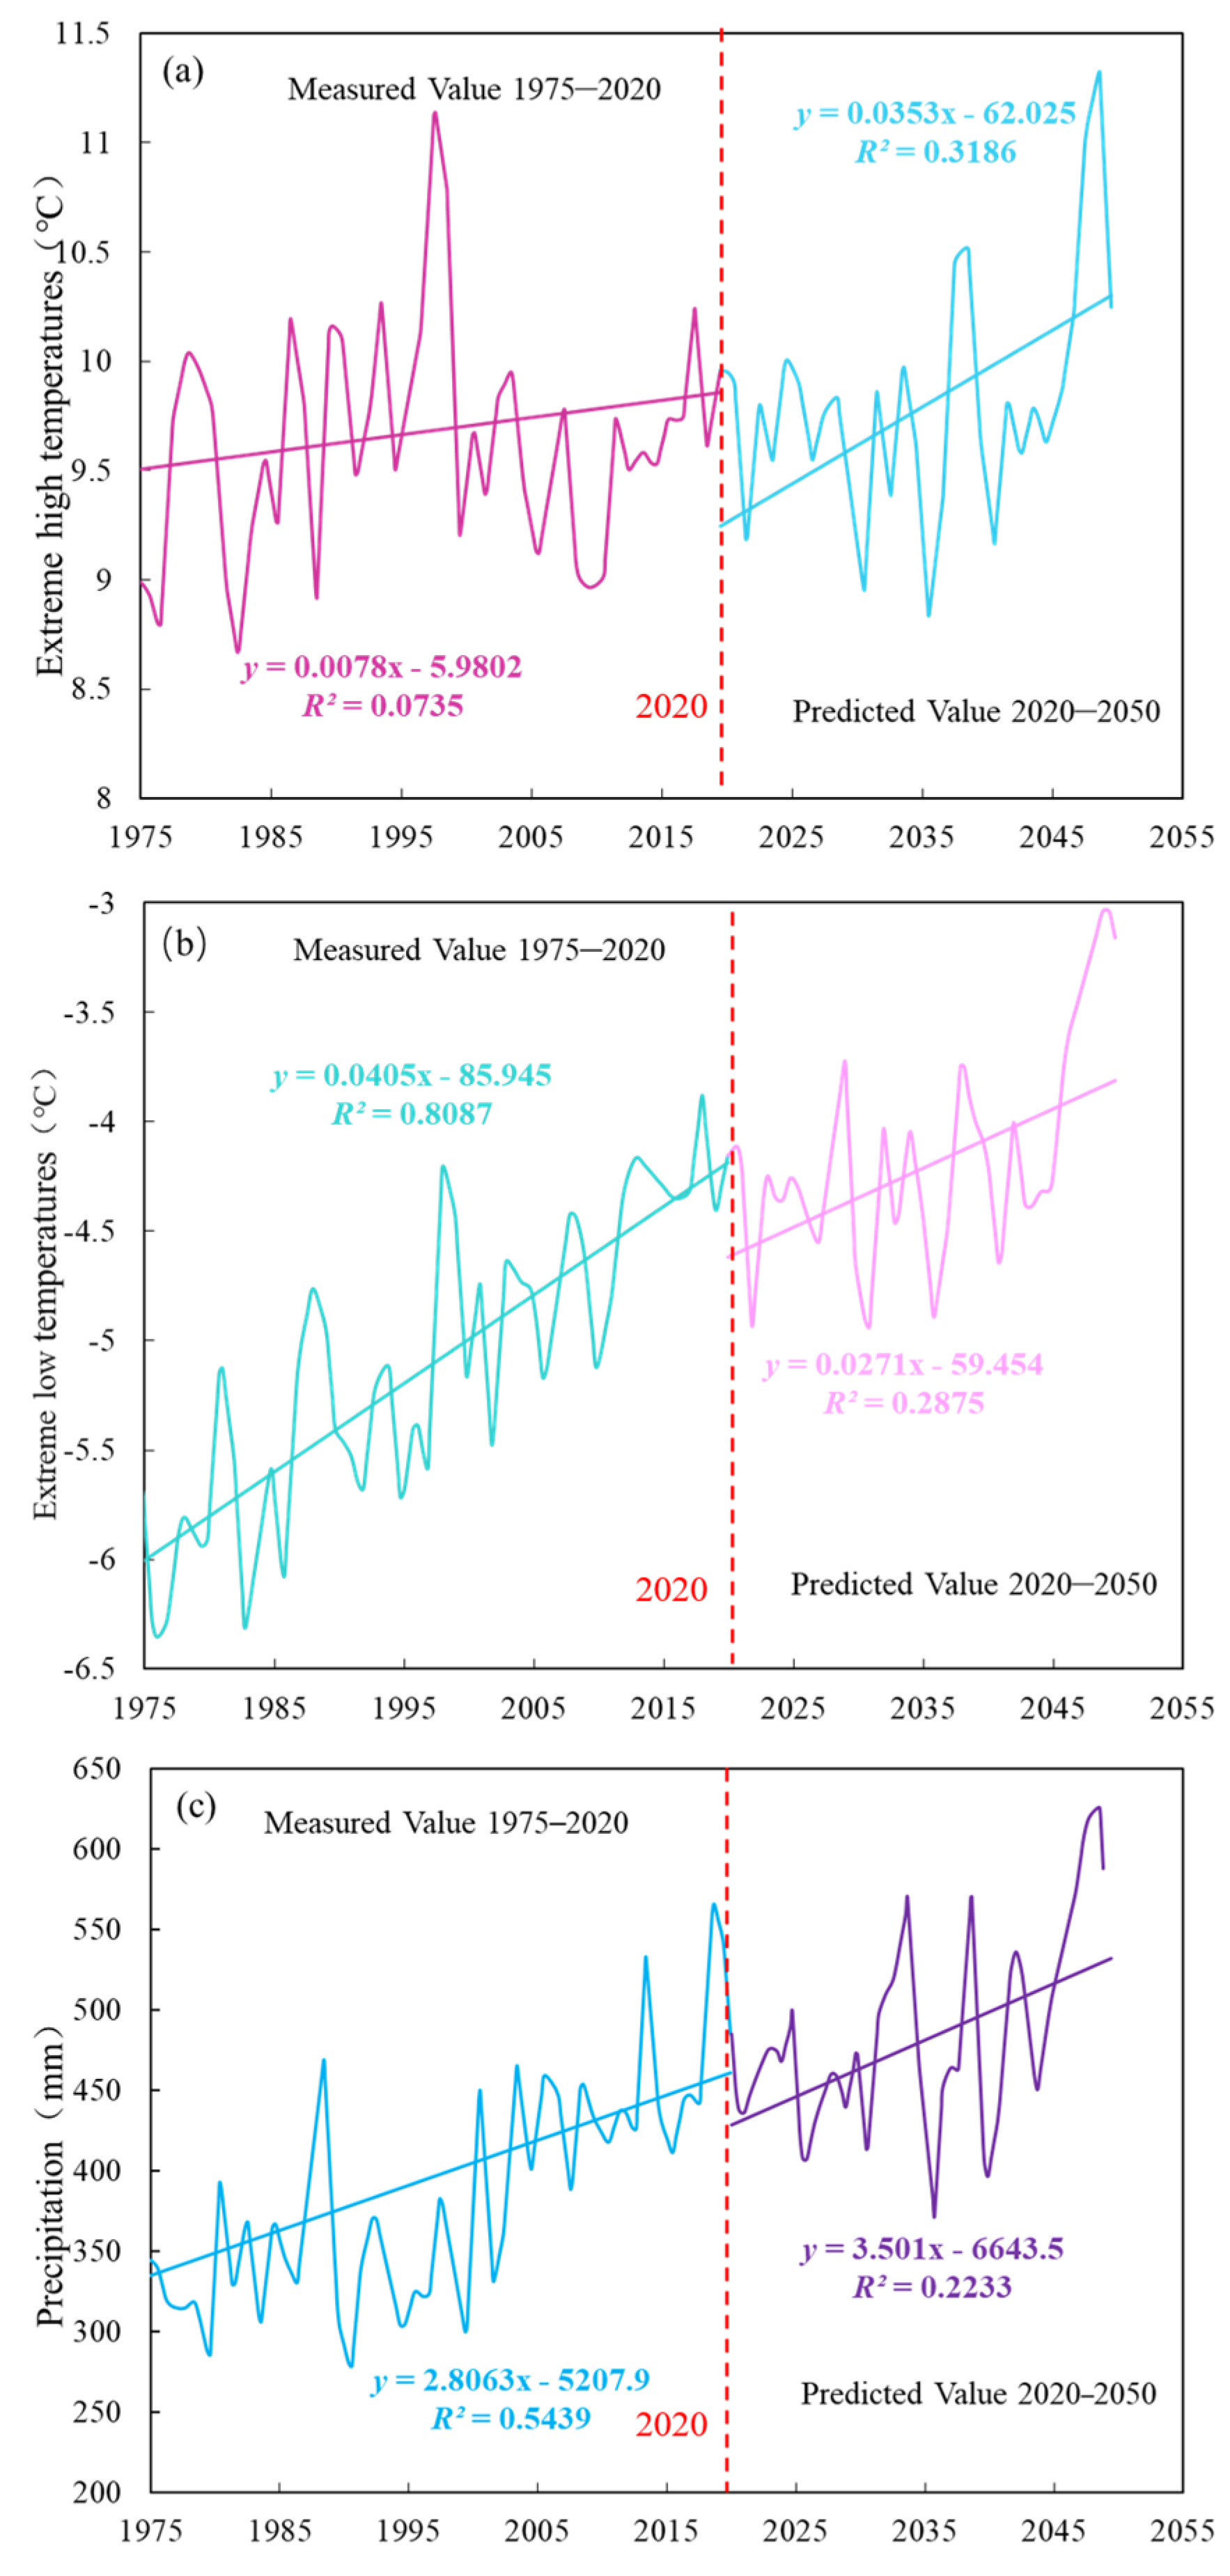
This study integrates daily maximum and minimum temperature and precipitation data from meteorological stations across the Lake Qinghai Basin for the period 1975–2019. A statistical downscaling framework was employed, combining Principal Component Analysis (PCA) and optimal regression techniques to develop regression equations linking extreme temperature events (extreme high and low temperatures), precipitation, and large-scale predictor variables. These relationships were used to project trends in extreme temperatures and precipitation from 2020 to 2050. From 2020 to 2050, extreme high temperatures in the Lake Qinghai Basin are projected to rise from 8.57 °C to 9.95 °C, a total increase of 1.38 °C, corresponding to a warming rate of 0.46 °C per decade (Figure 10a). Compared to the historical average extreme high temperature (1975–2019), the 2020–2050 mean is 0.2 °C higher. The highest extreme high temperature is projected for 2028 at 11.28 °C, while the lowest is expected in 2035 at 8.23 °C. Extreme low temperatures are also projected to increase steadily, from −4.11 °C in 2020 to −3.15 °C in 2050, a total rise of 0.96 °C over the 30-year period. Relative to the 1975–2019 historical average, the projected extreme high temperature for 2020–2050 is 1.19 °C higher (Figure 10b).
Precipitation in the Lake Qinghai Basin is projected to follow a fluctuating upward trend from 2020 to 2050, with an overall increase of approximately 38% (Figure 10c). Supporting studies corroborate this trend, projecting a nearly 40% increase in precipitation from 2030 to 2050 relative to 2030 levels [32].

3.2.3. Changes in Runoff in the Buha River Basin over the Next 30 Years

By inputting extreme temperature and precipitation data from meteorological stations across the Lake Qinghai Basin into the SWAT hydrological model, the future runoff trends of the Buha River Basin over the next 30 years can be simulated. In configuring the SWAT model, aside from temperature and precipitation data, other meteorological variables were generated using the model’s built-in weather generator. Land use data were derived from remote sensing interpretations at a spatial resolution of 30 m for the years 2020 and 2050.
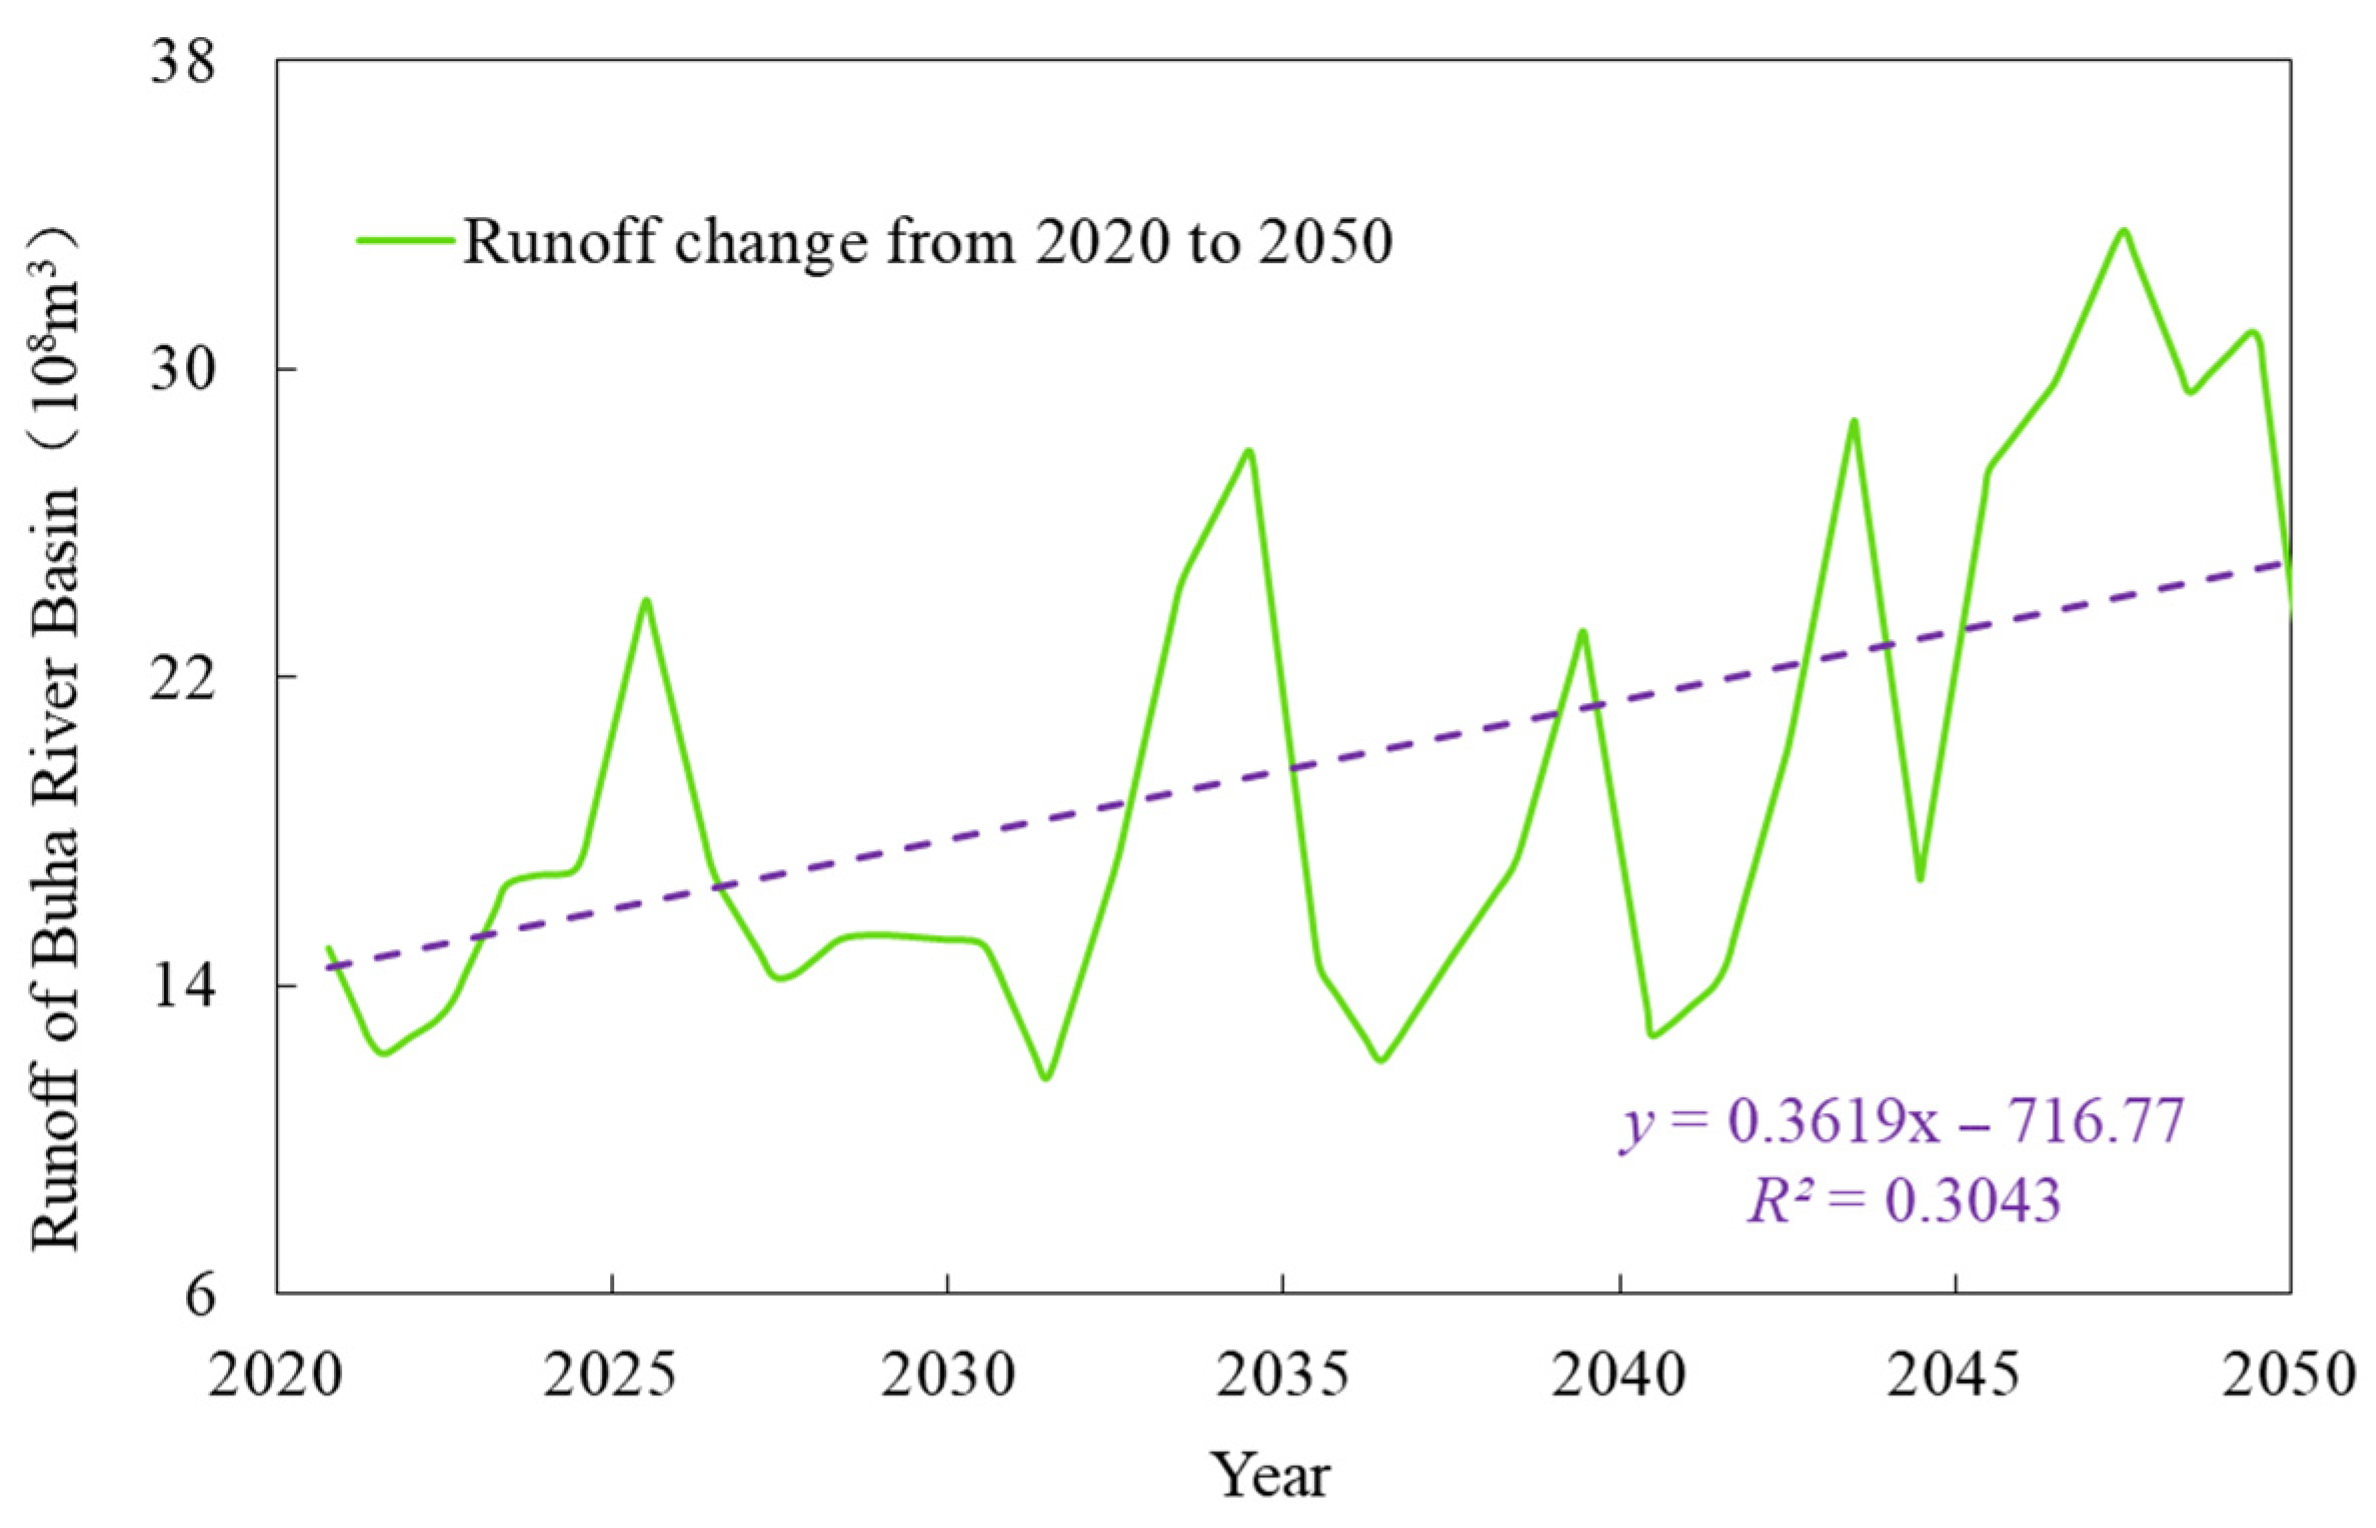
To validate the accuracy of future land use projections, the CA–Markov model was employed, and the Kappa coefficient was calculated using the CROSSTAB module in IDRISI 17.2 software. The resulting Kappa value of 0.82 indicates that the CA–Markov model performs well in simulating future land use changes in the Lake Qinghai Basin. After incorporating the above datasets, the SWAT model was run to simulate runoff changes in the Buha River Basin over the next three decades. Using the calibrated SWAT model, simulation results show a significant upward trend in runoff volume from 2020 to 2050, primarily driven by rising temperatures and increased precipitation. Over the 30-year period, the total runoff volume in the Buha River Basin is projected to increase by 8.82 × 10⁸ m3 (Figure 11), with the peak annual runoff reaching 33.59 × 10⁸ m3 in the year 2047.

3.3. Changes in Water Level, Water Storage, and Lake Area over the Next 30 Years

The lake water balance model is used to establish the relationships among lake water storage, lake area and lake level, and evaporation, underground runoff and precipitation are included in the lake water balance equation to obtain the future trends of the Lake Qinghai water level, lake area and water storage. In conclusion, we analyze the impacts of water level changes in Lake Qinghai over the next 30 years and the areas inundated by the continuous rise in the water level. The results of the present study revealed that the water level, lake area, and water storage capacity of Lake Qinghai from 2020 to 2050 exhibited continuous increasing trends. In particular, the increasing trend is more obvious after 2045 (Figure 12). Among them, the water level of Lake Qinghai rises to 3197.36 m in 2040, which is 1.01 m higher than that in 2020. Moreover, the lake area has reached approximately 4729.28 km2, which is an increase of 140.6 km2, and the water storage capacity of the lake has reached approximately 896.32 × 10⁸ m3, which is an increase of 15.32 × 10⁸ m3. By 2050, the water level of Lake Qinghai will be more than 3200 m, which is 5.46 m greater than the water level in 2020, and the water level area of Lake Qinghai will be more than 5000 km2, which will increase by approximately 500 km2 compared with the lake area in 2020.
The water storage capacity of Lake Qinghai is expected to show a gradual increase over the next 30 years, a change that is expected to effectively alleviate the increasingly tense water resources situation in the Lake Qinghai Basin. The increase in water level will not only provide a guarantee for the sustainable utilization of water resources, but will also promote the restoration of the surrounding wetlands and vegetation, which will help to slow down the expansion of land desertification. With the recovery of the water level, the ecosystem in the basin will be significantly improved, and biodiversity and ecological services will be upgraded, laying the foundation for ecological restoration and sustainable development in the basin.
Furthermore, we analyzed the relationship between projected climatic extremes—specifically, maximum temperature, minimum temperature, precipitation, and the state of Lake Qinghai, including its water level, lake area, and storage volume, over the next 30 years. The correlation analysis revealed a significant positive relationship between precipitation and the lake’s water level (R = 0.299, p < 0.05), lake area (R = 0.299, p < 0.05), and water storage (R = 0.303, p < 0.01). Similarly, extreme high temperatures were significantly and positively correlated with the lake’s water level (R = 0.441, p < 0.01), lake area (R = 0.439, p < 0.01), and water storage (R = 0.434, p < 0.01). In contrast, extreme low temperatures exhibited a significant negative correlation with these same lake parameters (R = −0.372, p < 0.01 for all three variables). Our analysis indicates that the anticipated increase in precipitation, along with rising extremely high and low temperatures within the Lake Qinghai Basin over the next three decades, will collectively enhance regional runoff. This increase in runoff is expected to drive a corresponding rise in the lake’s water level, lake area, and water storage, thereby making a positive contribution to the ecological equilibrium of the basin.
The sustained rise in Lake Qinghai’s water level presents a double-edged sword. Its short-term benefits include improving regional wetland ecosystems, moderating local climate patterns, and curbing desertification. However, of greater concern are the long-term potential risks: a persistent rise in water level threatens surrounding agricultural and pastoral activities, as well as tourism resources. Furthermore, it could exacerbate water eutrophication due to increased nutrient influx and adversely affect the habitats of key species, ultimately posing complex challenges to the sustainable development and ecological security of the watershed.

4. Discussion

4.1. Runoff and Water Level

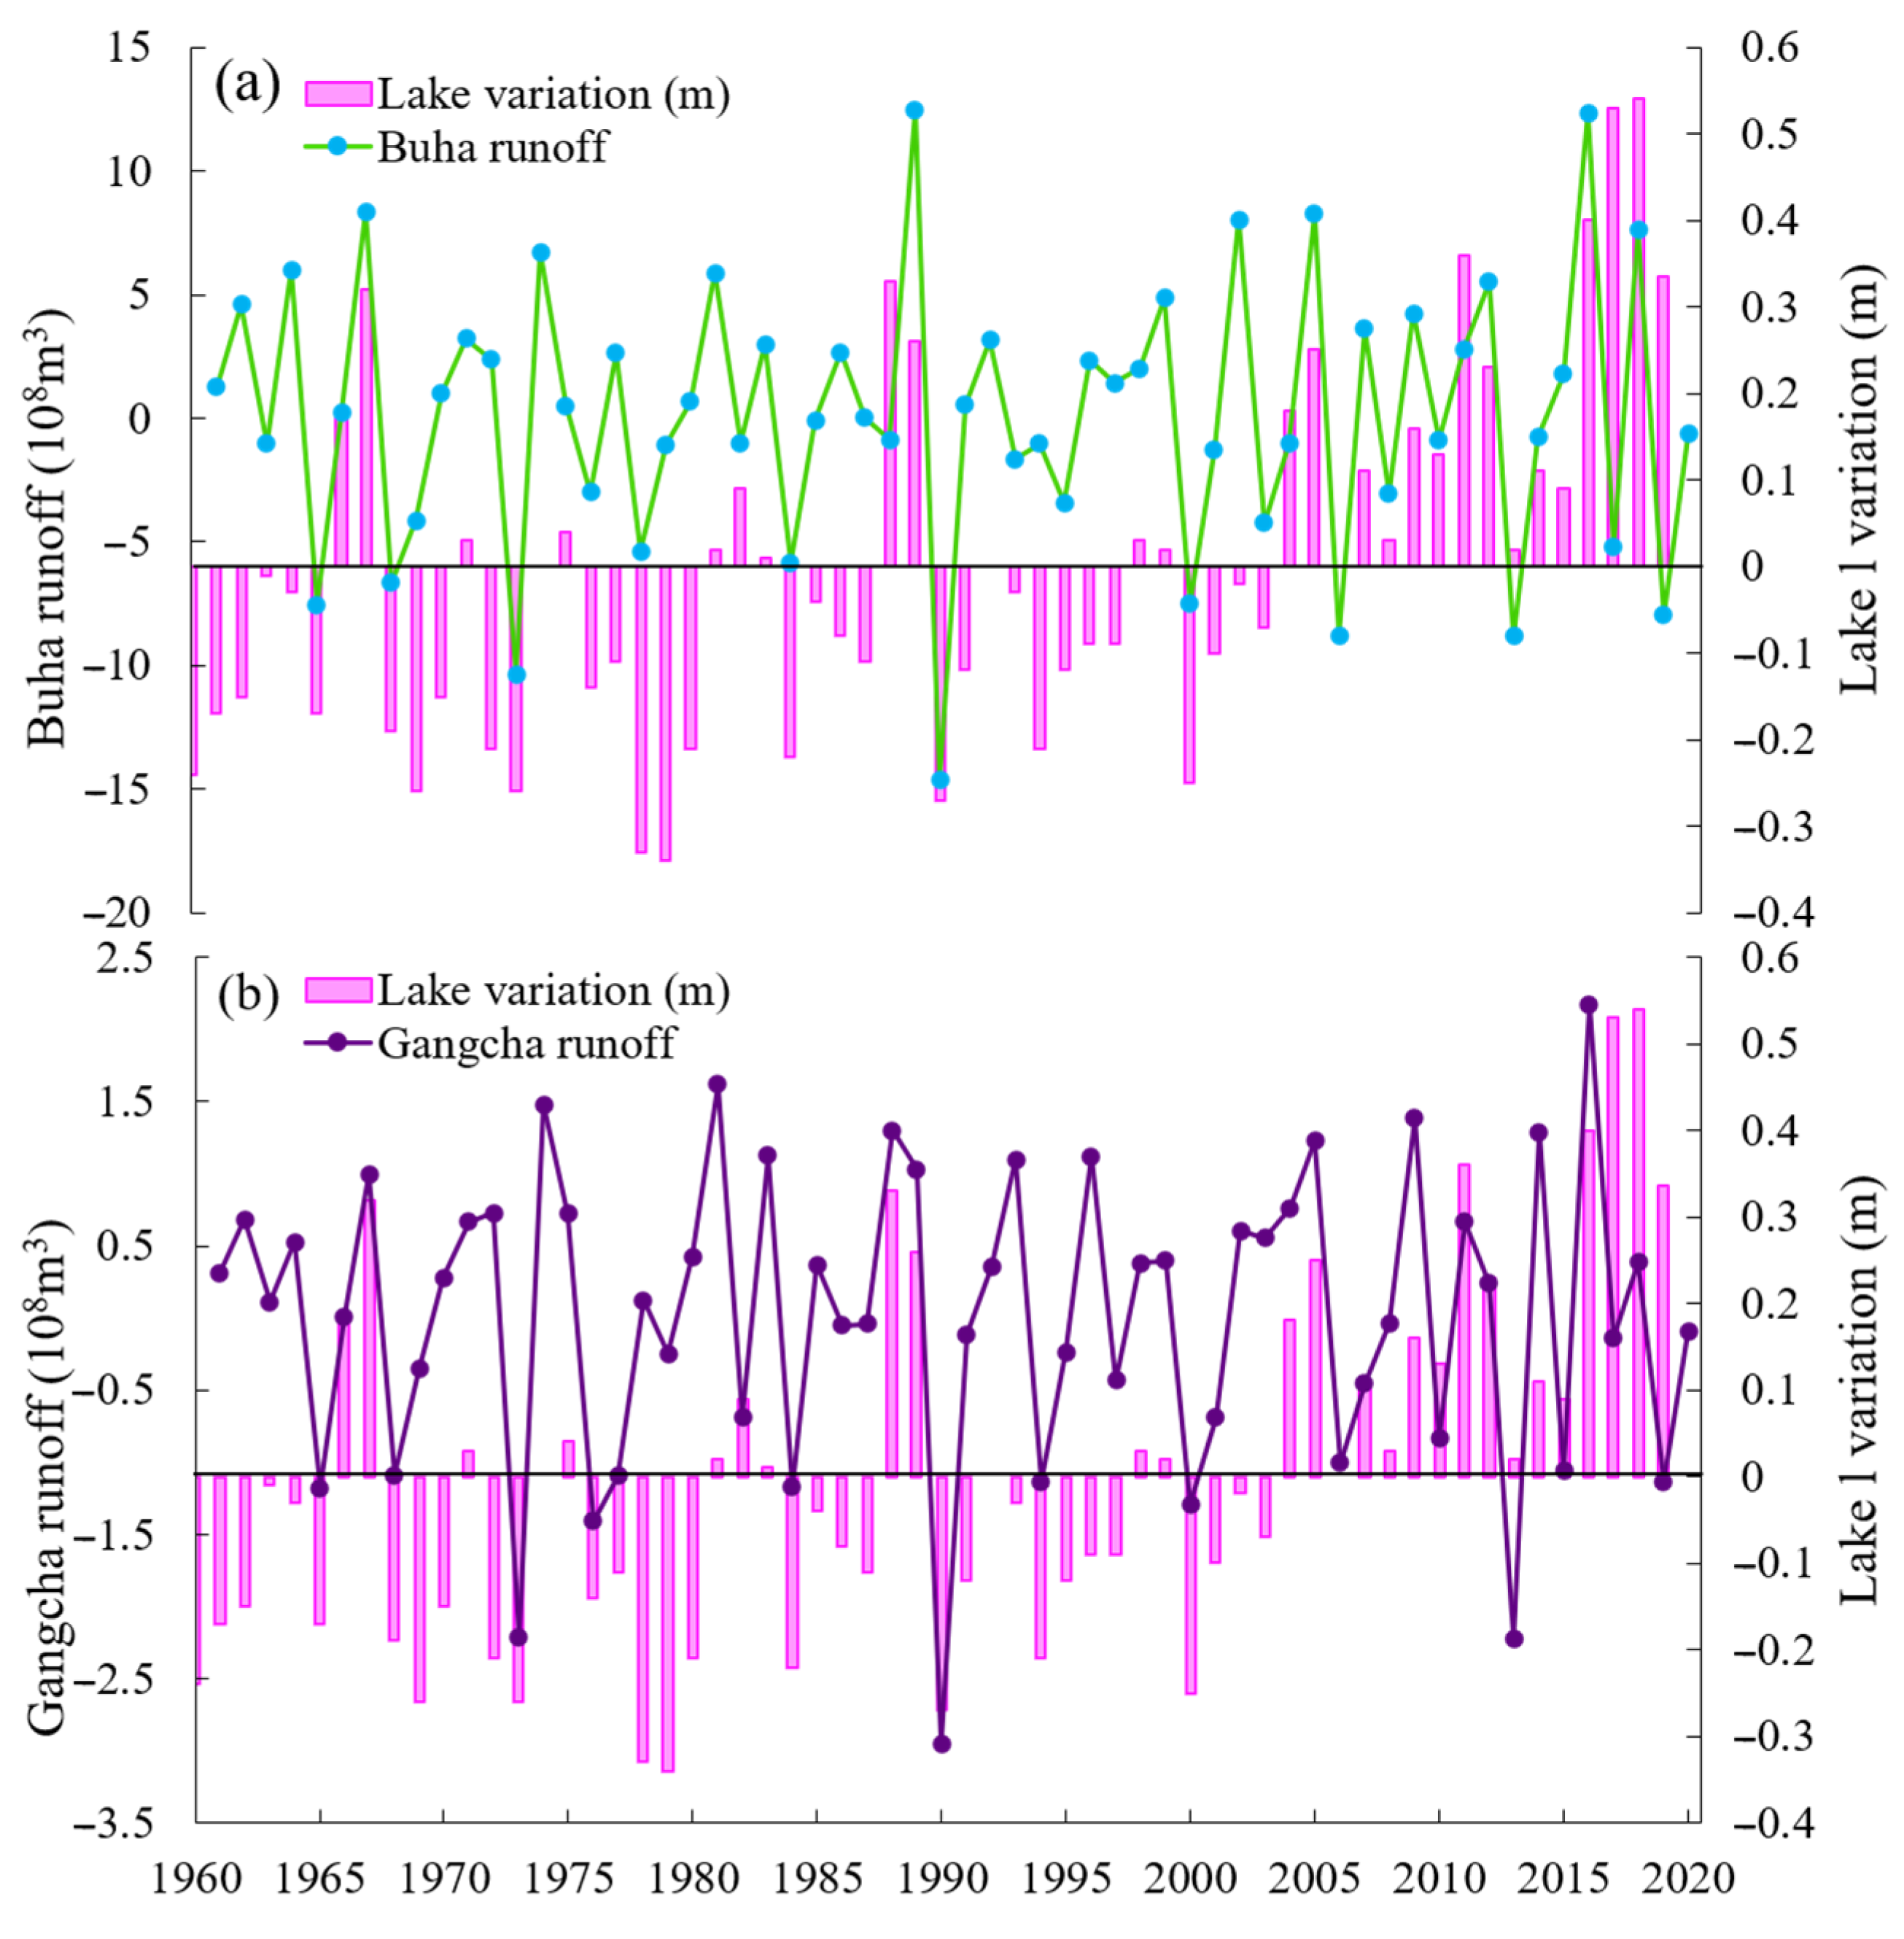
In the case of runoff from the Gangcha hydrological station, the increasing trend of the lake level was not consistent with the change in runoff from the Gangcha hydrological station. For example, the runoff from the Gangcha hydrological station in 1981 increased by 1.61 × 10⁸ m3 compared with that in the previous year, although the lake level decreased by 0.21 m. Likewise, the runoff at the Gangcha hydrological station in 1990 decreased by 1.95 × 10⁸ m3 compared with that in the previous year; however, the lake level increased by 0.26 m (Figure 13). The reason for this may be that the average annual runoff at the Gangcha hydrological station accounted for 16.9% of the multiyear average runoff into the lake; thus, the contribution to the lake level was relatively minor. In contrast, the annual average runoff at the Buha River accounted for 57% of the multiyear average surface runoff into the lake. Therefore, runoff from the Buha River has a more significant effect on the water level of Lake Qinghai. Correlation analysis revealed that the runoff from the Gangcha hydrological station was significantly correlated with the lake level (R = 0.288, p < 0.05), and the runoff from the Buha River was highly significantly correlated with the lake level (R = 0.487, p < 0.01). If the relationship between precipitation and runoff is considered, the changes in the water level of Lake Qinghai are sensitive to both. In general, precipitation has a significant effect on the runoff process, and changes in precipitation significantly affect the flow production process in a basin. Similarly, the decreased lake level was closely related to decreased river runoff. Changes in temperature, in turn, lead to an increase in potential evapotranspiration, affecting the evaporation of surface runoff to some extent.
With global warming, the annual temperature (0.35 °C/10a) and precipitation (7.9 mm/10a) on the Tibetan Plateau have significantly increased [39,40]. Against this background, the melting of glaciers and the increase in precipitation on the Qinghai–Tibet Plateau have led to increasing lake areas and lake levels [41,42]. Correspondingly, the precipitation and runoff in Lake Qinghai Basin also show increasing trends. The water level change in Lake Qinghai increases with increasing river runoff and precipitation and decreases with decreasing river runoff and precipitation. Thus, the changes in the water level in Lake Qinghai are more significantly influenced by rainfall and runoff.

4.2. Impacts of Climate Change on Runoff

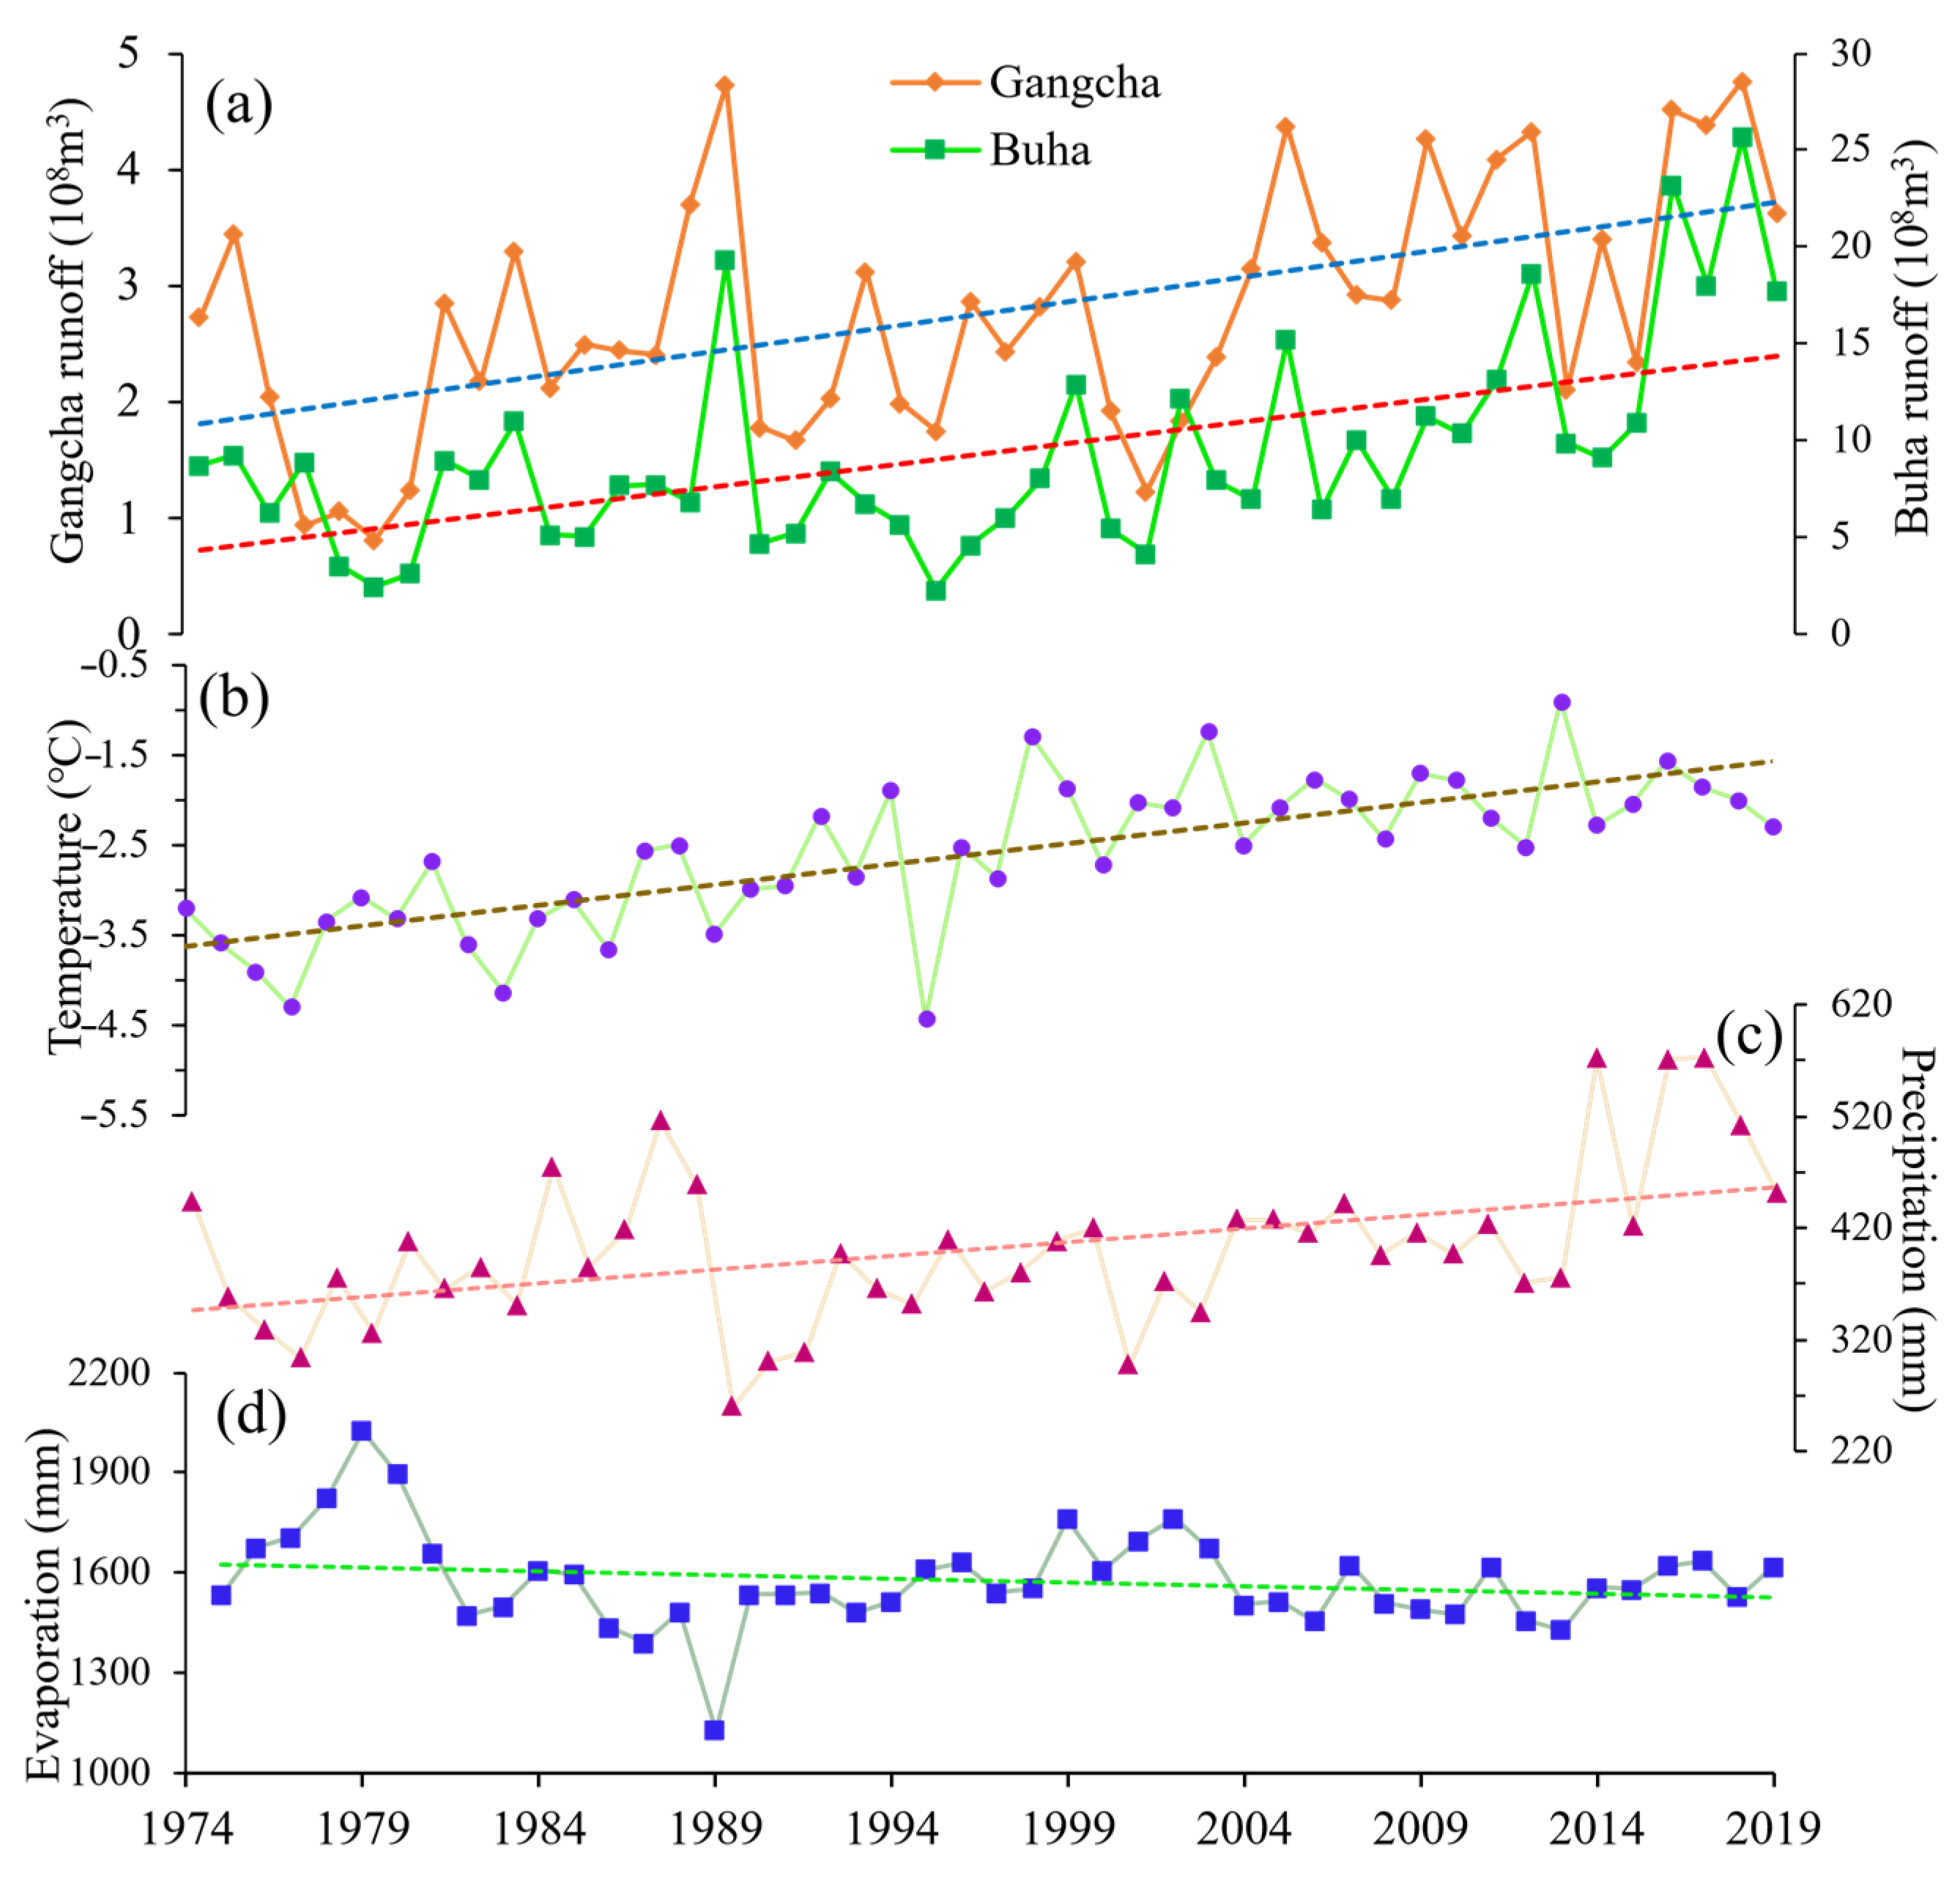
The water level of Lake Qinghai has been sensitive to climate change, while differences in temperature and precipitation have different effects on runoff (Figure 14). In particular, increasing trends of both precipitation and runoff were observed during the stage of lake level increase (2005–2020). This indicates that changes in lake levels were significantly influenced by both precipitation and runoff. Precipitation changes cause significant changes in flow production processes in watersheds, whereas temperature changes lead to an increase in potential evapotranspiration and affect evaporation from surface runoff to some extent [43]. However, in the Qinghai–Tibet Plateau region, because of its special geographical location, higher temperatures could also lead to an increase in glacier ablation, which would significantly increase the amount of runoff in a specific season [44]. From 1975 to 2004, there was a fluctuating decreasing trend in precipitation in the Lake Qinghai Basin. During the same period, the temperature significantly increased; however, the evaporation decreased. From 2005 to 2020, the annual precipitation and temperature in the Lake Qinghai Basin tended to increase, whereas evaporation tended to decrease. This indicates that the change in temperature directly affects evaporation from the lake surface, which indirectly affects the change in water level in Lake Qinghai. The results of the correlation analysis revealed that changes in runoff were positively correlated with precipitation (R = 0.772, p < 0.01) and negatively correlated with evaporation. This indicated that changes in precipitation affect runoff, lake area and lake level, which ultimately affect the hydrological processes in Lake Qinghai. Overall, changes in precipitation directly affect surface runoff into the lake, which is highly persistent in recharging the lake level and is the primary reason for the rising water level of Lake Qinghai.
Our projections of future climate and hydrological changes in the Lake Qinghai Basin are broadly consistent with large scale studies employing the same CMIP6/SSP scenarios and focusing on the entire Tibetan Plateau [45]. Specifically, results from coupling the SWAT hydrological model with future climate scenario models indicate that temperatures in the Lake Qinghai Basin will exhibit an upward trend over the next 30 years, aligning with the established consensus that the Tibetan Plateau will continue to experience accelerated warming. Relevant studies indicate that under a medium emissions scenario, the mean temperature will rise by more than 2 °C by mid-century [46,47]. Furthermore, existing literature highlights that precipitation and runoff are the primary drivers of lake water level changes [48,49], further supporting our conclusions regarding Lake Qinghai hydrological response.

4.3. Limitations and Future Research

For the Lake Qinghai Basin, under the influence of the dual context of climate and human activities, it is more challenging to use a model to quantify the effects of these factors on hydrological processes in the basin. The SUFI–2 algorithm can be used to characterize the uncertainty of model calibration and validation, and two metrics (p–factor and r–factor) are used to assess the measurement and simulation errors. The uncertainty of model calibration and validation was assessed with reference to the recommended values (p–factor > 7.1 and r–factor < 5.5) proposed [23], and the uncertainty in simulating the runoff from the Lake Qinghai basin in this study was acceptable. In this work, the SUFI–2 algorithm in SWAT–CUP software (Version 5.1.6.2) was used to calibrate and validate the monthly runoff volume data from the Buha River and Gangcha hydrological stations in the Lake Qinghai Basin and to perform sensitivity analysis and model uncertainty analysis on the model parameters. Although the SWAT model was applicable to the simulation of Lake Qinghai runoff, there were still some uncertainties between the simulation results and the practical observation data.
Research demonstrates that the SWAT model is suitable for simulating runoff dynamics in the Lake Qinghai Basin, though its full potential remains untapped. While the CMIP6 model adeptly captures the spatial distribution of average surface temperature and precipitation in the basin, it tends to underestimate temperatures and overestimate precipitation. We find that the CMIP6 model tends to underestimate temperature and overestimate precipitation in this basin is a critical consideration. Furthermore, our current SWAT model, while robust for climatic drivers, does not yet incorporate dynamic human activities such as agricultural water withdrawal, land-use changes, or the specific contribution of glacier melt, which is a significant factor in the broader Qinghai–Tibet Plateau.
In future research, we will analyze the water level change pattern of Lake Qinghai and explore the main driving and inducing factors affecting water level changes in Lake Qinghai. (1) We need to collect more information and data on surface groundwater, agricultural water uses and management practices (fertilization, tillage practices, and irrigation), and socioeconomic data (population, livestock, and industrial and agricultural development) to improve the accuracy of the SWAT model for simulating the Lake Qinghai Basin. (2) To simulate and predict the impacts of climate change and human activities on the runoff and water level changes in the Lake Qinghai Basin and to predict the trends of the hydrological processes in the basin and the water level changes in Lake Qinghai under the dual stress of climate and human activities in the coming decades. (3) To analyze the ecological and environmental effects caused by changes in lake water levels against the background of climate and human activities.

5. Conclusions

This study combines the CMIP6 multi-model SSP climate scenarios with a multi-site, multi-parameter SWAT model, which was applied to the Lake Qinghai basin as a unique, data-sparse high-altitude inland lake region. The results indicate that: (1) The results revealed that twenty-one model parameters were applied for sensitivity analysis at the Buha River and Gangcha hydrological stations, seven of which (GW_DELAY, CH_N2, EPCO, GWQMN, REVAPMN, GW_REVAP, and SLSUBBSN) were more distinct and sensitive to runoff (p < 0.05). The simulation results reveal that the hydrological model of Lake Qinghai better reflects the changes in various hydrological factors in the watershed and its lake. (2) Based on CMIP6 future climate scenarios, this study predicts that the Lake Qinghai Basin will undergo a significant warming and moistening process in the future. Under the high-emission scenario (SSP5-8.5), the temperature rise rate could reach 1.024 °C per decade, with annual precipitation showing an increasing trend across all scenarios (increase of 11.1% to 18.9%). The runoff in the Buha River basin is projected to increase substantially over the next 30 years due to rising temperatures and precipitation, with a total increment of approximately 8.82 × 10⁸ m3. This indicates a further intensification of the regional hydrological cycle and highlights the sensitivity of Lake Qinghai water level to climate change. The findings provide crucial data support for regional water resource management, ecological conservation, and adaptive planning.
Although the SWAT model effectively simulates the trend of runoff changes in the Lake Qinghai Basin, uncertainties remain due to limitations in groundwater, agricultural water use, and socioeconomic data. Future research should integrate more detailed human activity and cryosphere data to enhance model prediction accuracy and assess the potential ecological impacts of lake water level changes under dual pressures of climate change and human activities.

Author Contributions

H.Z.: conceptualization, supervision, resources, writing—review and editing, and foundation acquisition. P.H.: methodology, software, data processing and writing—original draft preparation. J.D. and S.Q.: investigation, review and editing. C.W. and J.W.: investigation, data curation. Z.W. and X.J. data curation. All authors have read and agreed to the published version of the manuscript.

Funding

This work was supported by the National Natural Science Foundation of China (U2202207 and 41820104008), Joint Fund of Henan Province Science and Technology R&D Program (225200810057), the Innovation Team Project of Henan Academy of Sciences (Project No. 20230107), the National Natural Science Foundation of China (4230144) and the Wisdom of the Central Plains Geographic Information Technology Collaborative Innovation Center (2023C004).

Data Availability Statement

All data and models that support the findings of this study are available from the corresponding author upon reasonable request.

Conflicts of Interest

The authors declare no conflicts of interest.

References

  1. Woolway, R.I.; Kraemer, B.M.; Lenters, J.D.; Merchant, C.J.; O’Reilly, C.M.; Sharma, S. Global lake responses to climate change. Nat. Rev. Earth Environ. 2020, 1, 388–403. [Google Scholar] [CrossRef]
  2. Zhang, G.; Ran, Y.; Wan, W.; Luo, W.; Chen, W.; Xu, F.; Li, X. 100 years of lake evolution over the Qinghai–Tibet Plateau. Earth Syst. Sci. Data 2021, 13, 3951–3966. [Google Scholar] [CrossRef]
  3. Yao, T.; Bolch, T.; Chen, D.; Gao, J.; Immerzeel, W.; Piao, S.; Su, F.; Thompson, L.; Wada, Y.; Wang, L.; et al. The imbalance of the Asian water tower. Nat. Rev. Earth Environ. 2022, 3, 618–632. [Google Scholar] [CrossRef]
  4. Moser, K.A.; Baron, J.S.; Brahney, J.; Oleksy, I.A.; Saros, J.E.; Hundey, E.J.; Smol, J.P. Mountain lakes: Eyes on global environmental change. Glob. Planet. Change 2019, 178, 77–95. [Google Scholar] [CrossRef]
  5. Zhang, G.; Yao, T.; Chen, W.; Zheng, G.; Shum, C.K.; Yang, K.; Jia, Y. Regional differences of lake evolution across China during 1960s–2015 and its natural and anthropogenic causes. Remote Sens. Environ. 2019, 221, 386–404. [Google Scholar] [CrossRef]
  6. Grant, L.; Vanderkelen, I.; Gudmundsson, L.; Tan, Z.; Perroud, M.; Stepanenko, V.M.; Thiery, W. Attribution of global lake systems change to anthropogenic forcing. Nat. Geosci. 2021, 14, 849–854. [Google Scholar] [CrossRef]
  7. Huang, L.; Liu, J.; Shao, Q.; Liu, R. Changing inland lakes responding to climate warming in Northeastern Tibetan Plateau. Clim. Change 2011, 109, 479–502. [Google Scholar] [CrossRef]
  8. Zhang, Z.; Chang, J.; Xu, C.Y.; Zhou, Y.; Wu, Y.; Chen, X.; Duan, Z. The response of lake area and vegetation cover variations to climate change over the Qinghai-Tibetan Plateau during the past 30 years. Sci. Total Environ. 2018, 635, 443–451. [Google Scholar] [CrossRef]
  9. Hou, P.; Weidman, R.P.; Liu, Q.; Li, H.; Duan, L.; Zhang, X.; Liu, F.; Gao, Y.; Xu, J.; Li, H.; et al. Recent water-level fluctuations, future trends and their eco-environmental impacts on Lake Qinghai. J. Environ. Manag. 2023, 333, 117461. [Google Scholar] [CrossRef]
  10. Huang, C.; Lai, Z.; Liu, X.; Madsen, D. Lake-level history of Lake Qinghai on the NE Tibetan Plateau and its implications for Asian monsoon pattern-A review. Quat. Sci. Rev. 2021, 273, 107258. [Google Scholar] [CrossRef]
  11. Fan, C.; Song, C.; Li, W.; Liu, K.; Cheng, J.; Fu, C.; Chen, T.; Ke, L.; Wang, J. What drives the rapid water-level recovery of the largest lake (Lake Qinghai) of China over the past half century? J. Hydrol. 2021, 593, 125921. [Google Scholar] [CrossRef]
  12. Cui, B.L.; Li, X.Y. Stable isotopes reveal sources of precipitation in the Lake Qinghai Basin of the northeastern Tibetan Plateau. Sci. Total Environ. 2015, 527, 26–37. [Google Scholar] [CrossRef]
  13. Wan, W.; Xiao, P.; Feng, X.; Li, H.; Ma, R.; Duan, H.; Zhao, L. Monitoring lake changes of Qinghai-Tibetan Plateau over the past 30 years using satellite remote sensing data. Chin. Sci. Bull. 2014, 59, 1021–1035. [Google Scholar] [CrossRef]
  14. Wang, H.; Qi, Y.; Lian, X.; Zhang, J.; Yang, R.; Zhang, M. Effects of climate change and land use/cover change on the volume of the Lake Qinghai in China. J. Arid Land 2022, 14, 245–261. [Google Scholar] [CrossRef]
  15. Gong, J.; Li, J.; Yang, J.; Li, S.; Tang, W. Land use and land cover change in the Qinghai Lake region of the Tibetan Plateau and its impact on ecosystem services. Int. J. Environ. Res. Public Health 2017, 14, 818. [Google Scholar] [CrossRef]
  16. Chang, B.; He, K.N.; Li, R.J.; Sheng, Z.P.; Wang, H. Linkage of climatic factors and human activities with water level fluctuations in Qinghai Lake in the northeastern Tibetan Plateau, China. Water 2017, 9, 552. [Google Scholar] [CrossRef]
  17. Liang, J.; Lupien, R.L.; Xie, H.; Vachula, R.S.; Stevenson, M.A.; Han, B.P.; Lin, Q.; He, Y.; Wang, M.; Liang, P.; et al. Lake ecosystem on the Qinghai–Tibetan Plateau severely altered by climatic warming and human activity. Palaeogeogr. Palaeoclimatol. Palaeoecol. 2021, 576, 110509. [Google Scholar] [CrossRef]
  18. Stuart-Smith, R.F.; Roe, G.H.; Li, S.; Allen, M.R. Increased outburst flood hazard from Lake Palcacocha due to human-induced glacier retreat. Nat. Geosci. 2021, 14, 85–90. [Google Scholar] [CrossRef]
  19. Trinh, T.; Ishida, K.; Kavvas, M.L.; Ercan, A.; Carr, K. Assessment of 21st century drought conditions at Shasta Dam based on dynamically projected water supply conditions by a regional climate model coupled with a physically based hydrology model. Sci. Total Environ. 2017, 586, 197–205. [Google Scholar] [CrossRef]
  20. Kaya, Y.; Sanli, F.B.; Abdikan, S. Refinement of ICESat-2 derived inland water surface levels with the TG20 local geoid model: In the case of Türkiye lakes. Phys. Chem. Earth Parts A B C 2025, 139, 103900. [Google Scholar] [CrossRef]
  21. Zhu, Z.; Fu, C.; Wu, H.; Wu, H.; Cao, Y.; Xia, Y. Decoding the hundred-year water level changes of the largest Saline Lake in China: A joint lake-basin modeling study based on a revised SWAT+. J. Hydrol. Reg. Stud. 2023, 49, 101521. [Google Scholar] [CrossRef]
  22. Li, X.; Yang, X.; Ma, Y.; Hu, G.; Hu, X.; Wu, X.; Wang, P.; Huang, Y.; Cui, B.; Wei, J. Qinghai Lake Basin critical zone observatory on the Qinghai-Tibet plateau. Vadose Zone J. 2018, 17, 1–11. [Google Scholar] [CrossRef]
  23. Wang, X.; Gao, B. Future hydrological changes of the upstream basin and their effects on the water level of the Qinghai Lake. J. Hydrol. Reg. Stud. 2025, 59, 102425. [Google Scholar] [CrossRef]
  24. Yang, G.; Zhang, M.; Xie, Z.; Li, J.; Ma, M.; Lai, P.; Wang, J. Quantifying the contributions of climate change and human activities to water volume in Lake Qinghai, China. Remote Sens. 2021, 14, 99. [Google Scholar] [CrossRef]
  25. Lian, X.H.; Qi, Y.; Wang, H.W.; Zhang, J.L.; Yang, R. Assessing changes of water yield in Qinghai Lake watershed of China. Water 2019, 12, 11. [Google Scholar] [CrossRef]
  26. Li, Z.; Zhang, Z.; Xiong, S.; Zhang, W.; Li, R. Lake surface temperature predictions under different climate scenarios with machine learning methods: A case study of Lake Qinghai and Hulun lake, China. Remote Sens. 2024, 16, 3220. [Google Scholar] [CrossRef]
  27. Luo, Z.; Liu, J.; Zhang, S.; Shao, W.; Zhang, L. Research on climate change in Lake Qinghai Basin based on WRF and CMIP6. Remote Sens. 2023, 15, 4379. [Google Scholar] [CrossRef]
  28. Chen, C.; Gan, R.; Feng, D.; Yang, F.; Zuo, Q. Quantifying the contribution of SWAT modeling and CMIP6 inputting to streamflow prediction uncertainty under climate change. J. Clean. Prod. 2022, 364, 132675. [Google Scholar] [CrossRef]
  29. Yin, G.A.; Niu, F.J.; Lin, Z.J.; Luo, J.; Liu, M.H. Data-driven spatiotemporal projections of shallow permafrost based on CMIP6 across the Qinghai–Tibet Plateau at 1 km2 scale. Adv. Clim. Change Res. 2021, 12, 814–827. [Google Scholar] [CrossRef]
  30. Chen, F.; Wu, D.; Chen, J.; Zhou, A.; Yu, J.; Shen, J.; Huang, X. Holocene moisture and East Asian summer monsoon evolution in the northeastern Tibetan Plateau recorded by Lake Qinghai and its environs: A review of conflicting proxies. Quat. Sci. Rev. 2016, 154, 111–129. [Google Scholar] [CrossRef]
  31. Mo, L.; Yu, X.; Feng, Y.; Jiang, T. Runoff Variations and Quantitative Analysis in the Qinghai Lake Basin Under Changing Environments. Hydrology 2025, 12, 94. [Google Scholar] [CrossRef]
  32. Xiong, X.; Zhang, K.; Chen, X.; Shi, H.; Luo, Z.; Wu, C. Sources and distribution of microplastics in China’s largest inland lake–Lake Qinghai. Environ. Pollut. 2018, 235, 899–906. [Google Scholar] [CrossRef]
  33. Neitsch, S.L.; Arnold, J.G.; Kiniry, J.R.; Williams, J.R. Soil and Water Assessment Tool Theoretical Documentation Version 2009; Texas Water Resources Institute: College Station, TX, USA, 2011. [Google Scholar]
  34. Mishra, S.K.; Singh, V. Soil Conservation Service Curve Number (SCS-CN) Methodology; Springer Science & Business Media: Berlin, Germany, 2013. [Google Scholar]
  35. Beven, K. A sensitivity analysis of the Penman-Monteith actual evapotranspiration estimates. J. Hydrol. 1979, 44, 169–190. [Google Scholar] [CrossRef]
  36. Moriasi, D.N.; Arnold, J.G.; Van Liew, M.W.; Bingner, R.L.; Harmel, R.D.; Veith, T.L. Model evaluation guidelines for systematic quantification of accuracy in watershed simulations. Trans. ASABE 2007, 50, 885–900. [Google Scholar] [CrossRef]
  37. Busico, G.; Colombani, N.; Fronzi, D.; Pellegrini, M.; Tazioli, A.; Mastrocicco, M. Evaluating SWAT model performance, considering different soils data input, to quantify actual and future runoff susceptibility in a highly urbanized basin. J. Environ. Manag. 2020, 266, 110625. [Google Scholar] [CrossRef]
  38. Tokarska, K.B.; Stolpe, M.B.; Sippel, S.; Fischer, E.M.; Smith, C.J.; Lehner, F.; Knutti, R. Past warming trend constrains future warming in CMIP6 models. Sci. Adv. 2020, 6, eaaz9549. [Google Scholar] [CrossRef]
  39. Duan, A.; Xiao, Z. Does the climate warming hiatus exist over the Tibetan Plateau? Sci. Rep. 2015, 5, 13711. [Google Scholar] [CrossRef]
  40. You, Q.; Min, J.; Kang, S. Rapid warming in the Tibetan Plateau from observations and CMIP5 models in recent decades. Int. J. Climatol. 2016, 36, 2660–2670. [Google Scholar] [CrossRef]
  41. Ji, J.; Shen, J.; Balsam, W.; Chen, J.; Liu, L.; Liu, X. Asian monsoon oscillations in the northeastern Qinghai–Tibet Plateau since the late glacial as interpreted from visible reflectance of Lake Qinghai sediments. Earth Planet. Sci. Lett. 2005, 233, 61–70. [Google Scholar] [CrossRef]
  42. Wu, Q.; Zhang, T.; Liu, Y. Permafrost temperatures and thickness on the Qinghai–Tibet Plateau. Glob. Planet. Change 2010, 72, 32–38. [Google Scholar] [CrossRef]
  43. Zhang, G.; Yao, T.; Xie, H.; Yang, K.; Zhu, L.; Shum, C.K.; Ke, C. Response of Tibetan Plateau lakes to climate change: Trends, patterns, and mechanisms. Earth-Sci. Rev. 2020, 208, 103269. [Google Scholar] [CrossRef]
  44. Song, C.; Huang, B.; Richards, K.; Ke, L.; Hien Phan, V. Accelerated lake expansion on the Tibetan Plateau in the 2000s: Induced by glacial melting or other processes? Water Resour. Res. 2014, 50, 3170–3186. [Google Scholar] [CrossRef]
  45. Chen, R.; Li, H.; Wang, X.; Gou, X.; Yang, M.; Wan, G. Surface air temperature changes over the Tibetan Plateau: Historical evaluation and future projection based on CMIP6 models. Geosci. Front. 2022, 13, 101452. [Google Scholar] [CrossRef]
  46. Wang, H.; Liu, J.; Luo, Z.; Nazli, S.; Shi, L. Hydrologic response and prediction of future water level changes in Qinghai Lake of Tibet Plateau, China. J. Hydrol. Reg. Stud. 2025, 57, 102168. [Google Scholar] [CrossRef]
  47. Su, F.; Zhang, L.; Ou, T.; Chen, D.; Yao, T.; Tong, K.; Qi, Y. Hydrological response to future climate changes for the major upstream river basins in the Tibetan Plateau. Glob. Planet. Change 2016, 136, 82–95. [Google Scholar] [CrossRef]
  48. Zhang, G.; Yao, T.; Shum, C.K.; Yi, S.; Yang, K.; Xie, H.; Feng, W.; Bolch, T.; Wang, L.; Behrangi, A.; et al. Lake volume and groundwater storage variations in Tibetan Plateau’s endorheic basin. Geophys. Res. Lett. 2017, 44, 5550–5560. [Google Scholar] [CrossRef]
  49. Lei, Y.; Yao, T.; Yang, K.; Sheng, Y.; Kleinherenbrink, M.; Yi, S. Contrasting hydrological budgets of the adjacent lake systems on the Tibetan Plateau. J. Hydrol. 2023, 620, 129487. [Google Scholar]
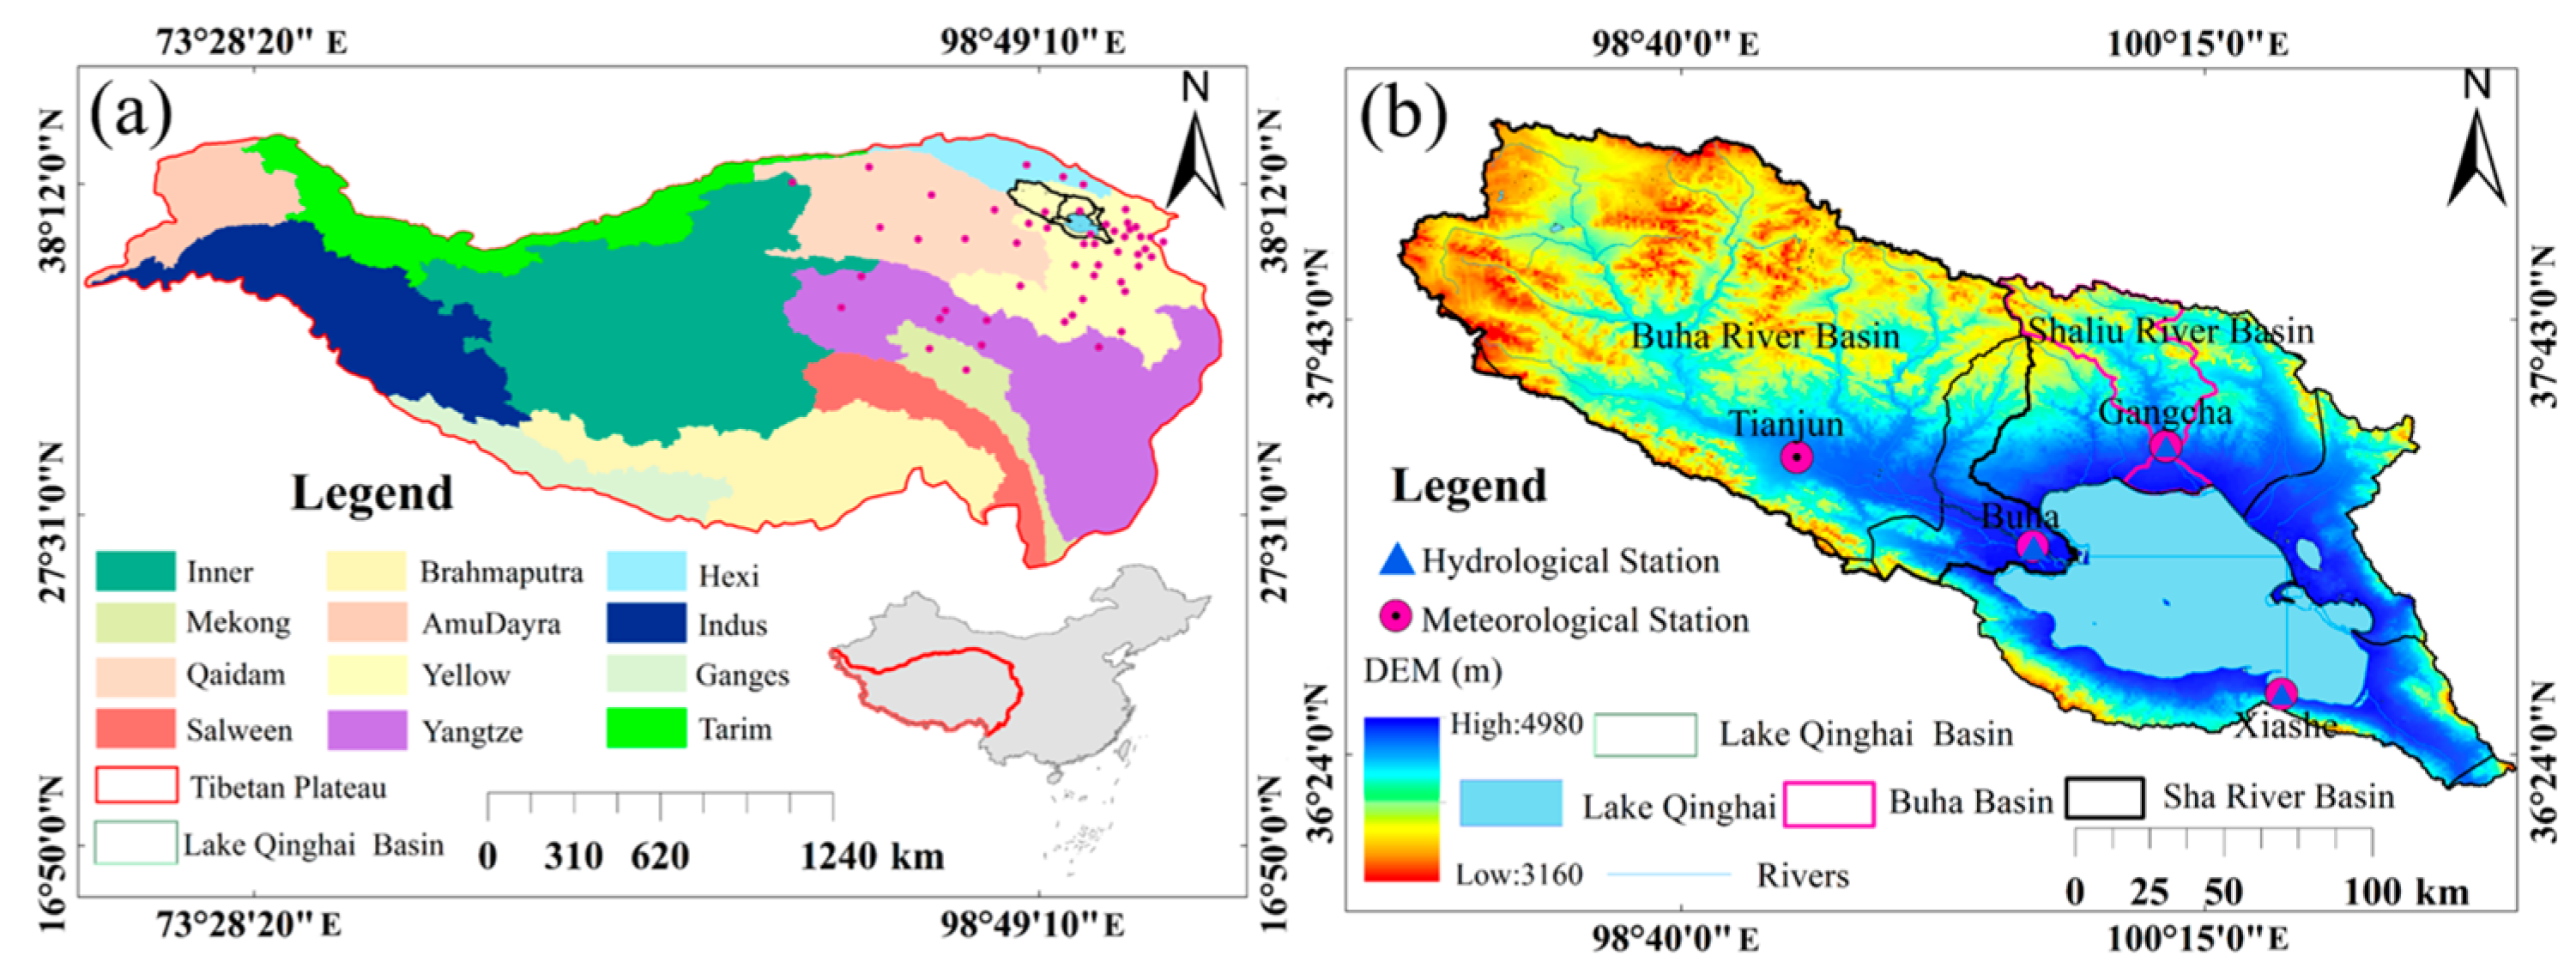
Figure 1. Study area of the Lake Qinghai Basin (a) Qinghai–Tibet Plateau; (b) Lake Qinghai Basin.
Hydrology 12 00259 g001
Figure 2. Types of databases in the Lake Qinghai Basin.
Hydrology 12 00259 g002
Figure 3. Types of databases in the Lake Qinghai Basin. (a) Land use types; (b) soil types.
Hydrology 12 00259 g003
Figure 4. Subbasins and HRU division of the Lake Qinghai Basin. (a) subbasin division; (b) setting of the land slope.
Hydrology 12 00259 g004
Figure 5. Ranking and evaluation of sensitive SWAT parameters.
Hydrology 12 00259 g005
Figure 6. Monthly flow observations and simulated values for the Gangcha hydrological station in the Lake Qinghai Basin during the calibration and validation periods (1962–2017).
Hydrology 12 00259 g006
Figure 7. Monthly flow observations and simulated values for the Buha hydrological station in the Lake Qinghai Basin during the calibration and validation periods (1962–2017).
Hydrology 12 00259 g007
Figure 8. CMIP6 model simulation of annual mean surface air temperature on the Qinghai–Tibetan Plateau from 2030 to 2100 under different scenarios.
Hydrology 12 00259 g008
Figure 9. CMIP6 model simulation of annual mean annual precipitation on the Qinghai–Tibetan Plateau from 2030 to 2100 under different scenarios.
Hydrology 12 00259 g009
Figure 10. Changes in extreme temperatures and precipitation in the Lake Qinghai Basin. (a) Extreme high temperatures, (b) Extreme low temperatures, (c) Precipitation.
Hydrology 12 00259 g010
Figure 11. Trends in runoff volume in the Buha River Basin from 2020 to 2050.
Hydrology 12 00259 g011
Figure 12. Changes in the water level, lake area and water storage of Lake Qinghai from 2020 to 2050.
Hydrology 12 00259 g012
Figure 13. Runoff and lake level changes in Lake Qinghai. (a) Runoff from the Buha River hydrological station and water level of Lake Qinghai. (b) Runoff from the Gangcha River hydrological station and water level of Lake Qinghai.
Hydrology 12 00259 g013
Figure 14. Trends in annual means of runoff at the Buha River and Gangcha hydrological stations. (a) Gangcha and Buha runoff; (b) Temperature; (c) Precipitation; (d) Evaporation.
Hydrology 12 00259 g014
Table 1. Relationship between electrical conductivity and water temperature.
Variable NameDefinitionInitial RangeCalibration Parameter RangeCalibration ResultSensitivity Priority
GangchaBuhaGangchaBuha
r__CN2Initial SCS runoff curve number for moisture condition II−0.2–0.20.1546–0.50.030.260.10.1
v__ESCOSoil evaporation compensation factor0–10.18–0.870.510.060.20.5
v__EPCOPlant uptake compensation factor0–10.4519–0.8176 0.65 0.9
v__OV_NManning’s “n” value for overland flow0.5–2−20–8.220.010.090.190.4
r__SOL_ZDepth from soil surface to bottom of layer (mm)−0.5–0.50.071–0.41−0.25−0.25
v__ALPHA_BFBaseflow alpha factor (1/days)0–10.37–0.790.0480.5810.01
v__GW_DELAYGroundwater delay time (days)0–50081.35–360.61162.7931351202
v__GWQMNThreshold depth of water in the shallow aquifer needed for return flow to occur (mm H2O)0–5000984.9–3293.640.240.2319137.5
v__GW_REVAPGround water “revap” coefficient0.02–0.20.102–0.17110.070.1
v__RCHRG_DPDeep aquifer percolation fraction0–10.25–0.7510.051.40.9
v__TLAPSTemperature lapse rate (°C/km)−10–101.89–7.3
v__CH_N2Manning’s “n” value for the main channel−0.0–160.30.0146–0.18820.250.2496
v__CH_K2Effective hydraulic conductivity in main channel alluvium (mm/h)−0.01–500277.25–428.890122.21115.28
v__SURLAGSurface runoff lag coefficient0.05–244.0058–17.342620.312.1862
v__SLSUBBSNAverage slope length (m)10–150107.5921–15023.1296.07310
v__SFTMPSnowfall temperature (°C)−20–207.4457–20516.92.9
v__SMTMPSnow melt base temperature (°C)−20–20−20–8.228550.50.7−3.4
v__SMFMXMelt factor for snow on June 21 (mm H2O/°C-day)0–208.6342–16.2167103.58.55.6
r__SOL_AWCAvailable water capacity of the soil layer (mm H2O/mm soil)−0.5–1.00.0196–0.3401−0.500.50.1
v__SMFMNMelt factor for snow on December 21 (mm H2O/°C-day)1–81.8524–13.9574381.76.5
v__TIMPSnowpack temperature lag factor0.01–1.00.5929–10.040.6811
Disclaimer/Publisher’s Note: The statements, opinions and data contained in all publications are solely those of the individual author(s) and contributor(s) and not of MDPI and/or the editor(s). MDPI and/or the editor(s) disclaim responsibility for any injury to people or property resulting from any ideas, methods, instructions or products referred to in the content.