1. Introduction
Groundwater pollution poses a significant challenge to ensuring the quality and sustainability of water resources in semi-arid regions, where it is the primary source of water for both drinking and irrigation purposes [
1,
2,
3,
4]. The scarcity and pollution of surface water bodies make groundwater a vital component of securing water supply safety [
5,
6,
7]. However, the growth of populations and climate variations has led to an imbalance between groundwater recharge and extraction, resulting in a decline in groundwater levels and quality [
8]. In semi-arid regions, groundwater is often contaminated with high levels of nitrate, fluoride, or arsenic, which can have severe health implications for residents [
9]. For instance, high levels of nitrate contamination can cause serious health effects, including infant methemoglobinemia, type -1- childhood diabetes, blood pressure, and acute respiratory infection [
10]. Similarly, high fluoride concentrations can lead to endemic fluorosis [
11]. The health risks associated with contaminated groundwater are particularly concerning for children, who are more susceptible to the negative impacts of these contaminants [
12]. In some regions, the health risks posed by groundwater pollution are exacerbated by the lack of reliable surface water resources, making groundwater the only viable option for water supply [
13]. To mitigate these risks, sustainable development and rainwater harvesting are recommended to improve groundwater quality. Additionally, conjunctive use of groundwater and surface water, as well as the construction of water storage facilities, can help to ensure a safe and reliable water supply [
14].
The significance of groundwater quality assessment lies in its role in determining the suitability of groundwater for various purposes [
15]. Managing this essential resource optimally and sustainably requires a thorough assessment of its chemical composition. The desired quality of groundwater supply varies depending on its intended use [
16].
The water quality index (WQI) was developed by Horton in 1965 [
17] and utilizes a mathematical formula to derive a numerical value that represents overall water quality based on physical, chemical, and biological measurements [
18]. However, the WQI has limitations, and researchers have proposed recommendations to overcome them. One recommended approach is the use of an integrated-weight method to incorporate environmental uncertainty into groundwater quality evaluation [
19]. Gao et al. [
20] developed the integrated-weight water quality index (IWQI) specifically for assessing groundwater’s suitability for drinking purposes. Additionally, selecting appropriate water quality indicators is crucial for accurate WQI calculation, with parameters weighted according to their importance to water quality [
21]. Akhtar et al. [
22] provided a detailed review of the evolution of water quality index (WQI) estimation methods, from simple direct calculations to multi-criteria approaches. Despite the widespread use of the WQI in urban water supply assessment, its application in evaluating groundwater quality for irrigation purposes is equally important, as it will help to minimize adverse impacts on agriculture [
23]. Analyzing groundwater quality and creating GIS-based maps are integral components of effective groundwater planning strategies [
24]. Hydrochemical studies and GIS analyses help identify contaminated zones, assess water suitability for various purposes, and provide essential information for water management programs [
25].
The study focuses on the Wadi Boussellam sub-watershed, where groundwater’s vital role in socio-economic activities faces threats from domestic, industrial, and agricultural pollution. The study aims to evaluate groundwater quality through analytical monitoring of pollutants to enhance sustainable water management and conserve vital resources. This involves updating parameter selection for the WQI, addressing emerging contaminants, and aligning with regulatory standards. The methodology integrates fieldwork, laboratory analysis, data processing, and spatial mapping for a comprehensive evaluation of groundwater quality. Its key contributions include detailed insights into physicochemical parameters, geospatial assessments using GIS-RS techniques, and standardized measures through the WQI. This focus benefits northeastern Algeria’s agricultural development and regional water management and conservation efforts. The study’s reliable methodology and detailed analysis contribute significantly to environmental sciences, aiding decision-makers in formulating effective management strategies for aquifer protection.
2. Study Area
The upstream Bousselam sub-watershed spans an area of approximately 1776.84 square kilometers within the larger Soummam watershed (
Figure 1a,b). It is bordered by the Chott Beïda sub-watershed to the east, the Soubella sub-watershed to the south, and the K’sob and Middle Bousselam sub-watersheds to the west. To the north, it is adjacent to the Dehamcha and Agrioun sub-watersheds (
Figure 1c).
Diversified agricultural activities are prevalent in the area, with Northern regions engaging in mountain agriculture, apiculture, and tree farming, while the Central and Southern regions focus on extensive farming, cereal cultivation, fallow land, and livestock rearing. Industrial activities, which are concentrated around Setif and Aїn Oulmene cities, include agribusiness, wood processing, paper production, leather manufacturing, textiles, plastics, chemicals, glass production, metallurgy, mechanical, electrical, and hydraulic engineering, quarrying, construction materials, and public works.
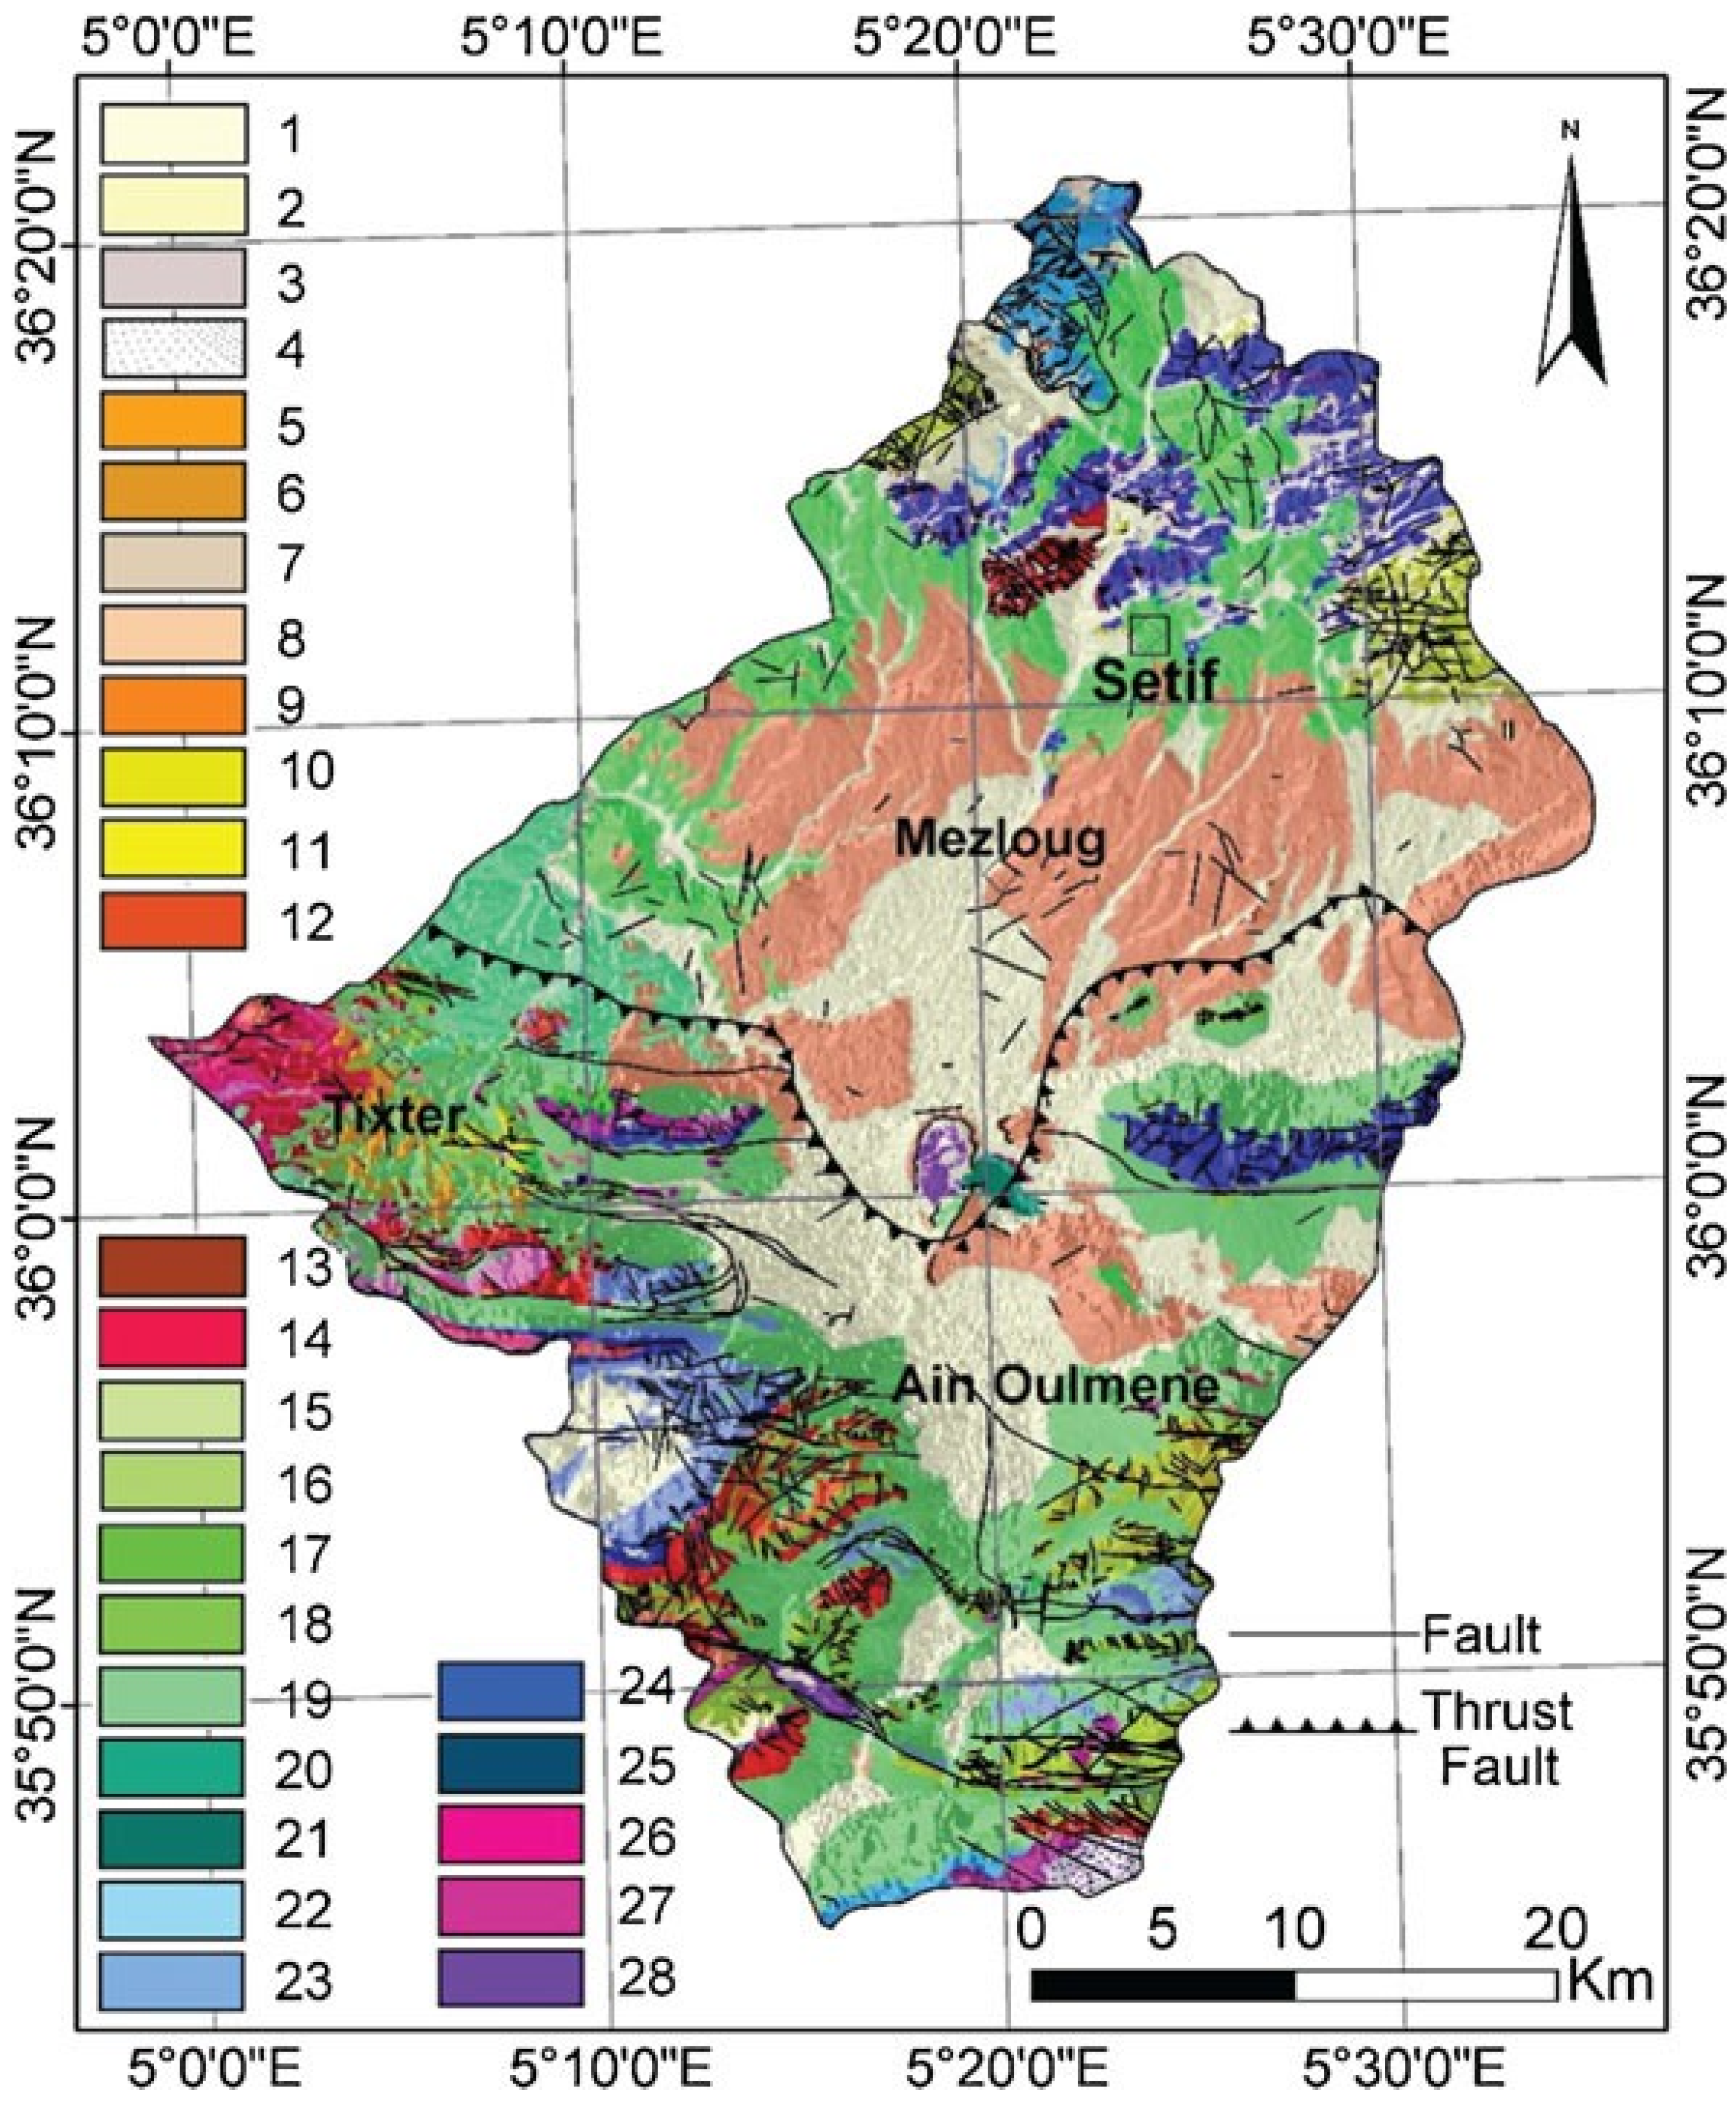
The study area exhibits a continental to semi-arid climate with distinct seasonal patterns. The region experiences a rainy, cold season from September to May, succeeded by a dry, hot season for the remainder of the year. Over the past five decades (1973–2023), the annual average rainfall has varied from 550 mm in the North to 300 mm in the South. January stands out as the coldest month, with an average temperature of 5.4 °C, while the highest temperatures (averaging 26.3 °C) are recorded for July. Hydrogeologically, carbonate formations from the Lower and Upper Cretaceous periods constitute the main aquifers, with a Mio-Plio-Quaternary shallow aquifer, and a deep karstic aquifer that contributes significantly to the region’s water resources. The geological setting includes Numidian thrust sheets, Tellian thrust sheets, a South-Setifian allochthonous set, a South-Setifian autochthonous set, and a non-tectonic set, comprising sedimentary formations composed of limestone, marl, clay, sandstone, dolostone, and quaternary deposits (
Figure 2).
3. Materials and Methods
The study of groundwater chemistry plays a crucial role in monitoring the changes in dissolved elements, determining their origins, and evaluating water quality for diverse applications. Additionally, it aids in identifying areas vulnerable to contamination, contributing to improved water resource management strategies.
The methodology adopted for this research comprises field sampling, laboratory analysis, WQI calculation, and spatial mapping, as shown in the flowchart in
Figure 3.
To analyze physicochemical parameters, we followed the methodology established by Rodier et al. [
26]. Water samples were collected from farmers’ wells (
Figure 1d) (
Table 1) in March 2022, following standard protocols [
27]. Sampling involved collecting samples after 15 min of pumping from 16 wells using 1.5 L sterile polyethylene containers. In situ measurements of temperature, electrical conductivity (EC), and pH were conducted using a WTW cond 3110 device. The samples were then stored at 4 °C to maintain their integrity until they were transported for analysis. The analysis included determining concentrations of calcium (Ca
2+), magnesium (Mg
2+), bicarbonate (HCO
3−), and chloride (Cl
−) through volumetric titration methods. Calcium and magnesium were titrated with 0.01 N EDTA, while bicarbonate and chloride were analyzed using HCl and AgNO
3, respectively. Sodium (Na
+) and potassium (K
+) concentrations were measured using Atomic Absorption Systems Agilent Technologies 200 series AA. Sulfate (SO
42−), ammonium (NH
4+), and nitrates (NO
3−) were analyzed calorimetrically with visible UV/vis ODYSSEY DR 2500 spectrophotometry. Each parameter was analyzed at least twice to ensure accuracy. The analyzed water chemistry data were used to determine water quality variables and calculate the WQI.
We used a 30 m resolution DEM to delineate the basin and its hydrological features. Data processing and visualization were done using Excel-StatPro 7.0, and ESRI-ArcGIS 10.8 software. The calculation of saturation indices for dissolved minerals was performed using the WATEQ 4F software. Diagram tools aided in calculating saturation and Base Exchange indices, while hydrochemical facies and water classification models (Riverside, Stabler, Piper, Wilcox) were generated using OriginPro v9.7 software.
Water quality was assessed using a standard WQI method [
28,
29] and ranked into five categories: excellent, good, medium, poor, and extremely poor [
30,
31], (
Table 2). This classification serves as a decision-making tool for assessing groundwater quality across various applications, consolidating diverse data into a single metric. The calculation methodology involved a weighted arithmetic index for water type classification and compared chemical concentrations of the analyzed water samples against the Algerian Drinking Water Standards (ADWS), (
Figure 3).
3.1. Relative Weight Assignment
Each physicochemical parameter of water is assigned a relative weight (Wi) using Equation (1):
where Wi is the relative weight of the (i
th) parameter, Si is the standard value of the applicable norm, and K is the proportionality constant, which is determined using Equation (2):
The calculation of the relative weight (Wi) in Equation (1) considers the ratio between the standard value (Si) and the proportionality constant (K). This weight reflects the significance of each parameter in influencing the overall water quality index, with higher weights indicating a greater impact on water quality assessment.
Accurate determination of relative weights is crucial for precise water quality assessment, considering factors like environmental context, potential health risks, and regulatory standards. Careful consideration of these factors ensures that the assigned weights align with the actual impact of each parameter on water quality assessment.
Utilizing these relative weights in the overall water quality index calculation appropriately weighs the contribution of each parameter, providing a comprehensive and objective assessment of water quality.
3.2. Quality Assessment Scale (qi)
A quality assessment scale (qi) is computed for each parameter using Equation (3):
where q
i is the water quality rating (scale) of the (
ith) parameter, c
i is the concentration of each parameter in mg/L, and (s
i) is the standard value of the applicable norm. The q
i scale enables independent assessment of parameter quality, with higher values indicating degraded water quality and lower values indicating better quality, such as that observed in pure water with low concentrations.
Quantitative assessment through the quality assessment scale allows for a detailed understanding of individual parameters’ contributions to the overall water quality index. This information aids in prioritizing remediation efforts and identifying potential contamination sources.
3.3. Water Quality Index
The WQI was used to assess the suitability of water resources for domestic use, focusing on key quality metrics [
32]. The calculation of WQI is performed as shown in Equation (4) [
22].
where Wi is the weight assigned to each parameter, with n indicating the total parameters considered. The Wi term signifies the relative weight for each parameter, while qi assesses the overall water quality.
3.4. Water Quality Index Mapping
The development of the WQI map involves using physicochemical parameters from water sampling points and processing them through GIS using inverse distance weighting interpolation. This approach offers precise spatial visualization of water quality across the studied region.
3.5. Water Suitability for Irrigation
Irrigation water quality, determined by dissolved salts’ (Na, Cl, Mg, Ca, K) type and concentration, significantly impacts soil salinization. These salts originate from natural sources like rock and soil weathering, as well as anthropogenic sources such as domestic and industrial discharges. Evaluation of water suitability for irrigation employs two simplified methods.
The Riverside method [
33] assesses soil salinization risk using the Sodium Adsorption Ratio (SAR) in Equation (5):
The Wilcox method (Equation (6)) [
20] considers Ca
2+, Mg
2+, K
+, and Na
+ concentrations for classifying water into five categories (excellent, good, permissible, mediocre, and poor) (
Table 3). A graphical representation illustrates the sodium percentage (Na
+%) and electrical conductivity relationship, which is crucial for understanding irrigation water’s impact on plant growth.
3.6. Base Exchange Index
The Base Exchange Index (BEI), introduced by Schoeller [
35], provides an estimation of the ion exchange process between water and the underlying geological formations. It measures the ratio of exchanged ions to the initially present ions of the same nature in the water. The calculation is performed using Equation (7):
where concentrations are expressed in meq/L.
The interpretations of the BEI values are as follows:
BEI = 0: No ion exchange.
BEI > 0: Sodium (Na+) and potassium (K+) ions in the water are exchanged for calcium (Ca2+) and magnesium (Mg2+) ions in the rock (direct exchange).
BEI < 0: Calcium (Ca2+) and magnesium (Mg2+) ions in the water are exchanged for sodium (Na+) and potassium (K+) ions in the rock (reverse exchange).
3.7. Saturation Index
The Langelier Saturation Index (LSI) is used to assess the tendency of water to be aggressive or to cause scaling [
36]. It is calculated by subtracting the actual water (pH) from the predetermined equilibrium (pHs) using Equation (8):
In the case of LSI:
SI < 0: pH < pHs, indicating aggressive water.
SI > 0: pH > pHs, indicating scaling water.
SI = 0: pH = pHs, indicating a state of equilibrium.
pH is measured as the logarithm of the concentration of H⁺ or H
3O⁺ ions (mg/L), as shown in Equation (9) [
37].
where the concentration of H
3O
+ is expressed in mg/L.
The Langelier Saturation Index (LSI), ref. [
38] is calculated using Equation (10).
where pH represents the actual pH measurement of the water. pHs is the saturation pH in calcite or calcium carbonate, according to Hallopeau and Dubin’s method [
39], and is calculated based on Equation (11):
C is a constant that is dependent on water mineralization and temperature [C = log K’s − log K’2 + 9.2]. Alc and CaO represent total alkalinity (TAC) and calcium content, both of which are expressed in mg/L of CaO.
The obtained grades could be divided as follows. If LSI > 0, it indicates scaling or incrustation in water. If LSI < 0, it indicates aggressive or corrosive water. And if LSI = 0, the water is at equilibrium, saturated with CaCO3, implying that no deposits are formed or dissolved. In our case, the measured pH values were inputted into the “Diagram” program. And the software calculated the index automatically.
The total hardness (TH) of water, measured in (°F), reflects the concentrations of calcium and magnesium in meq/L, as determined by Equation (12).
where “TH” represents the total Hardness of the water and “r” represents the stoichiometric coefficient of calcium and magnesium ions in the water sample. It signifies the proportion of these ions contributing to the total hardness (TH) calculation, where their concentrations are measured in (meq/L).
Based on the calculated TH, water levels are structured in the following categories: Water is classified as very soft when TH ranges from 0 to 7 °F, soft between 7 and 15 °F, moderately hard within 15 to 30 °F, hard between 30 and 40 °F, and very hard if TH exceeds 40 °F.
4. Results and Discussion
4.1. Physicochemical Parameters
The results shed light on key physicochemical parameters of the groundwater samples, offering insights into their quality and potential impacts on water resources.
Temperature Influence: Water temperature affects analytical parameters, notably conductivity, and can indicate the water’s origin and flow dynamics. The measured temperatures range from 15.4 to 17.9 °C and fall within acceptable standards, suggesting a protective shield against ambient temperature influences.
pH Levels: The pH values, ranging from pH 6.5 to pH 7.5 across the wells, indicate a neutral to slightly alkaline nature of the groundwater in the study area.
Electrical Conductivity: EC, an indicator of dissolved salt content, shows variations from 1042 µS/cm to 1613 µS/cm, reflecting mineralization levels. Higher EC values, particularly in central and western areas, suggest prolonged contact with geological formations, influencing water quality.
Total Hardness: TH values range from hard to very hard. This could be attributed to the carbonate leaching, highlighting the potential challenges that might arise in relation to certain uses due to hardness levels.
Elemental Composition: Naturally occurring elements generally meet WHO and ADWS standards. However, elevated chlorides and nitrates, likely resulting from wastewater discharge, exceed guidelines. Anthropogenic sources contribute to high phosphate and ammonium levels, surpassing recommended limits.
The analysis of 16 well-water samples revealed elevated levels of phosphate (PO4−) and ammonium (NH4+), ranging from 11.22 mg/L to 18.76 mg/L for phosphate and 2.37 mg/L to 5.72 mg/L for ammonium. These concentrations surpass the Algerian Drinking Water Standards (ADWS) of 0.4 mg/L for phosphate and 0.3 mg/L for ammonium, signaling a significant deviation from regulatory norms with potential risks to human health and the environment. Immediate action is needed to address these exceedances and implement effective mitigation strategies, including improving wastewater treatment and adopting sustainable agricultural practices, to ensure the safety and sustainability of water resources.
The results underscore the complexity of groundwater quality, which is influenced by natural geological processes and anthropogenic activities. Elevated mineralization, hardness, and pollutant levels, particularly with regard to the presence of chlorides, nitrates, phosphates, and ammonium, signify potential risks to water suitability for various uses. Effective management strategies are crucial to mitigate these impacts; such strategies include implementing wastewater treatment measures, controlling industrial discharges, and promoting sustainable agricultural practices to safeguard groundwater quality and ensure long-term water resource sustainability.
Table 4 summarizes the water geochemistry analysis conducted on the collected samples, whereas
Table 5 showcases the calculated relative weight of the physicochemical parameters, helping to assess their significance in the overall water quality assessment.
4.2. Water Classification
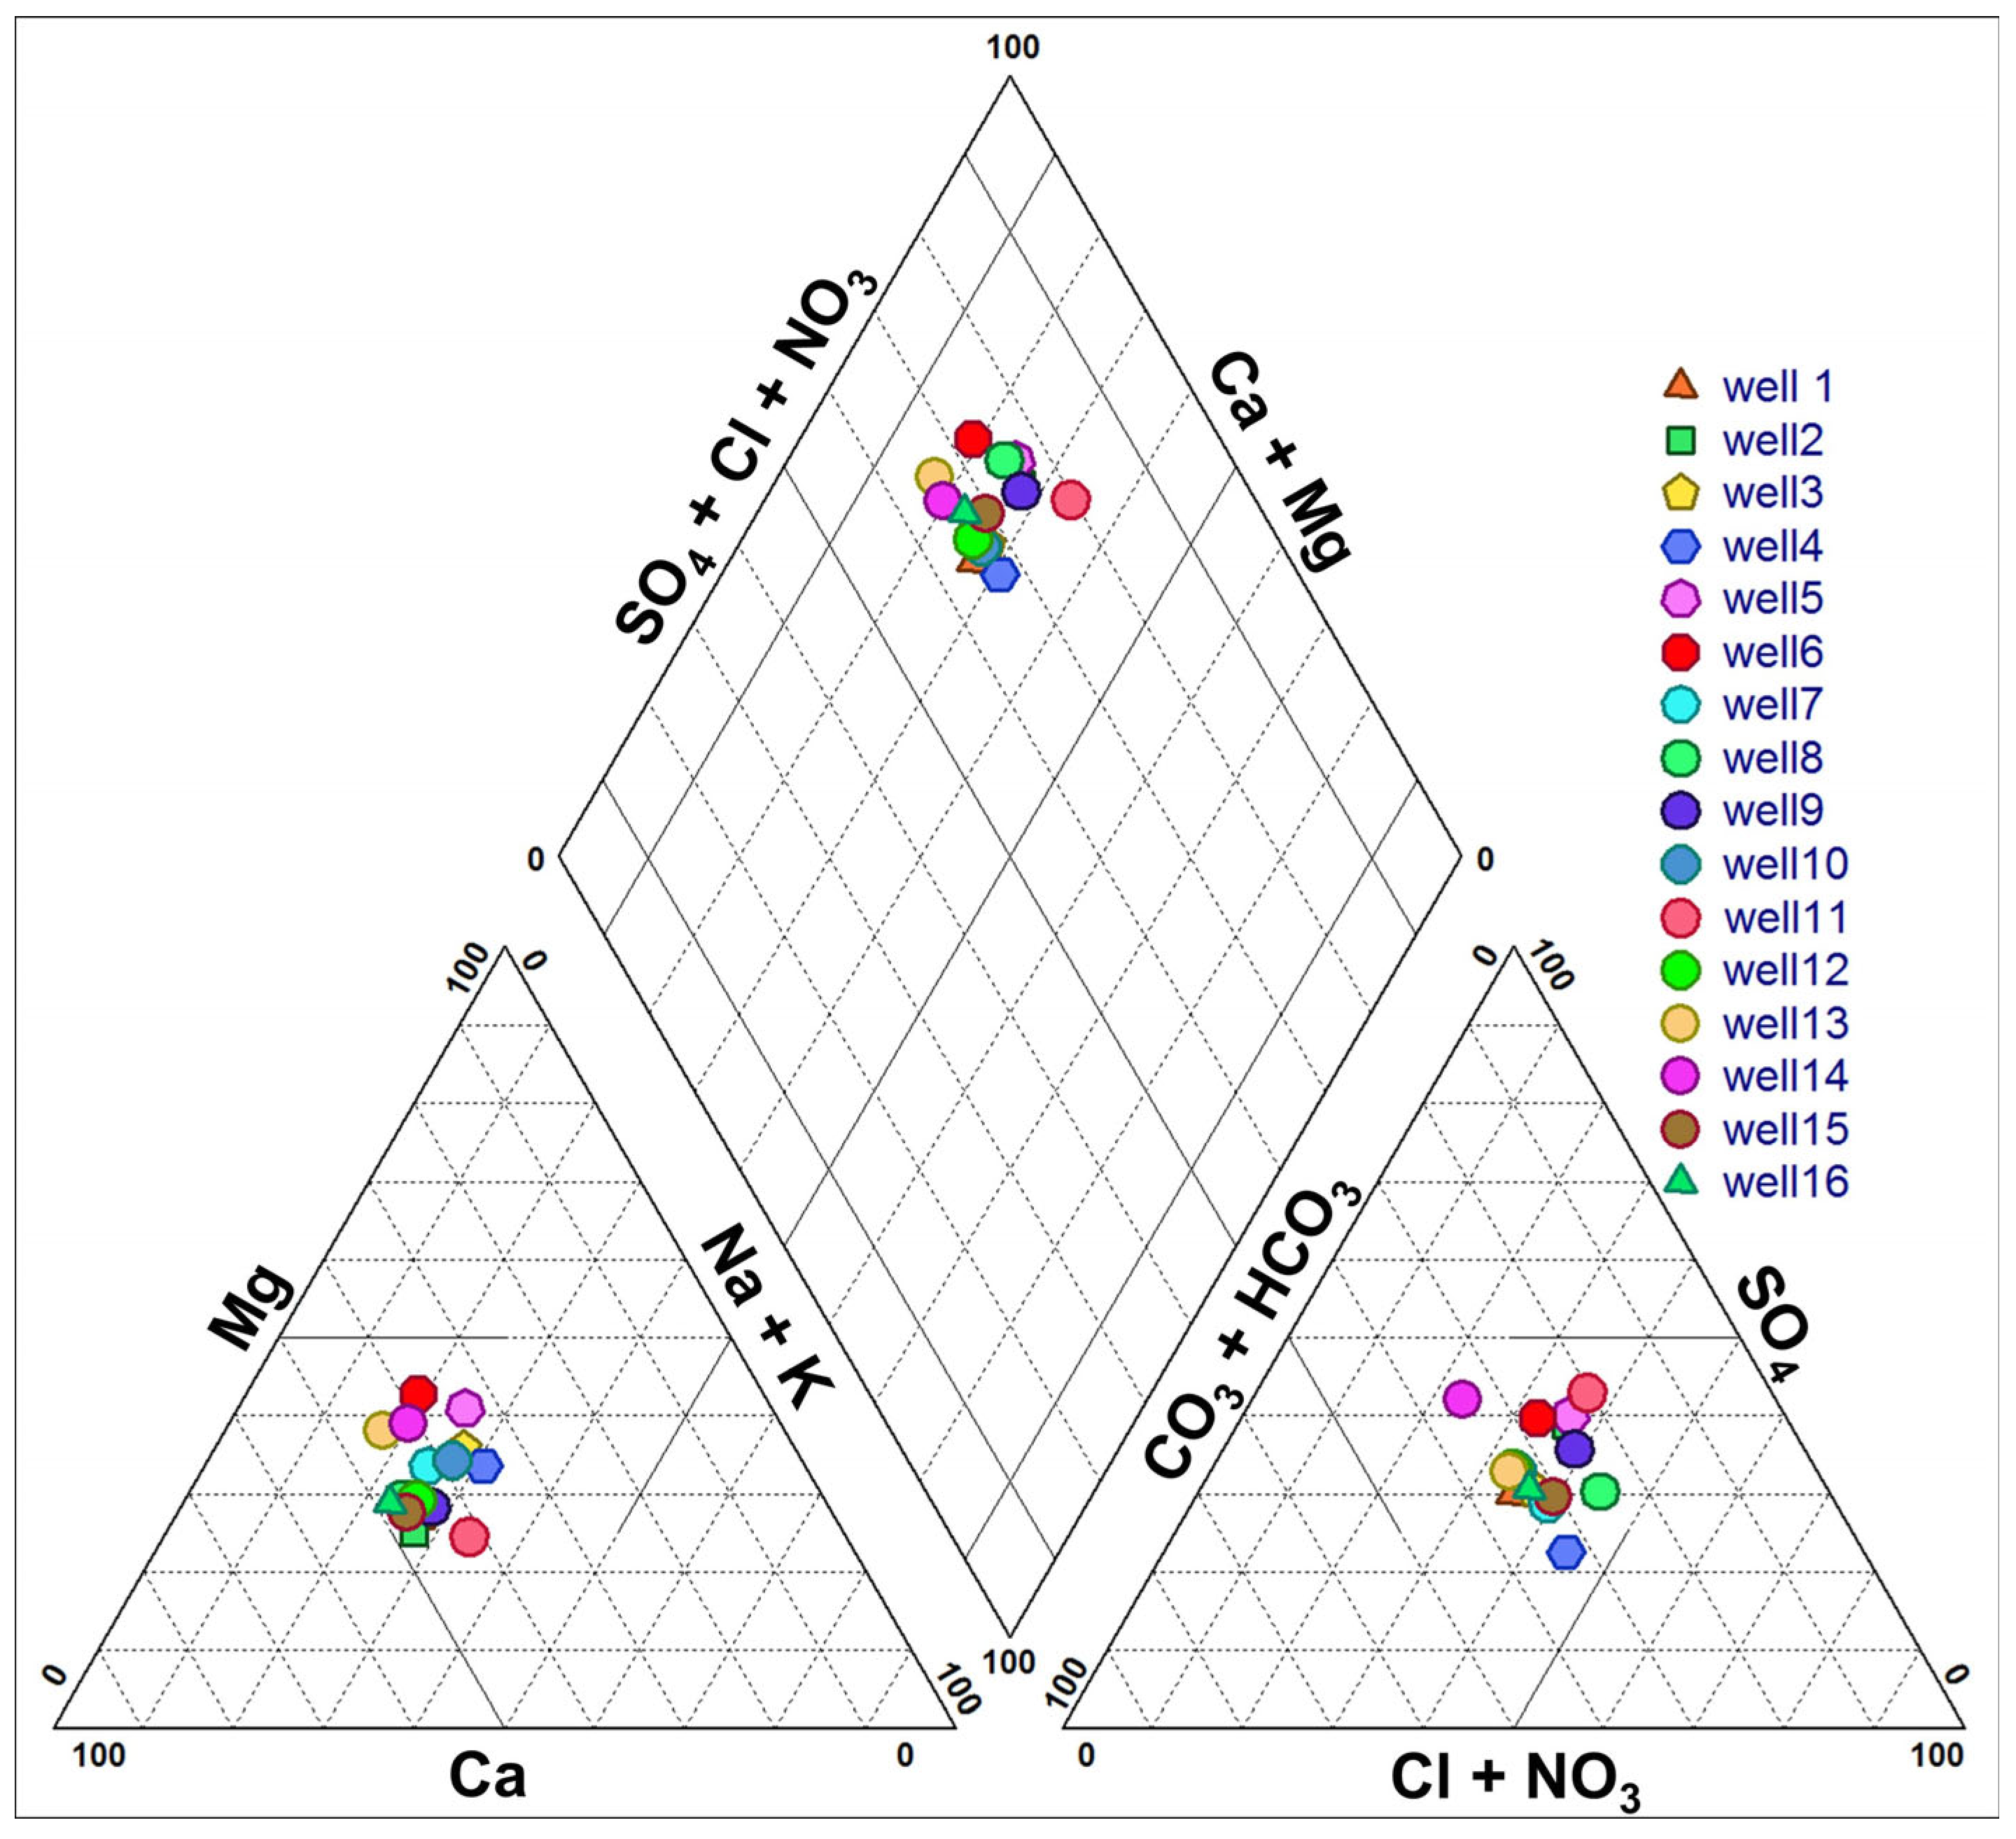
The graphical representation using the Piper diagram reveals the presence of four facies types, with a predominance of the chloride–calcium facies, accounting for approximately 7 out of 16 water sampling points (
Figure 4). The chloride–calcium facies (37%) is observed in wells P2, P3, P4, P5, P11, and P12, which are located in the Northeastern part of the study area. The presence of chlorides can be attributed to the occurrence of Miocene gypsum marls or domestic pollution infiltrated by waters from the Boussellam Wadi.
The bicarbonate–calcium facies (31%) is observed in wells P1, P10, P12, P13, and P16, which could be attributed to the surrounding Cretaceous carbonate formations. The process of water infiltration and percolation through soils can lead to increased bicarbonate and calcium concentrations. The sulfate–calcium facies (19%) are likely the result of gypsum dissolution present in the Miocene marls, as well as anthropogenic inputs such as industrial waste and agricultural nutrients. The magnesium-sulfate facies (13%) are observed in wells P6 and P7 in the southwest of the study area, which is attributed to the dissolution of sulfates (gypsum marls) and dolomite.
4.3. Base Exchange Index
With the exception of well 14, which shows a negative value, all water sampling points exhibit positive values (
Table 6). This suggests that the sodium and potassium ions in the water are being exchanged for calcium and magnesium ions in the rock mass (direct exchange).
4.4. Saturation Index
The study utilized WATEQ software [
40] to calculate the saturation indices of dissolved minerals, revealing a chemical evolution in the study region. Water in the area is oversaturated with carbonate minerals but undersaturated with evaporitic minerals. Carbonate minerals, particularly dolomite, tend to precipitate, indicating water’s aggressiveness in dissolving these minerals to achieve equilibrium.
4.5. Water Quality Index
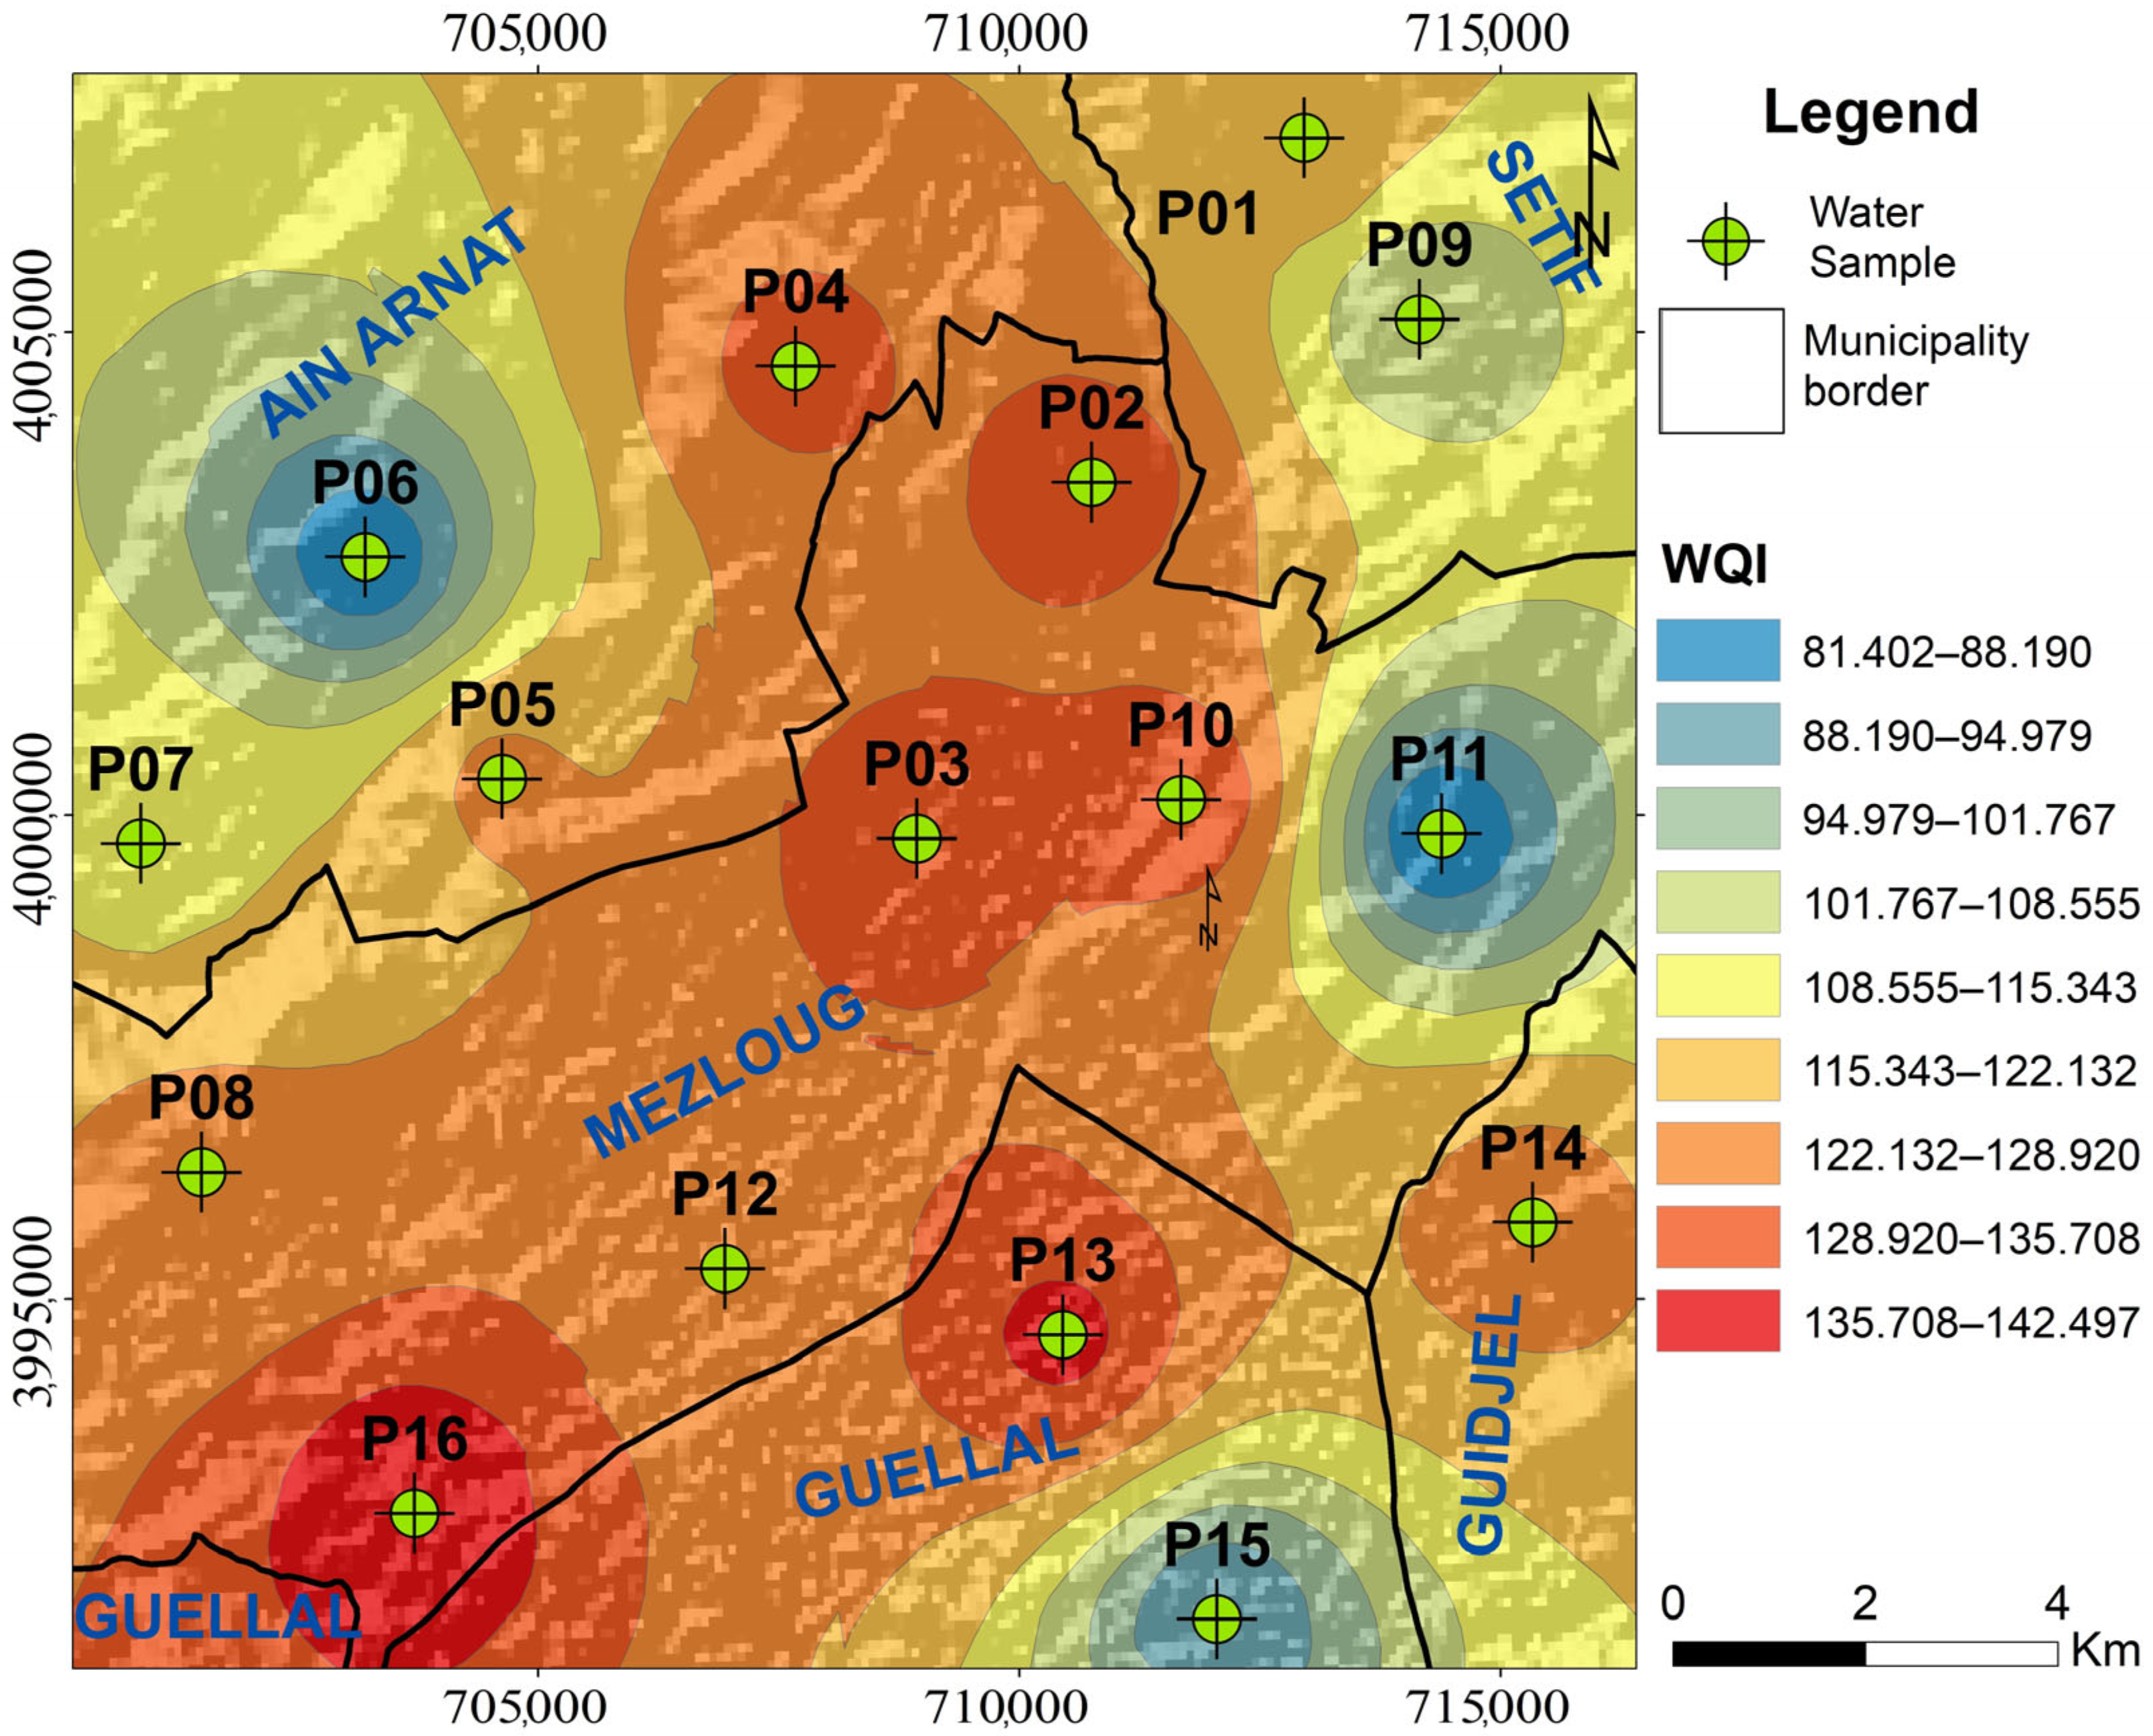
The calculated WQI values (
Table 7) were used to create a groundwater quality map based on the spatial distribution of various indices (
Figure 5 and
Figure 6). These three tools allow for the classification of the studied groundwater, ranging from poor quality for wells P6, P11, and P15 to very poor quality for the remaining wells. This alarming degradation of water, caused by various anthropogenic sources of pollution, necessitates the inevitable implementation of a protective perimeter for the entire Boussellam watershed and rigorous and continuous monitoring of various activities.
4.6. Suitability of Water for Irrigation
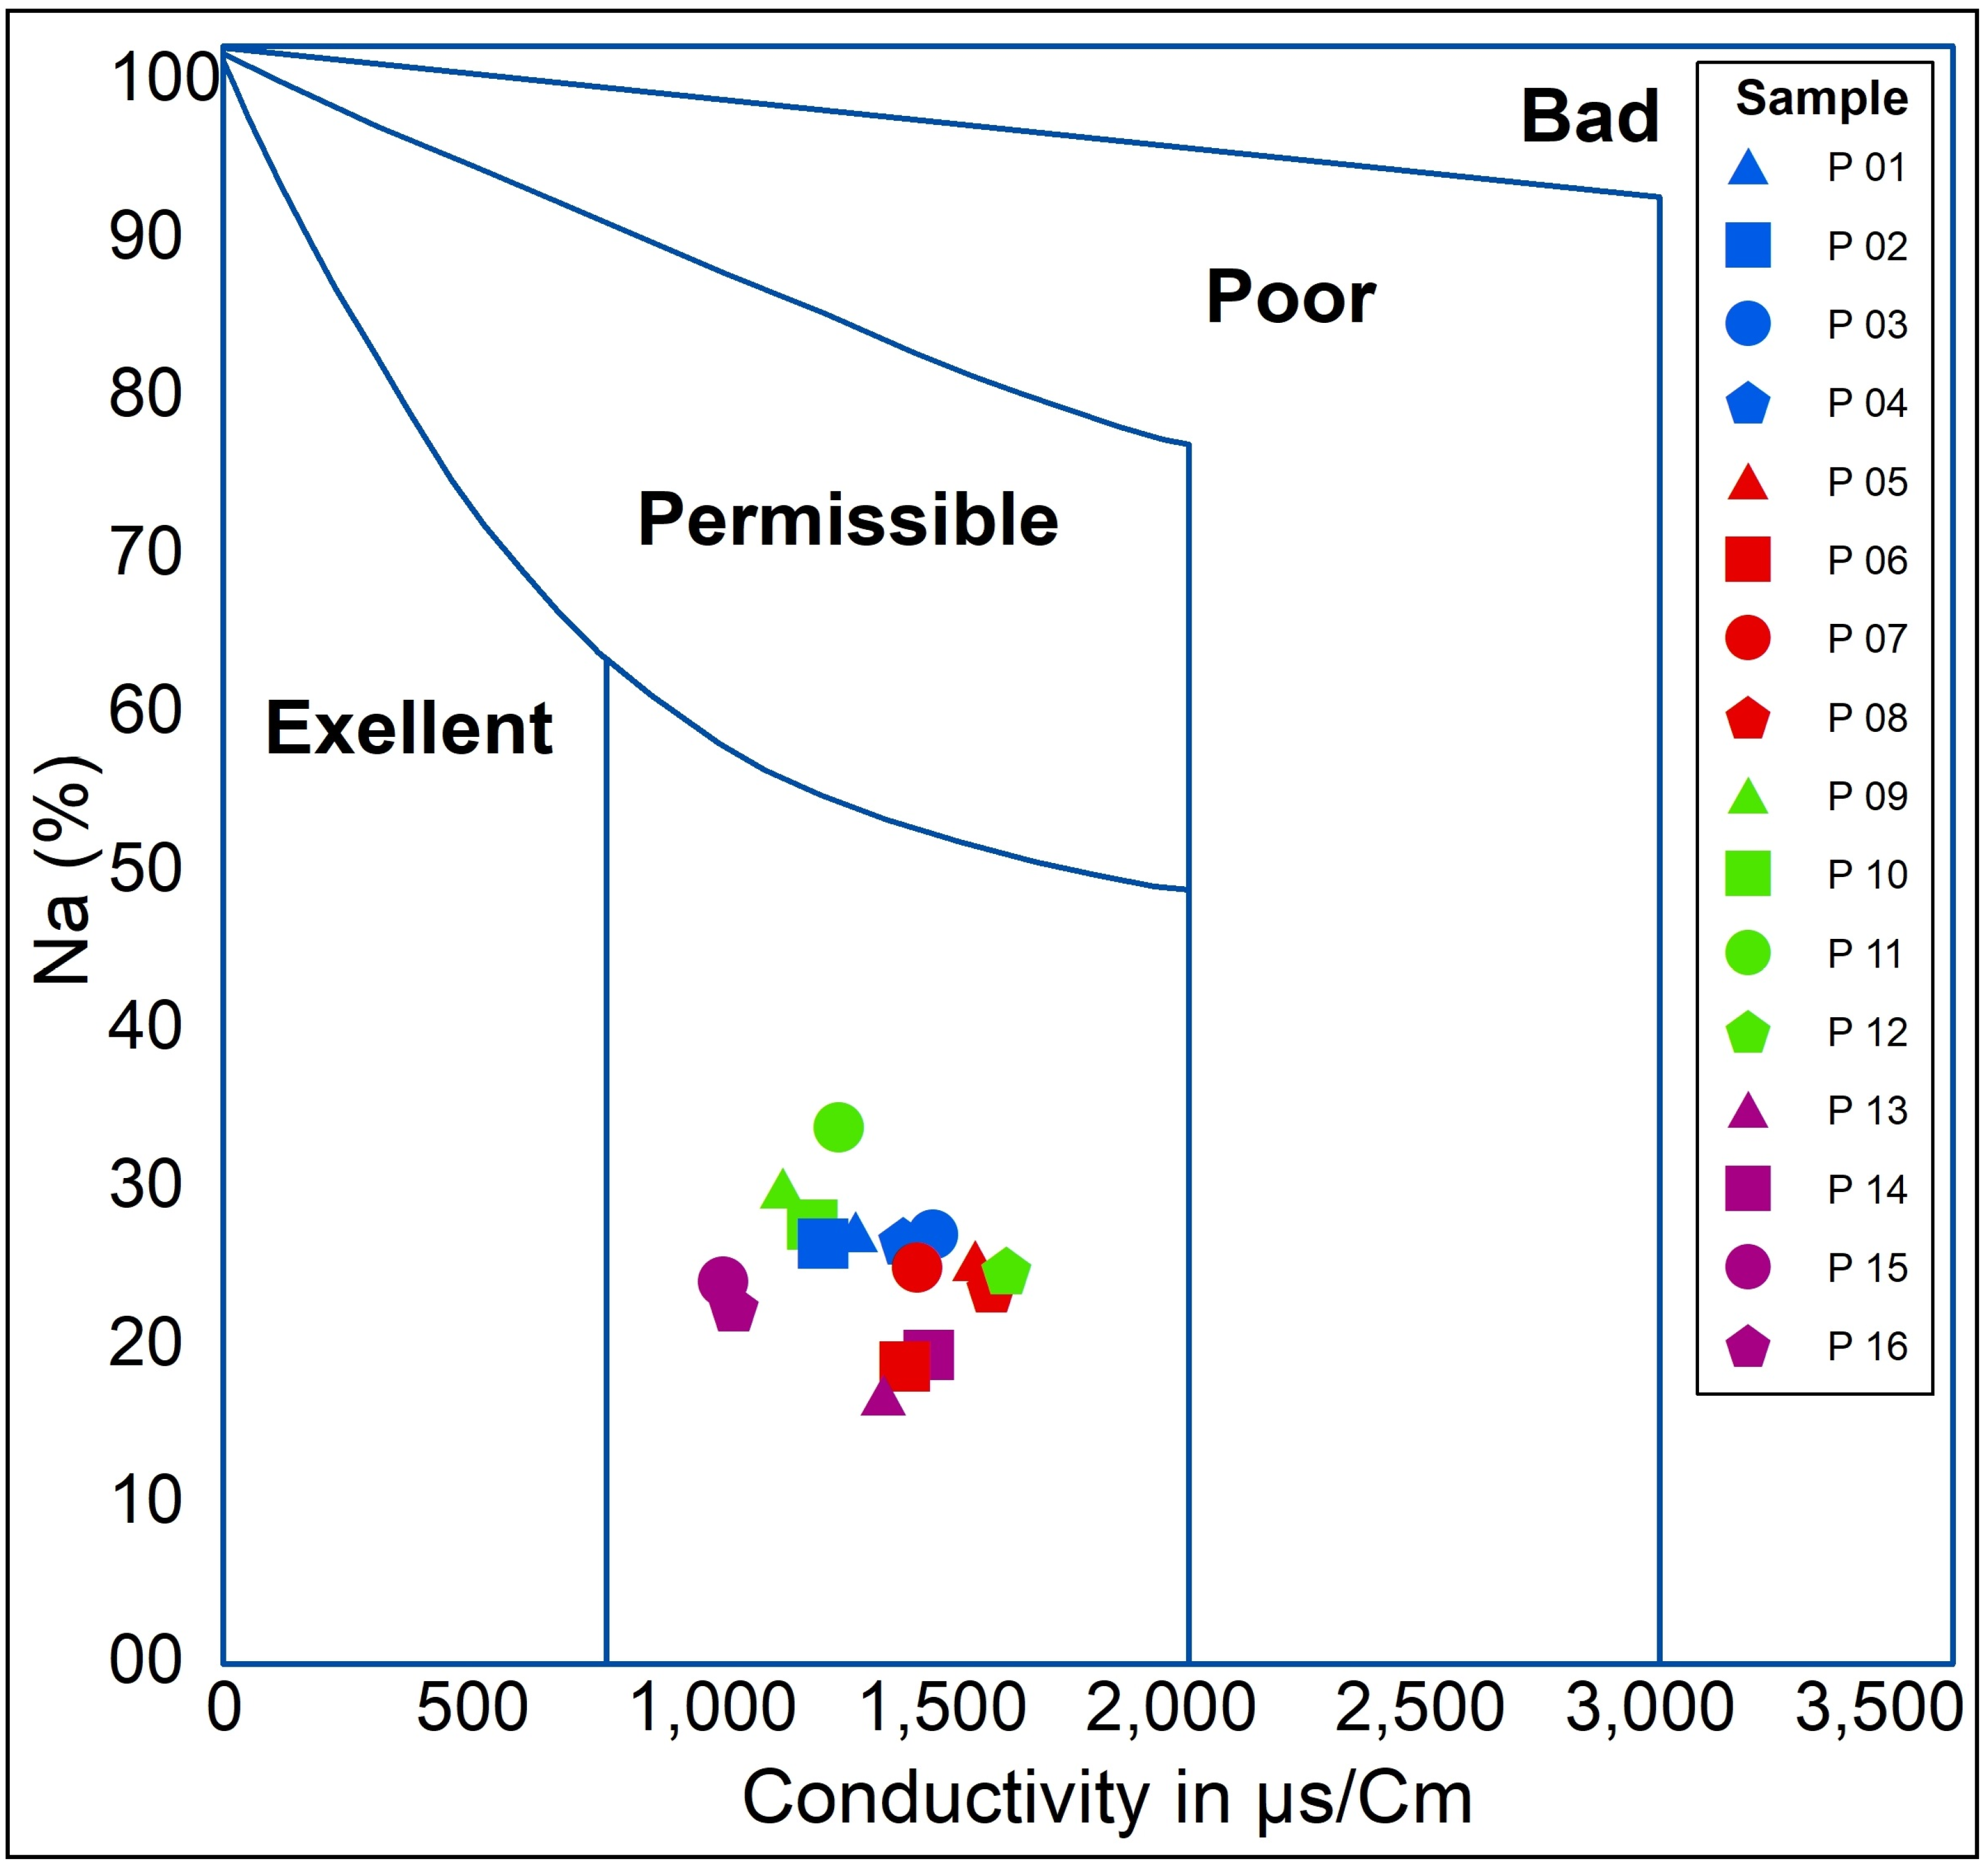
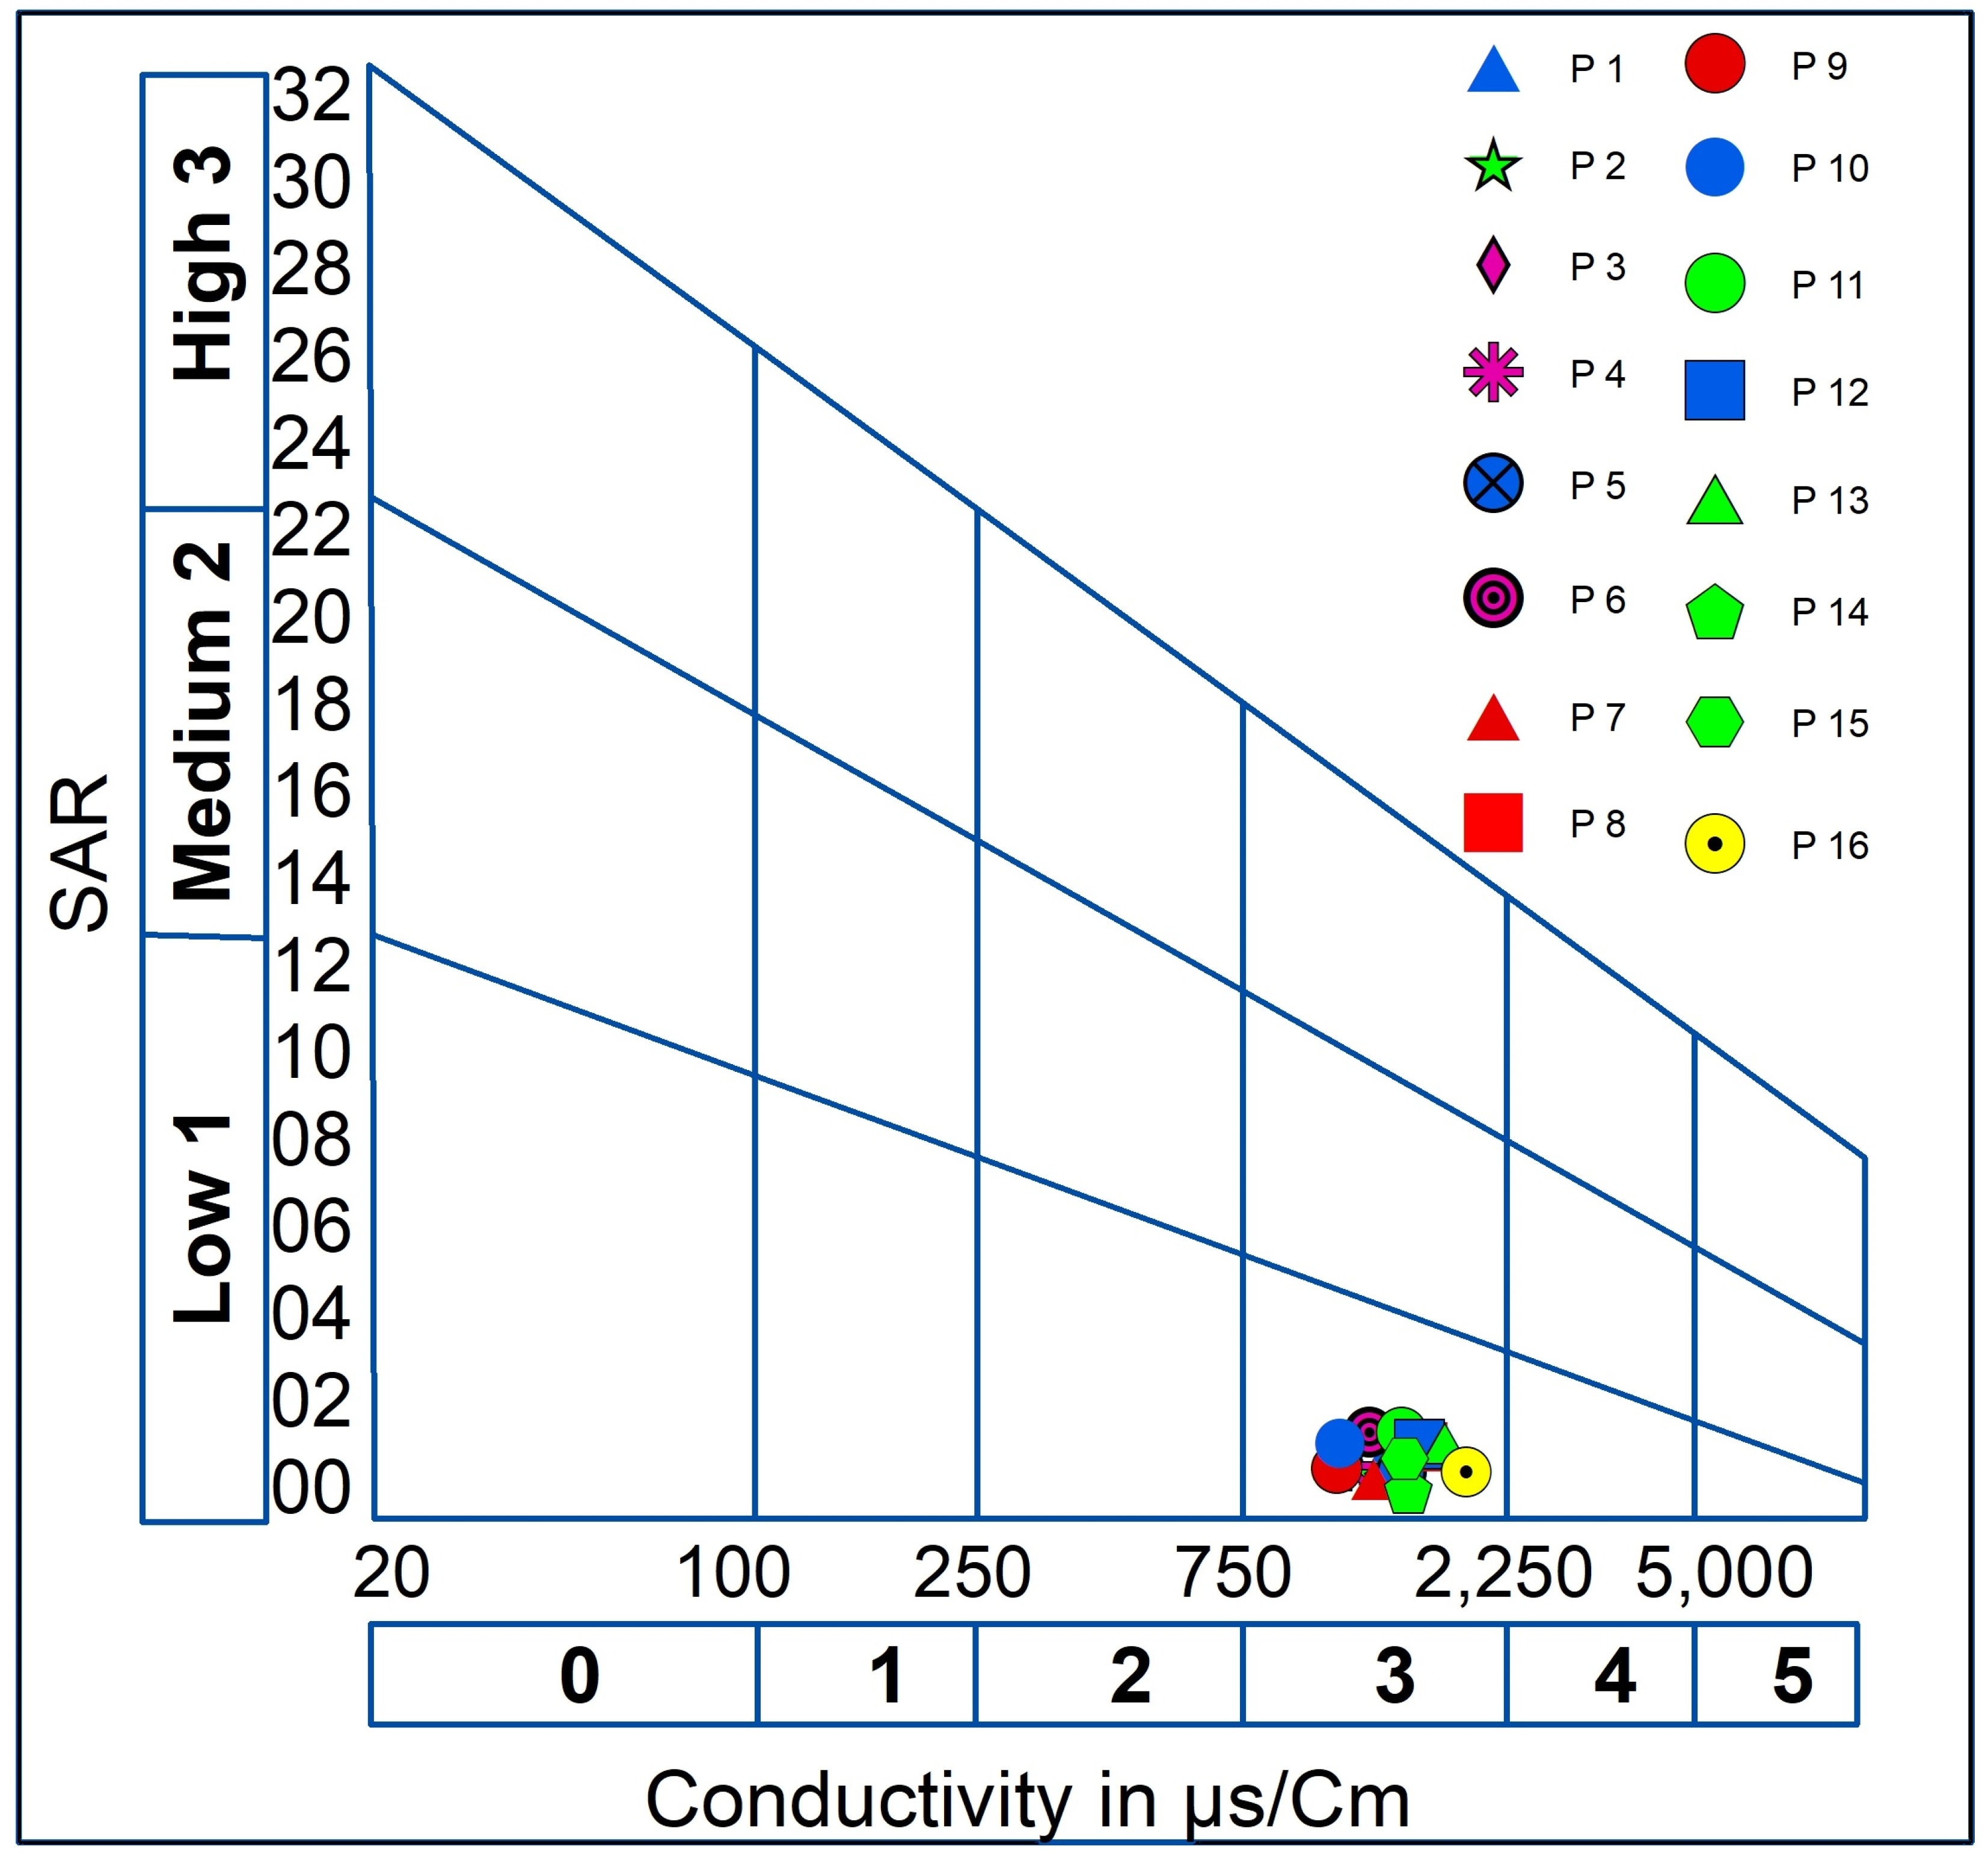
The graphical representation in the Wilcox diagram indicates that the water quality is sufficient for irrigation purposes (
Figure 7). According to the classification based on the Riverside Alkali Index (
Figure 8), the water falls into the C3-S1 class, which is considered acceptable for irrigation of crops that can tolerate salts in well-drained soils.
The diagram of Wilcox and Riverside suggests that the groundwater in the study area is suitable for irrigation purposes, without risk of alkalization and blocking of soil pores, and therefore it necessitates waterproofing, as described in [
38], which is provided to implement adequate drainage and continually monitor the salt level in the soil.
Both natural and artificial recharge significantly affect groundwater quality. Natural recharge occurs through processes like precipitation, infiltration, and percolation, while artificial recharge involves human activities such as irrigation, injection wells, or intentional recharge basins.
Returned irrigation flow, also known as agricultural runoff, can lead to salinization of groundwater. This happens when water containing dissolved salts, fertilizers, pesticides, or other contaminants seeps into the groundwater after being discharged onto the land. Over time, the accumulation of salts and pollutants can degrade groundwater quality, rendering it unsuitable for various purposes.
Besides salinization, natural recharge can introduce sediments, nutrients, and pollutants into groundwater through surface-water runoff. Geological processes like weathering or leaching of minerals from rocks and soils can also alter groundwater’s chemical composition.
Artificial recharge can contribute to groundwater contamination if improperly treated wastewater or untreated sewage is discharged into the ground, introducing pathogens, organic compounds, heavy metals, or other pollutants. Industrial activities, if not properly managed, can also result in groundwater pollution as pollutants infiltrate the groundwater. In urban areas with impervious surfaces, stormwater runoff carries pollutants like oil, heavy metals, or chemicals into the groundwater.
To mitigate these impacts on groundwater quality, several measures can be taken. These include adopting best management practices in agriculture to minimize the use of fertilizers and chemicals and implementing precision irrigation techniques to reduce water and chemical runoff. Proper wastewater treatment processes should be employed to remove contaminants before discharging treated water into the ground.
Establishing buffer zones or vegetative barriers can act as filters, preventing contaminants and sediments from reaching the groundwater. Regular monitoring and water quality assessments are essential for identifying changes or trends in groundwater quality and enabling timely actions.
5. Conclusions
The hydrogeochemical study aimed to characterize groundwater in the study area and assess its suitability for various uses, including human consumption and irrigation. The presence of bicarbonates, chlorides, sulfates, calcium, and magnesium in the groundwater was primarily attributed to natural sources such as leached geological formations, but potential anthropogenic pollution was also identified. The waters exhibited tendencies towards equilibrium, particularly in evaporitic elements, and precipitation of carbonate elements, which was facilitated by direct ion exchange processes.
However, the analysis of the Water Quality Index (WQI) indicated significant pollution levels throughout the region, rendering the water unsuitable for human consumption. Nevertheless, the use of Richarde and Wilcox diagrams classified the water as suitable for irrigation with caution.
To address the identified challenges, urgent remediation measures are necessary to combat the observed high pollution levels in groundwater. This includes implementing control measures to regulate and reduce anthropogenic activities that contribute to pollution. Advanced wastewater treatment systems should be adopted to minimize contaminant input.
Establishing appropriate protection perimeters around groundwater sources is crucial to prevent further contamination, and strict enforcement and regular monitoring of these parameters are essential.
Optimizing water management practices is vital for sustainable resource use. This includes promoting water conservation, efficient irrigation techniques, and the reuse of treated wastewater for non-potable purposes whenever feasible.
Continuous monitoring of groundwater quality is necessary to track long-term changes in chemical composition and assess the effectiveness of implemented measures. This requires the establishment of a well-distributed network of monitoring wells.
Further research should explore advanced treatment technologies and innovative methods like membrane filtration and bioremediation to develop sustainable and cost-effective remediation strategies.
Raising public awareness about groundwater protection, responsible water management, and pollution risks is crucial. Engaging stakeholders in these efforts will foster collective action aimed at preserving groundwater resources.
Implementing these recommendations can mitigate pollution, protect groundwater sources, and ensure the long-term sustainability and quality of water resources for present and future generations.
Author Contributions
K.B. and Y.H.; methodology, K.Z.; software, R.H.; validation, M.G., Y.H. and R.H.; formal analysis, K.Z.; investigation, K.B.; resources, M.G.; data curation, K.B., M.B. and G.P.; writing—original draft preparation, R.H.; writing—review and editing, Y.H.; visualization, R.H.; supervision, Y.H.; project administration, R.H. All authors have read and agreed to the published version of the manuscript.
Funding
This research received no external funding.
Data Availability Statement
No new data were created.
Acknowledgments
The present study was conducted under the supervision of the IAWRSMB-Tunisia and the Laboratory of Applied Research in Engineering Geology, Geotechnics, Water Sciences, and Environment, Setif 1 University, Algeria.
Conflicts of Interest
The authors declare no conflicts of interest.
References
- Todd, D.K.; Mays, L.W. Groundwater Hydrology; John Wiley & Sons: Hoboken, NJ, USA, 2004. [Google Scholar]
- Besser, H.; Mokadem, N.; Redhouania, B.; Rhimi, N.; Khlifi, F.; Ayadi, Y.; Omar, Z.; Bouajila, A.; Hamed, Y. GIS-based evaluation of groundwater quality and estimation of soil salinization and land degradation risks in an arid Mediterranean site (SW Tunisia). Arab. J. Geosci. 2017, 10, 350. [Google Scholar] [CrossRef]
- Liu, Z.; Zhu, H.; Cui, X.; Wang, W.; Luan, X.; Chen, L.; Cui, Z.; Zhang, L. Groundwater quality evaluation of the Dawu water source area based on water quality index (WQI): Comparison between Delphi method and multivariate statistical analysis method. Water 2021, 13, 1127. [Google Scholar] [CrossRef]
- Hu, L.; Chen, L.; Li, Q.; Zou, K.; Li, J.; Ye, H. Water quality analysis using the CCME-WQI method with time series analysis in a water supply reservoir. Water Supply 2022, 22, 6281–6295. [Google Scholar] [CrossRef]
- Zhang, Q.; Xu, P.; Qian, H. Groundwater quality assessment using improved water quality index (WQI) and human health risk (HHR) evaluation in a semi-arid region of northwest China. Expo. Health 2020, 12, 487–500. [Google Scholar] [CrossRef]
- Adimalla, N.; Qian, H. Groundwater quality and contamination: An application of GIS. Environ. Earth Sci. 2023, 82, 423. [Google Scholar] [CrossRef]
- Karunanidhi, D.; Aravinthasamy, P.; Subramani, T.; Muthusankar, G. Revealing drinking water quality issues and possible health risks based on water quality index (WQI) method in the Shanmuganadhi River basin of South India. Environ. Geochem. Health 2021, 43, 931–948. [Google Scholar] [CrossRef] [PubMed]
- Chaudhuri, R.R.; Sharma, P.; Kansal, A. Reducing the water footprint of megacities in Asia: Addressing water reuse and groundwater recharge (case study of Delhi, India). In Urbanization in the Global South; Routledge: New Delhi, India, 2021; pp. 167–183. [Google Scholar]
- Karunanidhi, D.; Subramani, T.; Roy, P.D.; Li, H. Impact of groundwater contamination on human health. Environ. Geochem. Health 2021, 43, 643–647. [Google Scholar] [CrossRef] [PubMed]
- Ramalingam, S.; Panneerselvam, B.; Kaliappan, S.P. Effect of high nitrate contamination of groundwater on human health and water quality index in semi-arid region, South India. Arab. J. Geosci. 2022, 15, 242. [Google Scholar] [CrossRef]
- Raju, N.J. Arsenic in the geo-environment: A review of sources, geochemical processes, toxicity, and removal technologies. Environ. Res. 2022, 203, 111782. [Google Scholar] [CrossRef]
- Yin, S.; Xiao, Y.; Han, P.; Hao, Q.; Gu, X.; Men, B.; Huang, L. Investigation of groundwater contamination and health implications in a typical semiarid basin of North China. Water 2020, 12, 1137. [Google Scholar] [CrossRef]
- Allaoua, N.; Hafid, H.; Chenchouni, H. Exploring groundwater quality in semi-arid areas of Algeria: Impacts on potable water supply and agricultural sustainability. J. Arid Land 2024, 16, 147–167. [Google Scholar] [CrossRef]
- Marques, A.C.; Veras, C.E.; Rodriguez, D.A. Assessment of water policies contributions for sustainable water resources management under climate change scenarios. J. Hydrol. 2022, 608, 127690. [Google Scholar] [CrossRef]
- Kallel, A.; Ksibi, M.; Dhia, H.B.; Khélifi, N. (Eds.) Recent Advances in Environmental Science from the Euro-Mediterranean and Surrounding Regions. In Proceedings of the Euro-Mediterranean Conference for Environmental Integration (EMCEI-1), Sousse, Tunisia, 22–25 November 2017; Springer International Publishing: Cham, Switzerland, 22–25 November 2018. [Google Scholar] [CrossRef]
- Todd, D.K. Groundwater Hydrology, 2nd ed.; John Wiley and Sons, Inc.: New York, NY, USA, 2007. [Google Scholar]
- Horton, R. An index number system for rating water quality. J. Water Pollut. Control Fed. 1965, 37, 300–306. [Google Scholar]
- Rana, R.; Ganguly, R. Water quality indices: Challenges and applications—An overview. Arab. J. Geosci. 2020, 13, 1190. [Google Scholar] [CrossRef]
- Xue, B.; Wang, G.; Xiao, J.; Helman, D.; Sun, W.; Wang, J.; Liu, T. Global convergence but regional disparity in the hydrological resilience of ecosystems and watersheds to drought. J. Hydrol. 2020, 591, 125589. [Google Scholar] [CrossRef]
- Gao, Y.; Qian, H.; Ren, W.; Wang, H.; Liu, F.; Yang, F. Hydrogeochemical characterization and quality assessment of groundwater based on integrated-weight water quality index in a concentrated urban area. J. Clean. Prod. 2020, 260, 121006. [Google Scholar] [CrossRef]
- Akhtar, N.; Ishak, M.I.S.; Ahmad, M.I.; Umar, K.; Md Yusuff, M.S.; Anees, M.T.; Ali Almanasir, Y.K. Modification of the water quality index (WQI) process for simple calculation using the multi-criteria decision-making (MCDM) method: A review. Water 2021, 13, 905. [Google Scholar] [CrossRef]
- Mokadem, N.; Boughariou, E.; Mudarra, M.; Brahim, F.B.; Andreo, B.; Hamed, Y.; Bouri, S. Mapping potential zones for groundwater recharge and its evaluation in arid environments using a GIS approach: Case study of North Gafsa Basin (Central Tunisia). J. Afr. Earth Sci. 2018, 141, 107–117. [Google Scholar] [CrossRef]
- Benmarce, K.; Hadji, R.; Zahri, F.; Khanchoul, K.; Chouabi, A.; Zighmi, K.; Hamed, Y. Hydrochemical and geothermometry characterization for a geothermal system in semiarid dry climate: The case study of Hamma spring (Northeast Algeria). J. Afr. Earth Sci. 2021, 182, 104285. [Google Scholar] [CrossRef]
- Dandge, K.P.; Patil, S.S. Spatial distribution of groundwater quality index using remote sensing and GIS techniques. Appl. Water Sci. 2022, 12, 7. [Google Scholar] [CrossRef]
- Rodier, J.; Legube, B.; Merlet, N.; Brunet, R.; Mialocq, J.C.; Leroy, P. L’analyse de l’eau-9e éd. Eaux naturelles, eaux résiduaires, eau de mer. Dunod 2009, 564–571. [Google Scholar]
- Wilde, F.D. Water-Quality Sampling by the US Geological Survey-Standard Protocols and Procedures; 2010-3121; US Geological Survey: Reston, VA, USA, 2010. [Google Scholar]
- Zhang, Y.; Jia, R.; Wu, J.; Wang, H.; Luo, Z. Uncertain in WQI-based groundwater quality assessment methods: A case study in east of Beijing, China. Environ. Earth Sci. 2022, 81, 202. [Google Scholar] [CrossRef]
- Verma, A.; Yadav, B.K.; Singh, N.B. Hydrochemical monitoring of groundwater quality for drinking and irrigation use in Rapti Basin. SN Appl. Sci. 2020, 2, 460. [Google Scholar] [CrossRef]
- Amiri, V.; Rezaei, M.; Sohrabi, N. Groundwater quality assessment using entropy weighted water quality index (EWQI) in Lenjanat Iran. Environ. Earth Sci. 2014, 72, 3479–3490. [Google Scholar] [CrossRef]
- Muzenda, F.; Masocha, M.; Misi, S.N. Groundwater quality assessment using a water quality index and GIS: A case of Ushewokunze Settlement, Harare, Zimbabwe. Phys. Chem. Earth 2019, 112, 134–140. [Google Scholar] [CrossRef]
- Misstear, B.; Vargas, C.R.; Lapworth, D.; Ouedraogo, I.; Podgorski, J. A global perspective on assessing groundwater quality. Hydrogeol. J. 2023, 31, 11–14. [Google Scholar] [CrossRef]
- Richards, L.A. (Ed.) Diagnosis and Improvement of Saline and Alkali Soils (No. 60); US Government Printing Office: Washington, DC, USA, 1954. [Google Scholar]
- Al-Obaidi, B.H.; Mahmood, R.S.; Kadhim, R.A. Water quality assessment and sodium adsorption ratio prediction of Tigris River using artificial neural network. J. Eng. Sci. Technol. 2020, 15, 3055–3066. [Google Scholar]
- Scholler, H. Hydrodynamic Dam Lekar Collogue Doboronik 1; UNESCO: Paris, France, 1965; pp. 3–20. [Google Scholar]
- Langelier, W.F. The analytical control of anti-corrosion water treatment. J. Am. Water Work. Assoc. 1936, 28, 1500–1521. [Google Scholar] [CrossRef]
- Chapman, D.V. Water Quality Assessments: A Guide to the Use of Biota, Sediments and Water in Environmental Monitoring; CRC Press: Boca Raton, FL, USA, 2021. [Google Scholar]
- Subramani, T.; Elango, L.; Damodarasamy, S.R. Groundwater quality and its suitability for drinking and agricultural use in Chithar River Basin, Tamil Nadu, India. Environ. Geol. 2005, 47, 1099–1110. [Google Scholar] [CrossRef]
- Sembiring, A.; Irawan, A.P. Analysis of the potential of crust formation and corrosiveness in the Way Rilau PDAM Lampung distribution network using the Langelier Saturation Index method. IOP Conf. Ser. Mater. Sci. Eng. 2020, 852, 012040. [Google Scholar] [CrossRef]
- Hallopeau, J. Carbonic balances in water. Terre et Eaux, No. 35, 1960/61.
- Plummer, L.N.; Busenberg, E.; Riggs, A.C. In-situ growth of calcite at Devils Hole, Nevada: Comparison of field and laboratory rates to a 500,000 year record of near-equilibrium calcite growth. Aquat. Geochem. 2000, 6, 257–274. [Google Scholar] [CrossRef]
Figure 1.
(a) Geographical location of the major watersheds of North Algeria within the Mediterranean basin. (b) Overview of the Soummam–Bousselam watershed and its neighboring watersheds. (c) Upstream Bousselam and adjacent subwatersheds. (d) Indication of the positions of water sampling points.
Figure 1.
(a) Geographical location of the major watersheds of North Algeria within the Mediterranean basin. (b) Overview of the Soummam–Bousselam watershed and its neighboring watersheds. (c) Upstream Bousselam and adjacent subwatersheds. (d) Indication of the positions of water sampling points.
Figure 2.
The geological map of the study area. [Legend: 1—recent alluvium, 2—slope unconsolidated formations, 3—topsoil, 4—slopes screes, 5—limestone with flints, 6—blackish marl, 7—brown and yellow limestone marl, 8—bandy clays, 9—yellowish marl, 10—redhead sandstone and conglomerates, 11—sandstones, 12—sandy loam, 13—marly and limestone tiles, 14—yellow—marl, 15—dolostone, 16—black marl, 17—marl and limestone sub—lithographic, 18—dolostone and limestone with flints, 19—gray marl and limestone, 20—marl and limestone, 21—limestone, 22—clay and sandstone benches, 23—marly limestone tiles, 24—phosphatic white limestone, 25—dolostones, 26—black marl, 27—colored clays and ground gypsum, 28—fine limestone].
Figure 3.
Flowchart of the adopted methodology.
Figure 3.
Flowchart of the adopted methodology.
Figure 4.
Classification of groundwater according to the Piper diagram.
Figure 4.
Classification of groundwater according to the Piper diagram.
Figure 5.
Spatial variations of the water quality index (WQI).
Figure 5.
Spatial variations of the water quality index (WQI).
Figure 6.
Mapping of groundwater quality in the study area. Haut du formulaire.
Figure 6.
Mapping of groundwater quality in the study area. Haut du formulaire.
Figure 7.
Water quality for irrigation according to Wilcox.
Figure 7.
Water quality for irrigation according to Wilcox.
Figure 8.
Water quality for irrigation according to Riverside.
Figure 8.
Water quality for irrigation according to Riverside.
Table 1.
Sampling location including latitude and longitude (UTM 32N WGS 84).
Table 1.
Sampling location including latitude and longitude (UTM 32N WGS 84).
| Sample ID | Longitude (m) | Latitude (m) | Z (m) | Level | Sample ID | Longitude (m) | Latitude (m) | Z (m) | Level |
|---|
| P1 | 713,001.837 | 4,006,527.143 | 993 | 991 | P9 | 714,172.741 | 4,004,661.015 | 993 | 991 |
| P2 | 710,769.800 | 4,003,051.023 | 950 | 946 | P10 | 711,721.160 | 3,999,831.037 | 951 | 946 |
| P3 | 708,940.263 | 3,999,428.538 | 932 | 928 | P11 | 714,392.285 | 3,999,465.134 | 966 | 959 |
| P4 | 707,732.777 | 4,004,221.927 | 980 | 976 | P12 | 706,927.773 | 3,995,110.830 | 898 | 897 |
| P5 | 704,659.147 | 4,000,013.990 | 928 | 926 | P13 | 710,403.893 | 3,994,415.606 | 915 | 914 |
| P6 | 703,195.516 | 4,002,282.617 | 912 | 904 | P14 | 715,270.462 | 3,995,549.921 | 927 | 924 |
| P7 | 700,926.890 | 3,999,355.358 | 913 | 908 | P15 | 712,013.886 | 3,991,524.938 | 919 | 916 |
| P8 | 701,475.753 | 3,996,062.191 | 916 | 913 | P16 | 703,707.787 | 3,992,659.251 | 897 | 894 |
Table 2.
The water quality classes based on the WQI [
29].
Table 2.
The water quality classes based on the WQI [
29].
| WQI Range | Category of Groundwater |
|---|
| 0–25 | Excellent water quality |
| 25–50 | Good water quality |
| 50–75 | Fair water quality |
| 75–100 | Poor water quality |
| 100–150 | Very poor water quality |
| >150 | Unsuitable for drinking/irrigation |
Table 3.
Classification of waters according to the SAR method [
34].
Table 3.
Classification of waters according to the SAR method [
34].
| Degree | Quality | Class | Use State |
|---|
| 1 | Excellent | C1-S1
C2-S2 | Irrigation is generally safe for most crops and soils. |
| 2 | Good | C2-S1
C2-S2 | Suitable for salt-tolerant plants but may pose problems for clayey soils. |
| 3 | Permissible | C3-S1
C2-S3
C3-S2 | Salinity should be monitored, and it is recommended to irrigate salt-tolerant crops on well-drained soils. |
| 4 | Poor | C4-S1
C4-S2
C3-S3 | Water is highly mineralized and should only be used for extremely salt-resistant plants in soils with good permeability. |
| 5 | Extremely poor | C3-S4
C4-S3
C4-S4 | Inappropriate |
Table 4.
Groundwater analysis results and ADWS.
Table 4.
Groundwater analysis results and ADWS.
| | X | Y | pH | E.C. | Ca2+ | Mg2+ | Na+ K+ | Cl− | HCO3− | SO42− | NO3− | PO43− | NH4+ |
|---|
| | (m) | (m) | | (µS/cm) | (mg/L) | (mg/L) | (mg/L) | (mg/L) | (mg/L) | (mg/L) | (mg/L) | (mg/L) | (mg/L) |
|---|
| P1 | 713,001 | 4,006,527 | 7.1 | 1245 | 114 | 40 | 76 | 158 | 300 | 200 | 24.23 | 13.25 | 3.67 |
| P2 | 710,769 | 4,003,051 | 7.2 | 1305 | 139 | 44 | 92 | 156 | 201 | 246 | 25.38 | 15.84 | 3.94 |
| P3 | 708,940 | 3,999,428 | 6.9 | 1466 | 121 | 71 | 104 | 188 | 3.04 | 225 | 25.71 | 11.22 | 3.14 |
| P4 | 707,732 | 4,004,221 | 7.2 | 1157 | 89 | 51 | 89 | 171 | 235 | 125 | 21.55 | 14.56 | 4.88 |
| P5 | 704,659 | 4,000,013 | 6.5 | 1433 | 100 | 73 | 85 | 188 | 229 | 301 | 23.34 | 18.76 | 5.16 |
| P6 | 703,195 | 4,002,282 | 7.3 | 1415 | 125 | 85 | 72 | 161 | 247 | 281 | 20.36 | 16.43 | 5.72 |
| P7 | 700,926 | 3,999,355 | 7 | 1613 | 154 | 75 | 105 | 222 | 333 | 235 | 26.98 | 17.32 | 4.65 |
| P8 | 701,475 | 3,996,062 | 7.2 | 1591 | 168 | 64 | 99 | 246 | 254 | 239 | 24.41 | 16.88 | 4.86 |
| P9 | 714,172 | 4,004,661 | 7.4 | 1222 | 108 | 42 | 78 | 167 | 202 | 224 | 22.54 | 14.56 | 3.67 |
| P10 | 711,721 | 3,999,831 | 6.9 | 1406 | 124 | 66 | 99 | 162 | 298 | 232 | 25.45 | 11.98 | 2.37 |
| P11 | 714,392 | 3,999,465 | 7.5 | 1273 | 109 | 39 | 102 | 158 | 163 | 271 | 21.81 | 11.9 | 2.86 |
| P12 | 706,927 | 3,995,110 | 7.2 | 1560 | 161 | 63 | 105 | 181 | 342 | 264 | 25.55 | 15.65 | 4.29 |
| P13 | 710,403 | 3,994,415 | 7.2 | 1369 | 139 | 72 | 62 | 160 | 304 | 231 | 22.73 | 16.02 | 4.55 |
| P14 | 715,270 | 3,995,549 | 7.4 | 1459 | 152 | 87 | 84 | 112 | 315 | 300 | 20.32 | 17.17 | 3.43 |
| P15 | 712,013 | 3,991,524 | 6.8 | 1042 | 99 | 35 | 61 | 143 | 207 | 156 | 21.25 | 13.64 | 3.84 |
| P16 | 703,707 | 3,992,659 | 7.4 | 1057 | 110 | 40 | 60 | 127 | 222 | 161 | 24.98 | 16.25 | 5.71 |
| ADWS (µS/cm) | 6.5–9.5 | 2500 | 200 | 150 | 200-12 | 200 | 250 | 250 | 50 | 0.4 | 0.3 |
Table 5.
Relative weight of physicochemical parameters.
Table 5.
Relative weight of physicochemical parameters.
| Parameters | Norms (Si) | 1/SI | k | Wi |
|---|
| Conductivity | 2800 | 0.00036 | 0.10956674 | 0.0000391 |
| Calcium | 200 | 0.005 | 0.0005478 |
| Magnesium | 150 | 0.0067 | | 0.0007304 |
| Sodium | 200 | 0.005 | 0.0005478 |
| Potassium | 12 | 0.083 | 0.0091306 |
| Chlorides | 500 | 0.002 | 0.0002191 |
| Sulfates | 400 | 0.0025 | 0.0002739 |
| Bicarbonates | 500 | 0.002 | 0.0002191 |
| Nitrates | 50 | 0.02 | 0.0021913 |
| Nitrites | 0.2 | 5 | 0.5478337 |
| Ammonium | 0.5 | 2 | 0.2191335 |
| Total Phosphate | 0.5 | 2 | 0.2191335 |
Table 6.
Base exchange index (BEI).
Table 6.
Base exchange index (BEI).
| Well | P1 | P2 | P3 | P4 | P5 | P6 | P7 | P8 | P9 | P10 | P11 | P12 | P13 | P14 | P15 | P16 |
|---|
| (BEI) | 0.288 | 0.119 | 0.185 | 0.249 | 0.321 | 0.338 | 0.282 | 0.399 | 0.294 | 0.089 | 0.029 | 0.137 | 0.427 | −0.105 | 0.394 | 0.298 |
Table 7.
Groundwater type according to the quality index.
Table 7.
Groundwater type according to the quality index.
| WQI Value | WQI Range | Well Sample n°. | Category |
|---|
| / | 0–25 | / | Excellent quality |
| / | >25–50 | / | Good quality |
| / | >50–75 | / | Fair quality |
| 81.402; 88.19; 94.97 | >75–100 | P: 11, 15, 6. | Poor quality |
| 101.76; 103.60; 108.55; 115.34; 122.13; 123.02; 125.68; 128.92; 130.87; 131.58; 134.01; 135.70; 142.49. | 100–150 | 1, 2, 3, 4, 5, 7, 8, 9, 10, 12, 13, 14, 16 | Very poor quality |
| / | >150 | / | Unsuitable Quality |
| Disclaimer/Publisher’s Note: The statements, opinions and data contained in all publications are solely those of the individual author(s) and contributor(s) and not of MDPI and/or the editor(s). MDPI and/or the editor(s) disclaim responsibility for any injury to people or property resulting from any ideas, methods, instructions or products referred to in the content. |
© 2024 by the authors. Licensee MDPI, Basel, Switzerland. This article is an open access article distributed under the terms and conditions of the Creative Commons Attribution (CC BY) license (https://creativecommons.org/licenses/by/4.0/).


 ,
, 


