Article

Preliminary Analyses of the Hydro-Meteorological Characteristics of Hurricane Fiona in Puerto Rico

by
Carlos E. Ramos Scharrón
1,2,*,
José Javier Hernández Ayala
3,
Eugenio Y. Arima
1 and
Francis Russell
1
1
Department of Geography and the Environment, The University of Texas at Austin, Austin, TX 78712, USA
2
Lozano Long Institute of Latin American Studies, The University of Texas at Austin, Austin, TX 78712, USA
3
Department of Geography, Environment & Planning, Sonoma State University, Rohnert Park, CA 94928, USA
*
Author to whom correspondence should be addressed.
Hydrology 2023, 10(2), 40; https://doi.org/10.3390/hydrology10020040
Submission received: 16 December 2022 / Revised: 29 January 2023 / Accepted: 30 January 2023 / Published: 1 February 2023
(This article belongs to the Section Hydrology–Climate Interactions)

Abstract

:
The Caribbean has displayed a capacity to fulfill climate change projections associated with tropical cyclone-related rainfall and flooding. This article describes the hydrometeorological characteristics of Hurricane Fiona in Puerto Rico in September 2022 in terms of measured and interpolated rainfall and observed peak flows relative to previous tropical cyclones from 1899 to 2017. Hurricane Fiona ranks third overall in terms of island-wide total rainfall and fourth in terms of daily rainfall. Maximum daily rainfall during Hurricane Fiona exceeded those previously reported (excluding Hurricane María in 2017) in the eastern interior and eastern portions of the island. In terms of peak flows, no value approached the world’s or Puerto Rico’s flood envelope, although 69% of the observations are considered ‘exceptional’. About 26% and 29% of all peak flows were in the 5–10 year and 10–25 year recurrence interval ranges, respectively, yet none matched the 25-year levels. The highest peak flows were concentrated in the central-eastern and southeastern regions. Even though Hurricane María provoked a more extreme hydrometeorological response, some of Hurricane Fiona’s hydro-meteorological characteristics were among the highest ever recorded in Puerto Rico, particularly for the south-central and eastern portions of the island, and it displayed the island’s current level of vulnerability to extreme rainfall.

1. Introduction

On 19 September of 2022, Hurricane Fiona (HF) made landfall in southwestern Puerto Rico (PR) as a Category 1 hurricane on the Saffir-Simpson Wind Scale [1]. Even though HF caused some wind damage, particularly to PR’s agricultural sector [2], most of the impacts related to this tropical cyclone (TC) were rain-related. Ordinal TC intensity scales (e.g., Saffir-Simpson’s) are not a definitive determinant of impact, in part because of the diverse nature of TC-related hazards (i.e., wind, flooding, landslides, storm surges, etc.) [3,4,5] and because, even though many TC impacts are rain-related [6], intensity categories are poorly correlated with rainfall [7]. Additionally, TCs expose existing inequities in societies, which become reflected in spatially-variable vulnerabilities [8]. Therefore, even when the intensity of a particular TC is relatively low, its impacts may be compounded to create immense losses [9].
HF’s proximity to PR’s southern coast, slow translational speed (~13 km h−1 or ~8 mph) [10], and abundance of precipitable water in the atmosphere led to high rainfall amounts in parts of PR. Total rainfall accumulations measured at a single weather station between the 17th and 19th of September reached a maximum of 824 mm (32.4 inches), surpassing the maximum at a station storm total for Hurricane María (HM) in 2017 (745 mm or 29.3 inches) [11]. HF’s large rainfall accumulations triggered mudslides and flooding that affected many communities and ecosystems around the island [12,13], with anecdotal evidence suggesting that various stream peak flows during HF matched or surpassed those associated with HM [14]. Various communities in the southeastern and central mountainous regions of the island were flooded or left disconnected after several bridges were destroyed by extreme river flows [15]. The hurricane also triggered an island-wide blackout and interruptions in water distribution, with about 41% and 16% of the residents remaining without power and water services one week after the storm [16]. The death toll associated with HF in PR was 25 [17], with the majority being indirect deaths caused by the lack of electrical power and running water, as has been documented for previous storms [18].
Previous studies have examined the extreme rainfall associated with TCs in the North Atlantic, finding that recent trends in enhanced hurricane intensities and impacts may be attributed to anomalously high ocean temperatures induced by climate change [19,20]. Therefore, regions of the North Atlantic, such as the Insular Caribbean, have displayed a recent capacity to fulfill climate change projections [21], similarly to what is being documented in parts of the Pacific [22,23]. These include an enhanced capacity for higher rainfall rates [24] and a slowing down of TC translational speeds that can lengthen storm duration and, thus, rainfall totals [25]. For example, recent TCs in islands such as Dominica have produced historical rainfall accumulations [26], which suggest an increase in the frequency of the most extreme rainfall [27]. Such is the case in PR, where some of the highest rainfall totals and peak flows associated with individual TCs ever recorded have been observed over the past three decades [11,28,29,30].
High rainfall intensities and totals caused by TCs are responsible for some of Earth’s highest meteorologically-induced streamflow rates [31]. Instantaneous peak flow rates (Qp in units of m3 s−1) refer to the maximum streamflow rates attained as a result of individual rainstorms [32]. Observed Qp maximum values for a specific geographic area or for the entire world are organized in peak flow catalogues known as ‘flood envelopes’, which show an inverse relationship between area-normalized maximum Qp (hereafter referred to as Qpa in units of m3 s−1 km−2) and watershed drainage area, as captured by the following equation:
ln ( Q p a ) = a + b × ln   ( A )
where a and b are fitted linear regression parameters, and A is the drainage area in km2 [33]. The decline in Qpa with increasing drainage area is due to the area-scaling effect of rainfall and flood wave attenuation [34] controlled by stream channel hydraulic efficiency, stream slope, and the geometric layout of stream networks [35,36].
Flood envelope catalogues have shown that the Insular Caribbean (e.g., Cuba and Dominica) has a capacity to generate some of the highest instantaneous peak flow rates in the world [37,38]. In PR, TCs with similar trajectories and characteristics to HF have caused many of the maximum peak flows recorded on the island. In fact, PR has displayed a capacity to generate some of the highest ever recorded streamflow rates for watersheds in the 10−1 to 102 km2 size range [34,39], with 20 TC-associated Qpa values lying within the 95% confidence interval of the world’s peak flow envelope [40]. It is important to note that 13 out of the 20 Qpa values from PR that match those in the world’s flood envelope have occurred since 1996. This proven capacity for TCs to generate high Qpa values led to a recent update of previously existing magnitude-frequency curves for the island, which were developed with measurements taken prior to 1996 [41] but now include data up to HM in 2017 [42].
This article describes the hydrometeorological characteristics of HF in PR, specifically in terms of rainfall and instantaneous peak flows. Hourly and daily rainfall data from weather stations distributed throughout the island were used to determine the spatial distribution of HF’s rainfall and its local context in terms of how it compares to normal annual rainfall and rainfall patterns recorded for individual TCs dating back to 1899 (n = 61 TCs), in addition to describing it in terms of the estimated recurrence interval (RI). Rainfall characteristics considered for the study were 1 h and 24 h maximum rainfall intensities and total event rainfall. In addition, Qpa observations during HF were compared with the flood envelopes for both the world and PR, and to previous TCs that have affected the island (n = 40 TCs), in addition to describing them in terms of their estimated RIs.

2. Materials and Methods

2.1. Rainfall

At approximately 8690 km2, PR (18.25° N, 66.50° W) is the smallest and easternmost island of the Greater Antilles. PR’s maritime tropical climate typifies that of all four main islands (i.e., Cuba, Jamaica, and Hispaniola). The island-wide mean annual temperature in PR is ~30 °C. The mean annual rainfall is 1690 mm yr−1 and ranges from ~700 mm yr−1 in the southwest part of the island to ~4600 mm yr−1 in the northeast, with ~45% occurring during the peak of the TC season from August to October [43]. Although not all of the largest individual rainstorms in PR are TC-related [44], TCs yielding an excess of 50 mm in mean island-wide rainfall occur on average 5 to 6 times per decade [45]. PR-specific climate change projections suggest an increase in the frequency and magnitude of events yielding an excess of 76 mm of rainfall [46,47]. Major TC landfalls (>3 on the Saffir-Sampson TC wind scale) have occurred once every five to six decades [48]. However, TC rainfall does not depend on TC magnitude or proximity to the low-pressure center but is determined by the amount of precipitable water in the atmosphere, ground elevation, and event duration [45]. Even though the largest amounts of TC rainfall have typically occurred in the eastern, southeastern, and central interior portions of the island [49], rainfall is largely dependent on the specific interactions of internal TC moisture with topographical features [50], and intense rainfalls and high Qpa values can occur throughout the entire island [40].
PR’s physiography consists of coastal lowlands, a northern karstic belt, and uplands consisting of three main units: the Cordillera Central, Sierra de Cayey, and Sierra de Luquillo (Figure 1) [51]. The Cordillera Central is the main topographic feature of the island’s upland province, traversing about two-thirds of its length before yielding into the two northeast- and southeast-trending ranges (Sierra de Luquillo and Sierra de Cayey, respectively). Alluvial valleys typify the approach of most rivers towards all four coastlines. The Caguas Valley is the only significant inland valley [52]. Even though forests currently cover about >40% of the island [53,54], most of these are secondary due to the widespread abandonment of sugar cane, coffee, tobacco, and cattle grazing lands [55,56]. Agricultural land presently covers only ~11% of the island [57].
Watershed-scale runoff response in PR is controlled by subsurface stormflow and saturation overland flow mechanisms due to high infiltration rates [58] and an abundance of macropores in forested areas [59]. River networks are relatively steep with an effective hydraulic conveyance capacity [60,61] which makes these fluvial systems very effective at transmitting flood waves and thus allows them to have relatively high Qpa values during intense rainstorms [34].
This study relied on hourly rainfall data from 77 recording stations and 24 h totals from a combination of 112 recording and non-recording stations (Figure 1b). Hourly (1 h Pint; in mm h−1) rainfall intensity data was obtained from the United States Geological Survey’s (USGS) online database [62]. It is important to note that, up to the completion of this article, the USGS data for HF is still considered as ‘provisional’. USGS data in combination with daily measurements collected by the network of rain gauges feeding the National Climatic Data Center online dataset [63] were used to establish maximum daily rainfall intensities (24 h Pint; in mm h−1) and total event rainfall (TR; in mm). Rainfall data was limited to the days during which HF was within a 500-km radius of PR (17th–19th September), following the protocols used by previous similar assessments [45,49,64].
Individual station rainfall data were interpolated to produce continuous rasterized surfaces of 1 h Pint, 24 h Pint, and TR for the entire island. The data for all three variables had a normal distribution according to the Shapiro-Wilk test (p-values = 0.88–0.98). An ordinary cokriging (OKC) method was employed with elevation as a covariate variable to predict rainfall at unknown locations [65,66]. Elevation has been established as a significant factor determining monthly and annual rainfall patterns [43,67,68] as well as TC-specific rainfall both in PR [50,64] and elsewhere [69,70]. In cokriging with one external variable, two covariances and one cross-covariance of rainfall and elevation at different spatial lags need to be calculated [66]. This is accomplished by manually fitting empirical covariograms to best capture the covariance structure of the data at different spatial lags. After some experimentation, we opted for an ‘exponential’ empirical model since it maintained the most accurate spatial pattern of observed rainfall, including both minimum and maximum values.
The interpolated rain rasters for HF were compared with those of previous TCs by using the ‘Raster Calculator’ tool in ArcGIS to calculate the ratio between HF and the overall maximum 24 h Pint and TR for all significant TCs that have affected PR between 1899 and 2017 (excluding HM; n = 60 TCs) [28]. Additionally, HM rainfall was contextualized locally by calculating the ratio of its TR to normal annual rainfall [43]. A similar analysis for HF’s 1 h Pint interpolated results was not feasible due to the lack of readily available datasets for other storms.
The 24 h Pint RI for each raster cell within PR for HF was calculated as follows. First, we obtained the 24 h precipitation frequency estimates in raster format with average recurrence intervals of 1, 2, 5, 10, 25, 50, 100, 200, 500, and 1000 years from NOAA’s website [71]. At 3-s resolution (~90 m), each cell i in each downloaded raster stores the 24 h Pint value in mm h−1 for a particular recurrence interval. Next, an ordinary least square (OLS) model was estimated for every single cell in the raster following Equation (1):
l n ( R I j i ) =   β 0 i + β 1 i x j i + β 2 i x j i 2 + β 3 i x j i 3 + u j i
where j = 1,…,10 is the number of input values corresponding to each given recurrence interval; the superscript i denotes each individual raster cell (I = 1,…,1,087,190 regressions in total); the β s are the coefficients to be estimated; and u is the error term. RI takes the value of the recurrence intervals (1,2,5,…,1000), and the x vector contains the corresponding 1 h and 24 h Pint value. Every regression i therefore relies on ten INT-RI pairs of values to estimate four parameters. Once the surfaces of parameters were calculated, the estimated recurrence interval R I ^ i for each TC raster cell was calculated by ‘plugging-in’ each INT interpolated raster in place of the x vector by using GIS raster algebra (Equation (2)).
R I ^ i =   α ^ i exp ( β ^ 0 i + β ^ 1 i x i + β ^ 2 i x i 2 + β ^ 3 i x i 3 )
The logarithmic transformation combined with the cubic polynomial function provides an excellent approximation to the overall shape of the non-linear relationship between RI and rainfall values [72] and guarantees that predicted RI values will always be positive. The regression R2 for all cells is above 0.99, an almost perfect fit.
The logarithmic transformation implies that the error term is now log-normally distributed. Therefore, OLS estimation biases the prediction of RI downward [73]. The α adjustment parameter attenuates such bias [74] and is defined as:
α ^ i = n 1 j = 1 10 exp ( u ^ j i )
where u ^ j i are the residuals of the regression (Equation (2)). For the reason that the regression fit was good for all cells, the residuals are small, and therefore the α ^ i parameters are also small. The largest correction was about 0.2%.
We repeated the procedure to calculate the recurrence intervals for 1 h Pint but decided not to include the results here because the model overestimated the RI in the northwestern part of the island, where intensity values during HF were very low. We opted instead to create a categorical map that identifies the cells whose HF’s 1 h Pint values exceeded the RI from NOAA’s 1 h Pint values by relying on the ratio between HF’s raster and those from NOAA [71]. The procedure assigns value 0 to those cells whose HF’s 1 h Pint values do not exceed any of NOAA’s recurrence interval values, 1 if it exceeds the 1 yr values, 2 if it exceeds 2 yr values, 3 if it exceeds 5 yr values, and so on until 10 for those cells exceeding 1000 yr RI values.

2.2. Peak Flow

This study relied on HF Qp data stored in the USGS’ online repository (n = 62 stations with drainage areas ranging from 1.2 to 540 km2) [62]. However, it is important to note that by the time of preparation of this article, the data was still classified as ‘provisional’. The data presented here represents peak flow values based on direct instantaneous stage measurements that are transformed into flow rates (in units of m3 s−1) by way of rating curves established for each stream gaging station [75].
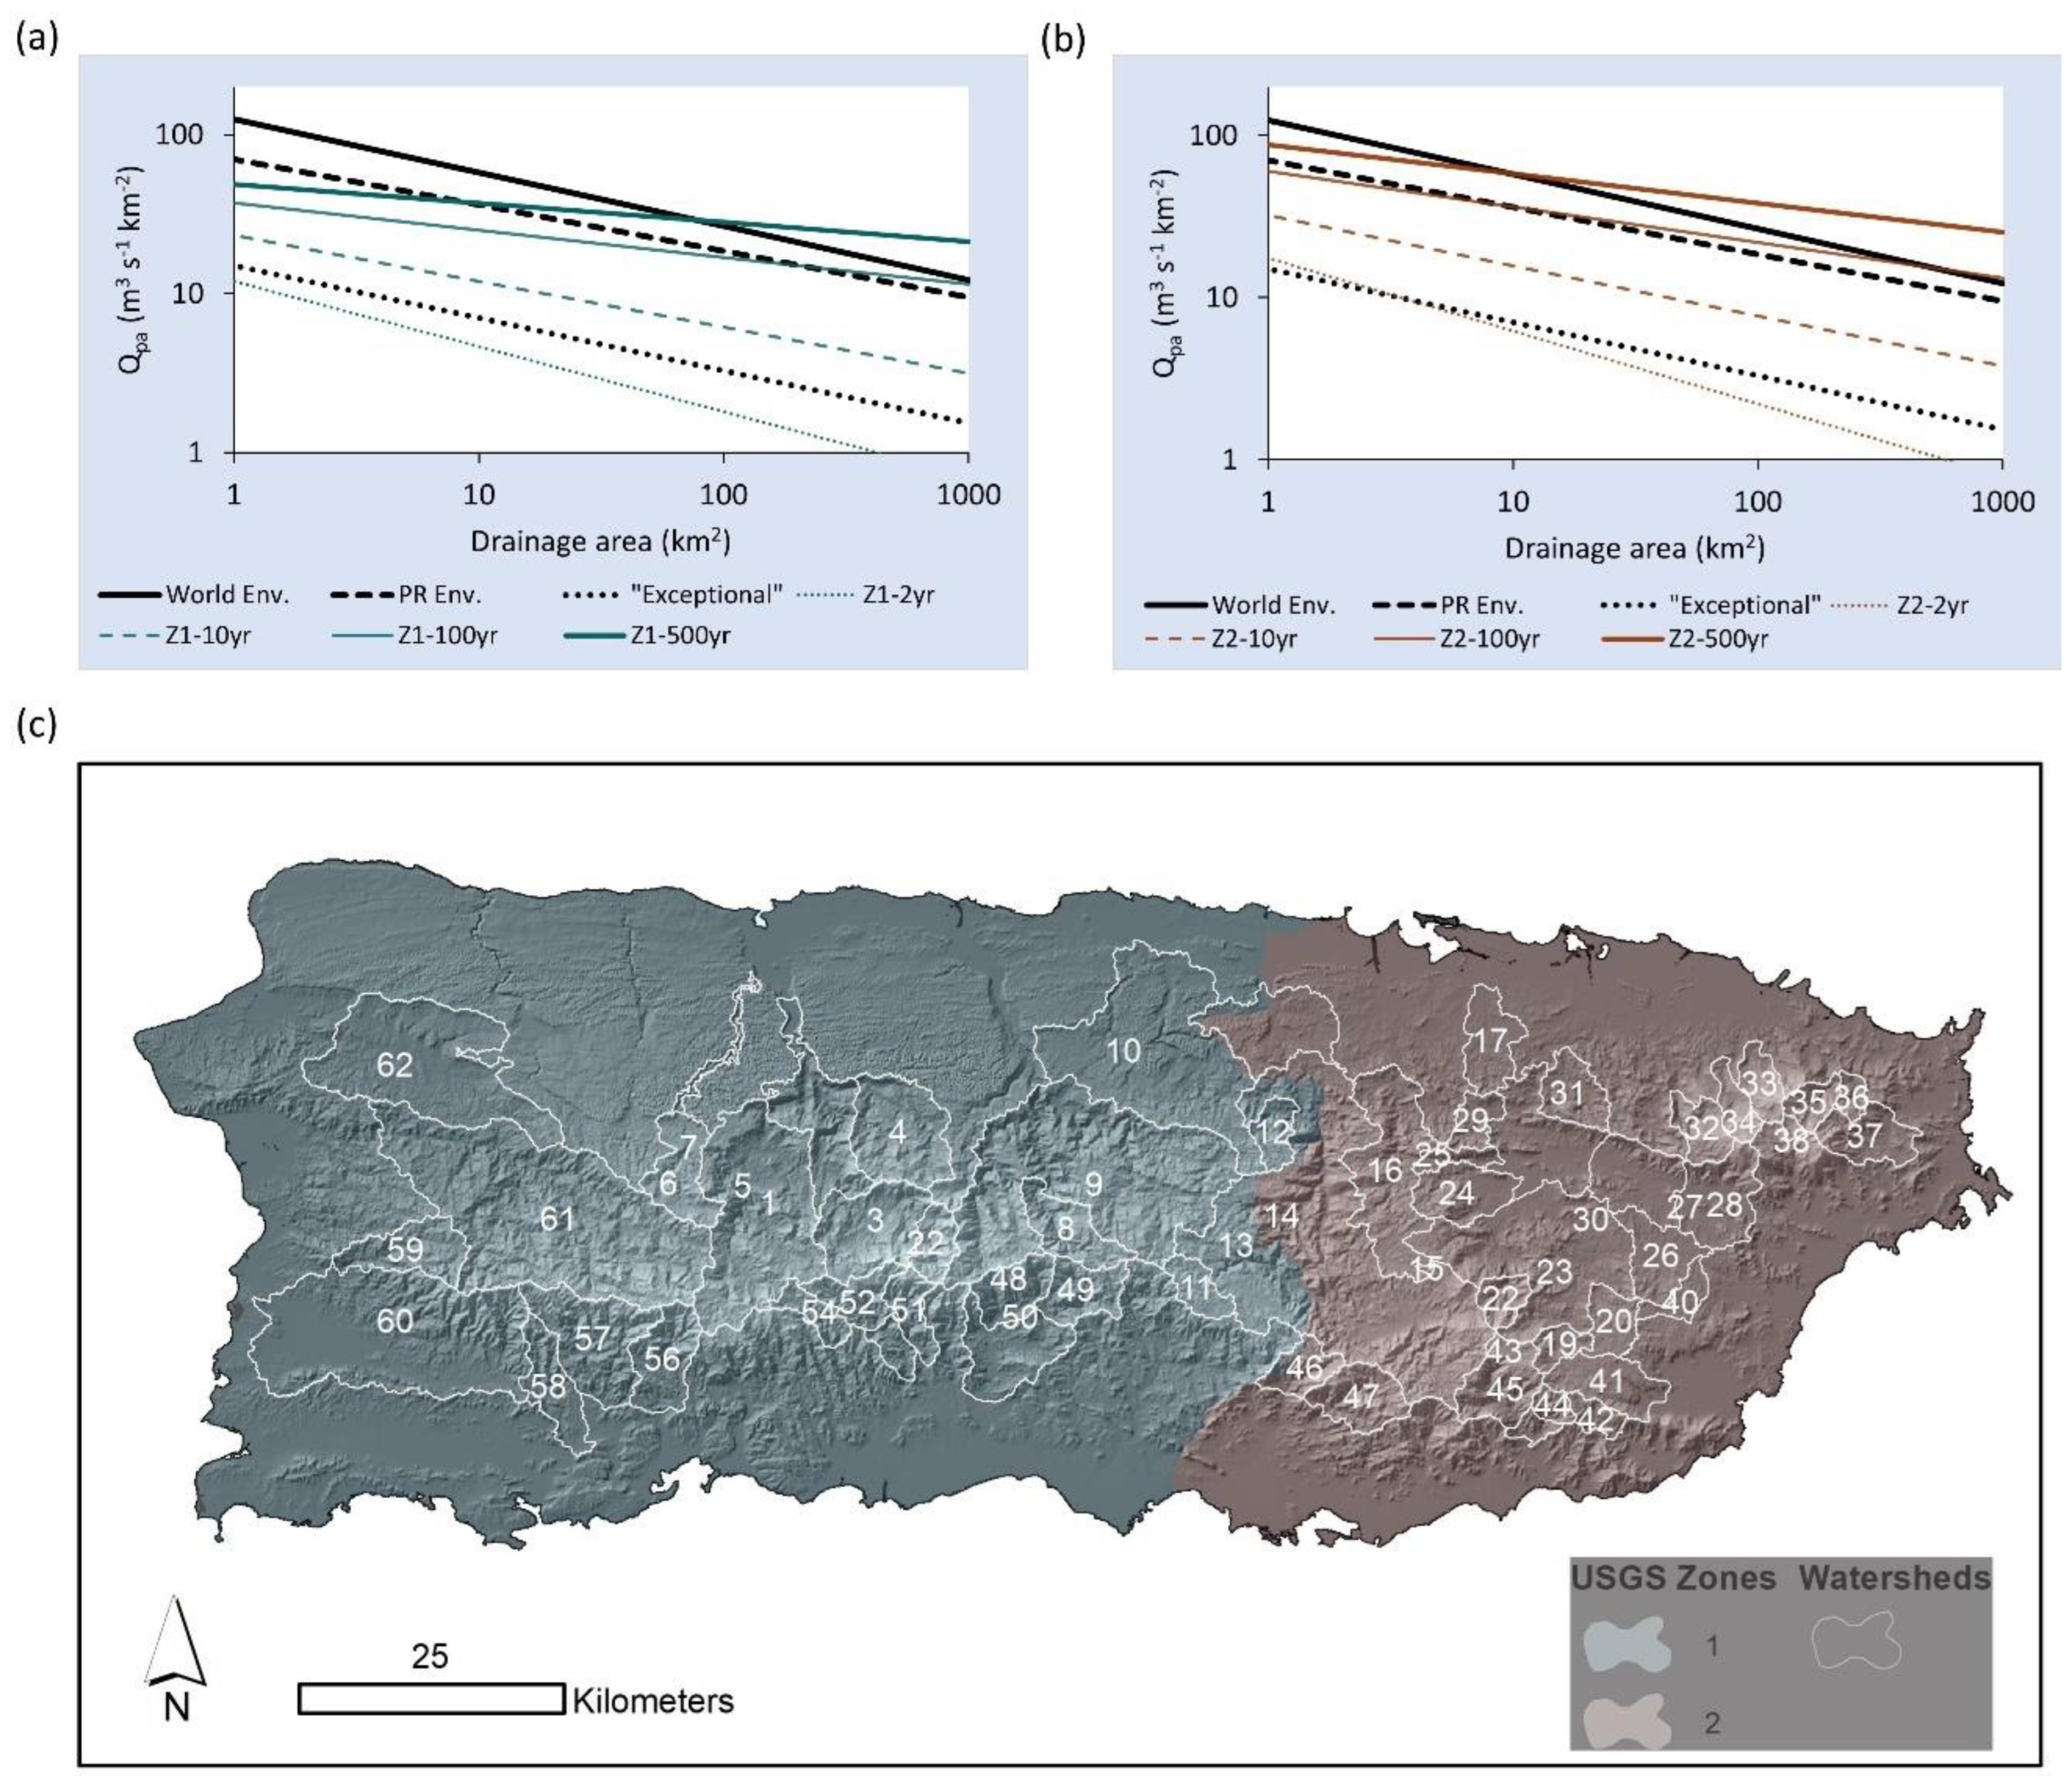
We relied on GIS-ready watershed polygons available through the USGS database [62] to define the size and extent of the source area for each stream gauging station (Figure 2; Table 1). The drainage area (in km2) for each watershed polygon was used to: (1) determine the watershed-scale average 1 h Pint and 24 h Pint following the protocol described by Ramos Scharrón, Garnett, and Arima [40]; and (2) convert Qp values (m3 s−1) into Qpa (in m3 km−2 s−1) by normalizing them by area. Since maximum Qpa is inversely related to drainage area (Equation (1)), a direct comparison of Qpa values is not an appropriate metric, neither to assess the magnitude of responses amongst Qpa observations from different watersheds during HF nor to compare HF Qpa rates to those of other previous TCs. Therefore, we relied on two metrics to evaluate the spatial distribution of Qpa magnitudes during HF and to assess the island-wide Qpa magnitude associated with HF relative to all TC-related events included in PR’s flood envelope [40]. The first consisted in calculating the proportion of observations that exceeded what is considered in the literature as an ‘exceptional’ area-normalized peak flow (Qpa excep) defined by [32] as:
Q p a   e x c e p = 15 × A 0.33
where Qpa excep is in m3 s−1 km−2 and A is in km2 (Figure 2). The second metric to compare HF to previous TC Qpas recorded in PR was based on the TC-averaged Q p a / Q p a   s i g ratio. It is important to note that this is not meant as a formal comparison among TCs but simply as an aid to position HF’s Qpa characteristics within those of other TCs that have affected PR since 1899 for which Qpa data has been compiled [40].
HF Qpa values were also compared with both the world’s and PR’s flood envelopes. The world’s envelope we used contains observations compiled for India [76], the United States [39], China [77], and the entire world [37]. The equation was developed based on simple linear regression analyses using both natural log-transformed Qpa and drainage area values [40]:
ln ( Q p a ) = 4.824   0.336 × ln ( A )
The 95% confidence intervals for the intercept are 4.659 to 4.988 and −0.367 to −0.304 for the slope (Figure 2).
The PR flood envelope was estimated through a quantile regression model and resulted in the following equation [40]:
ln ( Q p a ) = 4.249 0.289 × ln ( A )
The 95% confidence intervals for the intercept ranged from 3.908 to 4.589 and −0.358 to −0.219 for the slope (Figure 2).
HF Qpa values were also contextualized with regards to their expected recurrence interval. For this analysis, we relied on the updated magnitude-frequency equations for PR released by the USGS in 2021, for which separate sets of equations were developed for the western (Zone 1 (Z1); Equations (8a)–(8d)) and eastern (Zone 2 (Z2); Equations (9a)–(9d)) areas of the island (Figure 2) [42]. Solving for ln Qpa, these equations are:
ln ( Z 1   Q p a   2 y r   ) = 2.482 0.410 × ln ( A )
ln ( Z 1   Q p a   10 y r   ) = 3.151 0.290 × ln ( A )
ln ( Z 1   Q p a   100 y r   ) = 3.612 0.170 × ln ( A )
ln ( Z 1   Q p a   500 y r   ) = 3.887 0.120 × ln ( A )
ln ( Z 2   Q p a   2 y r   ) = 2.866 0.450 × ln ( A )
ln ( Z 2   Q p a   10 y r   ) = 3.469 0.310 × ln ( A )
ln ( Z 2   Q p a   100 y r   ) = 4.097 0.220 × ln ( A )
ln ( Z 2   Q p a   500 y r   ) = 4.474 0.180 × ln ( A )
It is important to note that Zone 2 Qpa values are higher for the same return period relative to those for Zone 1. Also, for both zones, an ‘exceptional’ Qpa (Equation (5)) means a value exceeding the 2-year recurrence interval estimate, and those matching the world’s and PR’s flood envelopes (Equations (5) and (7), respectively) are in the 100- and 500-year recurrence interval range (Figure 2).
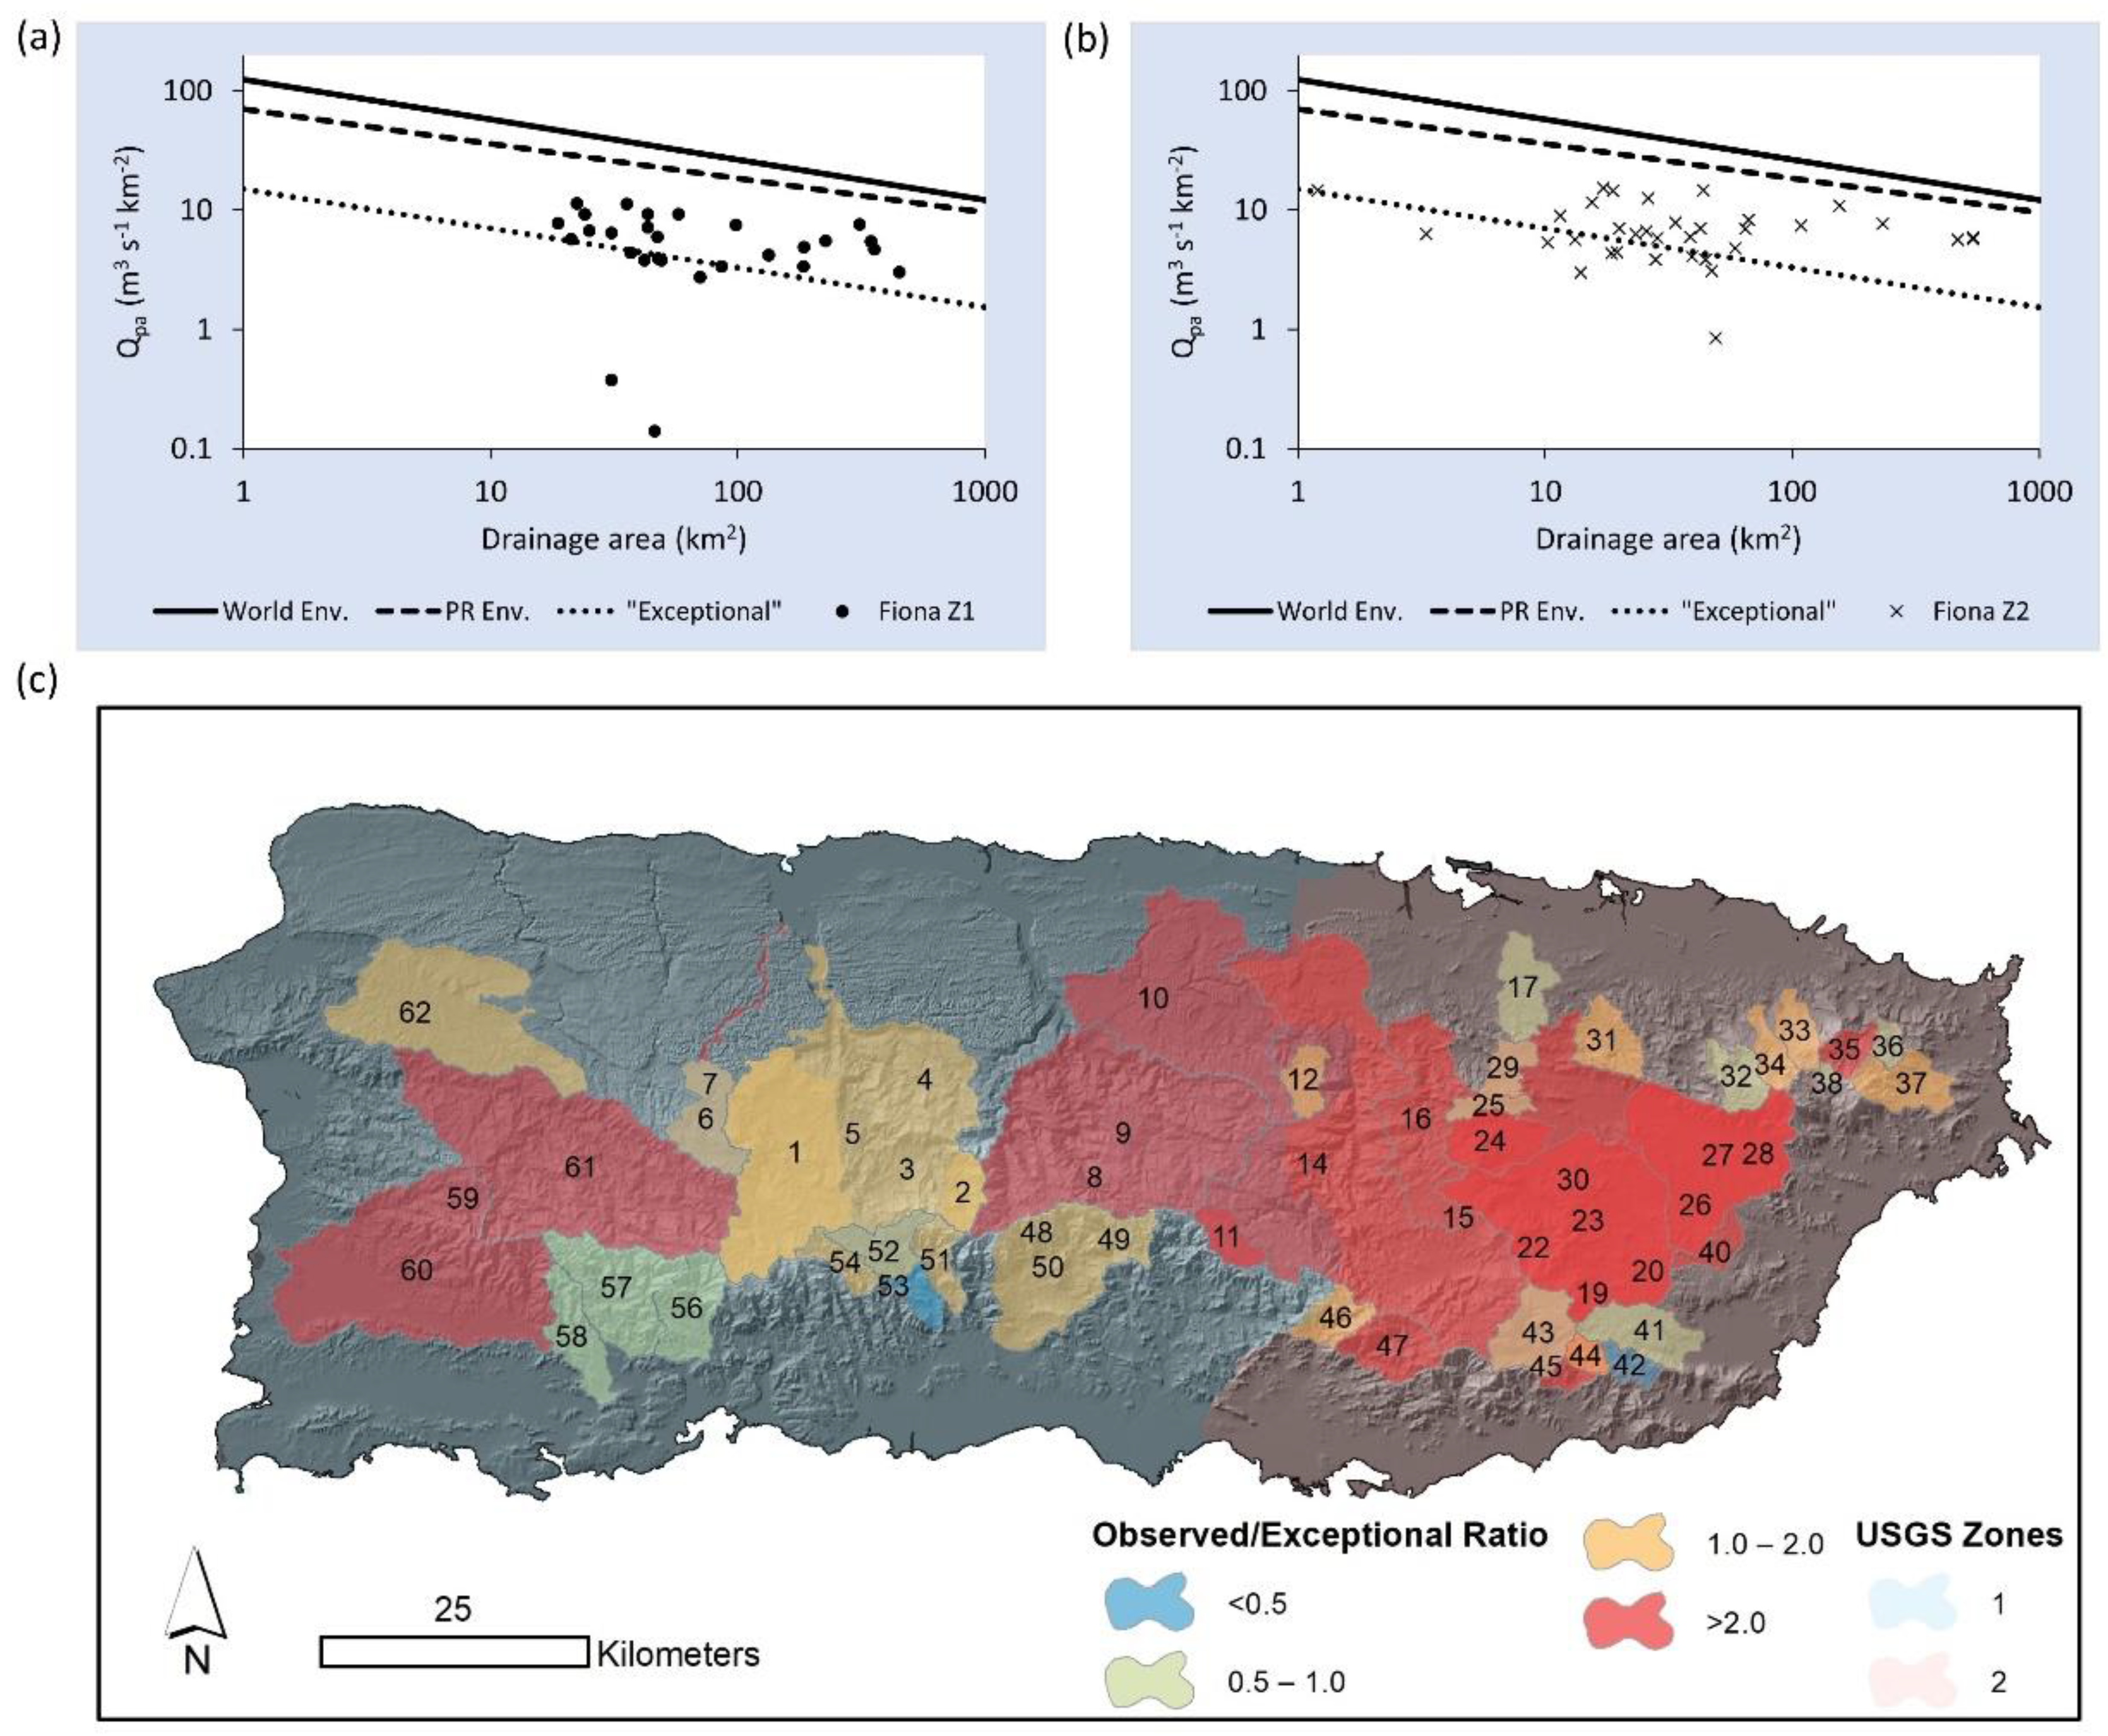
Figure 2. Comparison of the world’s and Puerto Rico’s flood envelope [40] to the island’s latest magnitude-frequency estimates [42]. (a) Drainage area versus area-normalized peak flows (Qpa) for Zone 1 (western region). (b) Drainage area versus Qpa for Zone 2 (eastern region). (c) Map showing the spatial extent of Zones 1 and 2 according to [42] and the location of the watersheds for which Qpa values were available for Hurricane Fiona.
Hydrology 10 00040 g002
Table 1. List of U.S. Geological Survey stations in Puerto Rico that recorded instantaneous peak flow rates during Hurricane Fiona.
Map Num.Station IDStation NameMap Num.Station IDStation NameMap Num.Station IDStation Name
150024950RG Arecibo blw Utuado2250053025R Turabo abv Borinquen4350092000RG de Patillas nr Patillas
250025155R Saliente nr Jayuya2350055001RG de Loiza @ Caguas4450093000R Marin nr Patillas
350026025R Caonillas @ Paso Palma2450055225R Caguitas @ V. Blanca4550093120RG de Patillas below L. Patillas
450027000R Limon abv Dos Bocas2550055380R Bairoa abv Bairoa4650100200R Lapa nr Rabo d. Buey
550027600RG Arecibo nr San Pedro2650056400R Valeciano nr Juncos4750100450R Majada @ La Plena
650028000R Tanama nr Utuado2750057000R Gurabo @ Gurabo4850110650R Jacaguas abv Guayabal
750028400R Tanama @ Charco Hondo2850055750R Gurabo blw El Mango4950110900R Toa Vaca abv Lago TV
850034000R Bauta @ Orocovis2950058350R Canas @ Rio Canas5050111500R Jacaguas @ J. Diaz
950035000RG Manati @ Ciales3050059050RG de Loiza blw Carraizo5150112500R Inabon @ Real Abajo
1050039500R Cibuco @ Vega Baja3150059210Q Grande @ B. Dos Bocas5250113800R Cerrillos abv Cerrillos
1150043197R Usabon nr Barranquitas3250061800R Canovanas nr Campo Rico5350114000R Cerrillos nr Ponce
1250044810R Guadiana nr Naranjito3350063800R Espiritu Santo nr Rio Grande5450114900R Portugues nr Tibes
1350045010RG below blw Plata Dam3450064200R Grande nr El Verde5550115240R Portugues at Tibes
1450046000R de La Plata at Toa Alta3550065500R Mameyes nr Sabana5650124200R Guayanilla nr Guay.
1550047535R Bayamon @ Arenas3650067000R Sabana @ Sabana5750126150R Yauco abv Monserrate
1650047850R Bayamón nr Baya.3750071000R Fajardo nr Fajardo5850129254R Loco @ Las Latas
1750049100R Piedras @ Hato Rey3850075000R Icacos nr Naguabo5950136400R Rosario nr Hormigueros
1850049310Q Josefina @ Piñero Avenue3950075500R Blanco @ Florida6050138000R Guanajibo nr Hormigueros
1950050900RG Loiza @ Qda Arenas4050081000R Humacao @ Las Piedras6150144000RG Anasco nr San Seb
2050051311R Cayaguas @ Cerro Gordo4150083500R Guayanes nr Yabucoa6250147800R Culebrinas nr Moca
2150051801RG Loiza @ San Lorenzo4250090500R Maunabo @ Lizas

3. Results & Discussion

3.1. Rainfall

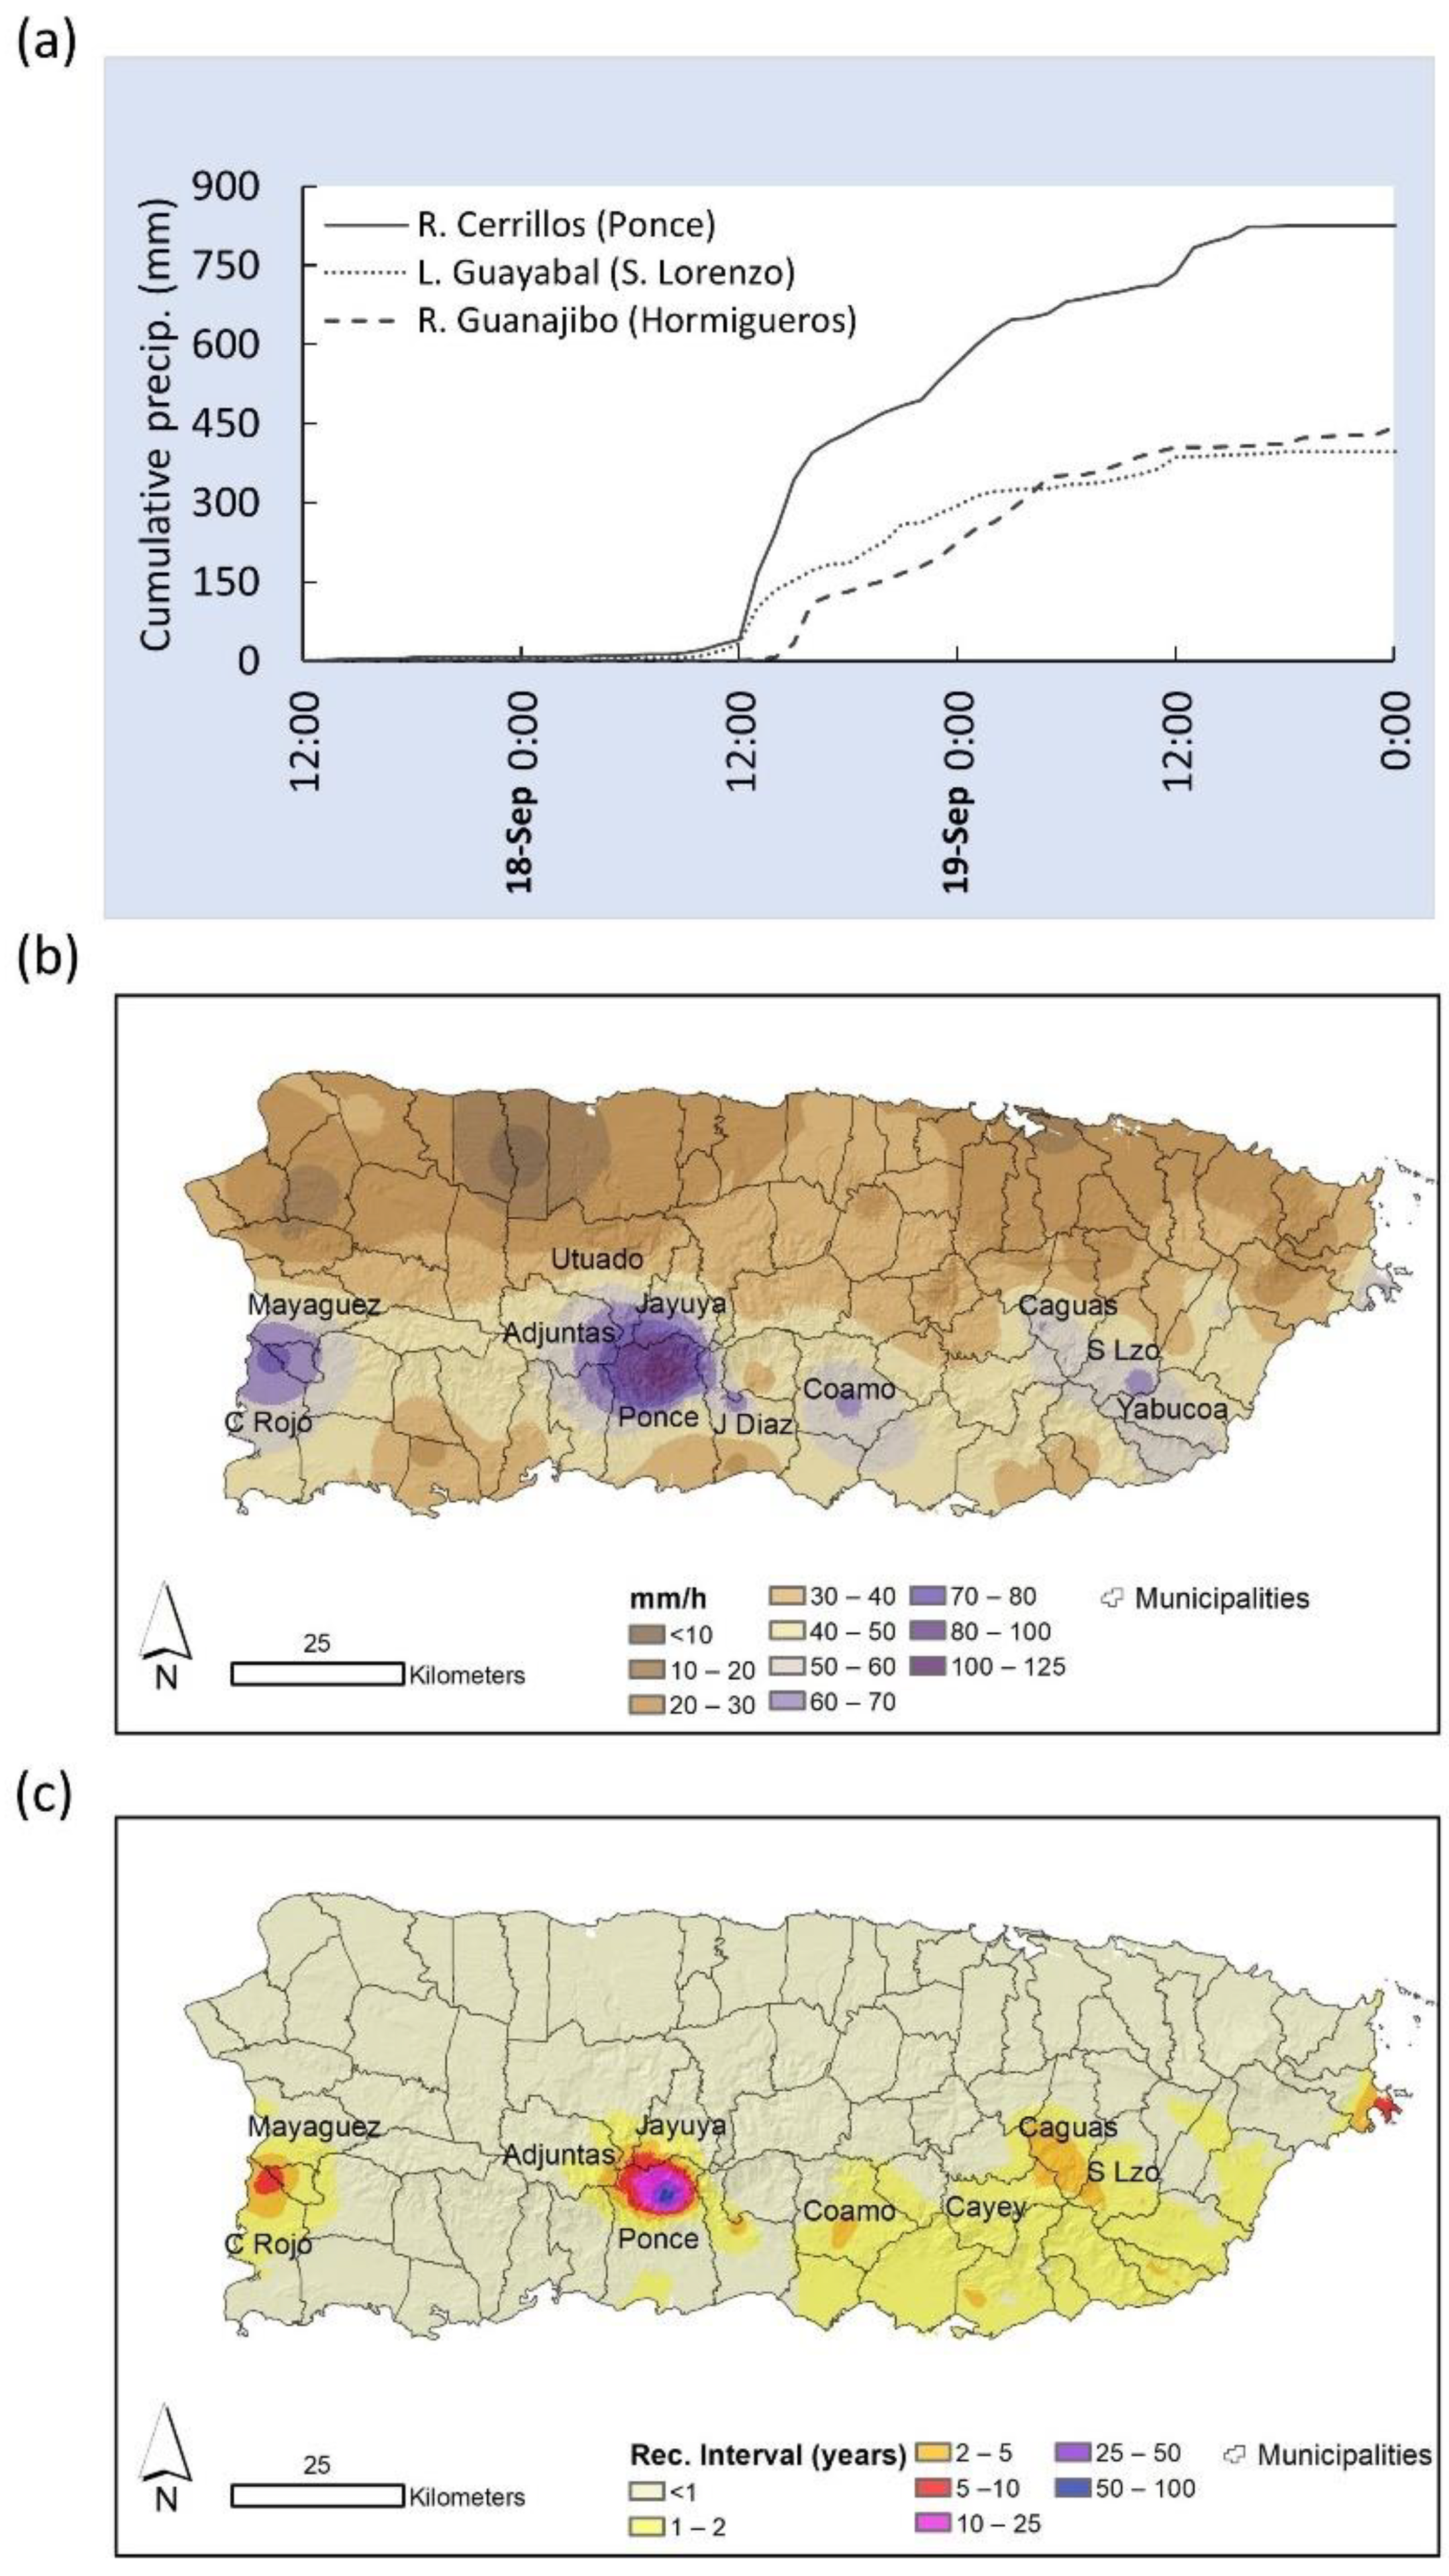
The maximum 1 h Pint during HF was 125 mm h−1 in northern Ponce (Río Cerrillos station: USGS 50113800) measured between 1 and 2 pm AST on the 18th of September (Figure 3a). Other notable maximum 1 h Pint values include 89 mm h−1 in east-central Ponce (Río Portugués near Tibes station: USGS 50114900), 77 mm h−1 near Hormigueros in the western part of PR (Río Guanajibo station: USGS 50113800), and 70 mm h−1 near Juana Díaz in the south (Lago Guayabal at damsite: USGS 50111300). Observed 1 h Pint values in the interior-east near Caguas and San Lorenzo ranged from 60–70 mm h−1. The geometric average 1 h Pint for the 77 recording rain gauges was 40 mm h−1.
The island-wide mean 1 h Pint based on cokriging interpolations was 38 mm h−1. About 15% of the island had maximum 1 h Pint values exceeding 50 mm h−1, but 100 mm h−1 was exceeded only for 0.2% of the island. Maximum 1 h Pint during HF over 96% of the island did not surpass intensities with recurrence intervals exceeding the 2 yr threshold (Figure 3). Only 1.1% of the island in northern Ponce registered 1 h Pint values exceeding 25 yr recurrence interval values.
Comparisons of HF’s 1 h Pint to those from previous TCs we not possible given the unavailability of readily available similar values for those TCs. However, out of the 25 stations that recorded rainfall during the entirety of HM in 2017, four of those recorded intensities exceeded 100 mm h−1 in eastern (in the municipalities of Las Piedras, San Lorenzo, and Gurabo) and central PR (Utuado), with the maximum reaching 214 mm h−1 at Gurabo. In comparison, the geometric mean of 1 h Pint recorded during HM was 73 mm h−1, and this is 1.8 times greater than for HF.
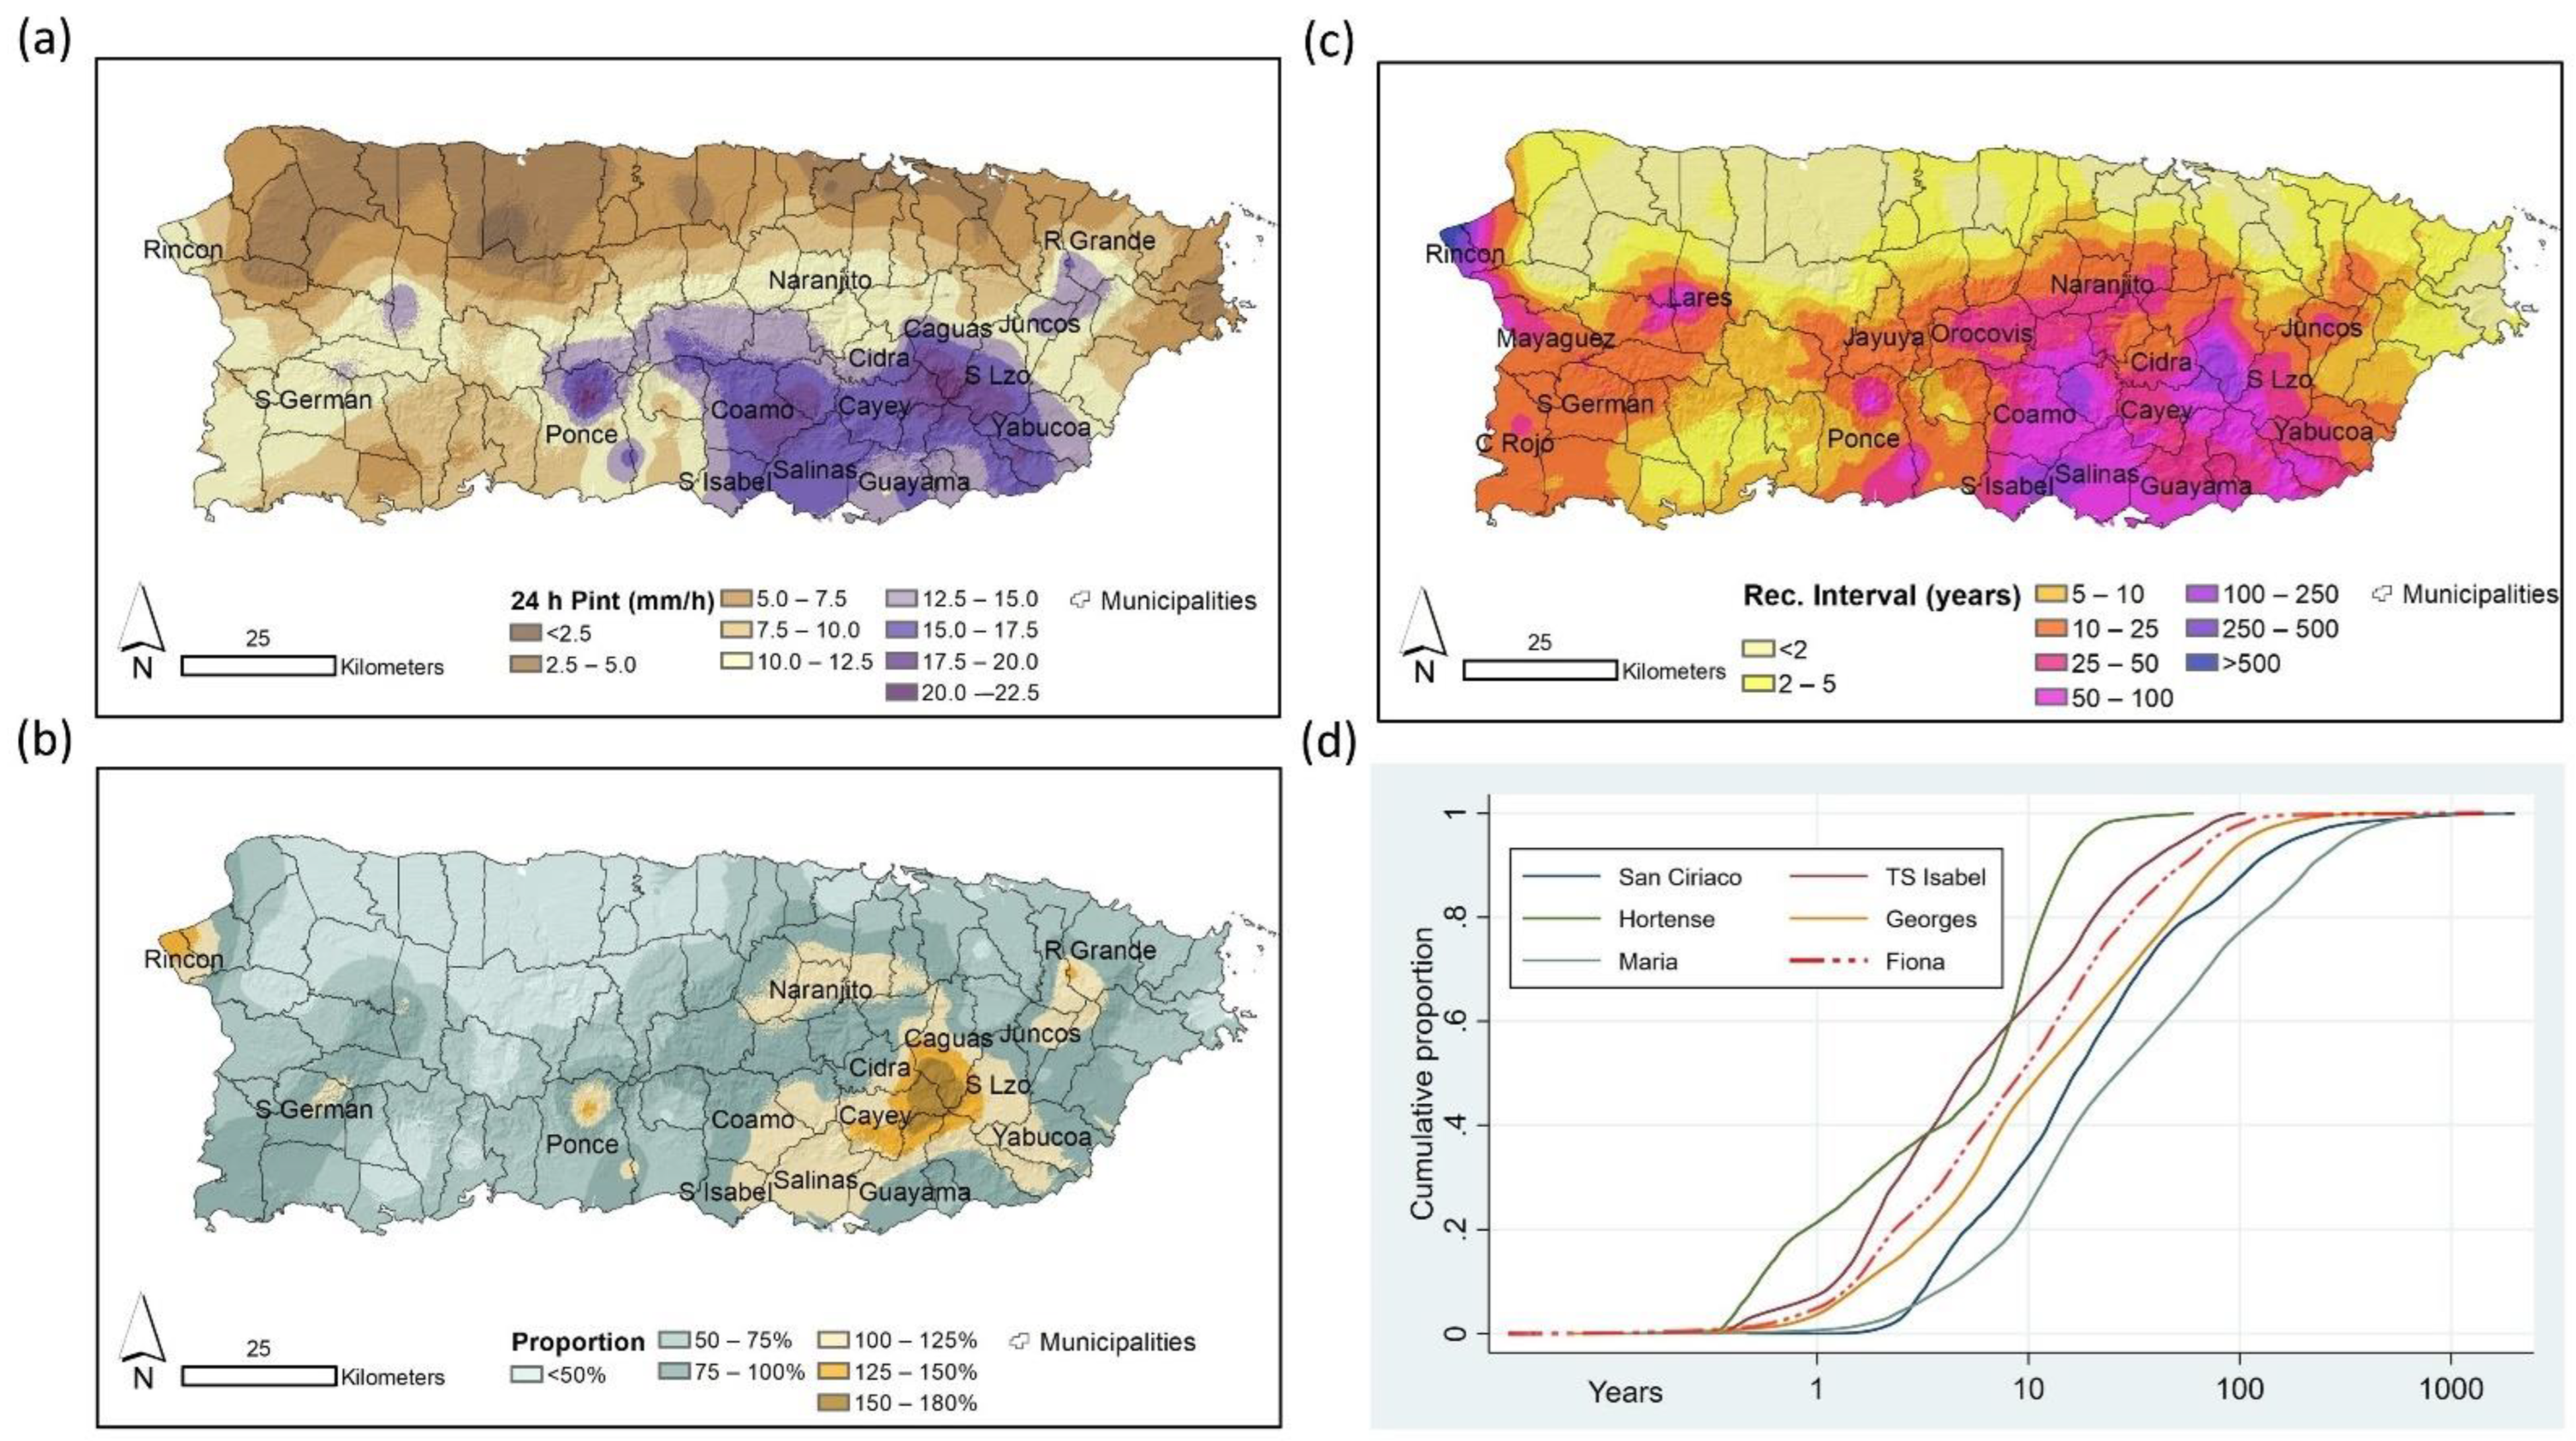
The maximum 24 h Pint values recorded at a station during HF were 21.8 mm h−1 at the Río Cerrillos station in Ponce and 22.4 mm h−1 at the La Plaza station in Caguas (USGS 50999961). The geometric mean of all 24 h Pint observations was 10.4 mm h−1. The island-wide mean 24 h Pint based on interpolations was 9.79 mm h−1, which places HF as the fourth-ranked TC in PR since 1899 behind Hurricanes María (12.7 mm h−1), San Ciriaco (11.3 mm h−1), and Georges (10.6 mm h−1), respectively [28] (Figure 4). Maximum daily intensities exceeding 12.5 mm h−1 occurred over 24% of the island between the municipalities of Ponce and Orocovis in the central region, from Coamo and Santa Isabel to Yabucoa on the south, between Juncos and the Rio Grande in the northeast, and in Lares in the west. Maximum 24 h Pint values exceeding 17.5 mm h−1 occurred over 3% of the island in northern Ponce, between Coamo and Aibonito, and in the Cayey, Caguas, and San Lorenzo areas.
In about 13% of PR, 24 h Pint values during HF exceeded those of all other TCs that have affected the island since 1899 (not including HM) (Figure 4). In fact, values in Cayey, northern Guayama, and southern Caguas exceeded previous maximums by upwards of 50 and 90%. Other regions where HF’s 24 h Pint values exceeded previous maximums included Rincón on the west coast, northern Ponce, areas of Aibonito, Santa Isabel, Salinas, Guayama, Cidra, and San Lorenzo in the central-east, Juncos, Canóvanas, and Río Grande in the northeast, and Naranjito and southern Bayamón in the north.
Maximum 24 h Pint RIs exceeding 25 years were estimated to account for about 20% of PR, and these were mostly concentrated in the central and southern portions of the island from Orocovis and Santa Isabel to Juncos and Yabucoa (Figure 4). The median island-wide 24-h Pint RI was ~10 years, with 20% of the island exceeding 25-year RIs. RIs exceeding 100 years were estimated to account for only 2% of PR. When compared with 24 h Pints reported for past TCs in PR, HF ranks fourth behind Hurricanes Maria, San Ciriaco, and Georges (respectively).
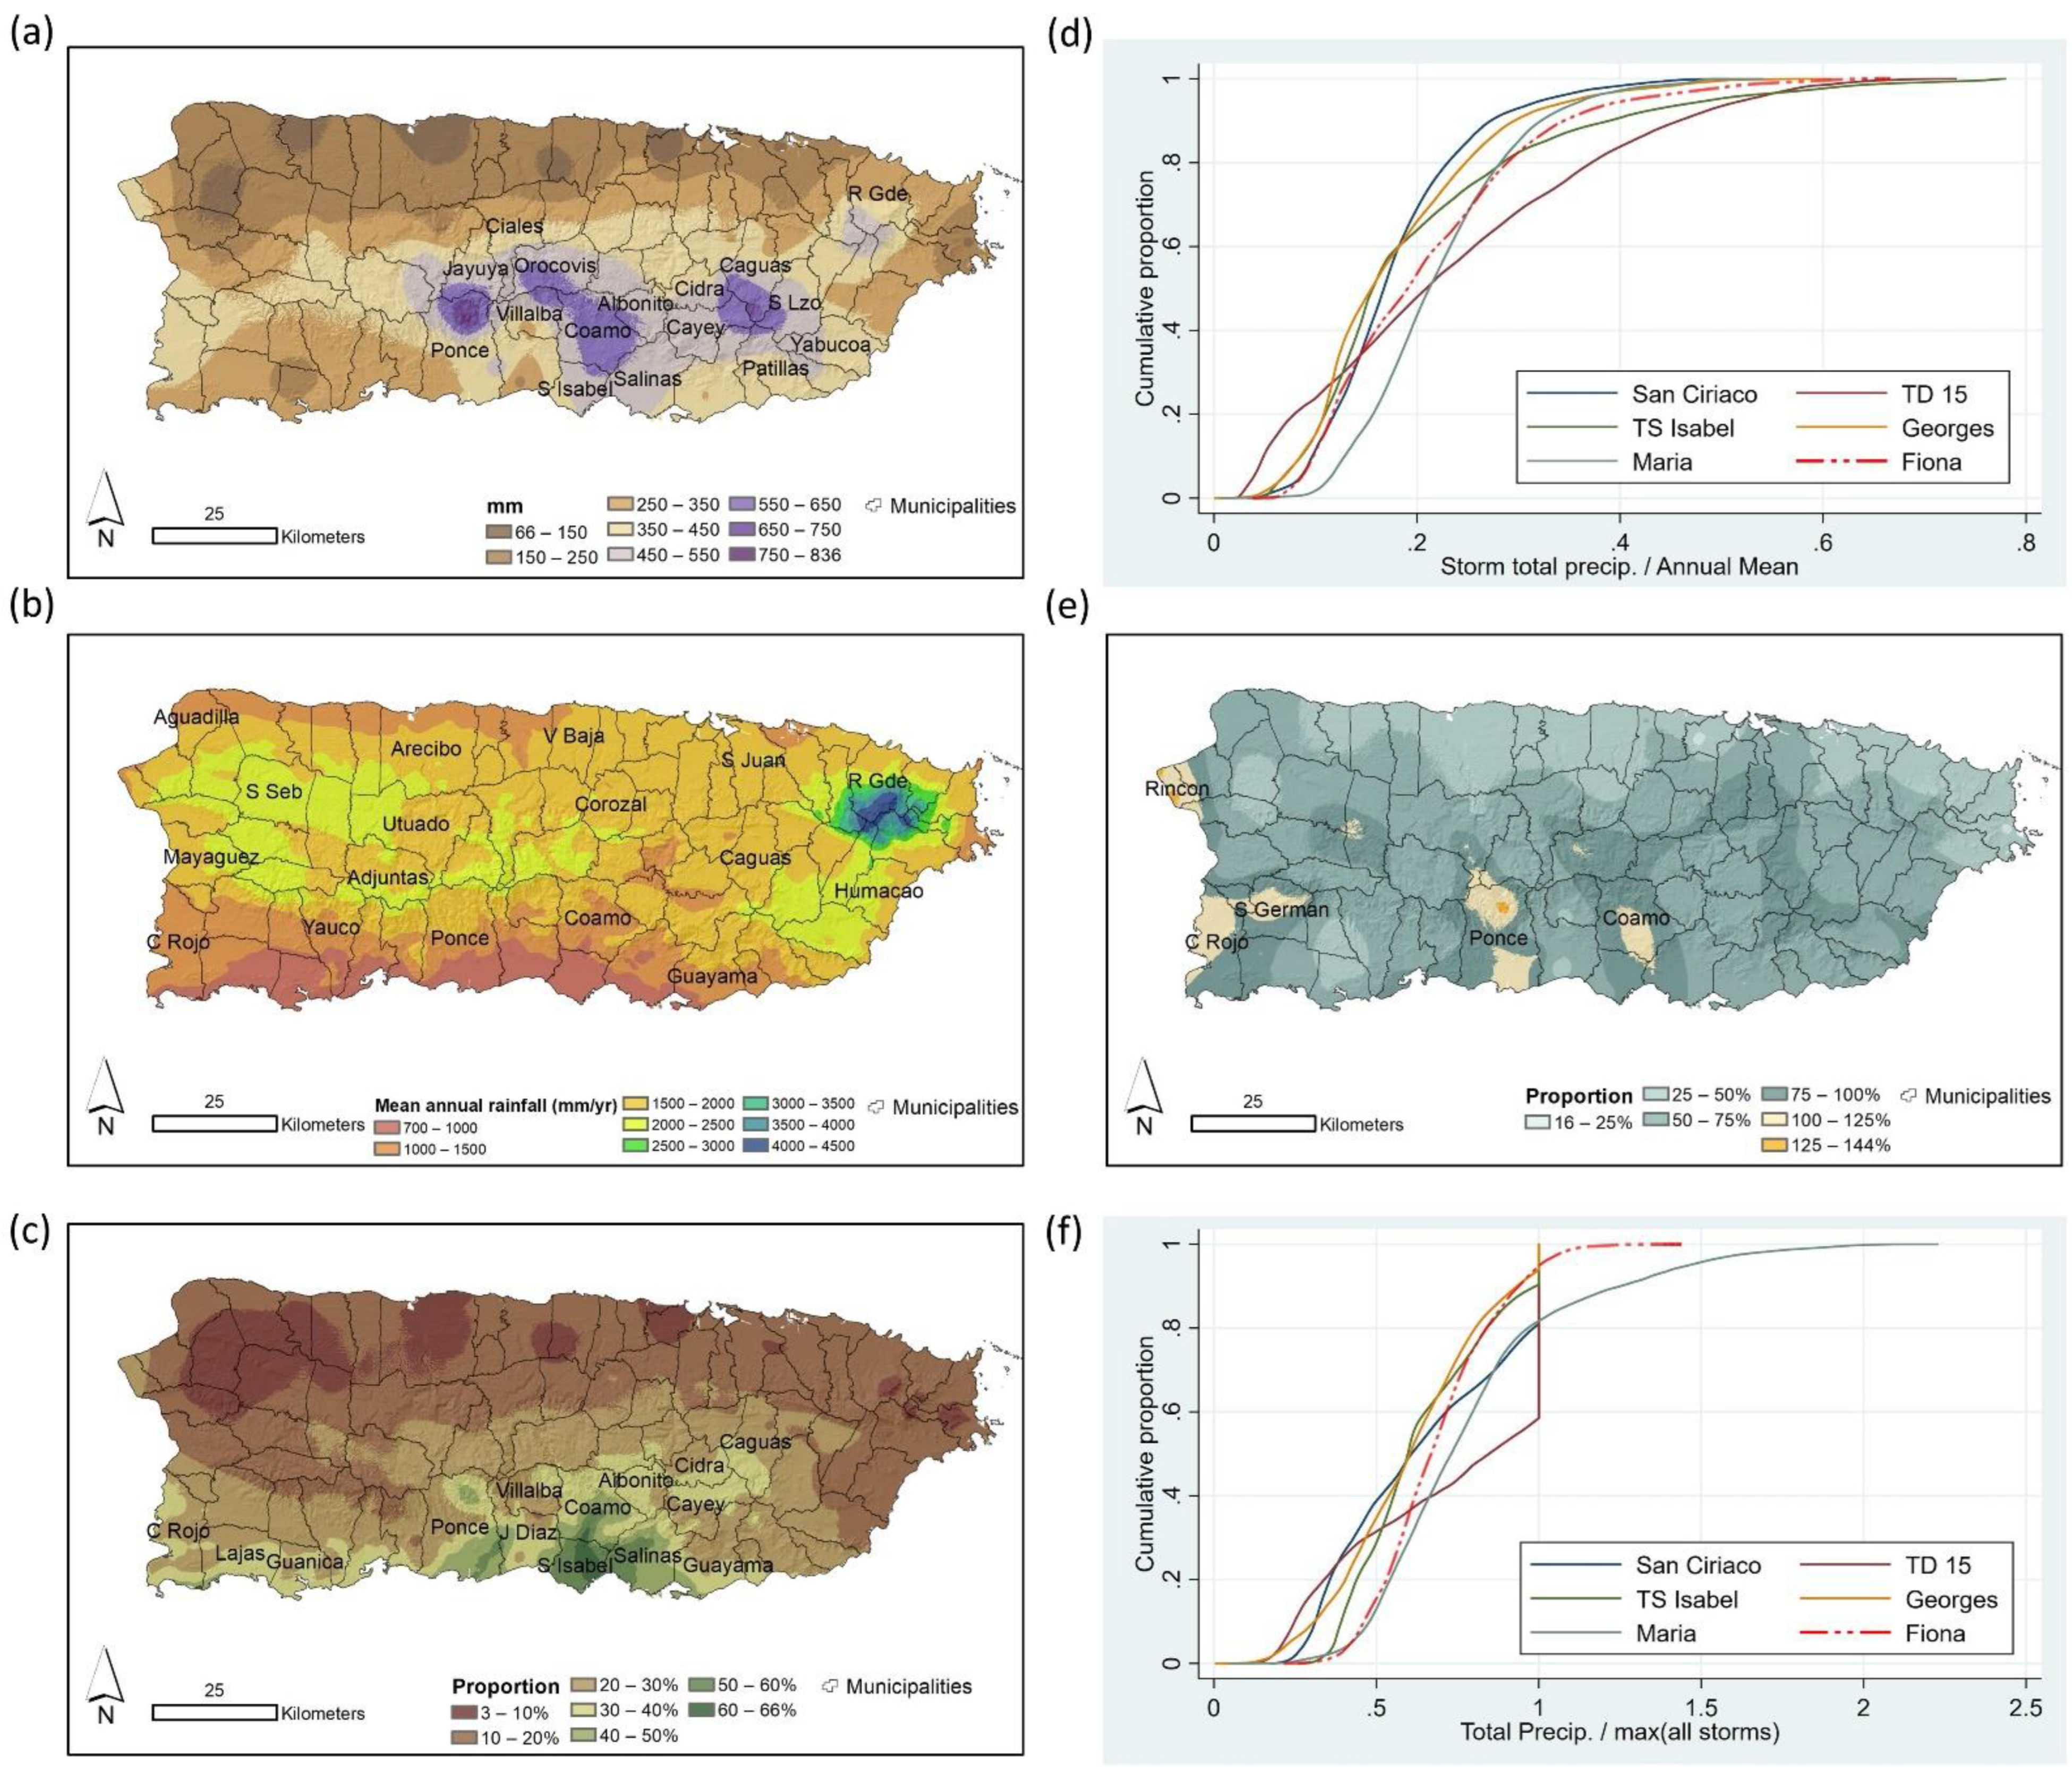
Rainfall associated with HF lasted from the 17th to the 19th of September 2022, with most of the rainfall (68% on average) occurring on the 18th. The maximum recorded rainfall (TR) at a weather station was 824 mm in the central-southern portions of the island near the boundary between the municipalities of Ponce and Jayuya (Río Cerrillos station: USGS 50113800). In this area, HF rainfall equaled about 45% of annual rainfall (Figure 5). This rainfall is the third maximum rainfall recorded at a single station during an individual tropical cyclone in PR since 1899 and is only surpassed by Tropical Depression #15 (TD15) in Jayuya (5–10 October 1970: 976 mm) and Huracán San Felipe II in Adjuntas (11–15 September 1928: 849 mm) [28].
Interpolations of weather station data based on cokriging analysis showed that significant amounts of rainfall exceeding 500 mm occurred in the central-southern and central-eastern portions of the island between the municipalities of Orocovis and Santa Isabel and from Salinas to Caguas (Figure 5). In the coastal municipalities of Santa Isabel and Salinas, HF’s TRequaled between 50 and 66% of annual normal rainfall. With the exception of rainfall totals reaching between 450–500 mm on the western side of the Sierra de Luquillo in the northeast island and on the southeast coast, TR values for the rest of PR were less than 350 mm and equaled 10–25% of annual rainfall.
The island-wide mean TR for HF was 336 mm according to the interpolated raster. This places HF third in average mean annual rainfall, only behind TD15 (379 mm) and HM (363 mm) [28]. TR during HF exceeded the maximum recorded during all TCs from 1899 to 2017 (excluding HM) for only about 3.5% of the island in the municipalities of Ponce, Coamo, Cabo Rojo, San Germán, and Rincón. In contrast, about 19% of the island experienced rainfall totals during HM that exceeded the maximum ever recorded for a TC since 1899.

3.2. Peak Flows

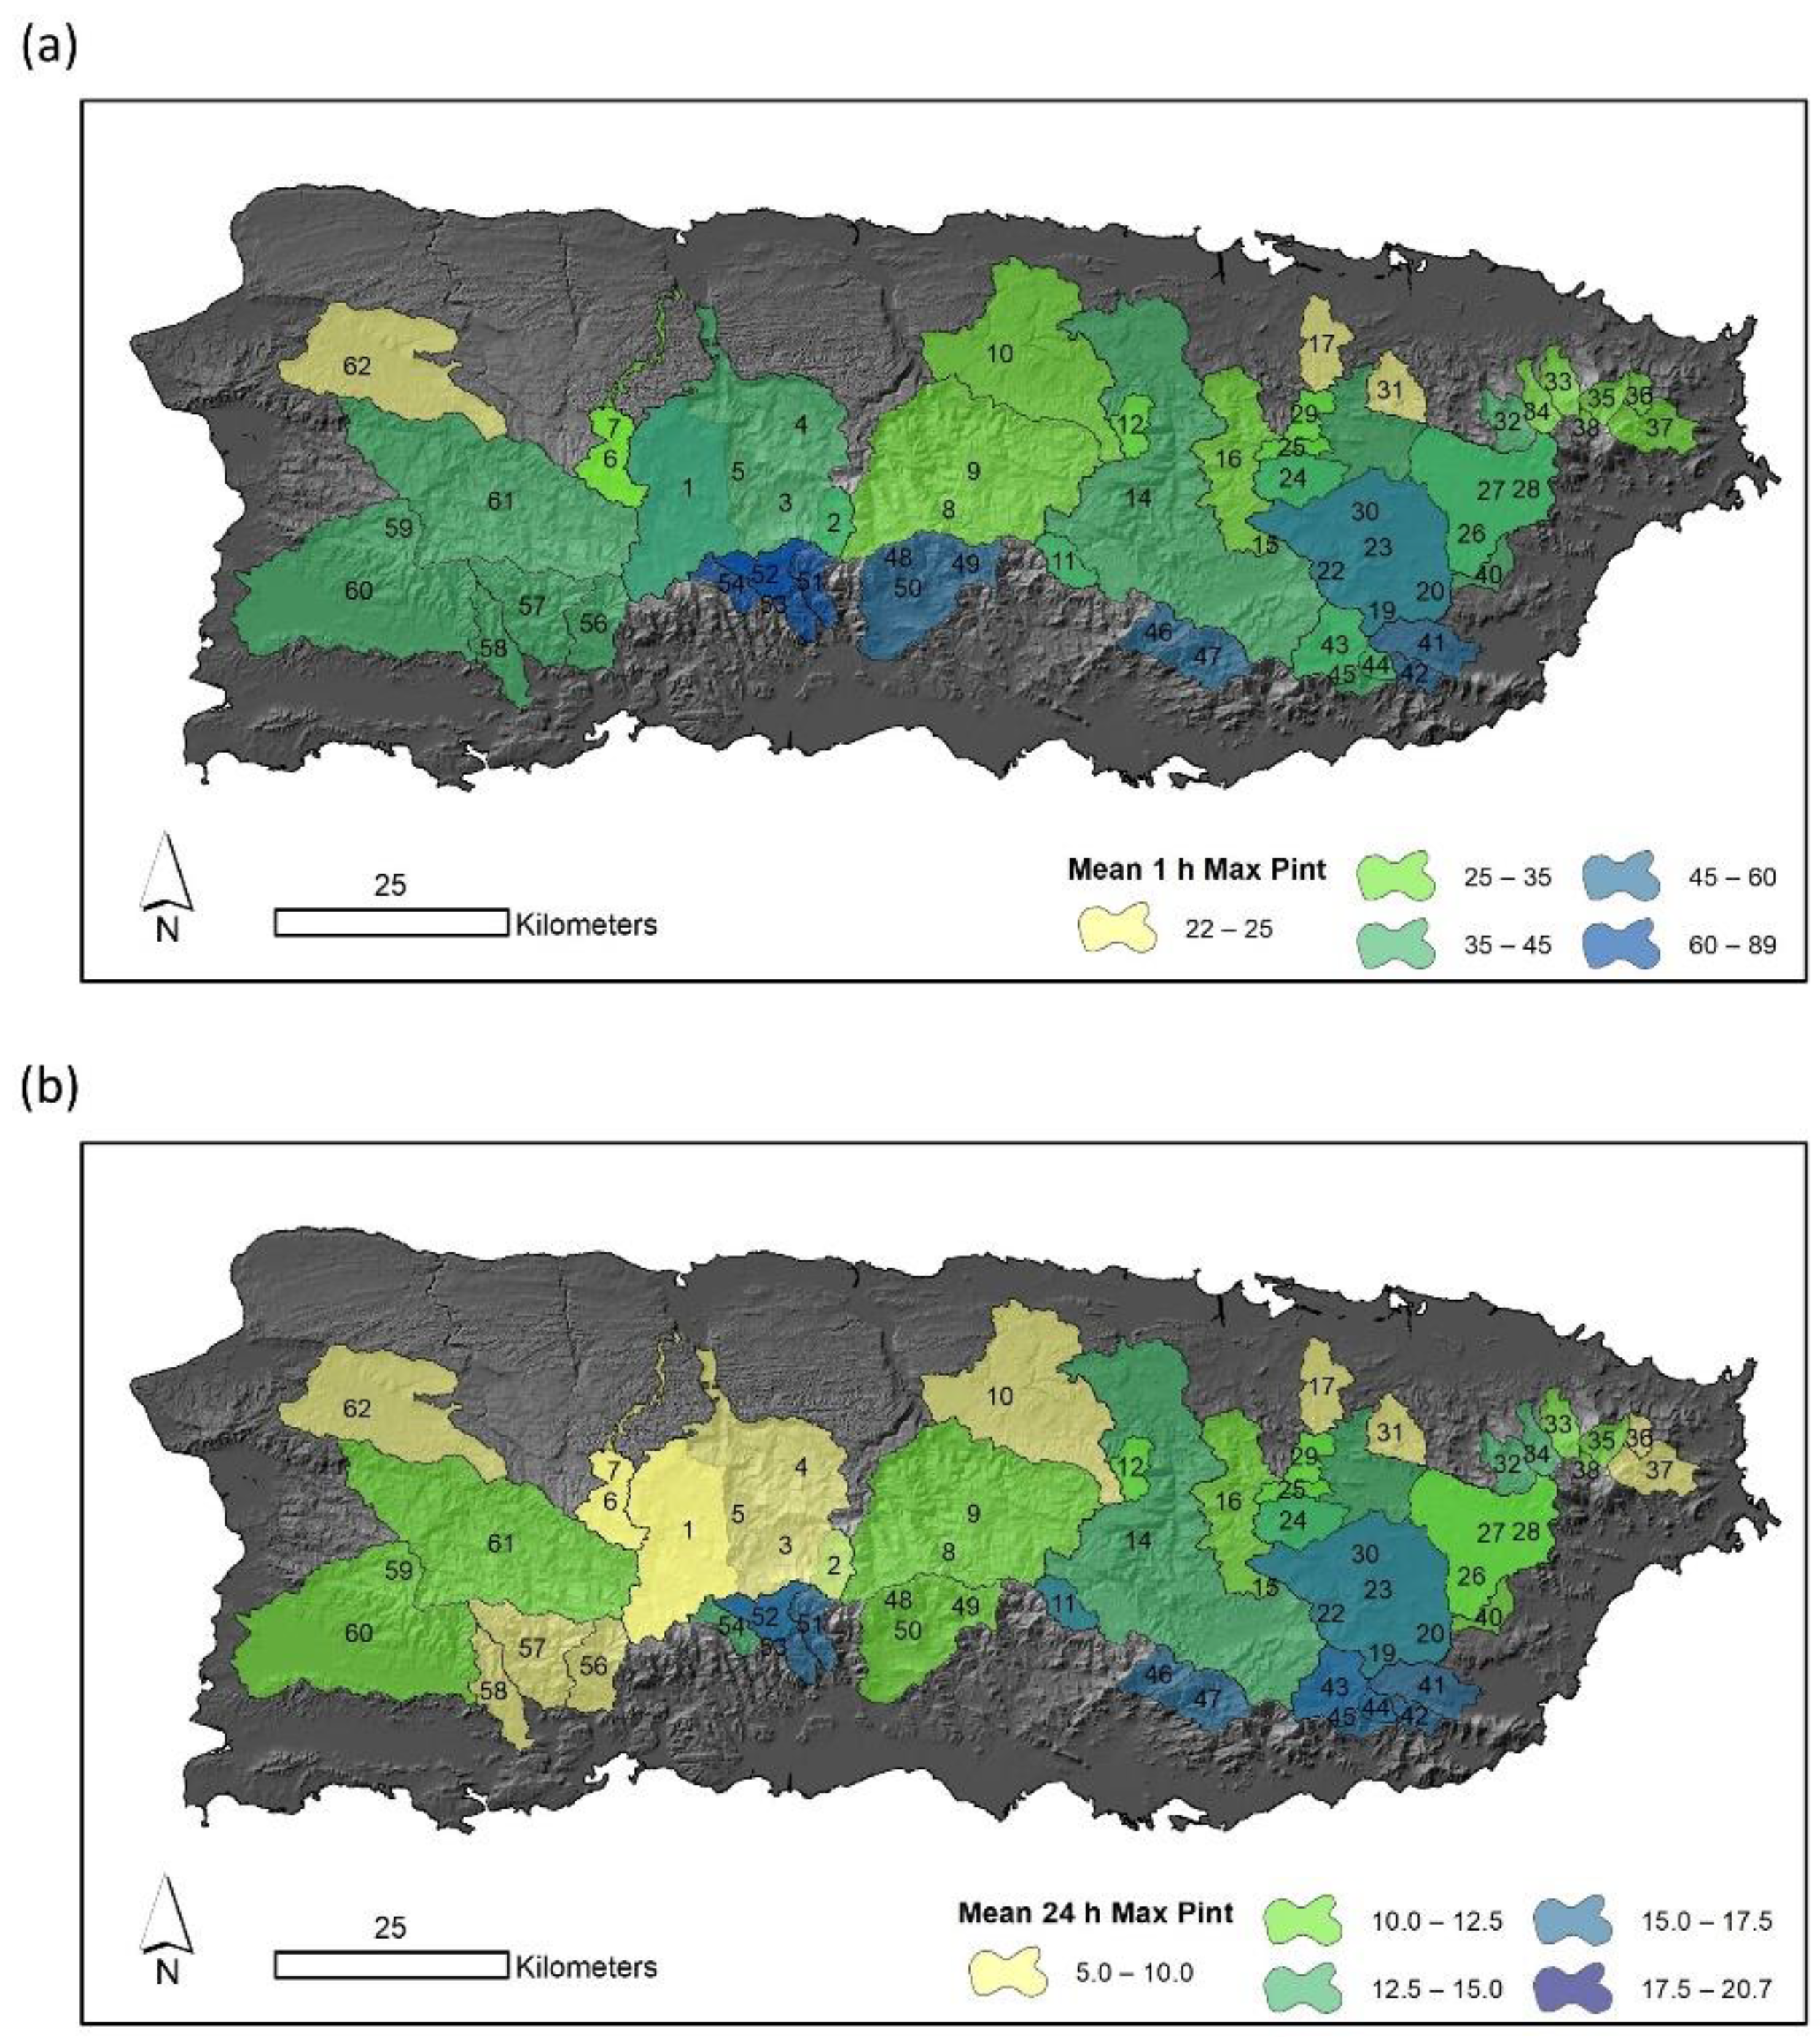
Watersheds with relatively high mean 1 h Pint values exceeding 45 mm h−1 during HF include those in the interior central (e.g., Río Grande de Loíza), southeastern (e.g., Ríos Guayanés, Patillas, Lapa, and Majada), and southern central (e.g., headwaters of Río Jacaguas and Ríos Inabón and Cerrillos) regions (Figure 6). In terms of the mean 24 h Pint, watersheds with high values exceeding 15 mm h−1 included the upper portions of the Río Grande de Loíza and small watersheds in the eastern and south-central portions of the island (e.g., Ríos Guayanés, Majada, and Inabón). In summary, rivers draining towards the north coast of PR, with the exception of portions of the Río Grande de Loíza, had the lowest watershed-scale mean Pint values during HF. The highest Pint values are concentrated in watersheds of the interior east, eastern, and southern central portions of the island.
Area-normalized peak flows during HF ranged from a minimum of 0.14 m3 s−1 km−2 (0.50 mm h−1) at the Río Cerrillos near Ponce station, located below the Cerrillos dam in south central PR (Map #53) to a maximum of 15.3 m3 s−1 km−2 (55.1 mm h−1) at the Río Humacao at Las Piedras station in southeastern PR (Map #40). Notable deviations between observed Qpa values and Qpa excep occurred at Río Gurabo at Gurabo (3.83 times greater than Equation (5); Map #27), Río Cagüitas at Villa Blanca (3.39 times greater; Map #24), Río Guanajibo (3.36 times greater; Map #60), Río Grande de Loíza below the Carraízo dam (3.12 times greater; Map #30), Río Grande de Loíza at Caguas (3.08 times greater; Map #23), and at Río de La Plata at Toa Alta (3.04 times greater; Map #14). All of these, with the exception of the Río Guanajibo station, are located in Zone 2 (eastern region) [42].
No Qpa value during HF reached the 95% confidence interval for the world’s or PR’s flood envelope curves (Ramos-Scharron et al., 2021; Equations (6) and (7), respectively). The geometric mean of all Qpa values for HF in PR was 6.54 m3 s−1 km−2 (23.5 mm h−1) and followed the expected general declining trend with increasing drainage area (Figure 7). Out of the 62 Qpa observations, a total of 43 (69%) exceeded values considered exceptional (Equation (5)); twenty of those occurred within Zone 1 and 23 within Zone 2. The average Q p a / Q p a   s i g ratio for HF equals 1.60. Therefore, in terms of island-wide Qpa magnitude, HF ranks 12th, almost tied with Tropical Storm Santa Clara in 1956 (67% of stations exceeding Qpa excep and an average Q p a / Q p a   e x c e p ratio of 1.45) [40].
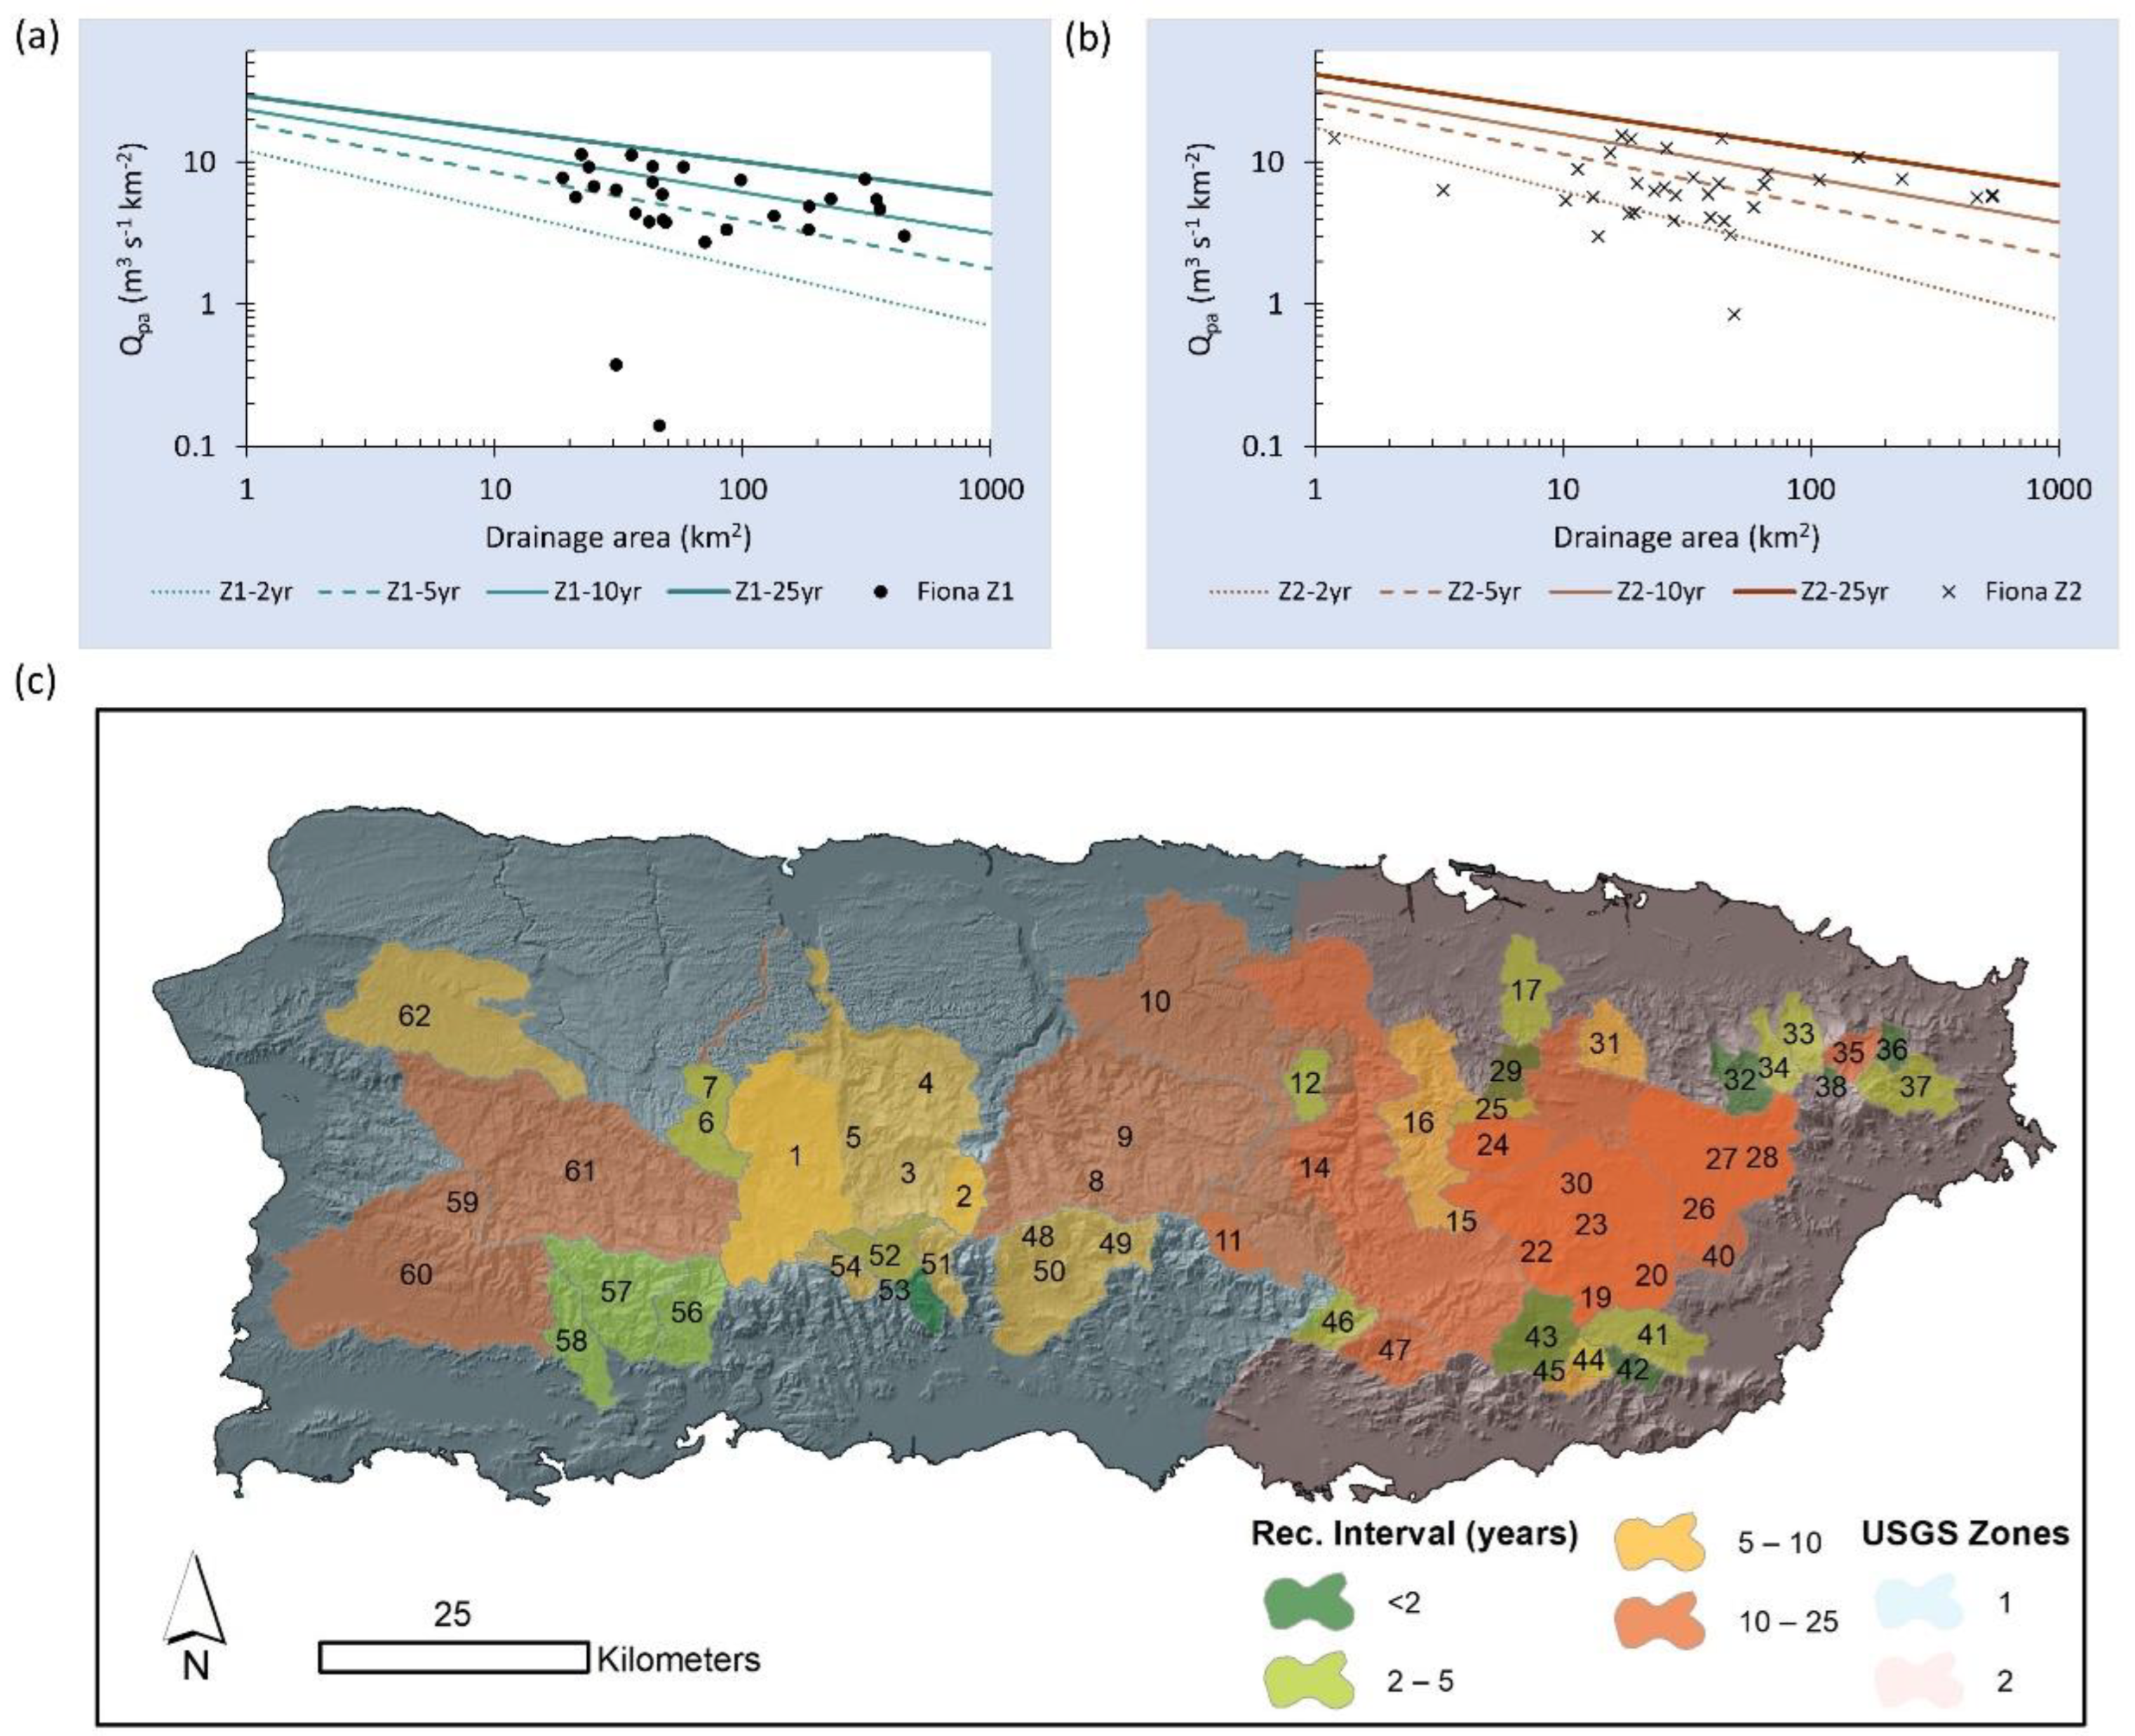
Overall, 51 out of the 62 Qpa observations (82%) during HF exceeded the 2 yr recurrence interval mark (Figure 8). None of the observed values in PR reached or exceeded 25 yr recurrence interval levels. Within Zone 1, all of the 28 stations, with the exception of two (Río Cerrillos near Ponce below the Cerrillos dam, Map #53, and Río Portugués at Tibes below the Portugués dam, Map #55) had Qpa values greater than 2 yr RI. In contrast, 9 out of the 34 stations in Zone 2 (26%) reported Qpa values less than the 2 yr RI values. None of these rivers in Zone 2 are obstructed by dams. About 27% of all Qpa observations had recurrence intervals between 2 and 5 years, with very similar proportions for both zones. Island wide, 26% and 29% of the stations had Qpa values in the 5–10 yr and 10–25 yr recurrence interval range, respectively. The proportion of watersheds in the 5–10-year recurrence interval category for Zone 1 (36%) was twice that in Zone 2 (18%). In summary, the vast majority of Qpa observations during HF in PR represented instantaneous peak flows with recurrence intervals ranging from 2 years to less than 25 years, with the majority of the highest values concentrating in the central-eastern and southeastern portions of the island (Table 2).
A total of 60 stream flow measuring stations in PR captured Qp data during both HM and HF. Out of those, a total of 11 displayed Qp values during HF that exceeded those during HM. These stations were Río Bayamón near Bayamon, Río Cayaguas at Cerro Gordo, Río Turabo above Borinquen, Río Grande de Loíza at Caguas, Rio Cagüitas at Villa Blanca, Río Humacao at Las Piedras, Río Guayanés near Yabucoa, Río Marín near Patillas, Río Grande de Patillas below Lago Patillas, Río Portugués near Tibes, and Río Guanajibo near Hormigueros.

4. Conclusions

Some of the highest rainfall totals and daily rain intensities associated with individual tropical cyclones ever recorded in the North Atlantic have been observed in Puerto Rico, particularly over the past three decades. This study relied on rainfall and instantaneous peak flow data to examine the hydro-meteorological characteristics of Hurricane Fiona in Puerto Rico and how these compare to other tropical cyclones that have affected the island since 1899. Cokriging interpolation surfaces for 1 h and 24 h maximum rainfall intensities and total event rainfall were used to examine the spatial characteristics of each tropical cyclone. The area-normalized instantaneous peak discharge data associated with Hurricane Fiona was compared with the world’s and Puerto Rico’s flood envelopes, previous observations, and locally-derived recurrence intervals.
Maximum hourly rain intensities during Hurricane Fiona did not surpass the 2-year rainfall intensities over 96% of the island, with recurrence intervals exceeding the 2-year threshold. However, the island-wide average 24 h maximum intensities place Hurricane Fiona as the fourth-ranked tropical cyclone that has affected PR since 1899, only behind Hurricanes María in 2017, San Ciriaco in 1899, and Georges in 1998. The maximum recorded rainfall at a station was 824 mm in the central-southern region of the island, and the island-averaged total rainfall is now the third maximum precipitation accumulation recorded in Puerto Rico since 1899. Overall, 82% of the peak flow observations exceeded the 2-year recurrence interval mark, with 55% of the values in the 5–25-year recurrence interval range and no values reaching the 25-year threshold. None of the values matched either the world’s or Puerto Rico’s flood envelope curve.
Even though Hurricane María was a more extreme hydrometeorological event than Fiona, some of Hurricane Fiona’s characteristics are similar to the highest daily and total rainfalls ever recorded in Puerto Rico. These types of extreme storms are projected to become more frequent in the Insular Caribbean. Recent work has found connections between climate change and extreme precipitation events associated with tropical cyclones in the North Atlantic basin. Future research will examine how much of the extreme rainfall associated with Hurricane Fiona could be attributed to human-induced climate change. Additionally, documenting the hydro-meteorological characteristics of tropical cyclones in light of their socio-economic and environmental impacts is an important step in understanding and addressing human and ecosystem vulnerabilities. The results of this study are presented here as an initial product of ongoing research efforts intended to address these issues.

Author Contributions

Conceptualization, C.E.R.S. and J.J.H.A.; Data curation, C.E.R.S. and F.R.; Formal analysis, C.E.R.S. and E.Y.A.; Investigation, C.E.R.S. and J.J.H.A.; Methodology, C.E.R.S. and E.Y.A.; Supervision, C.E.R.S.; Visualization, C.E.R.S., J.J.H.A. and E.Y.A.; Writing—original draft, C.E.R.S. and J.J.H.A.; Writing—review & editing, C.E.R.S., J.J.H.A., E.Y.A. and F.R. All authors have read and agreed to the published version of the manuscript.

Funding

This research received no external funding.

Data Availability Statement

Data that supports the findings of this study are available from the corresponding author, CERS, upon request.

Acknowledgments

Many thanks to K.S. Hughes (UPR-Mayaguez) for providing access to data from several USGS stations not accessible via online databases and to four anonymous reviewers for helping improve the quality of this article.

Conflicts of Interest

The authors declare no conflict of interest.

References

  1. National-Weather-Service. Hurricane Fiona—17–19 September 2022. Available online: https://www.weather.gov/sju/fiona2022 (accessed on 23 November 2022).
  2. Kim, J. Fiona Destroyed Most of Puerto Rico’s Plantain Crops—A Staple for People’s Diet; NPR News: Washington, DC, USA, 2022. [Google Scholar]
  3. Negri, A.J.; Burkardt, N.; Golden, J.H.; Halverson, J.B.; Huffman, G.J.; Larsen, M.C.; McGinley, J.A.; Updike, R.G.; Verdin, J.P.; Wieczorek, G.F. The hurricane-flood-landslide continuum. Bull. Am. Meteorol. Soc. 2005, 86, 1241–1247. [Google Scholar] [CrossRef]
  4. Needham, H.F.; Keim, B.D.; Sathiaraj, D. A review of tropical cyclone-generated storm surges: Global data sources, observations, and impacts. Rev. Geophys. 2015, 53, 545–591. [Google Scholar] [CrossRef]
  5. Song, J.Y.; Alipour, A.; Moftakhari, H.R.; Moradkhani, H. Toward a more effective hurricane hazard communication. Environ. Res. Lett. 2020, 15, 064012. [Google Scholar] [CrossRef]
  6. Bakkensen, L.A.; Park, D.-S.R.; Sarkar, R.S.R. Climate costs of tropical cyclone losses also depend on rain. Environ. Res. Lett. 2018, 13, 074034. [Google Scholar] [CrossRef]
  7. Kantha, L. Time to replace the Saffir-Simpson hurricane scale? Eos Trans. Am. Geophys. Union 2006, 87, 3–6. [Google Scholar] [CrossRef]
  8. Cruz-Martínez, G.; Arrigoitia, M.F.; Camacho, J.O.; Román-Velazquez, P. The making of Caribbean not-so-natural disasters. Alternautas 2018, 5. [Google Scholar] [CrossRef]
  9. Rezapour, M.; Baldock, T.E. Classification of hurricane hazards: The importance of rainfall. Weather. Forecast. 2014, 29, 1319–1331. [Google Scholar] [CrossRef]
  10. National-Hurricane-Center. Hurricane Fiona Intermediate Advisory Number 17A. Available online: https://www.nhc.noaa.gov/archive/2022/al07/al072022.public_a.017.shtml? (accessed on 23 November 2022).
  11. Hernández Ayala, J.J.; Méndez-Tejeda, R. How much rainfall did Hurricane María really drop in Puerto Rico? Weather 2020, 76, 313–316. [Google Scholar] [CrossRef]
  12. Hernández, A.R.; Murphy, Z. Hurricane Fiona Hit Puerto Rico as a Category 1 Storm. Flooding still Wrought Havoc; The Washington Post: Washington, DC, USA, 2022. [Google Scholar]
  13. Miller, P.W.; Kumar, A.; Mote, T.L.; Moraes, F.D.S.; Mishra, D.R. Persistent hydrological consequences of Hurricane Maria in Puerto Rico. Geophys. Res. Lett. 2019, 46, 1413–1422. [Google Scholar] [CrossRef]
  14. Ávila-Claudio, R. Huracán Fiona—”Nunca he Visto Nada Igual”: Las Graves Inundaciones y Destrozos que ha Causado el Ciclón en Puerto Rico; BBC News Mundo: London, UK, 2022. [Google Scholar]
  15. Casanova-Burgess, A. “Hurricane Maria Never Finished Leaving us”: The Aftermath of Fiona in a Puerto Rican Town; New Yorker: New York, NY, USA, 2022. [Google Scholar]
  16. McSorley, A.M.M. Hurricane Fiona Exposes More Than Crumbling Infrastructure in Puerto Rico; Center for the Study of Racism, Social Justice & Health: Los Angeles, CA, USA, 2022. [Google Scholar]
  17. Wilkinson, J. Hurricane Fiona Death Toll Climbs to 25 in Puerto Rico; New York Daily News: New York, NY, USA, 2022. [Google Scholar]
  18. Kishore, N.; Marqués, D.; Mahmud, A.; Kiang, M.V.; Rodriguez, I.; Fuller, A.; Ebner, P.; Sorensen, C.; Racy, F.; Lemery, J.; et al. Mortality in Puerto Rico after Hurricane Maria. N. Engl. J. Med. 2018, 379, 162–170. [Google Scholar] [CrossRef] [Green Version]
  19. Lim, Y.-K.; Schubert, S.D.; Kovach, R.; Molod, A.M.; Pawson, S. The roles of climate change and climate variability in the 2017 Atlantic hurricane season. Sci. Rep. 2018, 8, 16172. [Google Scholar] [CrossRef] [PubMed]
  20. Hernández Ayala, J.J.; Méndez-Tejeda, R. The extremely active 2020 hurricane season in the North Atlantic and its relation to climate variability and change. Atmosphere 2022, 13, 1945. [Google Scholar] [CrossRef]
  21. Taylor, M.A.; Stephenson, T.S.; Chen, A.A.; Stephenson, K.A. Climate change and the Caribbean: Review and response. Caribb. Stud. 2012, 40, 169–200. [Google Scholar] [CrossRef]
  22. Kim, J.-H.; Ho, C.-H.; Lee, M.-H.; Jeong, J.-H.; Chen, D. Large increase in heavy rainfall associated with tropical cyclone landfalls in Korea after the late 1970s. Geophys. Res. Lett. 2006, 33. [Google Scholar] [CrossRef]
  23. Lau, W.K.M.; Zhou, Y.P. Observed recent trends in tropical cyclone rainfall over the North Atlantic and the North Pacific. J. Geophys. Res. Atmos. 2012, 117. [Google Scholar] [CrossRef]
  24. Blake, E.S. The 2017 Atlantic Hurricane Season: Catastrophic Losses and Costs. Weatherwise 2018, 71, 28–37. [Google Scholar] [CrossRef]
  25. Kossin, J.P. A global slowdown of tropical-cyclone translation speed. Nature 2018, 558, 104–107. [Google Scholar] [CrossRef]
  26. Nugent, A.D.; Rios-Berrios, R. Factors Leading to Extreme Precipitation on Dominica from Tropical Storm Erika (2015). Mon. Weather. Rev. 2018, 146, 525–541. [Google Scholar] [CrossRef]
  27. Reed, K.A.; Wehner, M.F.; Zarzycki, C.M. Attribution of 2020 hurricane season extreme rainfall to human-induced climate change. Nat. Commun. 2022, 13, 1905. [Google Scholar] [CrossRef]
  28. Ramos Scharrón, C.E.; Arima, E. Hurricane Maria’s Precipitation Signature in Puerto Rico: A Conceivable Presage of Rains to Come. Sci. Rep. 2019, 9, 15612. [Google Scholar] [CrossRef] [Green Version]
  29. Keellings, D.; Hernández-Ayala, J.J. Extreme rainfall associated with Hurricane Maria over Puerto Rico and its connections to climate variability and change. Geophys. Res. Lett. 2019, 46, 2964–2973. [Google Scholar] [CrossRef]
  30. Mejia Manrique, S.A.; Harmsen, E.W.; Khanbilvardi, R.M.; González, J.E. Flood impacts on critical infrastructure in a coastal floodplain in Western Puerto Rico during Hurricane María. Hydrology 2021, 8, 104. [Google Scholar] [CrossRef]
  31. Gupta, A.; Hassan, M.; Slaymaker, O.; Berkowicz, S. Hurricane Floods as Extreme Geomorphic Events; IAHS Publication: Wallingford, UK, 2000; pp. 215–228. [Google Scholar]
  32. O’Connor, J.E.; Grant, G.E.; Costa, J.E. The geology and geography of floods. Anc. Floods Mod. Hazards Appl. Paleoflood Hydrol. Water Sci. Appl. Am. Geophys. Union 2002, 5, 359–395. [Google Scholar]
  33. Castellarin, A. Probabilistic envelope curves for design flood estimation at ungauged sites. Water Resour. Res. 2007, 43, W04406. [Google Scholar] [CrossRef]
  34. O’Connor, J.E.; Costa, J.E. Spatial distribution of the largest rainfall-runoff floods from basins between 2.6 and 26,000 km2 in the United States and Puerto Rico. Water Resour. Res. 2004, 40, W01107. [Google Scholar] [CrossRef]
  35. Costa, J.E. Hydraulics and basin morphometry of the largest flash floods in the conterminous United States. J. Hydrol. 1987, 93, 313–338. [Google Scholar] [CrossRef]
  36. Pitlick, J. Relation between peak flows, precipitation, and physiography for five mountainous regions in the western USA. J. Hydrol. 1994, 158, 219–240. [Google Scholar] [CrossRef]
  37. Herschy, R. The world’s maximum observed floods. Flow Meas. Instrum. 2002, 13, 231–235. [Google Scholar] [CrossRef]
  38. Ogden, F.L. Evidence of equilibrium peak runoff rates in steep tropical terrain on the island of Dominica during Tropical Storm Erika, August 27, 2015. J. Hydrol. 2016, 542, 35–46. [Google Scholar] [CrossRef]
  39. Costa, J.E. A comparison of the largest rainfall-runoff floods in the United States with those of the People’s Republic of China and the world. J. Hydrol. 1987, 96, 101–115. [Google Scholar] [CrossRef]
  40. Ramos Scharrón, C.E.; Garnett, C.T.; Arima, E.Y. A Catalogue of Tropical Cyclone Induced Instantaneous Peak Flows Recorded in Puerto Rico and a Comparison with the World’s Maxima. Hydrology 2021, 8, 84. [Google Scholar] [CrossRef]
  41. Ramos-Ginés, O. Estimation of Magnitude and Frequency of Floods for Streams in Puerto Rico: New Empirical Models; Water-Resources Investigations Report 99-4142; US Geological Survey: San Juan, Puerto Rico, 1999.
  42. Ryan, P.J.; Gotvald, A.J.; Hazelbaker, C.L.; Veilleux, A.G.; Wagner, D.M. Development of Regression Equations for the Estimation of the Magntidue and Frequency of Floods at Rural, Unregulated Gaged and Ungaged Streams in Puerto Rico through Water Year 2017; US Geological Survey: Reston, VA, USA, 2021.
  43. Daly, C.; Helmer, E.H.; Quiñones, M. Mapping the climate of Puerto Rico, Vieques, and Culebra. Int. J. Climatol. A J. R. Meteorol. Soc. 2003, 23, 1359–1381. [Google Scholar] [CrossRef]
  44. Méndez-Lázaro, P.A.; Nieves-Santiango, A.; Miranda-Bermúdez, J. Trends in total rainfall, heavy rain events, and number of dry days in San Juan, Puerto Rico, 1955–2009. Ecol. Soc. 2014, 19, 50. [Google Scholar] [CrossRef]
  45. Hernández Ayala, J.J.; Keellings, D.; Waylen, P.R.; Matyas, C.J. Extreme floods and their relationship with tropical cyclones in Puerto Rico. Hydrol. Sci. J. 2017, 62, 2103–2119. [Google Scholar] [CrossRef]
  46. Hayhoe, K. Quantifying Key Drivers of Climate Variability and Change for Puerto Rico and the Caribbean: Final Report. Available online: http://www.pr-ccc.org/wp-content/uploads/2014/08/PP_1-52_Hayhoe_Caribbean_Final_Report.pdf (accessed on 31 January 2021).
  47. Khalyani, A.H.; Gould, W.A.; Harmsen, E.; Terando, A.; Quinones, M.; Collazo, J.A. Climate change implications for tropical islands: Interpolating and interpreting statistically downscaled GCM projections for management and planning. J. Appl. Meteorol. Climatol. 2016, 55, 265–282. [Google Scholar] [CrossRef]
  48. Scatena, F.; Larsen, M.C. Physical aspects of hurricane Hugo in Puerto Rico. Biotropica 1991, 23, 317–323. [Google Scholar] [CrossRef]
  49. Hernández Ayala, J.J.; Matyas, C.J. Spatial distribution of tropical cyclone rainfall and its contribution to the climatology of Puerto Rico. Phys. Geogr. 2018, 39, 1–20. [Google Scholar] [CrossRef]
  50. Smith, J.A.; Sturdevant-Rees, P.; Baeck, M.L.; Larsen, M.C. Tropical cyclones and the flood hydrology of Puerto Rico. Water Resour. Res. 2005, 41. [Google Scholar] [CrossRef]
  51. Monroe, W.H. Some Tropical Landforms of Puerto Rico; Professional Paper 1159; US Geological Survey: Reston, VA, USA, 1980.
  52. Soto, S.; Pintó, J. Delineation of natural landscape units for Puerto Rico. Appl. Geogr. 2010, 30, 720–730. [Google Scholar] [CrossRef]
  53. Parés-Ramos, I.K.; Gould, W.A.; Aide, T.M. Agricultural abandonment, suburban growth, and forest expansion in Puerto Rico between 1991 and 2000. Ecol. Soc. 2008, 13. [Google Scholar] [CrossRef]
  54. Helmer, E.; Ramos, O.; López, T.d.M.; Quinones, M.; Diaz, W. Mapping the forest type and land cover of Puerto Rico, a component of the Caribbean biodiversity hotspot. Caribb. J. Sci. 2002, 38, 165–183. [Google Scholar]
  55. Grau, H.R.; Aide, T.M.; Zimmerman, J.K.; Thomlinson, J.R.; Helmer, E.; Zou, X. The ecological consequences of socioeconomic and land-use changes in postagriculture Puerto Rico. BioScience 2003, 53, 1159–1168. [Google Scholar] [CrossRef]
  56. Rudel, T.K.; Perez-Lugo, M.; Zichal, H. When fields revert to forest: Development and spontaneous reforestation in post-war Puerto Rico. Prof. Geogr. 2000, 52, 386–397. [Google Scholar] [CrossRef]
  57. Gould, W.A.; Alarcón, C.; Fevold, B.; Jiménez, M.E.; Martinuzzi, S.; Potts, G.; Quiñones, M.; Solórzano, M.; Ventosa, E. The Puerto Rico Gap Analysis Project Volume 1: Land Cover, Vertebrate Species Distributions, and Land Stewardship; United States Department of Agriculture, Forest Service, International Institute of Tropical Forestry: Río Piedras, Puerto Rico, 2008.
  58. Thomas, M.A.; Mirus, B.B.; Smith, J.B. Hillslopes in humid-tropical climates aren’t always wet: Implications for hydrologic response and landslide initiation in Puerto Rico. Hydrol. Process. 2020, 34, 4307–4318. [Google Scholar] [CrossRef]
  59. Schellekens, J. The interception and runoff generating processes in the Bisley catchment, Luquillo Experimental Forest, Puerto Rico. Phys. Chem. Earth Part B Hydrol. Ocean. Atmos. 2000, 25, 659–664. [Google Scholar] [CrossRef]
  60. Ahmad, R.; Scatena, F.; Gupta, A. Morphology and sedimentation in Caribbean montane streams: Examples from Jamaica and Puerto Rico. Sediment. Geol. 1993, 85, 157–169. [Google Scholar] [CrossRef]
  61. Li, Y.; Wright, D.B.; Byrne, P.K. The Influence of tropical cyclones on the evolution of river conveyance capacity in Puerto Rico. Water Resour. Res. 2020, 56, e2020WR027971. [Google Scholar] [CrossRef]
  62. U.S.-Geological-Survey. National Water Information System data available on the World Wide Web. USGS Water Data Nation 2022, 56, e2020WR027971. [Google Scholar] [CrossRef]
  63. National Oceanic and Atmospheric Administration (NOAA). NOAA, National Climatic Data Center, Climate Data Online: Map & Application Search; National Oceanic and Atmospheric Administration (NOAA): Washington, DC, USA, 2022.
  64. Hernández Ayala, J.J.; Matyas, C.J. Tropical cyclone rainfall over Puerto Rico and its relations to environmental and storm-specific factors. Int. J. Climatol. 2016, 36, 2223–2237. [Google Scholar] [CrossRef]
  65. Goovaerts, P. Geostatistics for Natural Resources Evaluation; Oxford University Press on Demand: Oxford, UK, 1997. [Google Scholar]
  66. Goovaerts, P. Geostatistical approaches for incorporating elevation into the spatial interpolation of rainfall. J. Hydrol. 2000, 228, 113–129. [Google Scholar] [CrossRef]
  67. Malmgren, B.A.; Winter, A. Climate zonation in Puerto Rico based on principal components analysis and an artificial neural network. J. Clim. 1999, 12, 977–985. [Google Scholar] [CrossRef]
  68. Garcia-Martinó, A.R.; Warner, G.S.; Scatena, F.N.; Civco, D.L. Rainfall, runoff and elevation relationships in the Luquillo Mountains of Puerto Rico. Caribb. J. Sci. 1996, 32, 413–424. [Google Scholar]
  69. Smith, R.B.; Schafer, P.; Kirshbaum, D.; Regina, E. Orographic enhancement of precipitation inside Hurricane Dean. J. Hydrometeorol. 2009, 10, 820–831. [Google Scholar] [CrossRef]
  70. Smith, R.B.; Minder, J.R.; Nugent, A.D.; Storelvmo, T.; Kirshbaum, D.J.; Warren, R.; Lareau, N.; Palany, P.; James, A.; French, J. Orographic precipitation in the tropics: The Dominica Experiment. Bull. Am. Meteorol. Soc. 2012, 93, 1567–1579. [Google Scholar] [CrossRef]
  71. Bonnin, G.; Martin, D.; Lin, B.; Parzybok, T.; Yekta, M.; Riley, D. Precipitation-Frequency atlas of the United States—Puerto Rico and the U.S. Virgin Islands. NOAA Atlas 2006, 3, 1–143. [Google Scholar]
  72. Zhou, Y.; Lau, W.K.; Huffman, G.J. Mapping TRMM TMPA into average recurrence interval for monitoring extreme precipitation events. J. Appl. Meteorol. Climatol. 2015, 54, 979–995. [Google Scholar] [CrossRef]
  73. Miller, D.M. Reducing transformation bias in curve fitting. Am. Stat. 1984, 38, 124–126. [Google Scholar]
  74. Duan, N. Smearing estimate: A nonparametric retransformation method. J. Am. Stat. Assoc. 1983, 78, 605–610. [Google Scholar] [CrossRef]
  75. Turnipseed, D.P.; Sauer, V.B. Discharge Measurements at Gaging Stations; US Geological Survey; Chapter 8 of Book 3; Section A; Techniques and Methods 3; US Geological Survey: Reston, VA, USA, 2010; p. 87.
  76. Rakhecha, P. Highest floods in India. Iahs Publ. 2002, 271, 167–172. [Google Scholar]
  77. Li, C.; Wang, G.; Li, R. Maximum observed floods in China. Hydrol. Sci. J. 2013, 58, 728–735. [Google Scholar] [CrossRef]
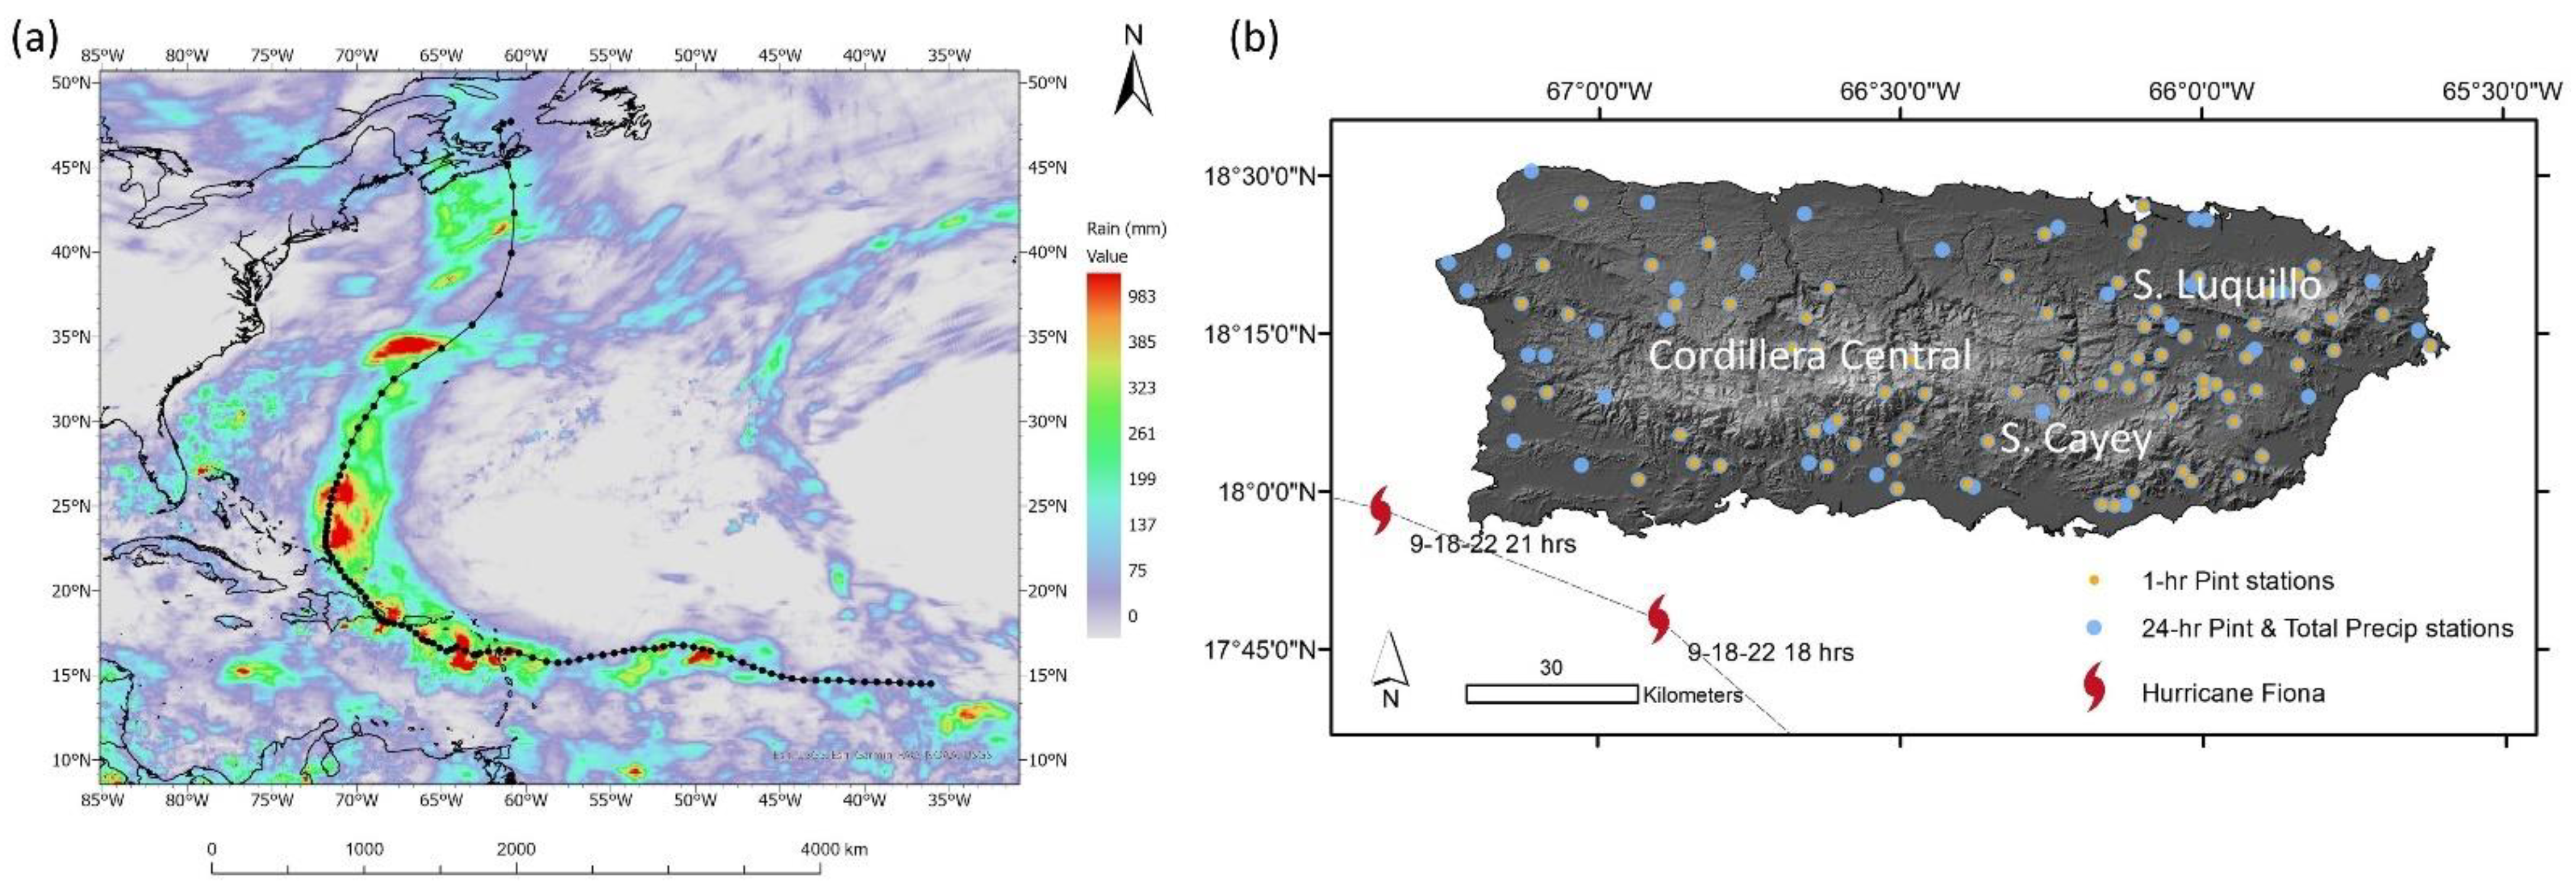
Figure 1. Hurricane Fiona track and location of rainfall measuring stations. (a) Complete six-hour timestep track for Hurricane Fiona (19–24 September 2022) and accumulated rainfall estimates from the Global Precipitation Mission [https://gpm.nasa.gov/data; accessed on 1 November 2022]. (b) Relief map of Puerto Rico showing Hurricane Fiona’s track in the vicinity of Puerto Rico and the location of weather stations measuring 1 h and 24 h rainfall intensities and total rainfall.
Hydrology 10 00040 g001
Figure 3. Hurricane Fiona’s 1 h Pint characteristics. (a) Hour-by-hour cumulative rainfall totals for three stations at different locations in the eastern (Lago Guayabal), central (Río Cerrillos), and western (Río Guanajibo) portions of Puerto Rico; (b) Spatial distribution of 1 h Pint in mm h−1 during Hurricane Fiona based on cokriging analyses of data collected from 77 recording weather stations; (c) Spatial distribution of 1 h Pint recurrence intervals for Hurricane Fiona.
Hydrology 10 00040 g003
Figure 4. Hurricane Fiona’s 24 h Pint characteristics. (a) Spatial distribution of 24 h Pint in mm h−1 during Hurricane Fiona based on co-kriging analysis on data collected at 112 weather stations; (b) Ratio of Hurricane Fiona’s interpolated 24 h Pint to the maximum for all other tropical cyclones that have affected Puerto Rico from 1899 to 2017 with the exception of Hurricane Maria; (c) Spatial distribution of 24 h Pint recurrence interval (in years) for Hurricane Fiona; (d) Cumulative distribution of 24 h Pint recurrence interval curves for the six tropical cyclones with the highest 24-h rain intensity values that have affected Puerto Rico from 1899 to 2017. (data for storms previous to Hurricane Fiona were taken from Ramos-Scharron and Arima [28]).
Hydrology 10 00040 g004
Figure 5. Hurricane Fiona’s total rainfall (TR) versus annual normal rainfall. (a) Spatial distribution of TR in mm during Hurricane Fiona based on co-kriging analysis of rainfall recorded between the 17th and the 19th of September 2022 at 113 weather stations; (b) Mean annual rainfall for Puerto Rico in mm (modified from [43]); (c) Ratio of Hurricane Fiona’s TR to mean annual rainfall; (d) Cumulative distribution curves for the proportion of annual rainfall caused by Huracán San Ciriaco (1899), Tropical Depression 15 (1970), Tropical Storm Isabel (1985), Hurricane Georges (1998), Hurricane María (2017), and Hurricane Fiona; (e) Proportion of Hurricane Fiona’s TR relative to the maximum total rainfall recorded for 60 tropical cyclones that have affected PR since 1899 with the exception of Hurricane María; (f) Cumulative distribution curves of the proportion of maximum tropical cyclone rainfall recorded in PR from 1899 to 2022 (not including Hurricanes María and Fiona) (data for storms previous to Hurricane Fiona taken from Ramos-Scharron and Arima [28]).
Hydrology 10 00040 g005
Figure 6. Watershed-by-watershed rainfall characteristics during Hurricane Fiona. (a) Mean 1 h rain intensities. (b) Mean 24 h rain intensities.
Hydrology 10 00040 g006
Figure 7. Watershed-by-watershed area-normalized instantaneous peak flow (Qpa) during Hurricane Fiona. (a) Drainage area versus Hurricane Fiona Qpa values for watersheds in Puerto Rico’s Zone 1 (western zone) relative to exceptional flows (Equation (5)), the world flood envelope (Equation (6)), and Puerto Rico’s flood envelope (Equation (7)). (b) Drainage area versus Hurricane Fiona’s Qpa values for watersheds in Puerto Rico’s Zone 2 (eastern zone) relative to exceptional flows, and the world’s and Puerto Rico’s flood envelopes. (c) Watershed-by-watershed distribution of Q p a / Q p a   e x c e p ratios for Hurricane Fiona.
Hydrology 10 00040 g007
Figure 8. Watershed-by-watershed evaluation of Hurricane Fiona’s area-normalized instantaneous peak flows (Qpa) relative to estimated recurrence intervals [42]. (a) Drainage area versus Hurricane Fiona Qpa values for watersheds in Puerto Rico’ss Zone 1 (western) relative to estimated recurrence intervals (Equations (8a)–(8d)). (b) Drainage area versus Hurricane Fiona Qpa values for watersheds in Puerto Rico’s Zone 2 (eastern) relative to estimated recurrence intervals (Equations (9a)–(9d)). (c) Watershed-by-watershed distribution of Hurricane Fiona’s Qpa values with respect to estimated recurrence interval.
Hydrology 10 00040 g008
Table 2. Summary of recurrence interval analyses for Hurricane Fiona’s instantaneous peak flow observations for Puerto Rico overall and for Zones 1 and 2.
Number of StationsProportion
Rec. Int.Zone 1Zone 2PR-WideZone 1Zone 2PR-Wide
<229117%26%18%
2–57101725%29%27%
5–101061636%18%26%
10–25991832%26%29%
Disclaimer/Publisher’s Note: The statements, opinions and data contained in all publications are solely those of the individual author(s) and contributor(s) and not of MDPI and/or the editor(s). MDPI and/or the editor(s) disclaim responsibility for any injury to people or property resulting from any ideas, methods, instructions or products referred to in the content.