Precipitation, Vegetation, and Groundwater Relationships in a Rangeland Ecosystem in the Chihuahuan Desert, Northern Mexico
Abstract
1. Introduction
2. Materials and Methods
2.1. Site Description
2.2. Soil Water and Precipitation Data
2.3. Groundwater Data and Aquifer Recharge
2.4. Vegetation Indices
2.5. Trend Analysis of Groundwater, Climate Variables, and Vegetation Indices
3. Results
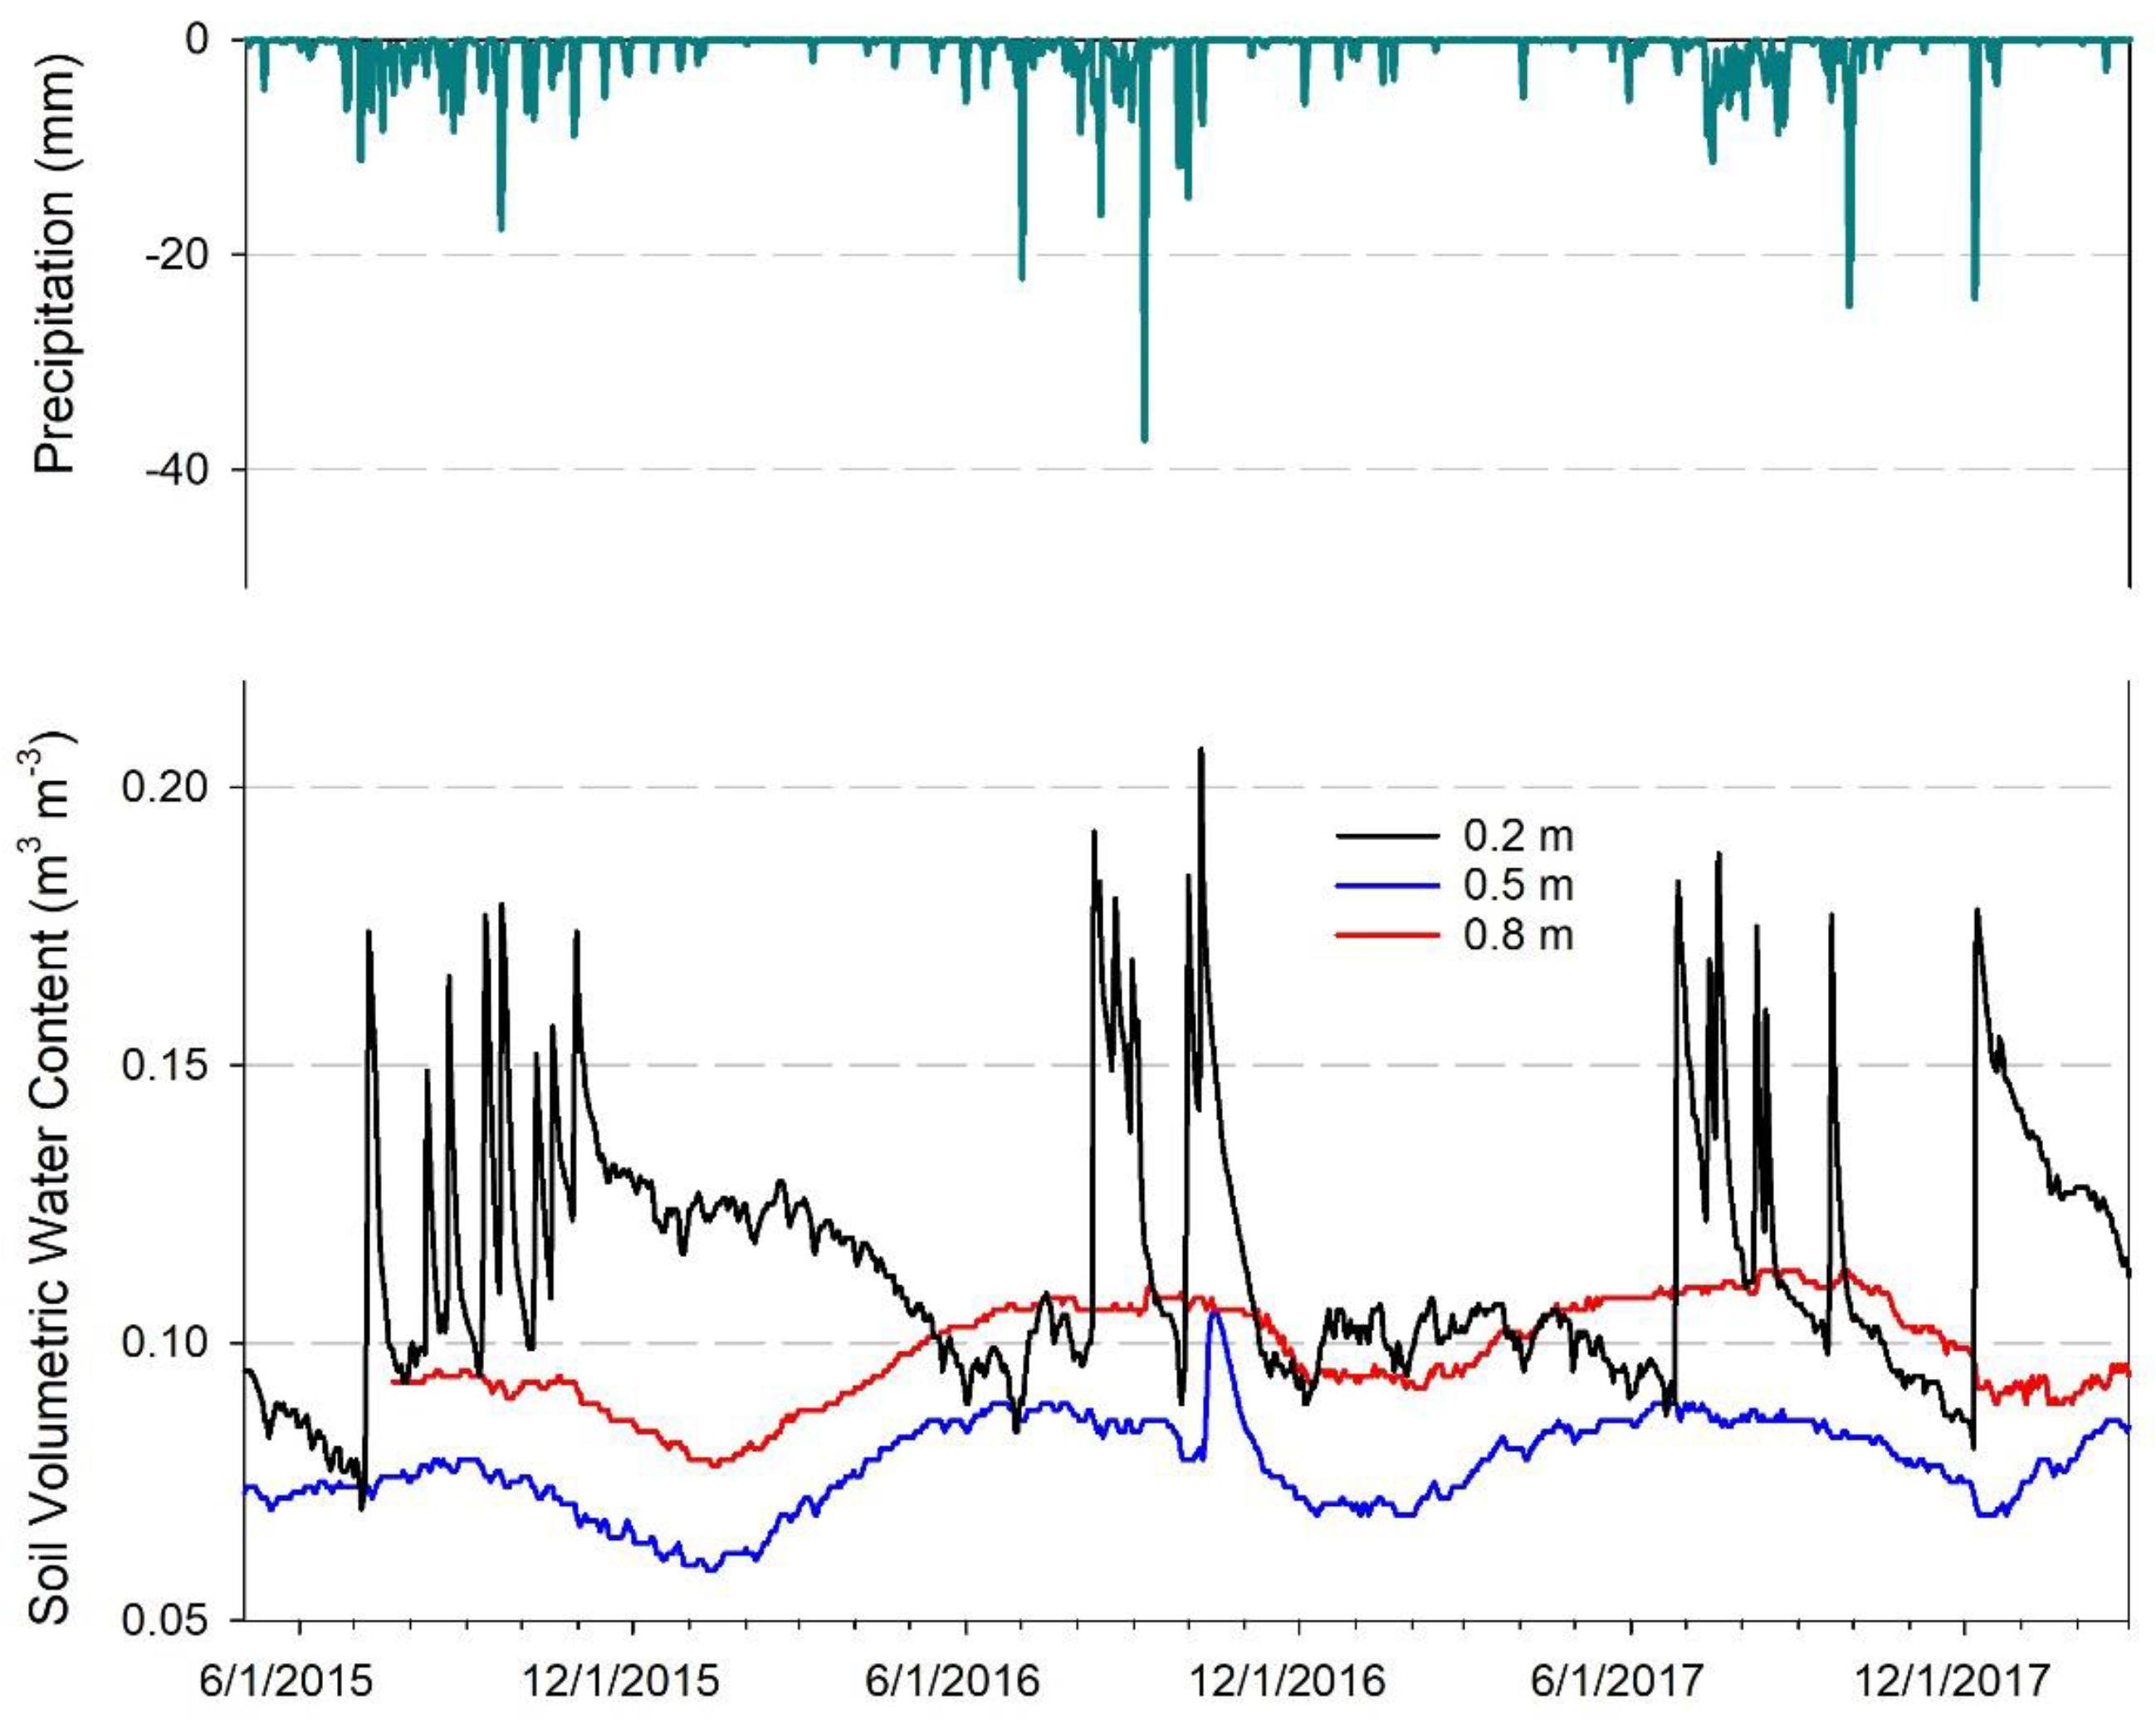
3.1. Soil Water
3.2. Precipitation, Vegetation, and Groundwater Relations
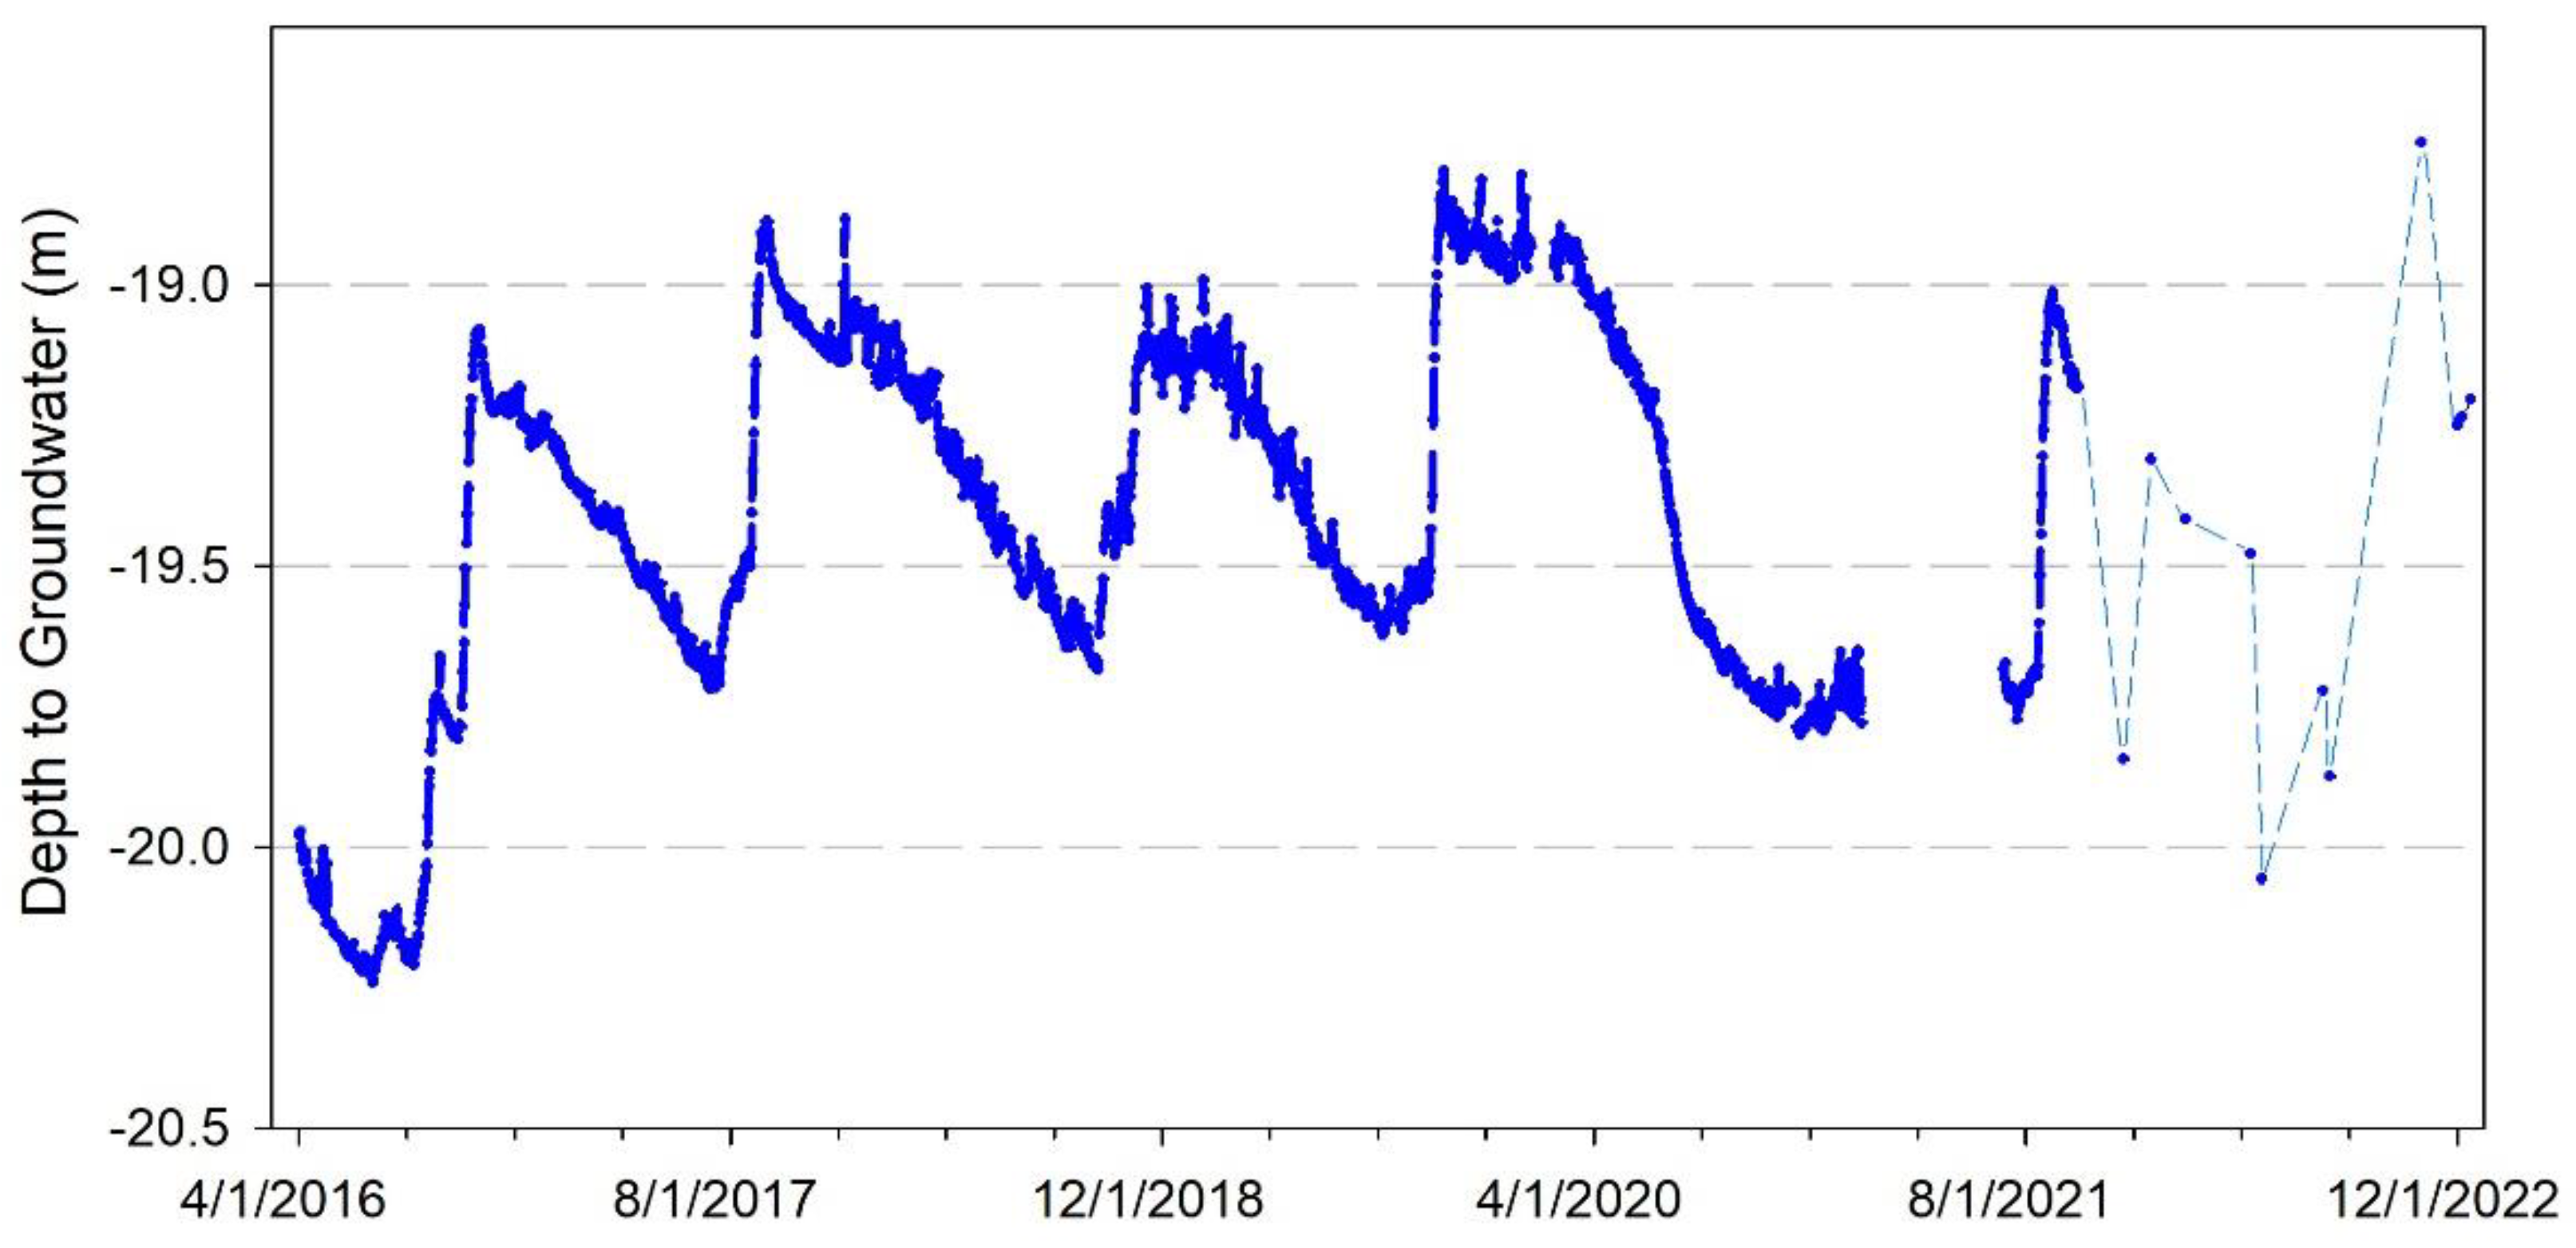
3.3. Groundwater Levels and Aquifer Recharge
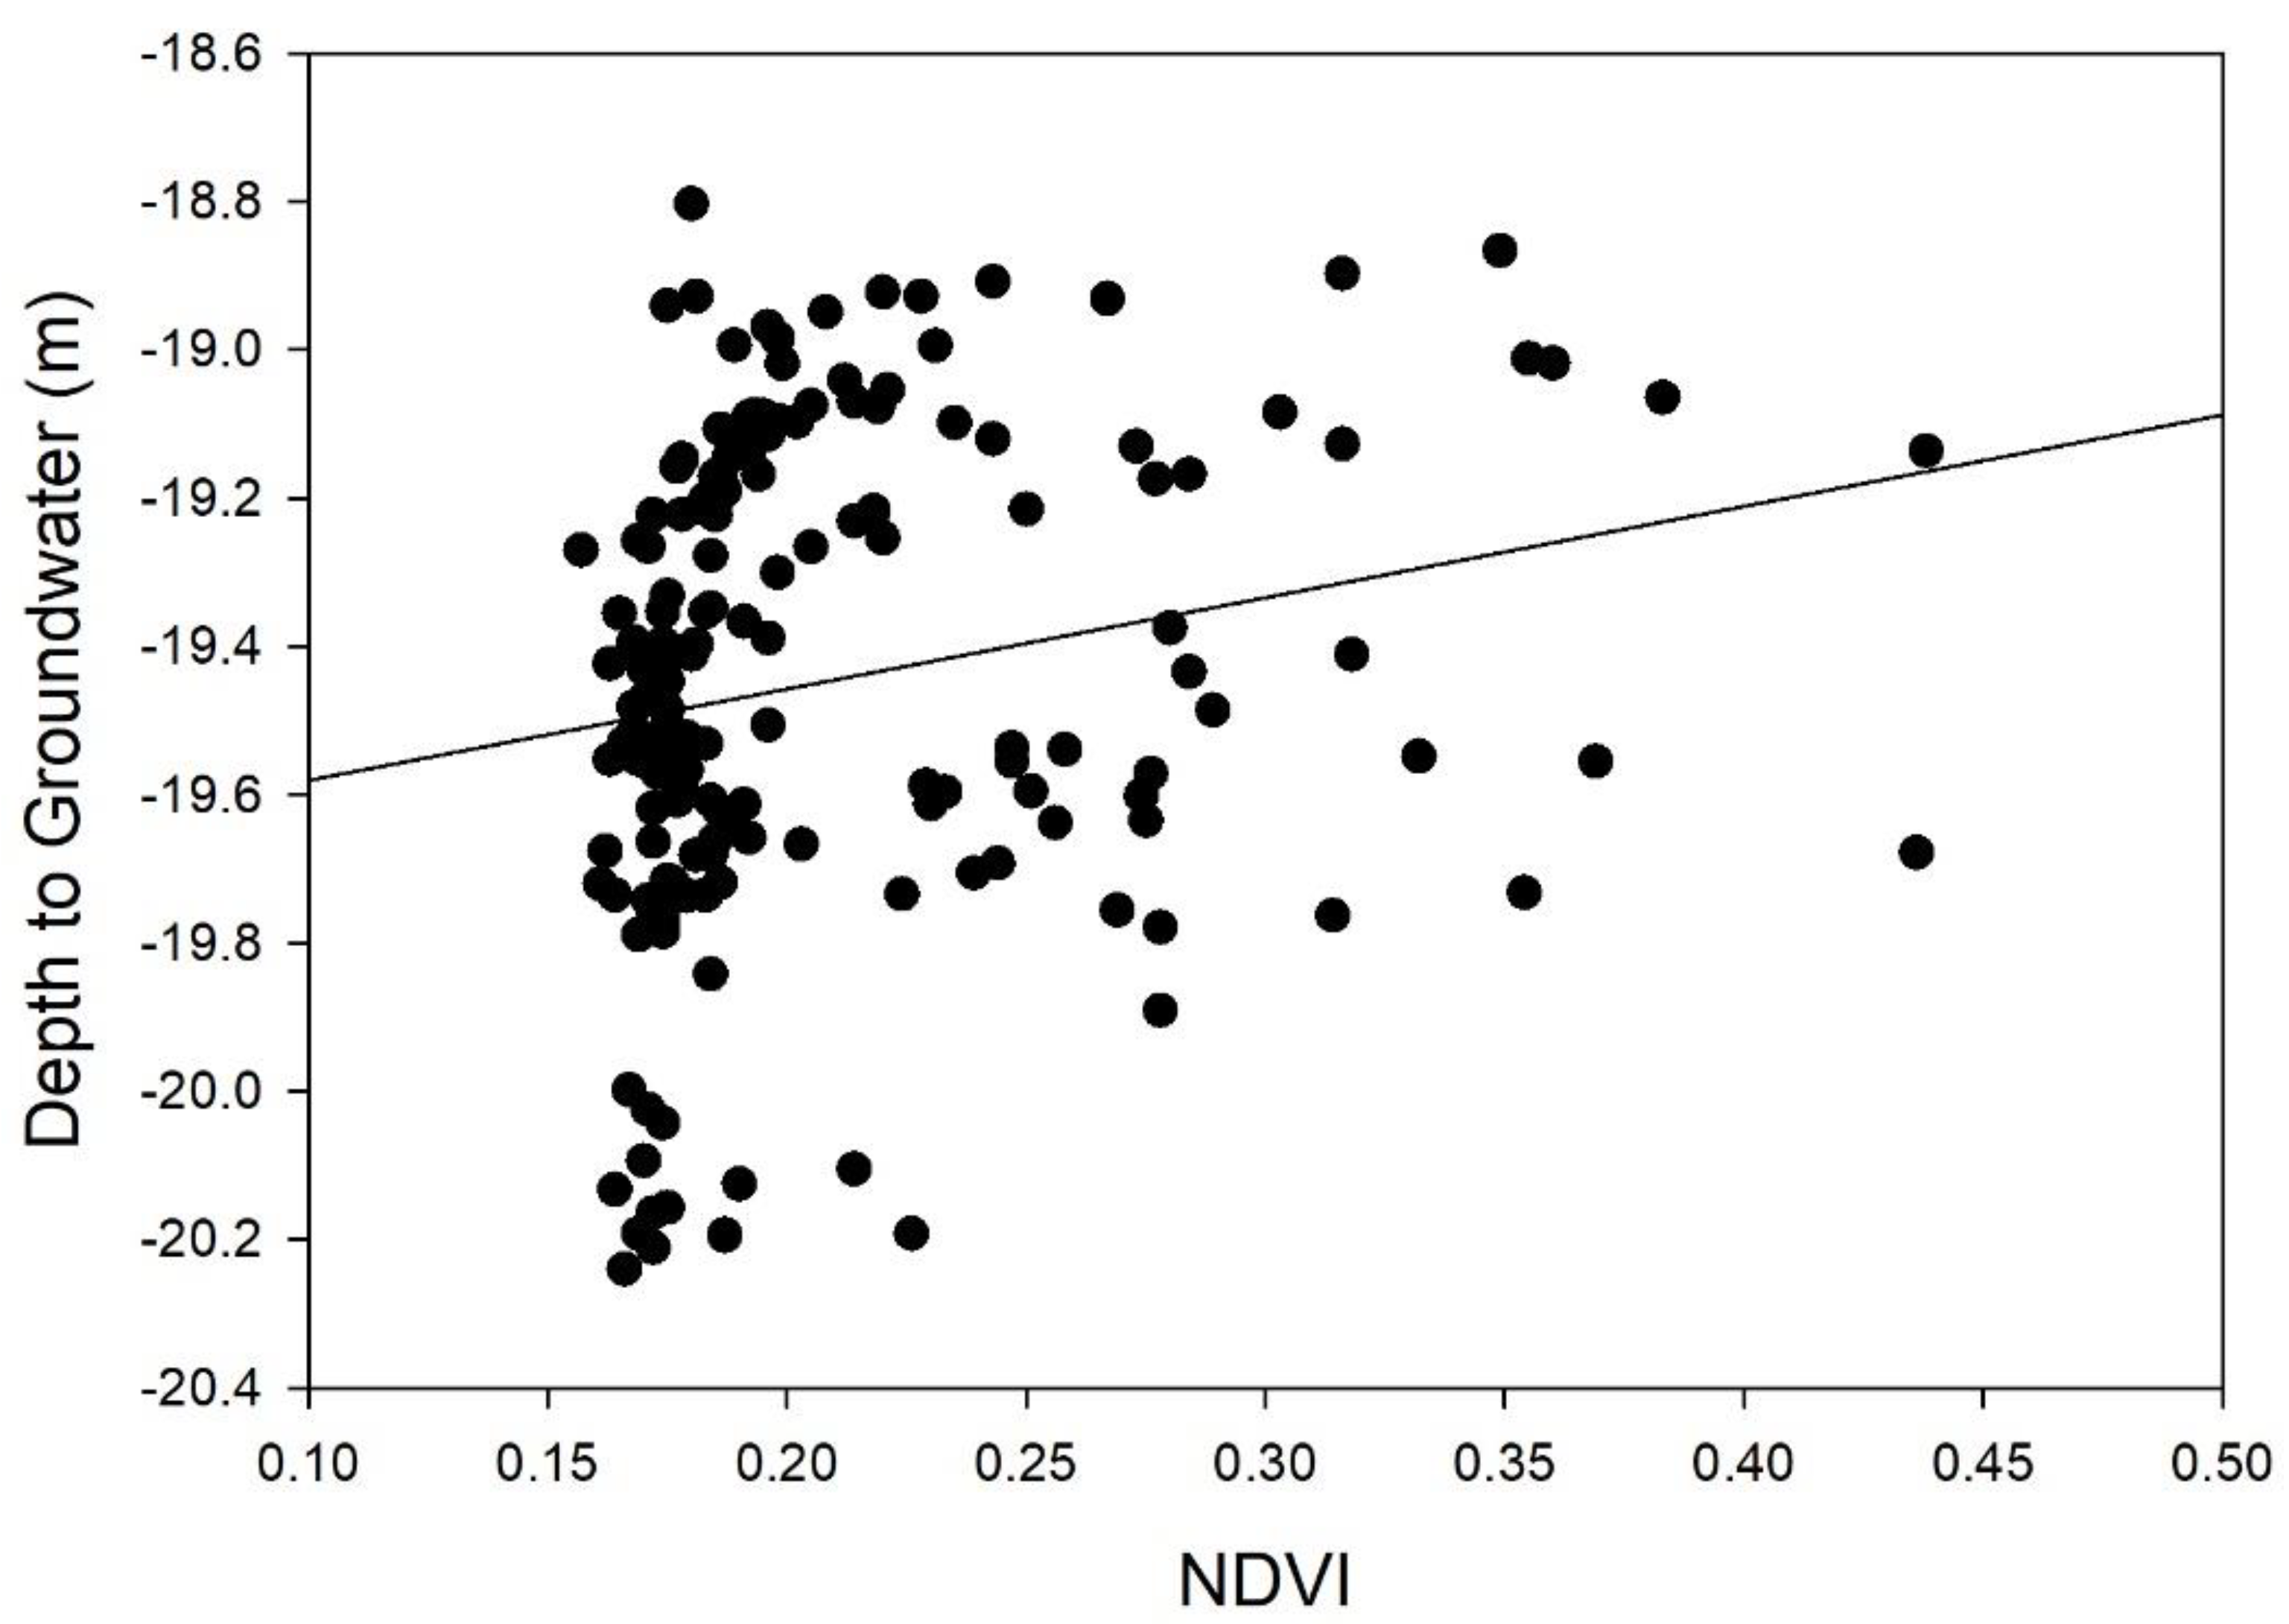
3.4. Correlation between Precipitation, Groundwater, Soil Water, and Vegetation Indices
3.5. Vegetation Indices—Interannual Variability
3.6. Trend Analysis
4. Discussion
Author Contributions
Funding
Institutional Review Board Statement
Informed Consent Statement
Data Availability Statement
Acknowledgments
Conflicts of Interest
Appendix A
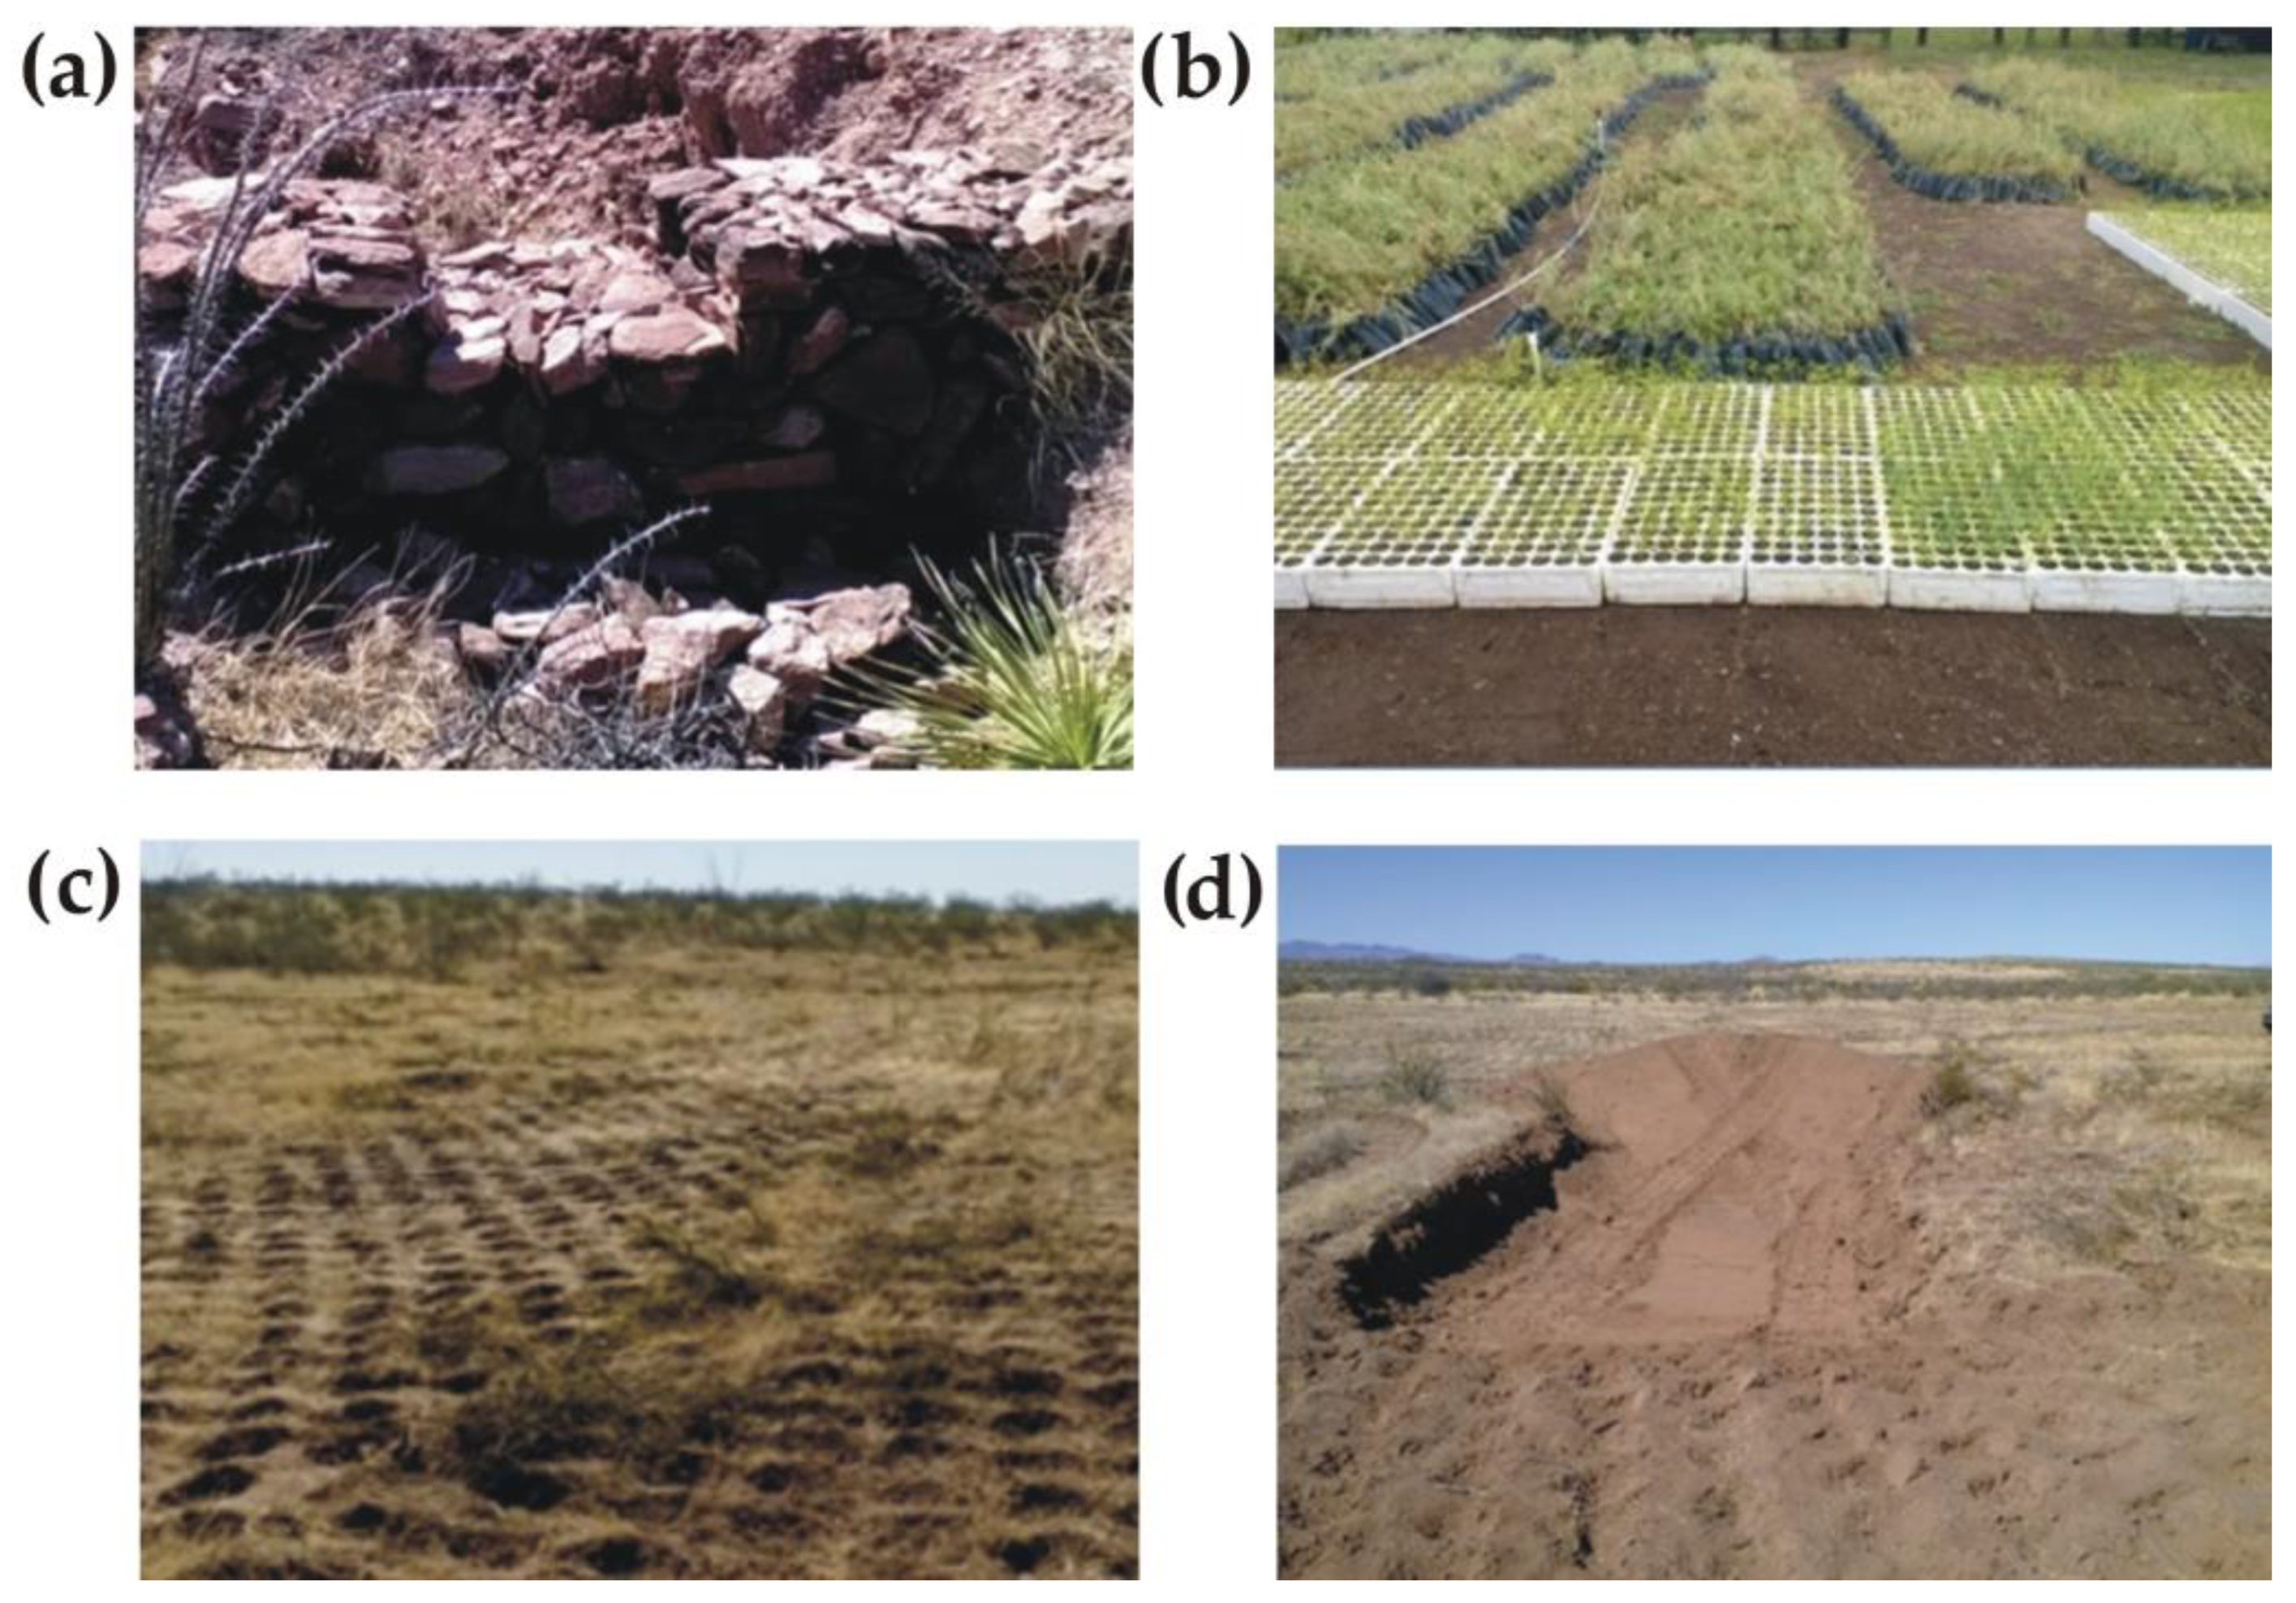
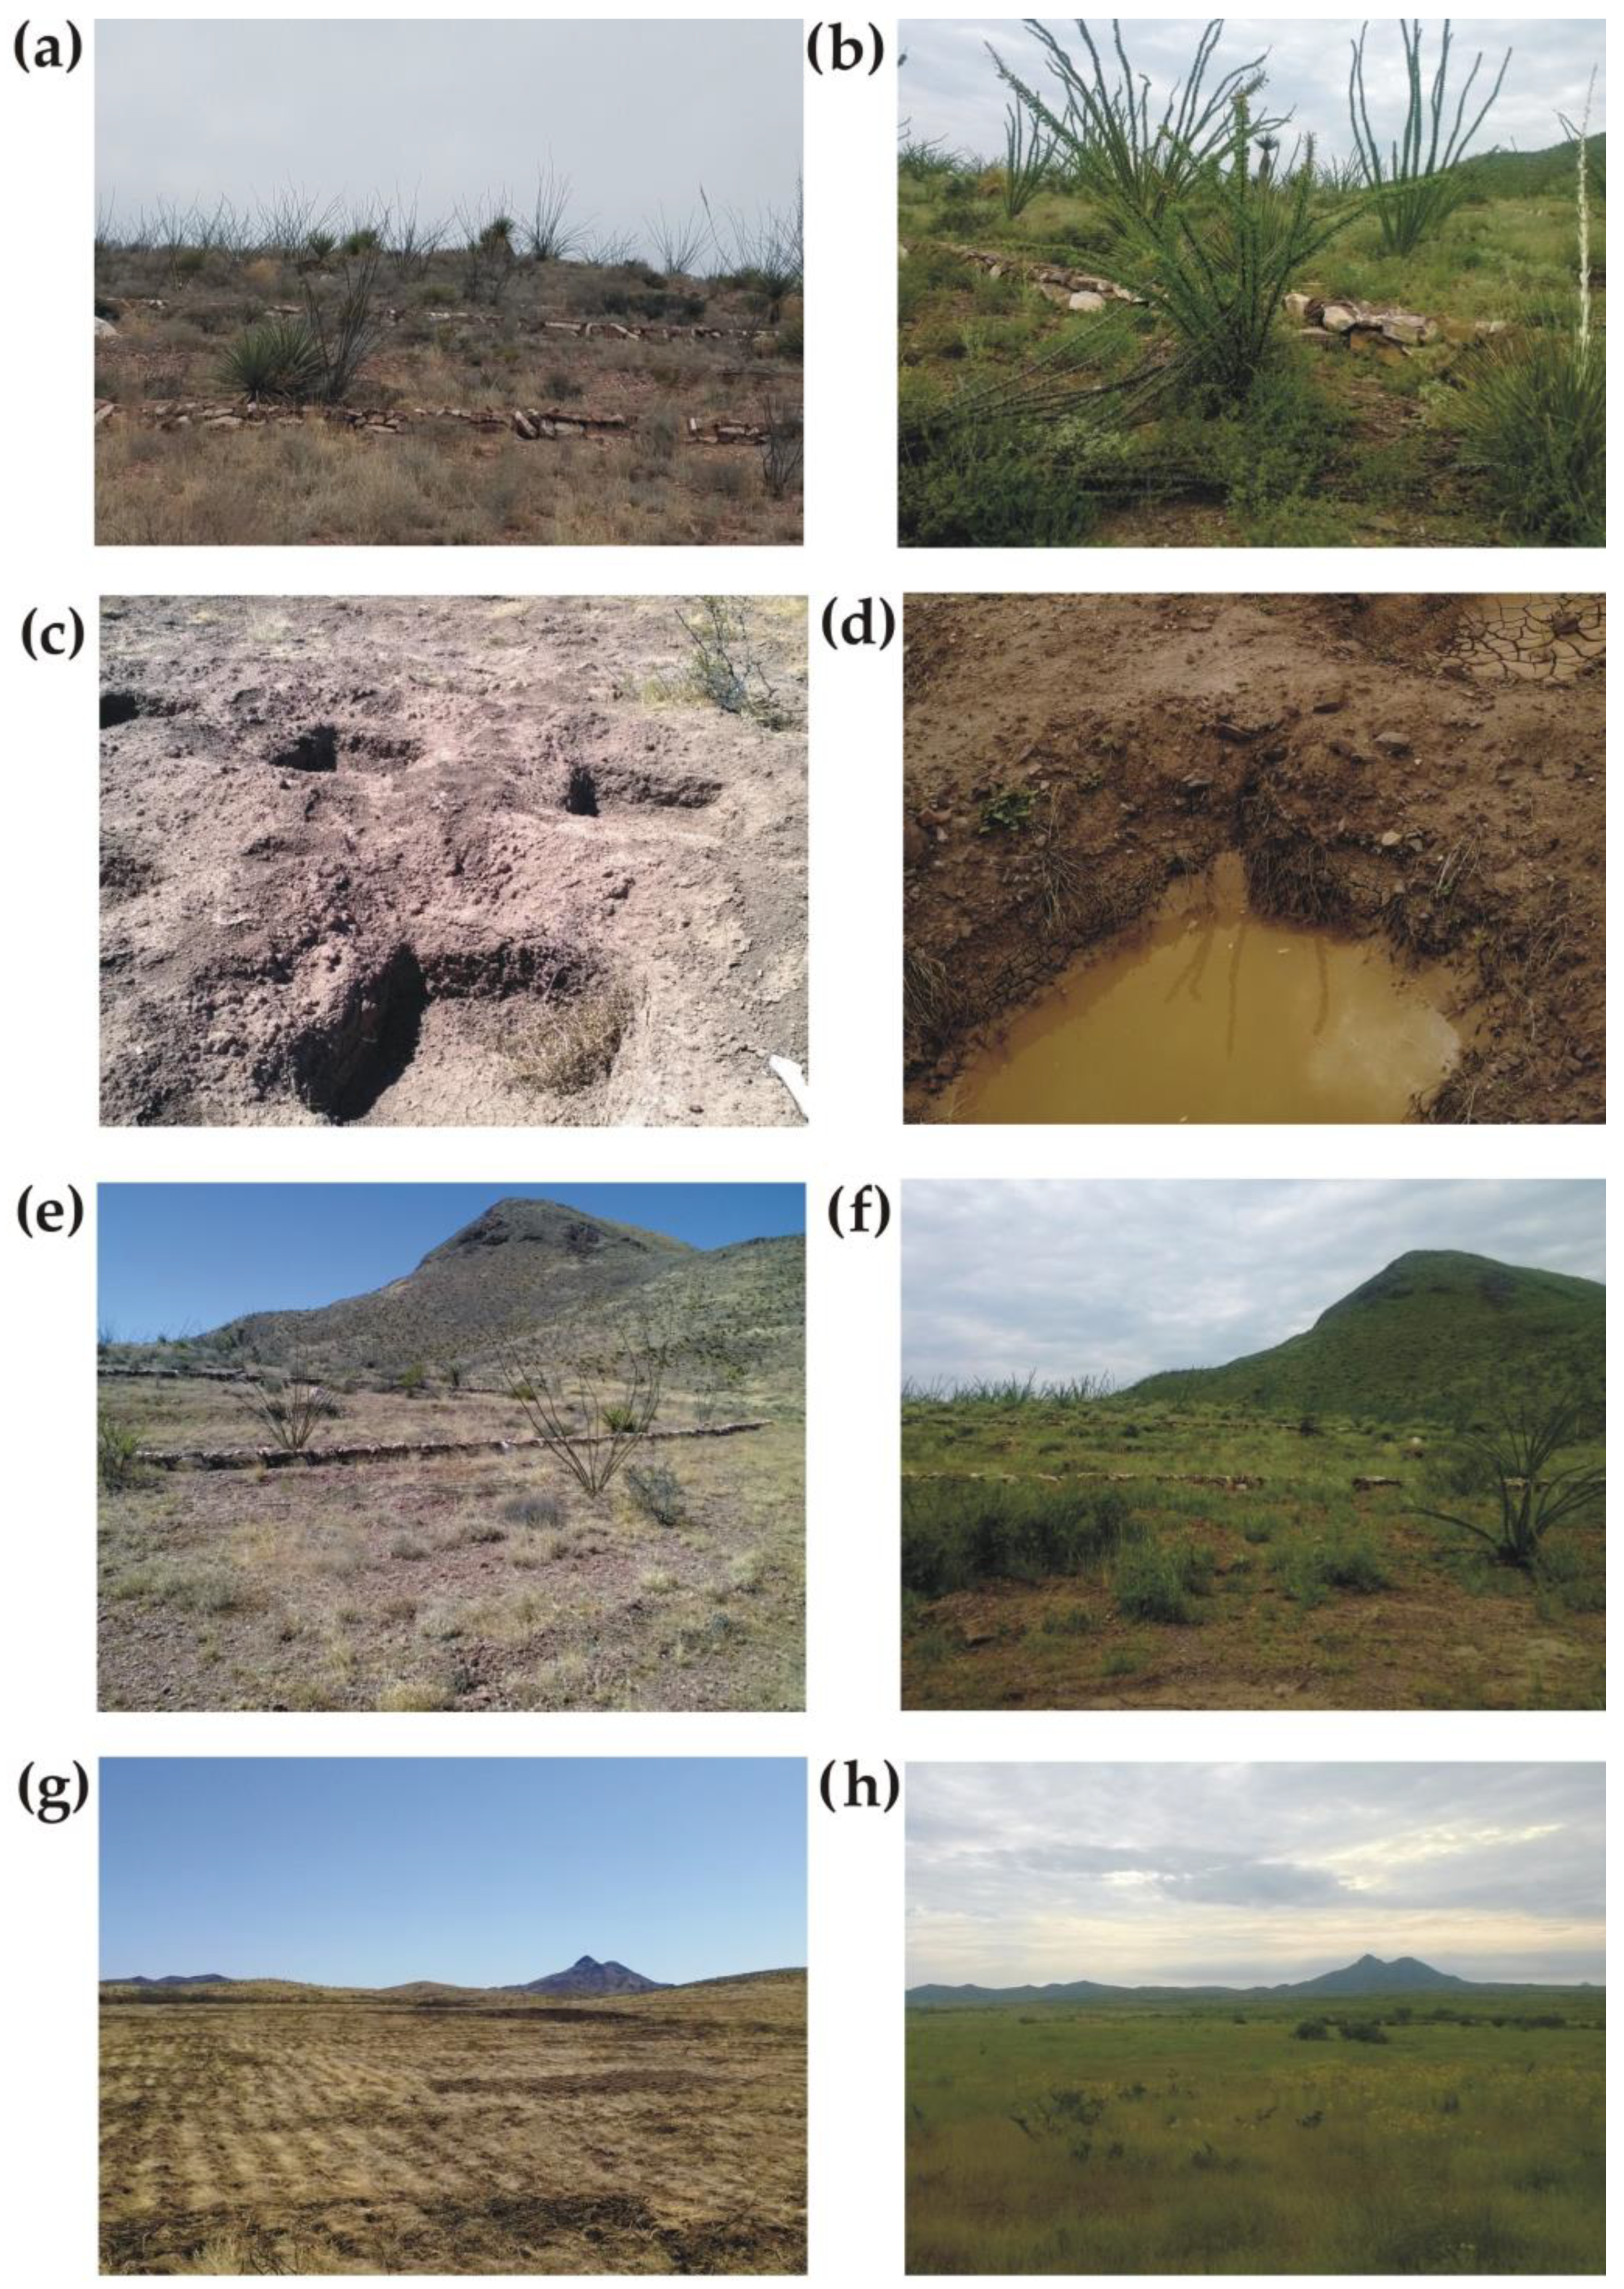
References
- Uhlenbrook, S.; Connor, R. The United Nations World Water Development Report 2019: Leaving No One Behind; UNESCO: Paris, France, 2019. [Google Scholar]
- Schewe, J.; Heinke, J.; Gerten, D.; Haddeland, I.; Arnell, N.W.; Clark, D.B.; Dankers, R.; Eisner, S.; Fekete, B.M.; Colón-González, F.J.; et al. Multimodel assessment of water scarcity under climate change. Proc. Natl. Acad. Sci. USA 2014, 111, 3245–3250. [Google Scholar] [CrossRef] [PubMed]
- Hejazi, M.I.; Edmonds, J.; Clarke, L.; Kyle, P.; Davies, E.; Chaturvedi, V.; Wise, M.; Patel, P.; Eom, J.; Calvin, K. Integrated assessment of global water scarcity over the 21st century under multiple climate change mitigation policies. Hydrol. Earth Syst. Sci. 2014, 18, 2859–2883. [Google Scholar] [CrossRef]
- Pachauri, R.K.; Meyer, L.A. Climate Change 2014: Synthesis Report. Contribution of Working Groups I, II and III to the Fifth Assessment Report of the Intergovernmental Panel on Climate Change; IPCC: Geneva, Switzerland, 2014; p. 151. [Google Scholar]
- Ojeda Olivares, E.A.; Sandoval Torres, S.; Belmonte Jiménez, S.I.; Campos Enríquez, J.O.; Zignol, F.; Reygadas, Y.; Tiefen-bacher, J.P. Climate Change, Land Use/Land Cover Change, and Population Growth as Drivers of Groundwater Depletion in the Central Valleys, Oaxaca, Mexico. Remote Sens. 2019, 11, 1290. [Google Scholar] [CrossRef]
- Scott, C.; Megdal, S.; Oroz, L.; Callegary, J.; Vandervoet, P. Effects of climate change and population growth on the trans-boundary Santa Cruz aquifer. Clim. Res. 2012, 51, 159–170. [Google Scholar]
- Briggs, M.K.; Lozano-Cavazos, E.A.; Poulos, H.M.; Ochoa-Espinoza, J.J.; Rodriguez-Pineda, J.A. The Chihuahuan Desert: A Binational Conservation Response to Protect a Global Treasure. Encycl. Worlds Biomes 2020, 126–138. [Google Scholar]
- Wulder, M.A.; Roy, D.P.; Radeloff, V.C.; Loveland, T.R.; Anderson, M.C.; Johnson, D.M.; Healey, S.; Zhu, Z.; Scambos, T.A.; Pahlevan, N.; et al. Fifty Years of Landsat Science and impacts. Remote Sens. Environ. 2022, 280, 113195. [Google Scholar] [CrossRef]
- Huntington, J.; McGwire, K.; Morton, C.; Snyder, K.; Peterson, S.; Erickson, T.; Niswonger, R.; Carroll, R.; Smith, G.; Allen, R. Assessing the role of climate and resource management on groundwater dependent ecosystem changes in arid environments with the Landsat archive. Remote Sens. Environ. 2016, 185, 186–197. [Google Scholar]
- Aguilar, C.; Zinnert, J.C.; Polo, M.J.; Young, D.R. NDVI as an indicator for changes in water availability to woody vegetation. Ecol. Indic. 2012, 23, 290–300. [Google Scholar] [CrossRef]
- Jia, K.; Liang, S.; Zhang, L.; Wei, X.; Yao, Y.; Xie, X. Forest cover classification using Landsat ETM+ data and time series MODIS NDVI data. Int. J. Appl. Earth Obs. 2014, 33, 32–38. [Google Scholar] [CrossRef]
- Mbatha, N.; Xulu, S. Time series analysis of MODIS-Derived NDVI for the Hluhluwe-Imfolozi Park, South Africa. Impact of recent intense drought. Climate 2018, 6, 95. [Google Scholar]
- Pettorelli, N.; Vik, J.O.; Mysterud, A.; Gaillard, J.M.; Tucker, C.J.; Stenseth, N.C. Using the satellite-derived NDVI to assess ecological responses to environmental change. Trends Ecol. Evol. 2005, 20, 503–510. [Google Scholar] [CrossRef] [PubMed]
- Chuai, X.W.; Huang, X.J.; Wang, W.J.; Bao, G. NDVI, temperature and precipitation changes and their relationships with different vegetation types during 1998–2007 in Inner Mongolia, China. Int. J. Climatol. 2013, 33, 1696–1706. [Google Scholar] [CrossRef]
- Birtwistle, A.N.; Laituri, M.; Bledsoe, B.; Friedman, J.M. Using NDVI to measure precipitation in semi-arid landscapes. J. Arid Environ. 2016, 131, 15–24. [Google Scholar] [CrossRef]
- Wingate, V.R.; Phinn, S.R.; Kuhn, N. Mapping precipitation-corrected NDVI trends across Namibia. Sci. Total Environ. 2019, 684, 96–112. [Google Scholar] [CrossRef] [PubMed]
- Parizi, E.; Hosseini, S.M.; Ataie-Ashtiani, B.; Simmons, C.T. Normalized difference vegetation index as the dominant predicting factor of groundwater recharge in phreatic aquifers: Case studies across Iran. Sci. Rep. 2020, 10, 17473. [Google Scholar] [CrossRef]
- Huang, F.; Ochoa, C.G. A copula incorporated cellular automata module for modeling the spatial distribution of oasis recovered by ecological water diversion: An application to the Qingtu Oasis in Shiyang River Basin, China. J. Hydrol. 2022, 608, 127573. [Google Scholar] [CrossRef]
- Hardisky, M.A.; Klemas, V.; Smart, R.M. The influence of soil salinity, growth form, and leaf moisture on the spectral radiance of Spartina alterniflora canopies. Photo Eng. Rem. S. 1983, 49, 77–83. [Google Scholar]
- Zimba, H.; Coenders-Gerrits, M.; Kawawa, B.; Savenije, H.; Nyambe, I.; Winsemius, H. Variations in canopy cover and its relationship with canopy water and temperature in the miombo woodland based on satellite data. Hydrology 2020, 7, 58. [Google Scholar] [CrossRef]
- Ji, L.; Zhang, L.; Wylie, B.K.; Rover, J. On the terminology of the spectral vegetation index (NIR− SWIR)/(NIR+ SWIR). Int. J. Remote Sens. 2011, 32, 6901–6909. [Google Scholar] [CrossRef]
- Castelli, G.; Oliveira, L.A.A.; Abdelli, F.; Dhaou, H.; Bresci, E.; Ouessar, M. Effect of traditional check dams (jessour) on soil and olive trees water status in Tunisia. Sci. Total Environ. 2019, 690, 226–236. [Google Scholar] [CrossRef]
- Everard, M. Community-based groundwater and ecosystem restoration in semi-arid north Rajasthan (1): Socio-economic progress and lessons for groundwater-dependent areas. Ecosyst. Serv. 2015, 16, 125–135. [Google Scholar] [CrossRef]
- Nemani, R.R.; Keeling, C.D.; Hashimoto, H.; Jolly, W.M.; Piper, S.C.; Tucker, C.J.; Myneni, R.B.; Running, S.W. Climate-driven increases in global terrestrial net primary production from 1982 to 1999. Science 2003, 300, 1560–1563. [Google Scholar] [CrossRef] [PubMed]
- Ochoa, C.G.; Caruso, P.; Ray, G.; Deboodt, T.; Jarvis, W.T.; Guldan, S.J. Ecohydrologic connections in semiarid watershed systems of central Oregon USA. Water 2018, 10, 181. [Google Scholar] [CrossRef]
- Durfee, N.; Ochoa, C.G. The seasonal water balance of juniper-dominated and sagebrush-dominated watersheds. Hydrology 2021, 8, 156. [Google Scholar] [CrossRef]
- Scanlon, B.R.; Healy, R.W.; Cook, P.G. Choosing appropriate techniques for quantifying groundwater recharge. Hydrogeol. J. 2002, 10, 18–39. [Google Scholar] [CrossRef]
- Sophocleous, M. Interactions between groundwater and surface water: The state of the science. Hydrogeol. J. 2002, 10, 52–67. [Google Scholar] [CrossRef]
- Jassas, H.; Merkel, B. Estimating Groundwater Recharge in the Semiarid Al-Khazir Gomal Basin, North Iraq. Water 2014, 6, 2467–2481. [Google Scholar] [CrossRef]
- Risser, D.W.; Gburek, W.J.; Folmar, G.J. Comparison of Recharge Estimates at a Small Watershed in East-Central Pennsylvania, USA. Hydrogeol. J. 2009, 17, 287–298. [Google Scholar] [CrossRef]
- Varni, M.; Comas, R.; Weinzettel, P.; Dietrich, S. Application of the water table fluctuation method to characterize groundwater recharge in the Pampa plain, Argentina. Hydrolog. Sci. J. 2013, 58, 1445–1455. [Google Scholar] [CrossRef]
- Healy, R.W.; Cook, P.G. Using Groundwater Levels to Estimate Recharge. Hydrogeol. J. 2002, 10, 91–109. [Google Scholar] [CrossRef]
- Childs, E.C. The nonsteady state of the water table in drained land. J. Geophys. Res. 1960, 65, 780–782. [Google Scholar] [CrossRef]
- Siyag, P.R. Site Selection, Survey and Treatment Plan. In Afforestation, Reforestation and Forest Restoration in Arid and Semi-Arid Tropics; Siyag, P.R., Ed.; Springer: Dordrecht, The Netherlands; Bonn, Germany, 2014; pp. 51–78. [Google Scholar]
- Gebrernichael, D.; Nyssen, J.; Poesen, J.; Deckers, J.; Haile, M.; Govers, G.; Moeyersons, J. Effectiveness of stone bunds in controlling soil erosion on cropland in the Tigray Highlands, northern Ethiopia. Soil Use Manage. 2005, 21, 287–297. [Google Scholar] [CrossRef]
- Ponce-Rodríguez, M.D.C.; Prieto-Ruíz, J.Á.; Carrete-Carreón, F.O.; Pérez-López, M.E.; Muñoz-Ramos, J.D.J.; Reyes-Estrada, O.; Ramírez-Garduño, H. Influence of stone bunds on vegetation and soil in an area reforested with Pinus engelmannii Carr. in the forests of Durango, Mexico. Sustainability 2019, 11, 5033. [Google Scholar] [CrossRef]
- Negusse, T.; Yazew, E.; Tadesse, N. Quantification of the impact of integrated soil and water conservation measures on groundwater availability in Mendae Catchment, Abraha We-Atsebaha, eastern Tigray, Ethiopia. Momona Ethiop. J. Sci. 2013, 5, 117–136. [Google Scholar] [CrossRef]
- García-Ávalos, S.; Rodriguez-Caballero, E.; Miralles, I.; Luna, L.; Domene, M.A.; Solé-Benet, A.; Cantón, Y. Water harvesting techniques based on terrain modification enhance vegetation survival in dryland restoration. Catena 2018, 167, 319–326. [Google Scholar] [CrossRef]
- Radonic, L. Re-conceptualising water conservation: Rainwater harvesting in the desert of the southwestern United States. Water Altern. 2019, 12, 699–714. [Google Scholar]
- Jahantigh, M.; Pessarakli, M. Utilization of contour furrow and pitting techniques on desert rangelands: Evaluation of runoff, sediment, soil water content and vegetation cover. J. Food Agric. Environ 2009, 7, 736–739. [Google Scholar]
- Schmidt, R.H., Jr. A climatic delineation of the ‘real’ Chihuahuan Desert. J. Arid Environ. 1979, 2, 243–250. [Google Scholar] [CrossRef]
- Pool, D.B.; Panjabi, A.O.; Macias-Duarte, A.; Solhjem, D.M. Rapid expansion of croplands in Chihuahua, Mexico threatens declining North American grassland bird species. Biol. Conserv. 2014, 170, 274–281. [Google Scholar] [CrossRef]
- Instituto Nacional de Geografía e Infotmatica (INEGI). Edafología. Available online: https://www.inegi.org.mx/temas/edafologia/#Descargas (accessed on 12 October 2022).
- Sistema Nacional de Información del Agua (SINA). Regiones Hidrológicas (Nacional). Available online: https://sina.conagua.gob.mx/sina/tema.php?tema=regionesHidrologicas (accessed on 12 October 2022).
- Comisión Nacional del Agua (CONAGUA). Actualización de la Disponibilidad Media Anual de Agua en el Acuífero Flores Magón-Villa Ahumada (0821); Estado de Chihuahua; Subdirección General Técnica Gerencia de Aguas Subterráneas: Ciudad De México, México, 2020; p. 27. [Google Scholar]
- Huang, S.; Tang, L.; Hupy, J.P.; Wang, Y.; Shao, G. A commentary review on the use of normalized difference vegetation index (NDVI) in the era of popular remote sensing. J. Forestry Res. 2021, 32, 1–6. [Google Scholar] [CrossRef]
- Zhang, S.; Ye, Z.; Chen, Y.; Xu, Y. Vegetation responses to an ecological water conveyance project in the lower reaches of the Heihe River basin. Ecohydrology 2017, 10, e1866. [Google Scholar] [CrossRef]
- Chen, X.; Vierling, L.; Deering, D.; Conley, A. Monitoring boreal forest leaf area index across a Siberian burn chronosequence: A MODIS validation study. Int. J. Remote Sens. 2005, 26, 5433–5451. [Google Scholar] [CrossRef]
- Verbesselt, J.; Hyndman, R.; Zeileis, A.; Culvenor, D. Phenological change detection while accounting for abrupt and gradual trends in satellite image time series. Remote Sens. Environ. 2010, 114, 2970–2980. [Google Scholar] [CrossRef]
- Jordan, C.F. Derivation of leaf-area index from quality of light on the forest floor. Ecology 1969, 50, 663–666. [Google Scholar] [CrossRef]
- Rouse, J.W.; Haas, R.H.; Deering, D.W.; Schell, J.A.; Harlan, J.C. Monitoring the Vernal Advancement and Retrogradation (Green Wave Effect) of Natural Vegetation; Texas A&M University: Austin, TX, USA, 1974; pp. 1–8. [Google Scholar]
- Friesen, J.; Steele-Dunne, S.C.; van de Giesen, N. Diurnal differences in global ERS scatterometer backscatter observations of the land surface. IEEE T. Geosci. Remote. 2012, 50, 2595–2602. [Google Scholar] [CrossRef]
- van Emmerik, T.; Steele-Dunne, S.C.; Judge, J.; van de Giesen, N. Impact of diurnal variation in vegetation water content on radar backscatter from maize during water stress IEEE T. Geosci. Remote. 2015, 53, 3855–3869. [Google Scholar] [CrossRef]
- Sriwongsitanon, N.; Gao, H.; Savenije, H.H.; Maekan, E.; Saengsawang, S.; Thianpopirug, S. Comparing the Normalized Difference Infrared Index (NDII) with root zone storage in a lumped conceptual model. Hydrol. Earth Syst. Sc. 2016, 20, 3361–3377. [Google Scholar] [CrossRef]
- Loveland, T.R.; Dwyer, J.L. Landsat: Building a strong future. Remote Sens. Environ. 2012, 122, 22–29. [Google Scholar] [CrossRef]
- Wulder, M.A.; Loveland, T.R.; Roy, D.P.; Crawford, C.J.; Masek, J.G.; Woodcock, C.E.; Allen, R.G.; Anderson, M.C.; Belward, A.S.; Cohen, W.B.; et al. Current status of Landsat program, science, and applications. Remote Sens. Environ. 2019, 225, 127–147. [Google Scholar] [CrossRef]
- Banskota, A.; Kayastha, N.; Falkowski, M.J.; Wulder, M.A.; Froese, R.E.; White, J.C. Forest monitoring using Landsat time series data: A review. Can. J. Remote Sens. 2014, 40, 362–384. [Google Scholar] [CrossRef]
- Gorelick, N.; Hancher, M.; Dixon, M.; Ilyushchenko, S.; Thau, D.; Moore, R. Google Earth Engine: Planetary-scale geospatial analysis for everyone. Remote Sens. Environ. 2017, 202, 18–27. [Google Scholar] [CrossRef]
- Ni, J. Estimating net primary productivity of grasslands from field biomass measurements in temperate northern China. Plant Ecol. 2004, 174, 217–234. [Google Scholar] [CrossRef]
- Fajardo, J.; Lessmann, J.; Bonaccorso, E.; Devenish, C.; Munoz, J. Combined use of systematic conservation planning, species distribution modelling, and connectivity analysis reveals severe conservation gaps in a megadiverse country (Peru). PloS ONE 2014, 9, e114367. [Google Scholar] [CrossRef] [PubMed]
- Realyvazquez-Valencia, M.T. Variables Relacionadas Con La Dinámica Del Nivel De Agua En El Subsuelo De Una Microcuenca Del Desierto Chihuahuense. Master’s Thesis, Universidad Autónoma de Chihuahua, Chihuahua, Mexico, 2021. [Google Scholar]
- Huang, F.; Ochoa, C.G.; Chen, X.i.; Cheng, Q.; Zhang, D. An entropy-based investigation into the impact of ecological water diversion on land cover complexity of restored oasis in arid inland river basins. Ecol. Eng. 2020, 151, 105865. [Google Scholar] [CrossRef]
- Huang, F.; Zhang, Y.; Zhang, D.; Chen, X. Environmental Groundwater Depth for Groundwater-Dependent Terrestrial Ecosystems in Arid/Semiarid Regions: A Review. Int. J. Environ. Res. Public Health 2019, 16, 763. [Google Scholar] [CrossRef]
- Zhu, L.; Gong, H.; Dai, Z.; Xu, T.; Su, X. An integrated assessment of the impact of precipitation and groundwater on vegetation growth in arid and semiarid areas. Environ. Earth Sci. 2015, 74, 5009–5021. [Google Scholar] [CrossRef]
- Montandon, L.; Small, E. The impact of soil reflectance on the quantification of the green vegetation fraction from NDVI. Remote Sens. Environ. 2008, 112, 1835–1845. [Google Scholar] [CrossRef]
- Wilcox, B.P.; Seyfried, M.S.; Breshears, D. Encyclopedia of Water Science; Marcel Dekker, Inc.: New York, NY, USA, 2003; pp. 791–794. [Google Scholar]
- Stonestrom, D.A.; Constantz, J.; Ferre, T.P.A.; Stanley, S.A. Ground-Water Recharge in the Arid and Semiarid Southwestern United States; U.S. Geological Survey Professional Paper 1703: Reston, VA, USA, 2007; p. 414.
- Coes, A.L.; Pool, D.R. Ephemeral-stream channel and basin-floor infiltration and recharge in the Sierra Vista subwatershed of the Upper San Pedro Basin, southeastern Arizona. In Ground-Water Recharge in the Arid and Semiarid Southwestern United States; Stonestrom, D.A., Constantz, J., Ferre, T.P.A., Stanley, S.A., Eds.; U.S. Geological Survey Professional Paper 1703: Reston, VA, USA, 2007; pp. 253–311. [Google Scholar]
- Taylor, C.J.; Alley, W.M. Ground-Water-Level Monitoring and the Importance of Long-Term Water-Level Data; US Geological Survey Circular 1217: Denver, CO, USA, 2001; pp. 1–63.
- Grimm, M. Metrics and Equivalence in Conservation Banking. Land 2021, 10, 565. [Google Scholar] [CrossRef]
- McKenney, B.A.; Kiesecker, J.M. Policy development for biodiversity offsets: A review of offset frameworks. Env. Manage. 2010, 451, 65–76. [Google Scholar] [CrossRef]
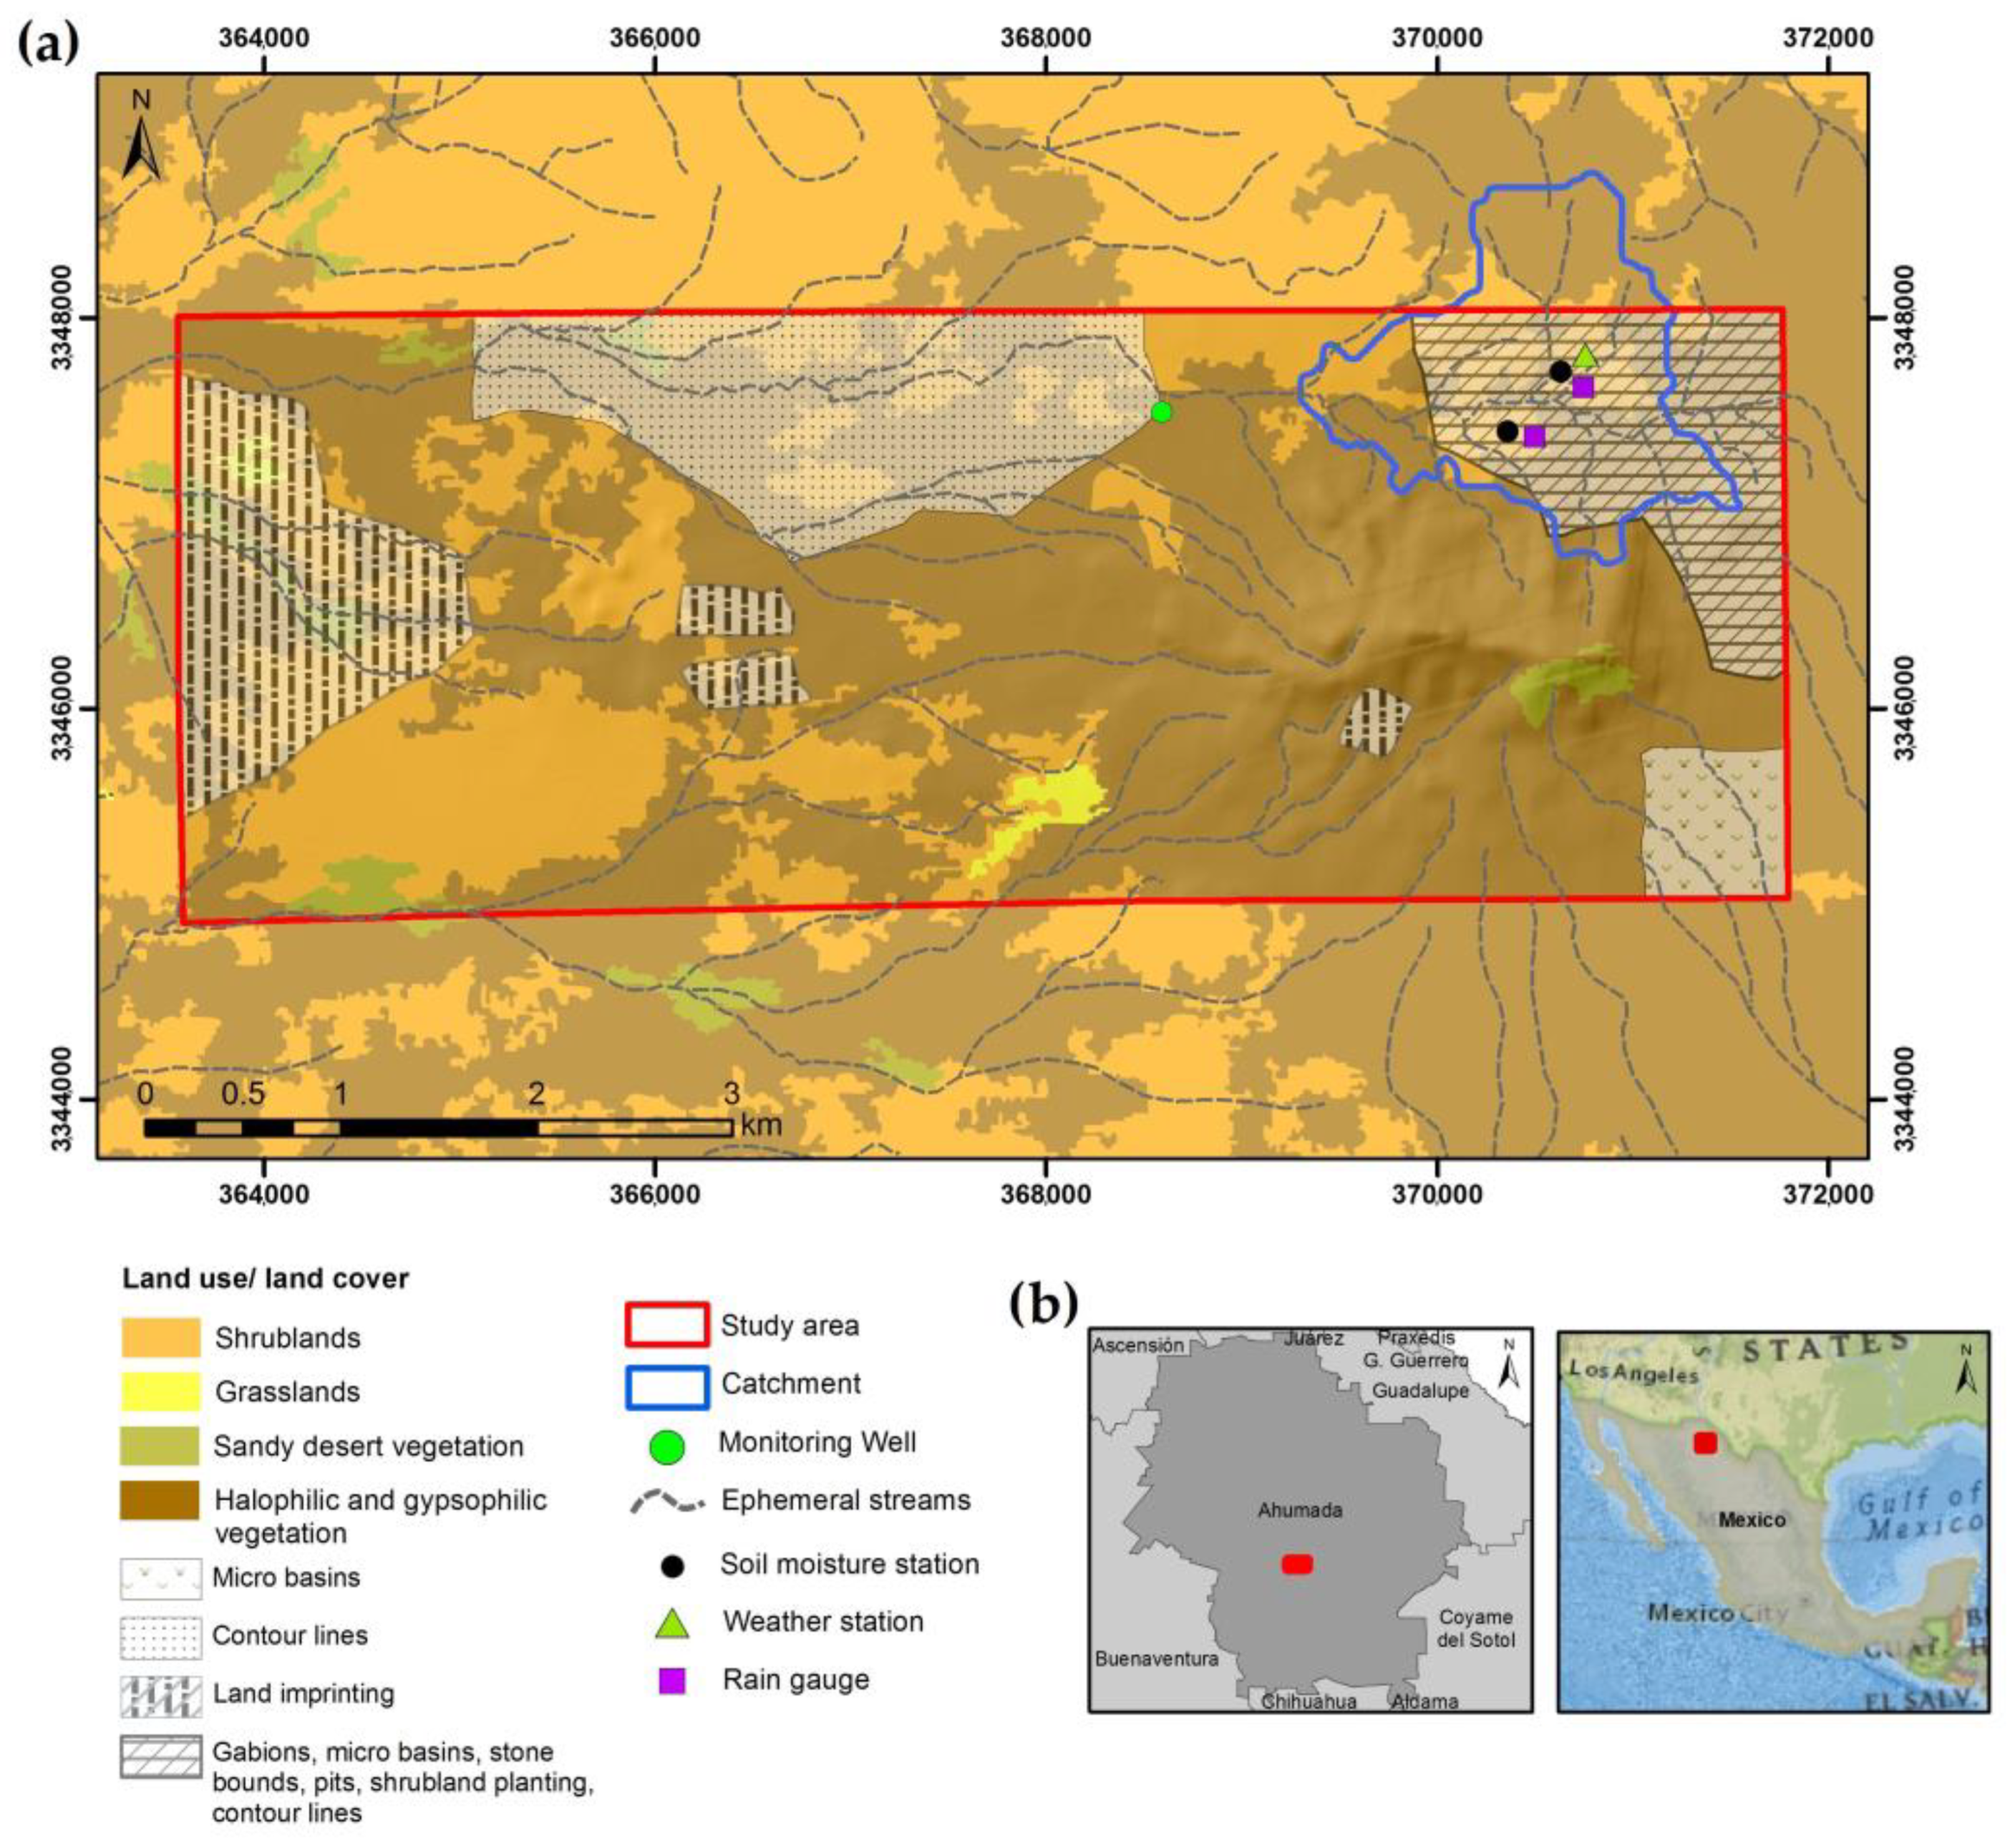

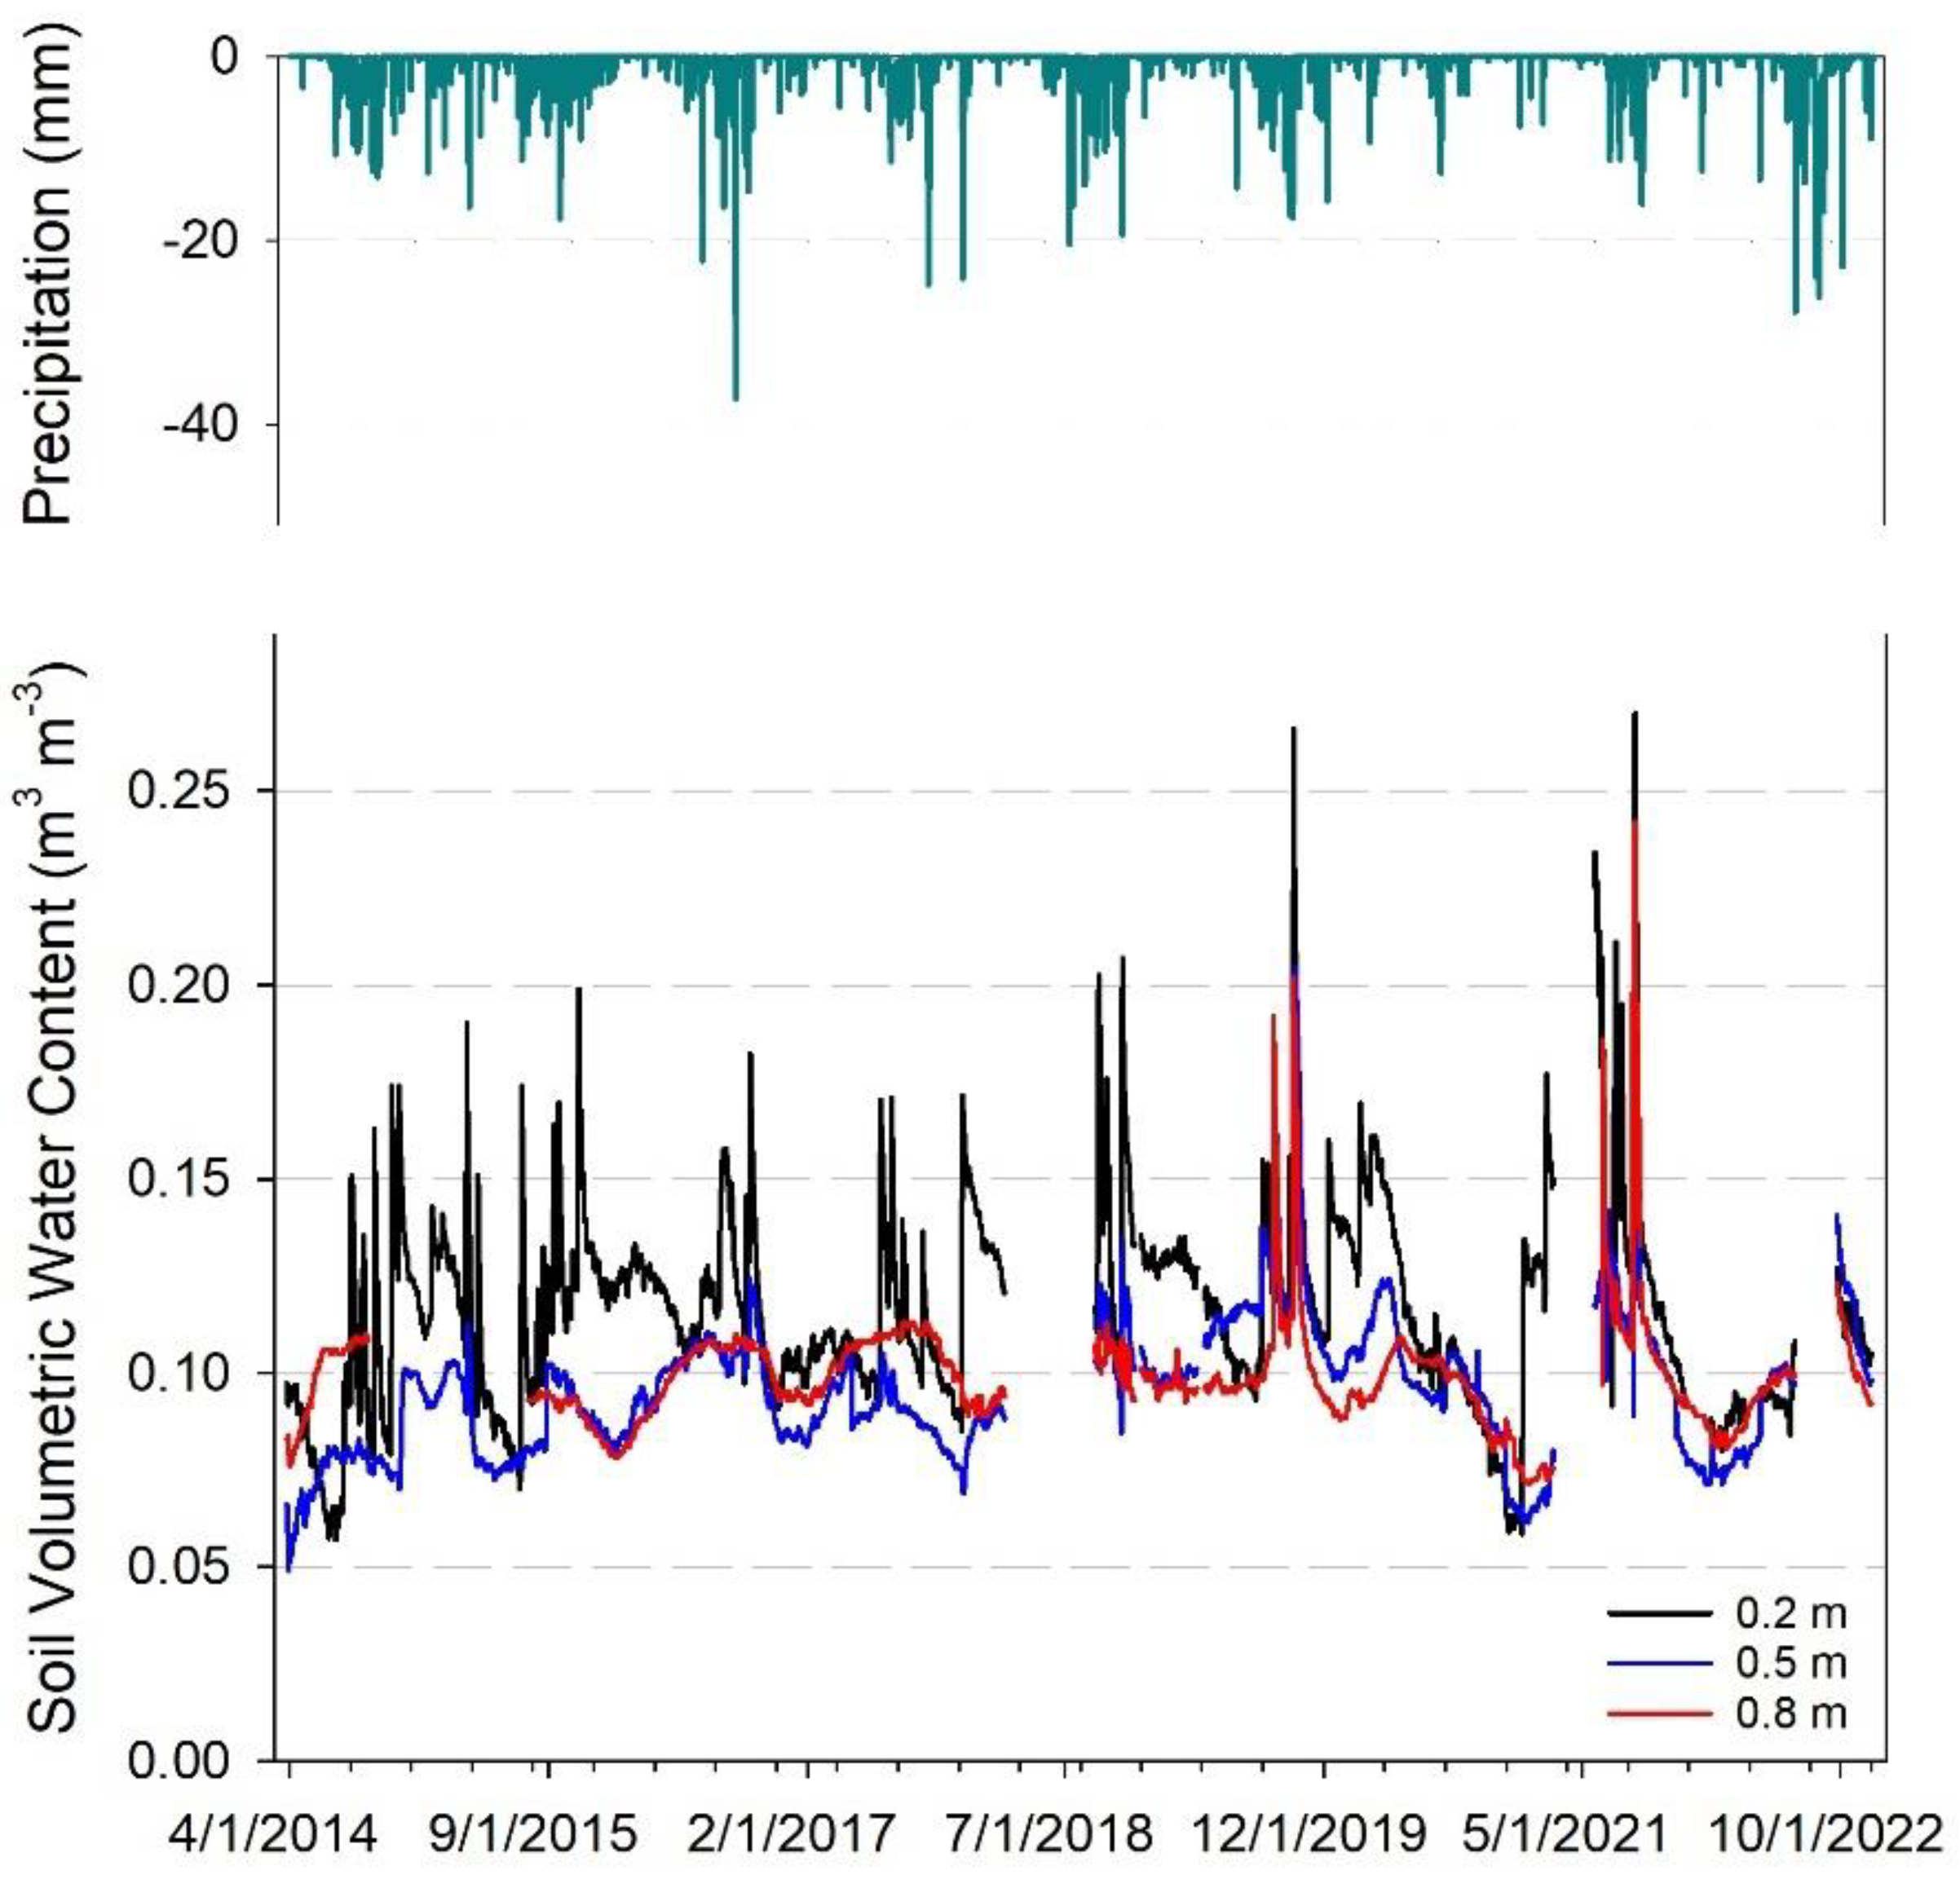
| Month | Precipitation | Daily Maximum Temperature | Daily Minimum Temperature |
|---|---|---|---|
| January | 13.3 | 22.7 | −4.8 |
| February | 10.8 | 25.4 | −3.9 |
| March | 9.6 | 29.1 | −1.5 |
| April | 9.9 | 32.3 | 2.9 |
| May | 12.2 | 36.5 | 8.1 |
| June | 26.5 | 39.4 | 15.0 |
| July | 62.6 | 38.4 | 18.0 |
| August | 70.5 | 36.6 | 16.9 |
| September | 49.6 | 34.8 | 12.1 |
| October | 24.7 | 31.8 | 4.4 |
| November | 11.4 | 26.8 | −2.1 |
| December | 16.8 | 23.0 | −5.0 |
| 2016 | 2017 | 2018 | 2019 | 2020 | 2021 | |||||||||||||
|---|---|---|---|---|---|---|---|---|---|---|---|---|---|---|---|---|---|---|
| Month | P | NDVI | G | P | NDVI | G | P | NDVI | G | P | NDVI | G | P | NDVI | G | P | NDVI | G |
| January | 4.7 | 0.19 | NA | 10.4 | 0.21 | 19.3 | 0.4 | 0.19 | 19.1 | 4.7 | 0.19 | 19.1 | 2.6 | 0.19 | 18.9 | 9.4 | 0.17 | 19.7 |
| February | 0.6 | 0.17 | NA | 1.2 | 0.19 | 19.4 | 3.8 | 0.19 | 19.2 | 3.4 | 0.18 | 19.2 | 5.5 | 0.18 | 18.9 | 10.4 | 0.18 | NA |
| March | 2.3 | 0.17 | NA | 0.2 | 0.17 | 19.4 | 1.1 | 0.18 | 19.2 | 4.6 | 0.17 | 19.2 | 19.9 | 0.19 | 19.0 | 0.3 | 0.17 | NA |
| April | 5.1 | 0.17 | 20.1 | 7.4 | 0.17 | 19.5 | 0.7 | 0.17 | 19.3 | 2.7 | 0.17 | 19.3 | 0.2 | 0.20 | 19.1 | 2.1 | 0.17 | NA |
| May | 14.8 | 0.17 | 20.2 | 9.7 | 0.17 | 19. 6 | 3.5 | 0.18 | 19.4 | 3.0 | 0.17 | 19.4 | 1.9 | 0.19 | 19.2 | 1.4 | 0.17 | NA |
| June | 17.2 | 0.17 | 20.2 | 10.8 | 0.18 | 19.6 | 15.1 | 0.18 | 19.5 | 22.7 | 0.17 | 19.5 | 2.7 | 0.19 | 19.3 | 44.0 | 0.16 | NA |
| July | 46.6 | 0.18 | 20.2 | 89.6 | 0.24 | 19.7 | 68.4 | 0.20 | 19.5 | 25.9 | 0.17 | 19.6 | 58.7 | 0.18 | 19.6 | 60.8 | 0.25 | 19.7 |
| August | 97.0 | 0.23 | 20.1 | 67.7 | 0.29 | 19.5 | 80.8 | 0.22 | 19.6 | 56.2 | 0.23 | 19.6 | 8.2 | 0.19 | 19.7 | 75.5 | 0.37 | 19.5 |
| September | 93.3 | 0.32 | 19.8 | 73.5 | 0.23 | 19.0 | 45.9 | 0.31 | 19.6 | 91.2 | 0.27 | 19.5 | 12.4 | 0.18 | 19.7 | 44.1 | 0.33 | 19.1 |
| October | 14.1 | 0.29 | 19.3 | 8.1 | 0.21 | 19.1 | 50.1 | 0.29 | 19.4 | 35.9 | 0.34 | 18.9 | 0.5 | 0.17 | 19.7 | 0.6 | 0.24 | NA |
| November | 4.2 | 0.23 | 19.2 | 1.7 | 0.19 | 19.1 | 0.3 | 0.25 | 19.1 | 31.5 | 0.25 | 18.9 | 0.0 | 0.17 | 19.8 | 5.2 | 0.21 | 19.8 |
| December | 15.9 | 0.22 | 19.2 | 46.2 | 0.21 | 19.1 | 13.9 | 0.21 | 19.1 | 16.8 | 0.21 | 19.0 | 8.8 | 0.17 | 19.8 | 13.7 | 0.20 | 19.3 |
| Year | P | ∆h | Re |
|---|---|---|---|
| 2016 | 316 | 1156 | 173 |
| 2017 | 327 | 833 | 125 |
| 2018 | 289 | 680 | 102 |
| 2019 | 299 | 822 | 123 |
| 2020 | 122 | −997 | 0 |
| 2021 | 268 | 761 | 114 |
| 2022 | 390 | 1311 | 197 |
| Z | Stat | 2007 | 2008 | 2009 | 2010 | 2011 | 2012 | 2013 | 2014 | 2015 | 2016 | 2017 | 2018 | 2019 | 2020 | 2021 |
|---|---|---|---|---|---|---|---|---|---|---|---|---|---|---|---|---|
| Low | Min | 0.0693 | 0.1067 | 0.0836 | 0.0740 | 0.0740 | 0.0787 | 0.1564 | 0.1282 | 0.1550 | 0.1348 | 0.1187 | 0.1357 | 0.1085 | 0.1121 | 0.1456 |
| Mean | 0.0989 | 0.1278 | 0.1004 | 0.0999 | 0.0990 | 0.0991 | 0.2008 | 0.1588 | 0.1824 | 0.1763 | 0.1498 | 0.1604 | 0.1755 | 0.1510 | 0.2051 | |
| Max | 0.1481 | 0.1835 | 0.1408 | 0.1395 | 0.1601 | 0.1286 | 0.3189 | 0.2101 | 0.2496 | 0.2300 | 0.2265 | 0.2131 | 0.2700 | 0.2106 | 0.3893 | |
| Mid | Min | 0.0644 | 0.0940 | 0.0832 | 0.0681 | 0.0654 | 0.0681 | 0.1414 | 0.1246 | 0.1446 | 0.1252 | 0.1175 | 0.1223 | 0.1279 | 0.1114 | 0.1200 |
| Mean | 0.0990 | 0.1232 | 0.0962 | 0.1011 | 0.0953 | 0.1063 | 0.1908 | 0.1507 | 0.1775 | 0.1566 | 0.1412 | 0.1579 | 0.1657 | 0.1459 | 0.2430 | |
| Max | 0.1434 | 0.1655 | 0.1129 | 0.1285 | 0.1261 | 0.1427 | 0.2555 | 0.1939 | 0.2722 | 0.2022 | 0.1878 | 0.1984 | 0.2020 | 0.1860 | 0.3111 | |
| High | Min | 0.1088 | 0.0987 | 0.0556 | 0.0915 | 0.0851 | 0.0904 | 0.1539 | 0.1414 | 0.1657 | 0.1311 | 0.1130 | 0.1337 | 0.1392 | 0.1189 | 0.2179 |
| Mean | 0.1289 | 0.1381 | 0.1034 | 0.1211 | 0.1131 | 0.1305 | 0.2043 | 0.1808 | 0.2066 | 0.1624 | 0.1428 | 0.1702 | 0.1879 | 0.1491 | 0.2898 | |
| Max | 0.1600 | 0.1919 | 0.1234 | 0.1690 | 0.1559 | 0.1755 | 0.2459 | 0.2158 | 0.2482 | 0.1893 | 0.1717 | 0.2204 | 0.2297 | 0.2258 | 0.3315 |
| Z | Stat | 2007 | 2008 | 2009 | 2010 | 2011 | 2012 | 2013 | 2014 | 2015 | 2016 | 2017 | 2018 | 2019 | 2020 | 2021 |
|---|---|---|---|---|---|---|---|---|---|---|---|---|---|---|---|---|
| Low | Min | −0.0832 | −0.0771 | −0.0707 | −0.1556 | −0.1058 | −0.0867 | −0.0280 | −0.1075 | −0.0955 | −0.0563 | −0.0756 | −0.0708 | −0.0763 | −0.1600 | −0.0892 |
| Mean | −0.0633 | −0.0172 | −0.0384 | −0.0643 | −0.0623 | −0.0548 | 0.0189 | −0.0427 | −0.0419 | −0.0045 | −0.0372 | −0.0111 | −0.0298 | −0.0836 | −0.0442 | |
| Max | −0.0393 | 0.0696 | 0.0005 | −0.0307 | −0.0271 | −0.0119 | 0.1378 | 0.0190 | 0.0131 | 0.0774 | 0.0836 | 0.1289 | 0.0148 | −0.0341 | 0.0056 | |
| Mid | Min | −0.0713 | −0.0496 | −0.0614 | −0.0913 | −0.0627 | −0.1072 | −0.0305 | −0.0828 | −0.0503 | −0.0435 | −0.0567 | −0.0534 | −0.0794 | −0.1325 | −0.0677 |
| Mean | −0.0379 | 0.0069 | −0.0212 | −0.0351 | −0.0370 | −0.0291 | 0.0144 | −0.0356 | −0.0045 | −0.0051 | −0.0175 | 0.0088 | −0.0072 | −0.0401 | −0.0135 | |
| Max | 0.0113 | 0.0474 | 0.0252 | 0.0195 | 0.0117 | 0.0321 | 0.0709 | −0.0033 | 0.0652 | 0.0464 | 0.0460 | 0.0559 | 0.0443 | 0.0163 | 0.0338 | |
| High | Min | −0.0838 | −0.0173 | −0.1018 | −0.0565 | −0.1149 | −0.0628 | −0.0313 | −0.0656 | −0.0726 | −0.0495 | −0.0346 | −0.0471 | −0.0291 | −0.1617 | −0.0972 |
| Mean | −0.0189 | 0.0246 | −0.0228 | −0.0097 | −0.0330 | −0.0057 | 0.0315 | −0.0046 | 0.0077 | 0.0143 | 0.0025 | 0.0073 | 0.0205 | −0.0396 | −0.0002 | |
| Max | 0.0266 | 0.0658 | 0.0293 | 0.0376 | 0.0221 | 0.0425 | 0.0884 | 0.0477 | 0.0476 | 0.0575 | 0.0284 | 0.0617 | 0.0676 | 0.0088 | 0.0434 |
| Variable | Sen’s Slope | p-Value |
|---|---|---|
| Pre-Treatment (2007–2012) | ||
| Air Temperature | 0.00104 | <0.001 |
| Precipitation | 0.00000 | 0.240 |
| NDVI | −0.00008 | <0.001 |
| NDII | 0.00029 | <0.001 |
| Post-Treatment (2014–2021) | ||
| Air Temperature | 0.00035 | <0.001 |
| Precipitation | 0.00000 | 0.840 |
| NDVI | 0.00015 | <0.001 |
| NDII | 0.00035 | <0.001 |
| G | 0.00013 | <0.001 |
Disclaimer/Publisher’s Note: The statements, opinions and data contained in all publications are solely those of the individual author(s) and contributor(s) and not of MDPI and/or the editor(s). MDPI and/or the editor(s) disclaim responsibility for any injury to people or property resulting from any ideas, methods, instructions or products referred to in the content. |
© 2023 by the authors. Licensee MDPI, Basel, Switzerland. This article is an open access article distributed under the terms and conditions of the Creative Commons Attribution (CC BY) license (https://creativecommons.org/licenses/by/4.0/).
Share and Cite
Ochoa, C.G.; Villarreal-Guerrero, F.; Prieto-Amparán, J.A.; Garduño, H.R.; Huang, F.; Ortega-Ochoa, C. Precipitation, Vegetation, and Groundwater Relationships in a Rangeland Ecosystem in the Chihuahuan Desert, Northern Mexico. Hydrology 2023, 10, 41. https://doi.org/10.3390/hydrology10020041
Ochoa CG, Villarreal-Guerrero F, Prieto-Amparán JA, Garduño HR, Huang F, Ortega-Ochoa C. Precipitation, Vegetation, and Groundwater Relationships in a Rangeland Ecosystem in the Chihuahuan Desert, Northern Mexico. Hydrology. 2023; 10(2):41. https://doi.org/10.3390/hydrology10020041
Chicago/Turabian StyleOchoa, Carlos G., Federico Villarreal-Guerrero, Jesús A. Prieto-Amparán, Hector R. Garduño, Feng Huang, and Carlos Ortega-Ochoa. 2023. "Precipitation, Vegetation, and Groundwater Relationships in a Rangeland Ecosystem in the Chihuahuan Desert, Northern Mexico" Hydrology 10, no. 2: 41. https://doi.org/10.3390/hydrology10020041
APA StyleOchoa, C. G., Villarreal-Guerrero, F., Prieto-Amparán, J. A., Garduño, H. R., Huang, F., & Ortega-Ochoa, C. (2023). Precipitation, Vegetation, and Groundwater Relationships in a Rangeland Ecosystem in the Chihuahuan Desert, Northern Mexico. Hydrology, 10(2), 41. https://doi.org/10.3390/hydrology10020041


