Article

Evaluating the Benefits of Flood Warnings in the Management of an Urban Flood-Prone Polder Area

1
Carrera de Ingeniería Ambiental, Centro de Investigaciones Tropicales del Ambiente y Biodiversidad (CITIAB), Universidad Nacional de Loja (UNL), Avenida Pio Jaramillo Alvarado, La Argelia, Loja 1101608, Ecuador
2
School of Engineering, Newcastle University, Newcastle upon Tyne NE1 7RU, UK
3
The National Key Laboratory of Water Disaster Prevention, Nanjing Hydraulic Research Institute, Guangzhou Road, Nanjing 210029, China
4
College of Geomatics & Municipal Engineering, Zhejiang University of Water Resources and Electric Power, Xuelin Road, Hangzhou 310020, China
*
Author to whom correspondence should be addressed.
Hydrology 2023, 10(12), 238; https://doi.org/10.3390/hydrology10120238
Submission received: 3 November 2023 / Revised: 29 November 2023 / Accepted: 7 December 2023 / Published: 13 December 2023
(This article belongs to the Section Hydrological and Hydrodynamic Processes and Modelling)

Abstract

:
Polders are low-lying areas located in deltas, surrounded by embankments to prevent flooding (river or tidal floods). They rely on pumping systems to remove water from the inner rivers (artificial rivers inside the polder area) to the outer rivers, especially during storms. Urbanized polders are especially vulnerable to pluvial flooding if the drainage, storage, and pumping capacity of the polder is inadequate. In this paper, a Monte Carlo (MC) framework is proposed to evaluate the benefits of rainfall threshold-based flood warnings when mitigating pluvial flooding in an urban flood-prone polder area based on 24 h forecasts. The framework computes metrics that give the potential waterlogging duration, maximum inundated area, and pump operation costs by considering the full range of potential storms. The benefits of flood warnings are evaluated by comparing the values of these metrics across different scenarios: the no-warning, perfect, deterministic, and probabilistic forecast scenarios. Probabilistic forecasts are represented using the concept of “predictive uncertainty” (PU). A polder area located in Nanjing was chosen for the case study. The results show a trade-off between the metrics that represent the waterlogging and the pumping costs, and that probabilistic forecasts of rainfall can considerably enhance these metrics. The results can be used to design a rainfall threshold-based flood early warning system (FEWS) for a polder area and/or evaluate its benefits.

1. Introduction

Polders are low-lying areas of land adjacent to coasts or large rivers that are enclosed by embankments constructed to protect the river and coastal floodplains in deltas across the globe, e.g., Bangladesh [1], Indonesia [2], Netherlands [3], and China [4]. Polders lie below the levels of the sea or adjacent outer rivers, and, therefore, pumping systems must be used during storm events to remove water from the inner rivers (artificial rivers inside the polder area) to the outer rivers to enable water to drain from the polder areas into the inner rivers [5]. Thus, even though polder areas are protected from river or tidal floods through embankments, these low-lying areas can also be affected by urban flooding if they are exposed to intense precipitation and the drainage, storage, and pumping capacity of the polder is poor. This condition is even worse with the more intense rainfalls experienced in recent years due to climate change. This is an issue that, for example, China is currently experiencing [6,7,8,9].
Cities on the Yangtze River Delta (the plain region of southeast China) are characterised by urban flood-prone polder systems [4], and Nanjing and Anhui, for example, have suffered catastrophic floods, e.g., in 1998 and 2016 [7,9]. Urban flood-prone polder systems in China are often operated based on reactive pumping actions (water-pumped based on the observed runoff (inflow) entering the inner rivers) [5,10], which increases the probability of the inner rivers’ storage capacity being overwhelmed. When this occurs, the runoff cannot drain freely to the inner rivers, and the waterlogging, and, therefore, the flood impact on the polder area, increases. The duration of waterlogging and the maximum inundated area are, for example, variates that measure damage which increases when this critical condition occurs in the polder system. Since the polder system’s storage capacity is defined by the water level of the inner rivers when the storm arrives, flood warnings can provide time in advance to decrease that water level through proactive pumping, thus increasing the storage capacity, and avoiding the critical condition situation.
Based on this concept, a flood early warning system, FEWS, based on rainfall thresholds [11,12,13,14] can be designed and implemented which can be characterised by a forecasting model providing, for example, forecasts of future storms, warning decisions made based on those forecasts and rainfall thresholds, and responses defined based on the pumping scheme operating in the flood-prone polder area. FEWSs operating in flood-prone polder systems of this kind have not, to the authors’ knowledge, been studied and designed before, apart from a recent study in Thailand [15] which reported that flood forecasts for a polder in Bangkok made it possible to decide in advance on explicit flood controls, including pump and canal gate operations. Urban polders in China have been studied in another context, for example, by analysing how polders (i) modify a river network structure [16], (ii) impact the hydrology of the adjacent outer rivers during extreme events [6,8], or (iii) impact the flood risk of areas located downstream of adjacent outer rivers [7].
The main aim of this paper is to demonstrate the potential benefits that could be gained from the use of flood forecasts and warnings in the operation of a polder system to mitigate flooding. This is achieved by simulating a rainfall threshold-based FEWS for monitoring and warning an urban flood-prone polder located in Nanjing (the Shazhou polder). The end-to-end forecast–warning–response system is driven by rainstorms and their forecasts simulated using the MC method. Deterministic and probabilistic forecasts and resulting warnings are simulated and metrics are computed that quantify the potential waterlogging duration and maximum inundated area in the polder under a wide range of storms, and the trade-off with pumping costs is explored for different pumping strategies.
This paper is structured as follows: Section 2 describes the materials and methods used to achieve the work’s aim. Here, the study area is described first in Section 2.1, and the conceptual model used by the MC framework to represent the water fluxes during a storm in the Shazhou polder is explained in Section 2.2. Then, a general description of the MC framework used to evaluate the potential benefits of flood warnings is given (Section 2.3). Next, in Section 2.4, Section 2.5 and Section 2.6, detailed descriptions of the components designed to obtain the metrics defining the waterlogging and pump operation costs are given. The results are presented in Section 3, and the paper ends with the discussion and conclusions in Section 4.

2. Materials and Methods
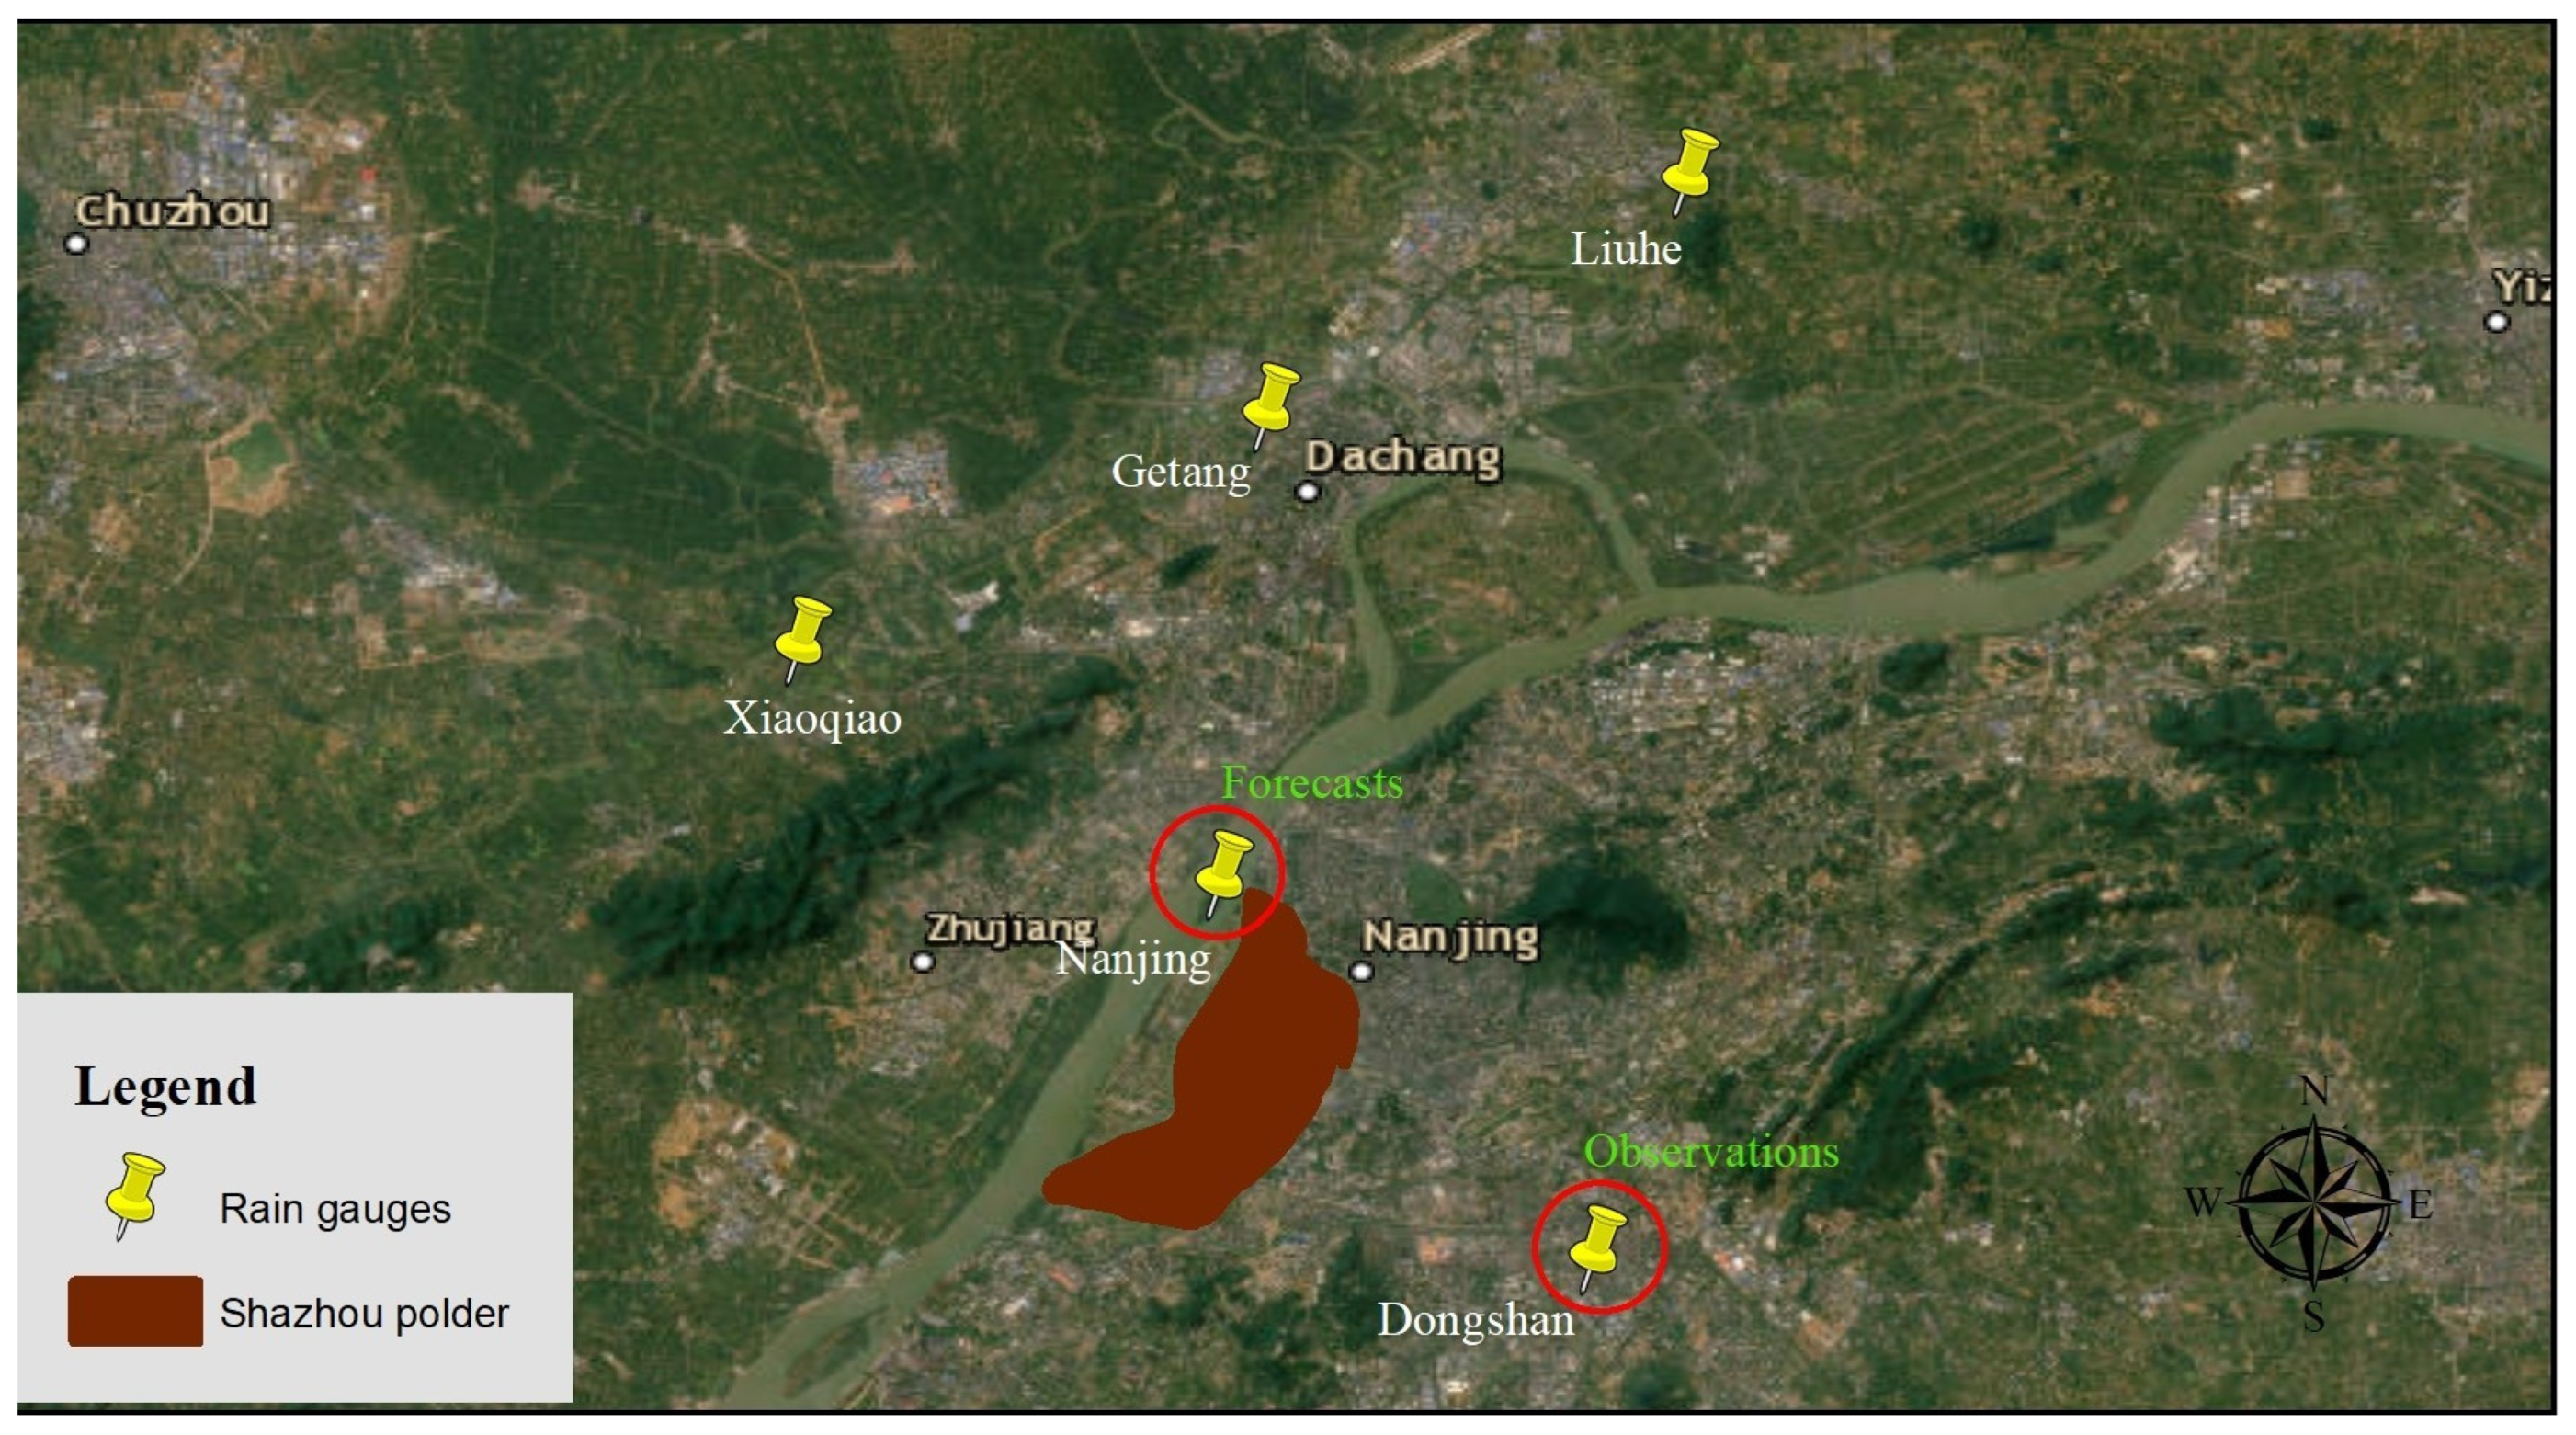
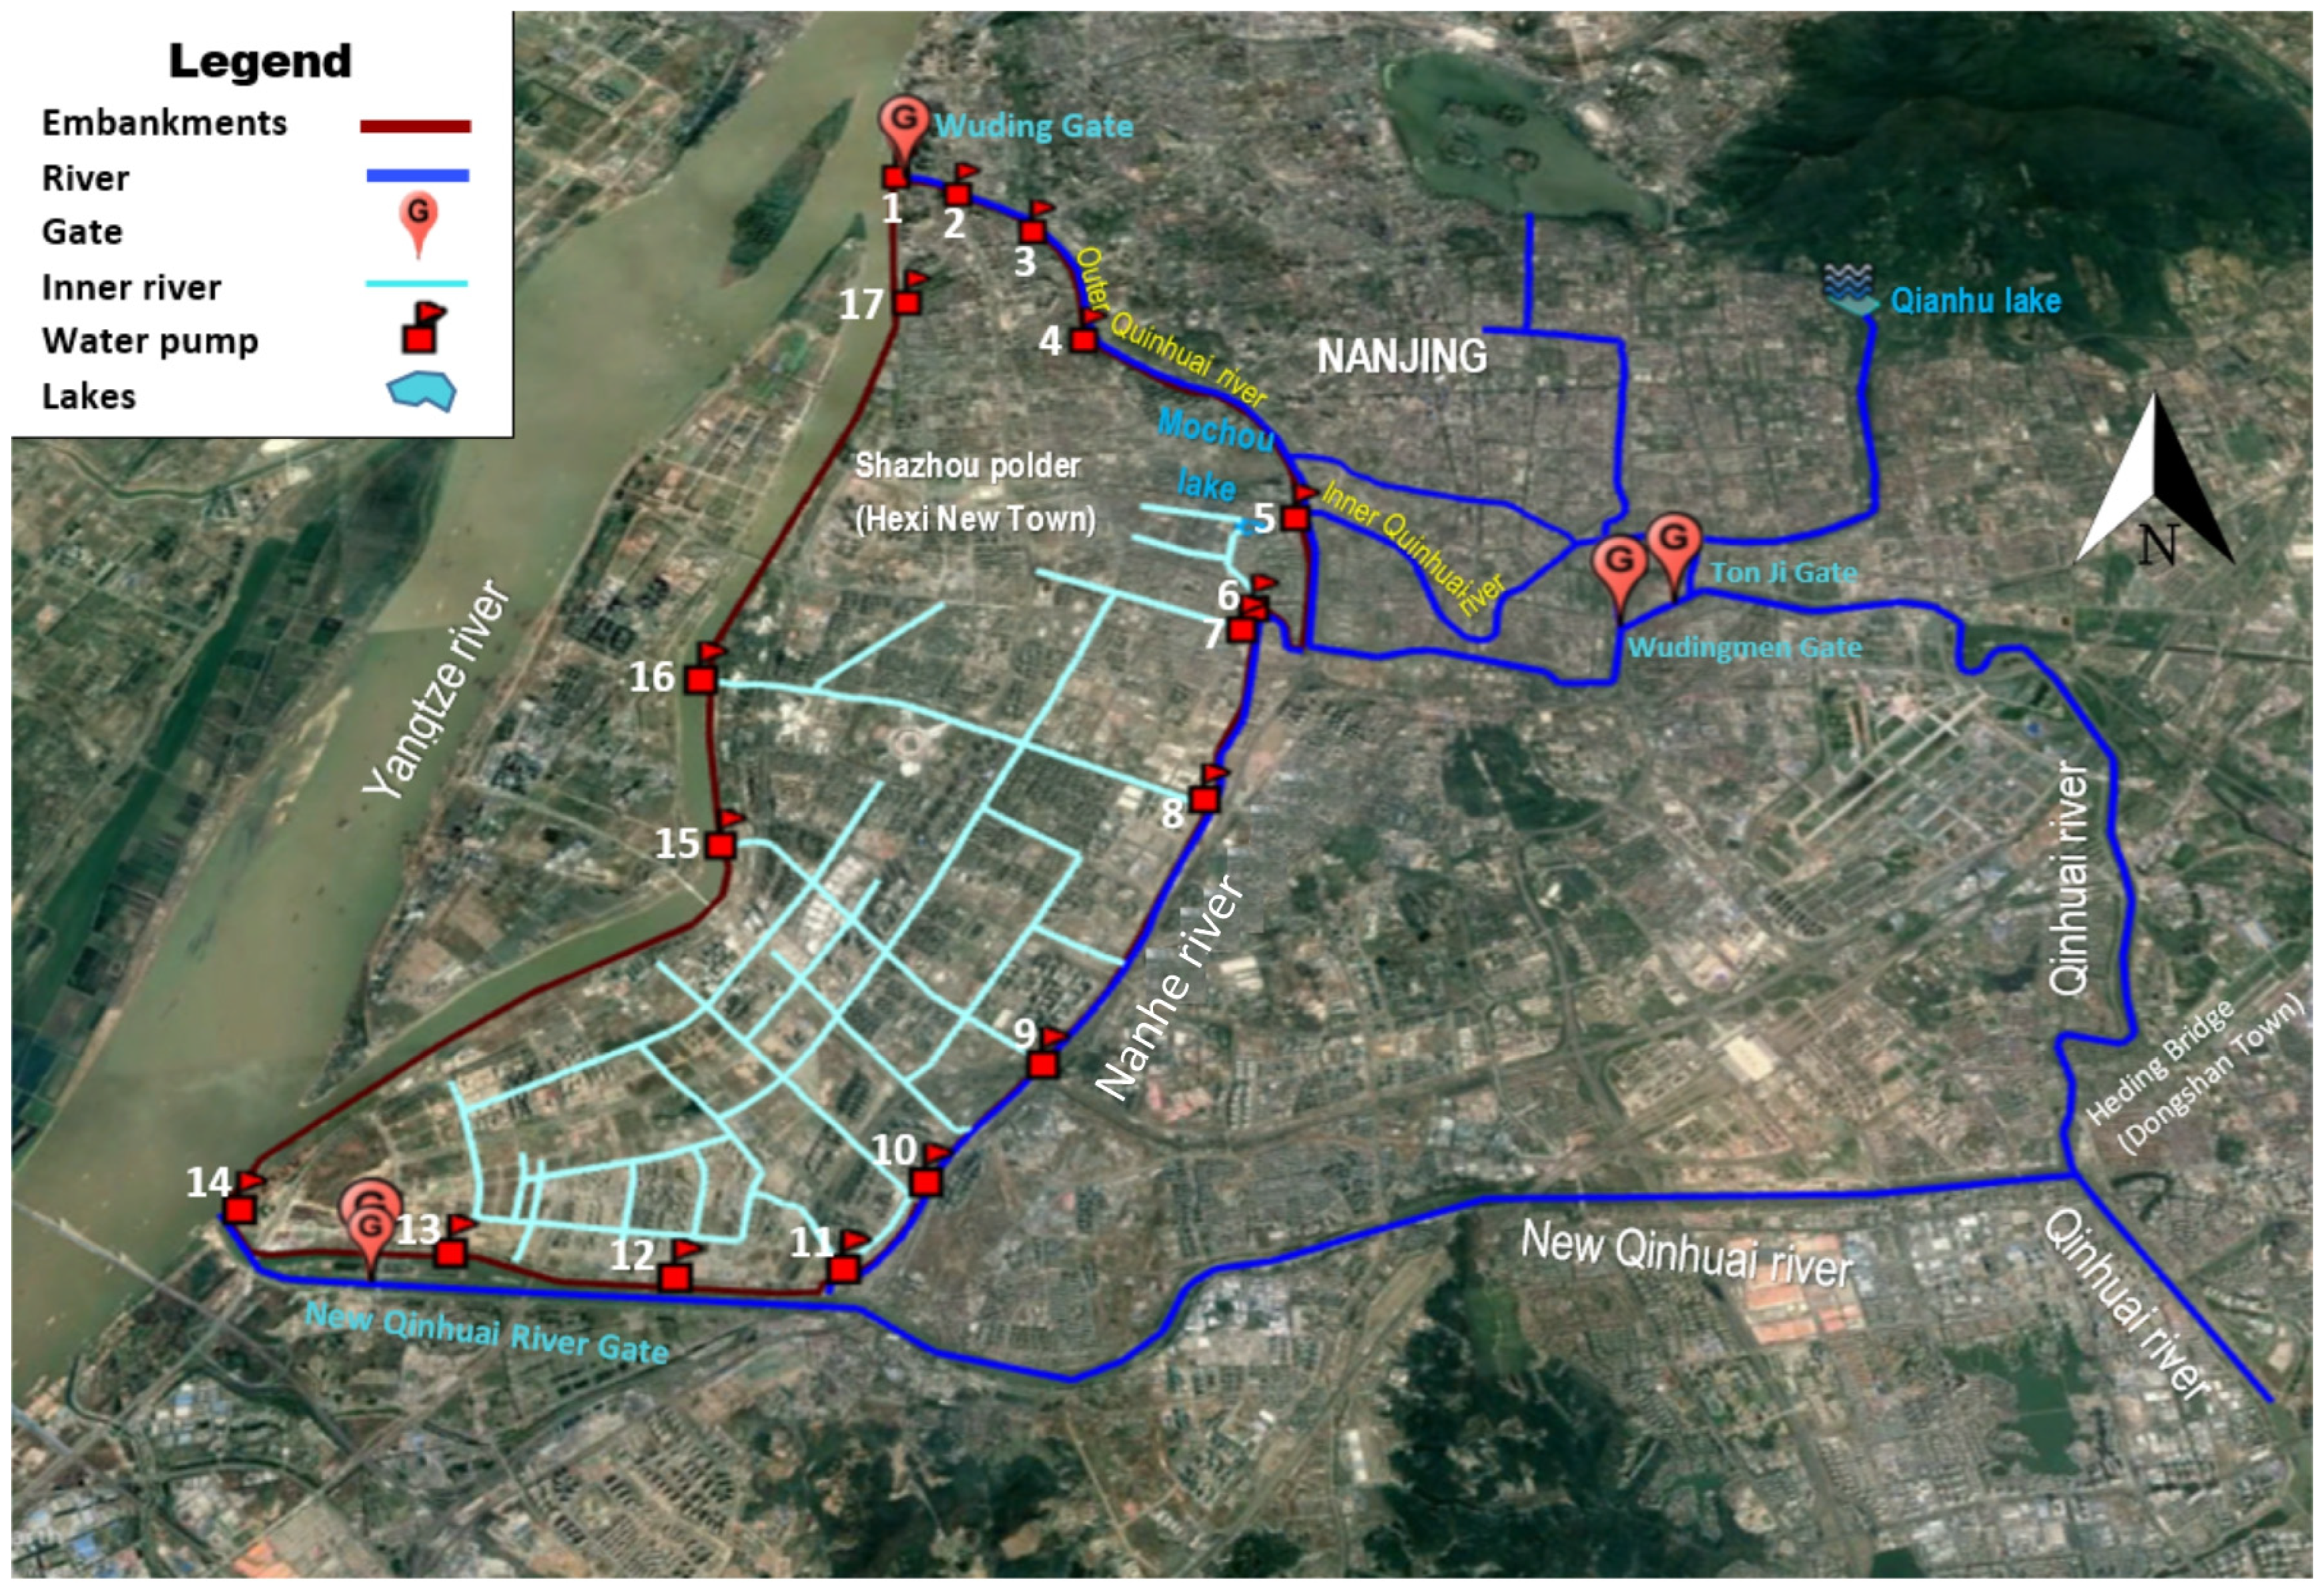
2.1. Study Area

Nanjing has suffered from severe pluvial flooding in recent years due to intense summer rainstorms, notably in 2016, resulting in the inundation of a number of areas in the city. Most of these areas are polders that have inner rivers and which lie below the levels of the adjacent outer rivers, which are, ultimately, connected to the Yangtse river. Pumping systems are operated during storm events to remove water from the inner rivers to the outer rivers, to enable water to drain from the polder areas into the inner rivers. Even though storm warnings are issued in Nanjing, these pumping operations can be considered to be reactive because they are mainly driven by the observed inflow.
The Shazhou polder is situated in Hexi New Town, located in the southwest of Nanjing City. This area (54.7 km2) is surrounded by the Yangtze, Qinhuai, Nanhe, and New Qinhuai rivers (the outer rivers). The topography of Hexi New Town is plain and low-lying, lower than the normal water level of the adjacent outer rivers. The town is protected from flooding by embankments, and stormwater, collected in the inner rivers, is discharged to the adjacent outer rivers using pumping stations [17] (Figure 1).
This research only focuses on the simulation of the water fluxes of the polder system and the inner rivers, and neglects any interaction with the adjacent outer rivers.

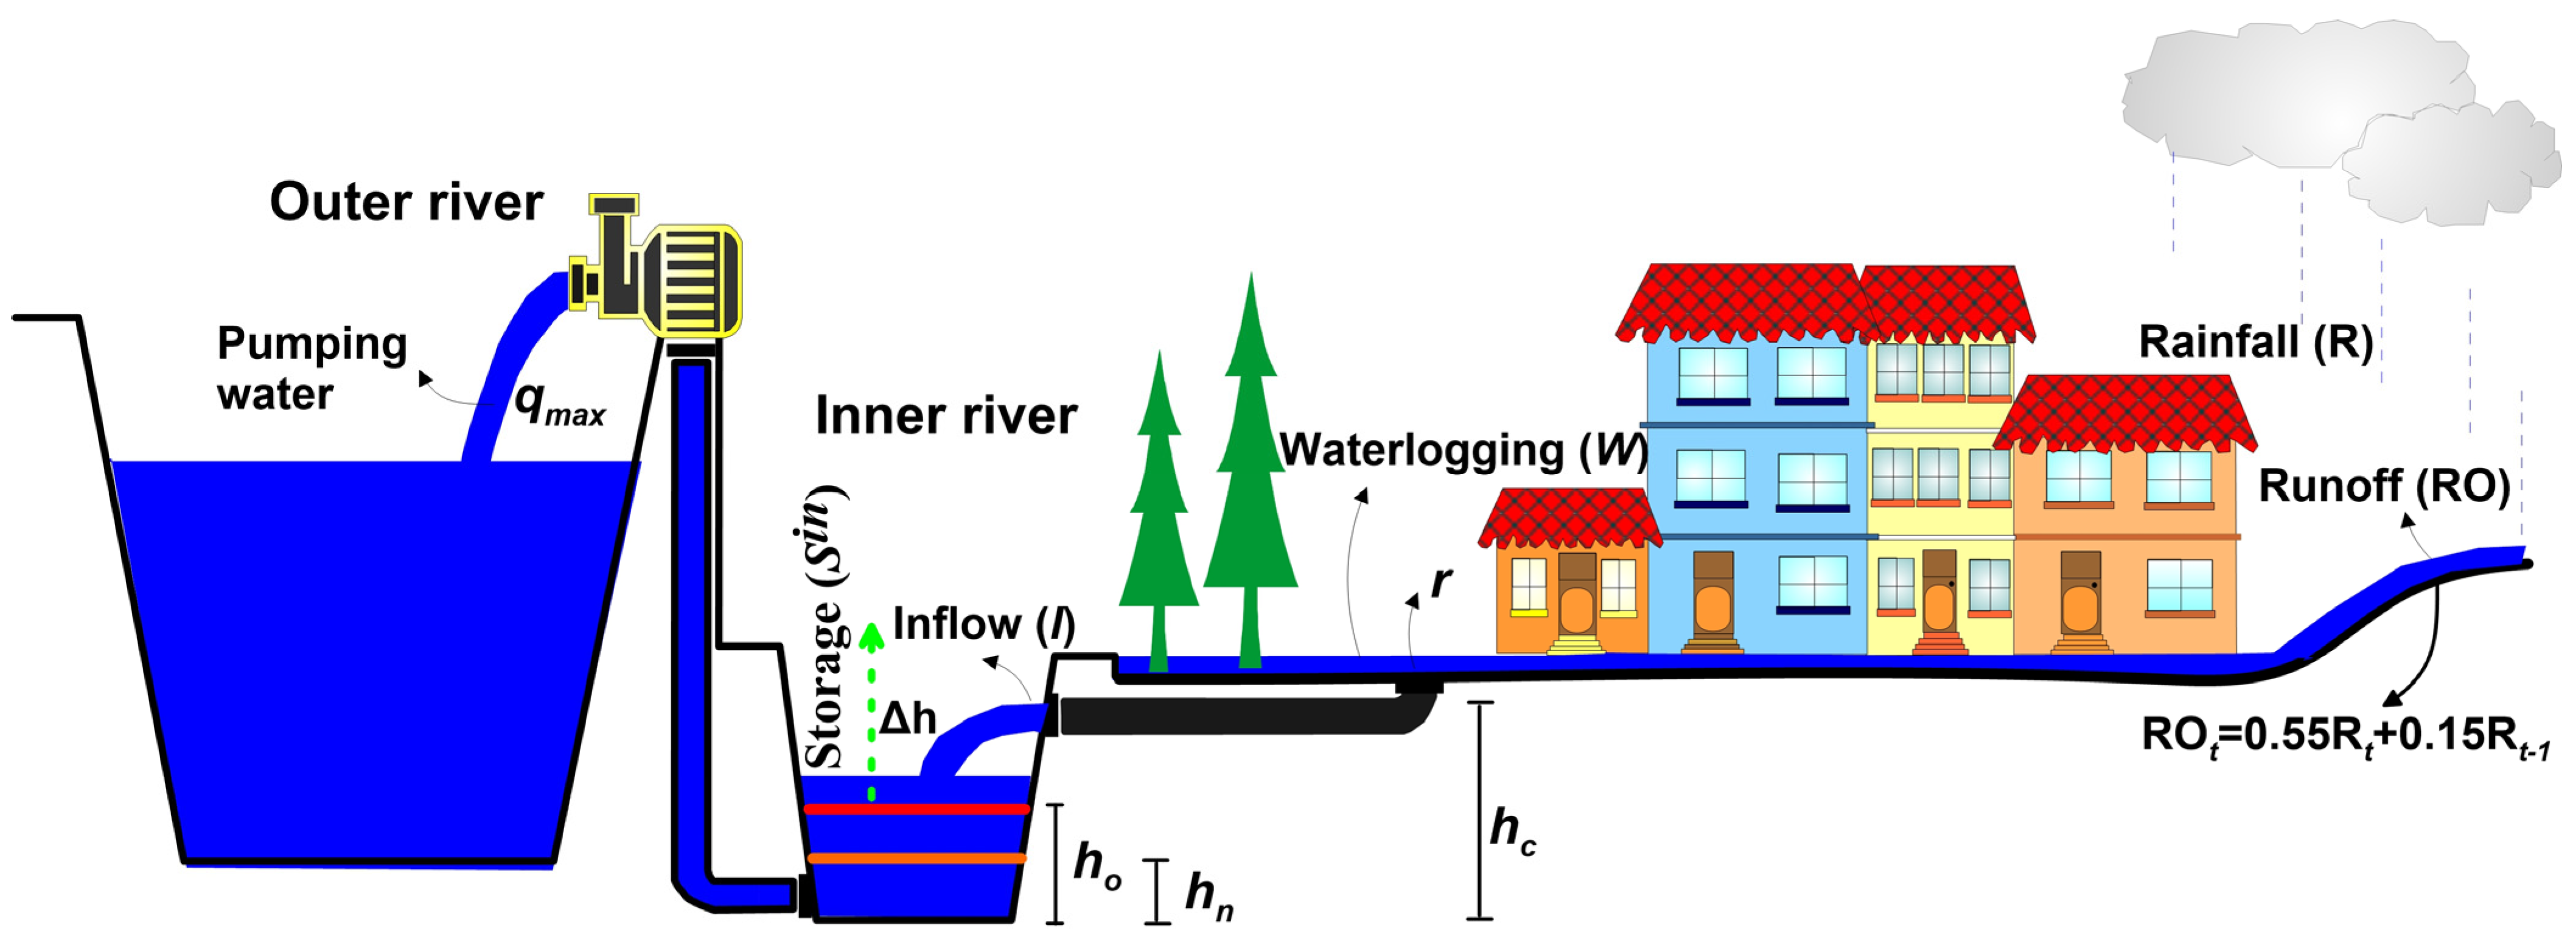
2.2. Conceptual Model of Water Fluxes in the Shazhou Polder System during A Storm Event

2.2.1. Model Structure

As in other works that have simulated water fluxes in a polder [5,6,18], this conceptual model assumes that the Shazhou polder can be represented as a tank with inputs and outputs (an input–output system). Thus, five processes have been identified to be simulated in the system during a storm: inflow to the inner rivers, polder runoff, waterlogging, storage in the inner rivers, and water pumped to the outer rivers (Figure 2). This model considers a “conceptual pipe” that aggregates the many contributions from the different parts of the polder urban drainage network. In the above-mentioned works, the capacity of this pipe has been represented through a variate representing the aggregation of the pipe-network drainage system ( r ). A maximum storage capacity of the inner rivers ( S m a x c a p ) is also considered which is defined here as the difference between two benchmark water levels: the water level at the outlet of the pipe above which waterlogging occurs, hereinafter called the critical water level ( h c ), and a pre-lowered water level in normal conditions ( h n ).
This model assumes that the initial water level prior to a storm is not a constant due to differences in the antecedent patterns of rainfall, h o   h n . If the water level exceeds the top of the pipe outlet level during a storm event, i.e., the critical water level h c , runoff cannot freely drain from the polder area; this constitutes the critical condition that can trigger or enhance waterlogging. The storage capacity of the inner rivers before a storm arrives ( S o c a p ) is defined by the difference between h c and h o ; its maximum value is S m a x c a p . Figure 2 shows the system working under non-critical conditions, i.e., when the water level of the inner rivers is below the critical level h c . However, waterlogging may still occur in this situation if the runoff from the polder exceeds the capacity of the pipe-network drainage r ; in this case, the maximum pumping capacity of the polder ( q m a x ) is used. The runoff process is simulated by using an average runoff coefficient ( C r u ) embedded into a rainfall–runoff relationship used by [18] to represent the rainfall–runoff process of a neighbouring polder, whereas the water storage in the inner rivers ( S i n ) at a given time step t is computed based on a variate known as the water surface ratio of a polder ( k ).
In our simulations, we have assumed that the maximum storage capacity of the inner rivers remains constant over time, and is not affected by sedimentation. However, we are focusing only on the month of July when flooding is prevalent, and doing multiple stochastic simulations of polder operation over this month, not continuous long-term simulation. So, sedimentation is not an issue over this time scale. However, we acknowledge that for an operational forecasting system, regular sediment depth surveys and storage adjustments would be necessary.
It is thought that a reactive pumping strategy is currently implemented by the flood managers, in which the rate of pumping is based on the inflow rate; this has been documented in [5,19]. The impact of pumping on the outer river levels, which drain to the Yangtze River, is not considered. A critical condition occurs if the pumping is insufficient to prevent the water levels from submerging the pipe outlet. Thus, there are two potential states of the system during a storm: the non-critical condition, when the water level of the inner rivers ( h ) is < h c , and the critical condition, when h     h c .
Under the assumptions detailed above, the system simulation algorithm is represented through Equations (A1)–(A7) (Appendix A), where the water balance is performed at an hourly time step, and all variates are represented in mm·hr−1 per square meter of surface area, rather than volumes. Table 1 describes the parameters needed to implement the algorithm.

2.2.2. Model Calibration Procedure

Particular efforts have been made recently to simulate polder systems in China for flood risk analysis [4,6,8]. However, none of the studies have considered a calibration procedure for the urban drainage system. One of the main reasons could be a lack of data/information, since, to calibrate a conceptual model, an average value of the observed water level of the inner rivers would be needed, derived from several observed points in the river network. In this context, the objective of the calibration process was to represent the conditions that give rise to a critical condition situation in the Shazhou polder, rather than the accurate simulation of the average observed water level ℎ, as this information was not available. For these purposes, this work used the observed rainfall of the 7 July 2016 event that is known to have caused a critical condition in the polder system. The calibration procedure consisted of adjusting one of the five parameter values in Table 1—the maximum pumping capacity ( q m a x ) of the polder. Values for the remaining parameter values were adopted from previous studies performed in the case study area [17,19]. Thus, the conceptual model used in the MC framework is not a precisely calibrated model, but it does capture the key components of the polder system and has been shown to reproduce the critical condition for a historical storm event. The calibrated model is sufficient to support a demonstration of the benefits of forecasts for decision-making within the MC framework. A much stronger calibration using more data would be needed for an operational forecasting and decision-support system.

2.3. General Description of the MC Framework

The MC framework is based on three components that support the simulation of a hypothetical FEWS monitoring and warning at the Shazhou polder (Figure 3a): (i) a rainstorm-and-forecast generator (RFG) which generates synthetic ‘real’ hourly rainfall and deterministic and probabilistic 24 h forecasts of the ‘real’ rainfall; (ii) a flood warning decision component (FWDC) that simulates warning decisions based on the type of forecast generated by the RFG; and (iii) a response and impact component (RIC) that uses the conceptual model of the Shazhou polder (Section 2.2.1) with pumping strategies to estimate their impact on waterlogging in the polder area, and the cost of pumping to mitigate this. In the RIC, a proactive pumping strategy is triggered by flood warnings and starts before the storm arrives based on the 24 h forecasts of rainfall. If a flood warning is not issued, only reactive pumping is implemented, i.e., the rate of pumping is based on the inflow rate (current condition of the Shazhou polder).
As shall be seen later, the MC framework’s application was based on simulated observed and forecast rainfalls generated from a stochastic spatio-temporal rainfall model embedded in the RFG. Therefore, the reader should have in mind that the use of the words“ observed” and “forecast” throughout the paper refers to simulated observed and forecast rainfalls which implies that the proposed framework can be applied with real-world observed and forecast rainfall data. In the following subsections, a description of the three components of the MC framework is given.

2.4. The Rainstorm-and-Forecast Generator (RFG)

The Rainfall Forecast Generator, RFG, utilizes RainSim V3, a stochastic spatial–temporal rainfall field generator which is described in detail in [20]; a brief summary is provided in Appendix B. RainSim is used to generate ‘observed’ rainfall values and their forecasts at hourly resolution with a prescribed correlation.
As numerical weather prediction (NWP) rainfall forecasts (e.g., ensembles) are typically available for up to 24 h in advance, a flood in the polder area is simulated based on rainfall forecasts over a 24 h forecast horizon (forecast lead time). To obtain the deterministic rainfall forecast, the hourly simulated forecasts are aggregated to obtain a 24 h forecast R ^ d a i l y .
A predictive uncertainty (PU) approach has been adopted to probabilistic rainfall forecasting, noting that the PU approach can encompass ensemble predictions [21]. To obtain the 24 h probabilistic forecast and its associated PU, a bivariate parametric model is constructed using daily ‘observed’ rainfalls ( R d a i l y ) and their forecasts R ^ d a i l y generated by the RainSim model. The model’s parameters, marginal distributions, and correlation coefficient are determined, and a conditional distribution of R d a i l y given R ^ d a i l y , i.e., f R d a i l y R ^ d a i l y .
To obtain the parameters of the marginal distributions of R d a i l y and R ^ d a i l y , a univariate analysis was performed based on the goodness of fit (GoF) of different distributions. When the sample size is large, as in this work, the GoF is not based on a traditional statistical test (tests based on the p -value) [22]; therefore, visual inspection was used to analyse the GoF through quantile–quantile (q-q) plots, and the Weibull equation was employed to compute empirical probabilities:
F m = m n + 1
where F m is the probability of non-exceedance of the event m , which is defined through the rank of descending values, and n is the sample size.
Thus, the RFG generates deterministic and probabilistic 24 h rainfall forecasts for the FWDC to simulate flood warnings. Figure 4 illustrates the generation of the probabilistic 24 h rainfall forecast conducted by the RFG, and Appendix B provides additional details on the RainSim model, fitting procedure, and data used for fitting.

2.5. The Flood Warning Decision Component (FWDC)

A flood warning aims to provide time in advance to the polder manager to conduct a proactive action in the polder system to avoid a critical condition situation. Figure 5a shows the chronology adopted within the MC framework for the operation of the polder system. It is assumed that the flood warning is issued at midnight, and, thus, the polder manager can conduct a proactive strategy based on the 24 h forecast. Note that the end of the proactive action ( t p r o ) depends on the pumping strategy adopted by the polder manager and where t p r o is located in time, and the storm might arrive before or after the proactive period.
The warning decision made at midnight is represented by a decision rule, and uses a rainfall threshold (RT) curve as a tool for making the flood warning decision. The RT curve defines critical volumes of daily rainfall on the polder area that bring the inner rivers to the critical condition ( h     h c , Figure 2). This curve is made up of different critical values associated with several initial conditions of the water level of the inner rivers ( h 0 ) at the time the forecast is issued. Thus, in the deterministic forecast scenario, it is assumed that a warning is automatically issued when the deterministic 24 h forecast, i.e., R ^ d a i l y , is above the RT curve (Figure 5b). In the probabilistic forecast scenario, a warning is automatically issued when the probability of exceedance ( P E ) of the RT curve exceeds a pre-defined probabilistic threshold (PT) (Figure 5c). P E is obtained from f R d a i l y R ^ d a i l y  (Figure 4), and PT is a value to be determined when analysing the performance of the FEWS in terms of the waterlogging and costs of the pumping response.

2.5.1. The Rainfall Threshold (RT) Curve for the Polder System

A rainfall threshold for flood warnings represents a simple and widely used method that has been used for urban and fluvial areas [13,14,23]. Although the application of thresholds is similar, the methodology of how rainfall threshold methods are set varies when considering the precision and parameters required [24]. In this work, a daily rainfall threshold ( R T d a i l y ) for a polder system is defined as the volume of a daily rainfall which brings the water level of the inner rivers to the critical level h c , i.e., a daily rainfall that fills up the storage capacity of the inner rivers. Thus, daily rainfall values greater than R T d a i l y falling on the polder area bring the inner rivers to critical conditions. In this context, R T d a i l y has to be associated with h o , i.e., the initial condition of the water level of the inner rivers at the time the forecast is issued. Note also that a critical condition situation depends not only on the volume but also on the rainfall profile of the storm causing critical conditions in the polder. Daily rainfalls with significant volumes that spread uniformly during the day might not cause critical conditions in the polder due to the runoff rate reaching the inner river being equal to or lower than the pumping capacity of the polder q m a x . In this case, water is not stored in the inner rivers, and the polder manager can drain the runoff smoothly if he pumps in proportion to the drainage from the polder. However, other daily rainfalls with similar rainfall volumes, but concentrated in relatively short time periods, might cause critical conditions in the polder system due to the runoff rate possibly being higher than the maximum pumping capacity q m a x . In this case, the water is pumped at a rate equal to q m a x , but the water level rises, and a critical condition situation can be reached. To account for the uncertainty in the distribution of rainfall across the day, the calibrated stochastic rainfall field model (RainSim V3), provides daily rainfall profiles based on the generated hourly values of those events that could potentially produce significant runoff events in the polder system (Appendix B). A value of R T d a i l y can be computed for each profile using a trial-and-error approach with the water balance model of the Shazhou polder with a pumping strategy that is thought to represent the current reactive pump operation in the Shazou polder (this is based on information provided by Nanjing Hydraulic Research Institute, NHRI). Then, R T d a i l y is estimated as a p-quantile of the resulting PDF of these values. The algorithm can be summarized as follows:
  • Step 1: From the RainSim simulations, define a set of observed daily rainfalls that could potentially produce significant runoff events in the polder system (daily rainfalls >50 mm, which is defined as extreme rainfall in China [25]).
  • Step 2: Define different initial conditions as
    h o j = h n + j h n n o
    where h o j is the initial condition j (i.e., the water level of the inner rivers before the storm arrives); n o is the number of initial conditions considered; h n is the normal level; and Δ h n is the difference between the critical water level h c and the normal water level h n .
  • Step 3: For each h o j , perform the following sub-steps:
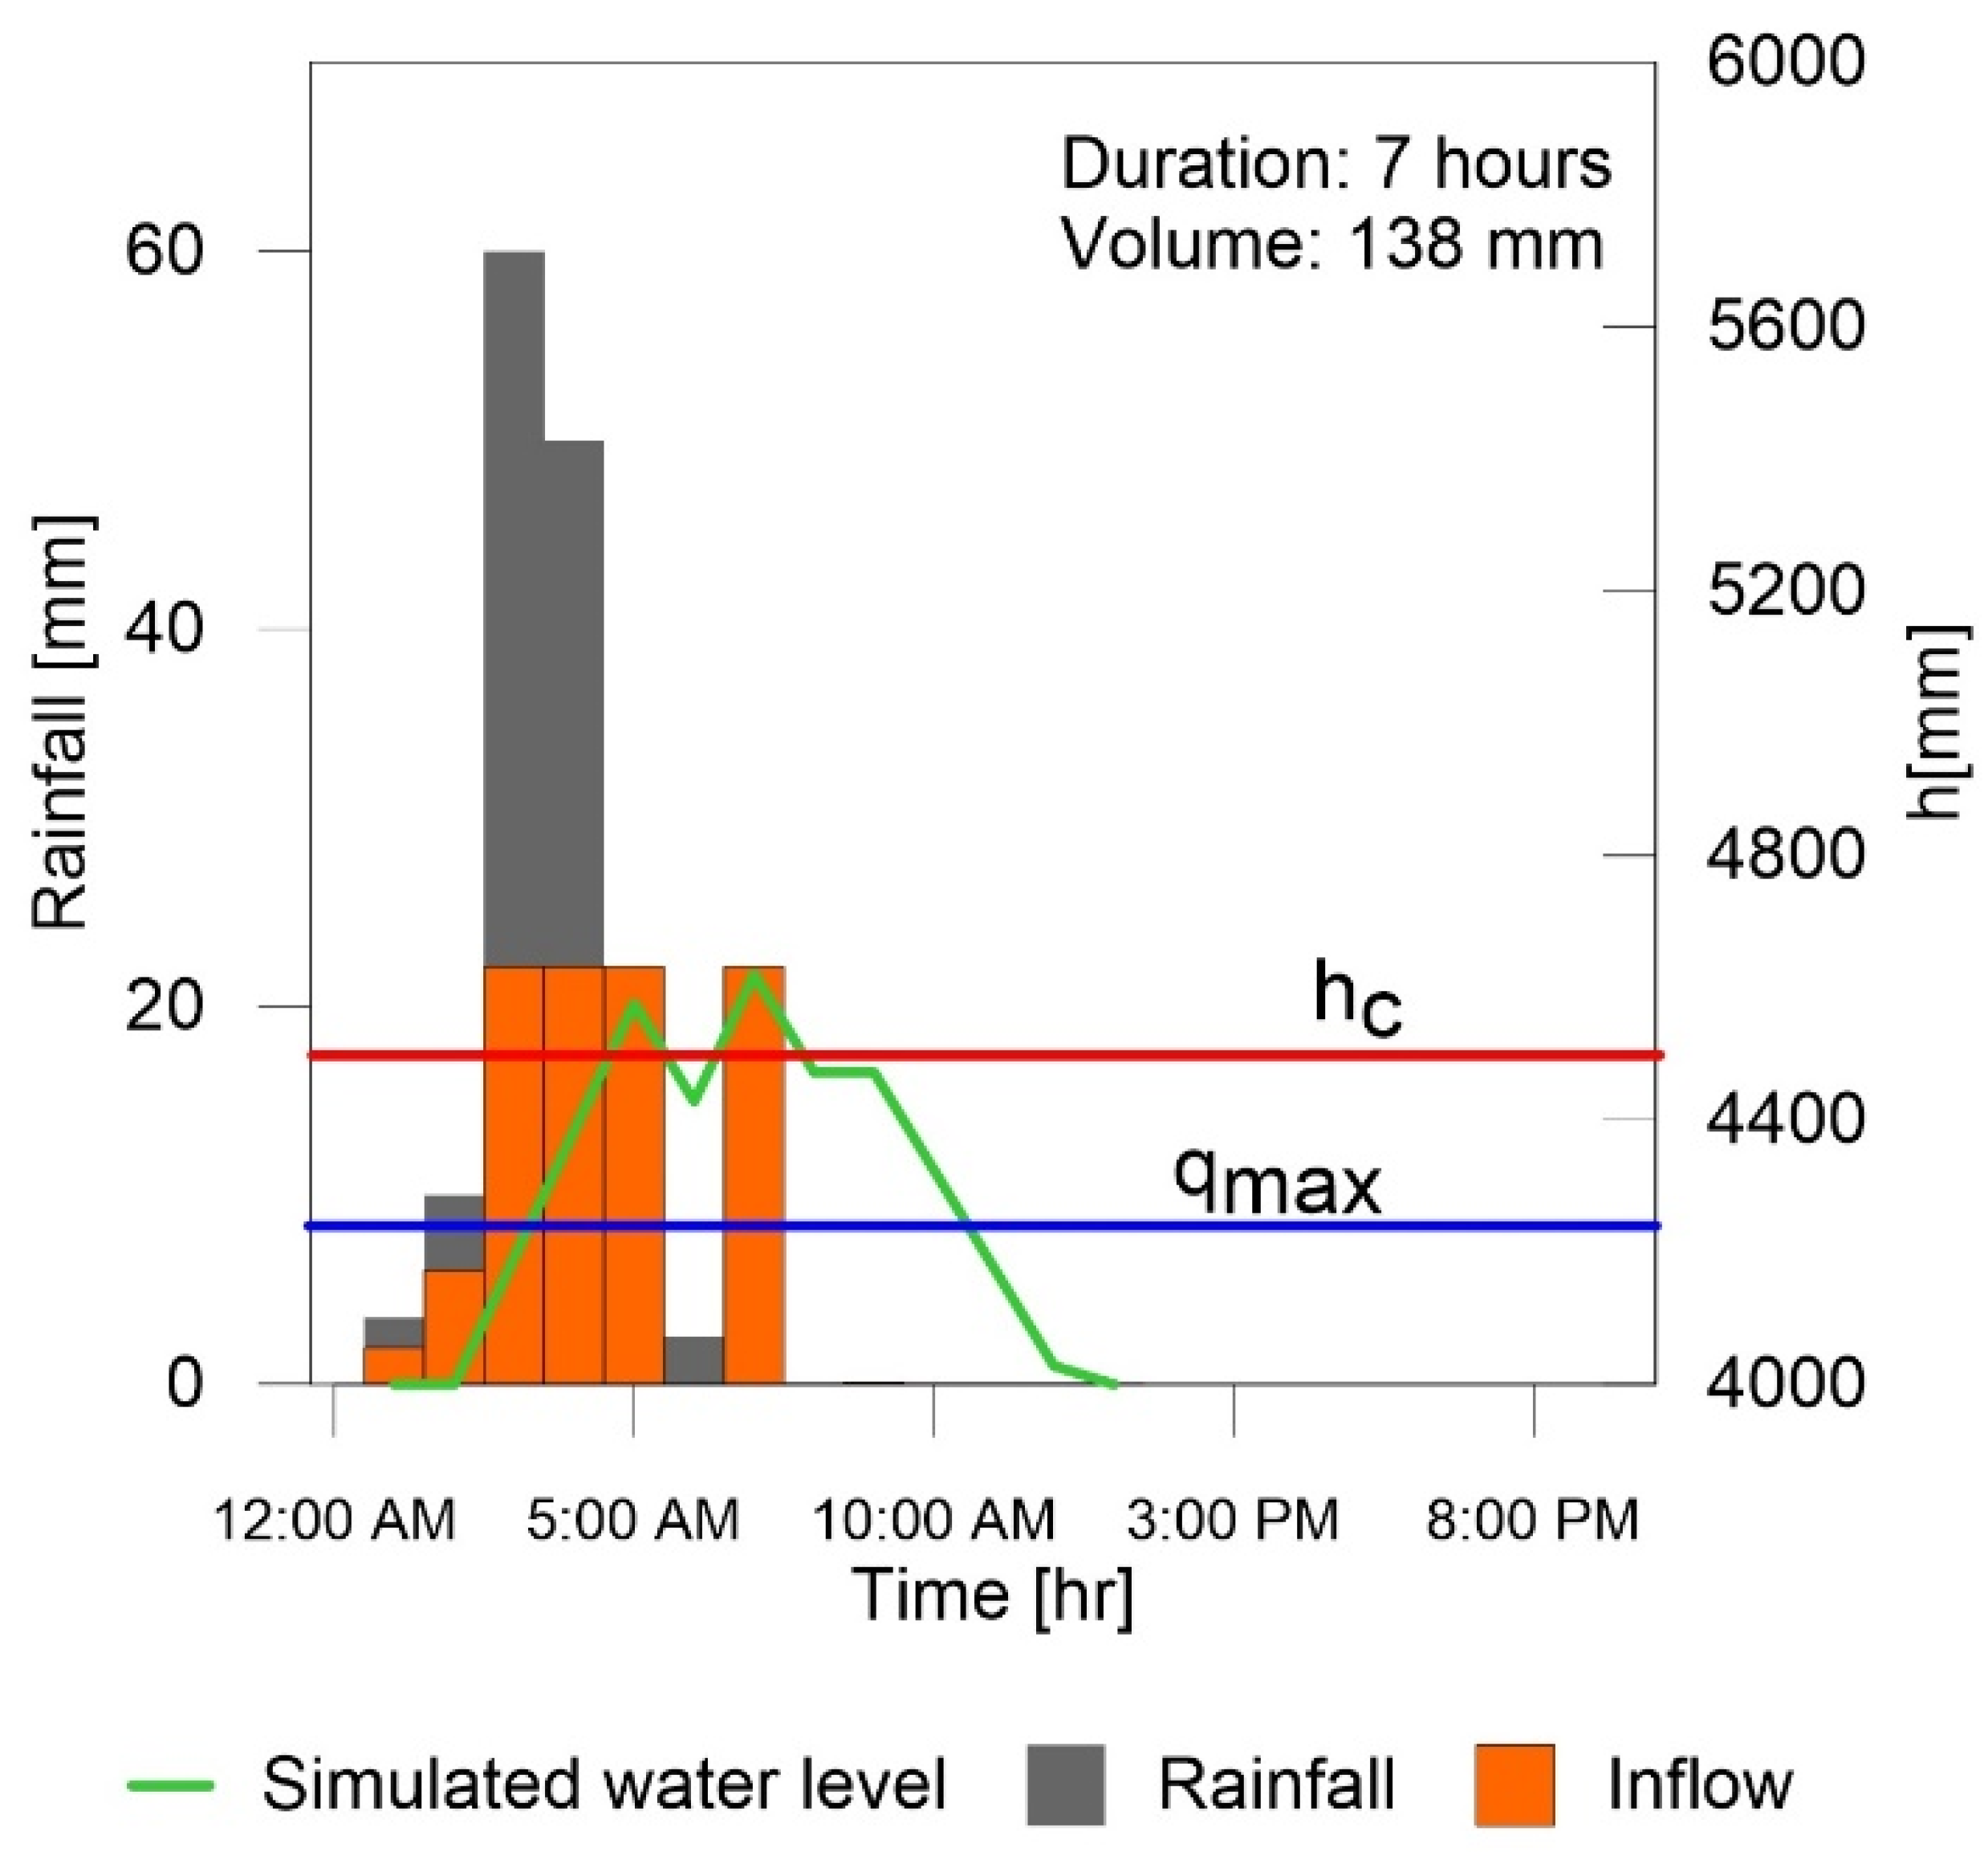
    By using the conceptual model of the polder system with the (reactive) pumping strategy that approximates the current pump operation in the Shazou polder (Appendix A), obtain values of R T d a i l y by rescaling all the values in the set of daily rainfalls obtained in Step 1 to make them larger or smaller until the resulting water level of the inner rivers hits the critical level h c .
    Define the PDF of R T d a i l y , i.e., f ( R T d a i l y ) , with the set of values obtained in the prior sub-step.
    Define the rainfall threshold associated with h o j , i.e., R T d a i l y j , as the p-probability quantiles of f ( R T d a i l y ) .
Thus, if we have an initial condition h o j in the inner rivers at the time the 24 h forecast of rainfall is issued, and a deterministic or probabilistic forecast is greater than R T d a i l y j , a critical condition will be reached, and a proactive pumping action should be conducted to avoid the inner rivers reaching the critical level.

2.6. The Response and Impact Component (RIC)

The RIC component in the MC framework represents a pumping scheme operating in a polder system, and the impact is estimated as the resulting waterlogging W in the polder after the pumping action has been performed. This process is simulated by the RIC through the conceptual model of the Shazhou polder and considering reactive and proactive pumping strategies under four flood warning scenarios (Appendix C).
The No-Warning Scenario represents the assumed current pump operation for the Shazou polder and is simulated by considering only reactive pumping actions in the conceptual model (Appendix C.1). When the water level starts to rise, the inflow I is greater than q m a x , and the polder manager will pump the water with a pumping rate equal to q m a x   . After the critical condition situation, the water level of the inner rivers is dropped to the normal water level h n with a pumping rate equal to q m a x . Furthermore, if, after the storm, the resulting water level of the inner rivers is below the critical level h c , it is assumed that the polder manager keeps the water level of the inner rivers at that level. These principles are represented by
q t =           q m a x ,                         i f   ( h t h c )   u n t i l   h = h n m i n q m a x ,   I t ,             i f   h t < h c   &   I t > 0         0 ,                             i f   h t < h c   &   I t = 0  
where, as explained in Appendix A, q t and I t (mm·hr−1) are the pumping and inflow rates at time step t, respectively, and h t (mm) is the water level of the inner rivers at time step t.
The Perfect Forecast Scenario is simulated by considering proactive and reactive pumping actions in the conceptual model and assuming perfect knowledge of the storm’s profile and volume (Appendix C.2). For a storm where a critical condition has occurred, the water balance of a critical observed daily runoff can be expressed by
R O d a i l y c = V p c + S o c a p + S c
where R O d a i l y c is the observed daily runoff causing critical conditions, V p c is the portion of this critical runoff reactively pumped during the storm to the adjacent outer rivers, S o c a p , as explained in Section 2.2.1, is the storage capacity of the inner rivers before the storm arrives, and S c is the portion of the critical runoff that brings the water level of the inner rivers beyond the critical level. The polder manager is assumed to have perfect knowledge about S c and V p c . The volume of water pumped before the storm arrives (proactive action), V p b e f o r e , is defined as
V p b e f o r e = S c + ( h c h r e f )
where S c is expressed as length units, h c is the critical level as explained in Section 2.2.1, and h r e f is a reference level of the inner rivers. The reference level h r e f is the level at which one wants the water level to be at after the pumping actions; it must be neither too high nor too low. Once the storm arrives, the polder manager then completes the pumping strategy by conducting the reactive pumping based on the inflows (reactive action) (Appendix C.2).
Two imperfect forecast scenarios are considered based on deterministic and probabilistic forecasts. In each case, the polder manager has an estimate of S c , designated by S ^ c , based on a deterministic and probabilistic daily rainfall volume forecast R ^ d a i l y , but has no knowledge of the daily rainfall profile.
The Deterministic Forecast Scenario assumes that the polder manager has an estimate of S c , designated by S ^ c , based on a deterministic daily rainfall volume forecast R ^ d a i l y , but has no knowledge of the daily rainfall profile. The volume of water pumped before the storm arrives (proactive action), V p b e f o r e , is taken to be S ^ c (Appendix C.3). Once the storm arrives, the polder manager then completes the pumping strategy by conducting the reactive pumping based on the inflows (reactive action). S ^ c is a function of R ^ d a i l y , and a proactive pumping factor described by a parameter α which represents the proportion of the forecasted runoff pumped in advance, with 0 < α < 1 (Appendix C.3). The proactive–reactive pumping strategy is defined as follows:
P s t r = V p b e f o r e                   t t p r o ;             p r o a c t i v e   a c t i o n V p             t m a x ( t a r r i v e , t p r o ) ;     r e a c t i v e   a c t i o n    
where V p b e f o r e is the volume of water pumped before the storm arrives, V p is the volume of water pumped during the storm (reactive action), t a r r i v e is the time at which the observed storm arrives in the polder, and t p r o defines the beginning of the proactive action period (Figure 5a).
For the Probabilistic Forecast-based Scenario, the polder manager is assumed to have an estimate of S c , designed by S ^ c , but has no knowledge of the rainfall profile. The volume of water pumped before the storm arrives (proactive action), V p b e f o r e , is S ^ c . Once the storm arrives, the polder manager then completes the pumping strategy by conducting the reactive pumping based on the inflows (reactive action). S ^ c is a function of the parameter α and the expected value of R d a i l y , given knowledge of the forecast R ^ d a i l y , i.e., E R d a i l y | R ^ d a i l y  (Appendix C.3). The proactive–reactive pumping strategy is defined as for the deterministic forecast case.
The three linked components are used to conduct an MC analysis of the potential waterlogging duration and maximum inundated area under the above scenarios by considering the full range of potential rainstorms in July, the rainiest month in Nanjing. This MC analysis provides an average value of the (i) maximum inundated area ( M I A ¯ ), (ii) duration of waterlogging ( D ¯ w ), and (iii) pumping costs ( C ¯ p ) during this month (Table 2). The pumping costs are computed according to an assumed pumping tariff by considering six steps in the pumping rate (Table 2), which matches with the number of pumps at each pumping station in the Shazou polder (Figure 1). The values of the metrics are calculated by considering several replications of the operation of the polder system over the month of July. Each July replication is performed using continuous simulation, with the hourly simulation of the polder system’s hydrology based on synthetic ‘observed’ rainfall time series and warning and proactive pumping strategies based on their corresponding 24 h forecast values provided by the RFG.
Thus, the benefits of using flood warnings in the Shazhou polder are evaluated by comparing the values of the metrics in Table 2 obtained from the no-warning scenario (current condition) with those obtained from the warning scenarios based on different forecast information (perfect, deterministic, and probabilistic forecasts). To do so, the MC framework couples the RFG with different warning decisions in the FWDC and with different pumping strategies in the RIC according to the scenario to be analysed. In the benchmark scenarios, the FWDC is removed because perfect knowledge of the storm (perfect forecast) is assumed or there are no forecasts (no-warning scenario) (Figure 3b,c), whereas, in the imperfect scenarios, the three components are fully exploited (Figure 3d).

3. Results

3.1. Calibration of the Polder Model Used in the MC Framework

Table 3 shows the parameter values adopted to implement the conceptual model of the Shazhou polder (Table 1). Most of these values have been taken from previous studies performed in the case study area [17,19], while the value of q m a x was initially obtained by summing the pumping capacity of all pumping stations and dividing by the polder area ( A p = 54.7 km2). This information can be checked in Duque [26] and has been confirmed based on interaction with the Nanjing Hydraulic Research Institute (NHRI).
The calibration procedure consisted of adjusting the value of q m a x to produce a critical condition situation for the 7 July 2016 event. The calibrated value of q m a x (9.62 mm·hr−1) represented 65% of the value obtained based on the theoretical maximum (14.8 mm·hr−1), which seems reasonable. Figure 6 shows the simulated inflow and water level for the 7 July 2016 event. According to the model, the critical condition started at 5:00, and the storage capacity was practically full at the end of the following 3 h (8:00 am). This result corresponds with observed records, which show that the inundation associated with this event occurred around these hours.

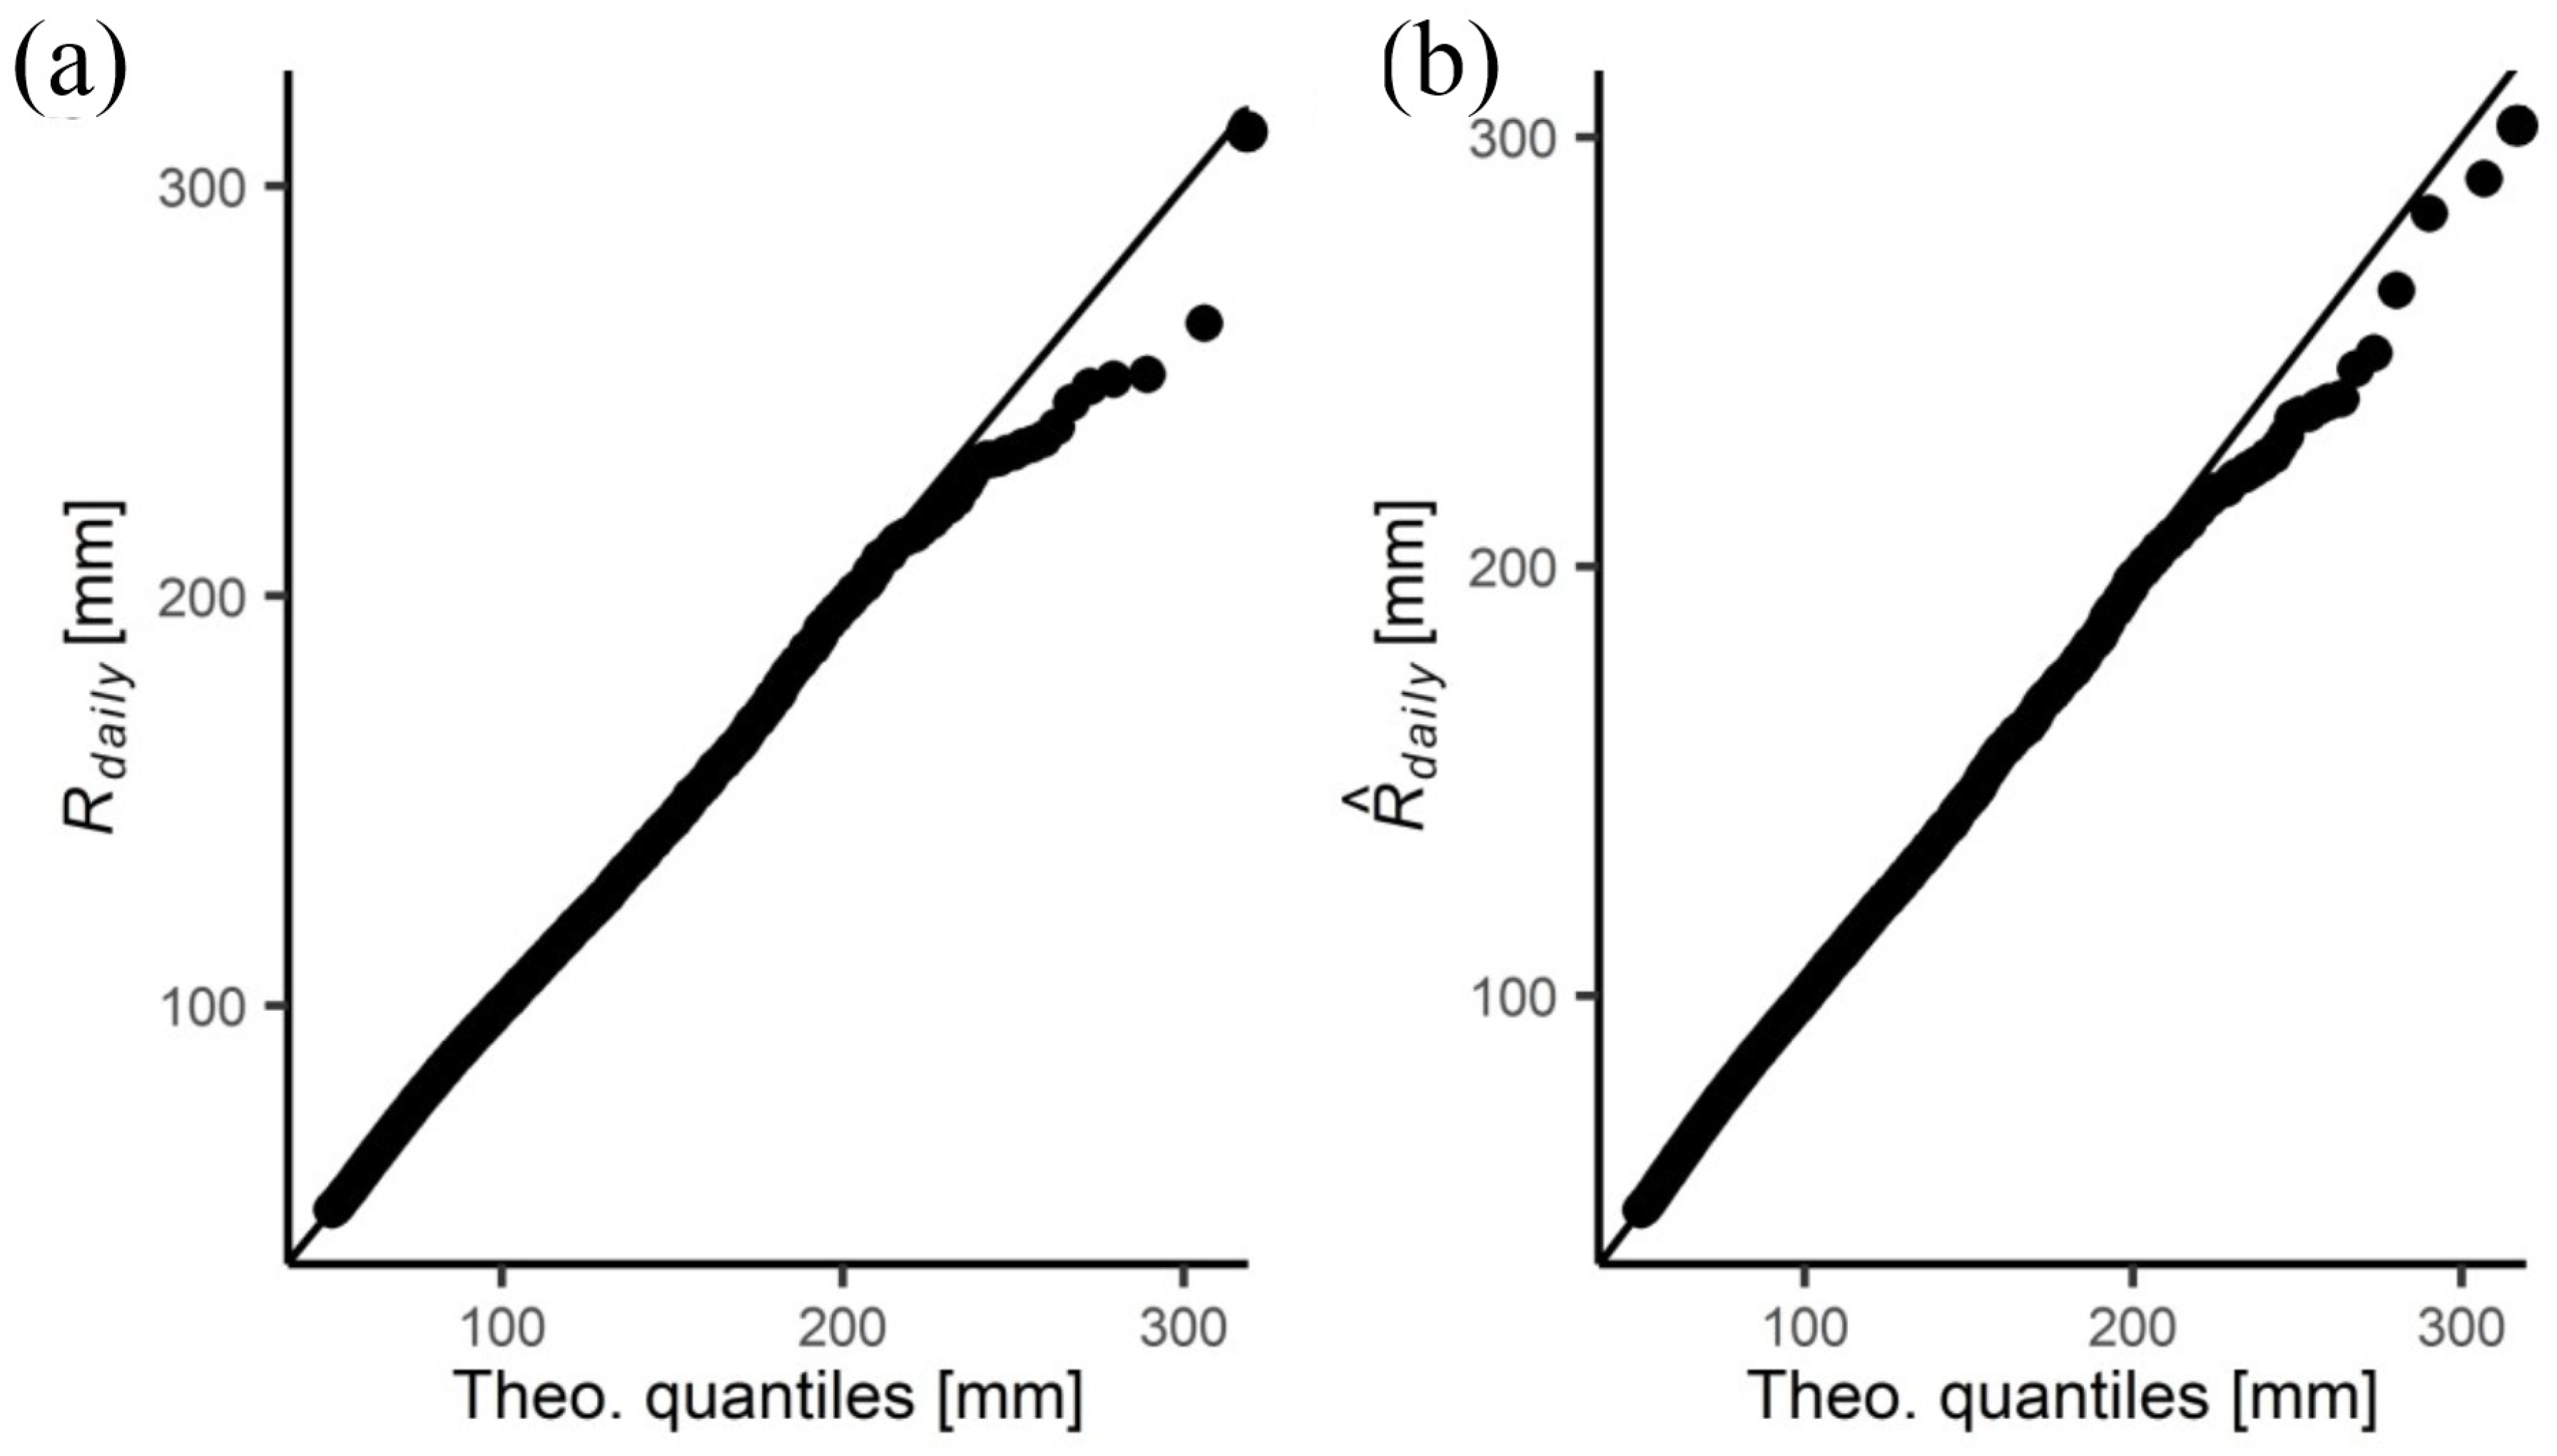
3.2. Calibration of RainSim Spatio-Temporal Rainfall Field Model

The calibration of the RainSim model is described in detail in Appendix B; a brief summary is provided here. A long daily rainfall record (Nanjing: 1950–2012) and short hourly records for five stations including Nanjing (2012–2016) were available for the calibration of RainSim. To simulate observed rainfall and associated forecasts, rainfall at one of the five stations, Dongshan, was treated as the ‘observed’ and rainfall at Nanjing as its forecast, with the spatial correlation between the two stations acting as a surrogate for the correlation between forecast and observed. Dongshan was close to the centre of the rainstorm that caused waterlogging in the Shazou polder in 2016.

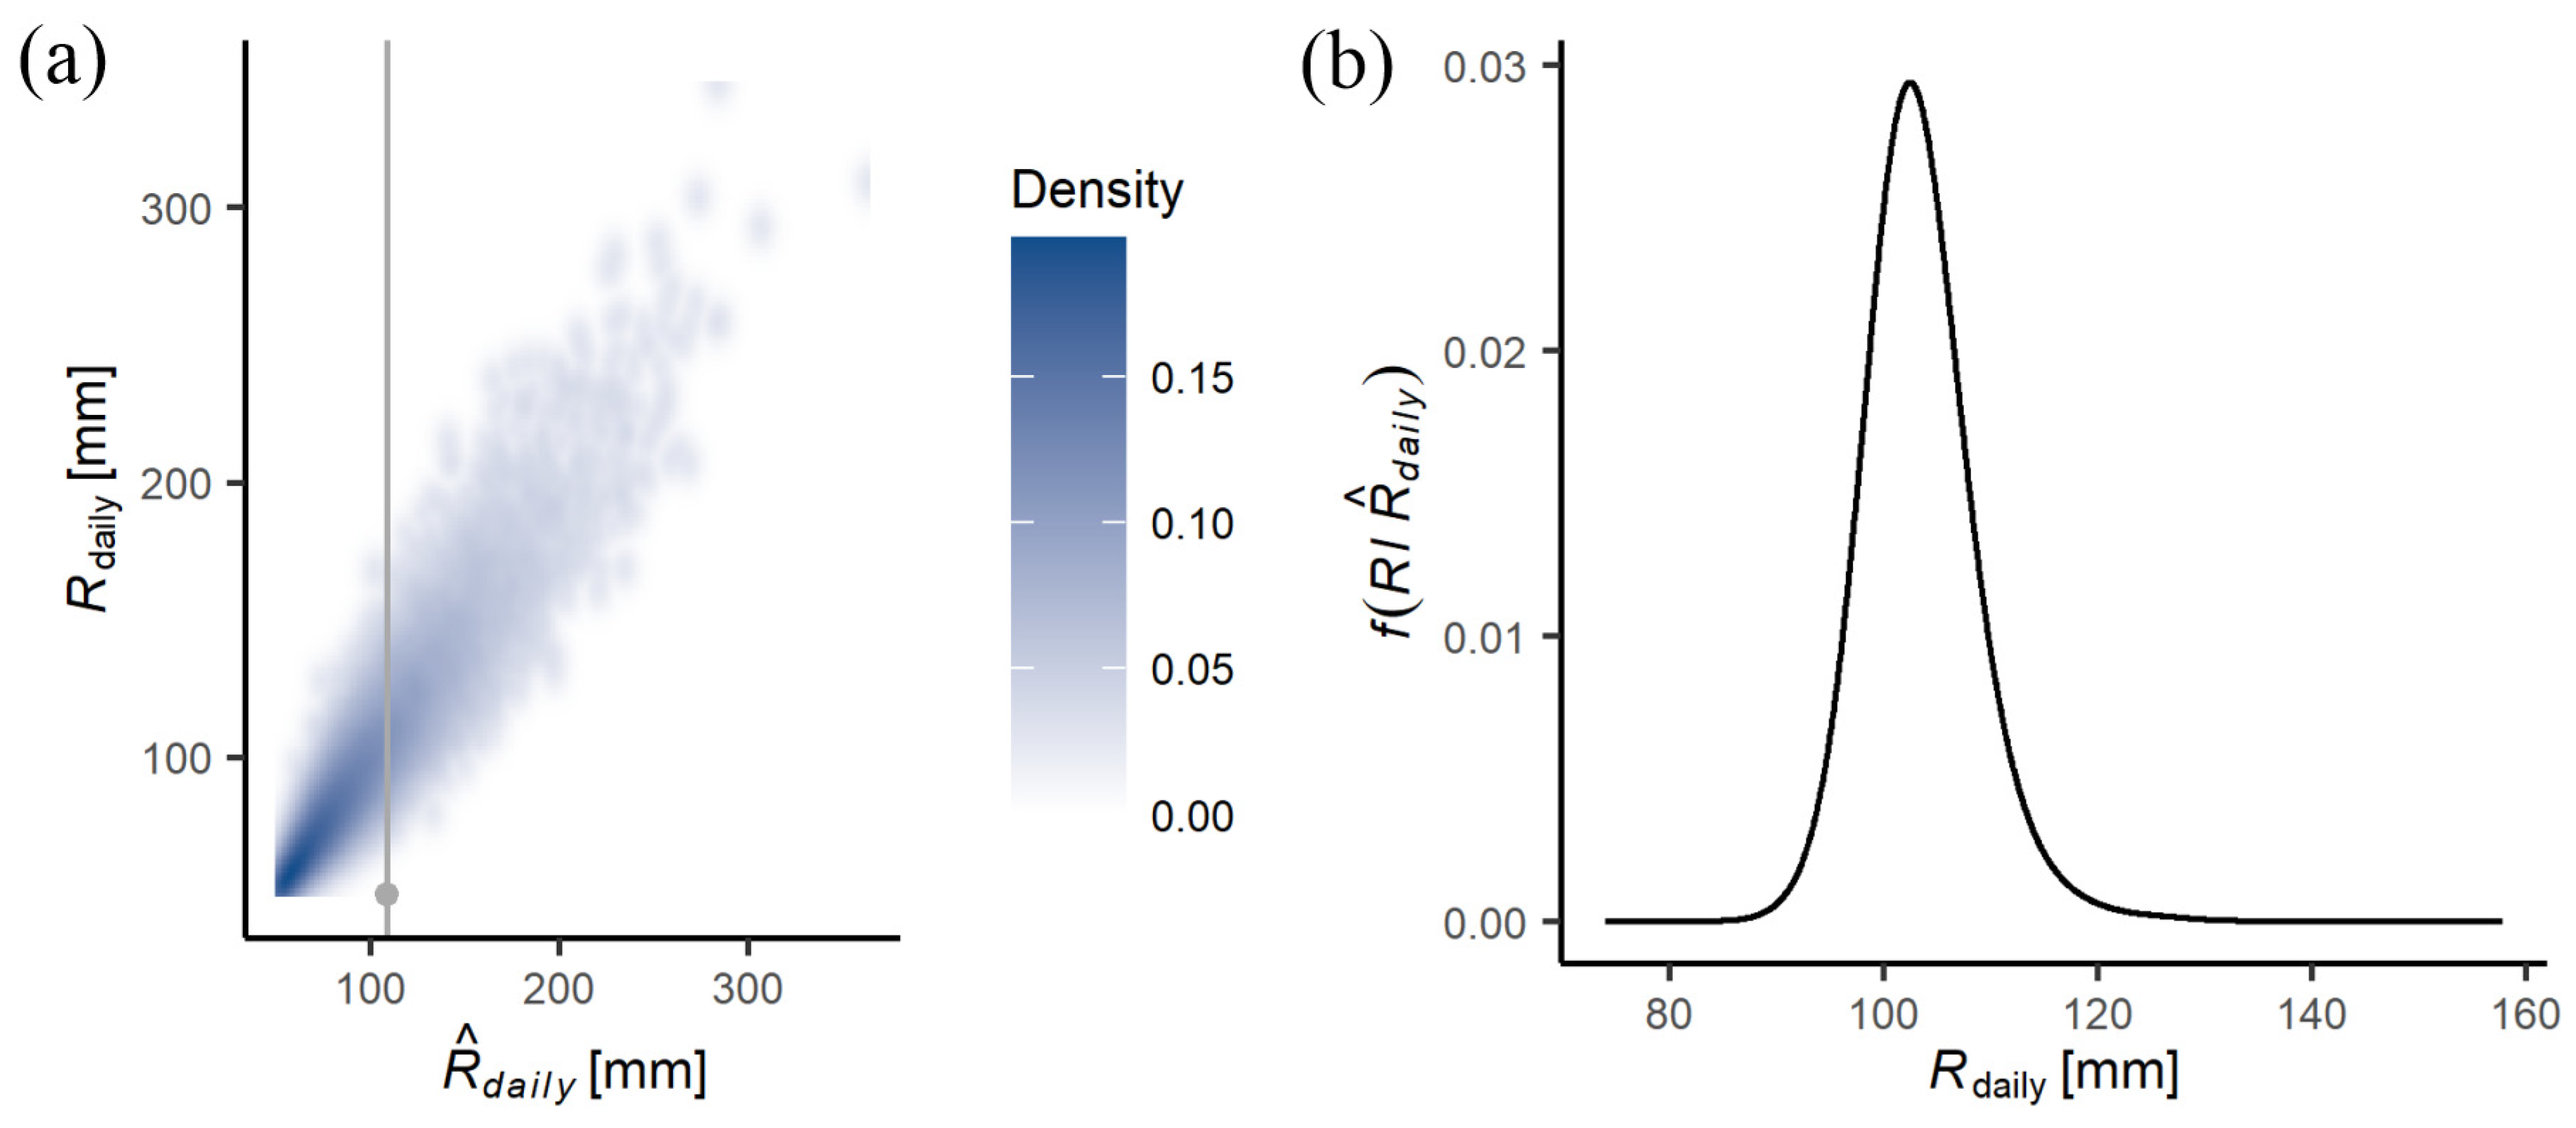
3.3. Joint Distribution of the Daily Rainfall R d a i l y and Its Forecasts R ^ d a i l y Used in the RFG

This analysis was carried out by first using the calibrated spatio-temporal RainSim model to generate a time series of 1000 years in length at hourly resolution, yielding 365,000 daily values of R d a i l y and R ^ d a i l y . A univariate analysis of each variable was carried out based on a q-q plot/visual inspection of the goodness of fit, GoF, of different distributions to values of R d a i l y and R ^ d a i l y . Since this work focuses on extreme rainfalls that could potentially produce significant runoff events in the polder system, this analysis only considered pairs of values that were both greater than 50 mm (daily rainfalls > 50 mm are defined as extreme rainfalls in China [22]). After applying this filter, the sample size was reduced to 17,998 daily values.
Among the several probability distributions tested, which were the Exponential, the Log-normal, and the Gamma distribution, the q-q plots suggested that the latter was the best distribution to represent the values of R d a i l y and R ^ d a i l y (Figure 7a,b).Table 4 shows the fitted distribution parameter values obtained through maximum likelihood estimation (MLE) and assuming that the location parameter is known, taken as 50 mm for each case. This table also shows the sample correlation coefficient of the pairs of values greater than 50 mm.
Since the GoF of R d a i l y and R ^ d a i l y suggested that the Gamma distribution is the best distribution to represent these variables, it was assumed that their bivariate relationship can be described by a bivariate Gamma distribution (BGD). The values described in Table 4 represent the parameters of this bivariate parametric model, namely the parameters that describe the marginal distributions of R d a i l y and R ^ d a i l y , and the correlation coefficient ( ρ R d a i l y R ^ d a i l y ) that defines the dependence structure of the pairs ( R d a i l y , R ^ d a i l y ).
The generation of pairs ( R d a i l y , R ^ d a i l y ) and the building of the predictive uncertainty PU expressed as f R d a i l y R ^ d a i l y based on the BGD was carried out using the Gaussian copula (see [26] for more details). The results of an example of the bivariate simulation based on the values described in Table 4 are shown in Figure 8. Figure 8a shows the joint density of 50,000 pairs ( R d a i l y , R ^ d a i l y ) from the BGD, whereas Figure 8b shows an example of PU expressed as f R d a i l y R ^ d a i l y for a forecast value R ^ d a i l y i shown in Figure 8a (grey dot). This variate is obtained by slicing the joint distribution in the vertical (grey line) at the grey dot corresponding to R ^ d a i l y i to give f R d a i l y R ^ d a i l y . Note that R ^ d a i l y i in the MC framework is obtained from the calibrated spatio-temporal RainSim rainfall field model and its associated f R d a i l y R ^ d a i l y is derived from the BGD.

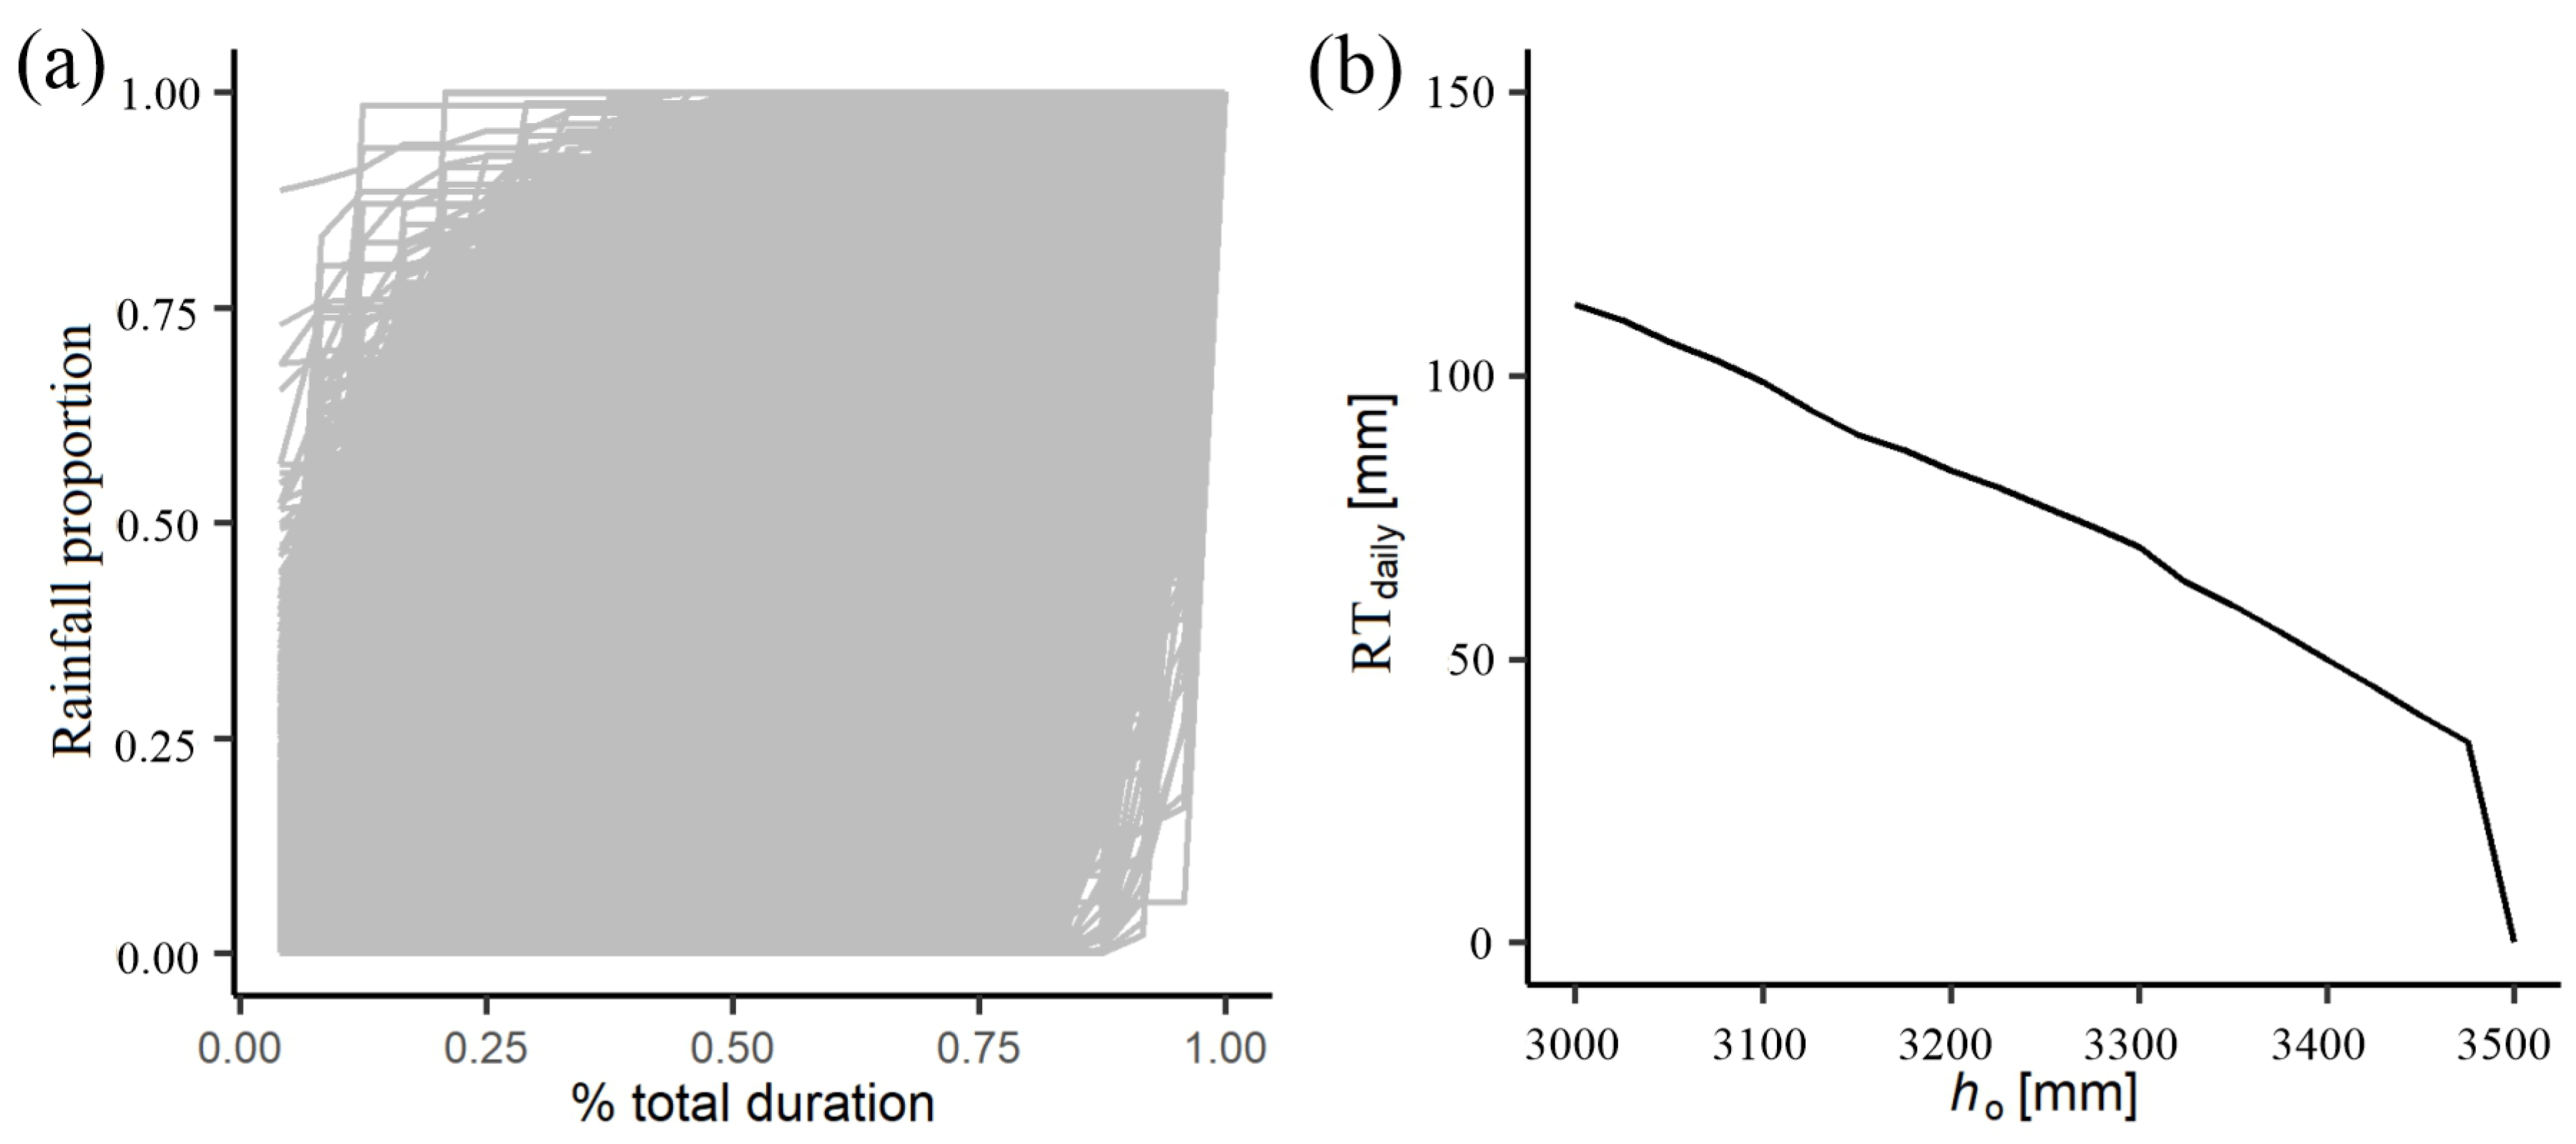
3.4. Rainfall Thresholds for the Shazhou Polder Used in the FWDC

The results of applying the approach explained in Section 2.5.1 are illustrated in Figure 9, which considers twenty initial conditions ( n o = 20 in Equation (2)). Figure 9a shows the 17,998 profiles of daily rainfall obtained from RainSim that could potentially produce significant runoff events in the polder system (daily rainfall > 50 mm); they are shown as dimensionless mass curves. Figure 9b shows the values adopted for the threshold R T d a i l y j by assuming them as the 0.01-probability quantile of f ( R T d a i l y ) . By doing that, one assumes that the values greater than these quantiles will bring the inner rivers to a critical condition. Finally, it is worth noting that the rainfall thresholds for the normal condition h n = 3000 mm are >100 mm, which corresponds to the warning categorised as “yellow” for Nanjing. A yellow warning is the second lowest on the four-colour-coded rainstorm warning system used in Nanjing; it triggers a consultation meeting headed by the Commander of Flood Control.

3.5. Application of the MC Framework

Table 5 summarises the input parameters of the MC framework (the input parameters for RainSim are given in Appendix B) and the values adopted according to the calibration procedure conducted for its constituent models and values taken from previous studies performed in the case study area. They are split according to the component they represent. The outputs of the MC framework are the values of the metrics described in Table 2 which are computed using the hourly observed rainfalls and their forecasts generated by RainSim.
If one shows only these results, one cannot fully appreciate how the several pumping strategies considered in the MC framework work during a critical storm. Therefore, this final subsection of the Results section first shows an example of the simulation of the polder system under all scenarios during the same ‘observed’ storm causing critical conditions. This analysis gives the reader a good insight into how the pumping criteria adopted for the different strategies are reflected when trying to mitigate a critical condition situation.

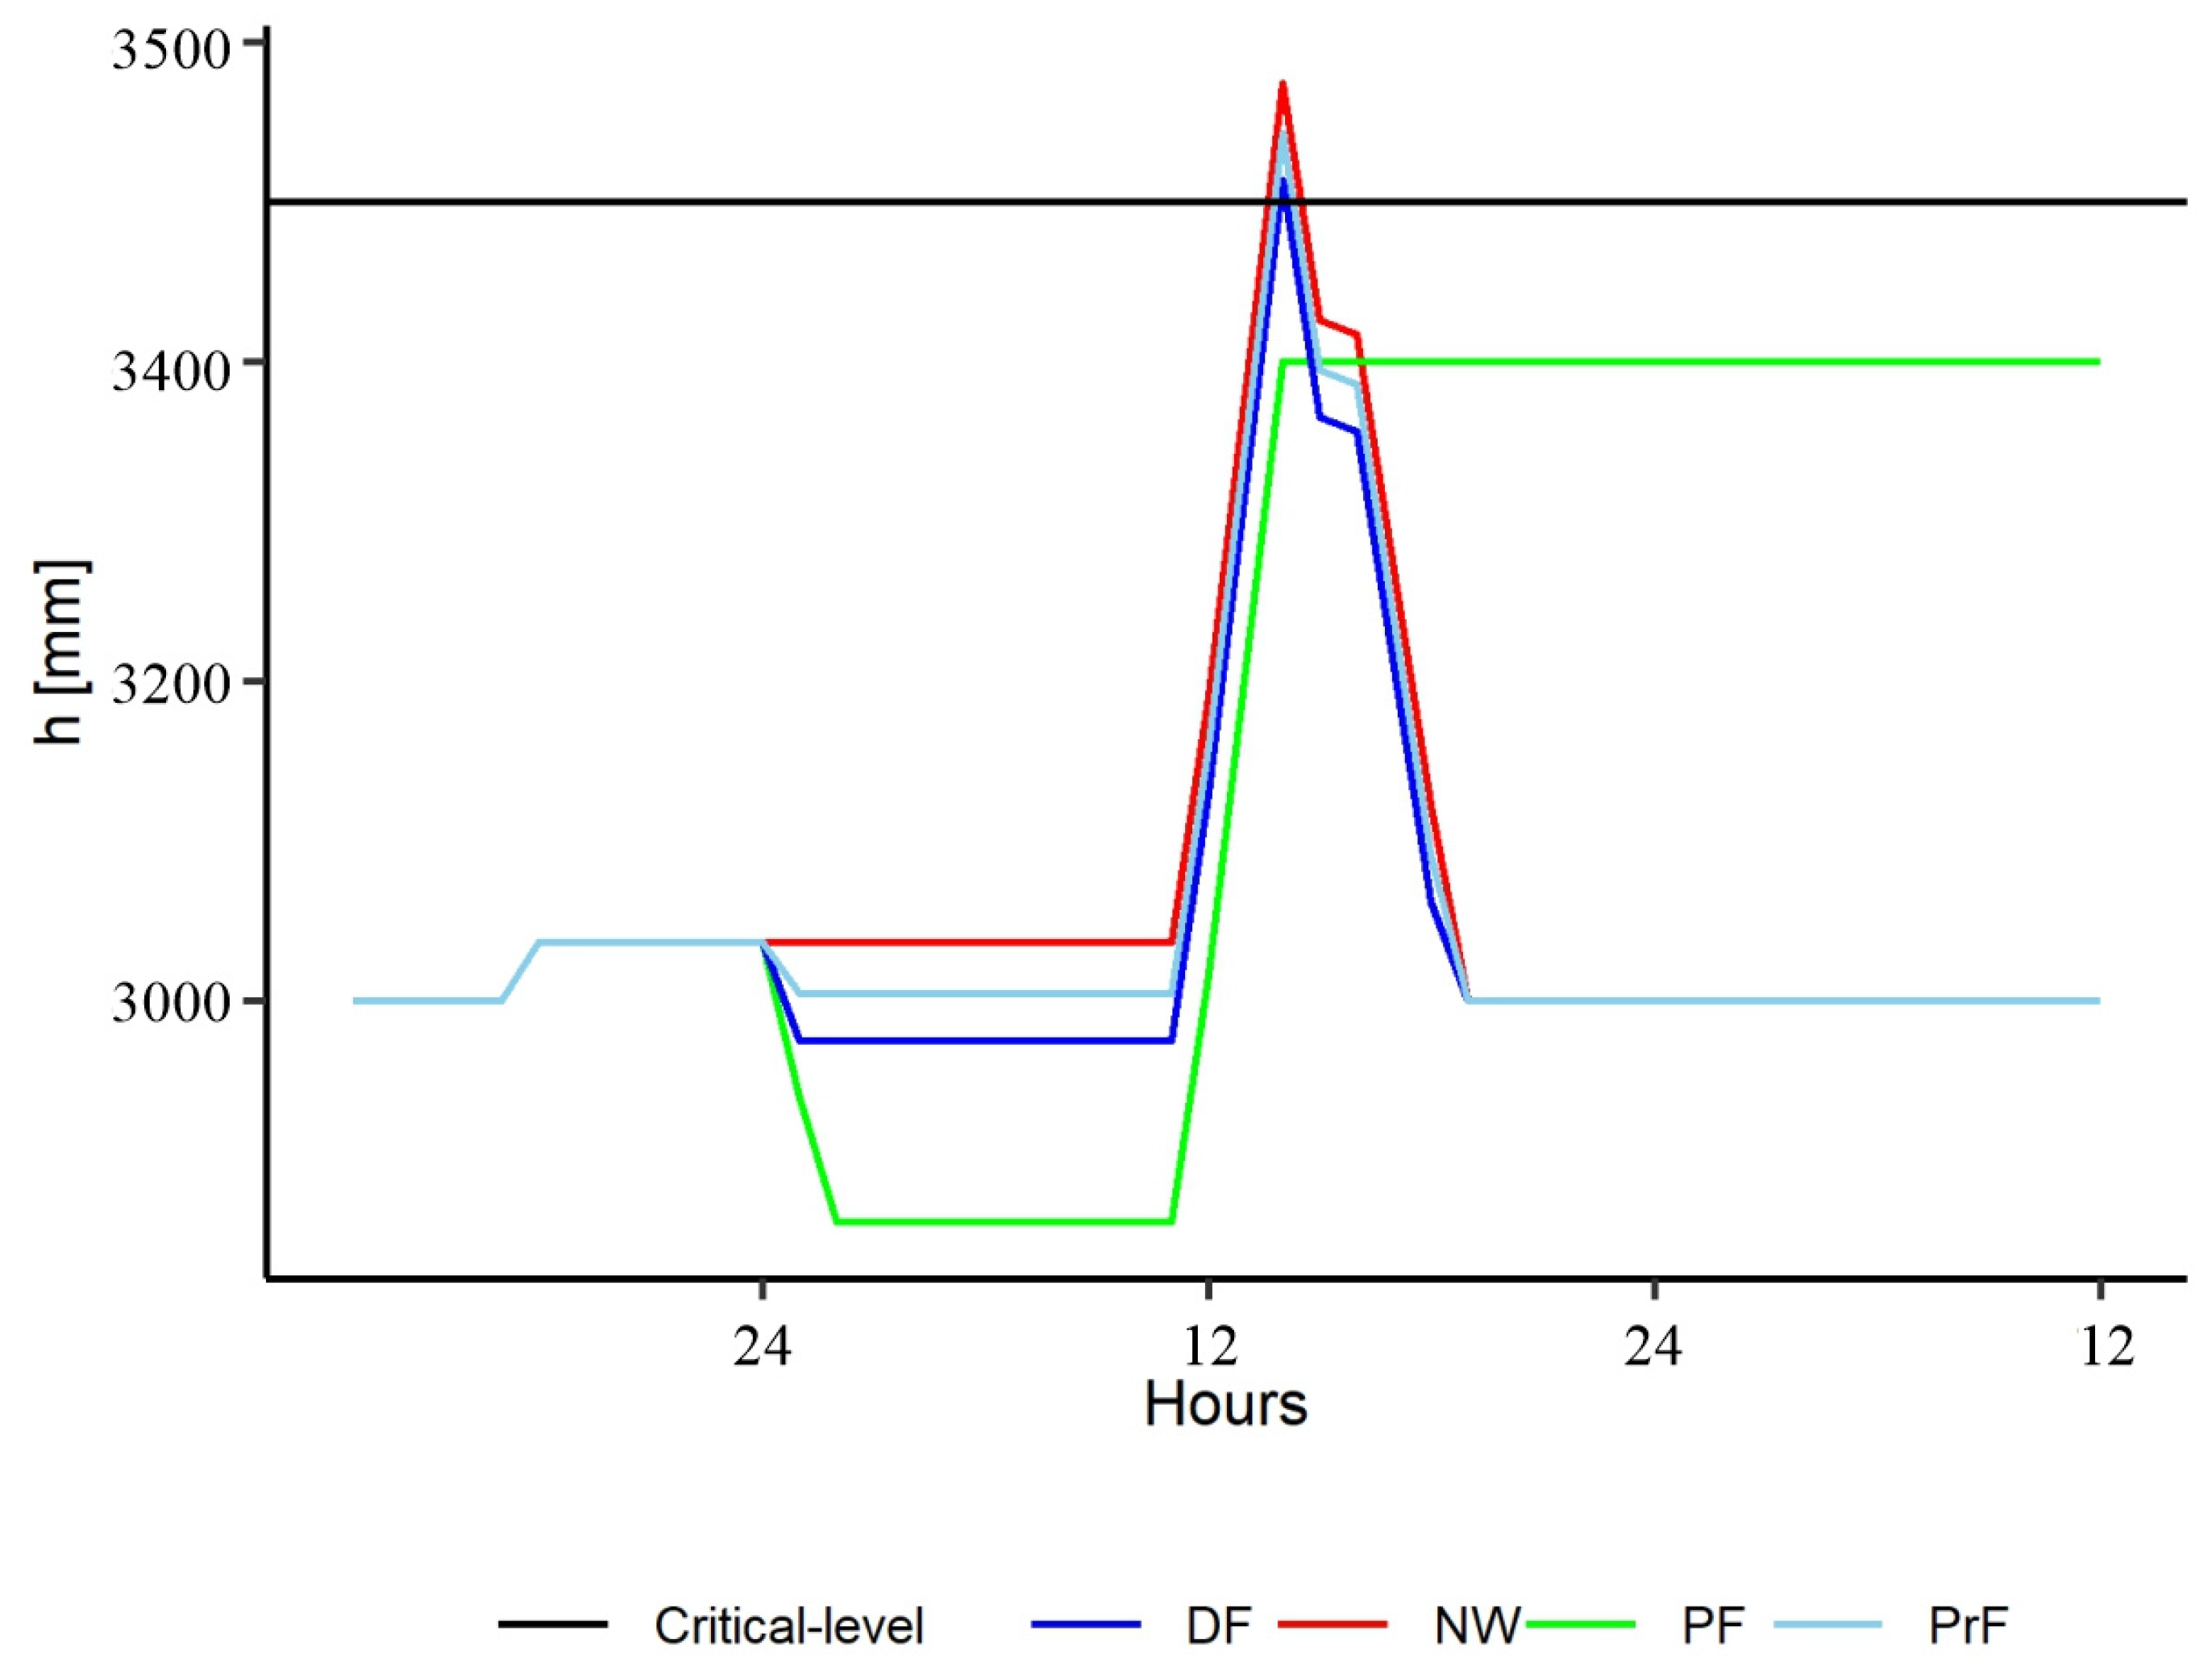
3.5.1. Simulation of Scenarios for A Single Storm

Figure 10 shows an example of the simulation of the polder system under all four scenarios during the same ‘observed’ storm causing critical conditions. In this case, the initial condition for all four scenarios matches. Note that, on day 1, the storm magnitude is insufficient to trigger a warning in the scenarios where proactive pumping is undertaken, and reactive pumping is performed in all cases. During day 2, a storm triggers proactive action in all cases, except for the no-warning scenario.
The four forecast scenarios were implemented for this observed storm as follows.
  • Under the no-warning scenario (NW), reactive pumping was implemented as described in Section 2.6.
  • Under the perfect forecast scenario (PF), the water level is dropped through proactive pumping before the storm arrives (Section 2.6), and the maximum water level matches with h r e f that is here assumed to be 3400 mm.
  • Under the deterministic forecast scenario (DF), a value of α = 0.05 was adopted. As can be seen for this storm (Figure 10), a warning was issued, and the value adopted for α is not large enough to avoid the critical condition. Therefore, after the critical condition situation, the water level is dropped to the normal water level h n (3000 mm) using a pumping rate equal to q m a x .
  • Under the probabilistic forecast scenario (PrF), a value of PT = 0.9 (probabilistic threshold) was used, and a warning was issued. For proactive pumping, a value a   = 0.025 was adopted, and as can be seen (Figure 10), this is not large enough to avoid the critical condition. Therefore, after the critical condition situation, the water level is dropped to the normal water level h n (3000 mm) with a pumping rate equal to q m a x .

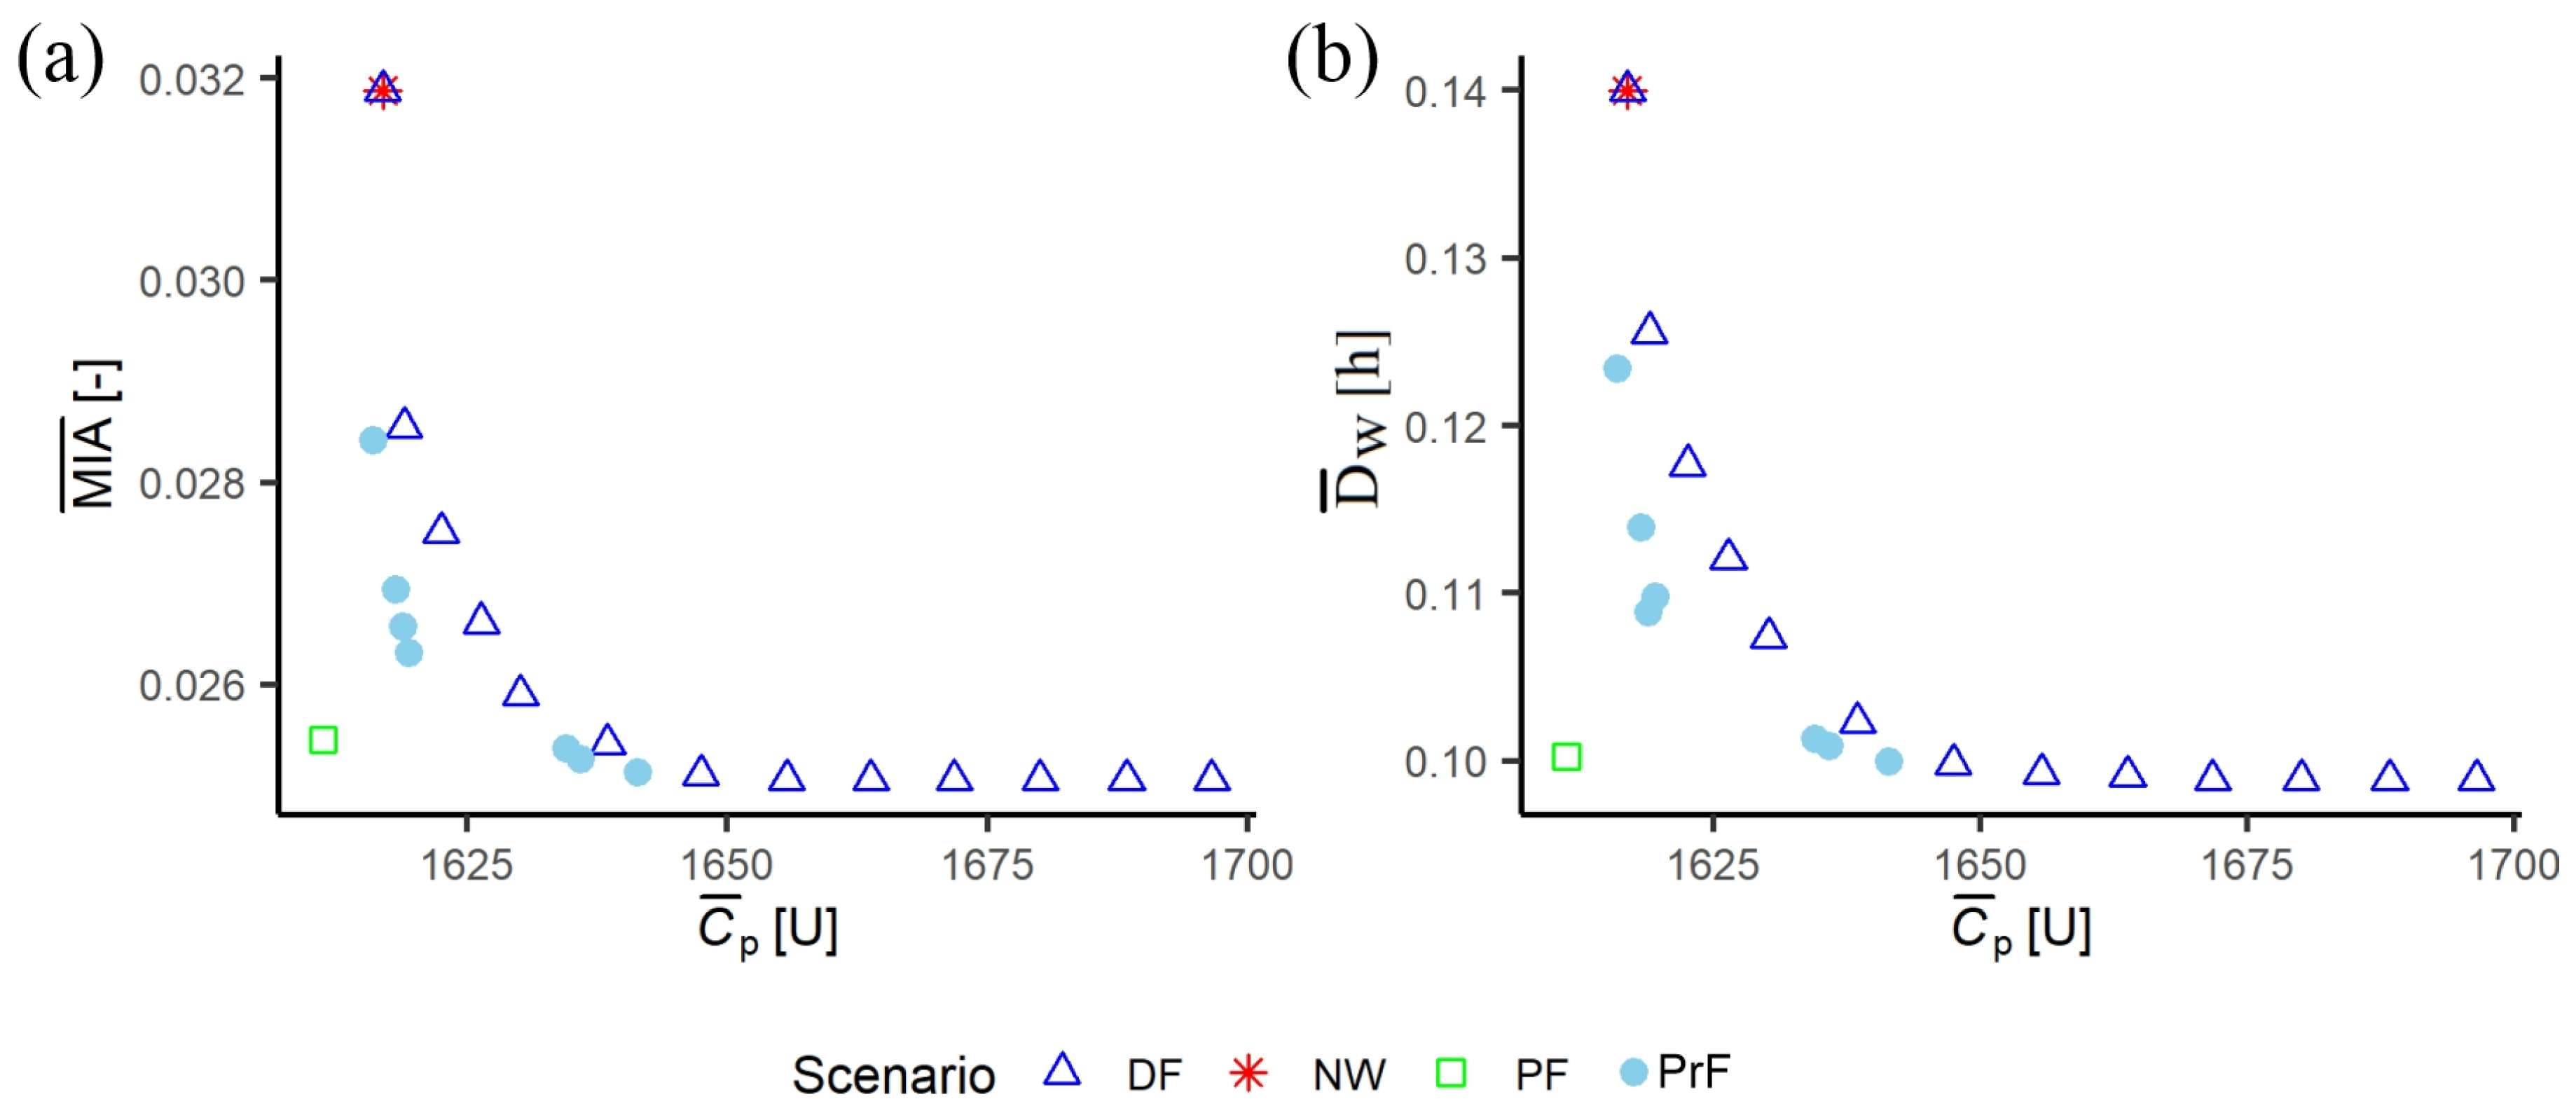
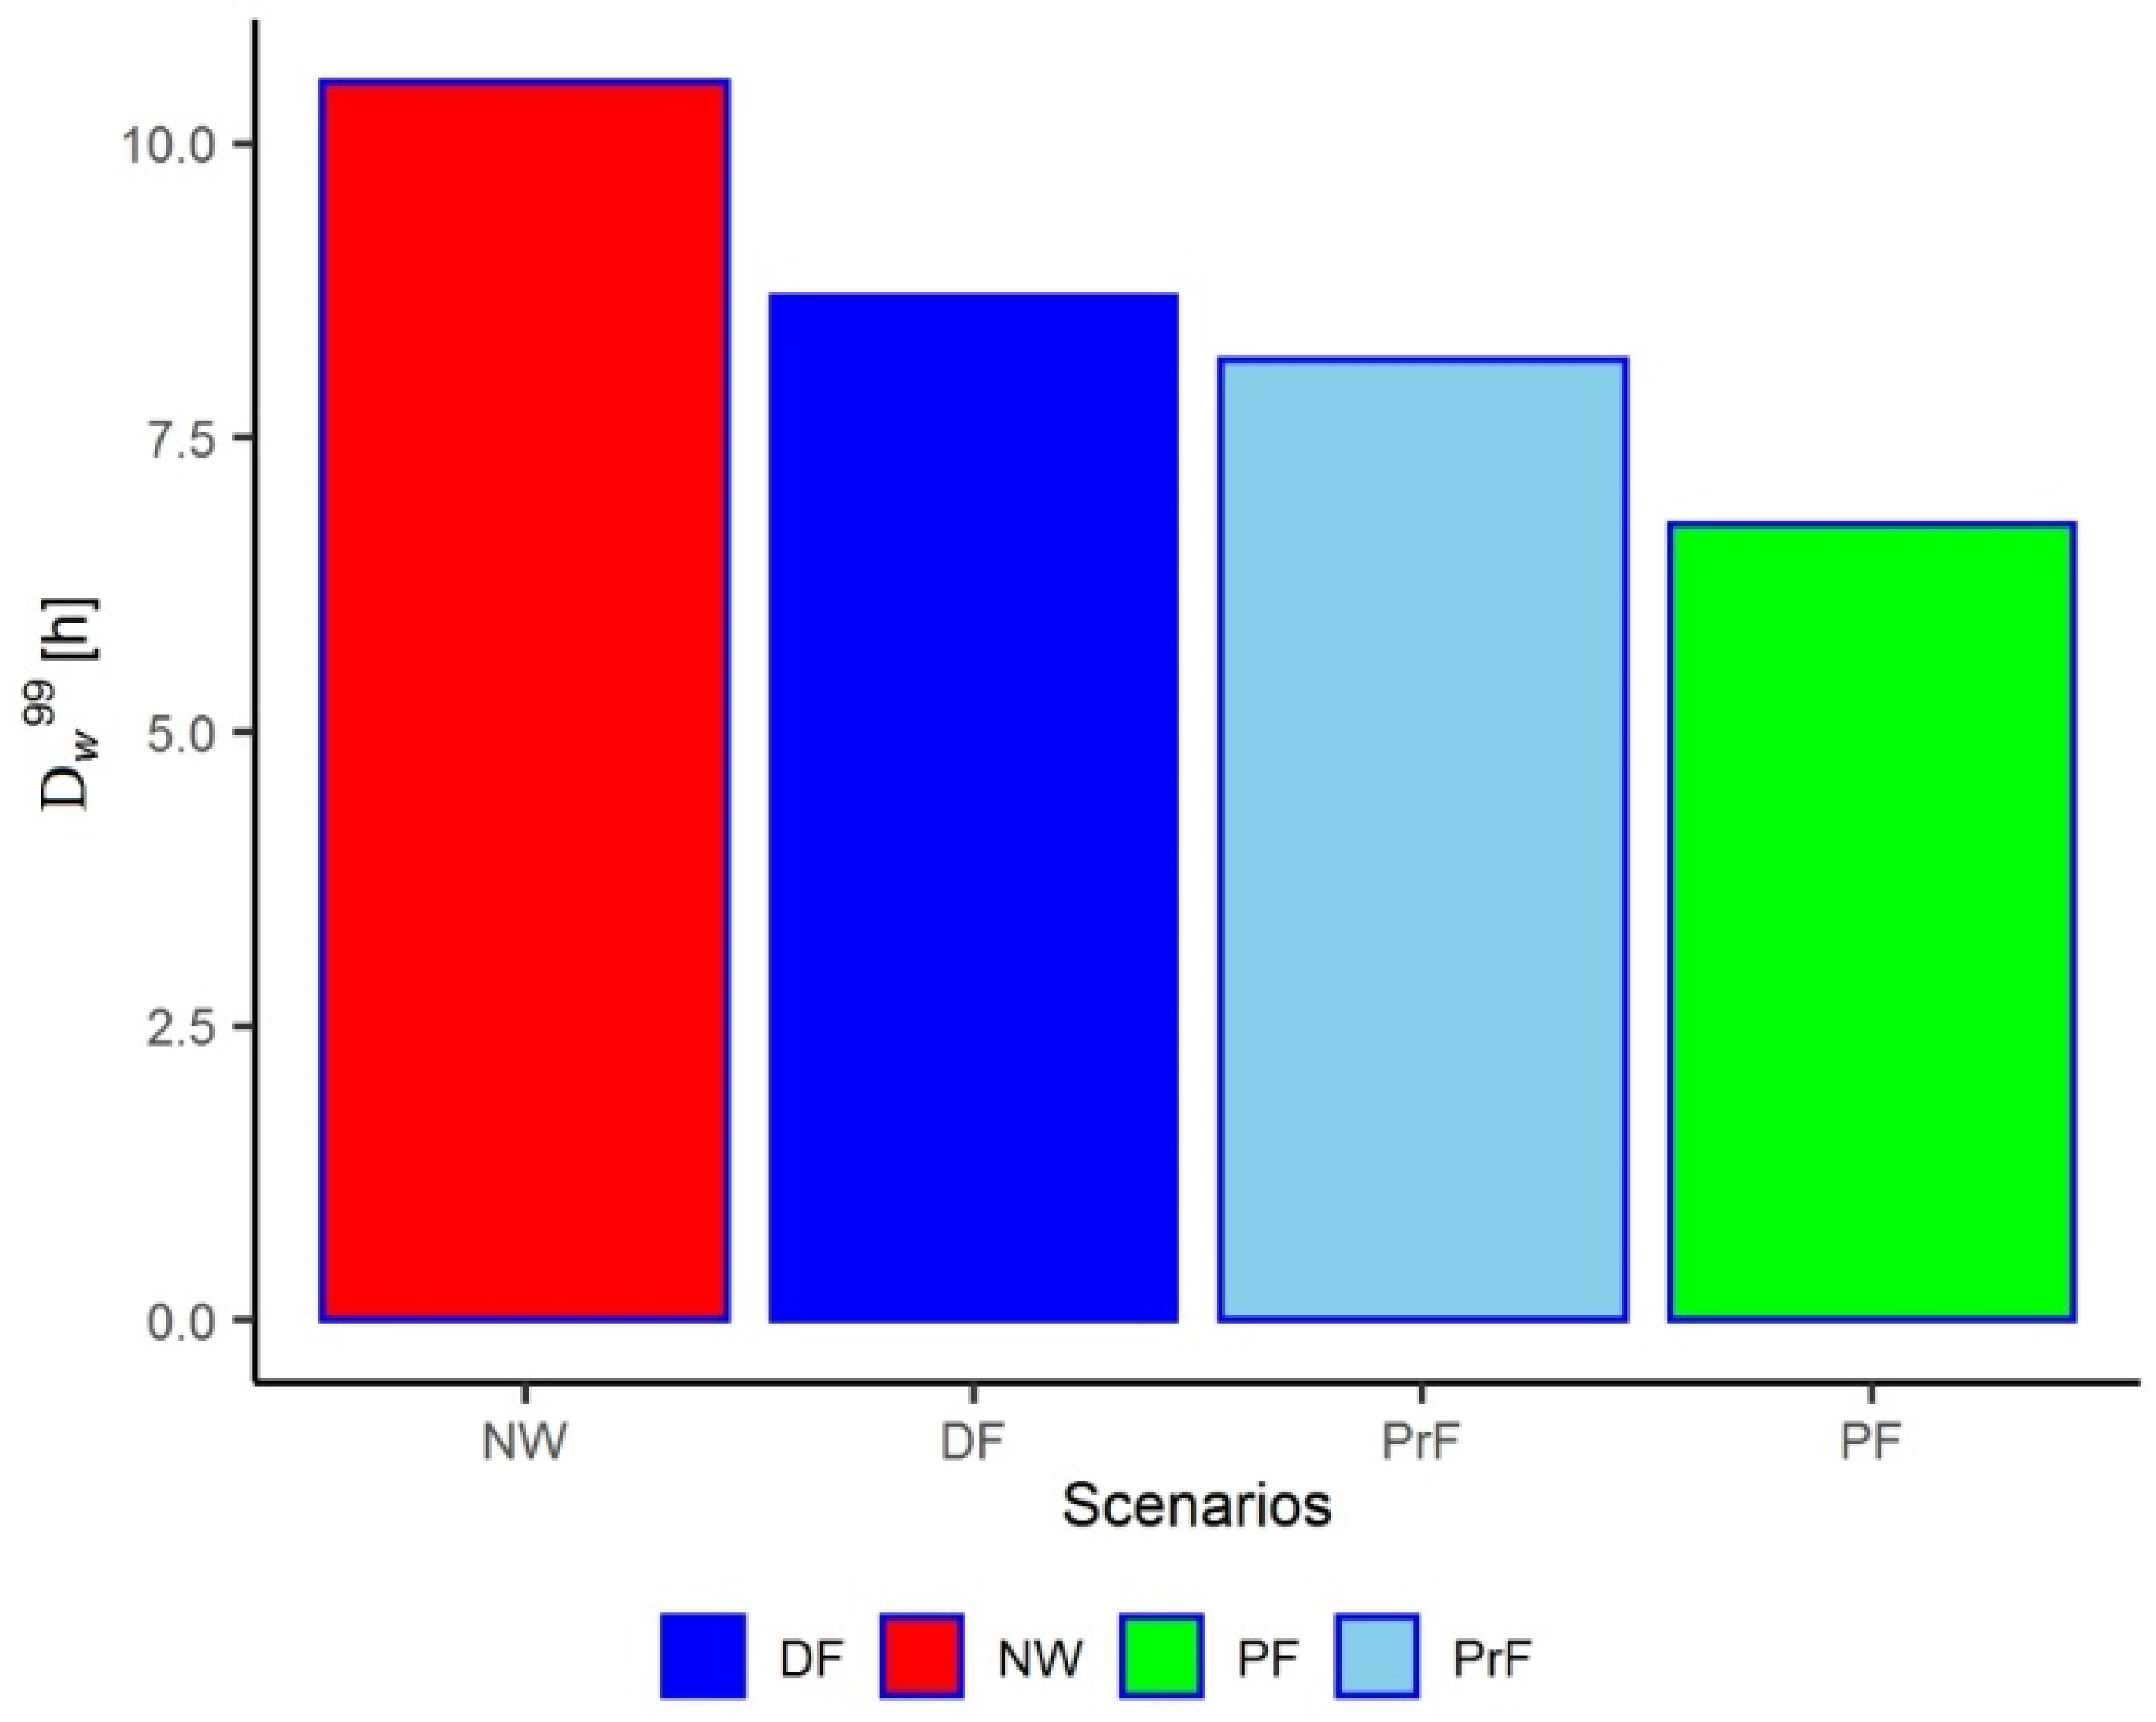
3.5.2. Simulation Experiments

The simulation experiments considered Julys with at least one rainfall event that could potentially produce a significant runoff event in the polder system (daily rainfalls > 50 mm). After applying this filter, the sample size was reduced to an 8730 July event (1000 years of simulated daily rainfall were used in the analysis). The results of the deterministic forecast scenario are provided in Figure 11a,b, showing the trade-off between the C ¯ p and M I A ¯ and D ¯ w . The results of the benchmark cases are also plotted in this figure. The no-warning scenario defines the worst scenario in the analysis due to no proactive pumping action being undertaken in the polder. In contrast, the perfect forecast scenario represents the best scenario due to the perfect knowledge of the target variables in the pumping strategy. Note that the pumping costs of this scenario are slightly lower than the no-warning scenario. That occurs because the number of critical condition situations decreases significantly in this scenario, and thereby the number of times the polder manager is assumed to drop the water level of the inner rivers with a pumping rate equal to q m a x . This is reflected in the reduction in the reactive pumping costs, which also reduces the total pumping costs (Table 2). Thus, any imperfect forecast strategy cannot overcome these results.
The worst strategy of the deterministic forecast scenario is when α = 0 (the highest triangle on the plots), i.e., when the volume of water pumped before a critical storm is zero, which can be considered as a reactive pumping strategy. Therefore, as one can expect, this strategy matches the results of the no-warning scenario. As α increases, the M I A ¯ and D ¯ w decrease, and C ¯ p increases. However, there is a point ( α = 0.25) where M I A ¯ and D ¯ w stop decreasing, and stay constant, which means that, after this point, the impact of critical storms cannot be avoided. That occurs because, after this point, most of the remaining critical storms to be avoided are those whose runoff starts at midnight (or close to this time) and whose inflow rate exceeds the pumping capacity of the polder q m a x . These storms are also a problem for the perfect forecast strategy. Under this condition, the polder manager is assumed not to have the required response capacity for the critical storm, and he/she can only use a pumping rate equal to q m a x , whereas the water level of the inner rivers rises until a critical condition situation occurs. Thus, after α   0.25, the values of M I A ¯ and D ¯ w are associated with waterlogging caused by these storms and by storms whose runoff overcomes the capacity of the drainage system.
The results of the probabilistic forecast scenario are provided in Figure 11c,d. The approach consisted of simulating the FEWS by considering different values of P T in the warning decision for each value of α in the pumping strategy based on probabilistic information. Then, the plot of C ¯ p v s . M I A ¯ or D ¯ w was used to define a set of “best” points as the Pareto front (black dots in Figure 11c,d). These best points show different combinations of probability P T and α , with several values of P T sharing the same value of α . However, if the polder manager chooses a value of α , it would be preferable to have just one value of P T that performs better than the deterministic scenario. This analysis was performed by plotting the best Pareto solutions associated with the same α with different values of P T and comparing them with the deterministic result associated with the same value of α . Then, the point that overcomes the deterministic result and is closest to the perfect forecast scenario was chosen. After this analysis, the set of best solutions was reduced to seven pairs with unique values of α and different P T values (Table 6).
A summary of the results is given in Figure 12 that shows this set of best probabilistic solutions together with the results of the other scenarios (no-warning, perfect and deterministic forecast scenarios). Furthermore, to confirm the behaviour across scenarios, the 99-percentile of values of D w greater than 1 h ( D w 99 ) was computed. The results are shown in Figure 13. As one can see, the behaviour of the scenarios in this figure is the same as the one shown in the prior figures, where the no-warning and perfect forecast scenario represent the worst and the best ones, respectively, with the imperfect forecast scenarios located in between, where the probabilistic results are better than the deterministic ones.

4. Discussion and Conclusions

While a number of studies have quantified predictive uncertainty, PU, in FEWSs, refs. [27,28,29,30,31,32] demonstrated the advantages of probabilistic forecasting over deterministic forecasting in terms of flood warning reliability (32); they typically do not consider the response and impact [33]. This represents an innovative contribution from this work in the context of polder operation. To address this issue, the MC framework simulates the fully integrated warning–response–impact system for the specific case of a polder and uses a rainstorm-and-forecast generator, RFG, to simulate observations and associated forecasts while quantifying PU and using it to make warning decisions in the FWDC and conduct the response in the RIC.
The simulation experiments conducted here (Section 3.5.2) focused on demonstrating the value of rainfall forecasts and threshold-based warnings in polder management. A perfect model of the Shazou polder system is assumed and used within the MC framework. Based on the works conducted in [5,19], a simple [5,19] empirical rainfall–runoff has been used that is sufficient for this demonstration study. More physically based models could be used in the future that better account for the dynamic, spatially distributed nature of urban environments, provided the necessary data are available.
The polder rainfall–runoff simulation model is furthermore linked with an impact curve to represent the inundated area. An impact curve relates the damaging variable (water level) of a current or future flood event to the magnitude of the impact and has been used for national flood risk assessment in the UK [34] and for simulating warned and flooded properties within an MC framework [33]. This curve, which was assumed here, makes the MC framework versatile; however, for operational implementation, a real-world data-based impact curve would be needed. This could be derived using 2D hydrodynamic modelling.
The simulated rainfall from RainSim V3 was used to represent observed rainfalls and their forecasts, and to explore the potential benefits from forecasts in reality. However, the assumed statistical properties were not based on real-world forecasts, making the situation potentially overly optimistic. For example, the correlation coefficient between observations and their forecasts, which defines the predictive uncertainty PU, can perhaps be considered too optimistic (0.93, Table 5), but it represents a target to achieve the demonstrated benefits. Future work could thus involve using real-world forecasts from numerical weather prediction, NWP, or statistical algorithms to examine the outcomes that could be achieved operationally. This could be possible in the short term because the number of registered extreme events is increasing, and flood warning/forecast validation databases are starting to be available for operational flood-forecasting systems across the globe [35,36], and particularly, maybe in the short term in Nanjing. While operational agencies may not always provide data for external research, the MC framework can still demonstrate the target correlations needed for desired performance.
The integrated MC framework revealed that the no-warning scenario resulted in the highest values of mean inundation area, M I A ¯ , and duration of waterlogging D ¯ w (Figure 12). Perfect forecast scenarios performed best, as expected, while deterministic and probabilistic forecasts offered improvements over no-warning scenarios. This study demonstrated a trade-off between average pumping costs C ¯ p and FEWS waterlogging performance measures ( M I A ¯ and D ¯ w ), i.e., waterlogging decreased as pumping costs increased. It was shown that probabilistic forecasts could outperform deterministic forecasts by generating points closer to Utopia on the Pareto curve, i.e., corresponding to the perfect forecast scenario (Figure 12). A proactive pumping strategy using a parameter α (proactive pumping factor, Table 5) can be utilized to define a Pareto trade-off curve. The perfect forecast point serves as a benchmark for judging improvements in imperfect forecasts and highlights the importance of enhancing rainfall forecasts.
The MC framework assumes warning decisions are based solely on forecasts, but in reality, factors such as experience, event type, cost–benefit analysis, risk attitude, and cultural environment also influence decisions [37,38]. Future work could explore the Shazou polder FEWS potential performance considering these factors and different rainfall forecasting algorithms and pumping strategies.
Additionally, a serious game could be designed for polder managers in Nanjing to virtually explore the effectiveness of proactive and reactive actions and to define preferred trade-off points on the Pareto curve. This would help enhance confidence in potential benefits and establish a balance between waterlogging and pumping costs.
The main conclusions that can be drawn from this study are as follows:
(i)
A flexible MC framework has been created that can simulate a fully integrated flood warning–response–impact system for the operation of a polder in real-time. The MC framework can serve as a test-bed for assessing the accuracy of forecasts needed to achieve desired operational performance.
(ii)
The simulation experiments with the integrated system have shown the potential benefits that can be derived from rainfall forecasts and threshold-based warnings in polder operation.
(iii)
Probabilistic rainfall forecasts are shown to outperform deterministic rainfall forecasts based on the selected metrics of polder operation.
(iv)
A Pareto curve has been generated that shows the trade-off between flooding metrics, such as inundated area or duration, and pumping costs, allowing a polder manager to choose an operating strategy that meets a stated objective.

Author Contributions

Conceptualization, F.D., G.O. and E.O.; methodology, F.D., G.O. and E.O.; software, F.D.; validation, F.D.; formal analysis, F.D., G.O. and E.O.; investigation, F.D.; resources, F.D.; data curation, F.D., Y.L. and M.S.; writing—original draft preparation, F.D.; writing—review and editing, F.D., G.O., E.O., Y.L. and M.S.; visualization, F.D.; supervision, E.O. and Y.L.; project administration, F.D. and E.O.; funding acquisition, F.D. and E.O. All authors have read and agreed to the published version of the manuscript.

Funding

Financial support for this research was provided to Felipe Duque through a PhD scholarship from the Secretary for Higher Education, Science, Technology and Innovation (SENESCYT) of the Government of Ecuador and by a joint project between Newcastle University and the Nanjing Hydraulic Research Institute, China, funded by the UK Royal Academy of Engineering. Greg O’Donnell was supported by the Water Security and Sustainable Development Hub, funded by the UK Research and Innovation Global Challenges Research Fund (ES/S008179/1). Yanli Liu and Mingming Song were supported by the National Natural Science Foundation of China (Grant. U2240203, 52079079).

Data Availability Statement

The data presented in this study will be made available upon request.

Conflicts of Interest

The authors declare no conflict of interest.

Appendix A

Appendix A.1. Conceptual Model of the Water Fluxes during a Storm in a Polder System

The following algorithm simulates the water fluxes in the Shazhou polder system during a storm. The water balance is performed at an hourly time step and the variables are expressed in terms of mm·hr−1 per square meter of surface area, rather than volumes.

Appendix A.1.1. Runoff

The runoff process is represented through Equation (A1), which is based on the rainfall–runoff relationship used by [18] in representing the rainfall–runoff process of a neighbouring polder.
R O t = 0.5 5 R t + 0.15 R t 1
where R t (mm) and R O t (mm) represent the rainfall and runoff value at the time step t (hr). As one can note, this equation states that the average runoff coefficient ( C r u ) in the polder system is 0.7, which can be considered a reasonable value considering that the impervious area in the polder has been reported to be about 78.5% [19]. No data were available to recalibrate this relationship for the Shazou polder.

Appendix A.1.2. Waterlogging

Under non-critical conditions, this process is simulated by using the equation of [5,19], which uses the capacity of pipe-network drainage r as the upper limit to derive the inflow process of the inner rivers. Under critical conditions, it is, on the other hand, assumed that the inflow process is blocked and, therefore, the waterlogging cannot be drained. These processes are represented by
W t = W t 1 + R O t ,                                                                   i f   h t h c   m a x 0 ,   W t 1 + R O t r ,                                             i f   h t < h c  
where r (mm·hr−1) is the capacity of the municipal pipe network, h t (mm) is the water level of the inner rivers at the time step t, W t is the cumulative excess runoff or waterlogging on the polder at the time step t, and h c is the critical water level (Figure 2) defined in mm.

Appendix A.1.3. Inflow

Under non-critical conditions, the inflow to the inner rivers is also represented by using the conceptual model of [5,19]. Under critical conditions, it is assumed that the inflow process is blocked, and the inflow to the inner rivers is zero. These processes are represented by:
I t =                                       0 ,                     i f   h t h c       m i n r , W t 1 + R O t ,                     i f   h t < h c  
where I t is the inflow at time step t.

Appendix A.1.4. Pumping Strategy

The time variable pumping rate ( q t ) to be considered in this algorithm will depend on the pumping strategy used to simulate the Shazou Polder. According to the authors’ understanding of current pump operation for the Shazou polder, the runoff is pumped to the adjacent outer rivers according to the observed inflow I (reactive pumping) [5,18,19], i.e., q t = I t , when I t < q m a x , and when I t q m a x , the runoff is pumped at the maximum pumping rate q m a x . If h t     h c (critical condition), it is assumed, based on the analysis of pumping records, that pumping operators will drop the inner rivers to a normal water level ( h n ) following the storm event. This normal water level h n defines the lowest level that pumping operators will draw down the inner rivers to, and this only occurs following a critical condition. This strategy and other pumping strategies considered in this work are explained in Appendix C.

Appendix A.1.5. Storage in the Inner Rivers

The water storage can be expressed by
S t = S t 1 q m a x ,                                         i f   ( h t h c )   S t 1 + m a x 0 , I t q m a x ,                   i f   ( h t < h c )    
where S t (mm) is the water storage in the inner rivers at a given time t . Since the variables used in Equation (A4) are areal variables (taking the area of the polder as reference), S t should be understood as a volume of water spread over the polder area. This “areal” value is related to the actual value of the storage as:
S t A p = S t i n A i n
where A p and A i n are the areas of the polder and inner rivers respectively in the same units, and S t i n is the actual value of the water storage in the inner rivers at a given time step t taking mm as the unit. If we consider k as the water surface ratio of the polder (ratio between A i n and A p ), S t i n can be expressed from Equation (A5) as
S t i n = S t k

Appendix A.1.6. The Water Level in the Inner Rivers

The water levels of inner rivers in a polder system are usually obtained by simulating the flow processes in the rivers by using, for example, the de St-Venant equations [17,19]. Since this research considers the polder as just an input–output system, these flow processes are not simulated, and the water level in the inner rivers is simply expressed by
h t = h t 1 + S t i n
The simulation experiments (Section 3.5.2) focus only on the month of July when flooding is most likely to occur; so, at the start of each July simulation, it is assumed that the initial water level is equal to the normal water level h n .

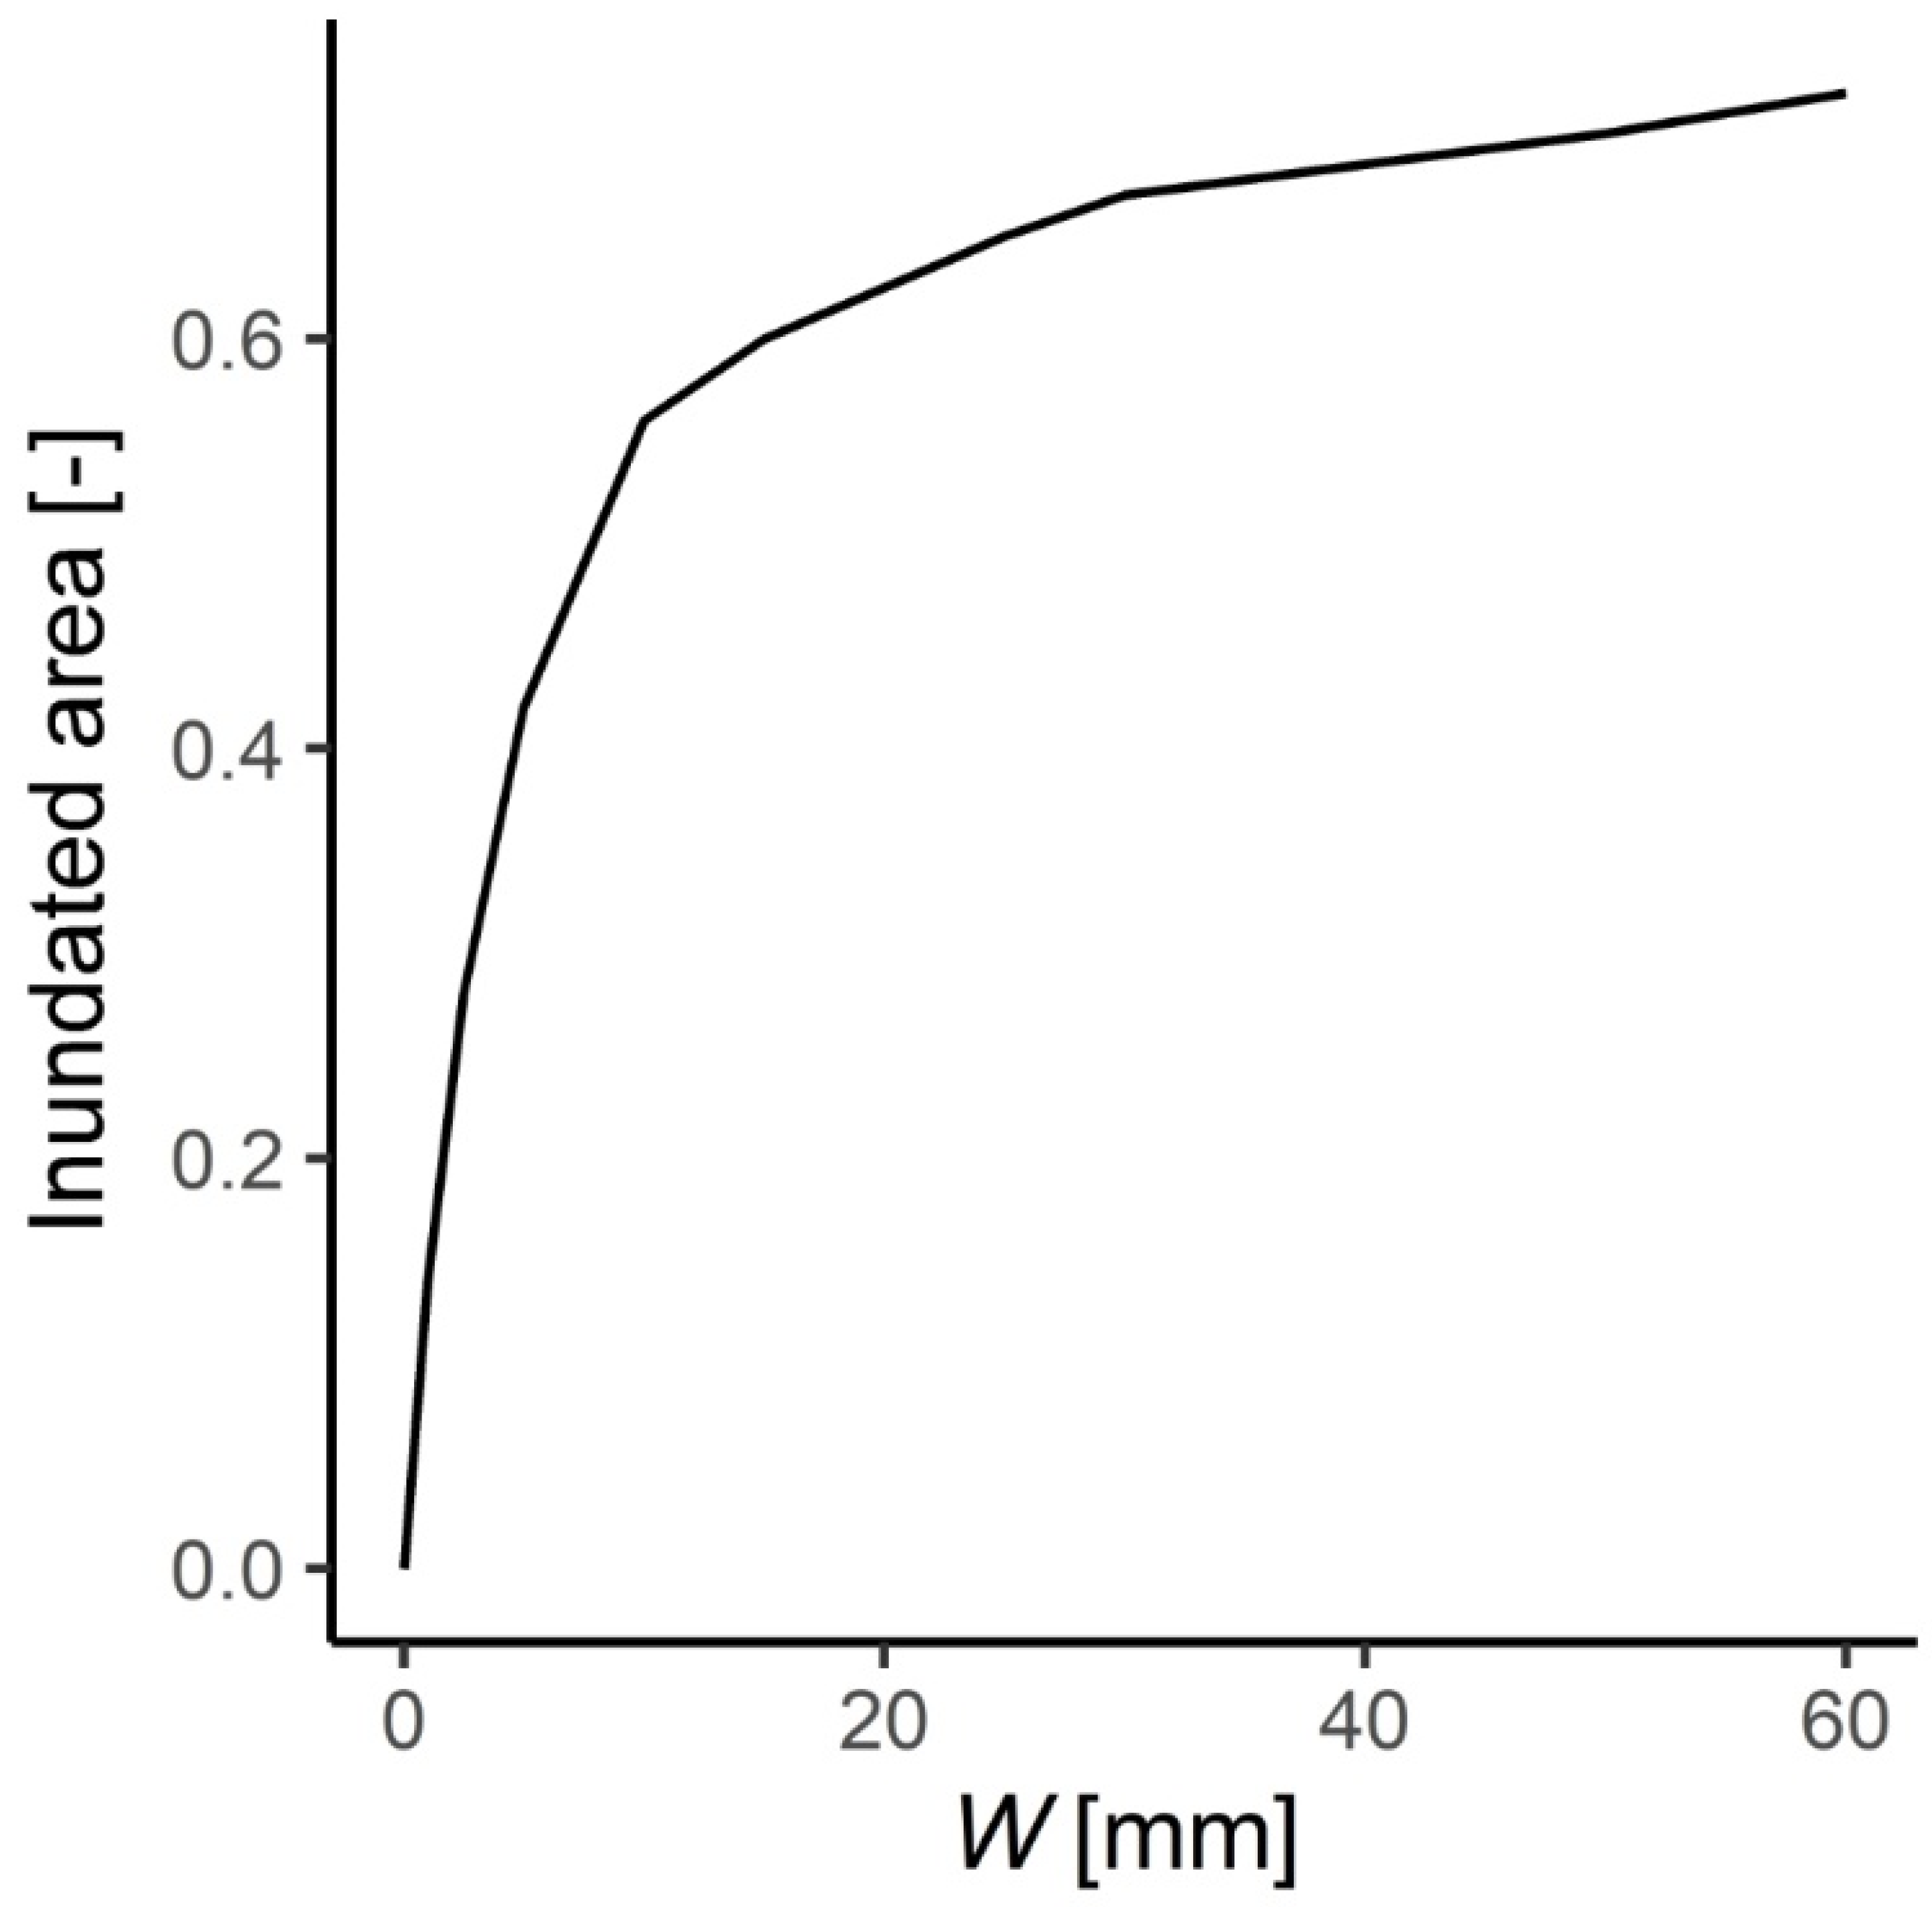
Appendix A.1.7. Inundated Area

A relationship is required that expresses the inundated area as a function of water level in the inundated polder. An impact curve was assumed for these purposes. This curve is shown in Figure A1 and was added to the conceptual model to represent the area inundated in the polder as a function of the depth of water that accumulates in the polder, i.e., the waterlogging. The shape of the function reflects the substantial development in lower areas of the polder, with substantial inundation occurring with initial waterlogging.
Figure A1. Inundated area–waterlogging function. This function was added to the conceptual model to represent the inundated area in the polder system as a function of the depth of waterlogging W (mm). The inundated area is expressed as a proportion of the area of the polder A p .
Hydrology 10 00238 g0a1

Appendix B

Appendix B.1. Spatio-Temporal RainSim Rainfall Field Model and Fitting Procedure

The stochastic rainfall modelling in RainSim is based on the Neyman–Scott Rectangular Pulses (NSRP) model [36], and it can be used for a single-site application (a point rainfall generator) or for spatial applications (a spatio-temporal rainfall generator). RainSim operates in three modes: First, several required statistics are computed from the observed time series; the aim of this stage is to perform a statistical characterisation of the rainfall time series. This mode is called analysis. Then, the parameter set is estimated that, according to analytical expectation, best matches the observed statistics. This mode is called fitting. Finally, synthetic time series are generated using the fitted parameters.
The spatio-temporal rainfall model was used for this application.

Appendix B.2. Available Data and Chosen Sites for Representing the Observed and Forecast Rainfall

RainSim V3 first requires a set of statistics to be computed from an observed sample to provide a statistical characterisation of the rainfall time series. These statistics are calculated from hourly and daily data. This subsection describes the sources of the data used for that purpose and other important information.
The daily data were obtained from the Global Historical Climatology Network-Daily (GHCN-Daily) dataset [39], which provides a long daily record (62 years) at Nanjing Station. The hourly data were collected from the five rainfall stations shown in Figure A2. The record lengths and other important information about the stations are described in Table A1.
Table A1. Characteristics of the rainfall stations used in RainSim V3.
CodeNameLat.Long.Record Period
62724050 Nanjing118°43′32°05′1950–2012 (daily)
2012–2016 (hourly)
62935200Xiaoqiao118°34′32°10′2012–2016 (hourly)
62936600Liuhe118°53′32°20′
62936660Getang118°44′32°15′
63129400Dongshan118°51′31°57′
Figure A2. Geographical locations of the five rainfall stations used for obtaining the statistics needed for the calibration and validation of RainSim V3 (Table A2), and description of the chosen sites (red circles) for representing the observed time series and its forecasts.
Hydrology 10 00238 g0a2
Table A2. Input parameters of RainSim for spatio-temporal applications and statistics needed to calibrate and validate the model. The statistics used for calibrating and validating RainSim correspond to July, which is the rainiest month in Nanjing.
Symbol or
Abbreviation
StatisticUnits or
Time Step
DescriptionCalibrated Values
λ1/mean waiting time between adjacent storm origins(1/h)Input parameters of the model0.003967
β 1/mean waiting time for raincell origins after storm origin (1/h)0.077682
ղ1/mean duration of raincell(1/h)5.381274
ξ1/mean intensity of a raincell(h/mm)0.169332
γ1/mean radius of raincells(1/km)0.015000
ρ Spatial density of raincell centres(km−2)0.001050
ObservedFittedWeight
meanThe mean h hour rainfall accumulationDailyStatistics needed from daily or hourly rainfall for calibrating and validating the model.6.456.425
pdyrThe probability that an h hour accumulation is dry, that is strictly less than a specified thresholdDaily
Hourly
0.69
0.91
0.81
0.93
6
5
varThe variance of the h hour accumulationDaily
Hourly
334.95
2.83
334.97
2.84
2
3
Lag1corrThe auto-correlation of the h hour accumulation of two-time series. Daily0.160.303
xcorrThe cross-correlation of the h hour accumulation of two-time series. Daily0.900.962
varThe variance of the h hour accumulationHourly
skewThe skewness coefficient of h hour accumulationHourly4.863.883
Dongshan station was chosen as the location that represents the observed time series and the time series at Nanjing station as its forecast. Since they are closely located, there is no bias between them, and the predictive uncertainty PU is only a function of a correlation parameter (xcorr in Table A2). The Dongshan station was chosen as the observed time series because the records of this station best represented the 7 July 2016 event, which, as explained above (Section 2.2.2), was used to calibrate the conceptual model of the Shazou polder.

Appendix B.3. Calibration of the Model

The parameters of the RainSim V3 spatio-temporal model (Table A2) are estimated by minimizing a sum of squares function based on the differences between observed and model statistics. The estimated parameters and observed statistics used in model fitting procedure are shown in Table A2. The daily statistics were calculated from the long daily record of the Nanjing station obtained from the GHCN-Daily dataset, whereas the hourly statistics were calculated from the Dongshan record (Table A1). The spatial-temporal rainfall model simulated rainfall at five locations (Figure A2), with the same observed statistics at each location, but with different spatial correlations (parameter xcorr in Table A2) obtained from the records of the five hourly rainfall stations (note that, for brevity, the spatial correlation in Table A2 is only shown for the Nanjing and Dongshan stations). This was carried out based on the criterion adopted to represent the observed rainfalls and their forecasts as explained in Section 2.3 and illustrated in Figure A2.

Appendix C

The response strategies used in the conceptual model of the Shazhou polder for each of the four forecast scenarios are as follows.

Appendix C.1. Reactive Pumping Strategy: No Warning Sccenario

A reactive pumping strategy can be defined as a pumping action driven by the inflow of the inner rivers I . Under non-critical conditions, this pumping strategy is represented by the following operational principle [5,18]: When the water level starts to rise,
If: the inflow exceeds the pumping capacity of the polder system q m a x ,
pump the water at the latter rate, while the excess water is stored in the inner rivers, raising the water level;
Else: pump the water at the inflow rate I t .
For the critical condition, it is assumed that the maximum pumping capacity q m a x is used in the polder. It is also considered that, after the critical condition has been reached and the inflow has stopped, the polder manager drops the water level of the inner river to the normal level h n by using the maximum pumping capacity q m a x . Furthermore, if the resulting water level of the inner rivers after the storm is below the critical level h c , it is assumed that the polder manager keeps the water level of the inner rivers at that level. These principles are represented by
q t =           q m a x ,                         i f   ( h t h c )   u n t i l   h = h n m i n q m a x ,   I t ,             i f   h t < h c   &   I t > 0         0 ,                             i f   h t < h c   &   I t = 0  
where, as explained in Appendix A, q t and I t (mm·hr−1) are the pumping and inflow rate at time step t, respectively; the other variables have already been introduced.
The adopted reactive pumping strategy has three mains assumptions: (i) the pumping starts when a storm starts (reactive action), (ii) once the dropped water level reaches a given water level (here assumed as h n ), the pumping ends, and (iii) the water level of the inner rivers can be higher than the level that defines the end of the pumping (i.e.,   h n ). This behaviour has been observed in the operation of the Shazhou polder [10].

Appendix C.2. Proactive Pumping Strategy: Perfect Forecast Scenario

The water balance of a critical observed daily runoff can be expressed by
R O d a i l y c = V p c + S o c a p + S c
where R O d a i l y c is the observed daily runoff causing critical conditions, V p c is the portion of this critical runoff reactively pumped to the adjacent outer rivers during the storm, S o c a p , as explained in Section 2.2.1, is the storage capacity of the inner rivers before the storm arrives, and S c is the portion of the critical runoff that brings the water level of the inner rivers beyond the critical level. The terms of the rhs in Equation (A9) are the three variables that should be considered in a proactive pumping strategy. Of these variates, only S o c a p is known before the storm arrives, and V p c and S c are, therefore, the target variables in a proactive pumping strategy. The perfect forecast scenario is the best scenario when simulating the polder system, as one is assuming perfect knowledge about these target variables; to know the values of these variables, one should have perfect knowledge of the profile and volume of the coming daily rainfall causing critical conditions in the polder.
Based on this concept, the proactive criterion adopted for a 24-h storm period in the MC framework for the proactive strategy in this and the other forecast scenarios is defined by
P s t r = V p b e f o r e                   t t p r o ;             p r o a c t i v e   a c t i o n V p             t m a x ( t a r r i v e , t p r o ) ;     r e a c t i v e   a c t i o n    
where V p b e f o r e is the volume of water pumped before the storm arrives (proactive action), V p is the volume of water pumped during the storm (reactive action), t a r r i v e is the time at which the observed storm arrives in the polder, and t p r o is the proactive action period (Figure 5a).
Thus, in the perfect forecast scenario, V p b e f o r e in Equation (A10) should be equal to S c ; and then, when the storm arrives, V p will be equal to V p c . Note, however, that, when applying this strategy, the storage capacity of the inner rivers at the end of the 24 h storm period will be full, which would produce a critical condition situation for the next day, even for a weak storm. To avoid this, V p b e f o r e under this scenario is expressed by
V p b e f o r e = S c + ( h c h r e f )
where S c is expressed as length units, and h r e f is a reference level of the inner rivers. The reference level h r e f is the level at which one wants the water level to be at after the pumping actions; it must be neither too high nor too low. In this first case, a critical condition situation can be produced the next day, even by a weak storm. In the second case, the strategy can be considered expensive. When considering the value of V p b e f o r e based on this equation, one makes sure that the level of the inner rivers after the end of the storm will be equal to h r e f .
Under perfect knowledge assumptions and considering the proactive criterion described in Equation (A10), S c should be computed prior to the analysis of the daily storm by performing in advance the 24 h water balance of the polder system based on reactive pumping actions and using the observed profile and volume of the daily rainfall to be analysed (perfect forecast). It can be computed through the following algorithm:
  • Step 1: Assume the polder system to be a tank (an input-output system) and compute the hourly runoff R O t by using Equation (A1), and its associated waterlogging W t and inflow I t through Equation (A2) and Equation (A3), respectively, for the no-critical-condition situation.
  • Step 2: Compute the hourly water storage as
S t = 0 ,                                                         i f   ( I t q m a x )   S t 1 + ( q m a x I t ) ,                             i f   ( I t > q m a x )    
  • Step 3: Compute the maximum value of S t , i.e., S m a x ( S 1 , S 2 , S 3 , S 24 ) , and compute S c as
S c = S m a x S o C a p
The chronology of the perfect forecast pumping strategy can be summarized as follows.
  • At midnight, the value of S c is delivered to the polder manager, and the polder manager conducts the proactive action by pumping a volume of water equal to S c + ( h c h r e f )  (Equation (A11)) with a pumping rate = q m a x .
  • Then, the polder manager waits for the arrival of the storm. If the storm arrives before S c + ( h c h r e f ) has been pumped, the manager will continue with the proactive strategy and use the pumping rate q m a x until the target volume has been pumped.
  • Finally, the polder manager completes the pumping strategy by conducting the reactive action once the storm arrives, which is represented by Equation (A8). The volume of water pumped during the reactive period will be equal to V p c and the level of the inner river at the end of the storm will be equal to h r e f .
Note that the representation of the perfect forecast pumping strategy does not mean that the polder system will not be affected by waterlogging. There are two conditions causing waterlogging under the perfect forecast scenario:
  • Condition 1: When the runoff rate R O overcomes the capacity of the drainage system r .
  • Condition 2: When the runoff starts at midnight and the inflow overcomes the pumping capacity of the polder system q m a x , i.e., before the proactive strategy can be implemented. Under this condition, t a r r i v e in Equation (A10) is zero, and the proactive action cannot be conducted. In this case, the polder manager does not have response capacity for the critical storm, and he/she is only able to use a pumping rate equal to q m a x , whereas the water level of the inner rivers rises until a critical condition situation is reached.

Appendix C.3. Proactive Pumping Strategy: Deterministic Forecast Scenario

The proactive pumping strategy in the imperfect forecast scenarios considers the uncertainty of the target variables S c and V p c and assumes the polder manager has a forecast of the total critical daily runoff ( R O d a i l y c ), designated by R O ^ d a i l y c , but has no knowledge of the rainfall profile. Thus, in this case, the polder manager has to deal with the proactive action based on knowledge of R O ^ d a i l y c and S o C a p ; the latter is assumed known because he/she knows the storage capacity of the inner rivers before the storm arrives. The following equation can be written based on the true values of these two variables:
R O d a i l y c = V e x c e s s + S o C a p
where V e x c e s s is the portion of the critical daily runoff expressed by V p c + S c in Equation (A9). Based on Equation (A14) and the information assumed known by the polder manager; one can, therefore, say that he/she has an estimate of V e x c e s s which can be computed as
V ^ e x c e s s = R O ^ d a i l y c S o C a p
where V ^ e x c e s s is the estimate of V e x c e s s based on the deterministic forecast R O ^ d a i l y c Thus, the estimate of S c in Equation (A9)can be computed as a proportion of V ^ e x c e s s as
S ^ c = α V ^ e x c e s s    
where S ^ c is the estimate of S c and α is a parameter, (0< α   < 1), representing the proportion of V ^ e x c e s s that represents S ^ c , i.e., α represents the proactive pumping factor in the pumping strategy. Based on Equation (A16), the estimate of V p c is given by
V ^ p c = 1 α V ^ e x c e s s  
Thus, an imperfect forecast-based proactive pumping strategy assumes that V p b e f o r e in Equation (A10) should be equal to S ^ c (Equation (A16)); and then, when the storm arrives, it assumes that V p will be equal to V ^ p c (Equation (A17)).
In this context, the deterministic forecast pumping strategy requires a forecast of the total critical daily runoff R O ^ d a i l y c based on the deterministic forecast of a critical daily rainfall ( R d a i l y c ) (a daily rainfall causing critical conditions in the polder), designated as R ^ d a i l y c . By definition, the values of this latter variable are values greater than a daily rainfall threshold R T d a i l y (Section 2.5.1) and, therefore, they are provided to the polder manager when a flood warning is issued. R O ^ d a i l y c is computed here as
R O ^ d a i l y c = 0.7 R ^ d a i l y c
where the value of 0.7 represents the average runoff coefficient of the polder system, C r u (Table 1), used in the conceptual model to compute the runoff rate R O (Equation (A1)).
The chronology of the operation of the polder system under the proactive pumping criterion described in Equation (A10) and Figure 5a and based on deterministic 24 h forecasts can be summarized as follows.
  • A deterministic 24 h forecast of rainfall is generated at midnight, and a warning decision is made based on the deterministic decision rule explained in Section 2.5 (Figure 5b). If a flood warning is issued, the deterministic forecast of the daily runoff that will cause critical conditions in the next 24 h, R O ^ d a i l y c , is delivered to the polder manager (Equation (A18)). If a flood warning is not issued, only a reactive pumping action is conducted.
  • If a flood warning is issued, the polder manager conducts the proactive action by pumping a volume of water equal to S ^ c = α V ^ e x c e s s with a pumping rate = q m a x , where V ^ e x c e s s is computed as R O ^ d a i l y c S o (Equation (A15)).
  • Then, the polder manager waits for the arrival of the storm. If the storm arrives before S ^ c has been pumped, the manager will continue with the proactive strategy and use the pumping rate q m a x until the target volume has been pumped.
  • Finally, the polder manager completes the pumping strategy by conducting the reactive action once the storm arrives, which is represented by Equation (A8).

Appendix C.4. Proactive Pumping Strategy: Probaabilistic Forecast Scenario

The proactive pumping strategy based on the probabilistic forecast uses the expected value of the forecast of a daily rainfall R d a i l y to compute R O ^ d a i l y c .
R O ^ d a i l y c = 0.7 E R d a i l y | R ^ d a i l y
where E R d a i l y | R ^ d a i l y is the expected value of the conditional distribution of R d a i l y given R ^ d a i l y , i.e., f R d a i l y R ^ d a i l y , obtained from the joint probability of R d a i l y and R ^ d a i l y (Figure 4).
The chronology of the operation of the polder system under the proactive pumping criterion described by Equation (A10) and Figure 5a, and based on probabilistic 24 h forecasts can be summarized as follows.
  • A probabilistic 24 h forecast of rainfall is generated at midnight, and a warning decision is conducted based on the probabilistic decision rule explained in Section 2.5 (Figure 5c). If a flood warning is issued, the probabilistic-forecast-based estimate of the daily runoff that will cause critical conditions R O ^ c d a i l y in the next 24 h is delivered to the polder manager (Equation (A19)). If a flood warning is not issued, only reactive pumping is conducted.
  • Then, the chronology (last three steps) is the same as for the deterministic scenario.

References

  1. Adnan, S.G. The Legacy of Polders: Diagnosing Complex Flooding Processes and Adaptation Options in the Coastal Region of Bangladesh; University of Oxford: Oxford, UK, 2020. [Google Scholar]
  2. Budiyono, Y.; Marfai, M.A.; Aerts, J.; de Moel, H.; Ward, P.J. Flood Risk in Polder Systems in Jakarta: Present and Future Analyses; Springer International Publishing AG: Cham, Switzerland, 2017; pp. 517–537. [Google Scholar]
  3. Baan, P.J.A.; Klijn, F. Flood Risk Perception and Implications for Flood Risk Management in the Netherlands. Int. J. River Basin Manag. 2004, 2, 113–122. [Google Scholar] [CrossRef]
  4. Wei, D.; Urich, C.; Liu, S.; Gu, S. Application of CityDrain3 in Flood Simulation of Sponge Polders: A Case Study of Kunshan, China. Water 2018, 10, 507. [Google Scholar] [CrossRef]
  5. Gao, C.; Liu, J.; Cui, H.; Doddi, Y. An Applicable Method to Calculate Drainage Modulus in Urbanized Lowlying Area. In Proceedings of the 2008 International Workshop on Education Technology and Training and 2008 International Workshop on Geoscience and Remote Sensing, ETT and GRS 2008, Shanghai, China, 21–22 December 2008. [Google Scholar]
  6. Gao, Y.; Yuan, Y.; Wang, H.; Schmidt, A.R.; Wang, K.; Ye, L. Examining the Effects of Urban Agglomeration Polders on Flood Events in Qinhuai River Basin, China with HEC-HMS Model. Water Sci. Technol. 2017, 75, 2130–2138. [Google Scholar] [CrossRef] [PubMed]
  7. Gao, Y.; Wang, D.; Zhang, Z.; Ma, Z.; Guo, Z.; Ye, L. Analysis of Flood Risk of Urban Agglomeration Polders Using Multivariate Copula. Water 2018, 10, 1470. [Google Scholar] [CrossRef]
  8. Fang, G.; Yuan, Y.; Gao, Y.; Huang, X.; Guo, Y. Assessing the Effects of Urbanization on Flood Events with Urban Agglomeration Polders Type of Flood Control Pattern Using the HEC-HMS Model in the Qinhuai River Basin, China. Water 2018, 10, 1003. [Google Scholar] [CrossRef]
  9. Wang, Y.-W.; Pendlebury, J.; Nolf, C. The Water Heritage of China: The Polders of Tai Lake Basin as Continuing Landscape. Plan. Perspect. 2023, 38, 949–974. [Google Scholar] [CrossRef]
  10. Song, M. SWMM Model in Nanjing. In Proceedings of the II-Workshop of the Project “A Virtual Collaboratory for Flood Forecasting, Flood Warning and Decision-making under Uncertainty in Urban Flood Management”, Newcastle upon Tyne, UK, 17–19 June 2019. [Google Scholar]
  11. Gambini, E.; Ceppi, A.; Ravazzani, G.; Mancini, M.; Valsecchi, I.Q.; Cucchi, A.; Negretti, A.; Tolone, I. An Empirical Rainfall Threshold Approach for the Civil Protection Flood Warning System on the Milan Urban Area. J. Hydrol. 2023, 628, 130513. [Google Scholar] [CrossRef]
  12. Mentzafou, A.; Papadopoulos, A.; Dimitriou, E. Flood Generating Mechanisms Investigation and Rainfall Threshold Identification for Regional Flood Early Warning. Environ. Earth Sci 2023, 82, 242. [Google Scholar] [CrossRef]
  13. Georgakakos, K.P. Analytical Results for Operational Flash Flood Guidance. J. Hydrol. 2006, 317, 81–103. [Google Scholar] [CrossRef]
  14. Young, A.; Bhattacharya, B.; Zevenbergen, C. A Rainfall Threshold-based Approach to Early Warnings in Urban Data-scarce Regions: A Case Study of Pluvial Flooding in Alexandria, Egypt. J. Flood Risk Manag. 2021, 14, e12702. [Google Scholar] [CrossRef]
  15. Chitwatkulsiri, D.; Miyamoto, H.; Irvine, K.N.; Pilailar, S.; Loc, H.H. Development and Application of a Real-Time Flood Forecasting System (RTFlood System) in a Tropical Urban Area: A Case Study of Ramkhamhaeng Polder, Bangkok, Thailand. Water 2022, 14, 1641. [Google Scholar] [CrossRef]
  16. Xu, H.; Yang, S.J. Exploring the Evolution of River Networks in Plain Polders of Taihu Lake Basin. Adv. Water Sci. 2013, 3, 366–371. [Google Scholar]
  17. Gao, C.; Liu, J.; Cui, H.; Hu, J. Treatment of Pump Drainage Boundary in Riverside City. Environ. Earth Sci. 2013, 68, 1435–1442. [Google Scholar] [CrossRef]
  18. Gao, C.; Liu, J.; Cui, H.; Zhu, J. An Effective Way to Determine Maximum Capacity of Pump Stations for Urbanized Polders. In Proceedings of the 3rd International Conference on Bioinformatics and Biomedical Engineering, iCBBE 2009, Beijing, China, 11–13 June 2009. [Google Scholar]
  19. Jun, L.; Cheng, G.; Han, C.; Jie, Z.; Gang, L. Research on Relationship between Drainage Modulus and Drainage Area in Large Urbanized Polder. In Proceedings of the 2010 The 2nd International Conference on Industrial Mechatronics and Automation, IEEE, Wuhan, China, 30–31 May 2010; pp. 630–633. [Google Scholar]
  20. Burton, A.; Kilsby, C.G.; Fowler, H.J.; Cowpertwait, P.S.P.; O’Connell, P.E. RainSim: A Spatial-Temporal Stochastic Rainfall Modelling System. Environ. Model. Softw. 2008, 23, 1356–1369. [Google Scholar] [CrossRef]
  21. Biondi, D.; Todini, E. Comparing Hydrological Postprocessors Including Ensemble Predictions Into Full Predictive Probability Distribution of Streamflow. Water Resour. Res. 2018, 54, 9860–9882. [Google Scholar] [CrossRef]
  22. Tanaka, J.S. “How Big Is Big Enough?”: Sample Size and Goodness of Fit in Structural Equation Models with Latent Variables. Child Dev. 1987, 58, 134–146. [Google Scholar] [CrossRef]
  23. Borga, M.; Anagnostou, E.N.; Blöschl, G.; Creutin, J.-D. Flash Flood Forecasting, Warning and Risk Management: The HYDRATE Project. Environ. Sci. Policy 2011, 14, 834–844. [Google Scholar] [CrossRef]
  24. Jang, J.-H. An Advanced Method to Apply Multiple Rainfall Thresholds for Urban Flood Warnings. Water 2015, 7, 6056–6078. [Google Scholar] [CrossRef]
  25. Liu, W.; Wu, J.; Tang, R.; Ye, M.; Yang, J. Daily Precipitation Threshold for Rainstorm and Flood Disaster in the Mainland of China: An Economic Loss Perspective. Sustainability 2020, 12, 407. [Google Scholar] [CrossRef]
  26. Duque, L.F. A Monte Carlo Simulation Study of the Factors Influencing the Performance of Flood Early Warning Systems; Newcastle University: Newcastle upon Tyne, UK, 2021. [Google Scholar]
  27. Hapuarachchi, H.A.P.; Wang, Q.J.; Pagano, T.C. A Review of Advances in Flash Flood Forecasting. Hydrol. Process. 2011, 25, 2771–2784. [Google Scholar] [CrossRef]
  28. Jain, S.K.; Mani, P.; Jain, S.K.; Prakash, P.; Singh, V.P.; Tullos, D.; Kumar, S.; Agarwal, S.P.; Dimri, A.P. A Brief Review of Flood Forecasting Techniques and Their Applications. Int. J. River Basin Manag. 2018, 16, 329–344. [Google Scholar] [CrossRef]
  29. Krzysztofowicz, R.; Kelly, K.S. Hydrologic Uncertainty Processor for Probabilistic River Stage Forecasting. Water Resour. Res. 2000, 36, 3265–3277. [Google Scholar] [CrossRef]
  30. Coccia, G.; Todini, E. Recent Developments in Predictive Uncertainty Assessment Based on the Model Conditional Processor Approach. Hydrol. Earth Syst. Sci. 2011, 15, 3253–3274. [Google Scholar] [CrossRef]
  31. Barbetta, S.; Coccia, G.; Moramarco, T.; Brocca, L.; Todini, E. The Multi Temporal/Multi-Model Approach to Predictive Uncertainty Assessment in Real-Time Flood Forecasting. J. Hydrol. 2017, 551, 555–576. [Google Scholar] [CrossRef]
  32. Barbetta, S.; Coccia, G.; Moramarco, T.; Todini, E. Real-Time Flood Forecasting Downstream River Confluences Using a Bayesian Approach. J. Hydrol. 2018, 565, 516–523. [Google Scholar] [CrossRef]
  33. Duque, L.-F.; O’Connell, E.; O’Donnell, G. A Monte Carlo Simulation and Sensitivity Analysis Framework Demonstrating the Advantages of Probabilistic Forecasting over Deterministic Forecasting in Terms of Flood Warning Reliability. J. Hydrol. 2023, 619, 129340. [Google Scholar] [CrossRef]
  34. Sayers, P.; Horritt, M.; Penning-Rowsell, E.; McKenzie, A. Climate Change Risk Assessment 2017: Projections of Future Flood Risk in the UK; Committee on Climate Change: London, UK, 2015. [Google Scholar]
  35. Ayzel, G.; Varentsova, N.; Erina, O.; Sokolov, D.; Kurochkina, L.; Moreydo, V. OpenForecast: The First Open-Source Operational Runoff Forecasting System in Russia. Water 2019, 11, 1546. [Google Scholar] [CrossRef]
  36. Harrigan, S.; Zsoter, E.; Alfieri, L.; Prudhomme, C.; Salamon, P.; Wetterhall, F.; Barnard, C.; Cloke, H.; Pappenberger, F. GloFAS-ERA5 Operational Global River Discharge Reanalysis 1979-Present. Earth Syst. Sci. Data 2020, 12, 2043–2060. [Google Scholar] [CrossRef]
  37. Arnal, L.; Anspoks, L.; Manson, S.; Neumann, J.; Norton, T.; Stephens, E.; Wolfenden, L.; Cloke, H.L. “Are We Talking Just a Bit of Water out of Bank? Or Is It Armageddon?” Front Line Perspectives on Transitioning to Probabilistic Fluvial Flood Forecasts in England. Geosci. Commun. 2020, 3, 203–232. [Google Scholar] [CrossRef]
  38. Ramos, M.-H.; Mathevet, T.; Thielen, J.; Pappenberger, F. Communicating Uncertainty in Hydro-Meteorological Forecasts: Mission Impossible? Meteorol. Appl. 2010, 17, 223–235. [Google Scholar] [CrossRef]
  39. Menne, M.J.; Durre, I.; Vose, R.S.; Gleason, B.E.; Houston, T.G. An Overview of the Global Historical Climatology Network-Daily Database. J. Atmos. Ocean. Technol. 2012, 29, 897–910. [Google Scholar] [CrossRef]
Figure 1. Map of the Shazhou polder (Hexi New Town) and its surrounding areas, Nanjing, China. The pumping system of the polder is made up of 17 pumping stations.
Hydrology 10 00238 g001
Figure 2. Conceptual model of water fluxes in the Shazhou polder system during an intense rainstorm. The figure shows the scenario when the water level is lower than h c (non-critical condition) but the runoff exceeds the drainage capacity r, resulting in water logging. The dashed green arrow indicates the behaviour of the water of the inner rivers under this condition during the pumping.
Hydrology 10 00238 g002
Figure 3. (a) Illustration of the MC framework for the case of a hypothetical FEWS monitoring and warning in the Shazhou polder; (bd) evaluation the benefits of flood warnings in the management of the Shazhou polder for the no warning, perfect and imperfect scenarios, respectively. The metrics are defined in Table 2.
Hydrology 10 00238 g003
Figure 4. Illustration of the generation of probabilistic 24 h observed rainfalls and their forecasts through the RFG. A bivariate parametric model, illustrated by a contour plot (red lines), is constructed based on the daily observed rainfalls R d a i l y and their forecasts R ^ d a i l y , from which f R d a i l y R ^ d a i l y is derived, blue line.
Hydrology 10 00238 g004
Figure 5. (a) Chronology of the operation of the Shazou polder by considering a flood warning based on 24 h forecast horizon. Warning decisions are assumed to be made at midnight, which are simulated in the FWDC using a deterministic (b) or probabilistic (c) rule.
Hydrology 10 00238 g005
Figure 6. Calibration of the conceptual model for the Shazhou polder. This figure shows the simulated water level for the 7 July 2016 rainfall event using the parameter values shown in Table 3. The simulated inflow I is also shown in this figure.
Hydrology 10 00238 g006
Figure 7. Visual inspection of GoF (qq-plots) of of R d a i l y (a) and R ^ d a i l y  (b).
Hydrology 10 00238 g007
Figure 8. Results of the bivariate simulation of R d a i l y and R ^ d a i l y . (a) shows the joint density of 50,000 pair of values of the BGD defined by the values of the parameters shown in Table 4. (b) shows the conditional distribution f R d a i l y R ^ d a i l y associated with the forecast value R ^ d a i l y i represented by a grey dot in (a).
Hydrology 10 00238 g008
Figure 9. Rainfall thresholds for the Shazhou polder. (a) shows the dimensionless mass curve of the proportion of observed daily rainfalls considered to obtain R T d a i l y values (daily rainfall > 50 mm). (b) shows the values of h o j against R T d a i l y j according to the approach described in Section 2.5.1.
Hydrology 10 00238 g009
Figure 10. Example of the simulation of the operation of the polder system (water level) during an ‘observed’ storm causing critical conditions for all four scenarios. In this and the remaining figures, the following abbreviations are used: DF: deterministic forecast scenario; NW: no-warning scenario; PF: perfect forecast; PrF: probabilistic forecast scenario. In this case, the initial condition for all scenarios matches, a   = 0.05 for DF and PT = 0.9, and a   = 0.025 for PrF.
Hydrology 10 00238 g010
Figure 11. The trade-off between pumping costs and waterlogging for the deterministic and probabilistic forecast scenarios and comparison with the two benchmark scenarios. This figure shows the trade-off between C ¯ p and M I A ¯ and D ¯ w for the deterministic (a,b) and probabilistic (c,d) forecast scenarios. The values of α considered were the following: 0, 0.025, 0.05, 0.075, 0.10, 0.15, 0.2, 0.25, 0.30, 0.35, 0.40, 0.45, 0.5.
Hydrology 10 00238 g011
Figure 12. Trade-off between pumping costs and waterlogging, defined by M I A ¯ (a) and D ¯ w (b), for the deterministic and probabilistic forecast scenarios (best probabilistic solutions) and comparison with the two benchmark scenarios.
Hydrology 10 00238 g012
Figure 13. Values of D w 99 for all scenarios. DF: deterministic forecast; NW: no-warning scenario; PF: perfect forecast, PrF: probabilistic forecast. The value of α assumed for the deterministic and probabilistic pumping strategy was 0.15.
Hydrology 10 00238 g013
Table 1. Input parameters for the conceptual model of water fluxes in a polder system during a storm (Figure 2).
ParameterDescriptionUnit
r The capacity of the pipe-network drainagemm·hr−1
q m a x The maximum pumping capacity for the polder
S m a x c a p Difference   between   the   critical   and   normal   water   level   of   the   inner   rivers ,   i . e . ,   h c and h n , respectivelymm
k Water surface ratio-
C r u Average runoff coefficient
Table 2. Description of the metrics used for evaluating the benefits of flood warnings in the Shazhou polder.
MetricEquationDescription of Equations
Average maximum inundated area M I A = m a x I A 1 , I A 2 , I A 3 , I A j M I A ¯ = 1 n i = 1 n M I A i M I A :   the   maximum   area   inundated   during   each   replication   i of the operation of the polder system during July.
I A : hourly inundated area.
j : the total number of simulated hours in a simulated July (744 h).
n : total number of July replications (8730 replications).
M I A ¯ : the average maximum inundated area in July.
D w i : number   of   hours   of   waterlogging   during   a   simulated   July   i .
D ¯ w : average waterlogging duration during July.
C ¯ p : average total pumping cost during July.
C ¯ p r o : average proactive pumping costs during July.
C ¯ r e a : average reactive pumping costs during July.
C p r o i : total proactive pumping cost for a simulated July i .
C r e a i : total reactive pumping cost for a simulated July i .
Average waterlogging duration D ¯ w = 1 n i = 1 n D w i
Average pumping costs C ¯ p = C ¯ p r o + C ¯ r e a C ¯ p r o = 1 n i = 1 n C p r o i C ¯ r e a = 1 n i = 1 n C r e a i
Assumed pumping tariff to compute the pumping costs
q  (mm·h−1)1.63.24.86.48 q m a x = 9.62
Tariff (units)1530456075100
Table 3. Calibrated values of the conceptual model parameters used in the simulation of the Shazhou polder FEWS. The description of the symbols is given in Table 1.
Symbol Units Value
r mm·hr−122.14
q m a x 9.62 (14.8)
S m a x c a p mm500
k -0.065
C r u 0.70
Table 4. Estimation of the parameters of the Gamma distribution for the values of R d a i l y and R ^ d a i l y and their correlation coefficient.
Location Parameter (mm)Shape Parameter (-)Scale Parameter (-)Correlation Coefficient
R o d a i l y R ^ o d a i l y γ R d a i l y γ R ^ d a i l y β R d a i l y β R ^ d a i l y ρ R d a i l y , R ^ d a i l y
50501.451.4423.223.30.93
Table 5. Adopted parameters for the MC framework. The parameters PT and α were varied within the specified ranges in the MC simulation experiments.
Symbol DescriptionValueComponent
R ^ o d a i l y Parameters of the joint distribution of the daily rainfall and its forecast.50 mmRFG
γ R ^ d a i l y 1.44
β R ^ d a i l y 23.3
R o d a i l y 50 mm
γ R d a i l y 1.45
β R d a i l y 23.2
ρ R d a i l y , R ^ d a i l y 0.93
PTProbabilistic threshold adopted for the probabilistic decision rule.0.1–1FWDC
r Parameters of the conceptual model22.14 mm·hr−1RIC
q m a x 9.62 mm·hr−1
S m a x c a p 500 mm
k 0.065
C r u 0.70
h r e f Water level assumed at the end of the perfect forecast-based proactive pumping strategy4400 mm
αProactive pumping factor (the proportion of the forecasted runoff pumped in advance) 0–0.5
Table 6. The final sets of parameters for the probabilistic forecast scenario.
Set1234567
α0.050.150.0750.10.30.20.25
PT0.90.90.80.80.80.70.7
Disclaimer/Publisher’s Note: The statements, opinions and data contained in all publications are solely those of the individual author(s) and contributor(s) and not of MDPI and/or the editor(s). MDPI and/or the editor(s) disclaim responsibility for any injury to people or property resulting from any ideas, methods, instructions or products referred to in the content.

