Article

Techno-Economic Analysis of Biogas Upgrading via CO2 Methanation for Sustainable Biomethane Production

Department of Chemical Engineering, Birla Institute of Technology and Science (BITS) Pilani, Hyderabad Campus, Jawahar Nagar, Kapra Mandal, Hyderabad 500078, India
*
Author to whom correspondence should be addressed.
ChemEngineering 2025, 9(5), 114; https://doi.org/10.3390/chemengineering9050114
Submission received: 13 August 2025 / Revised: 14 October 2025 / Accepted: 17 October 2025 / Published: 21 October 2025

Abstract

The rising dependence on fossil fuels has intensified greenhouse gas emissions, necessitating the development of renewable energy alternatives. Biogas is a sustainable fuel source; however, its low energy density hinders direct commercial application. This study explores the potential of upgrading biogas to biomethane (Bio-CNG) via CO2 methanation, using Aspen Plus v14.0 simulations and techno-economic analysis. Equilibrium studies revealed that optimal conditions of 300–400 °C, 1–5 bar, and a H2/CO2 ratio of 4 achieve CO2 conversion above 99%, methane selectivity exceeding 92%, and near-complete suppression of CO formation. The developed process flowsheet delivered a methane-rich stream (>92% CH4 + H2) with high yield. Economic evaluation showed that at optimal conditions, the process achieves a positive net present value (NPV) of $12.2 million (1 bar) and $1.7 million (5 bar) and a payback period as low as 0.92 years (1 bar) or 5.6 years (5 bar), depending on the pressure scenario. These results demonstrate that biogas upgrading through CO2 methanation is not only technically feasible but also economically competitive, supporting its integration into existing energy systems and contributing to the transition toward renewable fuels.

1. Introduction

The current dependence on fossil fuels continues to grow, leading to an unavoidable rise in energy consumption. As a result, greenhouse gas emissions, particularly carbon dioxide (CO2), are also increasing. This trend poses significant environmental challenges, necessitating urgent mitigation efforts. To mitigate the evident repercussions of climate change, it is imperative to stabilize the concentration of these greenhouse gases within the atmosphere. However, as the global population continues to rise and economies advance, the anticipated energy requirements now position energy as a pivotal issue of this century [1]. According to the World Meteorological Organization’s (WMO) recent report, global energy-related carbon dioxide emissions saw a rise of 2.4% in the year 2024, resulting in an increase of 1 billion tonnes and reaching a new all-time high of 41.6 billion tonnes. This occurrence is contrasted with an increase of 410 Mt in the previous year of 2023 (1.1%). Emissions attributed to coal constituted over 65% of the escalation observed in 2023 [2]. This is because about 80.9% of the global energy supply comes from fossil-fuel-based power plants such as coal, oil, and natural gas. These energy sources are the major contributors to GHG emissions [3]. In this context, replacing fossil fuel-based energy sources with renewable energy sources is the need of the hour. According to the International Renewable Energy Agency (IRENA) report, the global renewable power capacity amounted to 3870 GW at the end of 2023, reflecting a growth of 4.8% compared to the previous year. Renewables accounted for 86% of all new capacity additions, with solar energy leading the expansion at 345.5 GW, followed by wind power at 1017 GW. Asia dominated the growth, contributing 69% of the total expansion, with China alone adding 297.6 GW [4]. Biomass represents a highly promising alternative form of clean and sustainable fuel, capable of satisfying daily energy needs. Its utilization precedes the adoption of fossil fuels, including petroleum, natural gas, and coal. It makes up more than 6% of the world’s energy supply and 55% of renewable energy, making it the greatest source of renewable energy worldwide [5]. Biodiverse countries like India have significant potential for bioenergy expansion, with 25% of its primary energy coming from biomass and 70% of rural inhabitants relying on it as their main energy source. The bioenergy market is growing rapidly, meeting the energy needs of 90% of rural and 40% of urban populations, making it a key player in India’s renewable energy transition [6,7]. The utilization of biomass as an energy source can yield dual advantages, namely the mitigation of carbon dioxide emissions and enhanced fuel security, given its abundant availability. Biomass can be converted into different forms of bioenergy through thermochemical or biochemical processes, providing heat, power, or gaseous and liquid fuels. Among these, biogas—produced mainly via anaerobic digestion of organic matter—is one of the most versatile products, as it can be used directly for heating and power generation or upgraded to biomethane for use as a transport fuel.
Despite the numerous benefits of bioenergy as a clean energy source, its commercial utilization is hindered by several technical and economic barriers [8,9]. One of the major challenges that biogas faces is its poor energy density. The calorific value serves as the appropriate metric to quantify the efficiency of a fuel. On average, the calorific value of biogas is 21.5 MJ/m3, in contrast to that of natural gas, which stands at 36 MJ/m3 [10]. The disparity in calorific values between the two fuels can be primarily attributed to the non-combustible constituents of biogas, predominantly carbon dioxide. Likewise, other contaminants in biogas—such as hydrogen sulphide, ammonia, and siloxanes—can corrode upgrading equipment, damage gas engines during combustion, and impair downstream components such as pipelines, storage vessels, and purification units. Thus, to overcome this problem, one suggested solution is upgrading biogas to compressed natural gas (Bio-CNG) [11].
Raw biogas comprises roughly 50–70% methane, 30–45% carbon dioxide, and the remainder consists of contaminants such as hydrogen sulphide, ammonia, and other trace components [12]. The enhancement of biogas quality necessitates the removal of carbon dioxide, hydrogen sulphide, and water to achieve methane with a purity level exceeding 98% [13]. This refined product is referred to as bio-methane with a calorific value of about 36 MJ/m3 and demonstrates efficiency levels comparable to compressed natural gas (CNG) [14]. A plethora of well-established technologies currently exist for converting biogas into biomethane, which are notably efficient and possess the potential to facilitate a sustainable pathway for future CNG requirements [10].
Established biogas upgrading techniques for producing bio-CNG include physical/chemical adsorption methods such as PSA and water scrubbing, as well as membrane separation, all of which are commercially proven and widely deployed. These methods, however, often involve high energy consumption, operational costs, and challenges such as selectivity or the generation of secondary waste streams. In comparison, catalytic methanation offers an emerging in-situ upgrading pathway, where CO2 present in raw biogas is directly converted into CH4 by reaction with renewable hydrogen. This not only enhances the methane content to meet bio-CNG standards but also eliminates the need for downstream separation steps, making it a potentially more integrated and sustainable option. Nevertheless, methanation is still at the demonstration stage relative to conventional technologies, and practical issues such as hydrogen supply, heat removal, and catalyst stability remain critical for large-scale deployment [10].
Hydrogen (H2) is a promising sustainable fuel due to its high energy density, rapid combustion, and zero greenhouse gas emissions [15]. However, its production method significantly impacts its environmental carbon footprint. Grey hydrogen, produced via steam methane reforming, generates substantial CO2 emissions, while blue hydrogen, derived from natural gas, mitigates emissions through carbon capture and storage [16]. A more sustainable alternative, biogenic hydrogen (Bio-H2)-enriched compressed natural gas (Bio-H-CNG), is gaining attention for its compatibility with existing transportation infrastructure and potential environmental benefits [17]. Biogas dry reforming, a highly endothermic process, is emerging as a key pathway for hydrogen production by converting methane (CH4) and carbon dioxide (CO2) into valuable fuels [18]. Optimizing reaction conditions, such as temperature and catalyst selection, is essential to improving efficiency and minimizing side reactions like the reverse water-gas shift, ultimately enhancing hydrogen yield and sustainability [19].
H2 blending in the natural gas industry is a strategic approach to enhance fuel properties while reducing greenhouse gas emissions. Hydrogen/natural gas blends have reported calorific values in the range of 30–36 MJ/m3, depending on the hydrogen fraction, which is slightly lower than that of pure natural gas (~39 MJ/m3). Hydrogen-enriched natural gas exhibits higher combustion efficiency and increased flame speed, leading to cleaner and more efficient fuel utilization. Unlike other fuel modifications, this process does not require additional blending steps, as hydrogen can seamlessly integrate into the existing natural gas infrastructure without major alterations [20]. Studies indicate that hydrogen blends up to 20% by volume can be transported through conventional pipelines and utilized in combustion systems without safety concerns or significant efficiency losses [21,22]. As the industries move towards decarbonization, hydrogen blending presents a cost-effective and scalable pathway to enhance fuel sustainability while leveraging the existing gas distribution network.
While previous studies have primarily focused either on the technical aspects of biogas upgrading or on economic feasibility in isolation, they often neglect the integrated perspective needed for practical large-scale deployment. Many works also assume idealized conditions without accounting for real-world constraints such as energy integration, hydrogen sourcing, and pressure-related trade-offs, which significantly influence process viability [13,23]. This study overcomes these limitations by combining equilibrium, kinetic analyses, detailed Aspen Plus (v14.0, Bedford, MA, USA) simulations, and techno-economic evaluations within a single framework. By addressing both technical optimization and economic sustainability, it provides a more comprehensive understanding of the conditions necessary for scalable and cost-effective Bio-CNG production.
In this work, we explore the potential of capital investment in biomethane production by upgrading biogas while carefully evaluating technical and economic parameters. Thus, the aim of this paper is twofold: Firstly, to obtain the optimal operating conditions for the effective conversion of biogas to Bio-CNG with a decent methane purity level. Secondly, to analyze the economic parameters of the biogas-to-Bio-CNG conversion process and identify the ideal conditions for achieving high conversions.

2. Methodology

2.1. Equilibrium Studies Investigation

Equilibrium analyses are crucial before executing process plant simulation to ensure accurate modelling of reaction systems. These studies help determine the extent of chemical reactions, providing insights into key parameters such as reactant conversion, product selectivity, and reaction feasibility under different temperatures, pressures, and composition conditions. Reaction equilibria define the balance between forward and reverse reactions, allowing the prediction of the final composition of reaction mixtures.
By analyzing Gibbs free energy minimization and equilibrium constants for the reactions listed in Table 1, equilibrium studies aid in identifying the most favorable operating conditions to maximize desired product yield while minimizing byproducts. Such evaluations help validate the thermodynamic consistency of ASPEN simulations by selecting the appropriate reaction models, ensuring that calculated equilibrium compositions align with experimental data. Moreover, equilibrium studies prevent unrealistic simulations, such as conditions where reactions may not proceed efficiently or lead to incomplete conversions.
Since ASPEN simulations rely on thermodynamic models to predict enthalpy, entropy, fugacity, and activity coefficients, equilibrium analyses are essential for selecting the correct reaction kinetics and thermodynamic frameworks (as shown in Figure 1). Equilibrium analyses facilitate the validation and selection of the pertinent thermodynamic models and parameters. Inaccurate thermodynamic assumptions could result in significant deviations in the simulation outcomes. In this work, we initiated the analysis with an equilibrium reactor (REquil) to understand the equilibrium composition of the product stream. We then performed the sensitivity analysis to understand the role of temperature, pressure, and feed ratios on conversion and product selectivity. To account for non-ideal behaviour, the Peng-Robinson equation of state model was employed [24].
Thus far, a significant portion of the carbon dioxide extracted from biogas in traditional biomethane upgrading processes (approximately one-third of the total biomethane generated) is discharged into the atmosphere. The objective is to mitigate this emission and to facilitate the conversion of this carbon dioxide, in conjunction with hydrogen, into methane. The fundamental reaction employed for the methanation process is referred to as the Sabatier reaction. This reaction is a linear combination of the CO methanation reaction and the reverse water gas shift reaction [25].
The expressions given below were used to calculate the CO2 conversion (%), methane selectivity (%), methane yield (%), and selectivity of CO (%).
Conversion   of   CO 2   % =   1 F CO 2 , out F CO 2 , in × 100
Selectivity   of   CH 4   % =   F CH 4 , out F CH 4 , out + F CO , out × 100
Selectivity   of   CO   % =   F CO , out F CO , out + F CH 4 , out × 100
where F CO 2 , in is the molar flow rate of CO2 flowing into the reactor, F CO 2 , out , F CH 4 , out , and F CO , out are the molar flow rates of CO2, CH4, and CO flowing out of the reactor.

2.2. Development of Flowsheet

2.2.1. Non-Recycling Approach

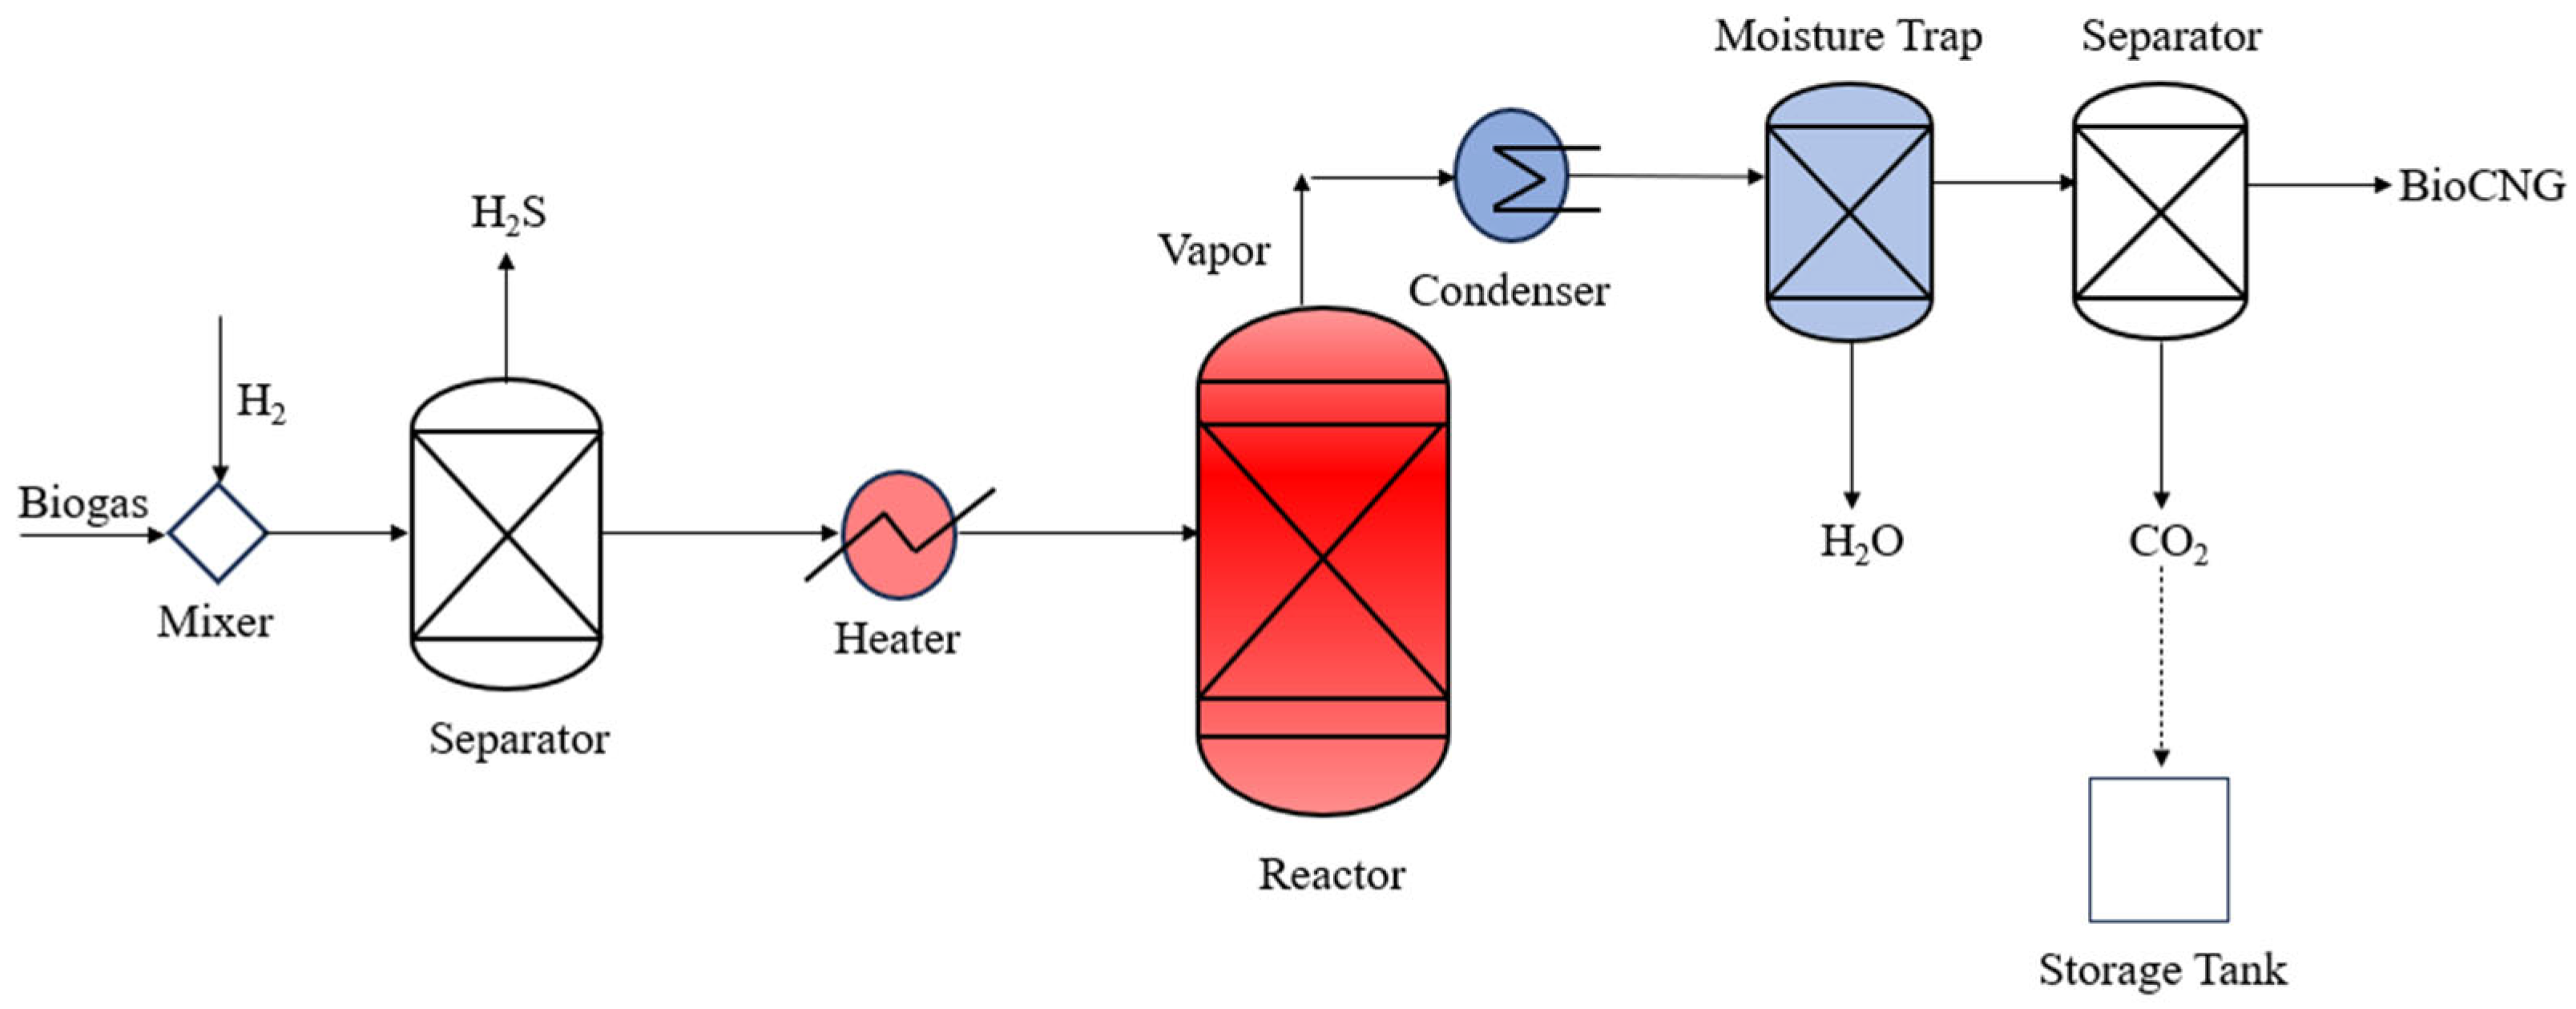
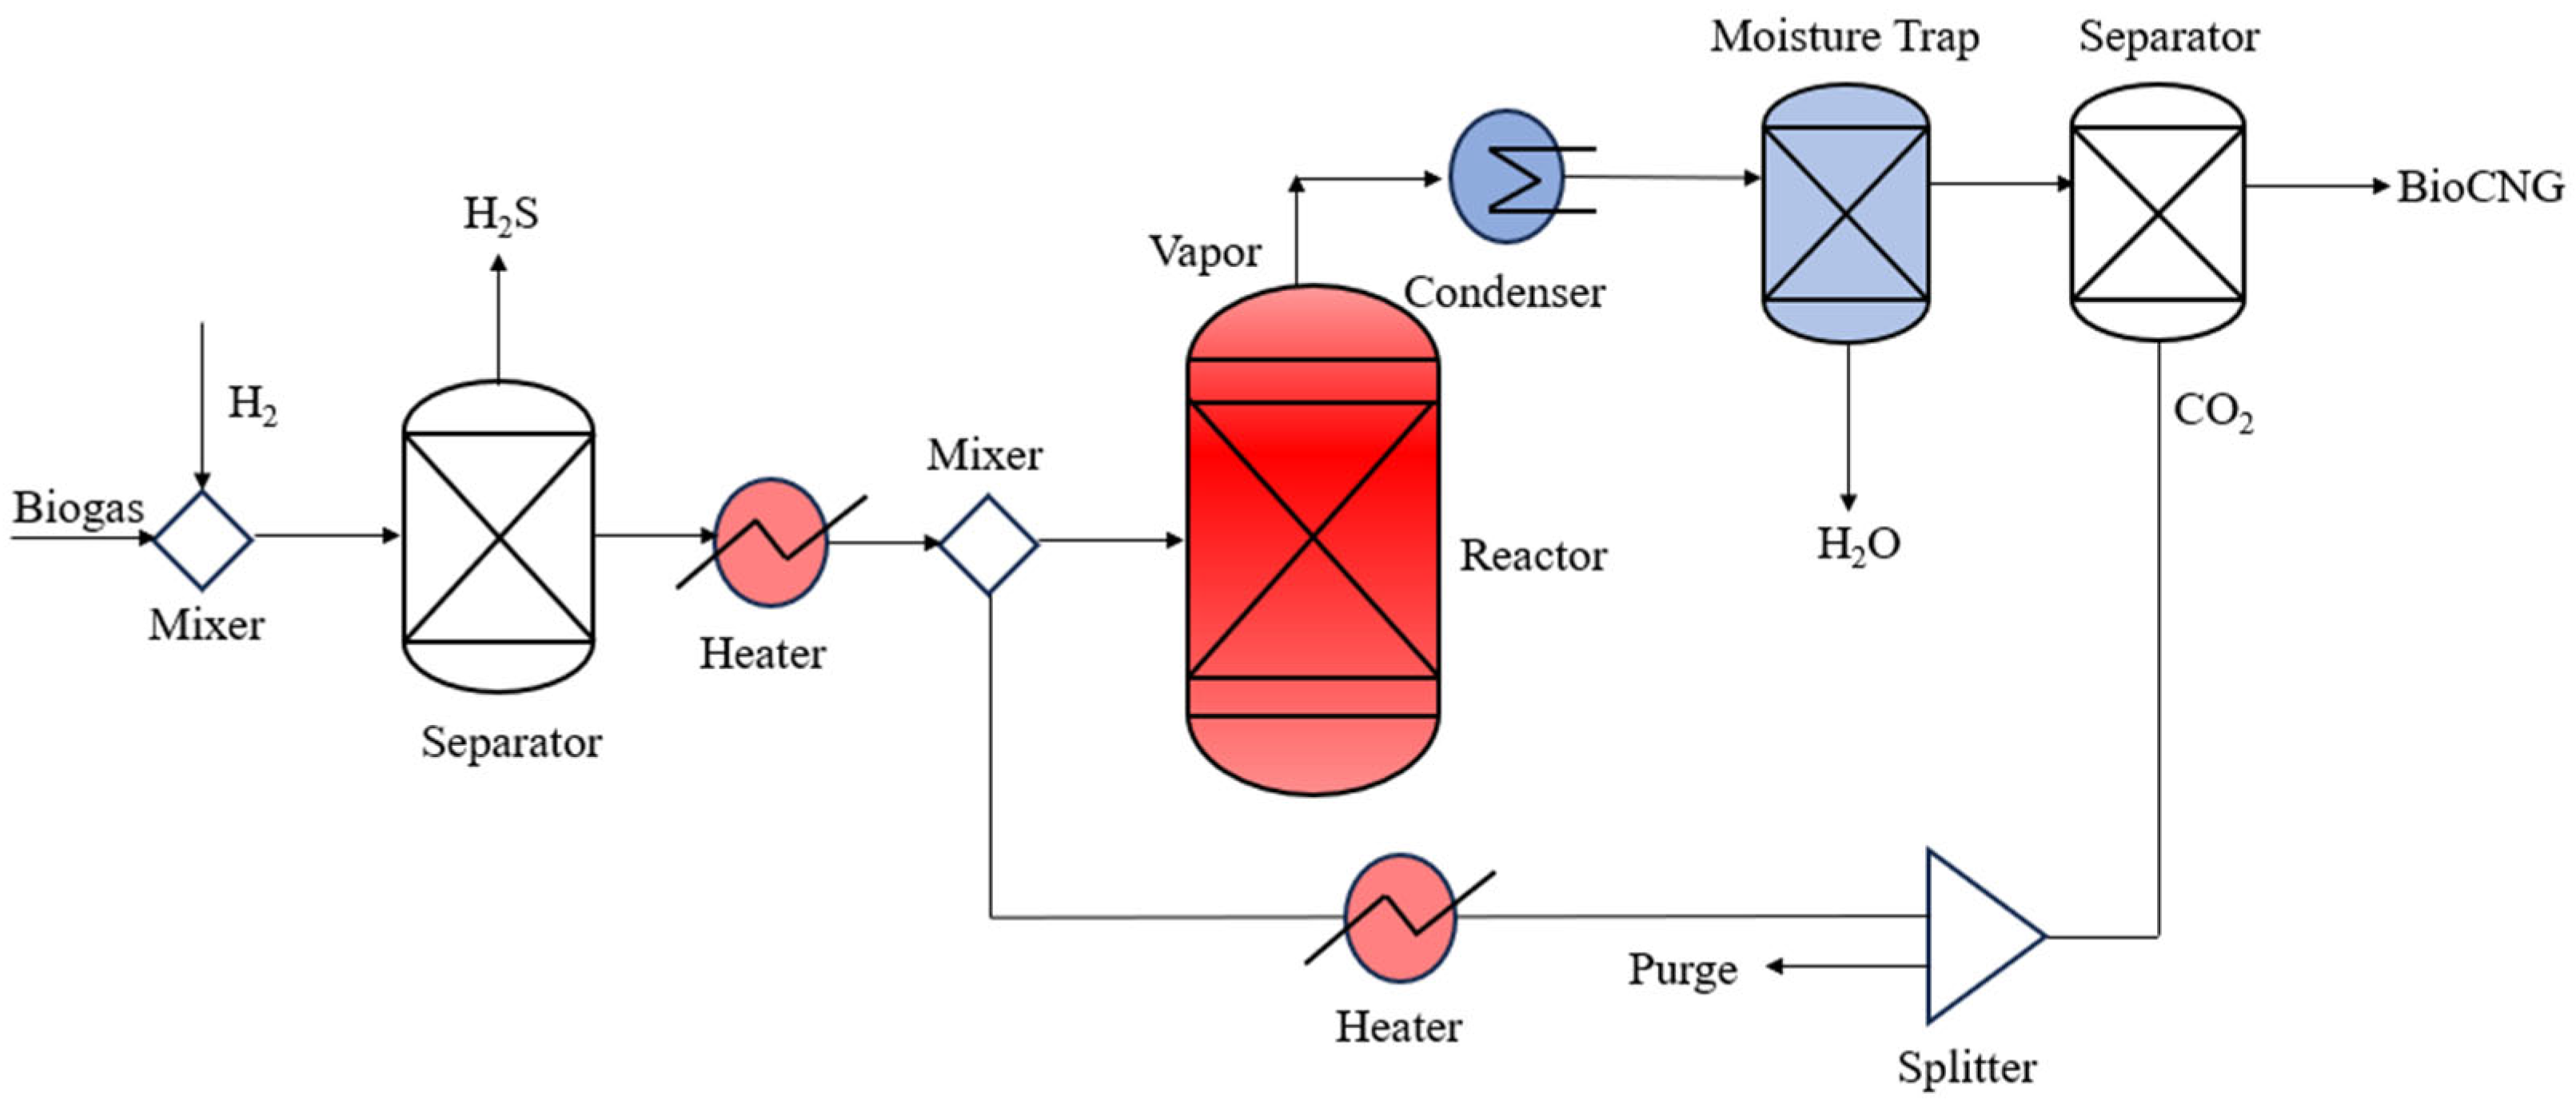
In this study, a comprehensive process flowsheet was developed for the efficient conversion of biogas into Bio-CNG using Aspen Plus v14.0. The process utilizes two primary inlet streams: pure hydrogen and impure biogas with composition highlighted in Table 2, both supplied at standard conditions of 1 bar pressure and 25 °C temperature. Initially, stoichiometric quantities of hydrogen were introduced, and the simulation was performed for the non-recycling configuration (refer to Figure 2). Subsequently, a recycling approach was implemented (refer to Figure 3), where stoichiometric amounts of CO2 were recycled to the kinetic reactor using the optimized operating conditions obtained from reaction equilibria analysis. However, it was observed that varying the recycle ratios resulted in excess CO2 being supplied to the reactor feed. To address this, additional make-up hydrogen was introduced to compensate for the increased CO2. The final molar flow rates for the impure biogas and hydrogen streams were set at 100 kmol/h and 150 kmol/h, respectively.
The biogas composition predominantly comprises methane (50%) and carbon dioxide (35%), with minor concentrations of hydrogen sulphide (H2S) at 0.036% or 360 ppm [26]. To ensure effective stream amalgamation, a mixer unit operation was employed to generate an outlet stream designated as FEED. The removal of H2S from the FEED stream is a critical step in the process. Even at trace concentrations, H2S poses severe health and environmental hazards due to its toxicity and corrosive properties, which can compromise infrastructure integrity. Consequently, a dedicated H2S removal unit was incorporated into the flowsheet [27]. A commonly adopted method is the use of a guard bed, typically packed with iron-based or other reactive sorbents, which selectively adsorb and convert sulfur species into stable sulfides. This protective unit acts as a front-end barrier, ensuring that trace SOx contaminants are efficiently captured before the gas enters the upgrading section. Guard beds are simple to operate, compact, and highly effective at achieving very low outlet sulfur concentrations, thereby enhancing process reliability and extending the lifetime of upgrading equipment and catalysts [28,29]. The treated stream is then preheated to 300 °C in a heater unit before being introduced into the reactor. The reactor operates at 300 °C and 1 bar, facilitating various reactions, including CO2 hydrogenation, CO hydrogenation, and reverse water-gas shift, aimed at converting biogas components into methane, the primary constituent of CNG.
A kinetic reactor was employed for the simulation of CO2 methanation in ASPEN Plus [30]. The high conversions predicted are not merely theoretical but can also be achieved experimentally under optimized conditions. Numerous studies have demonstrated that with the right choice of catalysts, particularly highly active and selective materials such as Ni-based catalysts promoted with elements like Ce, Zr, or Mn, near-equilibrium CO2 conversions are attainable at relatively moderate temperatures and pressures. Additionally, advances in catalyst design, including enhanced dispersion, strong metal-support interactions, and innovative reactor technologies like plasma-assisted systems, have significantly improved CO2 activation and hydrogenation kinetics. As a result, the experimental realization of high CO2 conversions, approaching equilibrium limits, is increasingly feasible, supporting the validity of the simulation results and highlighting the practical potential of the methanation process for renewable fuel production [31,32,33,34]. The conversions at the chosen operating conditions in our simulations are in good agreement with full-scale results reported by Dannesboe et al., where a 10 Nm3 h−1 catalytic reactor achieved stable CO2 conversion and methane selectivity under comparable temperatures and H2/CO2 ratios. This consistency supports the validity of our chosen parameters [35,36].
Following the reactor, the effluent undergoes further purification to enhance methane concentration and remove residual impurities. Initially, the reactor effluent is processed through a flash drum and a moisture trap to eliminate water. The resulting dry stream is directed to a separator unit designed to remove residual CO2, thereby enriching the methane (CH4) and hydrogen (H2) concentrations. In the non-recycling approach, the combined CH4 and H2 concentration reaches 92.57%.

2.2.2. Recycling Approach

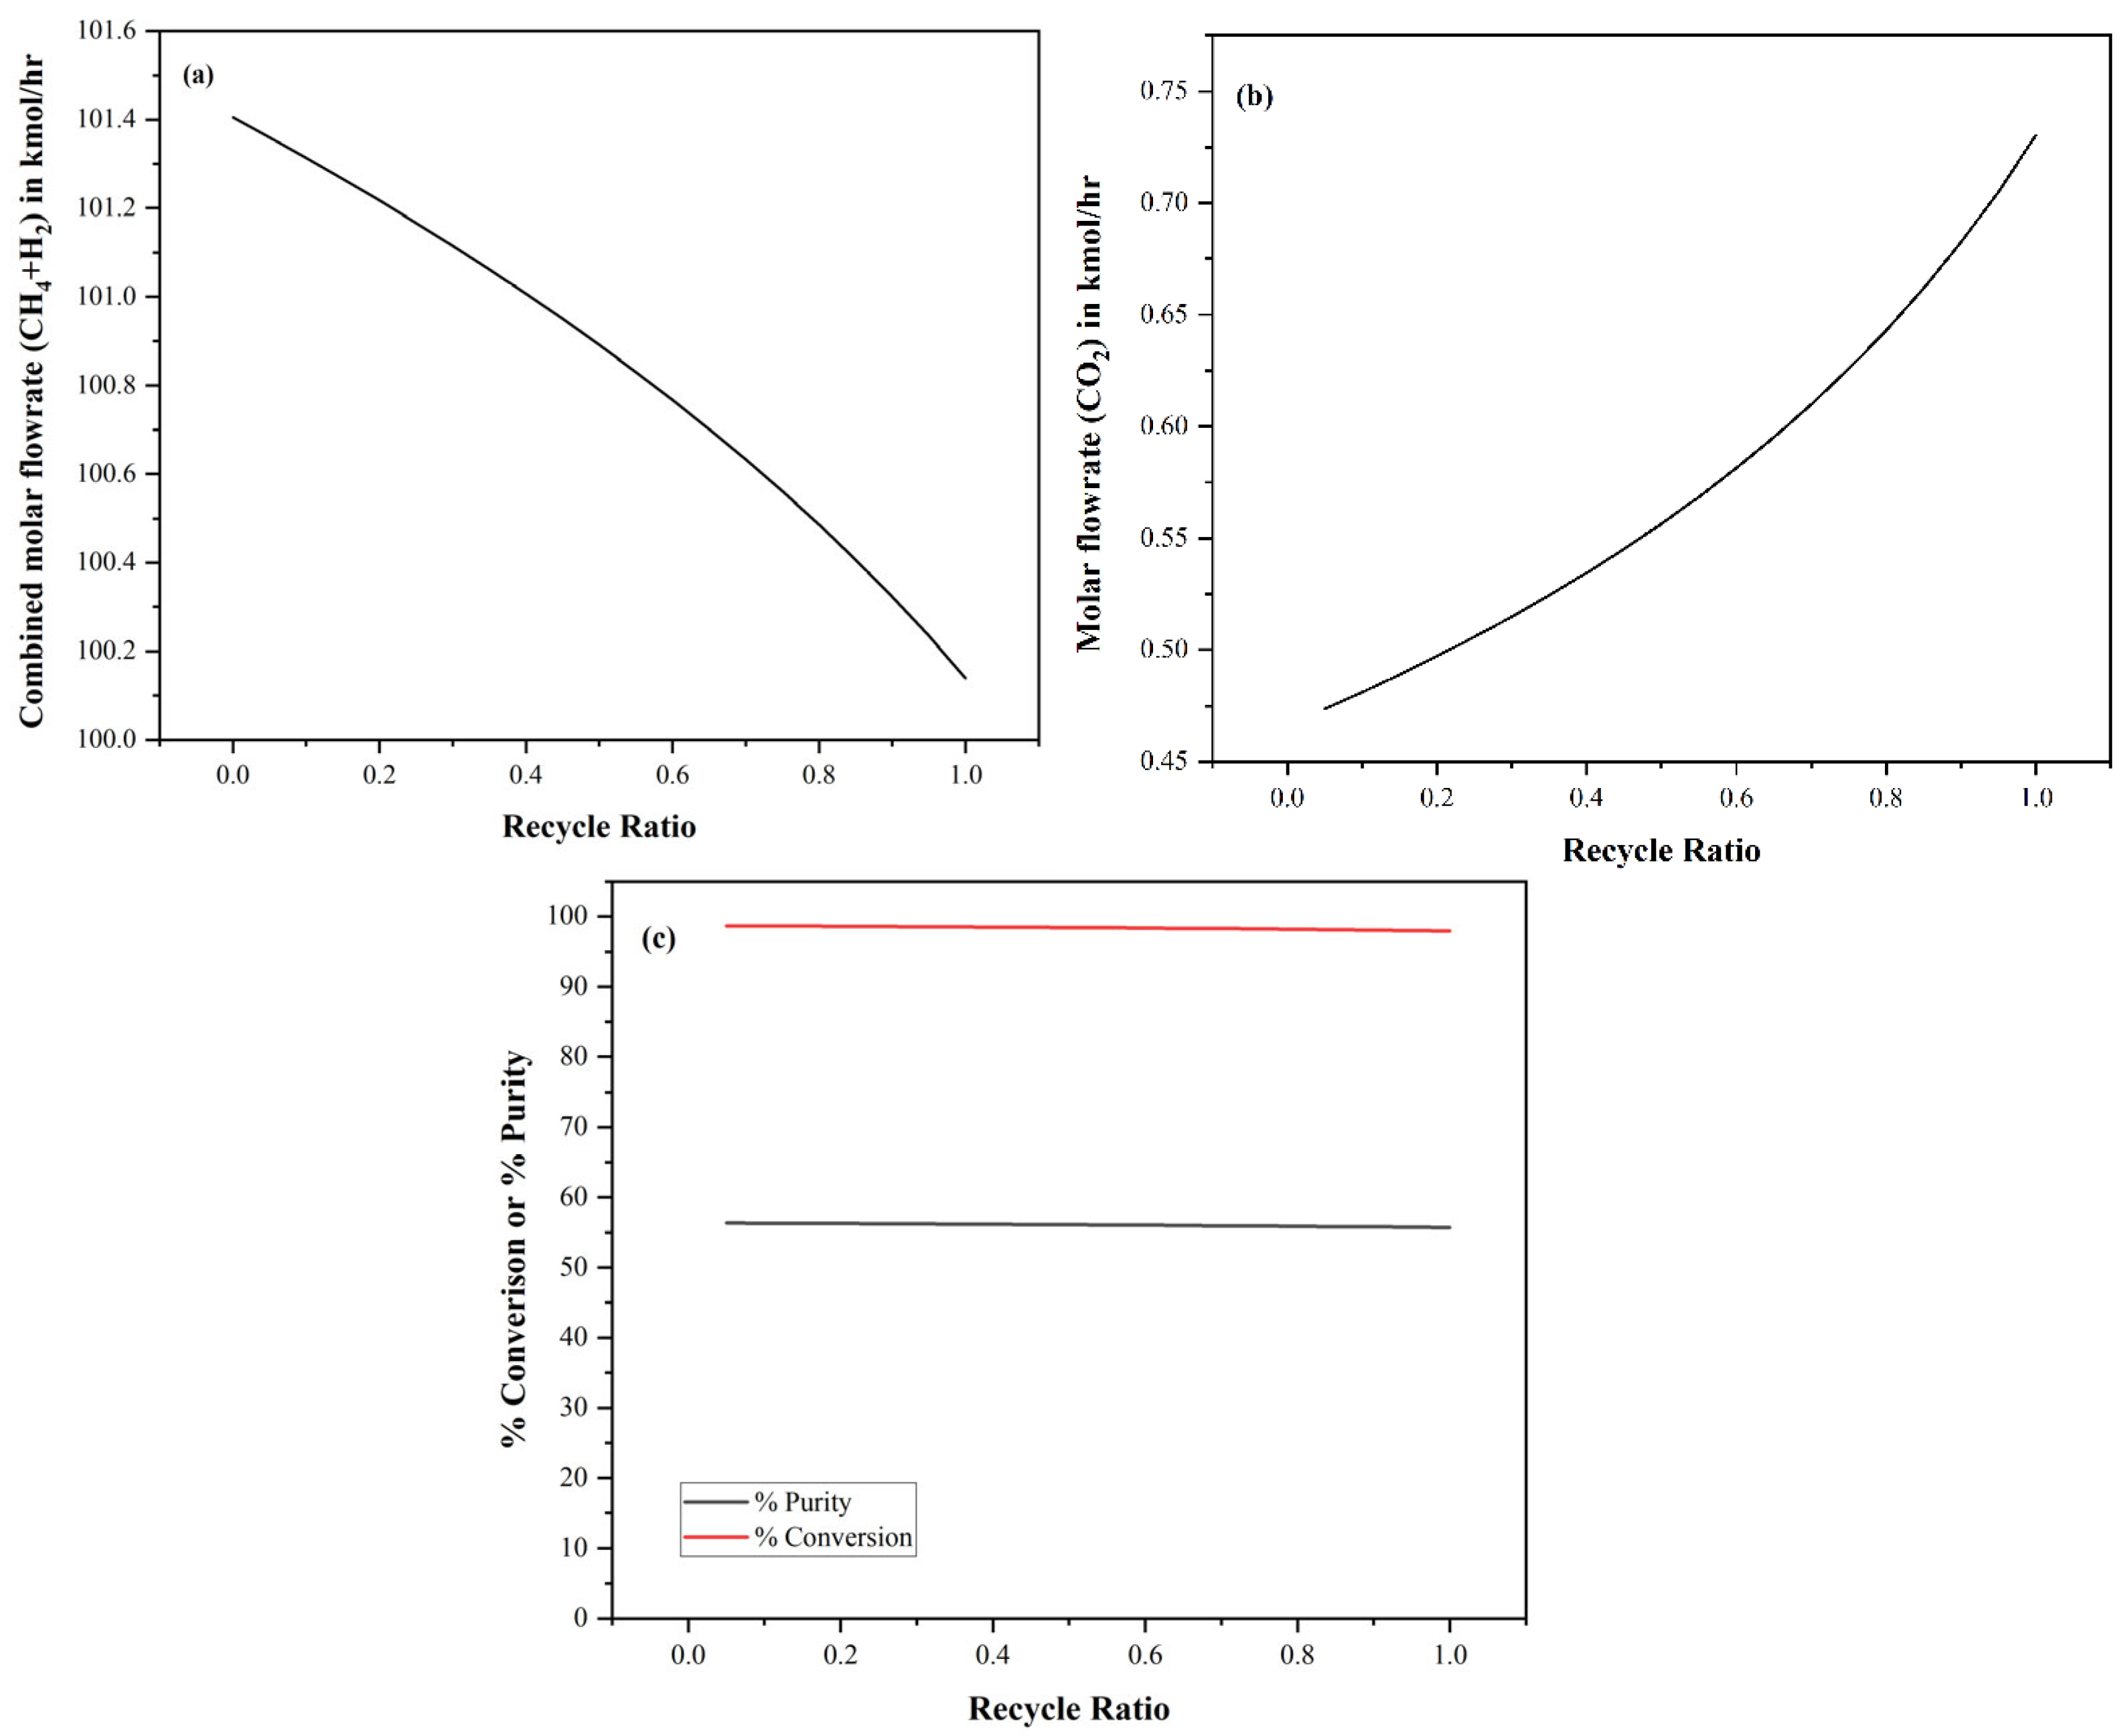
To optimize the recycling process, a splitter was integrated to regulate the recycle-to-purge ratio, ensuring efficient utilization of reactants. A detailed analysis was conducted to assess the impact of varying split fractions on the molar flow rates of CH4 and H2 and the overall conversion efficiency. The results indicate that as the recycling split fraction increases, the total molar flow rates of CH4 and H2 decline, while the CO2 concentration rises within the system. The graph shows the variation in combined molar flowrate of CH4 and H2 with respect to the recycle ratio. As the recycle ratio increases, more H2 is consumed in the methanation reaction, resulting in increased CH4 formation but an overall decrease in the combined CH4 + H2 flowrate due to the larger reduction in unreacted H2. However, as depicted in Figure 4, beyond a certain threshold, variations in conversion and product purity become negligible with further increases in the recycling split fraction.
Interestingly, it was observed that the amount of CO2 being recycled back into the system remained insignificant, even when the recycle ratio was set to 0.9. Given this outcome, it was determined that storing the separated CO2 would be a more effective approach than continuing with a recycling configuration. Consequently, the non-recycling strategy was deemed preferable for process optimization.

2.3. Techno-Economic Analysis

The ASPEN Economic Analyzer was used to evaluate the technical feasibility and economic viability of converting raw biogas to Bio-CNG, which is suitable for use as a renewable fuel. By integrating economic analysis along with the equilibrium studies and development of a flowsheet, the study aims to optimize the biogas to Bio-CNG pathway and support the transition towards sustainable energy solutions. The estimated costs of various equipment employed in Figure 3 have been presented in Table S1.
The reactor dimensions were determined based on a Gas Hourly Space Velocity (GHSV) of 20,000 h−1, ensuring optimal residence time for the reaction. A packed bed porosity of 0.4 was assumed, with a catalyst bulk density of 1030 kg/m3 [37]. To accommodate potential variations in packing and flow distribution, the total reactor volume was set to three times the packed bed volume, a standard engineering design practice adopted in industrial applications. The reactor vessel was designed with a length-to-diameter ratio (L/D) of 10, following standard industrial practices.
For cost estimation, the free-on-board (f.o.b.) purchase cost was adjusted by a factor of 1.05 to account for equipment transportation to the plant site. The Lang factors for fluid processing plants were utilized to estimate total direct and indirect costs. In addition to equipment and utility costs, the techno-economic assessment also considers the costs associated with the catalyst and the H2S adsorbent used in the process. Both the procurement and regeneration expenses of these materials were included in the analysis to provide a more comprehensive estimation of operating costs and long-term process feasibility [30]. Additionally, cost estimation methodologies and factors considered in similar techno-economic analyses were considered to ensure accuracy and consistency in evaluating the economic feasibility of the process. The following equations were used to calculate the total capital investment and direct and indirect costs in Table S2 [38].
T C I = F C I + W C I = D C + I C + W C I
D C   &   I C =   L a n g   F a c t o r   ×   C o s t   u n d e r   e a c h   c a t e g o r y
At 1 bar, the total capital investment is approximately $1.65 million. In comparison, at 5 bar, it increases significantly to about $6.8 million, driven mainly by higher equipment, installation, and service facility costs at elevated pressure. The depreciation cost was calculated using a linear depreciation method, considering a salvage value of 20%. Table S3 outlines the key assumptions used in determining the Total Product Cost (TPC).
The Total Plant Profit (TPP), Net Cash Flow, Payback Period, and Net Present Value (NPV) were computed using the following equations [38]:
T P P = T P C T P S
N e t   C a s h   F l o w = T P P + D e p r e c i a t i o n
P a y b a c k   P e r i o d =   T C I N e t   C a s h   F l o w
N P V =   N e t   C a s h   F l o w t 1 + d i s c o u n t   r a t e t   I n i t i a l   I n v e s t m e n t

3. Results and Discussion

3.1. Influence of Temperature on Gibbs Free Energy

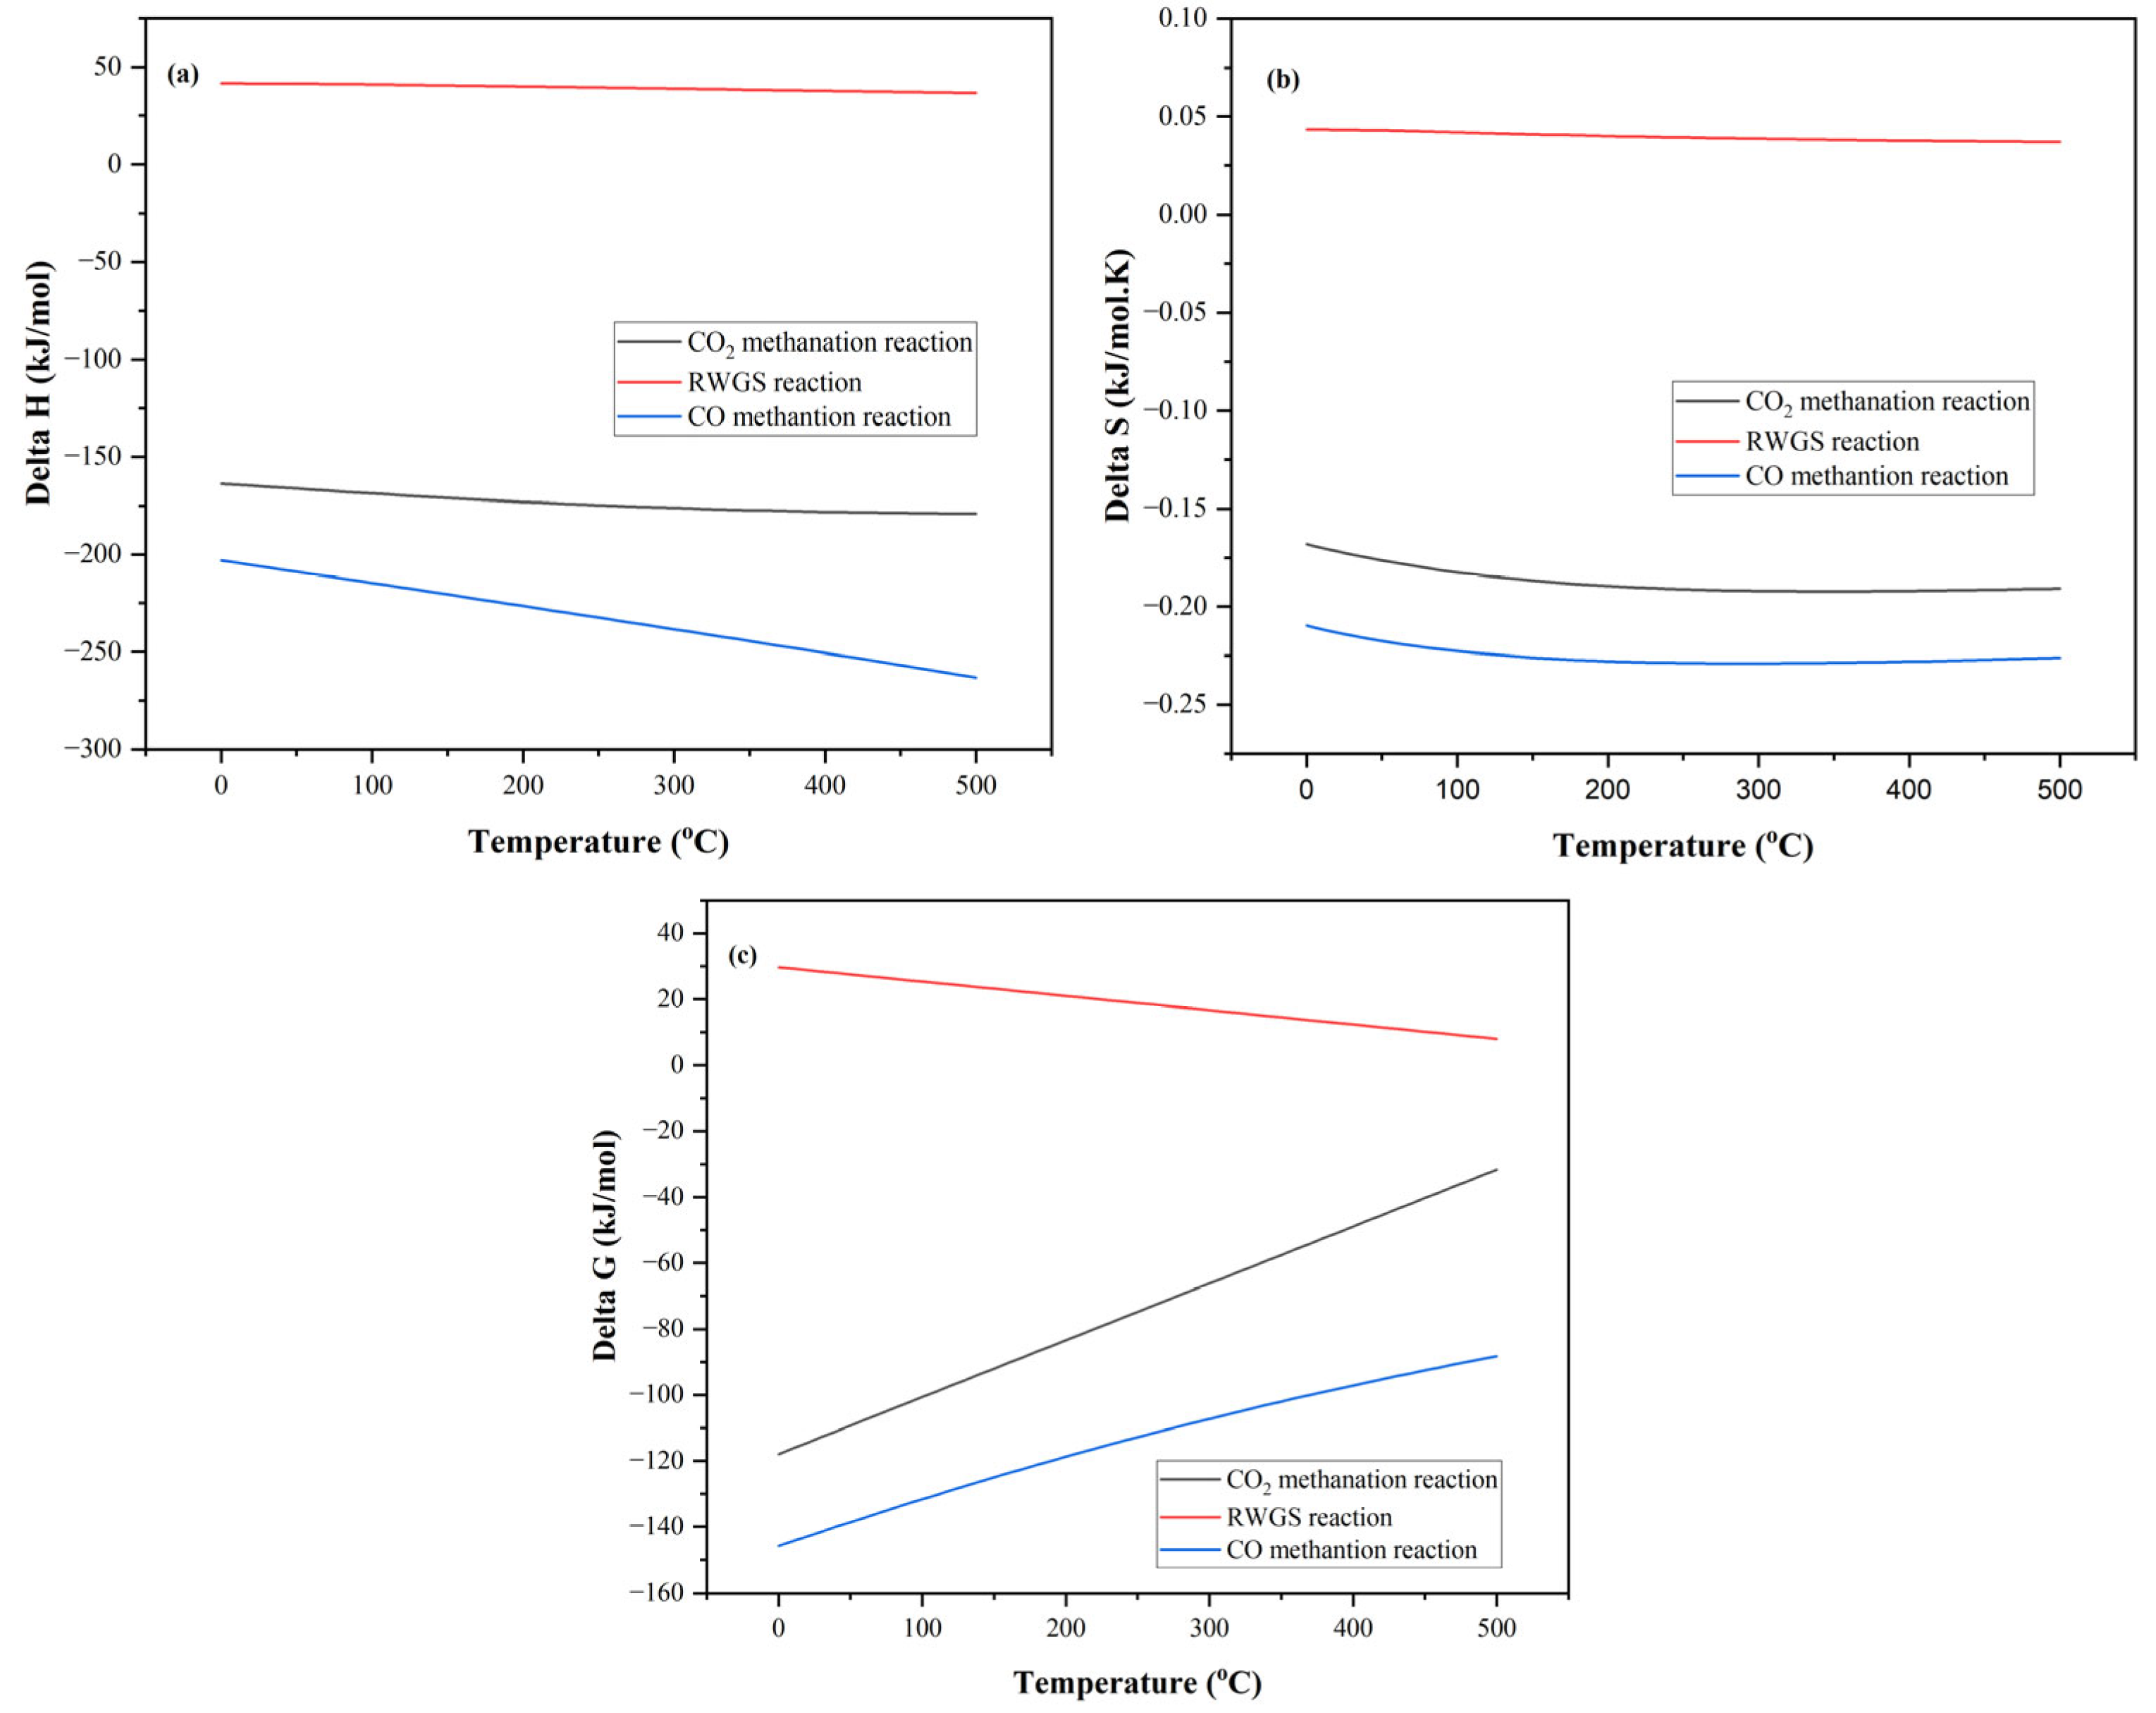
The feasibility and spontaneity of chemical reactions are largely dependent on how temperature affects thermodynamic parameters. In this setting, the fundamental thermodynamic quantity, Gibbs Free Energy, is crucial. The relationship between temperature and Gibbs Free Energy for several chemical processes is shown in Figure 5. Interestingly, the plot shows that the Gibbs free energy change for the RWGS process decreases with increasing temperature. This decrease suggests that the RWGS reaction is more favorable at higher temperatures. On the other hand, the Gibbs free energy of the CO2 and CO methanation processes rises with temperature, indicating that these reactions are more advantageous at lower temperatures.
Furthermore, entropy sheds more light on the thermodynamic behaviour of chemical processes by measuring the degree of disorder in a system. The observed negative entropy change for CO2 and CO hydrogenation suggests that the system’s disorder reduces with increasing temperature, indicating exothermic behaviour where heat is lost throughout the reaction. A steady decrease in entropy values with temperature for the RWGS reaction indicates minor changes in disorder in the reaction system.
Duyar et al. studied the thermodynamics of the RWGS reaction in detail to understand its implications on catalyst design [39]. Numerous scholars have likewise conducted investigations into the thermodynamic evaluation of diverse carbon dioxide methanation processes [40,41,42,43]. These investigations highlight the complex interactions between thermodynamic characteristics and temperature, clarifying their significant influence on the viability and energetics of chemical processes.

3.2. Influence of Temperature and Pressure

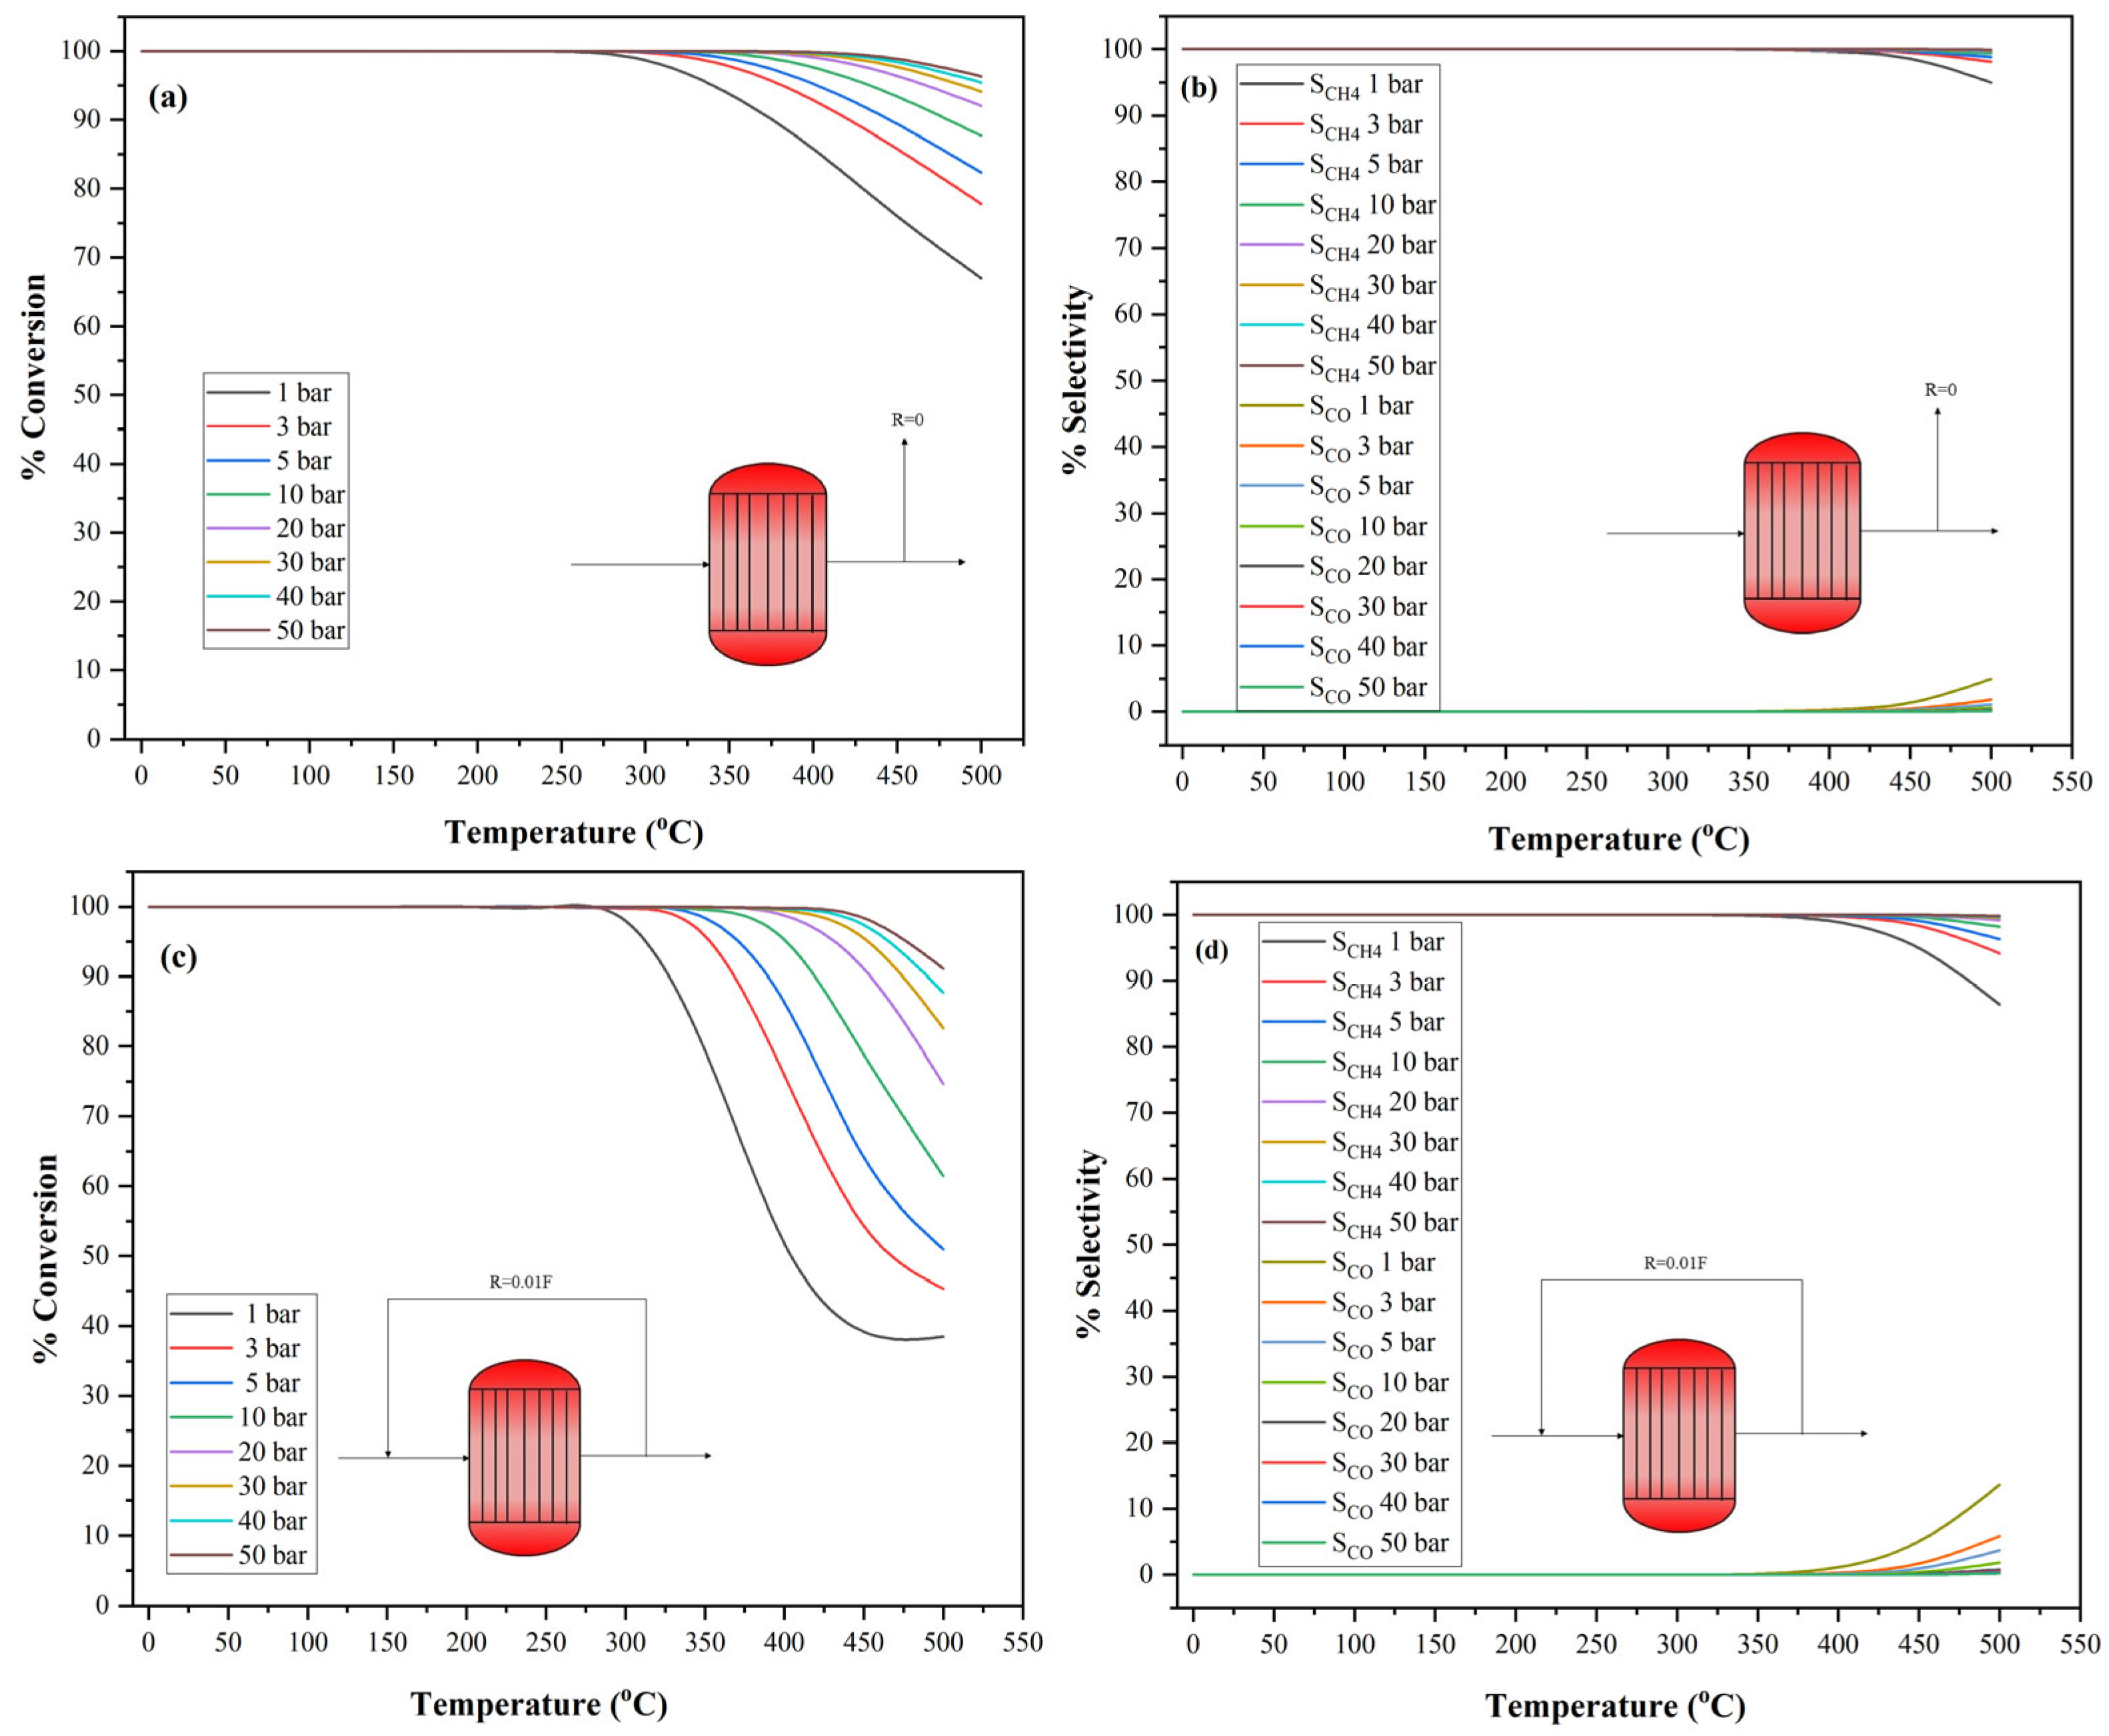
The effects of temperature and pressure were examined on key performance indicators (KPIs). The three main KPIs that we analyse are CO2 conversion, CO selectivity, and CH4 selectivity (refer to Figure 6). Finding the ideal temperature and pressure settings to maximize CO2 conversion and CH4 selectivity while minimizing CO selectivity is the main objective.
Numerous studies have been conducted to determine the optimal operating conditions for various reactions. Santos et al. simulated the influences of temperature, pressure, and feed ratio on the RWGS reaction. Their thermodynamic analysis revealed that the appropriate conditions for the RWGS reaction are 750 °C and 20 bar with a feed ratio of 0.8 [44]. Kim et al. optimized the operating conditions of the CO2 methanation reaction using Ni-based catalysts. They observed the comparative significance of the principal variables impacting CO2 conversion and CH4 yield. These were prioritized in the following order: reactor pressure > space velocity > reaction temperature [45].
Because they are exothermic, both the CO2 and CO methanation processes perform well at lower temperatures [46]. In contrast, due to its endothermic nature, the reverse water-gas shift (RWGS) reaction favors higher temperatures [47]. According to our analysis, CO2 conversion is improved at lower temperatures and greater pressures. More specifically, CO2 conversion drops drastically from 99.96% to 38% as the temperature rises from 300 °C to 500 °C at a pressure of 1 bar for the recycling approach. The conversion drops from 99.9% to 66.9% for the non-recycling approach. The yield and selectivity of CH4 within the same temperature range likewise show this tendency. However, the selectivity of CO increases drastically as the temperature increases.
As a result, the analysis indicates that temperatures between 300 °C and 400 °C and pressures between 1 and 5 bar are the optimal ranges for converting CO2 to CH4. The ideal pressure for the conversion process is 1 bar, even though higher pressures are theoretically more beneficial due to practical limitations, including economic ones.

3.3. Influence of H2/CO2 Ratio

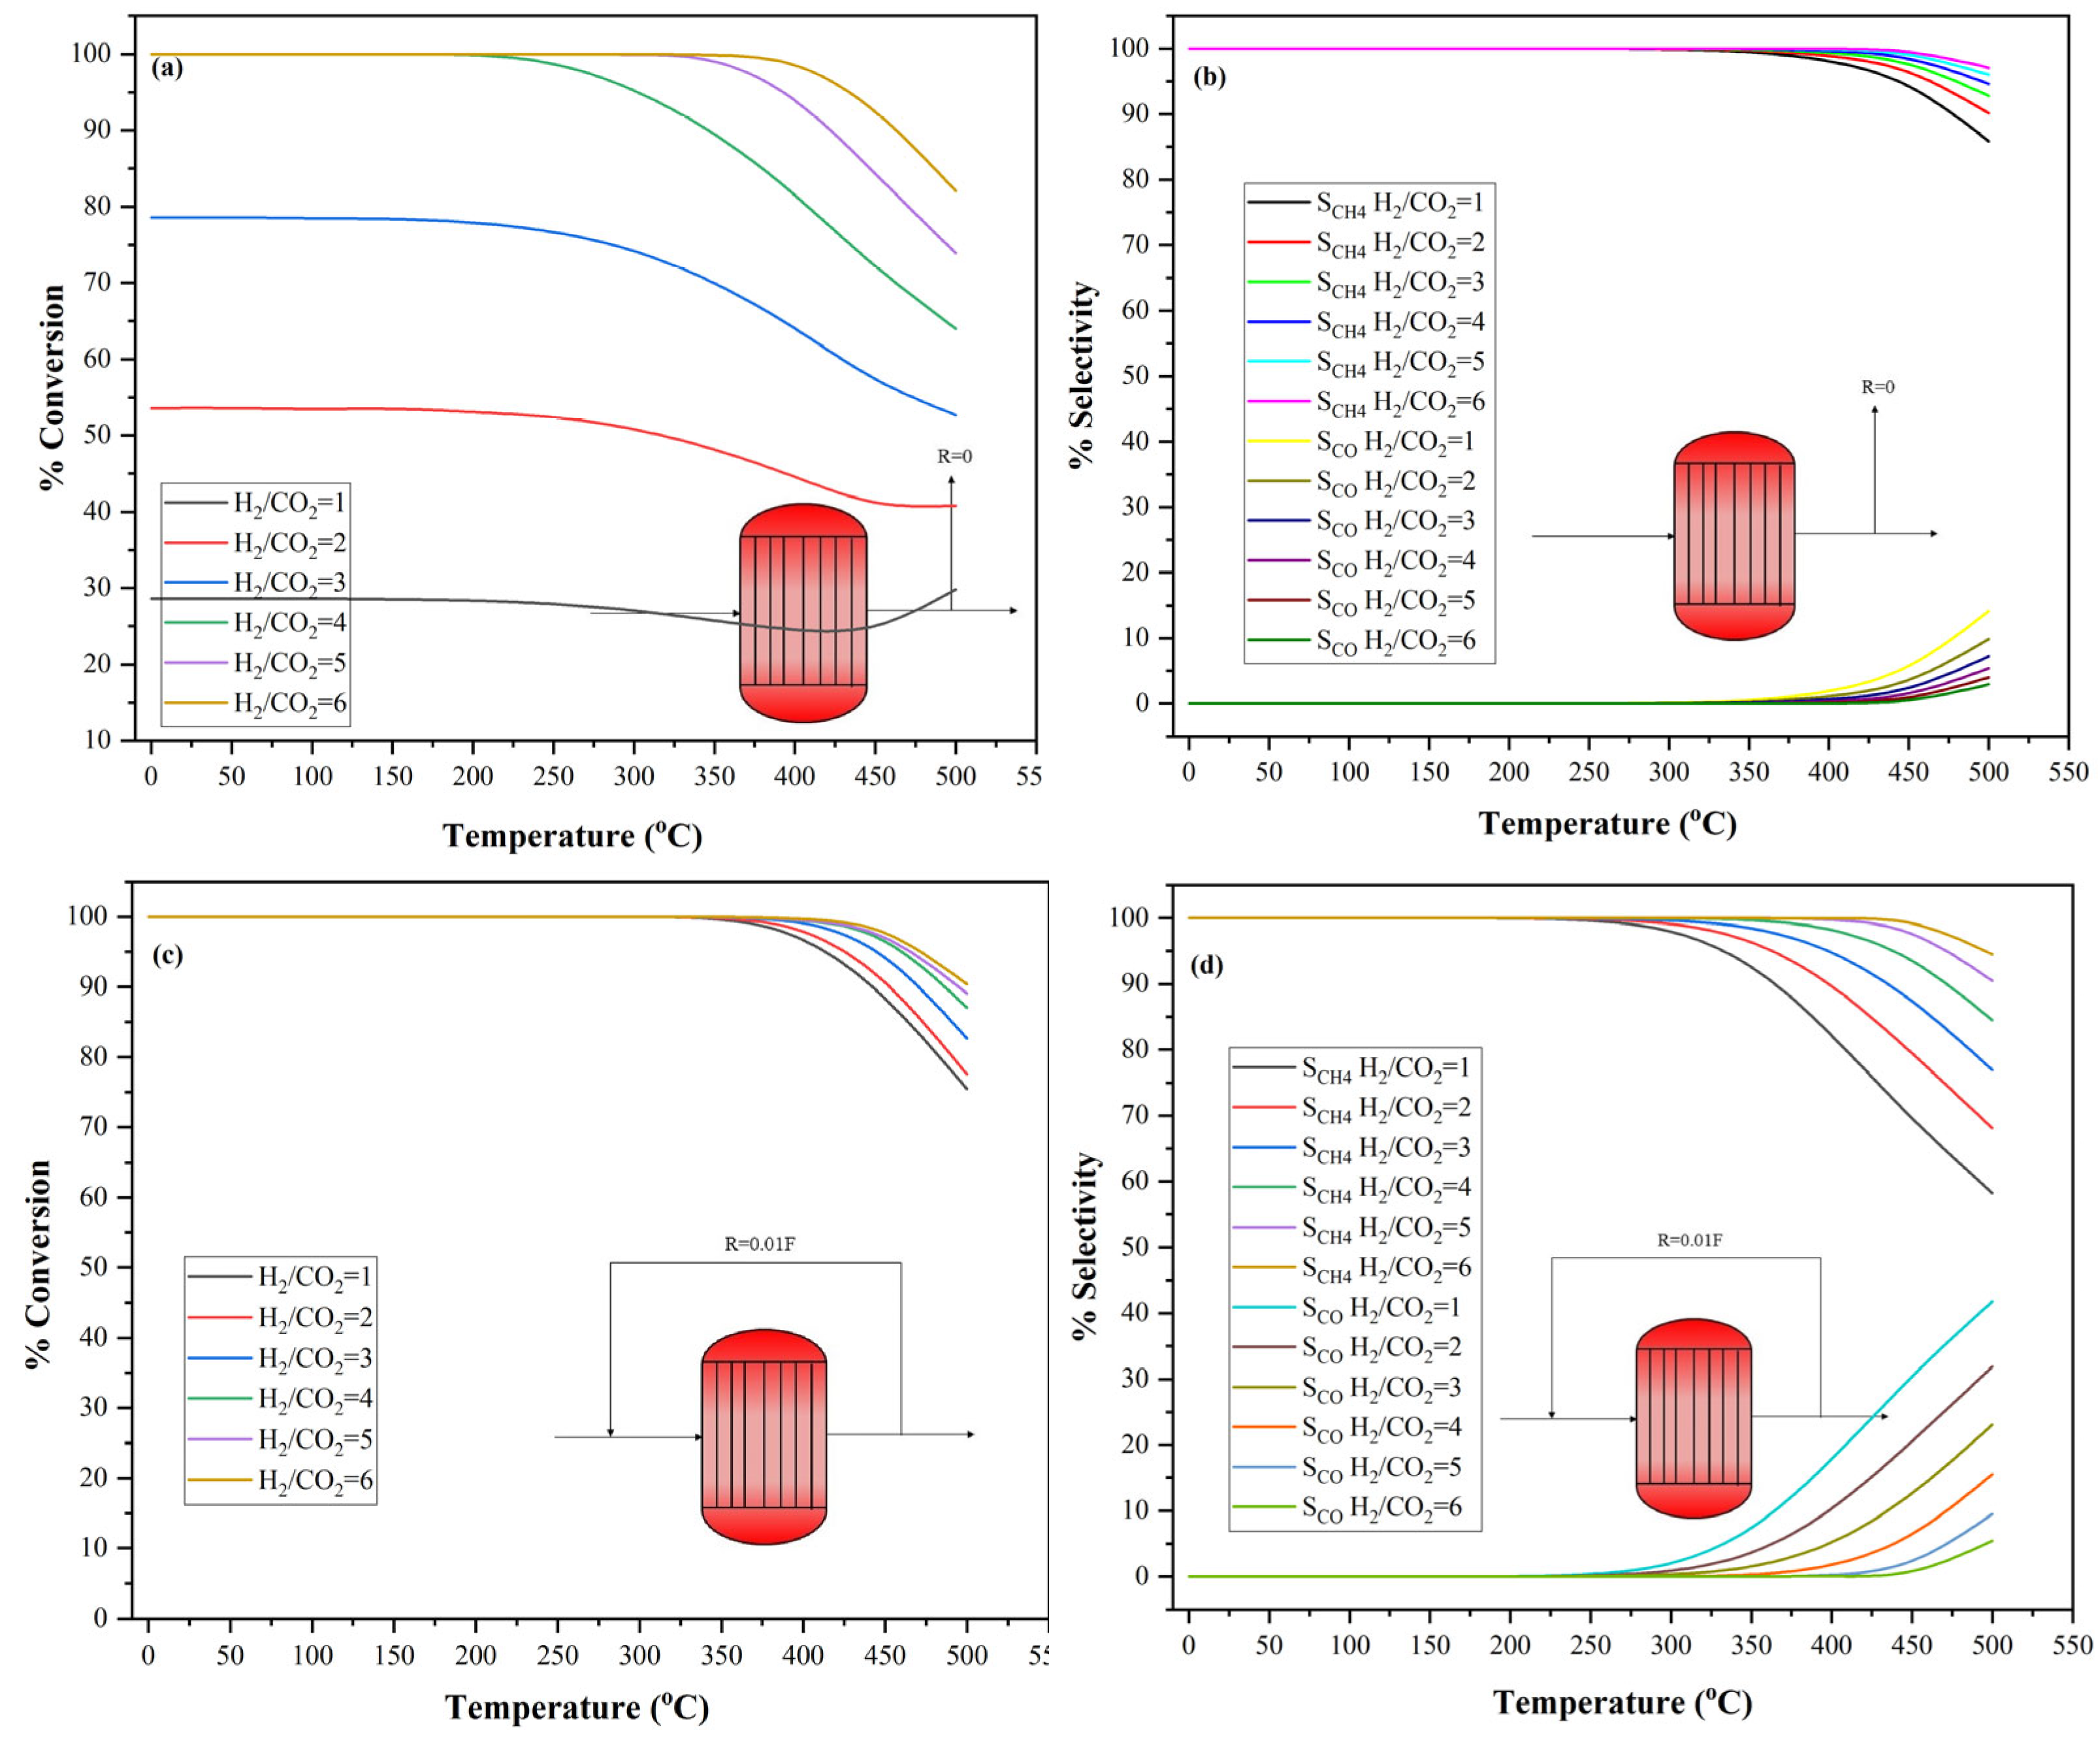
In order to thoroughly investigate how feed composition affects key performance indicators (KPIs), the temperatures varied from 0 to 500 °C, and the pressure was fixed at 1 bar while the H2/CO2 mole ratio varied from 1 to 6.
The H2/CO2 ratio and CO2 conversion were found to be directly correlated. Larger ratios resulted in higher rates of CO2 conversion. For example, the CO2 conversion rate varied from about 75% for H2/CO2 = 1 to over 90% for H2/CO2 = 6 at a constant temperature of 500 °C with recycle and from about 30% for H2/CO2 = 1 to over 82% for H2/CO2 = 6 at a constant temperature of 500 °C without recycle. In relation to all ratios excluding H2/CO2 = 1, the degree of conversion decreases at elevated temperatures; conversely, for the aforementioned ratio, it exhibits an increase (Figure 7a). This phenomenon can be elucidated by recognizing that this ratio represents the stoichiometric ratio for the RWGS reaction, which is characterized as an endothermic process. Consequently, as the temperature escalates, this reaction is preferentially enhanced, resulting in an increase in CO2 conversion.
Similar patterns were seen for CH4 yield and selectivity, with greater H2/CO2 ratios resulting in higher CH4 yield and selectivity. On the other hand, there was an inverse relationship between the H2/CO2 ratio and the selectivity of CO. Higher hydrocarbon ratios resulted in less selectivity, which was the desired outcome, whereas lower ratios produced higher CO selectivity. The simulations were conducted using an H2/CO2 ratio of 4, primarily considering the reaction stoichiometry while also accounting for economic factors.

3.4. Techno-Economics Discussion

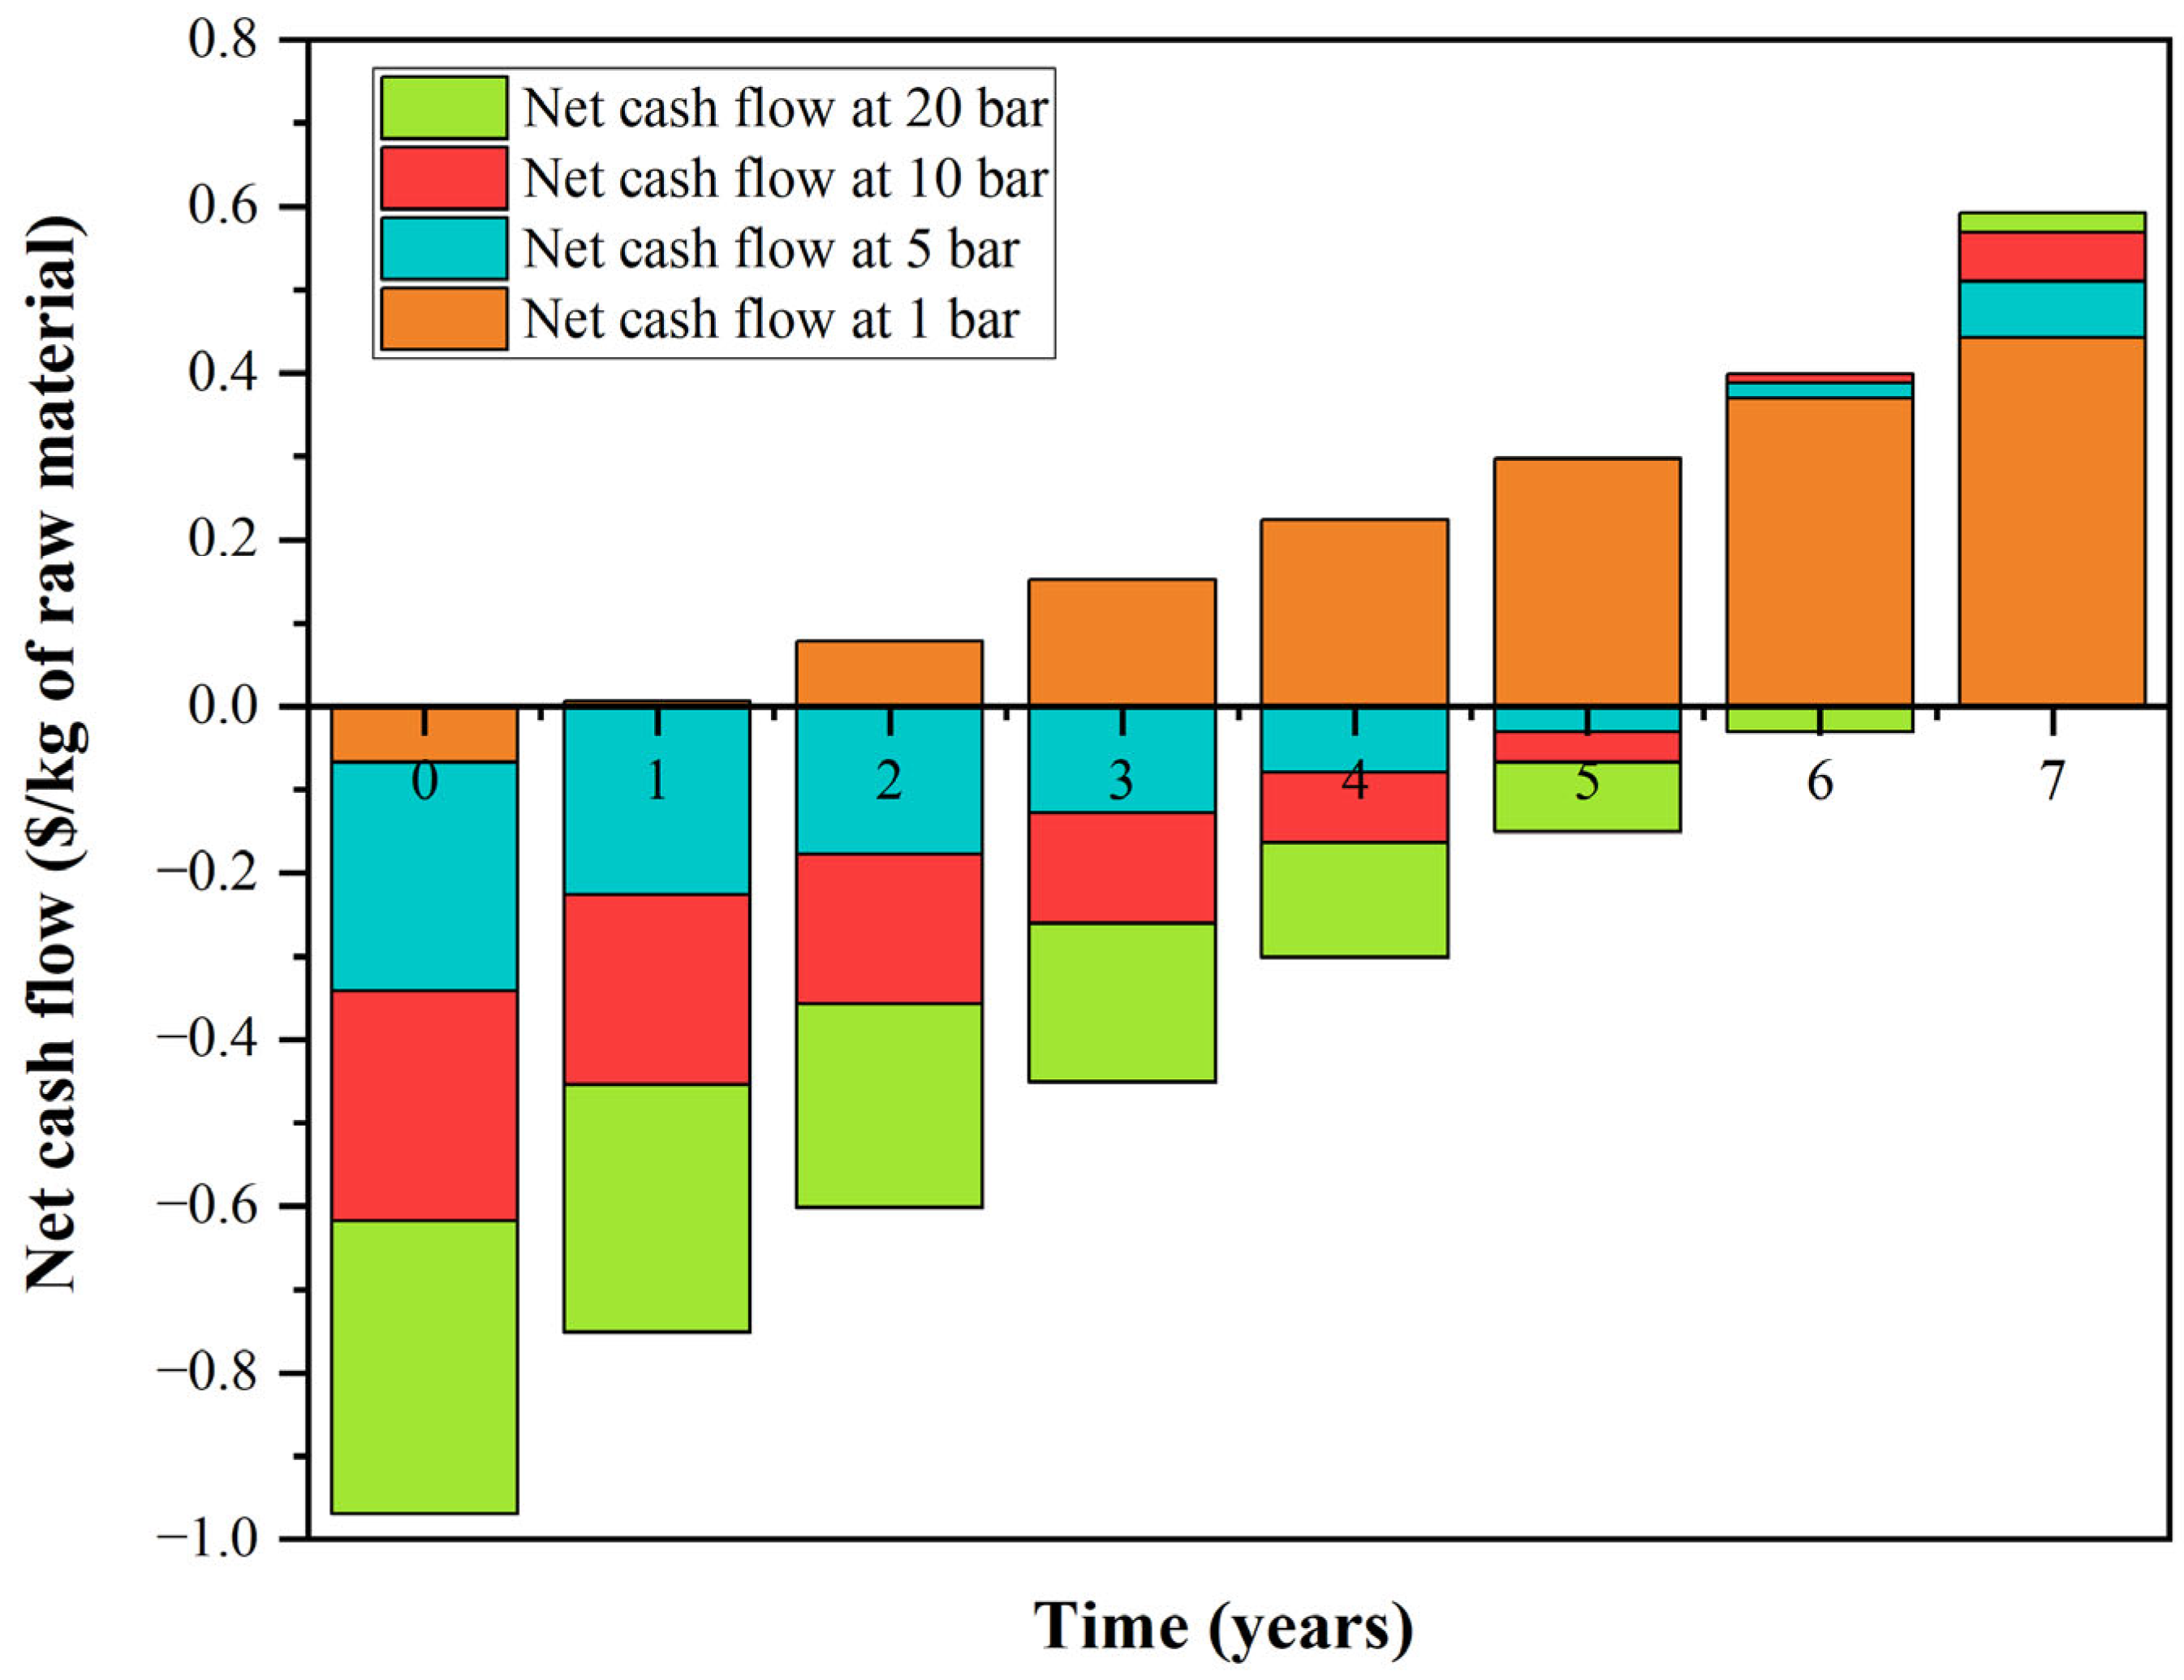
While raw material costs remain constant across scenarios, operation at higher pressures substantially elevates utility consumption, maintenance expenses, and fixed charges. This difference translates into higher apparent net cash flow and plant profitability at 1 bar, with a significantly shorter calculated payout period of 0.92 years compared to 6.56 years at 20 bar.
The Net Cash Flow graph (Figure 8) illustrates the financial performance over a seven-year period for four different operating pressures: 1 bar (orange), 5 bar (blue), 10 bar (red), and 20 bar (green). In the initial years, all scenarios exhibit negative cash flows due to high capital investment. The magnitude of this deficit increases with pressure, with the 20 bar case showing the steepest negative cash flow, while the 1 bar case incurs the lowest initial burden.
As revenues accumulate over time, the net cash flows improve and gradually transition into the positive range. The 1 bar scenario becomes profitable the earliest, turning positive around the second year and showing steady gains thereafter. By comparison, higher-pressure cases (5–20 bar) recover more slowly, with positive cash flow appearing only after the third to fourth year. Despite the delayed break-even, the 5 bar and 10 bar cases demonstrate stronger long-term recovery than the 1 bar case, and by the seventh year, the profitability gap between the scenarios narrows considerably.
While operation at 1 bar initially appears attractive due to its rapid payback, this advantage is offset by significant downstream challenges. Near-atmospheric operation results in low gas density, necessitating oversized reactors, pipelines, and additional compression stages to meet downstream pressure requirements. These hidden penalties increase both capital and operating costs over the plant’s lifetime. In contrast, operation at 5–10 bar, though demanding higher initial investment in pressure-rated equipment and greater utility consumption, ensures smoother integration with downstream units, reduces volumetric flow rates, and minimizes the need for multiple recompression steps. The 20 bar operation, while technically feasible, imposes disproportionately high upfront costs that erode its economic attractiveness. Higher operating pressures become more feasible when the feedstock is available at such pressures, as this eliminates the need for compression costs.
Overall, the analysis suggests that although the 1 bar scenario yields the shortest apparent payback period, medium-pressure operation (5–10 bar) offers a more robust and sustainable pathway, balancing integration efficiency, long-term profitability, and operational reliability for large-scale Bio-CNG production.
The cost and carbon footprint of hydrogen vary significantly depending on its production method (Table 3), influencing both the economic viability and environmental sustainability of industrial processes. Among the available hydrogen sources, grey hydrogen, produced via steam methane reforming (SMR), is the most economic option ($0.67–1.31/kg) but comes with a substantial carbon footprint (8.5 kg CO2/kg H2), making it less favorable from an environmental standpoint. Black hydrogen, obtained from coal gasification without carbon capture, offers a similarly low-cost alternative ($1.2–2/kg) but with even higher emissions (20 kg CO2/kg H2). These conventional methods, despite their cost advantages, contribute significantly to global CO2 emissions, raising concerns about their long-term sustainability.
In contrast, green hydrogen, produced via electrolysis powered by renewable energy, is a zero-emission alternative. However, its high energy input (192 MJ/kg) and elevated production cost ($2.28–7.39/kg) present economic challenges. Blue hydrogen, derived from SMR with carbon capture, utilization, and storage (CCUS), offers a compromise between cost and sustainability, with emissions reduced to 2 kg CO2/kg H2 and a price range of $0.99–2.05/kg. The implementation of CCUS technology in hydrogen production reduces environmental impact while maintaining cost competitiveness, making it a potential transitional solution toward decarbonization [48,49].
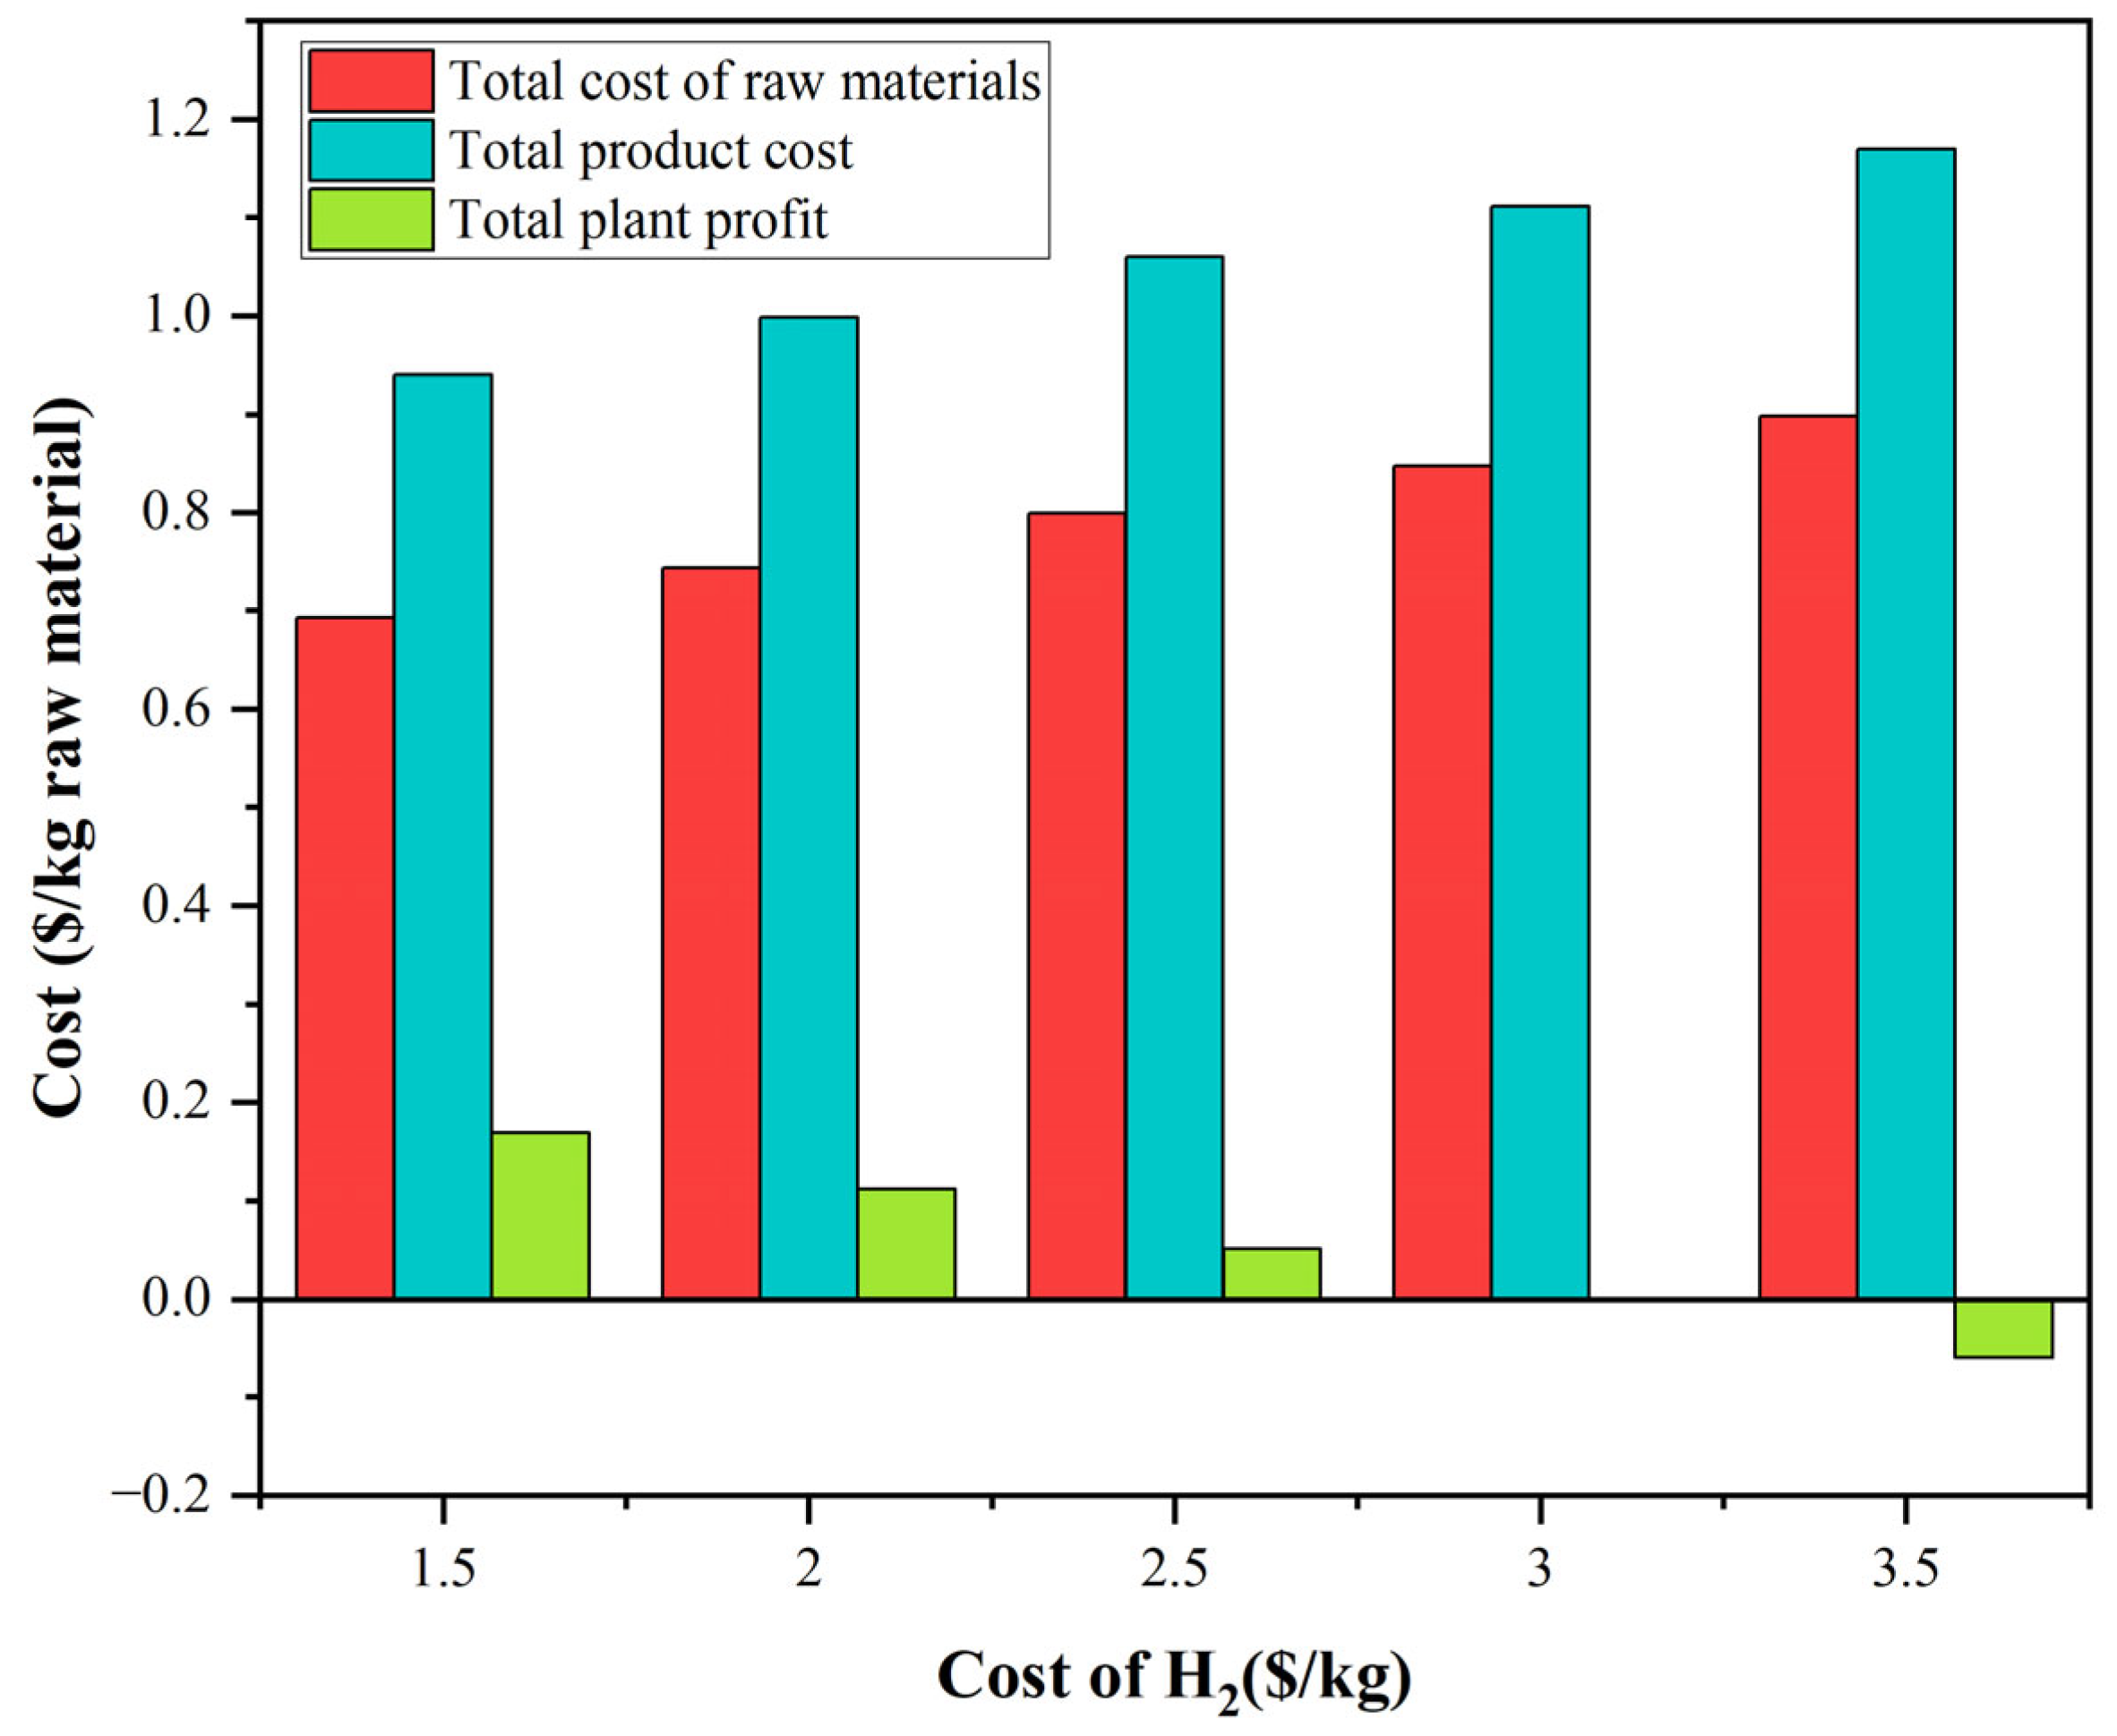
The choice of hydrogen source directly impacts key financial and operational parameters, such as payback period, total product cost, and overall profitability. A sensitivity analysis (Figure 9) was performed to assess how hydrogen prices from different production methods impact these parameters. As the cost of hydrogen increases, both the raw material cost and total product cost rise, reflecting the direct influence of the production method and associated costs on overall expenses. Meanwhile, the total plant profit declines sharply, turning negative at $3.5/kg, indicating that reliance on high-cost hydrogen sources could render the process economically unviable.
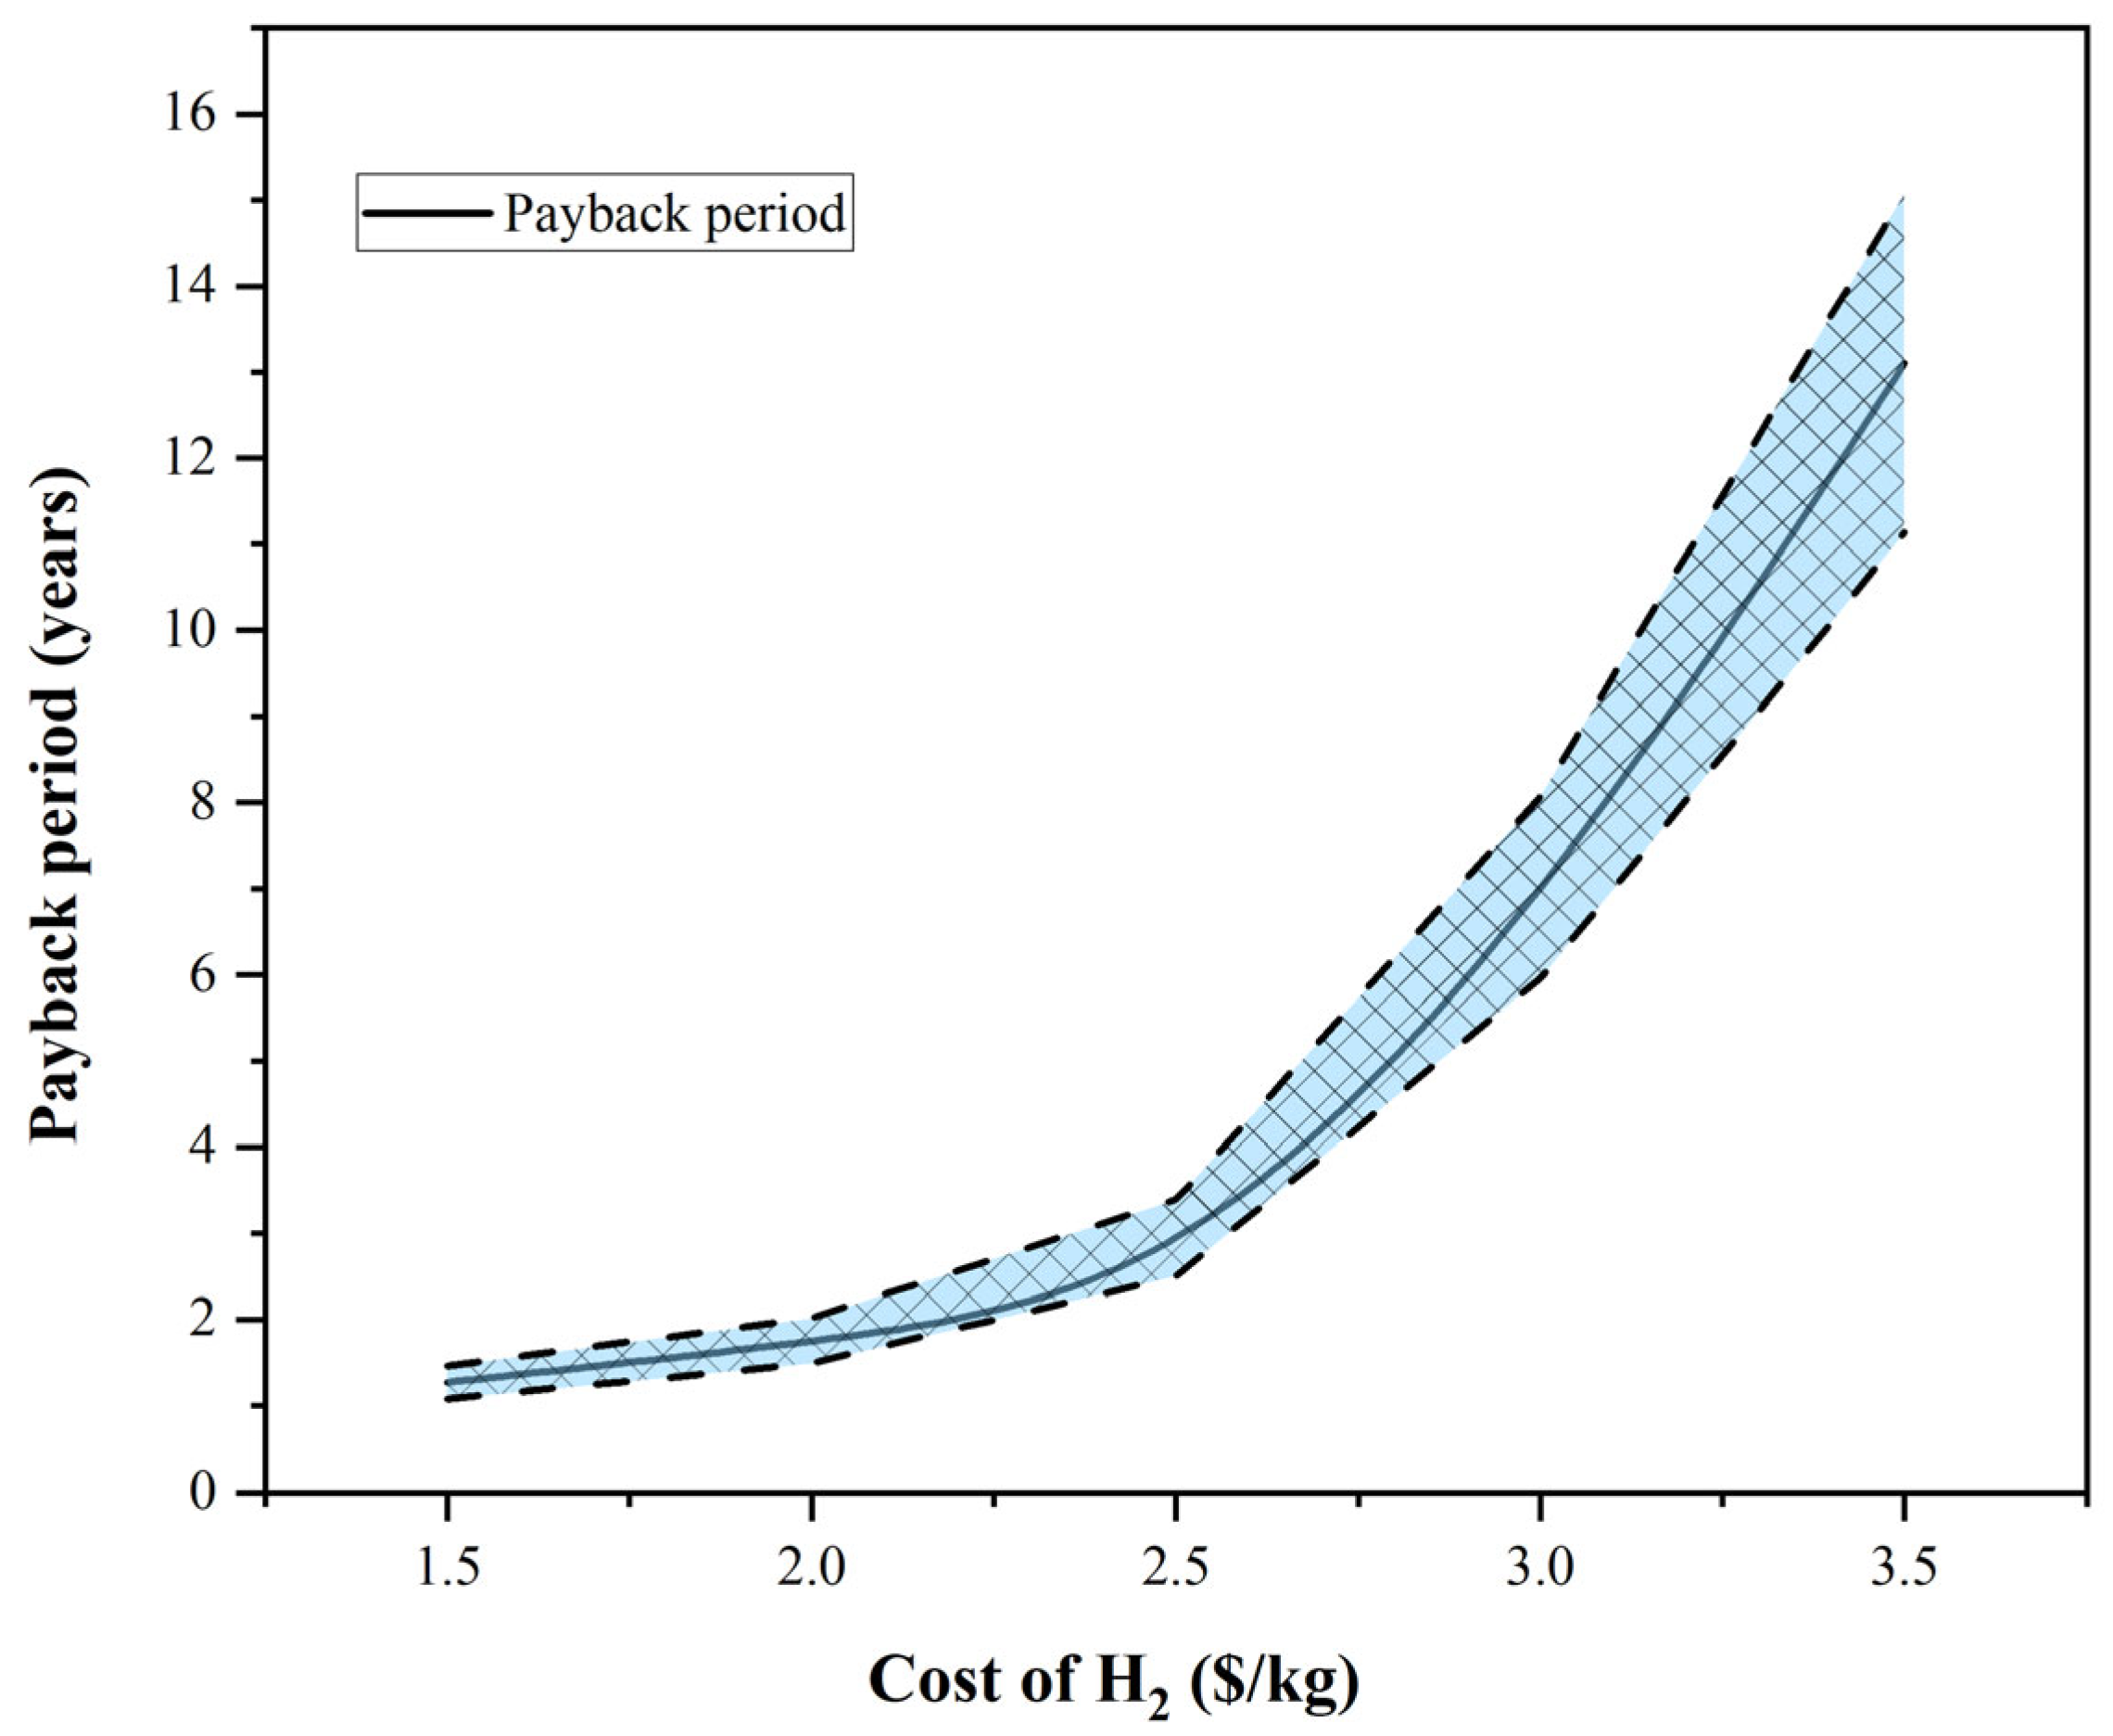
Figure 10 illustrates the variation in payback period with hydrogen cost, incorporating a ±15% margin to account for potential energy price fluctuations and international market uncertainties [50]. The central curve represents the baseline results, while the shaded band defines the range of variation. At lower hydrogen costs (1.5–2.0 $/kg), the payback period remains short even under fluctuating conditions, demonstrating strong economic feasibility. However, as hydrogen costs increase beyond 3.0 $/kg, the payback period rises sharply, and the widening of the uncertainty band indicates a greater sensitivity of project viability to market dynamics.
Lower-cost hydrogen sources reduce operating expenses and shorten the payback period, enhancing economic feasibility. However, their higher emissions could lead to increased regulatory costs or sustainability constraints. Conversely, low-carbon hydrogen sources, such as green and blue hydrogen, align with net-zero objectives but introduce higher initial costs, potentially extending the payback period. Therefore, a strategic balance between economic efficiency and environmental responsibility is essential for optimizing hydrogen utilization in industrial applications.
Hydrogen sourcing is fundamental to the sustainability and economic feasibility of biogas upgrading for biomethane and green hydrogen production. Green hydrogen, produced through electrolysis powered by renewable energy sources such as wind or solar, is gaining prominence due to its near-zero emissions profile compared to grey or blue hydrogen derived from fossil fuels. However, variability in renewable energy availability significantly affects hydrogen production rates and costs, necessitating careful integration of energy storage solutions like batteries or hydrogen storage to balance supply-demand mismatches. Feedstock variability also plays a crucial role in process design. Different biogas sources (e.g., agricultural waste, municipal solid waste, wastewater) exhibit diverse compositions impacting upgrading efficiency and catalyst durability. Optimizing hydrogen sourcing in tandem with feedstock characteristics enhances the robustness and scalability of biogas upgrading technologies [51].
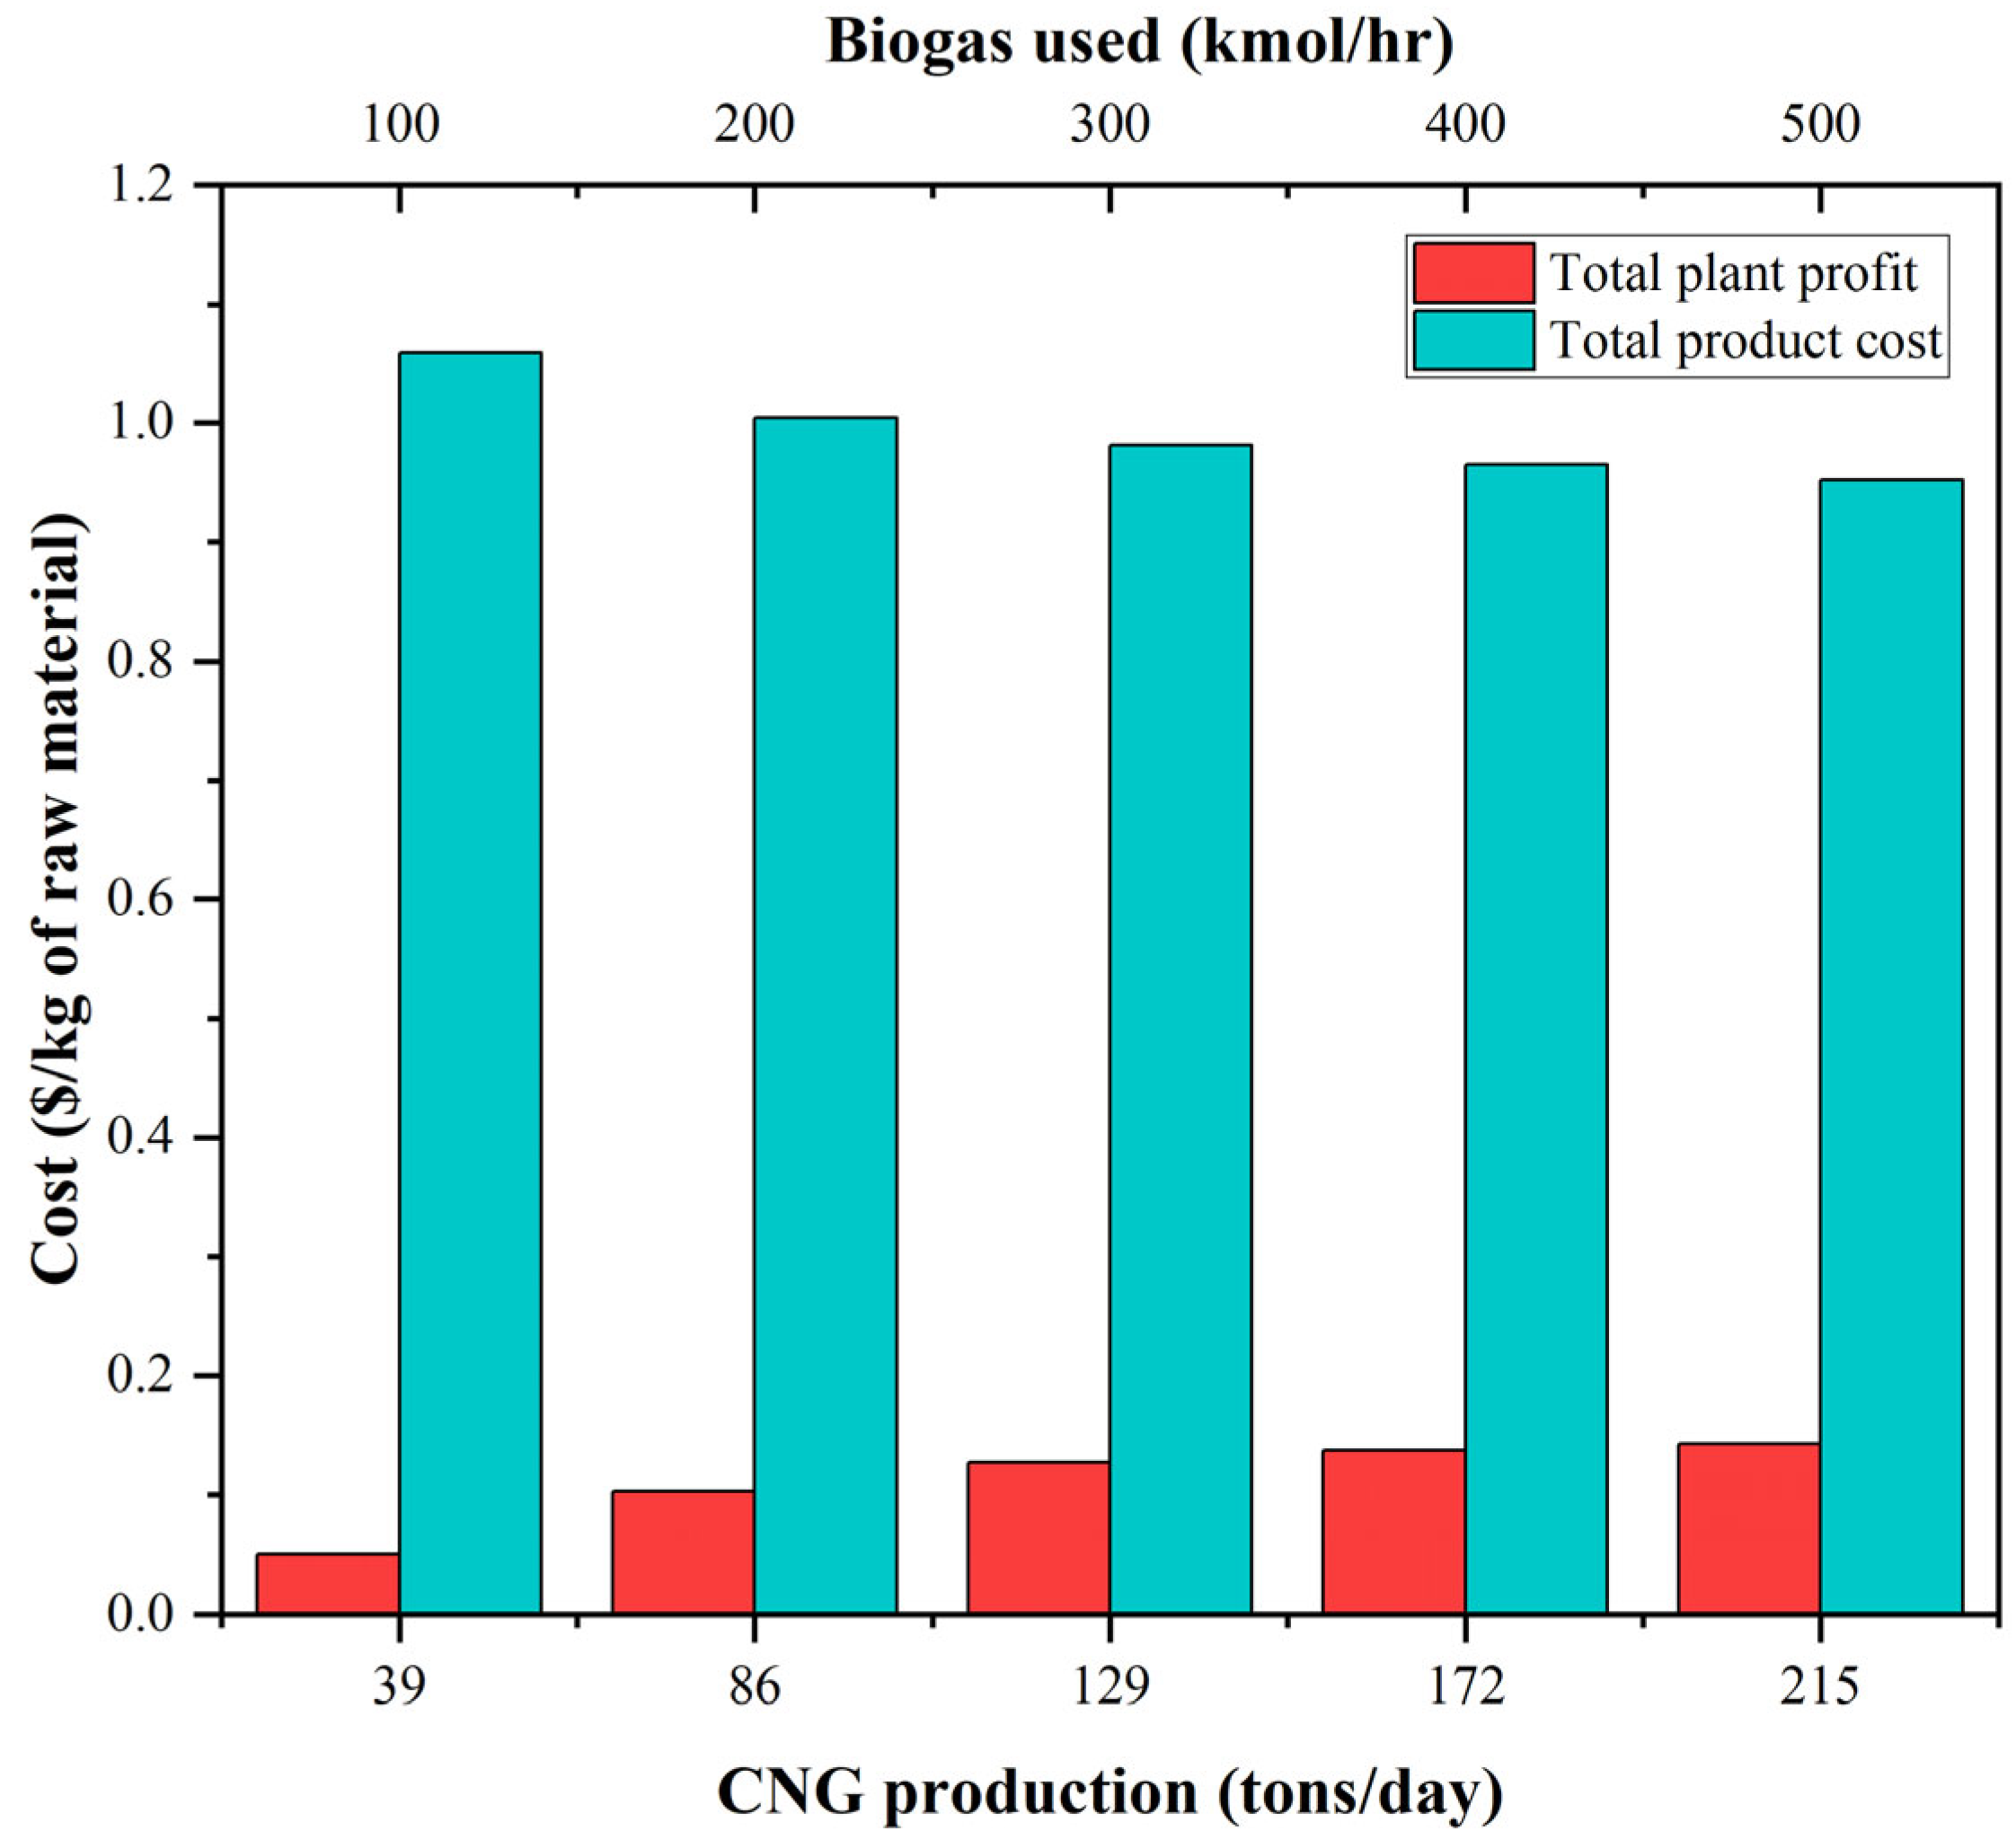
Figure 11 illustrates the relationship between CNG production capacity (in tons/day) and the associated total product cost and plant profit per kilogram of raw material. As production capacity increases from 39 to 215 tons/day, the total product cost per unit shows a slight but consistent decrease, indicating improved economies of scale. Concurrently, the total plant profit increases, demonstrating that higher production volumes enhance profitability. This trend highlights the economic benefit of scaling up CNG production, as larger-scale operations not only reduce unit costs but also significantly improve financial returns.
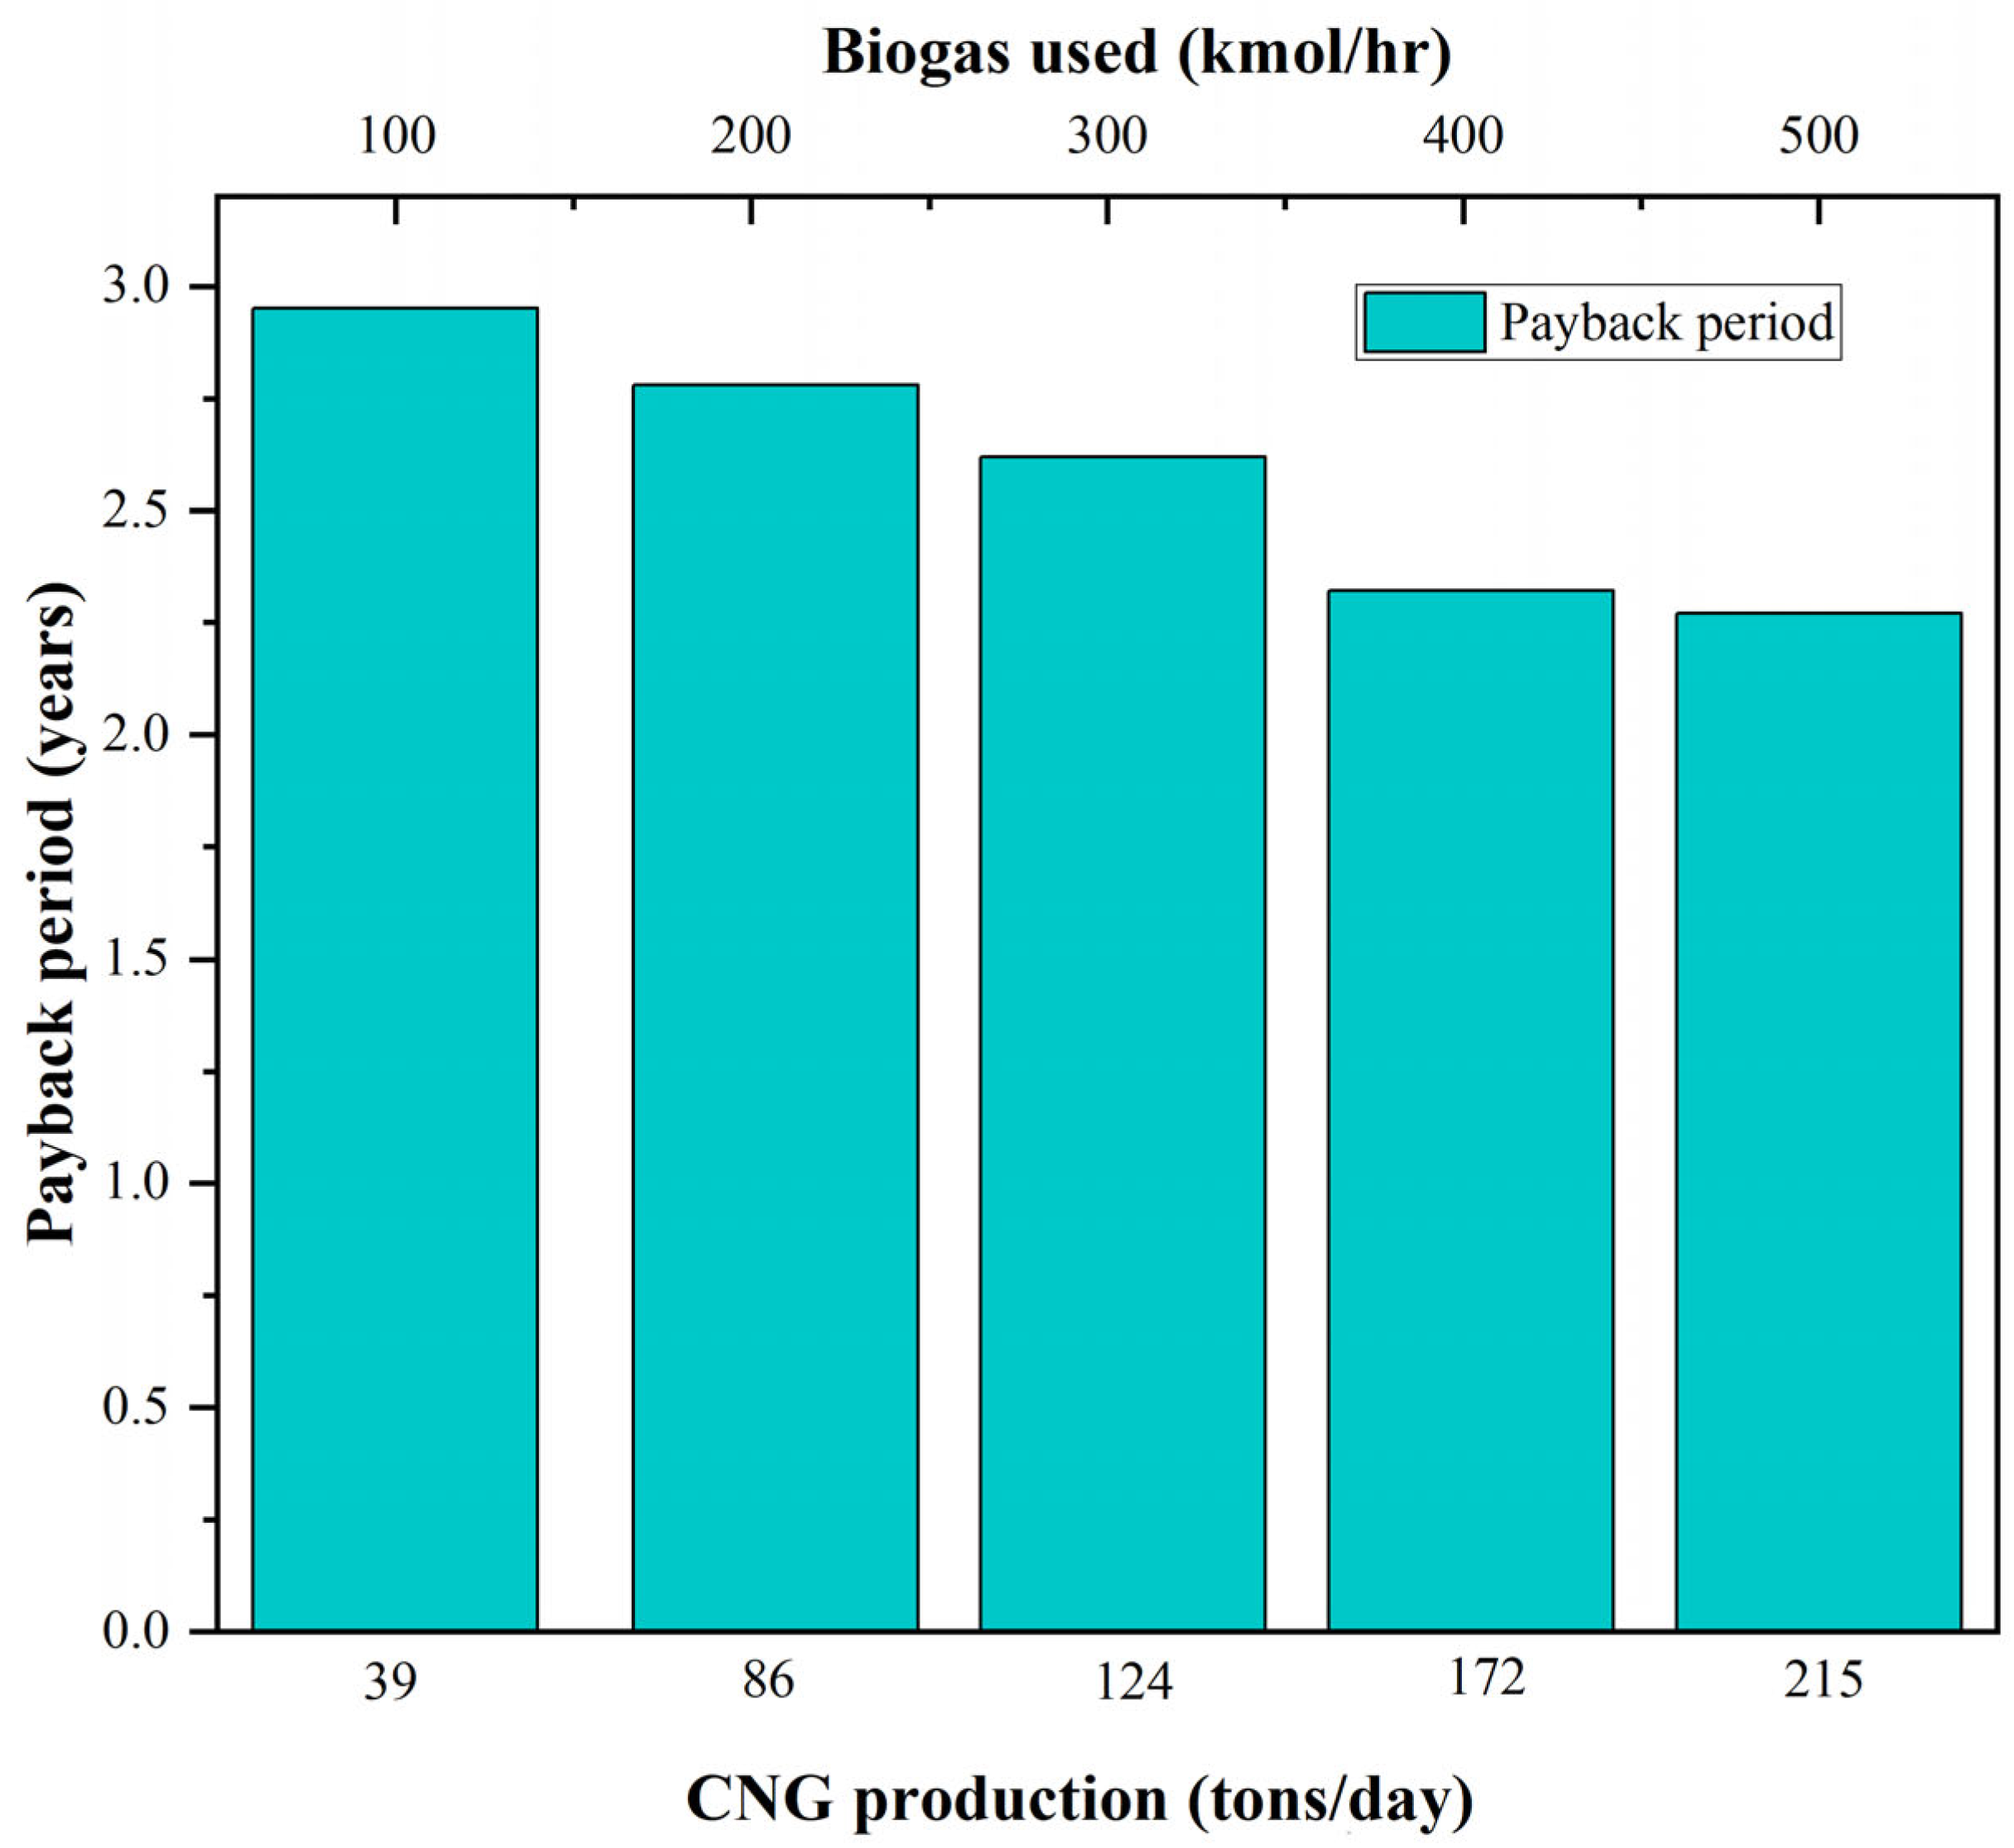
Figure 12 illustrates the relationship between CNG production capacity and the payback period of the plant. As the amount of biogas used increases from 100 to 500 kmol/hr the production of CNG increases from 39 to 215 tons/day, and a steady decline in payback period is observed from over 3 years to just under 2.2 years. This trend highlights the economic advantage of scaling up the process, as larger production volumes lead to faster capital recovery due to increased profitability and more efficient utilization of fixed costs.
Policy frameworks are critical levers in accelerating the deployment of green hydrogen technologies. Governments worldwide are adopting regulatory incentives, including production-linked subsidies, tax exemptions, and customs duty waivers, to reduce capital expenditure barriers for green hydrogen projects. Carbon pricing mechanisms such as carbon taxes and cap-and-trade systems further drive adoption by reflecting the environmental costs of fossil-based hydrogen, providing financial motivation to switch to greener alternatives. Additionally, mandates for hydrogen blending in natural gas pipelines and renewable fuel standards enhance demand certainty. Strategic funding for research, infrastructure development, and pilot projects complements these policies by mitigating technology risks and fostering industry confidence [52].
The environmental benefits of green hydrogen and biomethane are contingent on the entire life cycle of production, including feedstock selection and hydrogen sourcing methods. Life cycle assessments show that renewable-powered hydrogen significantly reduces greenhouse gas emissions compared to fossil-fuel-based routes, making a positive contribution to climate goals and improving air quality. However, challenges such as methane leakage in natural gas supply chains for blue hydrogen and energy-intensive electrolysis processes require ongoing mitigation. Policy-driven incentives such as carbon credits, renewable energy certificates, and low-carbon fuel standards amplify environmental gains by rewarding cleaner production and encouraging sustainable feedstock management. Furthermore, circular economy policies promoting waste valorization and biomass sustainability ensure long-term resource efficiency. Integrating these policy incentives with environmental assessments facilitates the practical deployment of clean hydrogen technologies, aligning with global sustainability objectives [53].

3.5. Energy Integration and Economics

Energy integration is a crucial aspect of process optimization, enhancing efficiency while reducing operational costs. The given flowsheet presents multiple unit operations with notable heat exchange opportunities. Several blocks exhibit negative heat duties, indicating that they release heat during operation. Rather than dissipating this excess heat, it can be effectively recovered and reused to minimize the external energy required for heating the feed from 25 °C to 300 °C.
One of the most significant heat sources in the process is the reactor, which has a heat duty of −1700 kW, indicating a highly exothermic reaction. Without proper temperature control, this could lead to operational challenges, requiring a cooling fluid to maintain the reactor at the desired temperature. As this cooling fluid absorbs heat, it gets heated up and can subsequently be used to partially preheat the feed, reducing the external energy input needed for heating.
Similarly, the condenser has a negative heat duty of −1375 kW, indicating that it releases a significant amount of heat while condensing vapors. A cooling fluid is required to maintain the condenser at an optimal temperature, and as this fluid absorbs heat, its temperature rises. Instead of discarding this heated cooling fluid, it can be routed through a heat exchanger to further preheat the incoming feed stream, improving overall thermal efficiency.
From an energy perspective, operating pressure strongly influences the overall efficiency of the upgrading process. At 1 bar, the need for repeated re-compression of gas streams to meet the operating requirements of downstream purification and storage units substantially increases electrical energy consumption, often negating the perceived benefits of low-pressure operation. In addition, the large volumetric flow rates at low pressure demand higher pumping and circulation loads, further raising indirect energy use. Conversely, operating at 5 bar requires a higher initial compression duty at the feed stage but subsequently reduces the number and size of intermediate compressors, stabilizes pressure profiles across separation units, and lowers volumetric flow-related energy losses. Moreover, methanation at elevated pressure enhances reaction kinetics and gas–liquid contact efficiency, thereby reducing residence time. Thus, while compression energy is non-negligible at 5 bar, its integration benefits and lower cumulative energy penalties across the process make it the more energy-efficient configuration for continuous Bio-CNG production.
In conclusion, effective energy integration in this process can be achieved by recovering heat from the reactor, condenser, and other heat-releasing units. By integrating the heated cooling fluid into the preheating stage, a portion of the required heating energy can be supplied internally, reducing reliance on external utilities. A significant portion of thermal energy is inherently generated within the process itself, primarily through the highly exothermic methanation reaction occurring in the reactor. This is complemented by substantial heat recovery from the condenser during the cooling of product gases. These units are major contributors to internal heat recovery, enabling efficient energy integration and reducing the demand for external heating sources. This approach ensures sustainable energy use, improving both economic and environmental performance.

4. Conclusions

This study presents a comprehensive investigation into the techno-economic feasibility of upgrading biogas to Bio-CNG through CO2 methanation. Through equilibrium modelling and process optimization, the optimal operating conditions were identified as 300–400 °C, 1–5 bar, and a H2/CO2 ratio of 4 to maximize methane yield while minimizing CO selectivity. The process flowsheet development demonstrated the effectiveness of a non-recycling approach for enhanced methane purity, supported by a detailed economic evaluation. The techno-economic analysis revealed that while higher pressures improve efficiency, they also lead to increased capital investment, making the selection of operating conditions a crucial trade-off between cost and performance.
Furthermore, the study highlights the impact of hydrogen sourcing on the economic viability of the process. While green hydrogen offers the most sustainable pathway, its high production costs can significantly extend the payback period. Blue hydrogen, with lower carbon emissions and cost competitiveness, emerges as a viable transitional option. Although blue hydrogen is currently more economically feasible, the cost of green hydrogen is expected to decline in the future with advancements in electrolyser technology, increased renewable energy deployment, and supportive policy measures. This future cost reduction could make green hydrogen a more attractive and sustainable long-term solution. Sensitivity analysis further underscores the importance of hydrogen pricing in determining profitability and payback duration. Additionally, energy integration strategies were proposed to enhance process efficiency by utilizing excess heat from exothermic reactions, reducing the external energy demand for feed preheating. This approach significantly improves the overall energy efficiency and economic sustainability of the Bio-CNG production process.
In conclusion, upgrading biogas to Bio-CNG presents a promising renewable energy solution, aligning with global sustainability goals. The study also recognizes the potential of hydrogen blending into Bio-CNG to produce H-CNG, which can further enhance the fuel’s quality. H-CNG offers superior combustion characteristics, reduced tailpipe emissions, and improved engine performance, making it an attractive option for clean transportation applications. However, optimizing economic and environmental trade-offs such as hydrogen sourcing, operating pressures, and heat recovery are essential for large-scale implementation. Future research should focus on catalyst development, process intensification, and policy-driven incentives to further enhance the feasibility and scalability of Bio-CNG as a sustainable fuel alternative.
Looking ahead, experimental validation and pilot-scale demonstrations are critical to bridge the gap between simulation-based findings and industrial practice. Such studies can provide insights into catalyst durability, heat management, and real gas compositions that are difficult to fully capture in models. In parallel, the development of regulatory frameworks and supportive policies will be essential to facilitate industrial adoption. Combining experimental research, techno-economic optimization, and regulatory strategies will accelerate the pathway toward large-scale, commercially viable Bio-CNG production through CO2 methanation.

Supplementary Materials

The following supporting information can be downloaded at: https://www.mdpi.com/article/10.3390/chemengineering9050114/s1: Table S1: Equipment cost at 1 bar and 5 bar; Table S2: Estimated values of total capital investment cost for the non-recycling approach; Table S3: Estimated values of total plant profit for the non-recycling approach.

Author Contributions

Conceptualization, D.A. and S.A.S.; methodology, D.A. and S.A.S.; validation, D.A. and S.A.S.; formal analysis, D.A. and S.A.S.; investigation, D.A. and S.A.S.; resources, S.A.S.; data curation, D.A.; writing—original draft preparation, D.A. and S.A.S.; writing—review and editing, S.A.S.; supervision, S.A.S.; project administration, S.A.S.; funding acquisition, S.A.S. All authors have read and agreed to the published version of the manuscript.

Funding

This research was funded by Council of Scientific & Industrial Research (CSIR), India, Grant No. 22/0864/23/EMR-II.

Data Availability Statement

The original contributions presented in this study are included in the article/Supplementary Materials. Further inquiries can be directed to the corresponding author.

Acknowledgments

Authors are grateful for the computational facilities provided by Computer Center Laboratory, BITS-Pilani Hyderabad Campus, India.

Conflicts of Interest

The authors declare no conflicts of interest.

Abbreviations

The following abbreviations are used in this manuscript:
Bio-CNGBiomethane
Bio-H-CNGBiogenic hydrogen-enriched compressed natural gas
CCUSCarbon capture, Utilization and Storage
CNGCompressed Natural Gas
DCDirect Costs
FCIFixed Capital Investment
f.o.b.Free-On-Board
GHGGreenhouse gas
GHSVGas Hourly Space Velocity
GWGiga Watt
ICIndirect Costs
KPIKey Performance Indicator
MJMega Joule
RWGSReverse Water Gas Shift
SMRSteam Methane Reforming
TCITotal Capital Investment
TPCTotal Product Cost
TPPTotal Plant Profit
TPSTotal Product Sales
WCIWorking Capital Investment

References

  1. Jiang, Z.; Xiao, T.; Kuznetsov, V.L.; Edwards, P.P. Turning carbon dioxide into fuel. Philos. Trans. R. Soc. A Math. Phys. Eng. Sci. 2010, 368, 3343–3364. [Google Scholar] [CrossRef] [PubMed]
  2. World Meteorological Organization Report. Available online: https://wmo.int/media/news/record-carbon-emissions-highlight-urgency-of-global-greenhouse-gas-watch#:~:text=Totalcarbondioxide(CO2)emissions,totheGlobalCarbonBudget (accessed on 18 June 2025).
  3. IEA Greenhouse Gas Emissions Data. Available online: https://www.iea.org/data-and-statistics/data-tools/greenhouse-gas-emissions-from-energy-data-explorer (accessed on 18 June 2025).
  4. IRENA Renewable Energy Statistics. 2024. Available online: https://www.irena.org/Publications/2024/Mar/Renewable-capacity-statistics-2024 (accessed on 21 June 2025).
  5. IEA Bioenergy. Available online: https://www.iea.org/energy-system/renewables/bioenergy (accessed on 22 June 2025).
  6. Ravindranath, D.; Shroff, S.; Rao, N. Diffusion of renewable energy technologies: Case studies of enabling frameworks in developing countries. In Technology Transfer Perspectives Series; Haselip, J., Nygaard, I., Hansen, U., Ackom, E., Eds.; UNEP Risø Centre: Copenhagen, Denmark, 2011; pp. 129–145. [Google Scholar]
  7. Arora, D.S.; Busche, S.; Cowlin, S.; Engelmeier, T.; Jaritz, J.; Milbrandt, A.; Wang, S. Indian Renewable Energy Status Report: Background Report for DIREC 2010; No. NREL/TP-6A20-48948; National Renewable Energy Lab (NREL): Golden, CO, USA, 2010; Chapter 6; pp. 66–81. [Google Scholar]
  8. Nevzorova, T.; Kutcherov, V. Barriers to the wider implementation of biogas as a source of energy: A state-of-the-art review. Energy Strat. Rev. 2019, 26, 100414. [Google Scholar] [CrossRef]
  9. Surendra, K.C.; Tanaka, D.; Hashimoto, A.G.; Khanal, S.K. Biogas as a sustainable energy source for developing countries: Opportunities and challenges. Renew. Sustain. Energy Rev. 2014, 31, 846–859. [Google Scholar] [CrossRef]
  10. Singhal, S.; Agarwal, S.; Arora, S.; Sharma, P.; Singhal, N. Upgrading techniques for transformation of biogas to bio-CNG: A review. Int. J. Energy Res. 2017, 41, 1657–1669. [Google Scholar] [CrossRef]
  11. Yang, L.; Ge, X.; Wan, C.; Yu, F.; Li, Y. Progress and perspectives in converting biogas to transportation fuels. Renew. Sustain. Energy Rev. 2014, 40, 1133–1152. [Google Scholar] [CrossRef]
  12. Matheri, A.N.; Sethunya, V.L.; Belaid, M.; Muzenda, E. Analysis of the biogas productivity from dry anaerobic digestion of organic fraction of municipal solid waste. Renew. Sustain. Energy Rev. 2018, 81, 2328–2334. [Google Scholar] [CrossRef]
  13. Barbera, E.; Menegon, S.; Banzato, D.; Alpaos, C.D.; Bertucco, A. From biogas to biomethane: A process simulation-based techno-economic comparison of different upgrading technologies in the Italian context. Renew. Energy 2019, 135, 663–673. [Google Scholar] [CrossRef]
  14. IEA. An Introduction to Biogas and Biomethane, in Outlook for Biogas and Biomethane: Prospects for Organic Growth. Available online: https://www.iea.org/reports/outlook-for-biogas-and-biomethane-prospects-for-organic-growth/an-introduction-to-biogas-and-biomethane (accessed on 22 June 2025).
  15. Prajapati, B.K.; Anand, A.; Gautam, S.; Singh, P. Production of hydrogen and methane rich gas by stepped pyrolysis of biomass and its utilization in IC engines. Clean Technol. Environ. Policy 2022, 24, 1375–1388. [Google Scholar] [CrossRef]
  16. Agrawal, D.; Mahajan, N.; Singh, S.A.; Sreedhar, I. Green hydrogen production pathways for sustainable future with net zero emissions. Fuel 2024, 359, 130131. [Google Scholar] [CrossRef]
  17. Santhosh, J.; Sarkar, O.; Mohan, S.V. Bioresource Technology Green Hydrogen-Compressed natural gas (bio-H-CNG) production from food waste: Organic load influence on hydrogen and methane fusion. Bioresour. Technol. 2021, 340, 125643. [Google Scholar] [CrossRef] [PubMed]
  18. Gao, Y.; Jiang, J.; Meng, Y.; Yan, F.; Aihemaiti, A. A review of recent developments in hydrogen production via biogas dry reforming. Energy Convers. Manag. 2018, 171, 133–155. [Google Scholar] [CrossRef]
  19. Kumar, R.; Kumar, A. International Journal of Hydrogen Energy Recent advances of biogas reforming for hydrogen production: Methods, purification, utility and techno-economics analysis. Int. J. Hydrogen Energy 2024, 76, 108–140. [Google Scholar] [CrossRef]
  20. IEA Global Hydrogen Review. Available online: https://www.iea.org/reports/global-hydrogen-review-2022 (accessed on 22 June 2025).
  21. Chae, M.J.; Kim, J.H.; Moon, B.; Park, S.; Lee, Y.S. The present condition and outlook for hydrogen-natural gas blending technology. Korean J. Chem. Eng. 2022, 39, 251–262. [Google Scholar] [CrossRef]
  22. Omar, M.; Seyed, A.; Hoseyni, M.; Cordiner, J. Fuelling the Future with Safe Hydrogen Transportation Through Natural Gas Pipelines: A Quantitative Risk Assessment Approach Centre for Chemical Process Safety as Low as Reasonably Practicable. Trans. Indian Natl. Acad. Eng. 2024, 9, 763–781. [Google Scholar]
  23. Sanz-Monreal, P.; Gil, J.; Sanz-Pérez, A. Techno-economic assessment of a plant for the upgrading of MSW biogas to synthetic natural gas by thermocatalytic methanation. J. Environ. Chem. Eng. 2025, 13, 112345. [Google Scholar] [CrossRef]
  24. Gagliano, A.; Nocera, F.; Bruno, M.; Cardillo, G. Development of an equilibrium-based model of gasification of biomass by Aspen Plus. Energy Procedia 2017, 111, 1010–1019. [Google Scholar] [CrossRef]
  25. Leonzio, G. Process analysis of biological Sabatier reaction for bio-methane production. Chem. Eng. J. 2016, 290, 490–498. [Google Scholar] [CrossRef]
  26. Calbry-muzyka, A.; Madi, H.; Rüsch-Pfund, F.; Gandiglio, M.; Biollaz, S. Biogas composition from agricultural sources and organic fraction of municipal solid waste. Renew. Energy 2022, 181, 1000–1007. [Google Scholar] [CrossRef]
  27. Javier, Ó.; Bermúdez, F.; Giraldo, L.; Sierra, R.; Juan, R.; Moreno, C. Removal of hydrogen sulfide from biogas by adsorption and photocatalysis: A review. Environ. Chem. Lett. 2023, 21, 1059–1073. [Google Scholar]
  28. Al-Samadi, M.; Ibrahim, A.; Abdullah, B.; El-Naas, M.H. Iron-based sorbents for H2S removal from biogas: A review. Arab. J. Chem. 2024, 17, 105821. [Google Scholar]
  29. Zhang, Y.; Kawasaki, Y.; Oshita, K.; Takaoka, M.; Minami, D.; Inoue, G.; Tanaka, T. Economic assessment of biogas purification systems for removal of both H2S and siloxane from biogas. Renew. Energy 2021, 168, 119–130. [Google Scholar] [CrossRef]
  30. Rönsch, S.; Köchermann, J.; Schneider, J.; Matthischke, S. Global Reaction Kinetics of CO and CO2 Methanation for Dynamic Process Modeling. Chem. Eng. Technol. 2016, 39, 208–218. [Google Scholar] [CrossRef]
  31. Al-Fatesh, A.S.; Kaydouh, M.N.; Ahmed, H.; Ibrahim, A.A.; Alotibi, M.F.; Osman, A.I.; El Hassan, N. Sr Promoted Ni/W-Zr Catalysts for Highly Efficient CO2 Methanation: Unveiling the Role of Surface Basicity. Langmuir 2023, 39, 17723–17732. [Google Scholar] [CrossRef] [PubMed]
  32. Vrijburg, W.L.; Moioli, E.; Chen, W.; Zhang, M.; Terlingen, B.J.P.; Zijlstra, B.; Filot, I.A.W.; Züttel, A.; Pidko, E.A.; Hensen, E.J.M. Efficient Base-Metal NiMn/TiO2 Catalyst for CO2 Methanation. ACS Catal. 2019, 9, 7823–7839. [Google Scholar] [CrossRef]
  33. Sreedhar, I.; Varun, Y.; Singh, S.A.; Venugopal, A.; Reddy, B.M. Developmental trends in CO2 methanation using various catalysts. Catal. Sci. Technol. 2019, 9, 4478–4504. [Google Scholar] [CrossRef]
  34. Chitturi, H.S.; Lavanya, Y.; Varun, Y.; Ramesh, A.; Pamu, S.H.; Sreedhar, I.; Singh, S.A. Unraveling the CO2 methanation and capture ability of NiO@metal oxides. J. Mater. Chem. A 2025, 10, 7422–7444. [Google Scholar] [CrossRef]
  35. Dannesboe, S.; Hansen, J.B.; Johannsen, J.R. Catalytic methanation of CO2 in biogas: Experimental results from a reactor at full scale. React. Chem. Eng. 2020, 5, 683–692. [Google Scholar] [CrossRef]
  36. Ahn, J.; Kim, H.; Ro, Y.; Kim, J.; Chung, W.; Chang, S. Development of Pilot-Scale CO2 Methanation Using Pellet-Type Catalysts for CO2 Recycling in Sewage Treatment Plants and Its Validation through Computational Fluid Dynamics (CFD) Modeling. Catalysts 2021, 11, 1005. [Google Scholar] [CrossRef]
  37. Mastroianni, L.; Medina, A.; De Domenico, A.; Eränen, K.; Di Serio, M.; Murzin, D.; Russo, V.; Salmi, T. DLP 3D Printing of Alumina Catalyst Architectures: Design, Kinetics and Modelling of Structure Effects on Catalyst Performance. Chem. Eng. J. 2024, 501, 157691. [Google Scholar] [CrossRef]
  38. Kanuri, S.; Vinodkumar, J.D.; Datta, S.P.; Chakraborty, C.; Roy, S.; Singh, S.A.; Dinda, S. Methanol synthesis from CO2 via hydrogenation route: Thermodynamics and process development with techno-economic feasibility analysis. Korean J. Chem. Eng. 2022, 40, 810–823. [Google Scholar] [CrossRef]
  39. Bown, R.M.; Joyce, M.; Zhang, Q.; Reina, T.R.; Duyar, M.S. Identifying Commercial Opportunities for the Reverse Water Gas Shift Reaction. Energy Technol. 2021, 9, 28–31. [Google Scholar] [CrossRef]
  40. Kakoee, A.; Gharehghani, A. Carbon oxides methanation in equilibrium: A thermodynamic approach. Int. J. Hydrogen Energy 2020, 45, 29993–30008. [Google Scholar] [CrossRef]
  41. Swapnesh, A.; Srivastava, V.C.; Mall, I.D. Comparative Study on Thermodynamic Analysis of CO2 Utilization Reactions. Chem. Eng. Technol. 2014, 37, 1765–1777. [Google Scholar] [CrossRef]
  42. Varandas, B.; Oliveira, M.; Andrade, C.; Borges, A. Thermodynamic Equilibrium Analysis of CO2 Methanation through Equilibrium Constants: A Comparative Simulation Study. Physchem 2024, 4, 258–271. [Google Scholar] [CrossRef]
  43. Gao, J.; Wang, Y.; Ping, Y.; Hu, D.; Xu, G.; Gu, F.; Su, F. A thermodynamic analysis of methanation reactions of carbon oxides for the production of synthetic natural gas. RSC Adv. 2012, 2, 2358–2368. [Google Scholar] [CrossRef]
  44. Santos, M.F.; Bresciani, A.E.; Ferreira, N.L.; Bassani, G.S.; Alves, R.M.B. Carbon dioxide conversion via reverse water-gas shift reaction: Reactor design. J. Environ. Manag. 2023, 345, 118822. [Google Scholar] [CrossRef]
  45. Yeo, C.E.; Seo, M.; Kim, D.; Jeong, C.; Shin, H.S.; Kim, S. Optimization of operating conditions for CO2 methanation process using design of experiments. Energies 2021, 14, 8414. [Google Scholar] [CrossRef]
  46. Bimetallic, C.C.N.T.; Tropsch, F.; Akbarzadeh, O.; Alshahateet, S.F.; Asmawati, N.; Zabidi, M.; Moosavi, S.; Chowdhury, Z.Z.; Sagadevan, S.; Temperature, E.O. Syngas Space Velocity and Catalyst Stability of Co-Mn/CNT Bimetallic Catalyst on Fischer Tropsch Synthesis Performance. Catalysts 2021, 11, 846. [Google Scholar]
  47. Adelung, S.; Dietrich, R. Impact of the reverse water-gas shift operating conditions on the Power-to-Liquid fuel production cost. Fuel 2022, 317, 123440. [Google Scholar] [CrossRef]
  48. Bhuiyan, M.H.; Siddique, Z. Hydrogen as an alternative fuel: A comprehensive review of challenges and opportunities in production, storage, and transportation. Int. J. Hydrogen Energy 2025, 102, 1026–1044. [Google Scholar] [CrossRef]
  49. Mar, J.M.; Santos, D.M.F. The Hydrogen Color Spectrum: Techno-Economic Analysis of the Available Technologies for Hydrogen Production. Gases 2023, 3, 25–46. [Google Scholar] [CrossRef]
  50. Braga, L.B.; Silveira, J.L.; Da Silva, M.E.; Tuna, C.E.; Machin, E.B.; Pedroso, D.T. Hydrogen production by biogas steam reforming: A technical, economic and ecological analysis. Renew. Sustain. Energy Rev. 2013, 28, 166–173. [Google Scholar] [CrossRef]
  51. Mansilha, C.; Barbosa-Póvoa, A.; Tarelho, L.; Fonseca, A. A comprehensive review of green hydrogen production technologies: Current status, challenges, research trends and future directions. Renew. Sustain. Energy Rev. 2026, 225, 116119. [Google Scholar] [CrossRef]
  52. Venizelou, V.; Poullikkas, A. The effect of carbon price towards green hydrogen power generation. Renew. Sustain. Energy Rev. 2025, 211, 115254. [Google Scholar] [CrossRef]
  53. Chen, Y.; Guo, W.; Ngo, H.H.; Chen, Z.; Wei, C.; Bui, X.T.; Tung, T.V.; Zhang, H. Ways to assess hydrogen production via life cycle analysis. Sci. Total Environ. 2025, 977, 179355. [Google Scholar] [CrossRef] [PubMed]
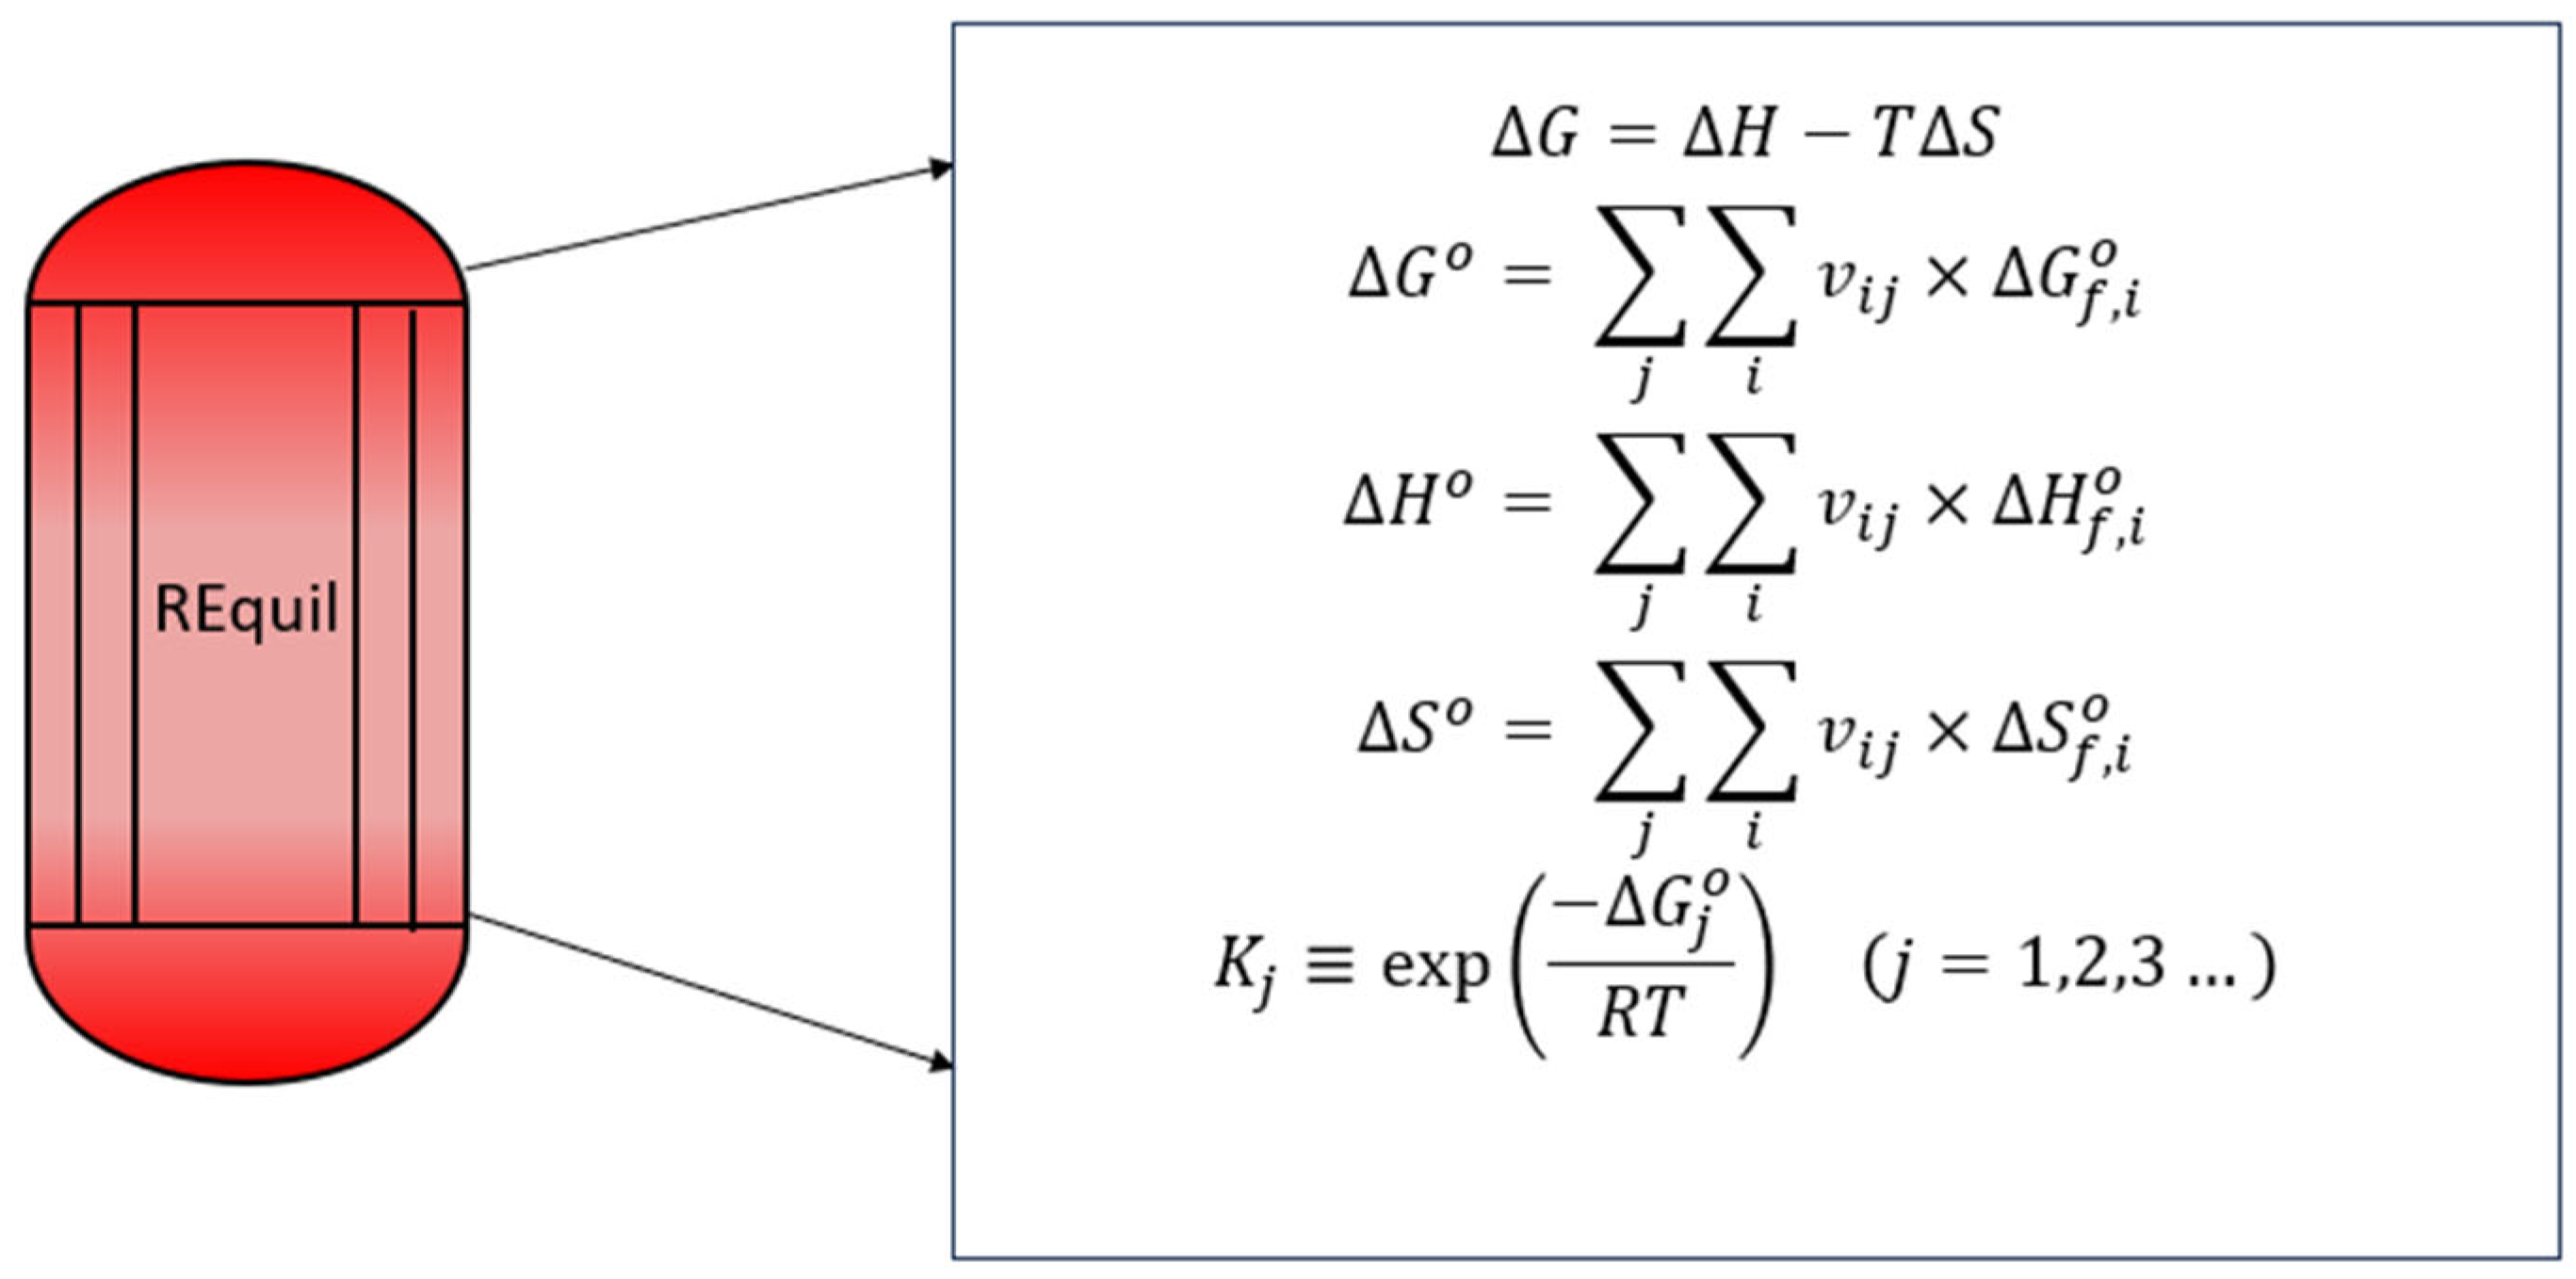
Figure 1. Reaction equilibrium methodology.
Chemengineering 09 00114 g001
Figure 2. Process flowsheet for conversion of biogas to Bio-CNG.
Chemengineering 09 00114 g002
Figure 3. Process flowsheet for conversion of biogas to Bio-CNG with recycle.
Chemengineering 09 00114 g003
Figure 4. Effect of recycle ratio on (a) combined molar flowrate of CH4 and H2, (b) molar flowrate of CO, and (c) CO2 conversion and purity (combined composition of CH4 and H2).
Chemengineering 09 00114 g004
Figure 5. (a) Enthalpy, (b) Entropy, (c) Gibbs free energy variations with temperature.
Chemengineering 09 00114 g005
Figure 6. Effect of temperature on (a) CO2 conversion, (b) Selectivity variation (CH4 and CO) without recycle, (c) CO2 conversion, and (d) Selectivity (CH4 and CO) with recycle (R/F = 0.01) at different pressures ranging from 1 to 50 bar.
Chemengineering 09 00114 g006
Figure 7. Effect of temperature on (a) CO2 conversion, (b) Selectivity variation (CH4 and CO) without recycle, (c) CO2 conversion, and (d) Selectivity (CH4 and CO) with recycle (R/F = 0.01) at different H2: CO2 ratios ranging from 1 to 6.
Chemengineering 09 00114 g007
Figure 8. Net Cash flow for two different operating pressures, 1 bar, 5 bar, 10 bar, and 20 bar (39 ton/day Bio-CNG production).
Chemengineering 09 00114 g008
Figure 9. Effect of H2 cost on raw material cost, product cost, and plant profitability (39 ton/day Bio-CNG production).
Chemengineering 09 00114 g009
Figure 10. Payback Period Variation with the Cost of H2 (39 ton/day Bio-CNG production).
Chemengineering 09 00114 g010
Figure 11. Effect of Production Scale on Cost Efficiency and Profitability (at Hydrogen Cost of 2.5 $/kg).
Chemengineering 09 00114 g011
Figure 12. Effect of Production Scale on Payback Period (at Hydrogen Cost of 2.5 $/kg).
Chemengineering 09 00114 g012
Table 1. Reactions employed for the methanation process.
Reaction NameReaction Stoichiometry∆H0298Reaction No.
CO2 MethanationCO2 + 4 H2 ↔ CH4 + 2 H2O−165 kJ/mol1
Reverse Water Gas ShiftCO2 + H2 ↔ CO + H2O41.5 kJ/mol2
CO MethanationCO + 3 H2 ↔ CH4+ H2O−206.1 kJ/mol3
Table 2. Biogas composition fed to the reactor.
ComponentComposition
Methane50 w/w%
Carbon Dioxide35 w/w%
Nitrogen8 w/w%
Hydrogen5 w/w%
Water1 w/w%
Hydrogen Sulphide0.9 w/w%
Oxygen0.1 w/w%
Table 3. Comparison of Hydrogen types based on cost and carbon footprint [48,49].
Hydrogen TypeCost (USD/kg)Emissions
(kg CO2/kg H2)
Energy
Requirement
(MJ/kg)
Source of
Hydrogen
Green H22.28–7.390192Electrolysis
Black H21.2–220236Gasification (no CCUS)
Grey H20.67–1.318.5167Steam methane reforming
(SMR)
Blue H20.99–2.052169/223SMR + CCUS,
Gasification + CCUS
The color of the Hydrogen type cell indicates the color code of H2.
Disclaimer/Publisher’s Note: The statements, opinions and data contained in all publications are solely those of the individual author(s) and contributor(s) and not of MDPI and/or the editor(s). MDPI and/or the editor(s) disclaim responsibility for any injury to people or property resulting from any ideas, methods, instructions or products referred to in the content.