Abstract
Metakaolin-based geopolymers with different molar ratios of Si/Al were synthesized and utilized as an efficient adsorbent for the removal of methylene blue (MB) as a model cationic dye from aqueous solution. Various analytical techniques were employed to characterize the synthesized geopolymers. The influence of the main operation conditions on the adsorption kinetics of MB onto the geopolymer was examined under various operating conditions. Results showed a significant maximum MB adsorption capacity at the temperature of 30 °C for all four types of geopolymers studied (designated as A, B, C, and D) up to 35.3, 23.6, 25.5, and 19.0 mg g−1, respectively. The corresponding order of Si/Al ratio was A < C < B < D. Adsorption kinetics was so fast and reached equilibrium in 10 min, and the experimental results were described using the adsorption dynamic intraparticle model (ADIM). The equilibrium data for MB removal was in agreement with the Langmuir isotherm.
1. Introduction
The continuous growth of the global population has fueled an increasing demand for industrial products, driving the expansion of various industrial sectors [1,2]. This rapid industrialization has concurrently led to the generation of large volumes of wastewater containing hazardous chemicals and dyes [3,4]. Effective wastewater treatment is thus essential to eliminate harmful pollutants before environmental discharge, as insufficiently treated effluents pose serious risks to ecosystems and human health [5,6] and inadequately treated wastewater has the potential to cause adverse effects on both the environment and human health [7].
Wastewater treatment plays an important role in mitigating the environmental impact of industrial processes and supporting sustainable production. The textile industry is a major contributor, consuming substantial amounts of water during manufacturing [8]. Wastewater from textile operations is typically laden with toxic heavy metals (e.g., chromium, antimony, cobalt) and persistent organic compounds such as dyes [8,9]. Among these, dye pollutants are especially concerning, given that global dye production exceeds 700,000 tons annually [10,11]. It is estimated that around 2% of these dyes are discharged into aquatic environments, either untreated or partially treated. This results in considerable environmental contamination [12,13].
Dyes are grouped by their chemical properties, application process, and specific areas of use [14,15], and many of them are toxic and even carcinogenic [16]. Moreover, they reduce light penetration in aquatic systems, disrupting photosynthetic processes and causing metal-induced microtoxicity in marine life [17,18,19,20]. Their high stability against biological degradation, light, heat, and oxidants renders dye-contaminated wastewater especially challenging to treat [13,21,22,23]. Over the past three decades, numerous treatment technologies have been explored, including photocatalysis [4,24], sonochemical degradation, electrochemical degradation, integrated chemical–biological degradation, precipitation processes, coagulation, flocculation, and ion exchange methods [10,25,26,27]. Among these, adsorption stands out for its operational simplicity, cost-effectiveness, and resilience to toxic compounds. Notably, it does not generate harmful byproducts [28,29].
Methylene blue (MB) is a widely used cationic dye in the textile, paper, and leather industries due to its strong color, solubility, and cost-effectiveness. However, its discharge into aquatic environments poses significant environmental and health risks [30,31]. Even at low concentrations, MB can cause harmful effects such as skin irritation, eye burns, nausea, and respiratory issues in humans, and it disrupts photosynthetic activity in aquatic organisms by reducing light penetration [30,31]. Moreover, MB is resistant to natural degradation and conventional wastewater treatments, persisting in effluents and contributing to long-term pollution [30,31].
While many adsorbents have been examined for MB removal [32,33]. The search for low-cost and efficient alternatives remains a focus of current research. Various unconventional materials such as fly ash, pine leaves, mango seeds, and clays have been tested with promising results in some cases, showing good removal capacities [34]. Table 1 summarizes recent studies (the past two years) investigating MB adsorption onto nontraditional materials, considering parameters such as cost, environmental impact, and removal efficiency. Despite progress, the economic feasibility of adsorption processes can only be enhanced through the use of low-cost sorbents.
This study explores the use of four geopolymer adsorbents synthesized from two distinct types of metakaolin for MB removal. Geopolymers are amorphous synthetic aluminum silicate materials [35,36]. They are structurally similar to tectosilicates, composed of a three-dimensional network of SiO44− tetrahedra partially substituted by Al [35,37,38,39]. They are typically formed via geopolymerization, which is a low-temperature (25–60 °C) polycondensation reaction involving an aluminosilicate precursor and a highly alkaline activator [35,40]. The process forms a cohesive gel that binds residual solids and allows the incorporation of fillers. Geopolymers are advantageous due to their rapid setting time (5–10 h), minimal shrinkage, low energy requirements, and ability to be synthesized in situ without mechanical processing [41,42]. Their environmental and economic sustainability further strengthens their appeal [37,43].
Metakaolin, a commonly used precursor, is favored for its high pozzolanic activity and silica content, contributing to the strength and durability of the resulting geopolymer [37,44,45,46]. It is also considered an environmentally friendly choice, as it can be derived from kaolin mining byproducts, thus minimizing industrial waste [47,48].
This study offers a novel contribution to the field of wastewater treatment by evaluating the adsorption performance of metakaolin-based geopolymers, with varying Si/Al ratios, for MB removal and comparing it to conventional materials such as activated carbon. Moreover, it provides a comprehensive investigation of adsorption kinetics and thermodynamics, supported by the application of the Adsorption Dynamic Intraparticle Model (ADIM), which remains scarcely reported in the literature. The estimation of the key design parameters such as tortuosity and surface diffusivity is essential for future scale-up and design of continuous systems. Furthermore, this work builds upon our earlier studies on the application of the ADIM model [49,50,51] and the development of functional materials for water purification [4,51,52]. This will advance the understanding and the application of geopolymer-based sorbents for environmental applications.

Table 1.
Some previously published works on the adsorption of MB using various types of adsorbents.
Table 1.
Some previously published works on the adsorption of MB using various types of adsorbents.
| Adsorbent | Process Parameters | Maximum Adsorption Capacity [mg g−1] | Kinetic Model/s | Thermodynamic Model/s * | Highlights | Ref. |
|---|---|---|---|---|---|---|
| Carboxylate-functionalized Hydrochar (CFHC) |
| at 30 °C: 155.57 |
|
|
| [29] |
| MFI zeolite (NZ) and ZSM-5 zeolite (CZ) |
| at 25 °C:
|
|
|
| [53] |
| Natural clay |
| at 25 °C: 113.63 |
|
|
| [54] |
| Cellulose, clay, and sodium alginate composites |
| at 30 °C: 113.63 |
|
|
| [55] |
| Natural clay Na-bentonite |
| at 30 °C: 24.99 |
|
|
| [56] |
| Moroccan clays |
| at 60 °C: 456.62 |
|
|
| [57] |
| Foamed metakaolin-based geopolymer |
| at 25 °C: 39.52 |
|
|
| [58] |
| 3D-printed red mud/metakaolin-based geopolymers |
| at 25 °C: 456.62 |
|
|
| [59] |
| Geopolymer derived from Partially De-aluminated Metakaolin (PDK) |
| at 25 °C: 8.00 |
|
|
| [60] |
| Metakaolin-based geopolymers |
| Maximum adsorption capacity of geopolymers at 30 °C: Type A: 35.3 [mg g−1] Type B: 23.6 [mg g−1] Type C: 25.5 [mg g−1] Type D: 19.0 [mg g−1] |
|
|
| This study |
* Pseudo first-order (PFO), Pseudo second-order (PSO), Weber–Morris intraparticle diffusion (WMID), Adsorption dynamic intraparticle model (ADIM).
2. Materials and Methods
MB (MW = 319.76 g/mol) powder with purity > 98% was supplied by ICN Biomedicals (Inc., Aurora, OH, USA). Commercial granular activated carbon DARCO 20–40 mesh (specific surface area of 650 m2/g, average pore diameter of 3.7 nm, total pore volume of 0.748 cm3/g) was supplied by Sigma Aldrich (Milan, Italy). Bi-distilled Milli-Q water, also filtered using 0.20 µm filters, was obtained through Merck Millipore (Darmstadt, Germany). Metakaolin MetaMax® (by BASF) was provided by Neuvendis s.p.a. (Milan, Italy), and metakaolin Mefisto® was supplied by Neuchem S.r.l. (Milan, Italy). The sodium silicate solution was supplied by Prochin Italia S.r.l. (Caserta, Italy). The chemical composition of metakaolin and sodium silicate solution is shown in Table S1. Sodium hydroxide of reagent grade was supplied by Sigma-Aldrich (Milan, Italy). All materials were used as received without further purification.
2.1. Synthesis and Characterization of Geopolymers
The synthesis of the four metakaolin-based geopolymer formulations was performed in the form of dense specimens. The specific quantities of each component used are detailed in Table S2, while Table S3 presents the corresponding molar ratios of Si/Al, Si/Na, and Al/Na. The activating alkaline solution was prepared by gradually dissolving solid sodium hydroxide into a sodium silicate solution. Given the highly exothermic nature of the reaction, this step was conducted in a water-ice bath with continuous stirring until complete dissolution was achieved. The solution was then left to cool at ambient conditions for 24 h. The final composition of the activating solution was approximately Na2O: 1.34 SiO2: 10.48 H2O. Subsequently, varying amounts of metakaolin were incorporated into the cooled alkaline solution, followed by mechanical mixing at 500 rpm to ensure homogeneity. The resulting mixtures were cast into molds and sealed under 95% relative humidity at room temperature (23 ± 2 °C) for 24 h. The specimens were transferred to an oven and maintained at 60 °C for an additional 24 h. Post-heating, the samples remained sealed at room temperature for another five days to promote further curing. Finally, they were unsealed and aged at ambient conditions for 21 days to complete the geopolymerization process. Representative images of the synthesized geopolymer samples are shown in Figure S1.
A variety of techniques were employed to characterize the synthesized metakaolin-based geopolymers. Wide-angle X-ray diffraction profiles were recorded with an Empyrean automatic powder diffractometer (PANalytical), using Cukα radiation (λ = 1.5418 Å) filtered with nickel. The profiles were recorded by continuous scanning of the 2θ diffraction angle, in the range 5–60°, at a speed of 0.02°/s (Δ2θ = 0.1° and Δt = 5 s). The phase recognition was carried out by using the ICDD-PDF-4+ 2021 (International Centre for Diffraction Data®) database. The morphological properties of the geopolymers were investigated using Scanning Electron Microscopy (SEM) technique by FEI Nova NanoSEM 450 at an accelerating voltage of 5 kV with Everhart Thornley Detector (ETD) on fresh fracture surfaces, after metallization with Au-Pd. Jasco ultra-violet and visible (V-550 UV/VIS Spectrophotometer) was used to detect the residual MB amounts in the aqueous solutions after the adsorption. MB shows a major absorption band at 665 nm [61]. As illustrated in Figure S2, the calibration curve equation is valid across the concentration interval of 0.0–0.5 mol m−3.
N2 physisorption analysis was conducted using a Micrometrics ASAP, 2020Plus to determine the surface area and the pore volume of the geopolymers.
The samples were previously outgassed at 200 °C for 3 h to remove water and other atmospheric contaminants. The specific surface area was calculated according to the Brunauer–Emmett–Teller (BET) method (SBET); the total pore volume (Vp) was determined from the amount of desorption N2 at P/P0 = 0.99. BJH pore-size distribution was determined by the desorption branch of isotherms [52].
Zeta potential measurements were carried out using the following instrument: Zetasizer Nano-ZSP (Malvern®, Worcestershire, UK), equipped with a helium-neon laser of 4 mW output power with a fixed wavelength of 633 nm (wavelength of laser red emission). A set of samples containing six aqueous solutions at different pH (from 3 to 14) was prepared. Experiments were carried out at a constant temperature (25.0 ± 0.1) °C.
To conduct FTIR analysis, pristine Geopolymer A was finely ground with anhydrous KBr, then pressed into a pellet, using KBr as both a diluent and reference. The spectra were obtained at a resolution of 2 cm−1 over the range of 400–4000 cm−1 using FT-IR 4700LE (JASCO, Tokyo, Japan) with ATR (attenuated total reflectance). To identify the interaction between Geopolymer A and MB, the pellet was covered with a drop of a saturated MB solution.
2.2. Pre-Treatment of Geopolymers
Before being used in the adsorption tests, the synthesized geopolymers were ball-milled using Retsch GmbH Mills-Type PM 100 CM. The collected powder was sieved in the range 17–112 μm to have a uniform particle size. The samples were washed two times, under stirring at 600 rpm, with 500 mL of water for 30 min. This step was repeated four times under the same stirring rate until the pH value no longer showed appreciable variations and settled around the value of 8. The pH values were measured by using a Metrohm 914 pH meter. These washing cycles were necessary to remove salts and other impurities. The collected samples were dried in the oven at 60 °C overnight.
2.3. Sorbents Screening Experiments
To investigate the pH effect on adsorption capacity, each geopolymer (0.100 g) was suspended in 10 mL of water, and the pH of each solution was adjusted to 2, 5, 7, 9, and 12 using HCl or NaOH solutions (0.1 M). After adjusting the pH, the solid was separated, and all samples were dried at 100 °C overnight. Then, batch adsorption screening tests were conducted by adding 5 mg of each geopolymer (treated at different pH levels) to vials containing 10 mL of a 15 mg L−1 MB solution. The vials were placed in a thermostatic bath at 30 °C for 24 h and stirred magnetically at 500 rpm.
The pH of the dye solution in contact with the adsorbent was measured, and vials were sealed. After the test, the samples were centrifuged at 3000 rpm for 60 min to separate the solid, and the concentration of MB in the supernatant aqueous solution was detected by means of a UV/VIS Jasco V-550 spectrophotometer. The uptake of MB qads (mg g−1) was calculated as in Equation (1).
where V is the solution volume (mL), c0 is the initial MB concentration (mg L−1), ce is the equilibrium MB concentration (mg L−1), and wads is the weight of the dry geopolymer (g). Once the ideal pH conditions were determined, the performance of the different geopolymers was tested and compared under the same experimental conditions. The aim was to identify the best-performing geopolymer in terms of MB adsorption uptake.
2.4. Thermodynamic and Kinetic Experiments
The adsorption isotherm experiments of MB onto the chosen geopolymer were performed at three different temperatures, i.e., 30, 40, and 50 °C, respectively, at the ideal pH conditions determined by a previous investigation. A fixed quantity of the adsorbent (5 mg) was suspended in 10 mL of MB solutions with different initial concentrations (5–30 mg L−1). The vials were placed in a water bath at constant temperature, and the solution was kept under stirring at 500 rpm for 3 h. The adsorption kinetics of MB onto the geopolymer was examined under various operating conditions, which are as follows: temperature, solid bulk density (i.e., the sorbent mass per liquid phase volume), initial MB concentration, and agitation speed as listed in Table S4. In a typical kinetics investigation, 250 mL of MB solution was prepared with a concentration of 30 mg L−1 and then loaded in a 500 cm3 glass jacketed three-necked reactor equipped with an impeller ensuring the desired rotational speed and connected to a thermostat to ensure temperature control. Then, 125 mg of the geopolymer was added to the solution and stirred at 450 rpm. After closing the reactor with its lid, it was coupled to a thermostat set to the desired reaction temperature. Samples were withdrawn with a syringe at different time intervals (0, 2, 4, 6, 8, 10, 30, and 60 min), then stored in sealed vials for subsequent centrifugation at 3000 rpm for 60 min and UV–VIS analysis.
2.5. Modeling Activity
To accurately interpret the kinetic data from batch experiments, a mathematical model that considers all relevant molecular-scale interactions is required. Accordingly, the ADIM was applied to model the adsorption kinetics of MB on the Type A geopolymer. This mathematical model was proposed by Russo et al. [49], who tested it on a wide number of pollutant/adsorbent systems of different chemical natures, demonstrating its general applicability [62]. In particular, the ADIM successfully described the adsorption kinetics of MB over silica in both batch and continuous devices [63]. According to the model, the adsorption of the pollutant occurs in a four-steps mechanism: first, the dye molecules diffuse from the bulk liquid phase, where its concentration is assumed to be constant in a fixed time t, to the liquid film surrounding the solid; the adsorbate reaches the solid surface through the film diffusion and then it diffuses along the particle radius in the pore; a local equilibrium is established between the liquid and solid phases inside the particle; and finally, the solute can diffuse on the adsorbent surface. The system was considered isothermal; the adsorbent particles were assumed to be spherical (shape factor s = 2), with the same size, and characterized by an average porosity and tortuosity factor; the intraparticle equilibrium is described, in this case, by the Langmuir adsorption isotherm. Based on the above-mentioned mechanism and the proposed hypotheses, by dividing the system into two main domains (i.e., the liquid bulk and the intraparticle regions), the mass balance (Equations (2) and (3)) for the batch system is:
where CB is the liquid bulk concentration of MB, ε′ the fluid bulk/solid phase volumetric ratio, km the fluid/solid mass transfer coefficient, asp the sorbent specific surface area per volume of particle, and CL the concentration in the liquid phase inside the pores of the solid particle.
where ε is the porosity of the adsorbent, CS is the concentration of the adsorbate on the solid surface, rp is the sorbent radius, s is the shape factor, DP is the effective pore diffusion coefficient, DS is the surface diffusion coefficient, and CS* is the solute saturation concentration on the solid. Equation (2) describes the mass balance of the bulk phase where the accumulation term equals the fluid/solid mass transfer, while in Equation (3), the overall accumulation term (for the liquid and the solid phase concentration inside the particle) equals the sum of the pore and surface diffusion limitations, which are dependent on the values of the effective diffusivity DP and the surface diffusivity DS, respectively. The DP value can be easily calculated from the molecular diffusivity of the solute in the bulk liquid phase D0 (estimated from the Wilke–Chang correlation [64] multiplied by the ratio between the porosity of the solid ε and the tortuosity factor τ (Equation (4)).
The values of DS range in the order of magnitude of 10−12 and 10−18 m2/s, and it depends on the interactions between the adsorbate and the adsorbent, so it is not directly calculable. Thus, it is estimated by fitting the experimental data.
The boundary conditions to solve the system of partial differential equations are (i) at the particle center (rp = 0), a symmetry condition is applied to ensure continuity in both the liquid and solid phase concentration profiles (Equations (5) and (6)); (ii) the surface steady-state hypothesis at rp = Rp expressed by Equation (7).
Another important condition is the local equilibrium between the concentration of the solute in the liquid and solid phase inside the particle, which is assumed to occur instantaneously, and it is expressed by the Langmuir adsorption isotherm (Equation (8)). The latter is used to evaluate the solute concentration in the solid (CS) at the equilibrium.
The model’s equations can be easily rearranged to accommodate other thermodynamic models, such as the Freundlich model (Equation (9)). The detailed derivation of these mathematical equations is provided in reference [41].
KF is the Freundlich constant related to the adsorption capacity, and 1/n is the adsorption intensity factor. It is worth noting that the isotherm parameters (CS* and b for the Langmuir model; KF and n for the Freundlich model) were estimated by non-linear regression of the experimental data obtained from the thermodynamic tests. The fitting was performed using the NLFit tool in OriginPro 2018, which employs the Levenberg–Marquardt algorithm to determine the optimal parameters by minimizing the sum of squared residuals. After obtaining these thermodynamic parameters and determining the best appropriate isotherm model, they were directly included into the mathematical model (ADIM) for the adsorption kinetic curve fitting.
The simultaneous solution of partial differential equations (PDEs), ordinary differential equations (ODEs), and algebraic equations (AEs) is rather difficult to perform. The method of lines, in particular, the second-order centered finite difference method, was adopted for discretizing the coordinate in 100 points, thus converting the problem into a system of ODEs to obtain the bulk concentration profile vs. time. The model equations were implemented in gPROMS ModelBuilder v.4.0 to perform all the calculations and to estimate the values of the surface diffusivity DS and the tortuosity factor τ by submitting the experimental data to non-linear regression analysis. The parameter estimation is performed by the software through the Maximum Likelihood Approach algorithm, which attempts to determine values for the unknown parameters by minimizing the following objective function (Equation (10)).
where N is the total number of measurements taken during all the experiments, ϑ is the set of model parameters to be estimated; NE is the number of experiments performed; NVi is the number of variables measured in the ith experiment; NMij is the number of measurements of the jth variable in the ith experiment; σijk is the variance of the kth measurement of variable j in experiment i; z′ijk is the kth measured value of variable j in experiment i; and zijk is the kth (model-)predicted value of variable j in experiment i.
A list of the input parameters for the model is reported in Table 2. The value of the particle radius (RP) was determined from the mean particle diameter, which was evaluated through granulometric distribution analysis. The specific geometric area (asp) of the solid is defined as the ratio between its surface and volume, assuming a spherical shape. The particle porosity (ε) was calculated by multiplying the pore volume by the apparent density of the solid. Given the absence of external mass transfer limitations in the system, the external mass transfer coefficient, km, was held constant at a high value, as will be detailed later.
Table 2.
Input parameters for the model.
3. Results and Discussion
3.1. Characterization of the Sorbents
Figure 1 displays the wide-angle X-ray diffraction (WAXD) patterns of the four synthesized metakaolin-based geopolymers. The diffraction profiles indicate that the samples are predominantly amorphous, as expected for geopolymeric materials. However, several crystalline peaks are observed, corresponding to residual kaolinite, quartz, and anatase, which were already present in the original metakaolin precursors (see Figure S4). Additionally, peaks attributed to trona (sodium hydrogen carbonate hydrate) are evident, likely formed during the geopolymerization process.
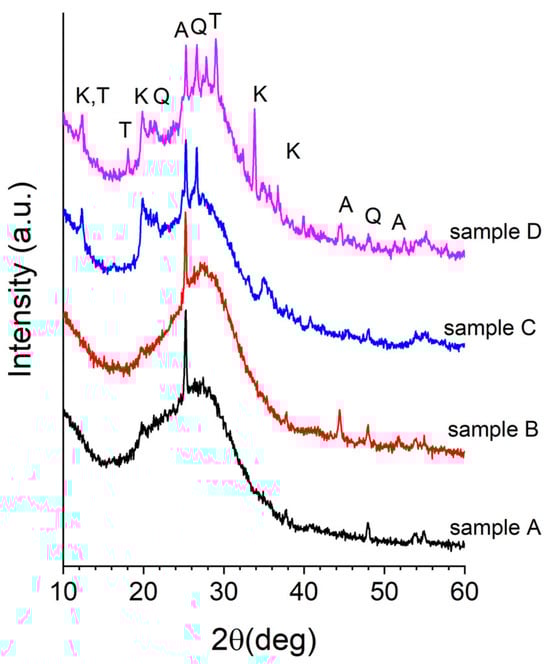
Figure 1.
WAXD patterns of the geopolymers A, B, C, and D. Main diffraction peaks of the crystalline phases have been indicated: A—anatase (01-070-7348); K—kaolinite (01-080-0886); Q—quartz (01-083-0539); T—trona (00-001-1077).
Figure 2 presents SEM micrographs illustrating the surface morphology of the synthesized geopolymers. Across all samples (Figure 2A–D), the morphology is consistent with that typically observed in geopolymeric materials that are characterized by a relatively homogeneous and continuous matrix. Small fractures are visible and are presumed to result from mechanical stress induced during the preparation of fresh fracture surfaces for SEM imaging. Lamellar crystalline structures, identified as unreacted kaolinite (also confirmed by the XRD patterns in Figure 1), are clearly visible due to their distinctive morphology. Minor quantities of similar lamellar features, again likely corresponding to unreacted kaolinite, are also detectable.
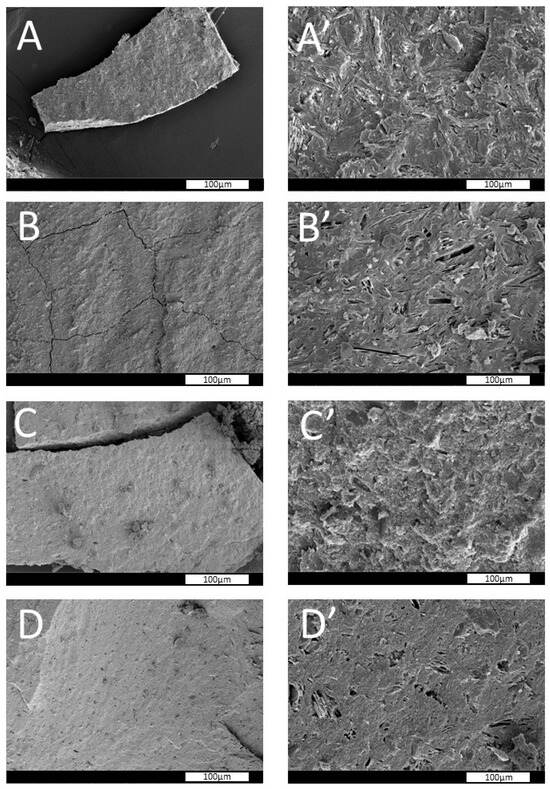
Figure 2.
SEM images of fresh fracture surfaces of geopolymers (A–D) at different magnifications: (A–D) 1000×; (A’–D’) 10,000×.
High-magnification SEM images (Figure 2A’–D’) further reveal the characteristic nanostructured morphology of geopolymeric gels. These micrographs highlight the presence of nanoscale spherical features, indicative of the gel-phase evolution that occurs during the polycondensation process. Such features are typical of geopolymer networks and further support the successful synthesis of the intended amorphous geopolymers [37,44].
Geopolymers possess surface areas that are about ten times lower than those observed for commercial activated carbon, indicating distinct textural properties. Specifically, the values of specific surface area, Sbet, vary in the range 50–34 m2 g−1 (sample A to D) compared with 650 m2 g−1 for commercial activated carbon. For the Type A geopolymer sample, which exhibited the highest adsorption capacity and affinity for MB (as discussed below), the N2 adsorption–desorption isotherms are presented in Figure 3.
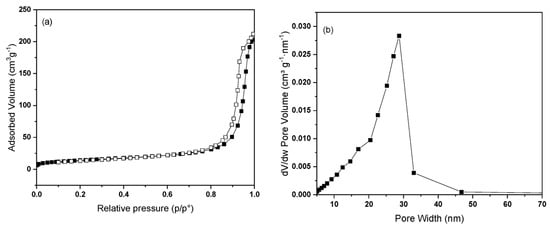
Figure 3.
(a) N2 adsorption/desorption isotherms at −196 °C of geopolymer type A. Adsorption and desorption branches were indicated with filled and empty symbols, respectively. (b) BJH pore-size distribution (PSD) plot obtained from the desorption branch of the isotherm for geopolymer type A.
According to the IUPAC classification, the shape of the isotherm corresponds to a type IV isotherm, which is characteristic of mesoporous adsorbents, containing pores with diameters between 2 and 50 nanometers. In these mesopores, adsorption behavior is governed by interactions between the adsorbent surface and the adsorbate molecules, as well as intermolecular forces among molecules in their condensed state within the pores. A key feature of type IV isotherms, shared with type II isotherms, is the initial adsorption of a monolayer followed by multilayer formation on the pore walls, eventually leading to a saturation plateau. This plateau represents the pore filling stage, but its length can vary. In some cases, such as the isotherm shown in Figure 3a, the plateau is reduced to a simple inflection point rather than a flat region.
With pores larger than 4 nm (in the case of N2 adsorption), capillary condensation is followed by hysteresis, which returns information about the pore shape. The hysteresis observed in Figure 3a can be classified as type I, which is characteristic of materials with a limited range of uniform mesopores (cylindrical type). The type 3 hysteresis associated with a type II adsorption branch, characteristic of plate-like particles, does not seem to be the case here because it lacks the step-down to close the hysteresis and because the lower limit of the desorption branch is normally located at the lowest p/p0 value, which is those induced by cavitation [65].
The pore-size distribution, PSD, is shown in Figure 3b. As expected from the adsorption/desorption isotherm analysis, geopolymer A exhibits a fairly narrow pore-size distribution centered on a value of about 30 nm, denoting the presence of large mesopores. A shoulder can also be observed at around 16 nm. The value of total pore volume obtained by processing adsorption/desorption isotherms corresponds to 0.33 cm3 g−1, less than half that of commercial activated carbon (0.75 cm3 g−1).
Figure 4 shows the FT-IR spectra obtained for geopolymer type A before (pristine) and after MB adsorption. Water peaks in the geopolymer’s FTIR spectra at 3433–1658 cm−1 are given to -O–H stretching and deformation, and H–O–H hydrogen binding from the water molecules. At 1476 cm−1, there is the stretching vibration of O-C-O, and the peak at 1042 cm−1 is caused by Si–O–Si deformation and stretching vibration of groups Si-O and the asymmetric Al-O-Al/Si-O-Si stretching. The signal at 734 cm−1 represents the bending vibration Si-O-Si, and the peak at 601 cm−1 is caused by Al–O–Si bending vibration, while at 450 cm−1, there is a characteristic band Al-O/Si-O bending vibration. After being in contact with MB, additional features appeared on the band centered at ~1678 cm−1, belonging to the stretching vibration of aromatic rings, and the peak at 1511 cm−1 corresponds to vibrations of the C-C and -C-N bonds in the heterocycle that evidence the fixation of MB on the geopolymer [66].
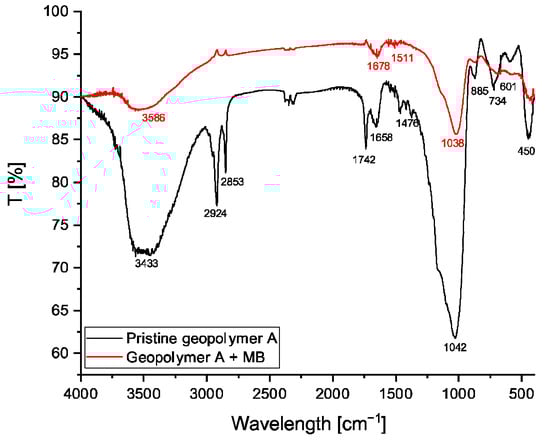
Figure 4.
FT-IR spectra of pristine geopolymer type A (black) and after saturated MB addition (red).
Additionally, the observed narrowing of the O–H stretching band at (3586 cm−1) and the aluminosilicate vibration band at (1042 cm−1) is likely attributed to the exchange of Na+ counter ions with MB+ ions, along with other molecular interactions [67].
Taking into consideration the physicochemical characteristics of geopolymer discussed above, possible mechanisms associated with MB removal could be electrostatic interactions between the negative sites of geopolymers and positive sites of MB+ and ion exchange between the MB cations and counterions (Na+, K+, Mg2+, and Ca2+).
Zeta potential analysis at different pH values was reported in Figure 5 at a refraction index of 2.3. The adsorbent’s zeta potential is negative within the studied pH interval (3.1, 4.6, 7.3, 9.6, 10.8, and 12.2), reaching the highest charge density at pH of ~10.8.
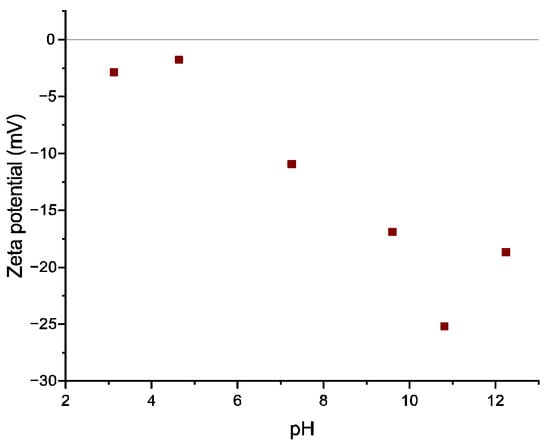
Figure 5.
Zeta-potential change with the solution pH of the geopolymer.
The zeta potential then stabilizes until pH values are close to 11, before increasing once more at higher pH values (~12). This trend indicates that pH values between 10.8 and 11 will induce the maximum attraction between the adsorbent (negatively charged) and the cationic adsorbate, and therefore promote higher MB removal efficiency [68].
In Figure S3, it can be seen that MB uptake onto the geopolymer increases as pH values increase. This is due to the electrostatic interaction of cationic dye MB with the negatively charged surface of the geopolymer; indeed, the Z-potential measurement shows that the geopolymer A negative surface charge increases with an increase in solution pH (see Figure 5). The adsorbed quantity value, pads [%], at acid pH is small due to the low amount of negative charge present on the adsorbent surface, and the lower adsorption of MB at acidic pH might be due to the presence of excess H+ ions competing with dye cations for the available adsorption sites. This can be explained by the electrostatic interaction of cationic dye MB with the negatively charged surface of the geopolymer.
3.2. Adsorption Screening Experiments
The adsorption tests conducted using geopolymers treated at different pH levels allowed the identification of the ideal pH conditions for maximum adsorption capacity (see Figure S3). As revealed, the best adsorption performance was obtained at pH > 5. Since the typical pH value of real industrial wastewater containing MB is pH = 7, the investigation was continued by fixing pH at 7.
Further, each geopolymer was subjected to an adsorption experiment to evaluate the adsorption performance of the four types of geopolymers, under identical experimental conditions (T = 30 °C, C0 = 8.02 × 10⁻² mol m−3; ρbulk = 0.50 kg m−3, v = 450 rpm, pH = 7). The uptake (qads) of MB for the four synthetic geopolymers is shown in Figure 6. As revealed, geopolymer A shows the highest adsorption performance. This could be explained by taking into account that geopolymer A shows the highest surface area and pore volume among the studied samples, but also the lowest Si/Al ratio.
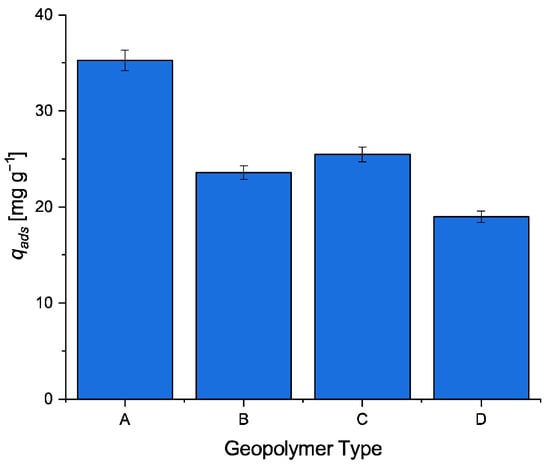
Figure 6.
Adsorption uptake of MB by using different synthetic geopolymers.
Furthermore, the adsorption capacity of type A geopolymer was compared with commercial activated carbon under the same operational conditions. Type A geopolymer is characterized by a surface area of 51 m2 g−1, while activated carbon has a surface area of 650 m2 g−1, which is 10 times larger. For this reason, it is more appropriate to normalize the qads results based on the surface area of the adsorbent (Figure 7). It is evident that the adsorption capacity towards MB of the type A geopolymer is significantly higher than that of activated carbon for the same surface area. The obtained results are proof of the great potential of this novel adsorbent in the removal of cationic dyes from wastewater.
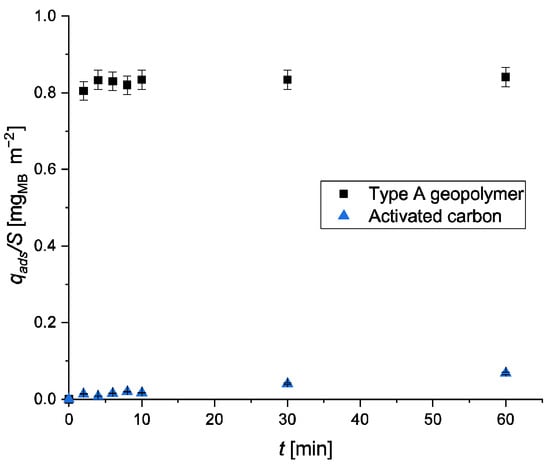
Figure 7.
Adsorption uptake of MB normalized by the surface area of the adsorbent.
For the mentioned reasons, geopolymer A was selected for kinetic and thermodynamic investigation since it displayed the highest uptake and affinity towards MB in comparison with types B, C, and D.
3.3. Adsorption Isotherms
To evaluate the adsorption capacity of the Type A geopolymer and establish the corresponding adsorption isotherm, a series of experiments was performed at three different temperatures: 30, 40, and 50 °C. The experimental data obtained were analyzed using the Langmuir and Freundlich isotherm models, whose mathematical expressions are reported in Equations (8) and (9), respectively (see Section 2.5). The results presented in Figure 8 clearly demonstrate that the experimental data are best described by the Langmuir isotherm model. According to this model, MB adsorption occurs through monolayer coverage on a homogeneous surface, with no significant interactions between adsorbed molecules. The mathematical formulation of the Langmuir isotherm is provided in Equation (8). The corresponding model parameters, along with their 95% confidence intervals, are summarized in Table 3, while the quality of the model fit is illustrated in Figure 8. This finding is in agreement with previous studies by Gonçalves et al. [59] and Kaya-Özkiper et al. [69], who also observed Langmuir-type behavior in the adsorption of MB using similar geopolymer-based adsorbents, suggesting a consistent adsorption mechanism governed by surface saturation rather than multilayer or heterogeneous adsorption.
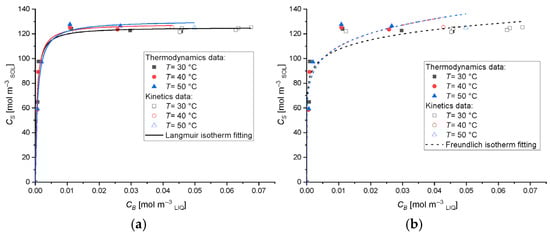
Figure 8.
(a) Langmuir and (b) Freundlich isotherm plots for the adsorption of MB dye on Type A geopolymer at different temperatures.
Table 3.
Estimated adsorption parameters of the Langmuir model.
Starting from the parameters obtained by data fit on the adsorption isotherms, it was possible to calculate some important thermodynamic parameters, essential to describe the adsorption process. The thermodynamic parameters were estimated according to Equations (11) and (12) [70,71].
where b is the Langmuir adsorption parameter (m3 mol−1), ΔG° (kJ mol−1) is the activation Gibbs free energy, Kc is the equilibrium constant (-), ΔH° (kJ mol−1) is the change in enthalpy, ΔS° (kJ mol−1 K−1) is the change in entropy, R is the ideal gas constant (8.314 J mol−1 K−1), and T is the absolute temperature (K).
The key thermodynamic parameters (ΔG°, ΔH°, and ΔS°) associated with the adsorption of MB onto the Type A geopolymer at temperatures of 303, 313, and 323 K are summarized in Table 4.
Table 4.
Kinetic and thermodynamic parameters for the adsorption of MB used on Type A geopolymer.
The negative values of ΔG° confirm the spontaneous nature of the adsorption process and indicate a strong affinity of MB molecules towards the Type A geopolymer [72]. Furthermore, the negative value of ΔH° reveals that the adsorption is exothermic, which may be attributed to the disruption of interactions or binding sites between the MB dye and the geopolymer surface. The relatively low absolute value of ΔH° also suggests that the adsorption is predominantly physical in nature [54,72,73]. In addition, the positive value of ΔS° reflects an increase in randomness at the solid–liquid interface during adsorption, further supporting the spontaneity of the process [67,74,75].
3.4. Adsorption Kinetics
Dedicated experiments were carried out to investigate the adsorption kinetics of MB onto the Type A geopolymer. The results are presented as the normalized bulk liquid concentration (CB/C0) plotted against time (t), providing insight into the temporal evolution of the adsorption process. The kinetic study was performed under various experimental conditions, as detailed in Table S4, by systematically varying parameters such as the impeller stirring rate, the initial dye concentration, the sorbent bulk density, and the temperature.
Figure 9 presents the concentration profiles at different stirring rates ν, clearly indicating the absence of external mass transfer limitations within the adsorption kinetic network; thus, a sufficiently high fluid–solid mass transfer coefficient, km, is expected.
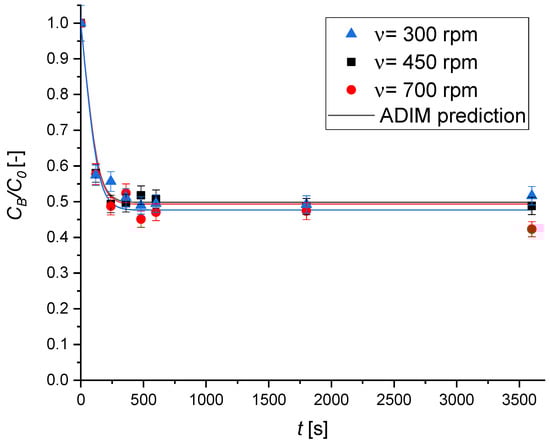
Figure 9.
The effect of the stirring rate on the MB adsorption kinetics over Type A geopolymer. Experimental conditions are T = 30 °C; C0 = 8.02 × 10⁻² mol m−3; ρbulk = 0.50 kg m−3.
The influence of the initial MB concentration is illustrated in Figure 10. As shown, increasing the initial dye concentration leads to a decrease in adsorption efficiency. This trend aligns with the Langmuir adsorption model, which assumes monolayer coverage of adsorbate molecules on a finite number of uniform adsorption sites. This finding is consistent with the findings reported by Elewa et al. [60] for methylene blue adsorption on geopolymeric materials. This trend is commonly observed in adsorption systems because at lower methylene blue concentrations, the ample availability of active sites on the geopolymer surface allows for the effective capture of nearly all dye molecules, resulting in near-complete removal.
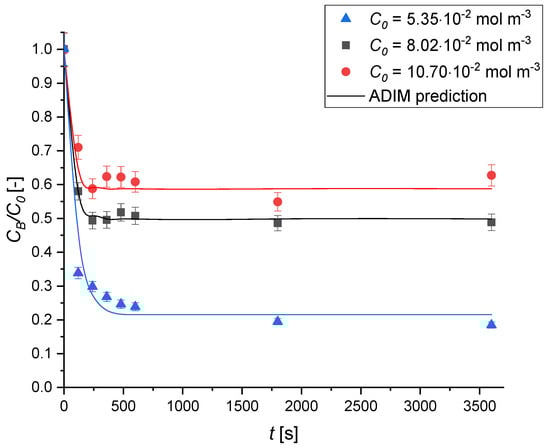
Figure 10.
The effect of the initial concentration on the MB adsorption kinetics over Type A geopolymer. Experimental conditions are T = 30 °C; v = 450 rpm; ρbulk = 0.50 kg m−3.
Figure 11 illustrates the effect of varying sorbent bulk density, achieved by adjusting the mass of geopolymer added to the MB solution, on the adsorption kinetics.
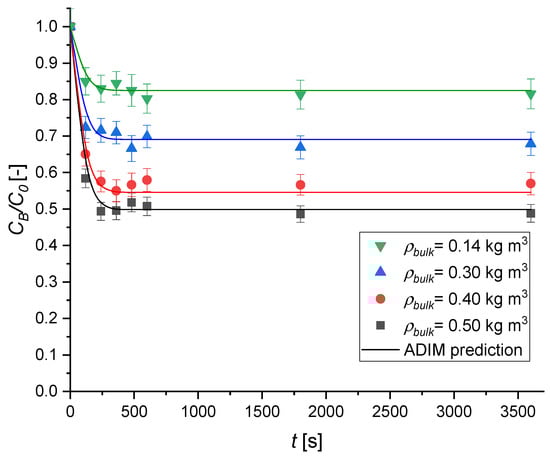
Figure 11.
The effect of the adsorbent bulk density on the MB adsorption kinetics over Type A geopolymer. Experimental conditions are T = 30 °C; v = 450 rpm; C0 = 8.02 × 10⁻² mol m−3.
An increase in sorbent bulk density leads to a noticeable acceleration in adsorption kinetics, with the initial slopes of the concentration profiles becoming steeper. The corresponding dye uptake improves markedly, rising from 15 to 50% by varying ρbulk from 0.14 to 0.50 kg m−3.
Finally, kinetic experiments were conducted at different temperatures. The obtained results, reported in Figure 12, clearly demonstrate that adsorption is only slightly influenced by temperature. This result is in good agreement with what was observed in the thermodynamic investigation.
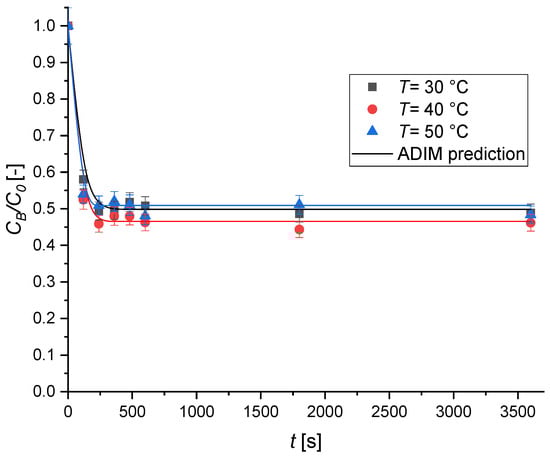
Figure 12.
The effect of the temperature on the MB adsorption kinetics over Type A geopolymer. Experimental conditions were set as v = 450 rpm; C0 = 8.02 × 10⁻² mol m−3, ρbulk = 0.50 kg m−3.
A comparison with the literature indicates that the adsorption capacity achieved in this study (35.5 mg/g) falls within an intermediate range. While some highly engineered or chemically modified materials, such as poly(methacrylic acid)-modified baker’s yeast, have shown very high capacities (up to 869.6 mg/g), many natural or less modified biosorbents (e.g., Streptomyces rimosus or Caulerpa racemosa var. cylindracea) [32] report much lower values, often below 10 mg/g. Recent studies also report extremely high methylene blue (MB) adsorption capacities for advanced hydrogel-based materials, reaching up to 2967.66 mg/g and 2500 mg/g for Fe3O4-reinforced hydrogels, highlighting the significant impact of chemical modification and nanomaterial incorporation [76]. However, these advanced materials and hydrogels often involve complex synthesis routes and high production costs, which may limit their large-scale practical applications. For comparison, the maximum adsorption capacity (qmax) of MB on the GO/ZTO/TO composite reported in the literature is 77.95 mg/g [77], which is higher than the value obtained in our study but still within the same order of magnitude, especially considering that our material was synthesized without advanced surface functionalization. Therefore, the performance of our material is promising, particularly due to its simpler synthesis and potential cost-effectiveness, supporting its practical applicability in MB removal from contaminated water.
The experimental data were analyzed using nonlinear regression. The corresponding model fits are shown in Figure 9, Figure 10, Figure 11 and Figure 12, demonstrating excellent agreement across all tested conditions. This confirms that the ADIM effectively captures the system’s behavior and provides valuable insight into its kinetic characteristics. Through parameter estimation, key transport properties were determined, including the tortuosity of the particles, τ, and that of the surface diffusivity coefficient, DS. Since DS is temperature-dependent, its value was estimated individually at each investigated temperature. The complete results of the parameter estimation are presented in Table 5. The estimated value of tortuosity was found to be in good agreement with values obtained from established correlations for cementitious materials with cylindrical pore structures [78], as given in Equation (13). These findings support the reliability of the parameter estimation and affirm that the derived kinetic parameters realistically represent the structural characteristics of the geopolymer material.
Table 5.
Optimal estimated values of surface diffusivity DS and the tortuosity τ. a Calculated value from the Equation (13).
The dependence of surface diffusivity on temperature can be expressed by an Arrhenius-like equation (Equation (14)) [49]. The estimated values of DS are plotted against the temperature in Figure 13.
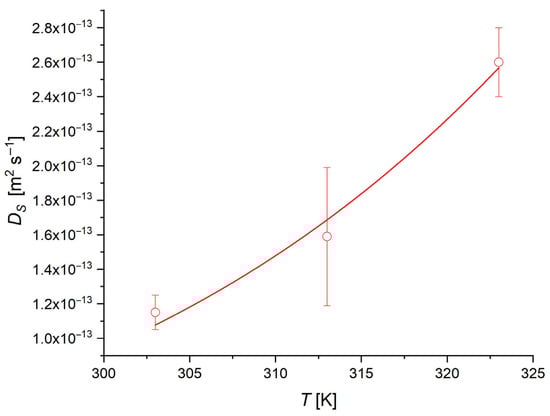
Figure 13.
Surface diffusion coefficient trend as a function of temperature.
From the fitting of the values of DS vs. T, a surface activation energy ES of 35 ± 5 kJ/mol is obtained.
The reliability of the model fitting was further validated by the parity plot shown in Figure 14, which demonstrates that the model predictions closely match the experimental data, falling within a ± 10% confidence interval. Moreover, the high correlation coefficient R2, which is equal to 0.99, confirms the excellent agreement between the predicted and observed values.
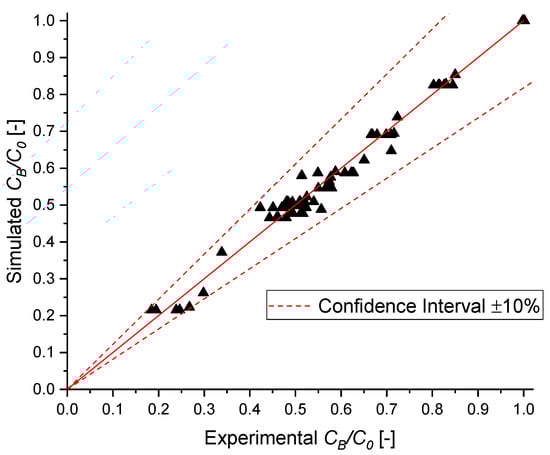
Figure 14.
Parity plot of MB normalized concentration.
4. Conclusions
This study presents the synthesis and application of metakaolin-based geopolymers for the removal of MB, a representative cationic dye commonly found in wastewater. Four geopolymer types were synthesized by varying the Si/Al molar ratios, and their structures were thoroughly characterized using multiple analytical techniques. The results confirmed the formation of amorphous geopolymeric networks with distinct morphological features.
Preliminary adsorption screening demonstrated that the geopolymer labeled Type A exhibited the highest adsorption capacity towards MB. Compared to activated carbon of similar surface area, Type A showed superior performance, attributed to enhanced electrostatic interactions between the cationic dye and the negatively charged geopolymer framework, along with its favorable textural and chemical properties.
A detailed investigation into the adsorption kinetics and equilibrium behavior was conducted through batch experiments. Operational variables such as temperature, adsorbent dosage, initial dye concentration, and agitation speed were systematically explored. The adsorption data were best described by the Langmuir isotherm model, indicating monolayer adsorption on a homogeneous surface with uniform energy distribution. This suggests a strong and specific interaction between MB and active sites on the Type A geopolymer.
To gain further insight into the mass transfer and the diffusion process, the ADIM was employed to extract key diffusion parameters (τ, DS), which are essential for scaling up to continuous flow systems. Thermodynamic analysis confirmed that the adsorption of MB onto the Type A geopolymer was spontaneous and exothermic. Overall, the findings underscore the promising potential of these tailored geopolymers as efficient and sustainable adsorbents for advanced wastewater treatment applications. In addition, the synthesized geopolymers demonstrate potential for economic sustainability. The materials used in their preparation are relatively low-cost and widely available, with energy input and processing costs needed for their synthesis. The rapid adsorption kinetics observed (equilibrium within 10 min) also imply shorter treatment times and lower sorbent usage, both of which contribute to lower operational expenses. While this study did not include a full economic assessment, the outlined factors suggest that these materials offer a cost-effective alternative for dye removal in wastewater treatment.
Supplementary Materials
The following supporting information can be downloaded at: https://www.mdpi.com/article/10.3390/chemengineering9040079/s1, Table S1: Chemical composition expressed as oxides (weight %) of the used metakaolin (MetaMax® and Mefisto®) and sodium silicate solution; Table S2: Summary of the masses of the various components used to produce metakaolin-based geopolymers; Table S3: Chemical composition of the metakaolin-based geopolymers expressed as oxides and Si/Al/Na molar ratios; Table S4: Investigated experimental conditions during the kinetic experiments. C0 represents the methylene blue initial concentration, ρbulk the sorbent bulk density; Figure S1: Optical pictures of the produced geopolymers taken on graph paper (side of small squares 1 mm); Figure S2: UV-VIS calibration curve for MB; Figure S3: Methylene blue adsorption uptake onto different geopolymers treated at different pH levels; Figure S4: Metakaolin diffraction patterns METAMAX (red) and Mefisto (black) as supplied by their respective manufacturers. The diffraction peaks labeled with the letter “A” are typical of anatase, those with the letter “Q” of quartz and those with the letter “K” are characteristic of kaolinite.
Author Contributions
Conceptualization, V.R., O.T. (Oreste Tarallo), and M.D.S.; methodology, M.H., M.D.L., R.P., O.T. (Olimpia Tammaro), and S.E.; software, M.E.F., O.T. (Oreste Tarallo), and V.R.; writing—original draft preparation, M.E.F., V.R., O.T. (Oreste Tarallo), and M.H.; data curation, V.R., O.T. (Oreste Tarallo), C.F., G.R., and R.T.; formal analysis, V.R., O.T. (Oreste Tarallo), C.F., G.R., and R.T.; supervision, O.T. (Oreste Tarallo), M.D.S., and V.R.; funding acquisition, M.D.S.; writing—review and editing, all authors. All authors have read and agreed to the published version of the manuscript.
Funding
This research received no external funding.
Data Availability Statement
Data is contained within the article or Supplementary Material.
Acknowledgments
The fellowship provided by the Faculty for the Future Program—Schlumberger Foundation to Maryam Hmoudah is deeply acknowledged and appreciated. G. R. and O. Tarallo acknowledge PRIN—Bando 2022 PNRR Project “Engineering of eco-sustainable geopolymer-based adsorbent materials for the removal of emerging pollutants and environmental remediation” CUP E53D23017810001. C. F. acknowledges PRIN—Bando 2022 PNRR Project “ZEOREMEDIA: Zeolitic sorbents for water remediation” CUP I53D23006540001.
Conflicts of Interest
No funds were used to conduct this study.
Abbreviations
| List of symbols | |
| asp | geometric specific area, m2·m−3 |
| b | Langmuir adsorption parameter, m3·mol−1 |
| c0 | adsorbate initial concentration, mg·L−1 |
| C0 | adsorbate initial concentration, mol·m−3 |
| Cadsorbent | adsorbent concentration, mg·L−1 |
| CB | solute bulk concentration, mol·m−3 |
| ce | adsorbate equilibrium concentration, mg·L−1 |
| CL | solute concentration in the liquid of the pores, mol·m−3 |
| CS | solute concentration in the solid, mol·m−3 |
| CS* | saturation solute solid concentration, mol·m−3 |
| D0 | molecular diffusivity, m2·s−1 |
| DP | pore diffusivity based on the cross-sectional area, m2·s−1 |
| DS | surface diffusivity, m2·s−1 |
| Kc | equilibrium constant, - |
| km | mass transfer coefficient, m·s−1 |
| MB | Methylene blue |
| MW | Molecular Weight, mol g−1 |
| pads | percentual adsorbed amount at time t, % |
| qads | adsorbed amount at time t, mol kg−1 |
| rP | particle radial coordinate, m |
| RP | particle radius, m |
| s | shape factor, - |
| S | specific surface area, m2 g−1 |
| t | time, s |
| T | temperature, K |
| VP | particle volume, m3 |
| wADS | adsorbent mass, g |
| Greek symbols | |
| ε | solid particle porosity, - |
| ε′ | liquid bulk–solid phase volumetric ratio, - |
| ρbulk | solid bulk density, kg m−3 |
| ρsolid | solid density, kg m−3 |
| τ | tortuosity factor, - |
References
- Tebeje, A.; Worku, Z.; Nkambule, T.T.I.; Fito, J. Adsorption of Chemical Oxygen Demand from Textile Industrial Wastewater through Locally Prepared Bentonite Adsorbent. Int. J. Environ. Sci. Technol. 2022, 19, 1893–1906. [Google Scholar] [CrossRef]
- Russo, V.; Hmoudah, M.; Broccoli, F.; Iesce, M.R.; Jung, O.-S.; Di Serio, M. Applications of Metal Organic Frameworks in Wastewater Treatment: A Review on Adsorption and Photodegradation. Front. Chem. Eng. 2020, 2, 581487. [Google Scholar] [CrossRef]
- Manikandan, S.; Subbaiya, R.; Saravanan, M.; Ponraj, M.; Selvam, M.; Pugazhendhi, A. A Critical Review of Advanced Nanotechnology and Hybrid Membrane Based Water Recycling, Reuse, and Wastewater Treatment Processes. Chemosphere 2022, 289, 132867. [Google Scholar] [CrossRef]
- Gallucci, N.; Hmoudah, M.; Martinez, E.; El-Qanni, A.; Di Serio, M.; Paduano, L.; Vitiello, G.; Russo, V. Photodegradation of Ibuprofen Using CeO2 Nanostructured Materials: Reaction Kinetics, Modeling, and Thermodynamics. J. Environ. Chem. Eng. 2022, 10, 107866. [Google Scholar] [CrossRef]
- Eniola, J.O.; Kumar, R.; Barakat, M.A.; Rashid, J. A Review on Conventional and Advanced Hybrid Technologies for Pharmaceutical Wastewater Treatment. J. Clean. Prod. 2022, 356, 131826. [Google Scholar] [CrossRef]
- Rathi, B.S.; Kumar, P.S. Application of Adsorption Process for Effective Removal of Emerging Contaminants from Water and Wastewater. Environ. Pollut. 2021, 280, 116995. [Google Scholar] [CrossRef]
- Garg, S.; Chowdhury, Z.Z.; Faisal, A.N.M.; Rumjit, N.P.; Thomas, P. Impact of Industrial Wastewater on Environment and Human Health. In Advanced Industrial Wastewater Treatment and Reclamation of Water; Springer: Berlin/Heidelberg, Germany, 2021; pp. 197–209. [Google Scholar]
- Singh, R.P.; Singh, P.K.; Gupta, R.; Singh, R.L. Treatment and Recycling of Wastewater from Textile Industry. In Advances in Biological Treatment of Industrial Waste Water and Their Recycling for a Sustainable Future; Singh, R., Singh, R., Eds.; Applied Environmental Science and Engineering for a Sustainable Future; Springer: Singapore, 2019; pp. 225–266. [Google Scholar] [CrossRef]
- Yang, K.; Liu, Y.; Li, Y.; Cao, Z.; Zhou, C.; Wang, Z.; Zhou, X.; Baig, S.A.; Xu, X. Applications and Characteristics of Fe-Mn Binary Oxides for Sb(V) Removal in Textile Wastewater: Selective Adsorption and the Fixed-Bed Column Study. Chemosphere 2019, 232, 254–263. [Google Scholar] [CrossRef]
- Crini, G. Non-Conventional Low-Cost Adsorbents for Dye Removal: A Review. Bioresour. Technol. 2006, 97, 1061–1085. [Google Scholar] [CrossRef] [PubMed]
- El Messaoudi, N.; El Khomri, M.; El Mouden, A.; Bouich, A.; Jada, A.; Lacherai, A.; Iqbal, H.M.N.; Mulla, S.I.; Kumar, V.; Américo-Pinheiro, J.H.P. Regeneration and Reusability of Non-Conventional Low-Cost Adsorbents to Remove Dyes from Wastewaters in Multiple Consecutive Adsorption–Desorption Cycles: A Review. Biomass Convers. Biorefinery 2022, 14, 11739–11756. [Google Scholar] [CrossRef]
- Adane, T.; Adugna, A.T.; Alemayehu, E. Textile Industry Effluent Treatment Techniques. J. Chem. 2021, 2021, 5314404. [Google Scholar] [CrossRef]
- Pearce, C.I.; Lloyd, J.R.; Guthrie, J.T. The Removal of Colour from Textile Wastewater Using Whole Bacterial Cells: A Review. Dye. Pigment. 2003, 58, 179–196. [Google Scholar] [CrossRef]
- Slokar, Y.M.; Majcen Le Marechal, A. Methods of Decoloration of Textile Wastewaters. Dye. Pigment. 1998, 37, 335–356. [Google Scholar] [CrossRef]
- Benkhaya, S.; M’rabet, S.; Lgaz, H.; El Bachiri, A.; El Harfi, A. Dyes: Classification, Pollution, and Environmental Effects. In Dye Biodegradation, Mechanisms and Techniques; Muthu, S.S., Khadir, A., Eds.; Sustainable Textiles: Production, Processing, Manufacturing & Chemistry; Springer: Singapore, 2022; pp. 1–50. [Google Scholar] [CrossRef]
- Delée, W.; O’Neill, C.; Hawkes, F.R.; Pinheiro, H.M. Anaerobic Treatment of Textile Effluents: A Review. J. Chem. Technol. Biotechnol. 1998, 73, 323–335. [Google Scholar] [CrossRef]
- Ghoreishi, S.M.; Haghighi, R. Chemical Catalytic Reaction and Biological Oxidation for Treatment of Non-Biodegradable Textile Effluent. Chem. Eng. J. 2003, 95, 163–169. [Google Scholar] [CrossRef]
- Pereira, M.F.R.; Soares, S.F.; Órfão, J.J.M.; Figueiredo, J.L. Adsorption of Dyes on Activated Carbons: Influence of Surface Chemical Groups. Carbon 2003, 41, 811–821. [Google Scholar] [CrossRef]
- Vandevivere, P.C.; Bianchi, R.; Verstraete, W. Review: Treatment and Reuse of Wastewater from the Textile Wet-Processing Industry: Review of Emerging Technologies. J. Chem. Technol. Biotechnol. 1998, 72, 289–302. [Google Scholar] [CrossRef]
- Robinson, T.; McMullan, G.; Marchant, R.; Nigam, P. Remediation of Dyes in Textile Effluent: A Critical Review on Current Treatment Technologies with a Proposed Alternative. Bioresour. Technol. 2001, 77, 247–255. [Google Scholar] [CrossRef] [PubMed]
- McMullan, G.; Meehan, C.; Conneely, A.; Kirby, N.; Robinson, T.; Nigam, P.; Banat, I.M.; Marchant, R.; Smyth, W.F. Microbial Decolourisation and Degradation of Textile Dyes. Appl. Microbiol. Biotechnol. 2001, 56, 81–87. [Google Scholar] [CrossRef]
- Ibrahim, S.; Shuy, W.Z.; Ang, H.M.; Wang, S. Preparation of Bioadsorbents for Effective Adsorption of a Reactive Dye in Aqueous Solution. Asia Pac. J. Chem. Eng. 2010, 5, 563–569. [Google Scholar] [CrossRef]
- Hmoudah, M.; El-Qanni, A.; Abuhatab, S.; Marei, N.N.; El-Hamouz, A.; Tarboush, B.J.A.; Alsurakji, I.H.; Baniowda, H.M.; Russo, V.; Di Serio, M. Competitive Adsorption of Alizarin Red S and Bromocresol Green from Aqueous Solutions Using Brookite TiO2 Nanoparticles: Experimental and Molecular Dynamics Simulation. Environ. Sci. Pollut. Res. 2022, 29, 77992–78008. [Google Scholar] [CrossRef]
- Toscanesi, M.; Russo, V.; Medici, A.; Giarra, A.; Hmoudah, M.; Di Serio, M.; Trifuoggi, M. Heterogeneous Photodegradation for the Abatement of Recalcitrant COD in Synthetic Tanning Wastewater. ChemEngineering 2022, 6, 25. [Google Scholar] [CrossRef]
- Adegoke, K.A.; Bello, O.S. Dye Sequestration Using Agricultural Wastes as Adsorbents. Water Resour. Ind. 2015, 12, 8–24. [Google Scholar] [CrossRef]
- Qiu, J.; Fan, P.; Feng, Y.; Liu, F.; Ling, C.; Li, A. Comparison of the Adsorption Behaviors for Methylene Blue on Two Renewable Gels with Different Physical State. Environ. Pollut. 2019, 254, 113117. [Google Scholar] [CrossRef]
- Jun, L.Y.; Karri, R.R.; Mubarak, N.M.; Yon, L.S.; Bing, C.H.; Khalid, M.; Jagadish, P.; Abdullah, E.C. Modelling of Methylene Blue Adsorption Using Peroxidase Immobilized Functionalized Buckypaper/Polyvinyl Alcohol Membrane via Ant Colony Optimization. Environ. Pollut. 2020, 259, 113940. [Google Scholar] [CrossRef]
- Garg, V.K.; Amita, M.; Kumar, R.; Gupta, R. Basic Dye (Methylene Blue) Removal from Simulated Wastewater by Adsorption Using Indian Rosewood Sawdust: A Timber Industry Waste. Dye. Pigment. 2004, 63, 243–250. [Google Scholar] [CrossRef]
- Li, B.; Guo, J.; Lv, K.; Fan, J. Adsorption of Methylene Blue and Cd(II) onto Maleylated Modified Hydrochar from Water. Environ. Pollut. 2019, 254, 113014. [Google Scholar] [CrossRef]
- Abuhatab, S.; El-Qanni, A.; Marei, N.N.; Hmoudah, M.; El-Hamouz, A. Sustainable Competitive Adsorption of Methylene Blue and Acid Red 88 from Synthetic Wastewater Using NiO and/or MgO Silicate Based Nanosorbcats: Experimental and Computational Modeling Studies. RSC Adv. 2019, 9, 35483–35498. [Google Scholar] [CrossRef]
- El-Qanni, A.; Nassar, N.N.; Vitale, G.; Hassan, A. Maghemite Nanosorbcats for Methylene Blue Adsorption and Subsequent Catalytic Thermo-Oxidative Decomposition: Computational Modeling and Thermodynamics Studies. J. Colloid Interface Sci. 2016, 461, 396–408. [Google Scholar] [CrossRef] [PubMed]
- Rafatullah, M.; Sulaiman, O.; Hashim, R.; Ahmad, A. Adsorption of Methylene Blue on Low-Cost Adsorbents: A Review. J. Hazard. Mater. 2010, 177, 70–80. [Google Scholar] [CrossRef]
- Azam, K.; Shezad, N.; Shafiq, I.; Akhter, P.; Akhtar, F.; Jamil, F.; Shafique, S.; Park, Y.K.; Hussain, M. A Review on Activated Carbon Modifications for the Treatment of Wastewater Containing Anionic Dyes. Chemosphere 2022, 306, 135566. [Google Scholar] [CrossRef] [PubMed]
- Yagub, M.T.; Sen, T.K.; Afroze, S.; Ang, H.M. Dye and Its Removal from Aqueous Solution by Adsorption: A Review. Adv. Colloid Interface Sci. 2014, 209, 172–184. [Google Scholar] [CrossRef]
- Ferone, C.; Roviello, G.; Colangelo, F.; Cioffi, R.; Tarallo, O. Novel Hybrid Organic-Geopolymer Materials. Appl. Clay Sci. 2013, 73, 42–50. [Google Scholar] [CrossRef]
- Ma, S.; Zhang, Z.; Liu, X. Comprehensive Understanding of Aluminosilicate Phosphate Geopolymers: A Critical Review. Materials 2022, 15, 5961. [Google Scholar] [CrossRef]
- Roviello, G.; Menna, C.; Tarallo, O.; Ricciotti, L.; Ferone, C.; Colangelo, F.; Asprone, D.; di Maggio, R.; Cappelletto, E.; Prota, A.; et al. Preparation, Structure and Properties of Hybrid Materials Based on Geopolymers and Polysiloxanes. Mater. Des. 2015, 87, 82–94. [Google Scholar] [CrossRef]
- Wu, D.; Cao, K.; Chen, K.; Mao, N. Interfacial Characteristics and Mechanical Behavior of Geopolymer Stabilizers with Clay Mineral: A Molecular Dynamics Study. Appl. Clay Sci. 2024, 250, 107286. [Google Scholar] [CrossRef]
- Roviello, G.; Ricciotti, L.; Tarallo, O.; Ferone, C.; Colangelo, F.; Roviello, V.; Cioffi, R. Innovative Fly Ash Geopolymer-Epoxy Composites: Preparation, Microstructure and Mechanical Properties. Materials 2016, 9, 461. [Google Scholar] [CrossRef] [PubMed]
- Roviello, G.; Chianese, E.; Ferone, C.; Ricciotti, L.; Roviello, V.; Cioff, R.; Tarallo, O. Hybrid Geopolymeric Foams for the Removal of Metallic Ions from Aqueous Waste Solutions. Materials 2019, 12, 4091. [Google Scholar] [CrossRef]
- Messina, F.; Ferone, C.; Colangelo, F.; Cioffi, R. Low Temperature Alkaline Activation of Weathered Fly Ash: Influence of Mineral Admixtures on Early Age Performance. Constr. Build. Mater. 2015, 86, 169–177. [Google Scholar] [CrossRef]
- Roviello, G.; Menna, C.; Tarallo, O.; Ricciotti, L.; Messina, F.; Ferone, C.; Asprone, D.; Cioffi, R. Lightweight Geopolymer-Based Hybrid Materials. Compos. Part B Eng. 2017, 128, 225–237. [Google Scholar] [CrossRef]
- Nasare, R.; Shah, V.; Joshi, T.; Dave, U.; Ghaffar, S.H. Exploring Sustainable Utilization of Ceramic Waste in Heat-Resistant Concrete: A Comprehensive Review. Int. J. Appl. Ceram. Technol. 2025, 22, e15021. [Google Scholar] [CrossRef]
- Duxson, P.; Mallicoat, S.W.; Lukey, G.C.; Kriven, W.M.; van Deventer, J.S.J. The Effect of Alkali and Si/Al Ratio on the Development of Mechanical Properties of Metakaolin-Based Geopolymers. Colloids Surf. A Physicochem. Eng. Asp. 2007, 292, 8–20. [Google Scholar] [CrossRef]
- Homayoonmehr, R.; Ramezanianpour, A.A.; Mirdarsoltany, M. Influence of Metakaolin on Fresh Properties, Mechanical Properties and Corrosion Resistance of Concrete and Its Sustainability Issues: A Review. J. Build. Eng. 2021, 44, 103011. [Google Scholar] [CrossRef]
- Zhao, J.; Tong, L.; Li, B.; Chen, T.; Wang, C.; Yang, G.; Zheng, Y. Eco-Friendly Geopolymer Materials: A Review of Performance Improvement, Potential Application and Sustainability Assessment. J. Clean. Prod. 2021, 307, 127085. [Google Scholar] [CrossRef]
- Perná, I.; Šupová, M.; Hanzlíček, T.; Špaldoňová, A. The Synthesis and Characterization of Geopolymers Based on Metakaolin and High LOI Straw Ash. Constr. Build. Mater. 2019, 228, 116765. [Google Scholar] [CrossRef]
- Jindal, B.B.; Alomayri, T.; Hasan, A.; Kaze, C.R. Geopolymer Concrete with Metakaolin for Sustainability: A Comprehensive Review on Raw Material’s Properties, Synthesis, Performance, and Potential Application. Environ. Sci. Pollut. Res. 2023, 30, 25299–25324. [Google Scholar] [CrossRef]
- Russo, V.; Tesser, R.; Trifuoggi, M.; Giugni, M.; Di Serio, M. A Dynamic Intraparticle Model for Fluid-Solid Adsorption Kinetics. Comput. Chem. Eng. 2015, 74, 66–74. [Google Scholar] [CrossRef]
- Hmoudah, M.; Fortunato, M.E.; Paparo, R.; Trifuoggi, M.; El-Qanni, A.; Tesser, R.; Murzin, D.Y.; Salmi, T.; Russo, V.; Di Serio, M. Ibuprofen Adsorption on Activated Carbon: Thermodynamic and Kinetic Investigation via the Adsorption Dynamic Intraparticle Model (ADIM). Langmuir 2023, 39, 11510–11519. [Google Scholar] [CrossRef]
- Russo, V.; D’Angelo, A.; Salvi, C.; Paparo, R.; Fortunato, M.E.; Cepollaro, E.M.; Tarallo, O.; Trifuoggi, M.; Di Serio, M.; Tesser, R. Fluoride Adsorption on Hydroxyapatite: From Batch to Continuous Operation. J. Environ. Chem. Eng. 2024, 12, 111973. [Google Scholar] [CrossRef]
- Tammaro, O.; Paparo, R.; Chianese, M.; Ritacco, I.; Caporaso, L.; Camellone, M.F.; Masenelli, B.; Lamirand, A.D.; Bluet, J.M.; Fontana, M.; et al. Reverse Micelle Strategy for Effective Substitutional Fe-Doping in Small-Sized CeO2 Nanocrystals: Assessment of Adsorption and Photodegradation Efficiency of Ibuprofen under Visible Light. Chem. Eng. J. 2024, 479, 147909. [Google Scholar] [CrossRef]
- Ji, Y.; Xu, F.; Wei, W.; Gao, H.; Zhang, K.; Zhang, G.; Xu, Y.; Zhang, P. Efficient and Fast Adsorption of Methylene Blue Dye onto a Nanosheet MFI Zeolite. J. Solid State Chem. 2021, 295, 121917. [Google Scholar] [CrossRef]
- Bingül, Z. Determination of Affecting Parameters on Removal of Methylene Blue Dyestuff from Aqueous Solutions Using Natural Clay: Isotherm, Kinetic, and Thermodynamic Studies. J. Mol. Struct. 2022, 1250, 131729. [Google Scholar] [CrossRef]
- Kausar, A.; Rehman, S.U.; Khalid, F.; Bonilla-Petriciolet, A.; Mendoza-Castillo, D.I.; Bhatti, H.N.; Ibrahim, S.M.; Iqbal, M. Cellulose, Clay and Sodium Alginate Composites for the Removal of Methylene Blue Dye: Experimental and DFT Studies. Int. J. Biol. Macromol. 2022, 209, 576–585. [Google Scholar] [CrossRef]
- Islam, M.R.; Mostafa, M.G. Adsorption Kinetics, Isotherms and Thermodynamic Studies of Methyl Blue in Textile Dye Effluent on Natural Clay Adsorbent. Sustain. Water Resour. Manag. 2022, 8, 52. [Google Scholar] [CrossRef]
- Loutfi, M.; Mariouch, R.; Mariouch, I.; Belfaquir, M.; ElYoubi, M.S. Adsorption of Methylene Blue Dye from Aqueous Solutions onto Natural Clay: Equilibrium and Kinetic Studies. Mater. Today Proc. 2023, 72, 3638–3643. [Google Scholar] [CrossRef]
- Candamano, S.; Coppola, G.; Mazza, A.; Caicho Caranqui, J.I.; Bhattacharyya, S.; Chakraborty, S.; Alexis, F.; Algieri, C. Batch and Fixed Bed Adsorption of Methylene Blue onto Foamed Metakaolin-Based Geopolymer: A Preliminary Investigation. Chem. Eng. Res. Des. 2023, 197, 761–773. [Google Scholar] [CrossRef]
- Gonçalves, N.P.F.; Olhero, S.M.; Labrincha, J.A.; Novais, R.M. 3D-Printed Red Mud/Metakaolin-Based Geopolymers as Water Pollutant Sorbents of Methylene Blue. J. Clean. Prod. 2023, 383, 135315. [Google Scholar] [CrossRef]
- Elewa, K.; Tawfic, A.F.; Tarek, M.; Al-Sagheer, N.A.; Nagy, N.M. Removal of Methylene Blue from Synthetic Industrial Wastewater by Using Geopolymer Prepared from Partially Dealuminated Metakaolin. Sci. Rep. 2025, 15, 17633. [Google Scholar] [CrossRef]
- Selvam, S.; Sarkar, I. Bile Salt Induced Solubilization of Methylene Blue: Study on Methylene Blue Fluorescence Properties and Molecular Mechanics Calculation. J. Pharm. Anal. 2017, 7, 71–75. [Google Scholar] [CrossRef] [PubMed]
- Russo, V.; Tesser, R.; Masiello, D.; Trifuoggi, M.; Di Serio, M. Further Verification of Adsorption Dynamic Intraparticle Model (ADIM) for Fluid–Solid Adsorption Kinetics in Batch Reactors. Chem. Eng. J. 2016, 283, 1197–1202. [Google Scholar] [CrossRef]
- Russo, V.; Masiello, D.; Trifuoggi, M.; Di Serio, M.; Tesser, R. Design of an Adsorption Column for Methylene Blue Abatement over Silica: From Batch to Continuous Modeling. Chem. Eng. J. 2016, 302, 287–295. [Google Scholar] [CrossRef]
- Wilke, C.R.; Chang, P. Correlation of Diffusion Coefficients in Dilute Solutions. AIChE J. 1955, 1, 264–270. [Google Scholar] [CrossRef]
- Pansini, M.; Dell’Agli, G.; Marocco, A.; Netti, P.A.; Battista, E.; Lettera, V.; Vergara, P.; Allia, P.; Bonelli, B.; Tiberto, P.; et al. Preparation and Characterization of Magnetic and Porous Metal-Ceramic Nanocomposites from a Zeolite Precursor and Their Application for DNA Separation. J. Biomed. Nanotechnol. 2017, 13, 337–348. [Google Scholar] [CrossRef] [PubMed]
- Al-husseiny, R.A.; Ebrahim, S.E. Effective Removal of Methylene Blue from Wastewater Using Magnetite/Geopolymer Composite: Synthesis, Characterization and Column Adsorption Study. Inorg. Chem. Commun. 2022, 139, 109318. [Google Scholar] [CrossRef]
- Dzoujo, H.T.; Shikuku, V.O.; Tome, S.; Akiri, S.; Kengne, N.M.; Abdpour, S.; Janiak, C.; Etoh, M.A.; Dina, D. Synthesis of Pozzolan and Sugarcane Bagasse Derived Geopolymer-Biochar Composites for Methylene Blue Sequestration from Aqueous Medium. J. Environ. Manag. 2022, 318, 115533. [Google Scholar] [CrossRef]
- Novais, R.M.; Carvalheiras, J.; Tobaldi, D.M.; Seabra, M.P.; Pullar, R.C.; Labrincha, J.A. Synthesis of Porous Biomass Fly Ash-Based Geopolymer Spheres for Efficient Removal of Methylene Blue from Wastewaters. J. Clean. Prod. 2019, 207, 350–362. [Google Scholar] [CrossRef]
- Kaya-Özkiper, K.; Uzun, A.; Soyer-Uzun, S. Tuning Adsorption, Structure and Compressive Strength of Sepiolite- and Metakaolin-Based Alkali Activated Monoliths for Methylene Blue Removal from Waste Water. Surf. Interfaces 2022, 33, 102110. [Google Scholar] [CrossRef]
- Chandarana, H.; Senthil Kumar, P.; Seenuvasan, M.; Anil Kumar, M. Kinetics, Equilibrium and Thermodynamic Investigations of Methylene Blue Dye Removal Using Casuarina Equisetifolia Pines. Chemosphere 2021, 285, 131480. [Google Scholar] [CrossRef] [PubMed]
- Bulut, Y.; Aydin, H. A Kinetics and Thermodynamics Study of Methylene Blue Adsorption on Wheat Shells. Desalination 2006, 194, 259–267. [Google Scholar] [CrossRef]
- Tran, H.N. Improper Estimation of Thermodynamic Parameters in Adsorption Studies with Distribution Coefficient K D(q e/C e) or Freundlich Constant (K F): Considerations from the Derivation of Dimensionless Thermodynamic Equilibrium Constant and Suggestions. Adsorpt. Sci. Technol. 2022, 2022, 5553212. [Google Scholar] [CrossRef]
- Seera, S.D.K.; Kundu, D.; Gami, P.; Naik, P.K.; Banerjee, T. Synthesis and Characterization of Xylan-Gelatin Cross-Linked Reusable Hydrogel for the Adsorption of Methylene Blue. Carbohydr. Polym. 2021, 256, 117520. [Google Scholar] [CrossRef]
- El Alouani, M.; Alehyen, S.; El Achouri, M.; Taibi, M. Preparation, Characterization, and Application of Metakaolin-Based Geopolymer for Removal of Methylene Blue from Aqueous Solution. J. Chem. 2019, 2019, 4212901. [Google Scholar] [CrossRef]
- Yao, Y.; Xu, F.; Chen, M.; Xu, Z.; Zhu, Z. Adsorption Behavior of Methylene Blue on Carbon Nanotubes. Bioresour. Technol. 2010, 101, 3040–3046. [Google Scholar] [CrossRef] [PubMed]
- Sivakumar, R.; Lee, N.Y. Adsorptive Removal of Organic Pollutant Methylene Blue Using Polysaccharide-Based Composite Hydrogels. Chemosphere 2022, 286, 131890. [Google Scholar] [CrossRef] [PubMed]
- Jaramillo-Fierro, X.; Cuenca, G. Enhancing Methylene Blue Removal through Adsorption and Photocatalysis—A Study on the GO/ZnTiO3/TiO2 Composite. Int. J. Mol. Sci. 2024, 25, 4367. [Google Scholar] [CrossRef]
- Yang, J.; Zhang, P. A Concise Pore Structure Model for Predicting the Effective Ion Diffusion Coefficients of Cementitious Materials. Constr. Build. Mater. 2020, 265, 120321. [Google Scholar] [CrossRef]
Disclaimer/Publisher’s Note: The statements, opinions and data contained in all publications are solely those of the individual author(s) and contributor(s) and not of MDPI and/or the editor(s). MDPI and/or the editor(s) disclaim responsibility for any injury to people or property resulting from any ideas, methods, instructions or products referred to in the content. |
© 2025 by the authors. Licensee MDPI, Basel, Switzerland. This article is an open access article distributed under the terms and conditions of the Creative Commons Attribution (CC BY) license (https://creativecommons.org/licenses/by/4.0/).