Article

Application of Risk Management in Applied Engineering Projects in a Petrochemical Plant Producing Polyvinyl Chloride in Cartagena, Colombia

by
Juan Pablo Bustamante Visbal
1,*,
Rodrigo Ortega-Toro
2 and
Joaquín Alejandro Hernández Fernández
3,4,5,*
1
Engineering Program, Universidad Tecnológica de Bolívar, Technological Campus, Km 1 Via Turbaco, Bolivar 130001, Colombia
2
Food Packaging and Shelf-Life Research Group (FP&SL), Food Engineering Program, Universidad de Cartagena, Cartagena 130015, Colombia
3
Chemistry Program, Department of Natural and Exact Sciences, San Pablo Campus, Universidad de Cartagena, Cartagena 130015, Colombia
4
Department of Natural and Exact Science, Universidad de la Costa, Barranquilla 080002, Colombia
5
Grupo de Investigación GIA, Fundacion Universitaria Tecnologico Comfenalco, Cr 44 D N 30A, 91, Cartagena 30015, Colombia
*
Authors to whom correspondence should be addressed.
ChemEngineering 2025, 9(4), 75; https://doi.org/10.3390/chemengineering9040075
Submission received: 31 January 2025 / Revised: 15 June 2025 / Accepted: 3 July 2025 / Published: 21 July 2025

Abstract

Risk management is crucial in engineering projects, especially in highly complex environments like petrochemical plants producing polyvinyl chloride (PVC). This study proposes a tailored risk management model, using analytic hierarchy process (AHP) and linear regression analysis, alongside MS Excel and IBM SPSS® version 23, to identify, assess, and prioritize key risks. Surveys and interviews revealed seven management factors (budget, schedule, safety, productivity, contracting, quality, and environment) and 18 critical risks, including design errors and procurement delays. The model quantifies risk impacts, provides a regression equation for risk classification, and supports effective mitigation strategies. Based on this model, decision-making can be facilitated for the implementation of effective mitigation strategies. It also promotes continuous improvement, optimizing economic resources and minimizing environmental impacts, addressing a research gap in Colombia’s petrochemical sector and paving the way for broader industrial applications.

1. Introduction

Particularly in the area of projects, it is undeniable that greater speed is required in developing the life cycle to achieve success and generate value for the organization [1]. On the other hand, when projects fail, they lead to many consequences, such as financial losses, loss of customer confidence, and loss of competitive advantages; therefore, there is a strong need for research on the successful performance of a project [2]. To achieve project success, it is important to consider that uncertainty and risk will be present from the moment the project is formulated and throughout its entire life cycle. This will also depend on the nature and magnitude of the project [3].
Most projects have time, cost, and scope restrictions, as well as some quality demands, but at the same time, there is a high level of uncertainty about positive and negative events in any project [2]. Risk and uncertainty are present in all projects, and even more so in engineering projects in petrochemical plants due to their complex technical environment and the development of new products or processes. Risk management in projects is an area of great interest both in academic circles and in the industrial sphere at national and global levels, and its vital importance for project management is recognized by several reference frameworks, standards, and best practices [4].
In the industry, each project is born to solve a problem and/or take advantage of an opportunity that guarantees the sustainability and continuity of the business in the short and medium term. In the case of the petrochemical industry, polyvinyl chloride (PVC) production is no exception [5], and although there are sufficient studies related to the topic of project risk management in the available literature, there are currently very few studies that address the topic, specifically in petrochemical plants producing PVC.
The first part of this work consisted of an extensive review of the specialized literature on project management and risk management related to engineering projects in petrochemical plants. For this study, engineering projects in petrochemical plants are considered to be all those that include the construction of new plants, the expansion of infrastructure, and the installation of large equipment to expand the production capacity; likewise, plant shutdowns are not considered for the present study. The second part consists of the analysis of results for the subsequent development of the risk management model in engineering projects in petrochemical plants for PVC production.

2. Literature Review

The modern petrochemical industry results from decades of economic, technical, and political forces. The basic raw materials for the petrochemical industry are extracted from natural gas or petroleum refining products [6]. Coal has been replaced mainly as a raw material, but its importance could increase in the face of future shortages of natural gas and oil. The petrochemical industry processes these raw materials into various final and intermediate chemical products as raw materials for other processes and industries, such as plastics, elastomers, and synthetic fibers [7]. The demand for petrochemical products is so broad that they have grown rapidly and dominated the world chemical market in the last 10 years [8].
In EPC projects, contracting companies are affected by changes in input information regarding basic design data and relevant engineering studies. Due to poorly managed changes, large EPC projects are delayed and face cost overruns, and some fail due to the complexity of the project. Often, the project is awarded to a single EPC contractor, which then cannot manage the project’s vast scope [9]. In addition, government regulatory policies established to minimize risk in the petrochemical industry may also affect the execution and sizing of expansion projects [10].
Several researchers have conducted studies focusing on risk models, risk identification and analysis, risk assessment, and risk prioritization [11]. Risk management involves identifying, analyzing, and responding to risks. Therefore, managing such risks requires first recognizing the factors that influence them [12], making it easier to understand the uncertainties within a project.

2.1. Risk and Uncertainty in Project Management

Risk has always been present in the industrial environment. External and internal factors create risks at various levels of an organization: operational, project, financial, strategic, business, and corporate [13]. However, it has only been in recent years that it has been actively managed for products, projects, and organizations [14]. Several concepts related to risk are in the literature specialized in project management.
Some authors associate risk with uncertainty and define risk as the exposure to the consequences of uncertainty that may affect the project objectives (including the possibility of loss or gain). Therefore, risk has two elements: the probability of occurrence of an event and the consequences of its impacts [15]. Generally, there is usually some confusion between the meaning of risk and uncertainty. Although the terms risk and uncertainty are frequently used as synonyms, the terms have different meanings and are used in various contexts; risk is more associated with the causes and consequences related to probability, while uncertainty stands out in the context of the lack of knowledge when facing the unknown [16]. In the concept of many professionals and the literature review on project management, there is no clear distinction between risk and uncertainty.
Risk can be defined as the exposure to loss or gain or the probability of loss or gain multiplied by its respective magnitude. In contrast, uncertainty in projects can be defined as the unknown probability of the impact of a project variable on the project objective [17]. Uncertainty levels at the beginning of projects are higher, and consequently, so is the risk of not meeting the goals and the value of the investment. Uncertainties decrease during a project’s development and progress [18].

2.2. Risk Management in Projects

Risk management is one of the areas of knowledge in project management, according to the Project Management Institute (PMI). It is “the processes for identifying, analyzing, planning the management, planning and identifying responses, and monitoring project risks” [19]. Similarly, PRINCE2 defines risk management as “the systematic application of principles, approaches and processes to the tasks of identifying and assessing risks, planning and implementing risk responses, and communicating risk management activities to stakeholders” [20]. Table 1 summarizes the different definitions and procedures for risk management established by PRINCE2, APM, PMI [21], and ISO 31000: Risk management—Guidelines [22].
As risk is traditionally associated with uncertainty, some scholars argue that risk management is about managing uncertainty. Despite the above, uncertainty management also involves identifying and managing all sources of uncertainty by exploring and understanding the origins of the project’s uncertainty rather than seeking to manage it without prejudices about what is desirable or undesirable [23]. Because the term manage refers to planning, governing, and controlling, it is necessary to direct management efforts to eliminate uncertainty as far as possible, since uncertainty arises as an obstacle and even constitutes a threat to successful management [24]. Therefore, during project development, risk management should be treated as an iterative process based on continuous improvement and constant monitoring [25]. Figure 1 shows the risk management process proposed by [26].
Risks can arise at any stage of the project life cycle; therefore, successful project implementation depends on a careful analysis of potential risks and adverse conditions that may occur until the project is completed [27].

2.3. Risk Management in Petrochemical Projects

Despite the large number of studies dedicated to risk management in projects, when referring to the petrochemical industries, the studies are scarce, as indicated by the results of the bibliographic review carried out in this work. The petrochemical industry is increasingly facing new challenges imposed by increased strict environmental and energy conservation requirements [28], reducing production costs, customer needs, obtaining raw materials, optimization of the supply chain, etc. [29]. These challenges or needs are what give rise to projects in the industry. It should also be considered that, at an international level, several researchers have developed various types of studies related to risk management focused on projects in petrochemical plants [18,30,31,32,33,34,35,36,37]. However, it should be noted that, according to what was determined by this research, in Colombia, there are no studies with similar approaches in the available scientific literature. In the research of [38], a reference framework has been developed in which four significant risk factors have been identified for any petrochemical project: human resources, procurement, schedule compliance, and communications. According to [39], no activity can be executed without risk, particularly in the case of the petrochemical and oil & gas industry. Therefore, risk and uncertainty are present in all projects and much more in petrochemical projects due to their complex technical environment and the development of new products or processes. The complexity in the execution of petrochemical projects is related to internal risks and risks external to the project environment that cause frequent changes [35]. Notably, the work developed by [37] proposes a model for risk analysis in petrochemical projects. This model seeks to evaluate the impact score that reflects the relationship of the relative importance of the project management factors and classify the risk factors into high- and low-impact groups. In the first process (analysis for management factors), project management factors are selected, and their relative importance is analyzed. This is to examine the impact score of risk factors specific to project characteristics such as type, location, etc., to reflect the relationship of relatively important project management factors. In the second process (Analysis for risk factors), project risk factors are selected, and their scores are analyzed to perform a quantitative analysis of their impact. Some scholars have established that risk management is vital in controlling risks and mitigating their effects. Therefore, its adoption is critical in high-risk petrochemical, oil exploration, and aerospace projects [40].

2.4. Development of Petrochemical Projects in Colombia

In Colombia, the oil refining industry began with the operation of the Barrancabermeja refinery (TROCO) in 1928 and later with the inauguration of the Cartagena refinery (INTERCOR) in 1957 [41]. The development of the petrochemical industry in Colombia, therefore, began after these periods. It began in the mid-sixties when the first projects to establish petrochemical industries in Cartagena and Barranquilla started to develop.
According to a study developed in 2007 by the National Learning Service (SENA) through the Petrochemical Sectoral Table, the history and development of the petrochemical industry in Colombia are closely related to the impetus given by the Cartagena refinery. This was due to the import substitution industrialization (ISI) policy at the end of the fifties [42]. The history of the most essential petrochemical companies began in Cartagena with the manufacture of fertilizers in 1961 in AMOCAR and ABOCOL, then continued in 1965 with the production of polymers such as Polyvinyl Chloride-PVC (Petroquímica Colombiana) and Polystyrene-PS (Dow Química) in Cartagena and in that same year the production of carbon black began in Cabot Colombiana. In 1966, the production of Nylon and PET began (ENKA de Colombia in Medellín). In 1967, Monómeros Colombo Venezolanos was founded in Barranquilla to produce Caprolactam and fertilizers. Later, in 1989, Polipropileno del Caribe (PROPILCO) and DEXTON began operations in Cartagena. Later, at the end of 2015, the implementation of the expansion and modernization project of the Cartagena refinery (REFICAR) started, and one of its purposes was to increase the production and productivity of the petrochemical industry [42]. According to data provided by the National Association of Financial Institutions (ANIF), as a result of the implementation of the expansion and modernization of REFICAR (Cartagena Refinery), the refining and petrochemical chain has grown at a much faster rate than the rest of the industry, resulting in a growth of 2.5% for this subsector in 2017. The good performance of the refining and petrochemical industry (considering that the petrochemical chain represents 32% of the total industry) has not been enough to offset the poor performance of the other sectors in Colombia, which is reflected in the −2.6% drop for 2017.

3. Materials and Methods

3.1. Data Collection

To develop the work, a thorough review and analysis of the literature on risk management in petrochemical plant projects is first carried out to identify the different perspectives, tools, and techniques applied to the subject. The information obtained comes from primary sources, such as surveys and interviews with project managers and professionals related to risk management in the PVC production plant. Applying these interviews to project professionals is intended to identify the practices used in the company for risk management and to identify the most significant risk factors that affect engineering projects in petrochemical plants. Subsequently, the model is developed to identify risks and quantify the impacts on engineering projects in petrochemical plants for PVC production.

3.2. Selection of Information Sources

The sources of information for this research are made up of primary and secondary sources. The primary sources refer to the professionals who are part of the execution and management of projects for a PVC resin production company. The professionals considered for the development of the interviews and surveys are those who meet the following conditions: they have more than five years of experience in the execution of projects, they have participated in the latest engineering projects developed in the company, and they have been leaders of at least one engineering project. The secondary sources comprise the bibliographic material consulted, which includes articles, technical reports, and specialized books on the main topics of this research.

3.3. Tools and Analysis Techniques

For the development of this study, Microsoft Excel 2019 and IBM SPSS® Statistics version 23 will be used as data analysis tools to perform calculations and statistical analysis, respectively. The statistical analysis techniques used are described below. The analytic hierarchy process (AHP) is an analysis method for decision-making based on multiple criteria [43]. The technique, one of the most widely used multi-criteria decision-making tools, was developed by Saaty [44]. It consists of a series of paired comparisons between the criteria in a matrix, considering a scale of preferences or hierarchies. Multiple linear regression analysis is applied in this research to determine the relationship between the independent variables (risk factors) and a dependent variable (weighting or score of the risk factors). Regression analysis determines a mathematical expression to describe the functional relationship between a response and several independent variables. This is used to predict the probability of the occurrence of an event from a model of the interrelation of the variables [45]. According to what is stated in [37], the equations resulting from the regression analysis have the following structure:
y = c + b 1 x 1 + b 2 x 2 + b 3 x 3 + + b n x n
The dependent variable (y) can be determined by substituting the values of the regression coefficients (bi) and independent variables (xi) into (1). For this research, the regression equation is derived into a model to predict the impact score (dependent variable) of the risk factors (independent variables).

4. Results and Discussion

4.1. Selection of Management Factors

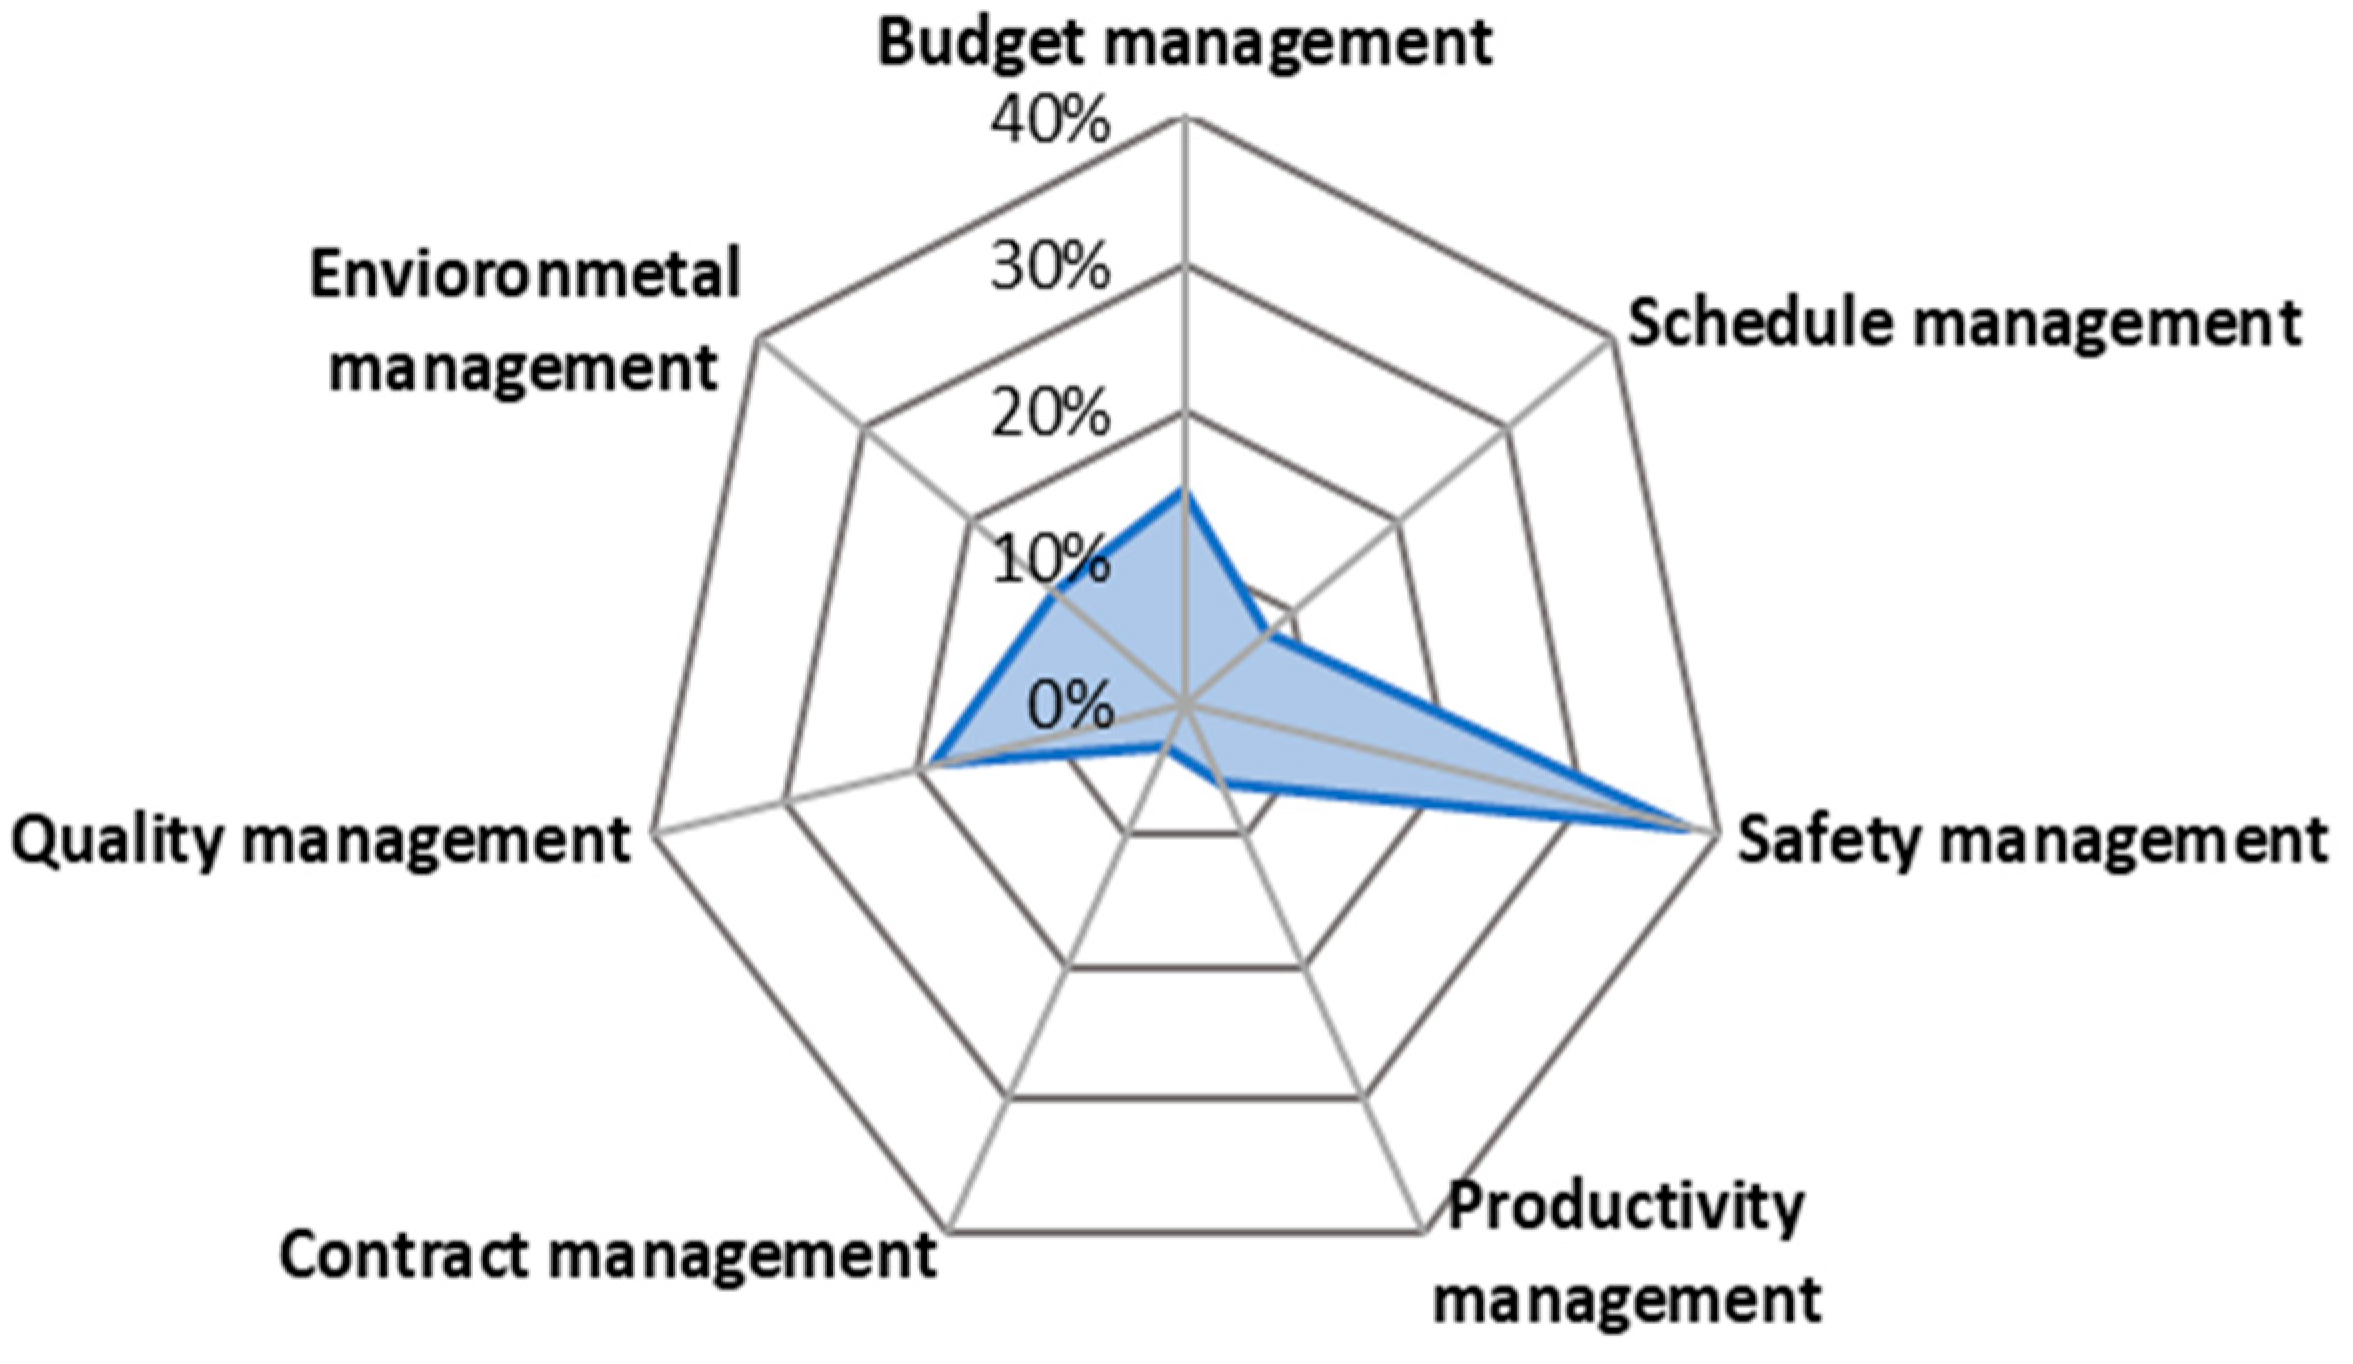
The most relevant management factors for this research were determined based on the interviews and surveys conducted thanks to the collaboration of the project engineers from the company studied. These project management factors are budget management, schedule management, safety management, productivity management, contract management, quality management, and environmental management. The selection of the management factors was established through the surveys. The management factors’ percentage weight or relative importance was determined using a Microsoft Excel spreadsheet to build the normalized matrix based on the analytic hierarchy process (AHP). However, although AHP is a powerful methodology for project risk management, it can have certain limitations, such as the subjectivity of pairwise comparisons—because it is based on subjective judgments—or the complexity in large hierarchies as the number of criteria and alternatives increases. Therefore, it is recommended to take special care when assigning weights, as they can introduce biases and inconsistencies and when trying to determine hierarchies because the process can become cumbersome and error-prone. On the other hand, regression analysis is a valuable technique for predicting risk impacts, but it can have certain limitations, such as its dependence on reliable and available historical data and difficulties in accounting for dynamic risks, such as sudden legislative changes, unexpected supply chain disruptions, political conflicts, or economic crises.

4.1.1. Importance of Management Factors

The management factors previously selected in this work are crucial in engineering projects due to their direct influence on the success of the project in the face of uncertainty and risks. To determine the importance of management factors, it is initially necessary to construct a first-level decision matrix or a paired comparison matrix. The square matrix is constructed considering the hierarchy assigned to the criteria (management factors) obtained through the surveys.

4.1.2. Consistency of the Matrix

The matrix was evaluated to determine its consistency and validity because the comparisons of the hierarchy of criteria applied in this method are subjective [46]. Therefore, it is necessary to evaluate the consistency index (CI) and calculate the consistency ratio (CR) with this index. For the present work, the accepted value of CR must be less than 0.1, as proposed by [44].

4.1.3. Calculation of the Consistency Index and Relationship

The consistency index (CI) was calculated using the following equation:
C I = λ m a x n n 1
where λ m a x is the maximum eigenvalue of the judgment matrix (pairwise comparison matrix). The judgment matrix aims to convert qualitative evaluations and subjective perspectives into a numerical framework, facilitating a systematic approach to decision-making [47]. The CI parameter can be compared with an actual number ,   R I (random index), which estimates the average of CI obtained randomly from the generation of matrices of size n [48]. The obtained quotient, CI/RI, is called the consistency ratio, CR. By calculating in Microsoft Excel, the consistency index (CI) result was obtained with a value of 0.069 and an RI of 1.32. When comparing the obtained RI value for the matrix of n = 7, agreement with the theoretical value proposed in the work carried out by Alfonso and Lamata [49] is observed. With the above values, the consistency ratio of the matrix is calculated as follows:
C R = C I R I = 0.069 1.32 = 0.052
The above value means that the judgments applied to the matrix criteria have a 5.2% inconsistency, because Saaty’s technique only accepts a matrix as a consistent one if CR < 10%. To determine the importance of management factors, a first-level decision matrix or paired comparison matrix is initially required. The square matrix is constructed by considering the hierarchy assigned to the criteria (management factors) obtained through the surveys. Table 2 shows the first-level decision matrix for the management factors.
Once the consistency of the paired comparison matrix is established, the percentage weight for each management factor is determined by calculating the sum of each factor in the standardized matrix and dividing it by n = 7, as shown in Table 3 and Figure 2.

4.1.4. Selection of Risk Factors

The risk factors selected for this research correspond to some of the most relevant ones identified in previous studies of engineering projects in petrochemical plants, such as the work of [37]. In addition, other risk factors were included during the development of surveys and interviews conducted for this case study. These factors were estimated considering their importance, probability, and frequency, according to the experience and opinions of the professionals surveyed. Table 4 shows the 18 risk factors selected for this research.

4.1.5. Risk Factor Impact Score

At this stage, it was necessary to develop a survey to determine the importance or impact index of each risk factor concerning each management factor. The scale considered ranges from a continuous score of 1 to 10 (maximum) according to the impact of the respective risk factor on the projects. The impact score of a risk factor is determined by adding the result of the individual multiplication of a risk factor impact by the weight of each management factor. The following equation represents this:
P I = i = 1 n I R i P G i
where the following is true:
I R i : Risk factor impact index.
P G i : Weight of the management factor.
The operation is performed for each of the 18 risk factor impact indices identified and assessed in the surveys of this research. To determine the impact index, a survey was developed to determine the importance or impact of each risk factor in relation to each of the management factors. The scale used ranges from a continuous score of 1 to 10 (maximum), as shown in Figure 3.
The respective calculations were made in a Microsoft Excel spreadsheet, with the result shown in Table 5.

4.1.6. Normality Analysis

With the data obtained from the linear regression using IBM SPSS software, a normality analysis or contrast is performed to establish whether the distribution of the observed data deviates from what is expected concerning a normal distribution with the same mean and standard deviation. Figure 4 represents the histogram of the residuals compared to a normal distribution with values of µ = 3.68 × 10⁻¹⁵ and σ = 0.767. The shape of the histogram, following an approximately normal distribution, suggests that the regression model generally meets the assumption of normality of the residuals. This is crucial to ensure the validity of the hypothesis tests and the reliability of the confidence intervals associated with the model coefficients.
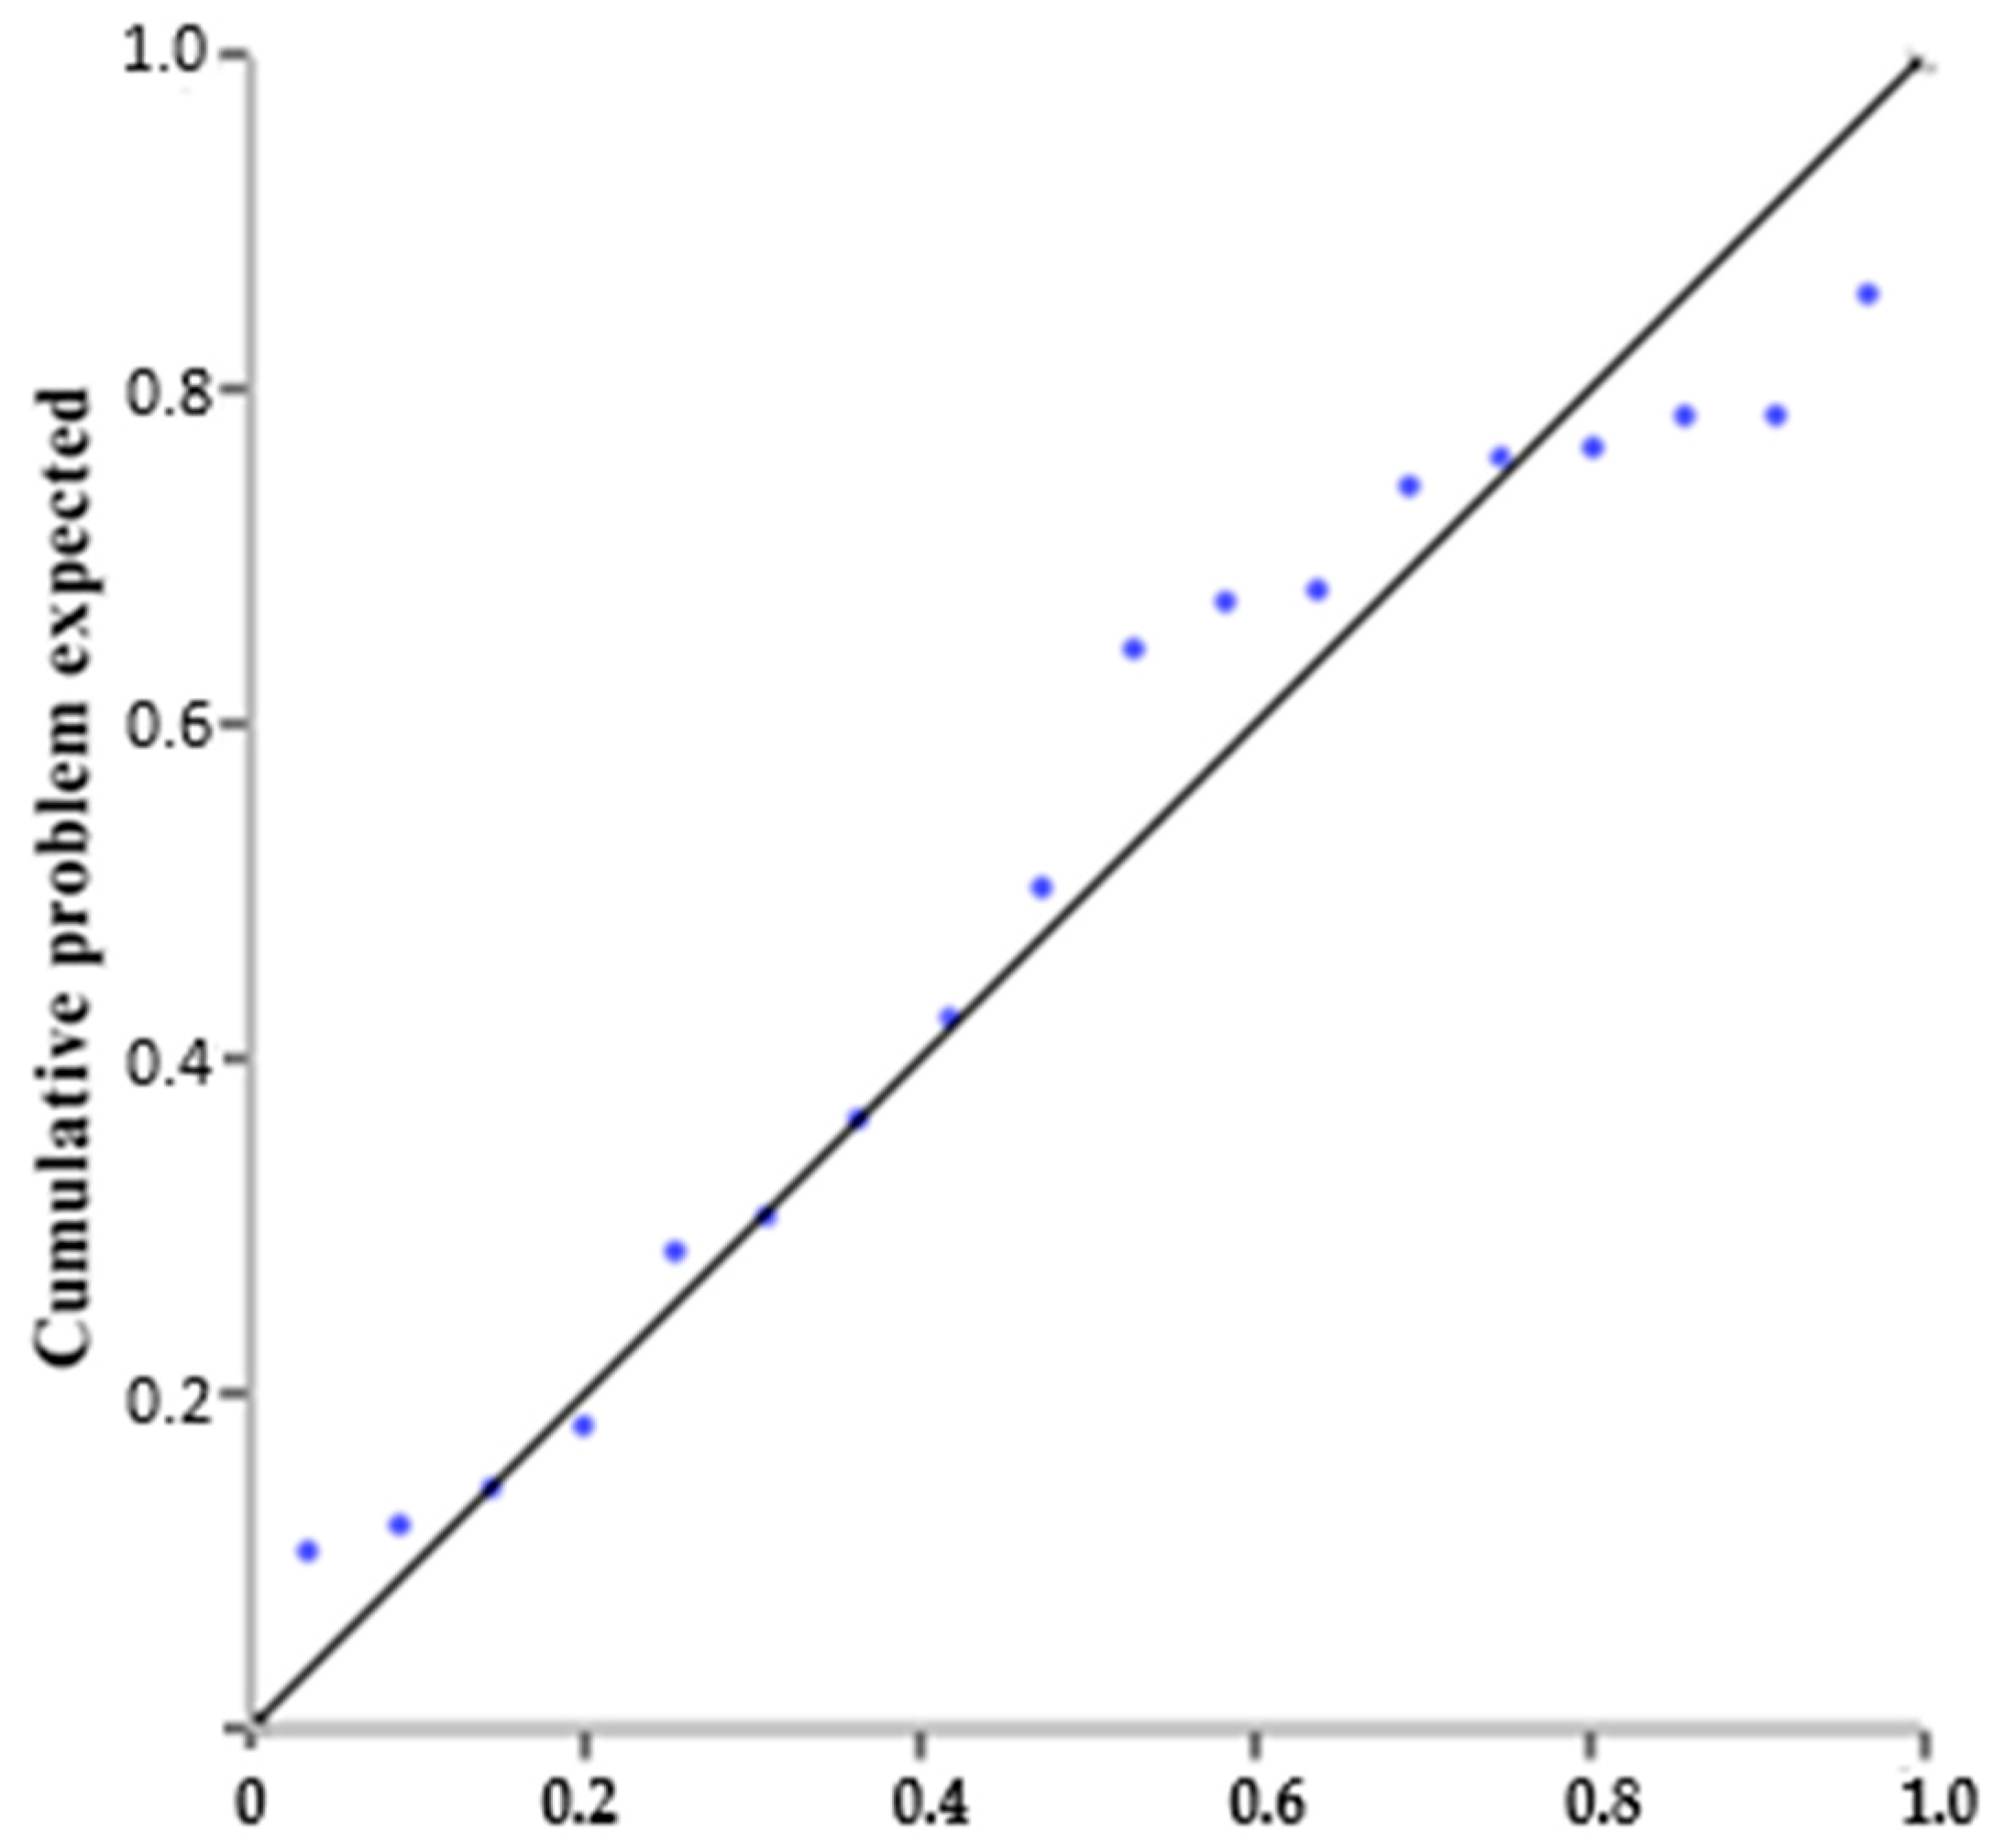
Similarly, with the IBM SPSS software, the P-P graph is obtained, and the accumulated proportions of the variables are compared with those of a normal distribution. This graph corresponds to Figure 5. According to the dispersion of the data in the P-P graph, it is observed that it resembles a normal distribution.

4.1.7. Hypothesis Testing

This case study uses the statistical procedure of Analysis of Variance (ANOVA) to test or contrast the null hypothesis using IBM SPSS software version 23. Table 6 shows the results obtained by SPSS for the analysis of variance (ANOVA). Based on the data received from the study, a significance level (α) or p-value < 0.05 is observed: the extremely low p-value (Sig. = 0.000) confirms that the independent variables collectively have a statistically significant effect on the dependent variable. Therefore, the null hypothesis (H0: independence between variables) is rejected, and the alternative hypothesis (H1: dependence between variables) is accepted, meaning some variables have a dependency relationship.
The residual value in the sum of squares column is the unexplained variability (variability in the dependent variable that the model fails to capture). The small residual value suggests the model fits the data very well.
The high value of the F contrast statistic indicates that the linear regression model’s prediction will be better. This value represents the ratio of the Mean Square Regression to the Mean Square Residual. A high F-statistic indicates that the model explains a significant amount of variance relative to the unexplained variance.

4.1.8. Linear Regression Model

The equation of the regression model in this work helps predict the impact score of the risk factors by multivariate linear regression using the indicators of the management factors as predictors. IBM SPSS® Statistics software was used to perform the regression analysis. Table 7 shows the summary of the regression model.
In the results of the linear regression model obtained, it can be observed that the correlation coefficient (R) and determination coefficient (R2) have values very close to 1, indicating a good correlation between the variables for this case study. The high value of R (0.998) indicates a good correlation between the independent and dependent variables. The value of the determination coefficient R2 (0.996) indicates that the regression model can explain 99.6% of the variance in the dependent variable. With such a high R2, the model almost completely explains the variability of the dependent variable, a phenomenon that is indicative of very good predictive capacity. The low standard error indicates that, in absolute terms, the predictions closely approximate the observed values, increasing confidence in the validity of the model. Finally, considering the value of the corresponding Durbin–Watson contrast ( d = 2.289), close to 2, suggests that there are no significant autocorrelation problems in the model residuals. Nevertheless, this does not allow establishing whether or not there is autocorrelation because d L = 0.502 and d U = 2.461, therefore: d L d   d U and the test is not decisive because it does not allow to conclude definitively about the presence or absence of autocorrelation in this model with a significance level of α = 5%. In the analysis of variance, the regression model is found to be significant (p-value of zero and F = 334.013) because if the p-value for an independent variable is greater than the significance level (commonly α = 0.05), the variable is considered statistically insignificant in explaining variations in the dependent variable. Therefore, the rejection of the null hypothesis is confirmed again, indicating a relationship between the independent and dependent variables. Table 8 shows the coefficients obtained from the multivariate linear regression to generate the equation of the fitted line.
Consequently, the equation of the fitted line is as follows:
y = 0.175 + 0.963 x 1 + 1.113 x 2 + 1.013 x 3 + 0.765 x 4 + 0.644 x 5 + 1.016 x 6 + 0.935 x 7  
where the following is true:
y : Impact of risk factors (IRF).
x1: Budget (PR).
x2: Schedule (CR).
x3: Safety (SE).
x4: Productivity (PD).
x5: Hiring (CN).
x6: Quality (CA).
x7: Environment (MA).

4.2. Proposed Model

This research began with a review of the technical and scientific literature related to the subject of study. Based on the systematic review of the limited existing literature on risk management for engineering projects in petrochemical plants, the theoretical structure and the state of the art were developed, which allowed the identification of the problem and the research objectives. In developing the model proposed in this research, the assumptions and conditions proposed by the author for the engineering projects executed in the petrochemical plant under study were considered. Likewise, the methodology proposed by [37] was considered mainly for the model’s design.

4.2.1. Objectives of the Model

The proposed model initially aims to provide a tool for identifying and quantifying the principal risk factors and classifying them according to their impacts on the engineering projects in this case study. The model then provides a regression equation to quantitatively predict the effect of risk factors that cause changes to the project and its scope.

4.2.2. Model Components

For developing the risk management model for engineering projects in petrochemical PVC production plants, seven project management factors and eighteen risk factors were considered and identified through the development of surveys of the experts interviewed. The relevance and consistency of the identified risk factors were determined through the analytic hierarchy process (AHP).

4.2.3. Risk Breakdown Structure

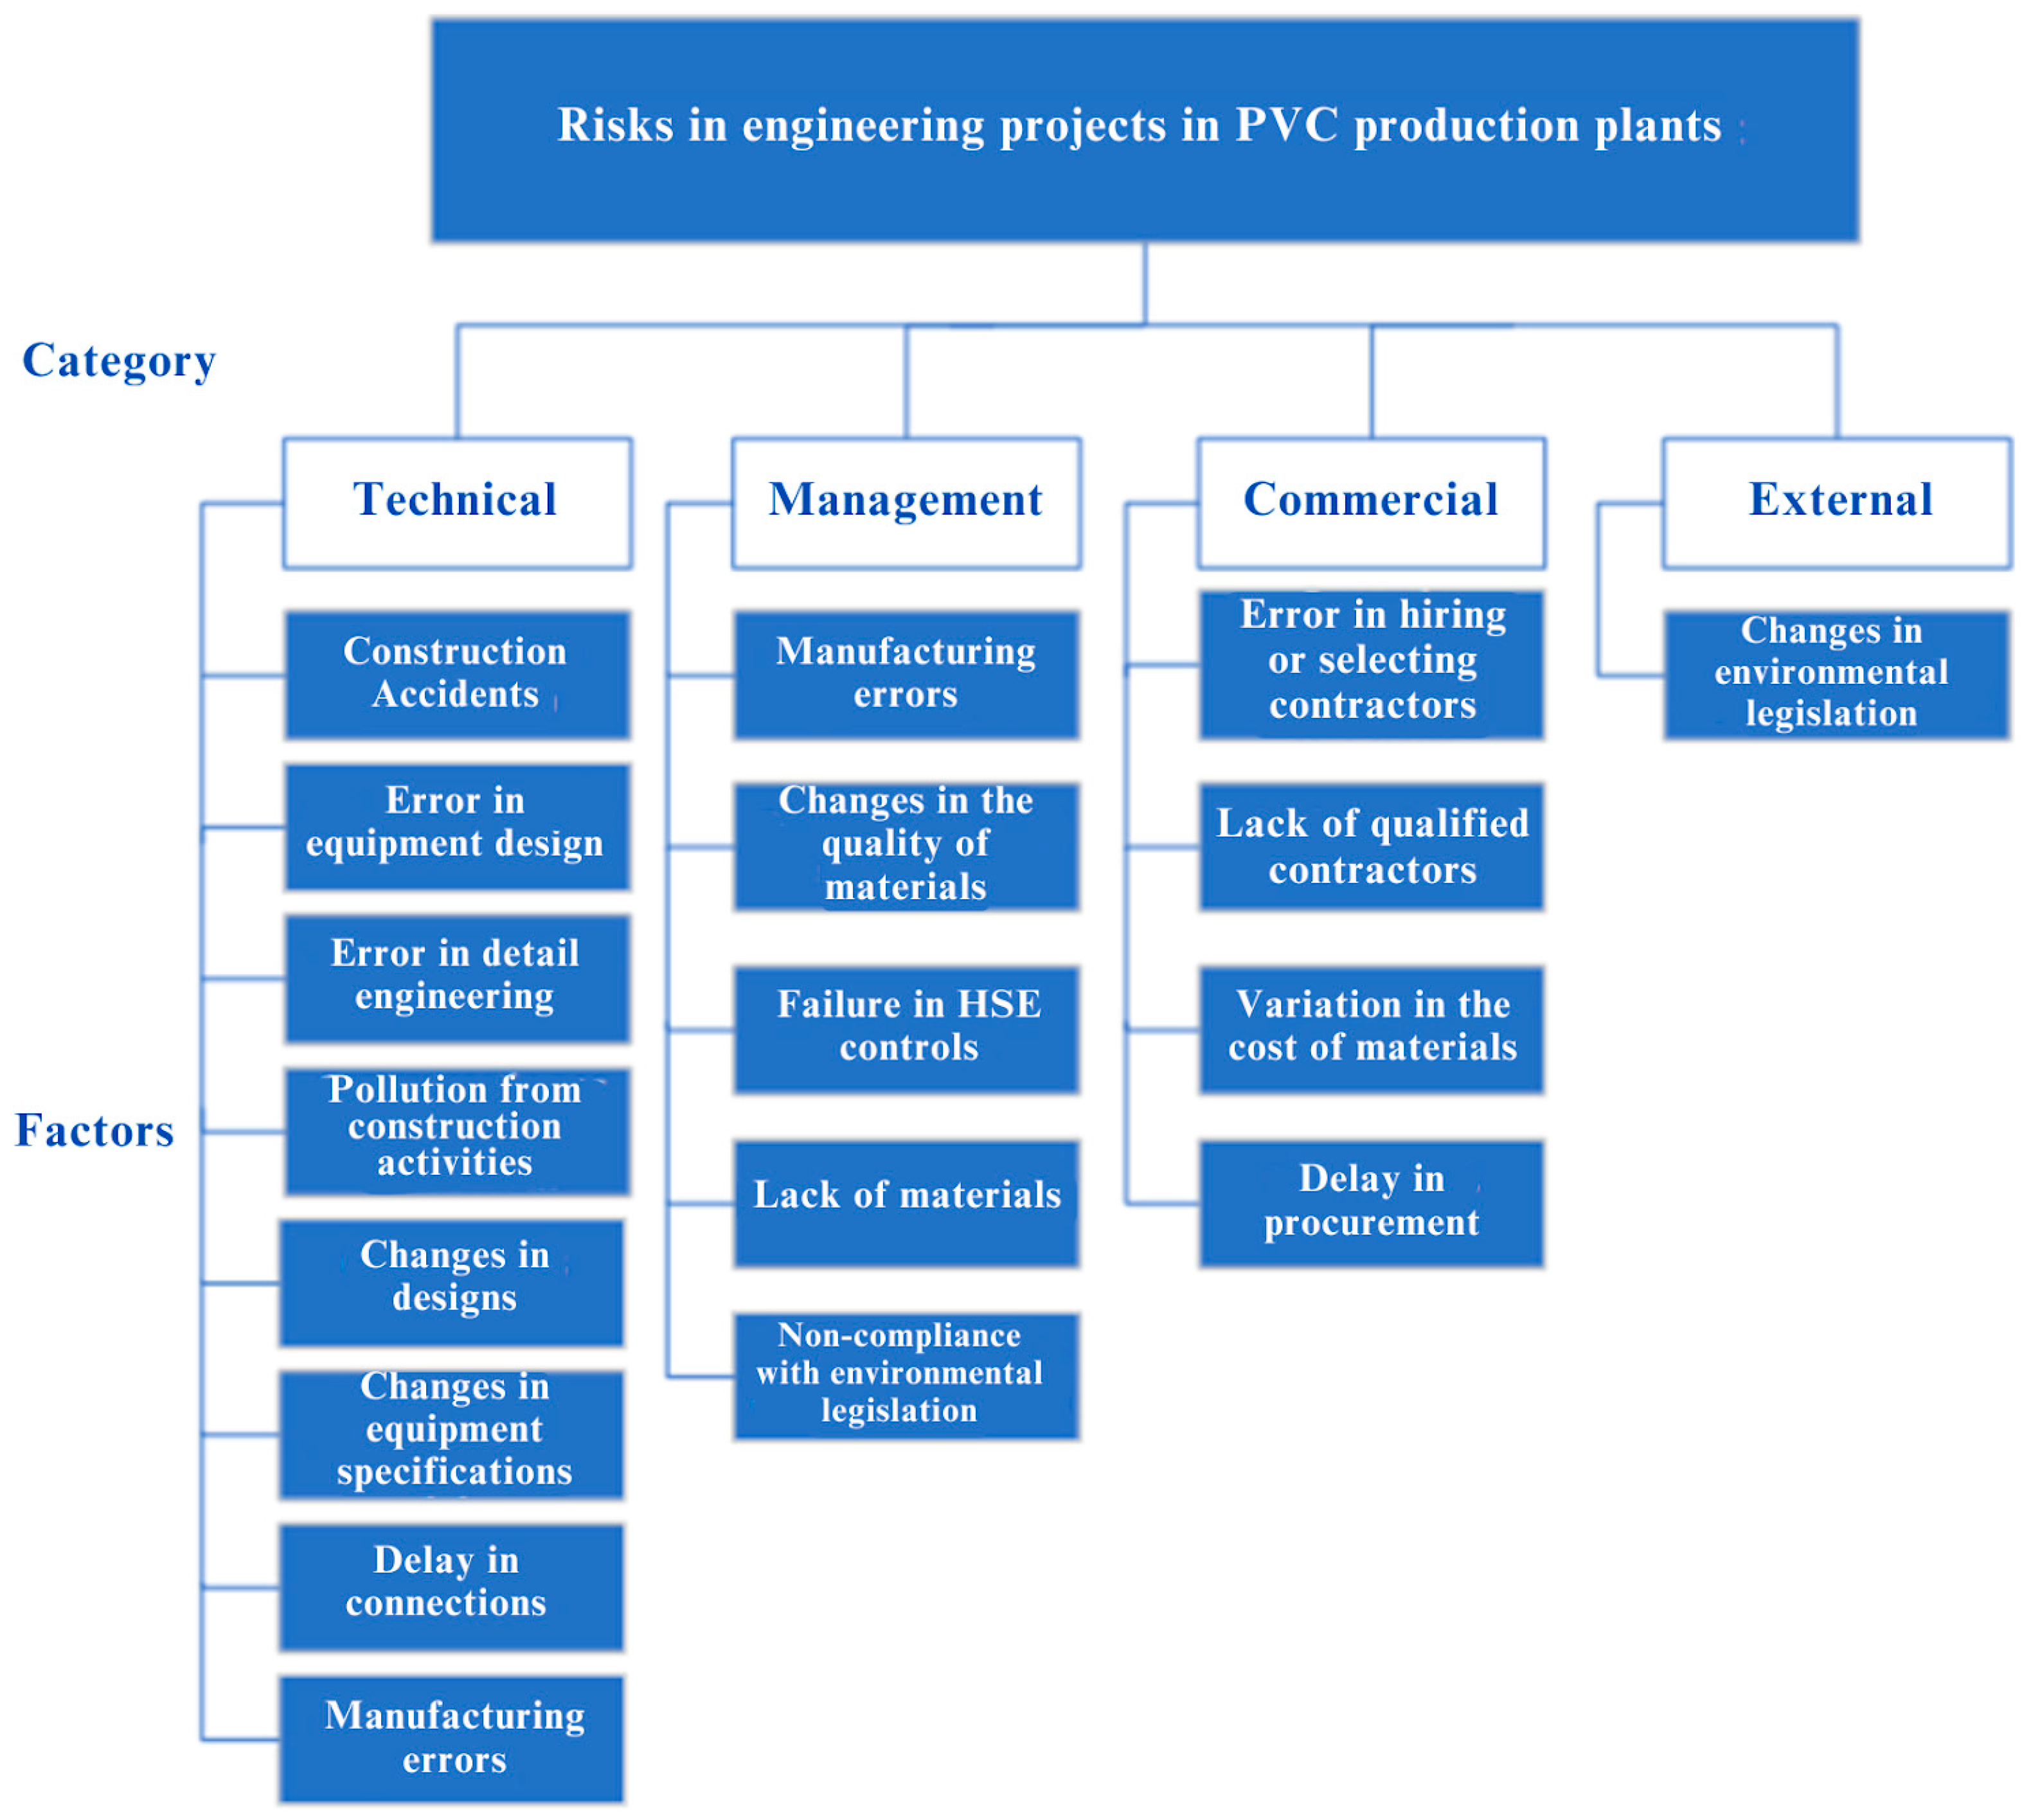
Based on the risk levels or categories set out in the PMBOK [21], a risk breakdown structure (RBS) is proposed that graphically represents the classification of risk factors by levels or hierarchies. These risk factors constitute the sources of the particular risks in the projects. Figure 6 illustrates the RBS for this case study, which can be used generically for engineering projects in petrochemical PVC production plants.

4.2.4. Model Overview

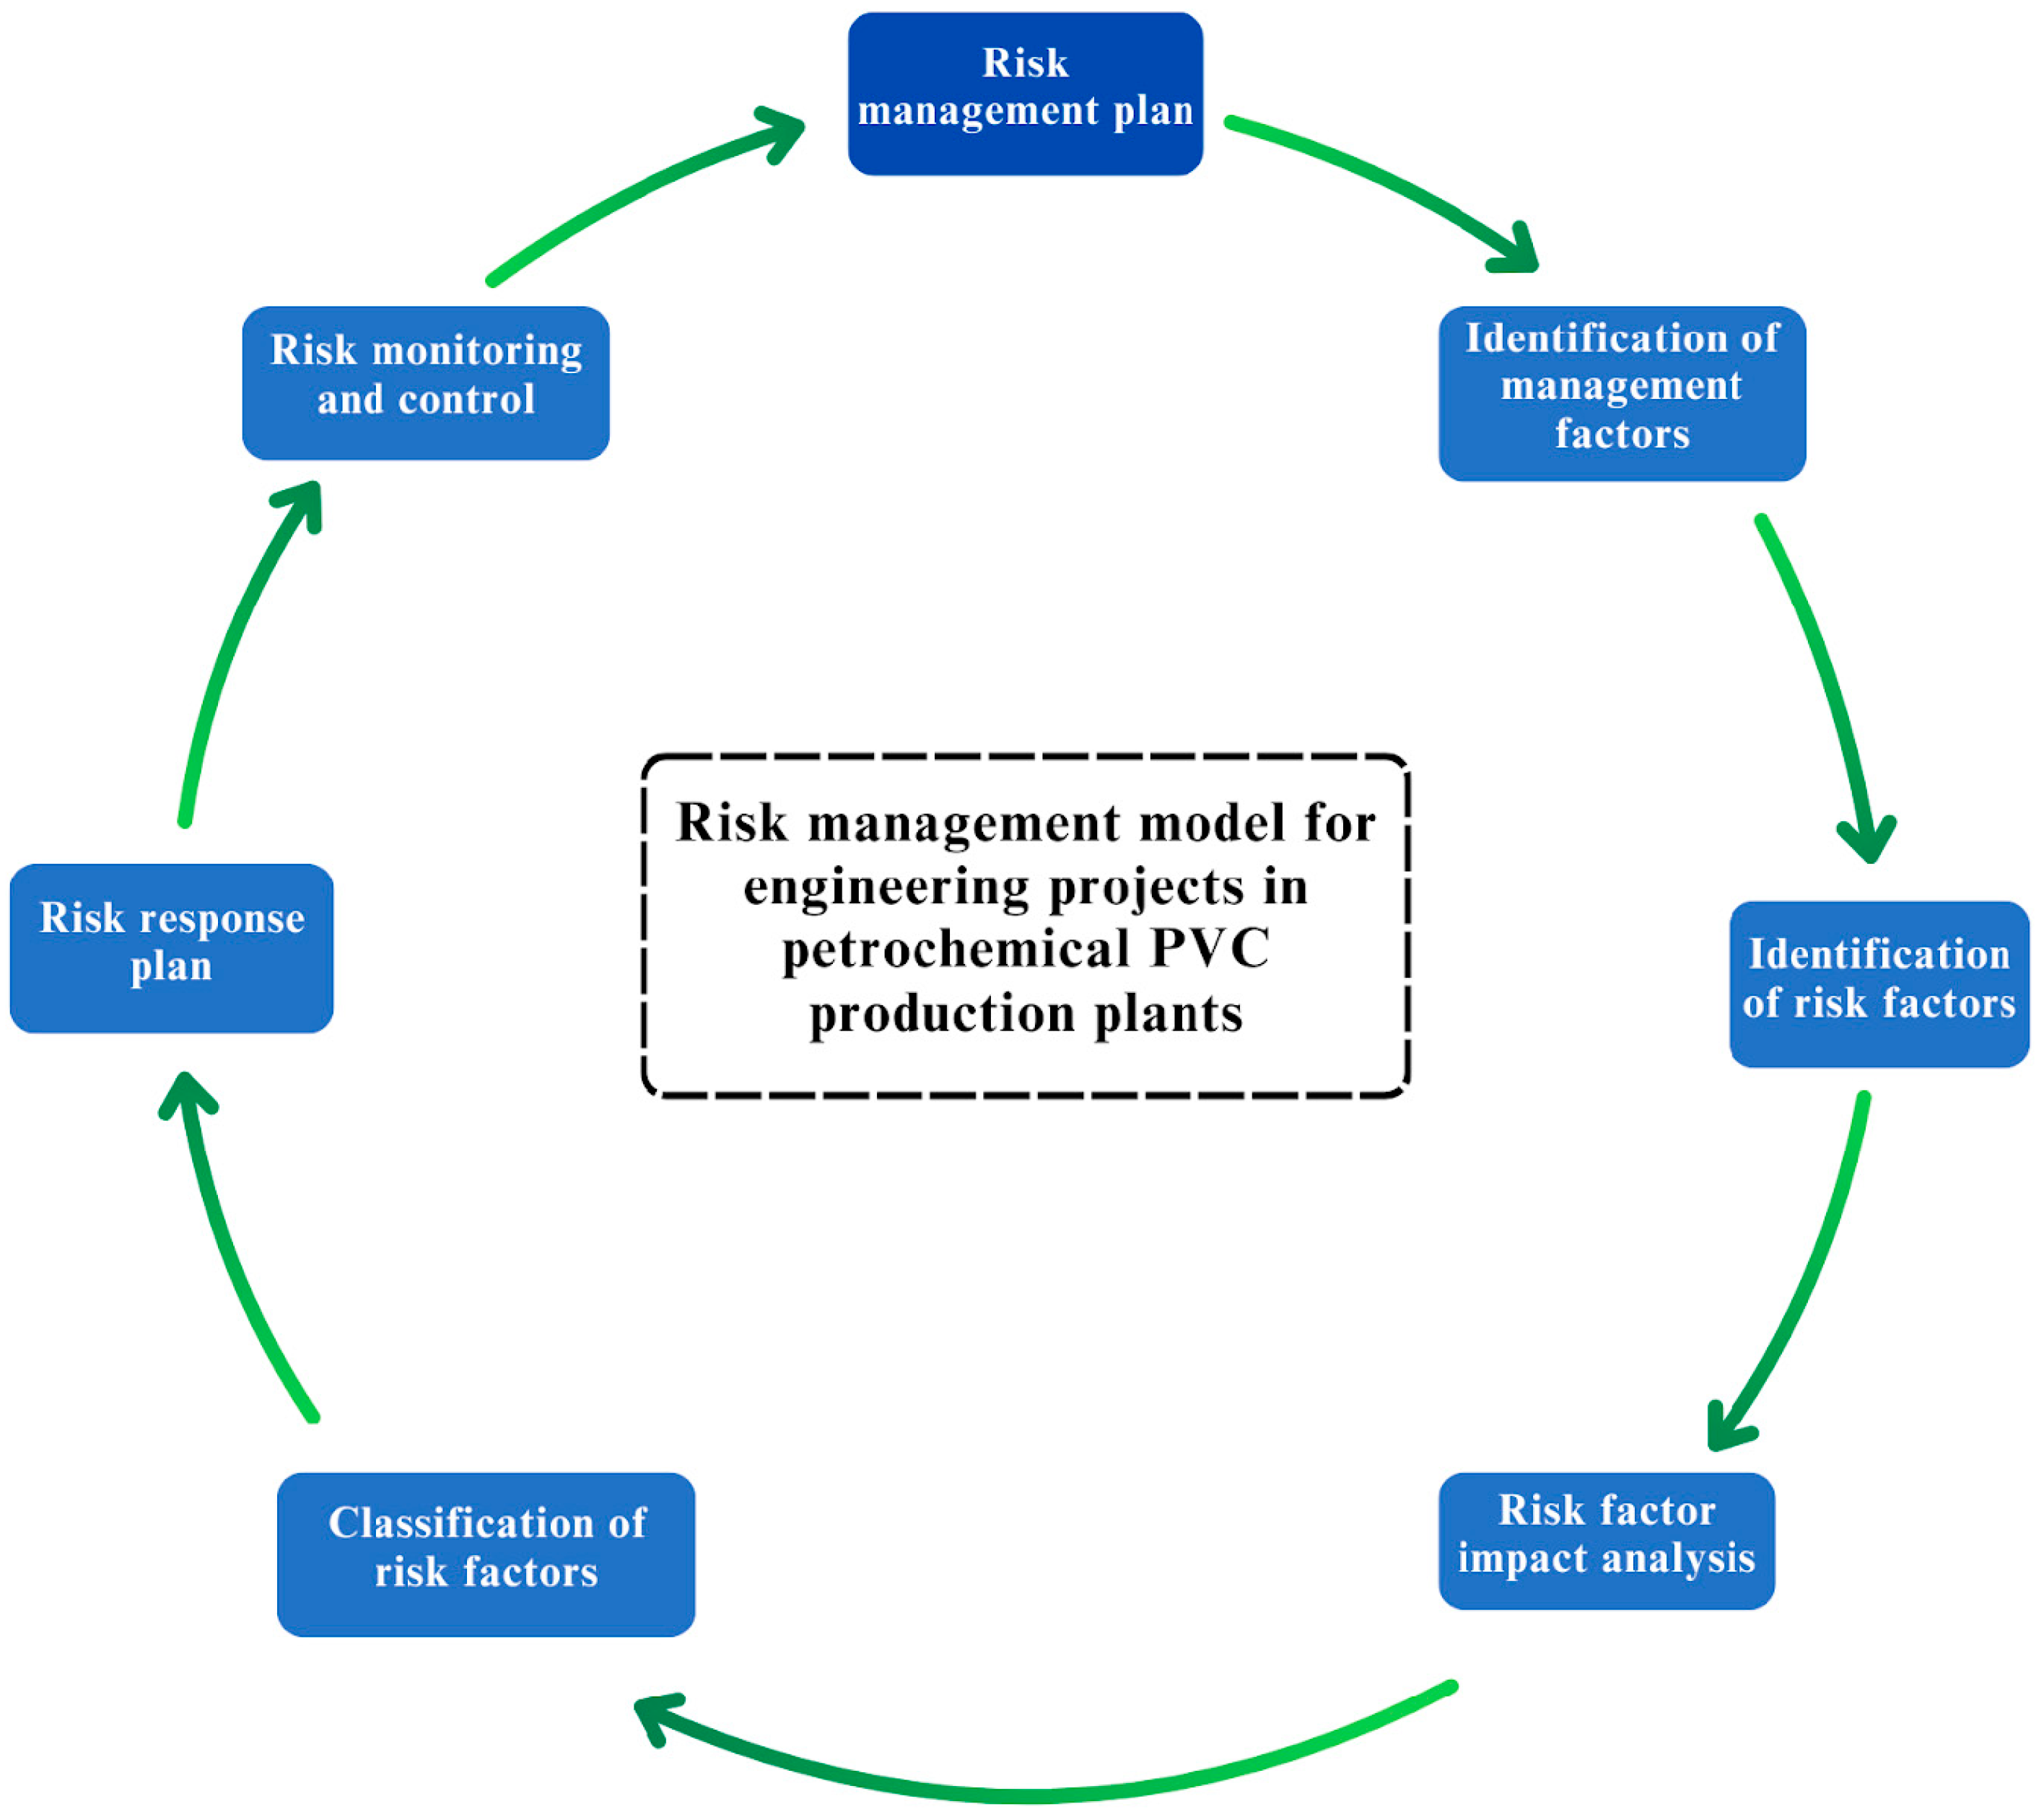
The construction of the proposed model was carried out in two parts, which are defined by two main processes: identification of management factors and identification of risk factors. These two processes are sequential and developed based on the information obtained from the surveys carried out for this research. Within each process, there are other subsequent phases that lead to obtaining the results necessary for the development of the risk management model. The risk management model designed for engineering projects in the present case study is represented in Figure 7. This proposed model is based on a cycle aimed at the review and continuous improvement of the processes of the project risk management plan.

4.2.5. Relevance of the Model

The present risk management model is timely and appropriate since it is specifically designed for engineering projects in petrochemical PVC production plants. The model proposal is significant and novel in that, in Colombia, there are no previous specific studies on the topic of interest of this study, and worldwide, there are not many studies on the particular subject, as evidenced in the state of the art. The regression equation proposed in the present model is also beneficial and accurate in predicting the independent variables’ behavior on the impact of risk factors. This is evidenced by the value obtained from the coefficient of determination (R2 = 0.996), which allows establishing that 99.6% of the dependent variables can be explained by the equation obtained for the regression model:
I F R = 0.175 + 0.963 P R + 1.113 C R + 1.013 S E + 0.765 P D + 0.644   C N + 1.016 C A + 0.935 M A
Due to the complexity of the petrochemical industry, it is essential to have a specific guide for risk management in projects developed in this industry in Colombia since the success of projects depends mainly on adequate management of the risks that may arise throughout their life cycle. All risk management allows for identifying and quantifying the impact tasks would have on the project if they materialize. Therefore, this model aims to identify and quantitatively evaluate risk factors through techniques that allow decisions to be made consistently and systematically so that there is always continuous improvement in the processes that make up the project’s risk management plan.

4.3. Economic and Environmental Impact of the Model

In economic terms, the early identification of risks, such as errors in detailed engineering, delays in procurement, or variations in material costs, allows the application of preventive strategies that reduce unforeseen expenses. For example, the model uses tools such as the analytic hierarchy process (AHP) and linear regression to prioritize the most critical risks, facilitating the efficient allocation of resources. This optimization minimizes cost overruns and reduces losses associated with downtime or schedule interruptions. Furthermore, risk management enables better control over budgets by anticipating adverse scenarios, reducing contingencies, and maximizing project profitability.
From an environmental perspective, the model also has a crucial impact. Mitigating risks such as changes in environmental legislation, pollution from construction activities, or regulatory non-compliance avoids fines and penalties and protects surrounding ecosystems. Integrating ecological management factors into the model ensures that decisions made during the project consider its sustainability. For example, predicting the impact of risky activities enables proactive ecological controls to be implemented to prevent irreversible damage. Furthermore, the model’s ability to quantitatively classify and assess risks fosters a culture of continuous improvement. This is critical in an industry with increasingly stringent environmental requirements, and energy and production costs that must be controlled to remain competitive. The combination of statistical analysis, such as ANOVA and multivariate regression, ensures a sound scientific basis for decision-making, resulting in tangible benefits for projects and the environment.

4.4. Impact of the Human Factor on Risk Management

The human factor plays a central role in risk management, directly influencing the ability to identify, assess, and mitigate the challenges inherent to projects. Key elements such as training, communication, and organizational culture are crucial to ensuring successful results.
Adequate staff training ensures teams have the necessary skills to handle advanced risk management tools and methodologies. In complex projects, such as petrochemical plants, technical training in analytical processes, such as the analytic hierarchy process (AHP), or the use of statistical software, significantly improves the ability to anticipate and address problems. A well-trained team can identify risks more accurately, assess their impacts, and propose effective strategies, thus minimizing the likelihood of errors or delays that increase costs. Effective communication, both vertically and horizontally, is equally critical. Efficient risk management requires that all information related to potential threats or contingencies flow clearly and promptly between team members and management levels. Lack of communication can lead to gaps in risk perception and the implementation of necessary measures. At the same time, an environment that encourages the exchange of ideas and concerns strengthens informed and coordinated decision-making. Finally, organizational culture provides the framework that underpins the collective attitude toward risk management. A culture that values prevention, proactivity, and continuous learning fosters a more robust and structured approach to challenges. When organizations promote transparency, collaboration, and shared responsibility, teams feel more engaged and are more likely to anticipate potential problems and act quickly in the face of adverse situations.

4.5. Comparison with Other Risk Management Frameworks, Techniques, and Tools

Considering the main approaches to risk management from the literature review conducted for this paper, a brief comparison between these approaches and the methodology used in this study is presented below.
While [22] provides a comprehensive, standardized approach to risk management that helps implement a strategic program, it lacks the detailed prioritization and predictive capabilities of AHP and regression analysis.
The use of risk assessment methods in the construction industry is expanding, with researchers and practitioners continuously developing approaches based on techniques such as the Monte Carlo simulation (MCS), analytic hierarchy process (AHP), and failure mode and effects analysis (FMEA), among others [50].
Monte Carlo simulation is a statistical technique that has been used as an excellent tool for modeling uncertainty and variability in risk analysis by several authors in different approaches such as [51,52,53,54]. It is widely utilized in construction project management for risk analysis, with probability theory traditionally serving as the foundation for modeling uncertainty in simulation inputs [51]. Nevertheless, Monte Carlo Simulation is computationally intensive and may not be able to perform the structured factor prioritization found in AHP.
The Bow Tie technique is a structured method for hazard analysis, visually mapping the progression of an accidental event from its causes to its consequences. It highlights existing and recommended protective barriers, both for prevention and mitigation, in a clear schematic format. Bowtie diagrams are effective for process and non-process hazard analysis; they do not provide the quantitative depth of regression analysis because they are a simple, qualitative visual tool with a general focus on process safety and major accident events.
Failure modes and effects analysis (FMEA) is a widely used qualitative methodology for identifying and mitigating specific operational risks by identifying different failure possibilities and their effects on the system. It is among the most widely used risk assessment methodologies across various industries and organizations. However, despite its extensive applications, FMEA has certain limitations that may result in unrealistic outcomes [55]. Since FMEA can make it difficult to prioritize risks based on multiple factors (as is done in AHP), it is suggested that this method could be used instead as part of an integrated model for risk assessment in projects.

5. Conclusions

This research carried out a comprehensive review of the state of the art, focusing mainly on the technical and scientific literature related to risk management in engineering projects in petrochemical plants. As a main result, a model was developed that allows quantitative identification and evaluation of management factors and risks, providing reliable criteria to support decision-making in implementing mitigation strategies. This model integrates tools such as the analytic hierarchy process (AHP), multiple linear regression, normality tests, and ANOVA, thus establishing data consistency and generating a solid methodological framework to assess the impact of different risk factors on projects. The work highlights the importance of experts’ opinions in developing the model, since their experience allowed us to identify the most influential management factors and consolidate lessons from previous projects. In addition, the combination of AHP with advanced statistical techniques strengthens the model’s accuracy, demonstrating that 99.6% of the independent variables can explain the impact of the risk factors through the developed regression equation. This level of precision reinforces the model’s usefulness in predicting and classifying risks according to their level of impact, which facilitates the prioritization of actions to mitigate them. Likewise, a significant lack of research in Colombia on risk management applied to petrochemical projects, specifically in PVC production, was evident. Some external factors (sudden legislative changes, unexpected supply chain disruptions, political conflicts, economic crises, etc.) constitute what is known as dynamic risk, which affects the model. Therefore, it is recommended that the established management factors be reviewed every four months. This study not only contributes to filling this gap but also establishes the basis for future research at the national level. In addition, the proposed model can be adapted to other projects within the petrochemical or crude oil refining industry, extending its applicability to various industrial contexts, and the model can be implemented from the planning stage to the project closure stage. The developed model also opens the door to the design of complementary tools, such as a risk-based cost analysis model, which allows for estimating the costs associated with materializing the identified risk factors. This would be especially valuable in evaluating the economic feasibility of similar projects, considering variables such as contracting prices, benefits and losses, and the costs associated with failure to meet objectives in EPC projects.

Author Contributions

Conceptualization, J.P.B.V., R.O.-T. and J.A.H.F.; Methodology, J.P.B.V., R.O.-T. and J.A.H.F.; Software, J.P.B.V., R.O.-T. and J.A.H.F.; Validation, J.P.B.V., R.O.-T. and J.A.H.F.; Formal analysis, J.P.B.V., R.O.-T. and J.A.H.F.; Investigation, J.P.B.V., R.O.-T. and J.A.H.F.; Resources, R.O.-T. and J.A.H.F.; Data curation, J.A.H.F.; Writing—original draft, J.A.H.F.; Writing—review & editing, J.A.H.F.; Visualization, J.A.H.F.; Supervision J.A.H.F.; Project administration, J.A.H.F.; Funding acquisition, J.A.H.F. All authors have read and agreed to the published version of the manuscript.

Funding

This research received no external funding.

Data Availability Statement

The original contributions presented in this study are included in the article. Further inquiries can be directed to the corresponding authors.

Conflicts of Interest

The authors declare no conflict of interest.

References

  1. Yim, R.; Castaneda, J.; Doolen, T.; Tumer, I.; Malak, R. A study of the impact of project classification on project risk indicators. Int. J. Proj. Manag. 2015, 33, 863–876. [Google Scholar] [CrossRef]
  2. Perminova, O.; Gustafsson, M.; Wikström, K. Defining uncertainty in projects–a new perspective. Int. J. Proj. Manag. 2008, 26, 73–79. [Google Scholar] [CrossRef]
  3. Al Hasani, M.; Regan, M. Understanding risk and uncertainty management practice in complex projects. Eur. J. Econ. Law Political 2017, 4, 24–38. [Google Scholar] [CrossRef]
  4. Karlsen, J.T.; Folke-Olsen, O.; Torvatn, T. Project Risk Management: Use and Benefit of Various Tools. En: Int. J. Risk Conting. Mgmt. 2013, 2, 79–101. [Google Scholar] [CrossRef]
  5. Iles, A.; Martin, A.; Rosen, C.M. Undoing chemical industry lock-ins: Polyvinyl chloride and green chemistry. Ethics Chem. 2021, 279–316. [Google Scholar] [CrossRef]
  6. Zhang, Y.; Xing, E.; Han, W.; Yang, P.; Zhang, S.; Liu, S.; Cao, D.; Li, M. Petrochemical industry for the future. Engineering 2024, 43, 99–114. [Google Scholar] [CrossRef]
  7. Stadtherr, M.; Rudd, D.F. Systems study of the petrochemical industry. Chem. Eng. Sci. 1976, 31, 1019–1028. [Google Scholar] [CrossRef]
  8. Hassani, H.; Silva, E.S.; Al Kaabi, A.M. The role of innovation and technology in sustaining the petroleum and petrochemical industry. Technol. Forecast. Soc. Chang. 2017, 119, 1–17. [Google Scholar] [CrossRef]
  9. Akhtar, M. Dealing with EPC Project Management Problems and Challenges a Case Study on Petrochemical, Oil and Gas EPC Projects in Middle-East. In Proceedings of the Abu Dhabi International Petroleum Exhibition & Conference, Abu Dhabi, United Arab Emirates, 9–12 November 2020. [Google Scholar] [CrossRef]
  10. Boaventura, K.M.; Peixoto, F.C.; Fernandes, H.L.S.; Pessoa, F.L.P. Long-Range Investment Assessment in a Petrochemical Industry: Cost and Safety Considerations. Comput. Chem. Eng. 2022, 161, 107737. [Google Scholar] [CrossRef]
  11. Ostadi, B.; Abbasi Harofteh, S. A novel risk assessment approach using Monte Carlo simulation based on co-occurrence of risk factors: A case study of a petrochemical plant construction. Sci. Iran. 2022, 29, 1755–1765. [Google Scholar] [CrossRef]
  12. Babaeipour, P.A.; Mohammadi, M.; Kazemi, M.A.A. Designing a Collaboration Model Among Supply Chain Members to Reduce External Supply Risk in the Oil and Petrochemical Industry Using Game Theory. Mgmt. Strateg. Eng. Sci. 2024, 6, 159–168. [Google Scholar] [CrossRef]
  13. Khodabakhshian, A.; Puolitaival, T.; Kestle, L. Deterministic and Probabilistic Risk Management Approaches in Construction Projects: A Systematic Literature Review and Comparative Analysis. Buildings 2023, 13, 1312. [Google Scholar] [CrossRef]
  14. Olsson, R. In search of opportunity management: Is the risk management process enough? Int. J. Proj. Manag. 2007, 25, 745–752. [Google Scholar] [CrossRef]
  15. Cooper, D.; Grey, S.; Raymond, G.; Walker, P. Project Risk Management Guidelines: Managing Risk in Large Projects and Complex Procurements; John Wiley & Sons Ltd.: Chichester, UK, 2005; p. 384. [Google Scholar]
  16. Do Vale, J.W.S.P.; De Carvalho, M.M. Risk and uncertainty in projects management: Literature review and conceptual framework. GEPROS. J. Sustain. Product. Oper. Syst. Mgmt. 2017, 12, 93–120. [Google Scholar] [CrossRef]
  17. Jaafari, A. Management of risks, uncertainties and opportunities on projects: Time for a fundamental shift. Int. J. Proj. Manag. 2001, 19, 89–101. [Google Scholar] [CrossRef]
  18. Vianello, J.M.; Costa, L.; Teixeira, J.P. Dynamic modeling of uncertainty in the planned values of investments in petrochemical and refining projects. Energy Econ. 2014, 45, 10–18. [Google Scholar] [CrossRef]
  19. Kutsch, E.; Hall, M. Deliberate ignorance in project risk management. Int. J. Proj. Manag. 2009, 28, 245–255. [Google Scholar] [CrossRef]
  20. Tomanek, M.; Juricek, J. Project Risk Management model based on PRINCE2 and SCRUM frameworks. Int. J. Softw. Eng Appl. 2015, 6, 81–88. [Google Scholar] [CrossRef]
  21. Project Management Institute (PMI). A Guide to the Project Management Body of Knowledge (PMBOK), 6th ed.; Project Management Institute: Newtown Square, PA, USA, 2021. [Google Scholar]
  22. ISO 31000:2018; Risk management—Guidelines, 3rd ed. International Organization for Standardization (ISO): Geneva, Switzerland, 2018.
  23. Ward, S.; Chapman, C. Transforming project risk management into Project uncertainty management. Int. J. Proj. Manag. 2003, 21, 97–105. [Google Scholar] [CrossRef]
  24. Böhle, F.; Heidling, E.; Schoper, Y. A new orientation to deal with uncertainty in projects. Int. J. Proj. Manag. 2016, 34, 1384–1392. [Google Scholar] [CrossRef]
  25. Roșu, M.M.; Rohan, R.; Juganaru, E.C. Methodology for risk analysis of projects. MATEC Web Conf. 2017, 112, 09012. [Google Scholar] [CrossRef]
  26. Chapman, C. Project risk analysis and management--PRAM the generic process. Int. J. Proj. Manag. 1997, 15, 273–281. [Google Scholar] [CrossRef]
  27. Samimi, A. Risk Management in EPC Projects. Eurasian J. Chem. Med. Pet. Res. 2024, 3, 191–201. [Google Scholar]
  28. Guerrero, E.C. Análisis de competitividad del sector petroquímico de Colombia basado en los factores productivos de clúster con alto potencial de desarrollo para el mejoramiento continuo del sector. Gestión Compet. Innovación 2013, 1, 12–21. [Google Scholar]
  29. Li, D. Perspective for smart factory in petrochemical industry. Comput. Chem. Eng. 2016, 91, 136–148. [Google Scholar] [CrossRef]
  30. Bidder, J. The project management of large petrochemical complexes. Eng. Process Econ. 1976, 1, 55–65. [Google Scholar] [CrossRef]
  31. Zhiguo, H.; Jiming, W.; Zhiguo, C. Model Choosing Method Based-on Variation Coefficient and Its Application to Project Management of Petrochemical Engineering Construction. In Proceedings of the 16th International Conference on Industrial Engineering and Engineering Management, Beijing, China, 21–23 October 2009; pp. 1749–1753. [Google Scholar] [CrossRef]
  32. Garcez, M.P.; Sbagria, R.; Kruglianskas, I. Factors for selecting Partners in Innovation Projects-Evidences from alliances in the Brazilian Petrochemical Leader. Rev. Adm. Inov. 2014, 11, 241–272. [Google Scholar] [CrossRef]
  33. Morales, M.A.; Dominguez, E.R.; Ibarra, A.A.; Reynaga, N.S.; Delgadillo, S.A.M. A methodological improvement for assessing petrochemical projects through life cycle assessment and eco-costs. Int. J. Life Cycle Assmt. 2014, 19, 517–531. [Google Scholar] [CrossRef]
  34. Pham, L.H.; Hadikusumo, H. Schedule delays in engineering, procurement, and construction petrochemical projects in Vietnam. Int. J. Energy Sec. Mgmt. 2014, 8, 3–26. [Google Scholar] [CrossRef]
  35. Elwany, M.H.; Elsharkawy, A. Impact of Integrating Earned Value Management and Risk Management on the Success in Oil, Gas and Petrochemicals Engineering Procurement and Construction EPC Projects. Int. J. Adv. Scient. Res. Mgmt. 2016, 1, 75–88. [Google Scholar]
  36. Heravi, G.; Fathi, M.; Faegh, S. Multi-criteria group decision-making method for optimal selection of sustainable industrial building options focused on petrochemical projects. J. Clean. Prod. 2017, 142, 2999–3013. [Google Scholar] [CrossRef]
  37. Kim, Y.S.; Kang, H.W. Development of a Model for Risk and Cost Analysis in Overseas Plant Construction Projects Focusing on Petrochemical Plant Construction Projects. KSCE J. Civ. Eng. 2017, 21, 1549–1562. [Google Scholar] [CrossRef]
  38. Khalafi, S.A.; Akhoondi, E.H.; Ghamsari, J.A.; Ansari, P. Determining the Most Significant Contributing Risk Factors to Petrochemical Project Failure. In Proceedings of the 9th European Conference on Management Leadership and Governance, Klagenfurt, Austria, 14–15 November 2013; pp. 114–121. Available online: https://www.researchgate.net/profile/Seyedamirhesam_Khalafi/publication/320073596_Determining_the_Most_Significant_Contributing_Risk_Factors_to_Petrochemical_Project_Failure/links/5b24295d458515270fd1c1e9/Determining-the-Most-Significant-Contributing-Risk-Factors-to-Petrochemical-Project-Failure.pdf (accessed on 23 December 2023).
  39. Damnjanovic, I.; Røed, W. Risk management in operations of petrochemical plants: Can better planning prevent major accidents and save money at the same time? J. Loss Prev. Process Ind. 2016, 44, 223–231. [Google Scholar] [CrossRef]
  40. Uher, T.E.; Toakley, A.R. Risk management in the conceptual phase of a project. Int. J. Proj. Manag. 1999, 17, 161–169. [Google Scholar] [CrossRef]
  41. Vásquez, H. La Historia del Petróleo en Colombia. Rev. Univ. EAFIT 1994, 30, 99–109. [Google Scholar]
  42. Acosta, K. Cartagena: Entre el progreso industrial y el rezago social. Econ. Región. 2013, 7, 5–66. [Google Scholar] [CrossRef]
  43. Vaidya, O.S.; Kumar, S. Analytic hierarchy process: An overview of applications. Europ. J. Oper. Res. 2006, 169, 1–29. [Google Scholar] [CrossRef]
  44. Saaty, T.L. The analytic network process. In International Series in Operations Research and Management Science; Springer: Boston, MA, USA, 2006; Volume 95, pp. 1–26. [Google Scholar] [CrossRef]
  45. Badiru, A.; Kovach, T. Statistical Techniques for Project Control; CRC Press & Francis Group: Boca Ratón, FL, USA, 2012; p. 412. [Google Scholar]
  46. Bhushan, N.; Rai, K. Strategic Decision Making: Applying the Analytic Hierarchy Process; Springer: London, UK, 2004; pp. 11–21. [Google Scholar]
  47. Pant, S.; Kumar, A.; Ram, M.; Klochkov, Y.; Sharma, H.K. Consistency Indices in Analytic Hierarchy Process: A Review. Mathematics 2022, 10, 1206. [Google Scholar] [CrossRef]
  48. Brunelli, M. Introduction to the Analytic Hierarchy Process; Springer Nature: Dordrecht, The Netherlands, 2015; p. 83. [Google Scholar] [CrossRef]
  49. Alonso, J.A.; Lamata, M.T. Consistency in the analytic hierarchy process: A new approach. Int. J. Uncertain. Fuzziness Knowl.-Based Syst. 2006, 14, 445–459. [Google Scholar] [CrossRef]
  50. Ahmadi, M.; Behzadian, K.; Ardeshir, A.; Kapelan, Z. Comprehensive risk management using fuzzy FMEA and MCDA techniques in highway construction projects. J. Civ. Eng. Manag. 2016, 23, 300–310. [Google Scholar] [CrossRef]
  51. Sadeghi, N.; Fayek, A.R. Fuzzy Monte Carlo Simulation and Risk Assessment in Construction. Comp.-Aided Civ. Infrastruct. Eng. 2010, 25, 238–252. [Google Scholar] [CrossRef]
  52. Qazi, A.; Shamayleh, A.; El-Sayegh, S.; Formaneck, S. Prioritizing risks in sustainable construction projects using a risk matrix-based Monte Carlo Simulation approach. Sustain. Cities Soc. 2021, 65, 102576. [Google Scholar] [CrossRef]
  53. Qazi, A.; Simsekler, M.C.E. Risk assessment of construction projects using Monte Carlo simulation. Int. J. Manag. Proj. Bus. 2021, 14, 1202–1218. [Google Scholar] [CrossRef]
  54. Sobieraj, J.; Metelski, D. Project Risk in the Context of Construction Schedules—Combined Monte Carlo Simulation and Time at Risk (TaR) Approach: Insights from the Fort Bema Housing Estate Complex. Appl. Sci. 2022, 12, 1044. [Google Scholar] [CrossRef]
  55. Alvand, A.; Mohammad Mirhosseini, S.; Ehsanifar, M.; Zeighami, E.; Mohammadi, A. Identification and Assessment of Risk in Construction Projects Using the Integrated FMEA-SWARA-WASPAS Model under Fuzzy Environment: A Case Study of a Construction Project in Iran. Int. J. Constr. Manag. 2021, 23, 392–404. [Google Scholar] [CrossRef]
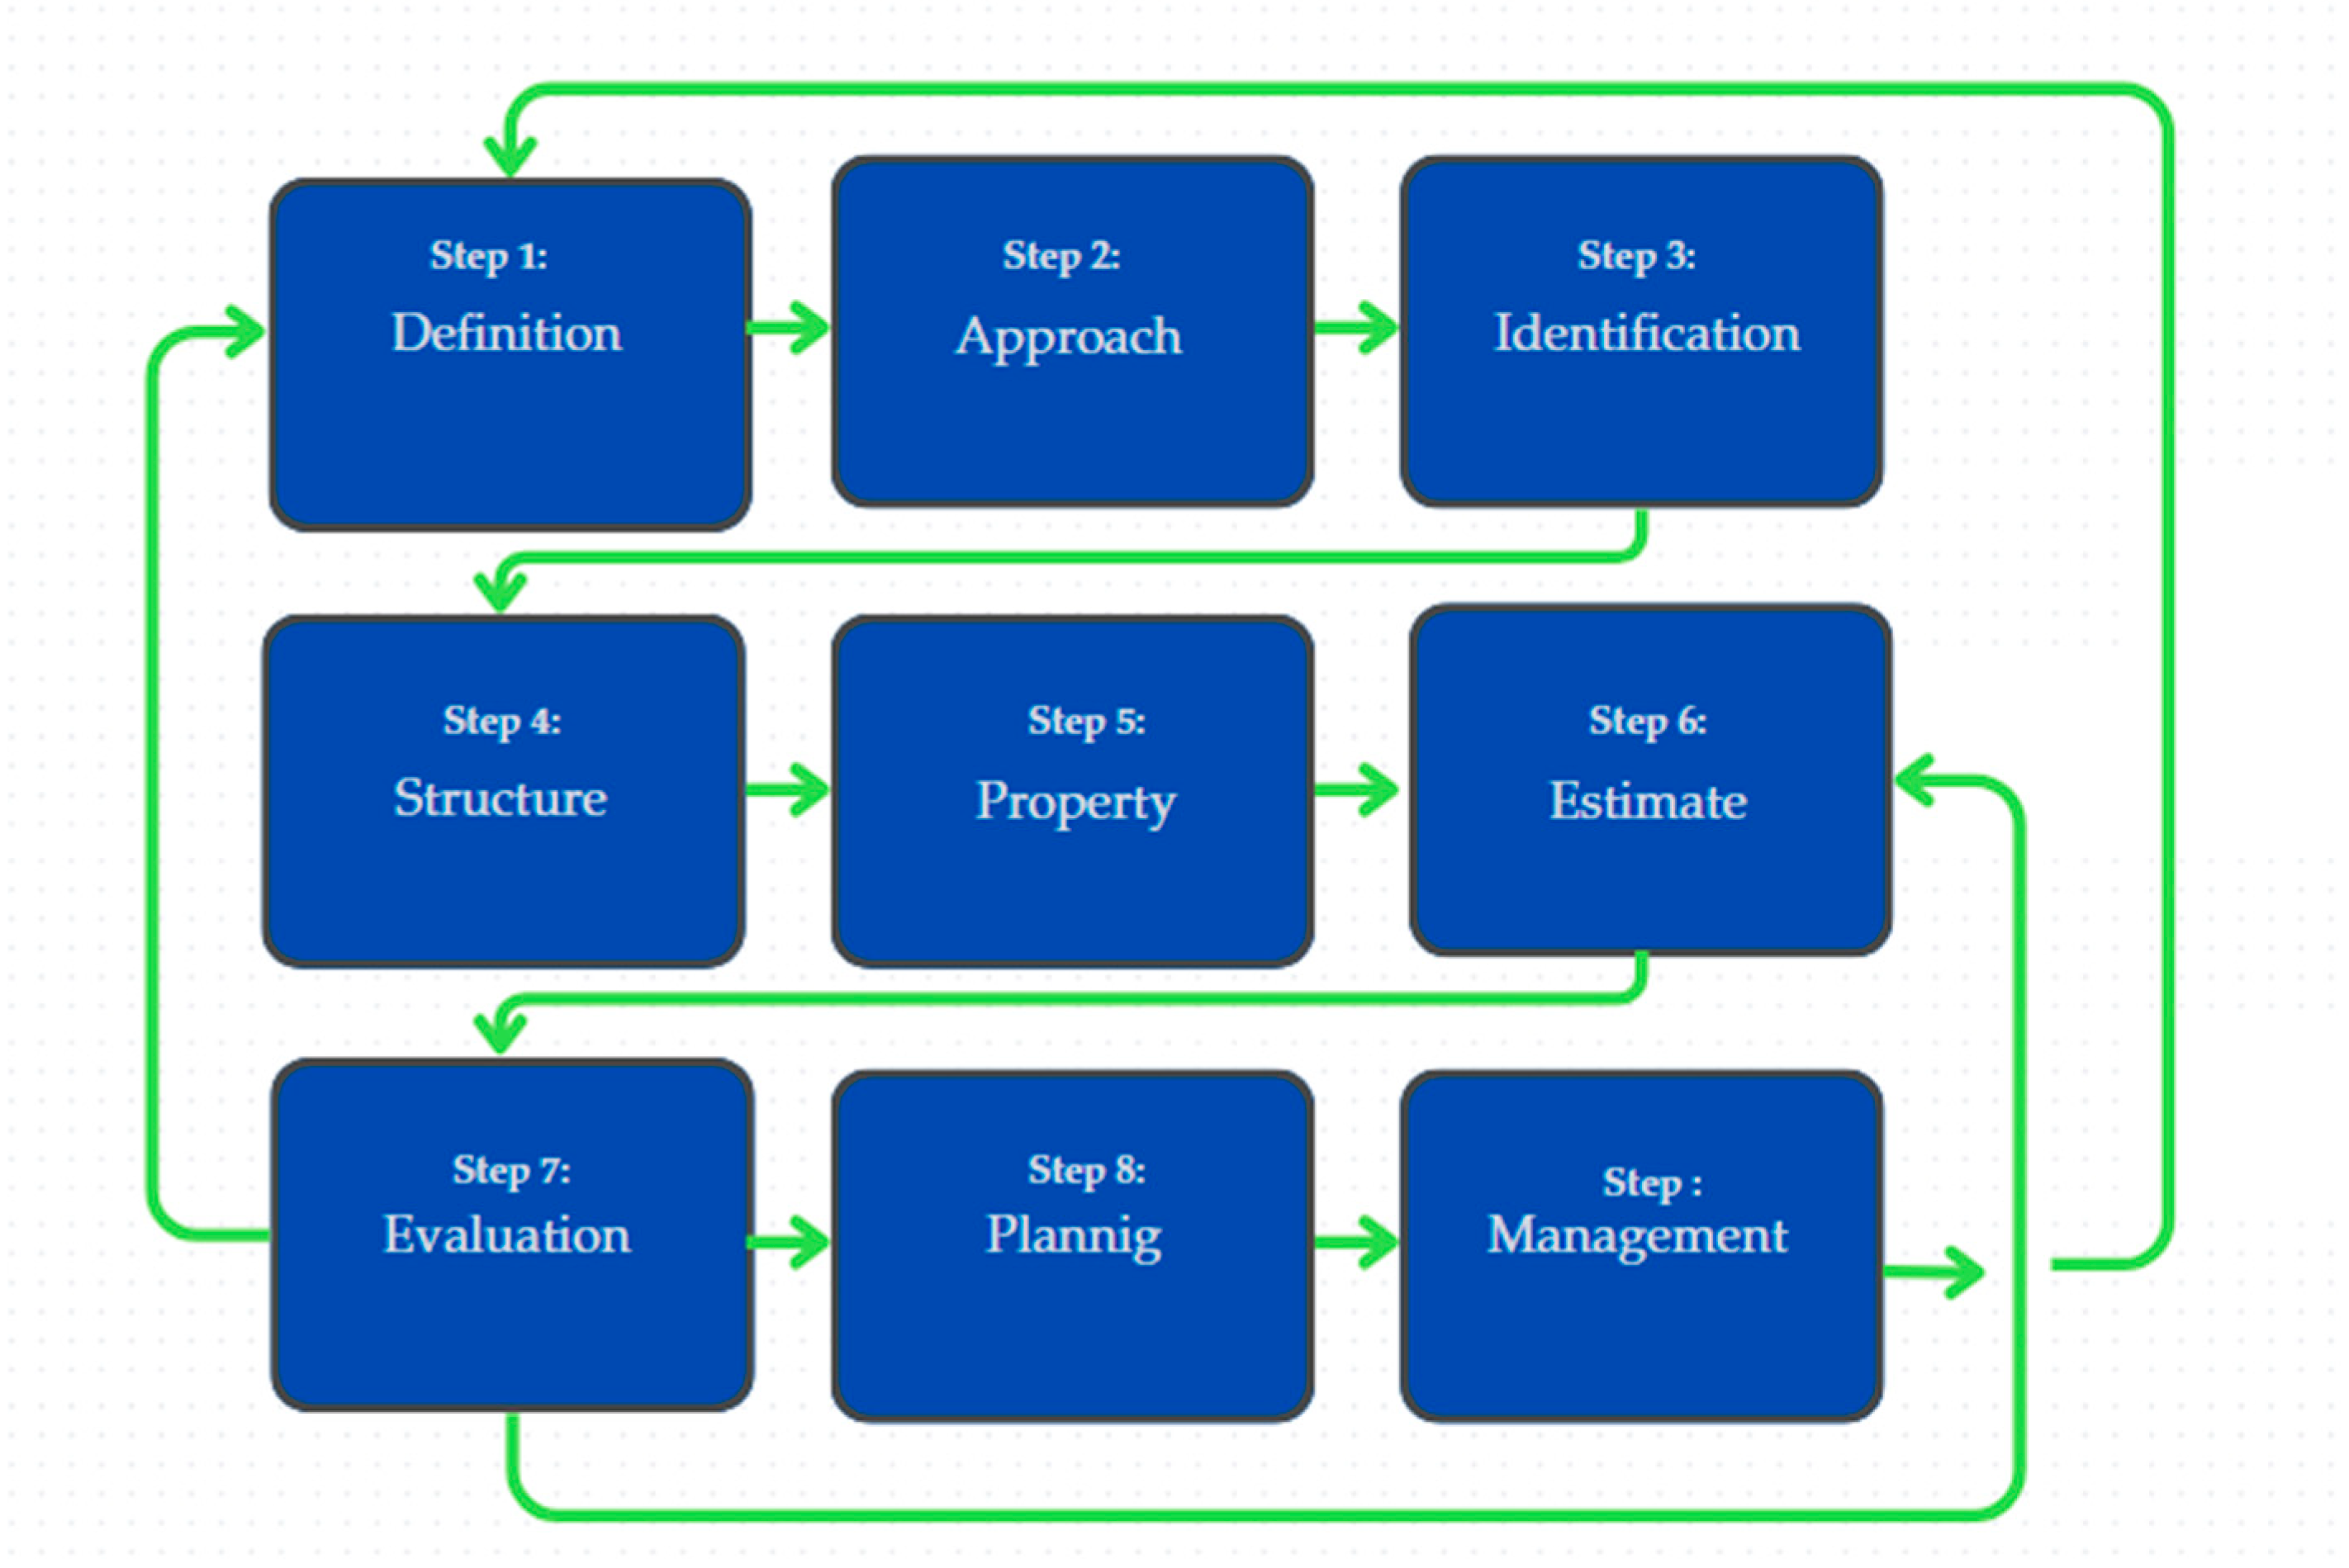
Figure 1. Project risk management process, adapted from [26].
Chemengineering 09 00075 g001
Figure 2. Radar graph of management factor distribution.
Chemengineering 09 00075 g002
Figure 3. Impact scale for risk factors.
Chemengineering 09 00075 g003
Figure 4. Residual histogram.
Chemengineering 09 00075 g004
Figure 5. Normal P-P plot of standardized residual regression.
Chemengineering 09 00075 g005
Figure 6. Risk breakdown structure (RBS).
Chemengineering 09 00075 g006
Figure 7. Risk management model for engineering projects in PVC-producing petrochemical plants.
Chemengineering 09 00075 g007
Table 1. Risk management procedures according to some methodologies and standards.
ProcedureDefinitionProcess
PRINCE2Systematic application of principles, approaches, and processes to the tasks of identifying and assessing risks, planning and implementing risk responses, and communicating risk management activities to stakeholders.Identify
Assess
Plan
Implement
APMProcess that enables individual risk events and overall risks to be understood and managed proactively, optimizing success by minimizing threats and maximizing opportunities.Identify
Assess
Response plan
Implement response
PMIProcesses to carry out management planning, identification, analysis, response planning, response implementation, and monitoring of project risks.Plan
Identify
Qualitative and quantitative analysis
Plan the response to risks
Risk response planning
Monitoring the risks
ISO 31000Provides guidelines for risk management. It offers a structured framework to help organizations identify, analyze, evaluate, treat, monitor, and communicate risks effectively.Risk identification
Risk analysis
Risk evaluation
Risk treatment
Monitoring and review
Table 2. Paired comparison matrix.
 Management Factors Budget Schedule Safety Productivity Contract Quality Environmental
 Budget  1 2 1/5 1 3 1/2 2
 Schedule  1/2 1 1/5 2 3 1 1/3
 Safety  5 5 1 5 9 3 2
 Productivity  10 1/2 1/5 1 3 1 1
 Contract  1/3 1/3 1/9 1/3 1 0.2 ½
 Quality  2 1 1/3 1 5 1 3
 Environmental  1/2 3 1/2 1 2 1/3 1
 Summation 10.33 12.83 2.54 11.33 26.00 7.03 9.83
Table 3. AHP results.
 Management Factors Budget Schedule Safety Productivity Contract Quality Environmental Sum Weight
 Budget  0.10 0.13 0.08 0.18 0.18 0.09 0.24 1.00 0.14
 Schedule  0.05 0.07 0.08 0.12 0.12 0.06 0.04 0.54 0.08
 Safety  0.52 0.34 0.39 0.31 0.31 0.51 0.24 2.62 0.38
 Productivity  0.03 0.03 0.08 0.06 0.11 0.06 0.06 0.43 0.06
 Contract  0.02 0.02 0.04 0.02 0.02 0.04 0.03 0.19 0.03
 Quality  0.21 0.20 0.13 0.18 0.18 0.18 0.24 1.32 0.19
 Environmental  0.05 0.20 0.20 0.12 0.07 0.09 0.12 0.85 0.12
 Summation - - - - - - - - 1.0
Table 4. Risk factors.
Risk Factors
Equipment design errorConstruction accidents
Detailed engineering errorLack of qualified contractors
Failure in HSE controlsDelay in connections
Design changesPlanning errors
Procurement delaysManufacturing errors
Variation in material costsError in contractor hiring or selection
Change in material qualityChanges in environmental legislation
Change in equipment specificationsPollution from construction activities
Lack of materialsNon-compliance with environmental legislation
Table 5. Impact and scoring indices.
Management Factors BudgetScheduleSafetyProductivity
Score = Index × weight14.4%7.5%37.6%6.2%
CodeRisk Factors ↓IndexScoreIndexScoreIndexScoreIndexScore
FR 1Equipment design error101.480.641.590.6
FR2Detailed engineering error8.51.29.10.731.17.70.5
FR 3Failure in HSE controls71.040.383.060.4
FR 4Changes in designs7.11.080.641.590.6
FR 5Procurement delays6.60.9100.741.5100.6
FR 6Material cost variation101.440.331.150.3
FR 7Material quality changes91.360.44.81.87.70.5
FR 8Equipment specification changes81.150.441.580.5
FR 9Lack of materials60.99.80.720.89.70.6
FR 10Construction accidents81.180.6103.88.80.5
FR 11Lack of qualified contractors60.97.40.641.590.6
FR 12Connection delays71.08.70.731.1100.6
FR 13Planning errors91.3100.75.52.180.5
FR 14Manufacturing errors9.61.480.662.39.30.6
FR 15Contracting or selecting contractor errors50.780.64.51.78.30.5
FR 16Environmental legislation changes81.140.351.930.2
FR 17Pollution from construction activities81.150.462.340.2
FR 18Non-compliance with environmental legislation6.10.94.20.341.540.2
Management factors RecruitmentQualityEnvironmentalAddition
Score = Index × weight3.4%18.8%12.1%100%
CodeRisk Factors IndexScoreIndexScoreIndexScoreIndexScore
FR 1Equipment design error80.38.61.680.38.61.6
FR2Detailed engineering error80.3101.980.3101.9
FR 3Failure in HSE controls50.250.950.250.9
FR 4Changes in designs90.381.590.381.5
FR 5Procurement delays90.35.61.190.35.61.1
FR 6Material cost variation8.60.371.38.60.371.3
FR 7Material quality changes80.37.51.480.37.51.4
FR 8Equipment specification changes70.291.770.291.7
FR 9Lack of materials70.281.570.281.5
FR 10Construction accidents60.25.81.160.25.81.1
FR 11Lack of qualified contractors100.391.7100.391.7
FR 12Connection delays6.20.28.11.56.20.28.11.5
FR 13Planning errors8.60.371.38.60.371.3
FR 14Manufacturing errors90.3101.990.3101.9
FR 15Contracting or selecting contractor errors100.39.51.8100.39.51.8
FR 16Environmental legislation changes60.230.660.230.6
FR 17Pollution from construction activities40.150.940.150.9
FR 18Non-compliance with environmental legislation50.230.650.230.6
Table 6. ANOVA results.
ModelSum of SquaresDegrees of FreedomMean SquareFSig.
Regression13.31071.901334.0130.000
Residual0.057100.0057
Total13.36717
Table 7. Regression model summary.
RR2Adjusted R2 Standard Error of the EstimateDurbin–Watson
0.9980.9960.9930.075452.289
Table 8. Regression coefficients.
ModelUnstandardized Coefficients
bStandard Error
(Constant)0.1750.164
Budget0.9630.100
Schedule1.1130.196
Safety1.0130.030
Productivity0.7650.278
Hiring0.6440.398
Quality1.0160.076
Environment0.9350.079
Disclaimer/Publisher’s Note: The statements, opinions and data contained in all publications are solely those of the individual author(s) and contributor(s) and not of MDPI and/or the editor(s). MDPI and/or the editor(s) disclaim responsibility for any injury to people or property resulting from any ideas, methods, instructions or products referred to in the content.