Article

Parametric Optimization of Multi-Stage Flashing Desalination System Using Genetic Algorithm for Efficient Energy Utilization

1
Mechanical Engineering Department, Al-Huson University College, Al-Balqa’ Applied University, P.O. Box 50, Al-Huson, Irbid 19117, Jordan
2
Water and Environmental Engineering Department, Al-Huson University College, Al-Balqa’ Applied University, P.O. Box 50, Al-Huson, Irbid 19117, Jordan
3
Chemical Engineering Department, Al-Huson University College, Al-Balqa’ Applied University, P.O. Box 50, Al-Huson, Irbid 19117, Jordan
4
Biomass Research Centre, University of Perugia, Via G. Duranti n. 67, 06125 Perugia, Italy
*
Authors to whom correspondence should be addressed.
ChemEngineering 2024, 8(4), 83; https://doi.org/10.3390/chemengineering8040083
Submission received: 20 June 2024 / Revised: 31 July 2024 / Accepted: 6 August 2024 / Published: 19 August 2024
(This article belongs to the Special Issue Advances in Renewable Energy Derivatives)

Abstract

:
The technique of multi-stage desalination with brine recirculation (MSF-BR) is characterized by its high energy demand, necessitating the exploration of efficient operational methods to minimize energy consumption and enhance plant performance. In this research study, Matlab R2021a software was used to apply a genetic algorithm with the aim of determining the optimal values of the operating variables of the MSF-BR system within certain limits, considering energy consumption and feed seawater temperature variation. The study included improving several operational factors, including top brine temperature, steam temperature, feed seawater temperature, cooling water flow rate and make up flow rate, number of station stages, and the stages of the heat rejection section. The optimal maintenance period during the operational year was also determined. The results of the analysis were based on data from the Al-Khafji desalination plant, which consists of 16 stages and has a production capacity of 7,053,393.8 gallons/day. The study aimed to achieve two main objectives: increasing the gain output ratio (GOR) and reducing the proportion of the recovery ratio. The results showed that the optimal period for maintenance is January, where the performance ratio ranges between 0.987 and 9.38, compared to the currently used month of December, where the performance ratio ranges between 1.096 and 9.56. Optimal target values were set at the following operating parameters: 33.3 °C for feed seawater temperature, 98.67 °C for steam temperature, 95.62 °C for brine temperature, 1571.18 kg/s for cooling water flow rate, 1624.24 kg/s for feed water flow rate, 21 stages for the station, and two stages for the heat rejection section. To achieve the highest GOR, the number of stages and heat rejection section should be more than 19 and 2, respectively. In general, to achieve improvements in GOR and reduce energy consumption, it is recommended to maintain Tf in the range of 33–34 °C and set Mcw between 1050 and 1800 kg/s.

1. Introduction

Freshwater scarcity affects over 40% of the world’s population [1,2], and this tendency is predicted to grow in the future. It is becoming increasingly common to treat wastewater [3,4,5] or desalinate salt water in many regions of the world because 94% of the water in the world is saline [2]. In the thermic desalination sector, the multi-stage flash (MSF) desalination technique is the most common. It contributes to about 40% of the global distribution industry [6], and as a result, it has become the main supply of fresh water for household, industrial, and agricultural use in various nations.
Khawaji et al. [7] described saltwater desalination as the process of eliminating dissolved salts from a nearly limitless source of seawater to make it suitable for human utilization, agricultural, and industrial purposes. The seawater is separated into two streams throughout the seawater desalination: one with low salt concentrations (distilled water) and another with high salt concentrations (rejected brine) [8,9]. Desalination technologies are used all over the world, with the two most common being membrane separation and thermal evaporation. Multi-stage flash (MSF) and multiple effect evaporation (MEE) technologies are two subcategories of thermal technology [10,11,12,13]. According to Khoshgoftar et al. [14], the MSF plants consume less power than MEE plants (1.521 kg/s vs. 1 kg/s). Also, MSF technology is most effective over other techniques; it illustrates lower operating costs by utilizing waste heat, a higher quality of produced potable water, and a different design of MSF that achieves optimum gain output ratio (GOR) over reverse osmosis systems and other thermal systems [8,9,10].
Several consecutive stages are used in MSF distillation units to achieve the distillation process. MSF plants contain 15–28 stages [15]. The feed seawater passes through condensers at the upper side of the stages, and its temperature increases gradually by absorbing heat rejected by the steam in the stage (outside of the condenser tubes) as a result of the vapor condensing and dropping down into the tray under the tubes [10]. The feed seawater enters the last condenser and flows in the opposite direction of the brine flow at the bottom of the stage. It exits the first condenser with an increase in temperature in the range of 2–3 °C/stage. The feed water then enters the brine heater (BH), where it reaches a higher temperature during the process. After the BH, the feed seawater enters the flashing stage; flashing occurs as a result of a decrease in pressure and temperature [9,10]. To convert the vapor into freshwater, it is condensed outside the tubes of the condenser which are located in the upper side of the stage where the feed seawater passes [16]. In the MSF process, the flashing flow system is either considered as once-through (MSF-OT) or brine recirculation (MSF-RB) [15,16,17]. The MSF-BR contains three sections: the BR, the heat recovery section (HRS), and the heat rejection section (HJS). In each of the flashing stages of the HRS, the stream of recycled brine flows in the opposite direction to the distillate product [9,10,11,12,13,14,15,16,17,18,19].
Recently, a number of studies have used optimization strategies to solve the MSF model problem [8,11,12]. These techniques are effective, but they are limited to the particular system of equations being studied and cannot be applied to other process models. Although these approaches provide effective solutions, they need significant customization for each specific model, which limits their ability to generalize. The past several years have seen a significant increase in the application of evolutionary-based optimization approaches like genetic algorithms (GAs) [20,21,22,23,24,25,26,27,28]. The benefit of using GAs to solve optimization issues is that function derivatives are not required. Another benefit is that GAs can converge to an ideal solution without the need for a starting condition.
Many studies [10,11,12,28,29] have investigated MSF systems. Using the gPROMS program, Said [16] created a mathematical model of the MSF process. A calcium carbonate fouling resistance model was developed to investigate the influence of stage temperature across the flashing stages. The operational parameters (steam temperature, flow rate of the rejected brine, and brine recycling) were then adjusted to maximize the efficiency of the MSF process and minimize the operation cost. Finally, the model’s influence on non-condensable gases was created and applied for further research. As a result, the total heat transfer coefficient values decreased as the non-condensable gases concentrations increased. In addition, the steam temperature had a significant impact on maintaining the production rate throughout the year.
Mongi and Kairouani [30] used multi-objective optimization methods such as the design of experiments methodology, gamultiobj Matlab software, and a rigorous process model to optimize the operation parameters of MSF-BR. The results revealed that, by using a large set of Pareto optimum solutions, which specify multiple sets of the optimal parameters of a desalination plant, this can lead to an optimal plant operating policy for the entire year.
Hanshik et al. [29] conducted research on the MSF distillation plant in order to assess the design principles and performance by varying the operating parameters. The findings showed that, by increasing the top brine temperature (To), performance can be improved. The terminal temperature difference (TTD) was also shown to be a factor in determining the capacity for freshwater production. As a result, the operating parameters of existing MSF plants may be modified to regulate energy usage.
MSF’s energy efficiency has also been improved by certain effective research efforts. The implication of diverse reductions in the energy consumption, flows of feed sequences, and exact predictions of unknown decision factors can all help to increase energy efficiency (temperature and vapor flow rate). Alrawashdeh et al. [10] investigated a small-scale plant for MSF-BR performance. The design and technical analysis were studied. The study showed that the optimum configuration of the plant included 24 stages (21 stages HRS, and three stages HJR) and provided 383 m3/d of freshwater production. Alsehli et al. [31] proposed an integrated MSF and solar system architecture with two separate thermal storage tanks. The offered idea, compared to previous designs, has a smaller solar collecting surface and can run continuously. The system was simulated using a dynamic simulation model of mass and heat exchanges, yielding a daily production of 53 kg/m2 of solar collecting area. An improved MSF system optimization model was developed by Hu et al. [32] using the annual total distillate cost as an objective parameter. Based on mathematical modeling and mechanism analysis, a 3000 ton/d MSF desalination plant optimization design study was conducted. The GAMS platform and an extended gradient approach were employed by Mussati et al. [33] to investigate the model of design optimization and enhance the construction of the MSF system. Mazzotti et al. [34] presented a model for the MSF-dynamic simulation and investigated the non-linear dynamic behavior under different conditions based on a full description of the underlying elementary processes utilized in the process. Lappalainen et al. [35] proposed a new approach for thermal modeling and MSF-dynamic simulation in one dimension. The technique integrates the Rachford–Rice model local equilibrium phases of seawater variables as a function of pressure, temperature, and salinity, with simultaneous energy, momentum, and mass solutions and rigorous solution. The results of the computations suggest that it is a capable method for the dynamic modeling of thermal desalination operations. Advanced control may be obtained for enhancing performance and cutting costs by utilizing the MSF process’s current dynamics. Hawaidi and Mujtaba [1] evaluated the dynamic correlation between the heater’s scaling coefficient, time of operation, and temperature of seawater, as well as the operational optimization issue with a given freshwater demand and the aim of a minimum cost of yearly operation. The optimization and dynamic modeling of the MSF operation have been investigated in recent years, considering the dynamic change of operating factors and the objective of an improved MSF system management.
In this study, Matlab R2021a software was used to implement a GA in order to evaluate the optimized operation parameters of the MSF-BR plant within maximum and minimum limitation values. The operation parameters were feed seawater temperature (Tf), top brine temperature (To), steam temperature (Ts), flow rate of make up (Mf), flow rate of cooling seawater temperature (Mcw), stage number (n), and heat rejection stage number (J), to obtain the maximum (GOR) and minimum recovery ratio (RR). Also, this investigation aimed to evaluate the optimum period of maintenance among all months across the year by implementing the best objective function (obj-f).

2. Methodology

2.1. MSF-BR Operation and Design

The MSF-BR is composed of three parts, as shown in Figure 1: BH, HRS, and HJS. Both the HRS and the HJS are composed of a sequence of flashing chambers.
Before entering the condenser tubes of an MSF-BR desalination plant, seawater undergoes a common pretreatment process to remove impurities and ensure efficient operation of the plant. This pretreatment process typically includes several steps such as screening to remove large debris, coagulation and flocculation to aggregate smaller particles, sedimentation to separate solids from water, filtration to remove finer particles, and disinfection to eliminate any remaining microorganisms. Additionally, antiscalant dosing and dechlorination are completed to further prepare it for desalination in the MSF-BR plant.
From the right side of the HJS to the beginning of this section, Mf flows into the plant via the condenser tubes. The portion of the seawater that is known as “cooling water” (Mcw) is discharged into the sea before entering the HRS to eliminate excess thermal energy from the desalination unit. The reset, also known as the make up feed, is treated (chemically) with an anti-scaling compound and deaerated. Then, inside the brine pool of the last stage of the HJS, it is combined with brine (Mb) coming from the previous stage, and then supplied to the condenser of the last stage of the HRS. The mixed stream, which is called recycled brine (Mr), is preheated by absorbing the distillate vapor’s latent heat [35,36,37,38].
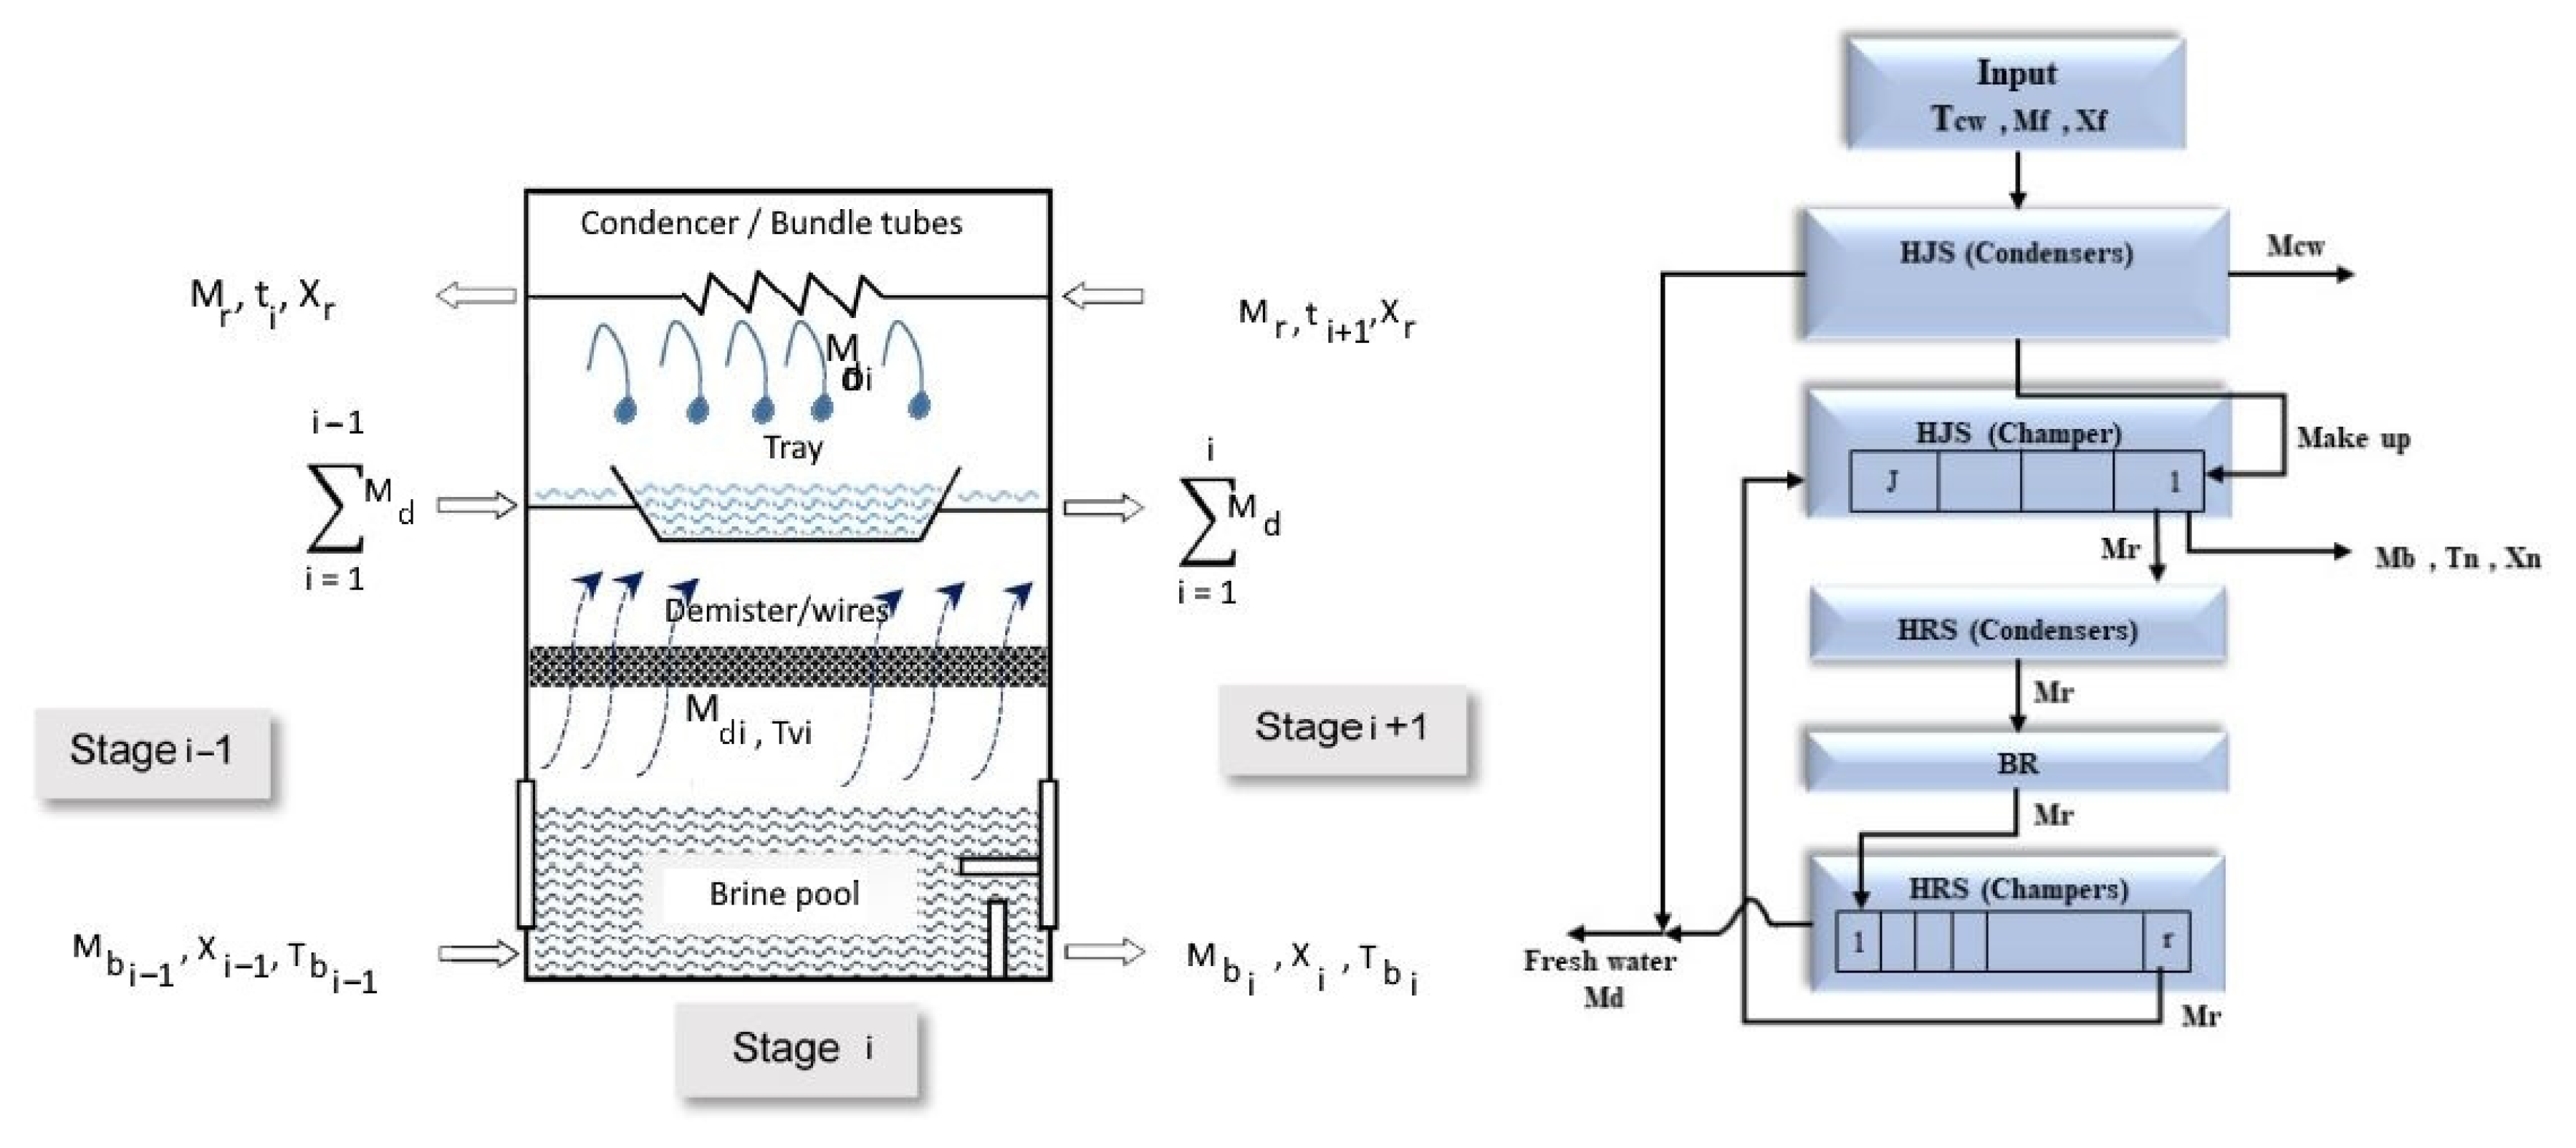
The Mr is heated even further in the heater by steam (Ms), at which point it achieves its highest brine temperature To. As shown in Figure 2, the brine enters the first stage and becomes superheated vapor under stage conditions. A portion of the brine is turned into vapor while the rest flows into the following stage. From one flashing chamber to the next, the flashing process proceeds. Each stage’s vapor flows via a demister to eliminate suspended brine droplets. It condenses in the condenser’s tube system and drops into the distillate tray, where it is passed to the next stage. In order to maintain a vacuum, each stage has an extraction line leading to ejectors that remove non-condensable gases.

2.2. Plant Description (Variables and Assumptions)

The Al-Khobar operations plant in Saudi Arabia is the subject of this investigation (10 MSF units). It has a cross-tube design with recirculating brine and 16 stages (includes 13 stages in HRS and 3 stages in HJS) with a daily capacity of 26,700 m3/d. The case study presented by Hawaidi and Mujtaba [1], Helal et al. [39], and Rosso et al. [37], is referenced by the configuration under investigation in this work. The main specifications of the plant that were employed in this study are reported by Rosso et al. [40]. The flow rate of streams of the Al-Khobar plant are 1577.8 kg/s, 1561.1 kg/s, 1763 kg/s, 259.4 kg/s, 37.47 kg/s of Mf, Mcw, Mr, Md, and Ms, respectively. Furthermore, the temperature of steam flow in BH which drives the desalination process is 97 °C. The main characteristics of the plant section are reported in Table 1.

2.3. Optimization of Operating Conditions

The optimization issue to be explored in this study involves the design data of the MSF-BR plant [38] and the temperature of the Tf provided in Table 2. Table 2 shows the seasonal variation in Tf at the Al-Khobar desalination plant site on Saudi Arabia’s east coast, approximately 400 miles from Riyadh [41].
Optimization problem:
  • Optimize: cooling water flow rate (Mcw), make up flow rate (Mf), top brine temperature To, steam temperature (Ts), stage number (n), stage number of heat rejection section (j).
  • Maximize: gain output ratio of the MSF-RB (GOR).
    Minimize: recovery ratio (RR).
  • Subject to constraints on inequity, such as restrictions on optimization parameters.
An optimization problem has two objective functions: optimal GOR and the minimum thermal energy supply to the heater is desired operationally. The thermal energy ratio reflects the thermal energy consumed by the system to produce distilled water; it was computed as Ein/Eout, where the following is applied:
Ein: the energy supply to produce steam at a specific enthalpy in the heater.
Eout: the waste energy consumed by Mr during passes inside the condenser tubes.
The limitations on variable values were applied in order to prevent the operation problem. Ts is a variable in BH tubes that influences the upper and lower limits of To. Due to scaling issues, Ts is restricted from exceeding an upper limit (UTs). The composition of saltwater treatment involves various chemical components that influence UTs values and the material of the tubes. To prevent a decrease in Ts leading to a reduction in To, a lower bound (LTs) should be set for To. A difference in pressure between the vapor area and the ejector area can lead to inadequate removal of non-condensable gas, instability caused by the inability to maintain a vacuum, and corrosion. This is completed to minimize scaling concerns arising from low brine velocity within condenser tubes and material resistance. These recommendations are supported by the literature [26,38]; the brine flow rate per stage width inside the HRS and HJS tubes should be 180 kg/m·s. The operating variables used in this study are listed in Table 3.
In addition, high Mcw will adversely affect the quantity of Mr between flashing chambers, causing a leak between flashing chambers. As a result, the plant’s functioning will be unpredictable, and it will be inefficient. Moreover, the flash evaporation efficiency could be affected by a lower Mcw, resulting in suboptimal temperature profiles in the stages. The upper limits (UTs, UTo, and UMf) are also imposed to prevent the scaling, fouling, and erosion of the condenser tubes in the HRS and HJS, as well as the tube of the BH. Lower limits (LTs, LTo) also lead to decreased distillate production, corrosion concerns, potential degradation of distillated water quality, and process instability. Meanwhile, a low Mf value might, on the other hand, result in distillate pollution.
All these variables are optimized within a specific range. The limitation of variable values are reported in Table 3. Thus, the optimization issue can be mathematically represented as Equations (1)–(3) [26]:
max G O R , P t h G O R M f , M c w , T o , T s , n , j   E t h ( M f , M c w , T o , T s , n ,   j )
G O R = M d M s
R R = i = 1 n M d i × λ v i M s × λ s
where λ v i is the latent heat of vapor, λ s is the latent heat of steam, and i is the stage number.
For the problem of optimization described above, MATLAB R2021a software uses genetic algorithm optimization (GA) to simulate the steady-state behavior of the MSF-BR process. The obj-fs for the MSF-BR desalination model was investigated over a whole year within the maximum and minimum limitation as mentioned in Table 2. Considering Figure 2, and according to the literature [39,40], Table 4 presents the equations for the model of steady-state, and it was assumed that the brine loss is negligible, and the specific heat capacity (Cp) is constant. The following assumptions underlie the model, which consists of a set of energy and mass balances as well as heat transfer equations [8,26]:

2.4. Genetic Algorithm

Using a suitable representation, such as a real integer, each decision variable (xi) in a GA is represented as a gene. A chromosome that may represent a single design solution is formed by the matching genes for all variables x1, x2, x3,… xn. A numerical tool called GA seeks to determine the global maximum or minimum of a clear goal function, f(X), and one or more real choice variables, x, which may be subject to a variety of linear or nonlinear limitations, g(X) [x,y]. The ability of a GA to solve optimization problems without the requirement to estimate function derivatives is only one of its many advantages. A population is made up of a collection of chromosomes that represent various elements and innovative solutions; the fittest solutions are chosen as parents to mate and generate new solutions. Crossover mating is used to cut and mix the DNA of the chosen parents to create offspring [10]. The solutions that did not survive are removed from the population, while the offspring are reinserted into it [22]. GAs require a variety of components and operators in order to work. The selection operator, evolution operators (mutation and crossover), resident selection mechanism, and closure condition are the components that are most essential.
Holland (1975) was the first to introduce the genetic algorithm [42], which is a chaotic optimization method simulating natural selection principles that is applied for resolving complicated problems. GAs have been effectively introduced to solve a variety of engineering and scientific problems [42,43,44,45,46,47,48,49]. The GA uses the mixing of variable keys in the MSF-BR operation to obtain the best model of MSF-BR. The number of publishing sizes (100), the crossover (0.5), and the mutation (0.1) are some of the GA parameters. This section evaluates the effectiveness of GA in solving various MSF-BR optimization instances by examining the impact of the parameters that were employed.

2.5. Solution Method

A GA was used to optimize the operation of MSF-BR. GA is a numerical tool that searches for the optimal solution to an optimization problem without having to derive objective functions. It consists of several elements and operators, including the selection operator, hybridization operator, and mutation operator.
The selection operator, which is the first step of a GA, is an exclusive population replacement mechanism that selects and transmits solutions to the following generation based on the idea of the survival of the fittest. Because it prevents the best responses from being lost, elitism can greatly enhance GA performance.
The mutation is a significant operator in the modification because it promotes variation, which enables us to explore future possibilities in the solution space and avoids becoming trapped in a local solution. By permitting a large leap to occur only rarely to prevent the local optima, the mutation is meant to generate relatively few iterations. By choosing a random variable parameter within a solution, the mutation is complete. In the crossover operator, the initial solutions are changed by using an intra-string crossover, where the variable parameters of the element solutions are changed. In order to produce two offspring, two sets of two-parent solutions are randomly chosen by the selection operator. The crossover probability in this study is chosen at 0.5. Apart from mutation, selection, and crossover, in order to find the best possible solution within each iteration of a GA, the newly generated solution will be updated if the new genes give a better solution than the outcomes of the previous solution. Otherwise, the updated solutions are neglected, and the process starts over in the next iteration of the crossover operator.

3. Results

After the obj-f’s components were established, the function could be optimized, allowing the plant’s operational variables to be changed to guarantee the optimal process gain output ratio. A mathematical description of the optimization problem was mentioned previously, as reported in Equation (1), and the limitations of the optimization parameters are illustrated in Table 3. In multi-objective linear optimization with inequality constraints, the decision variables are limited by these constraints. Multi-objective optimization can be solved well with GA. Numerous studies have tested the gain output ratio of these well-known, credible algorithms in different applications. Evolutionary algorithms have been used to solve multi-objective optimization problems in several investigations [38,39,40].
The optimization investigation focuses on using a GA to find the best operating parameters for the maximum gain output ratio and the minimum thermal energy ratio. MATLAB, which has been used in the present study, as is often the case, is an extremely potent tool for several engineering applications that involve numerous answers.

Application of GA in MSF-BR

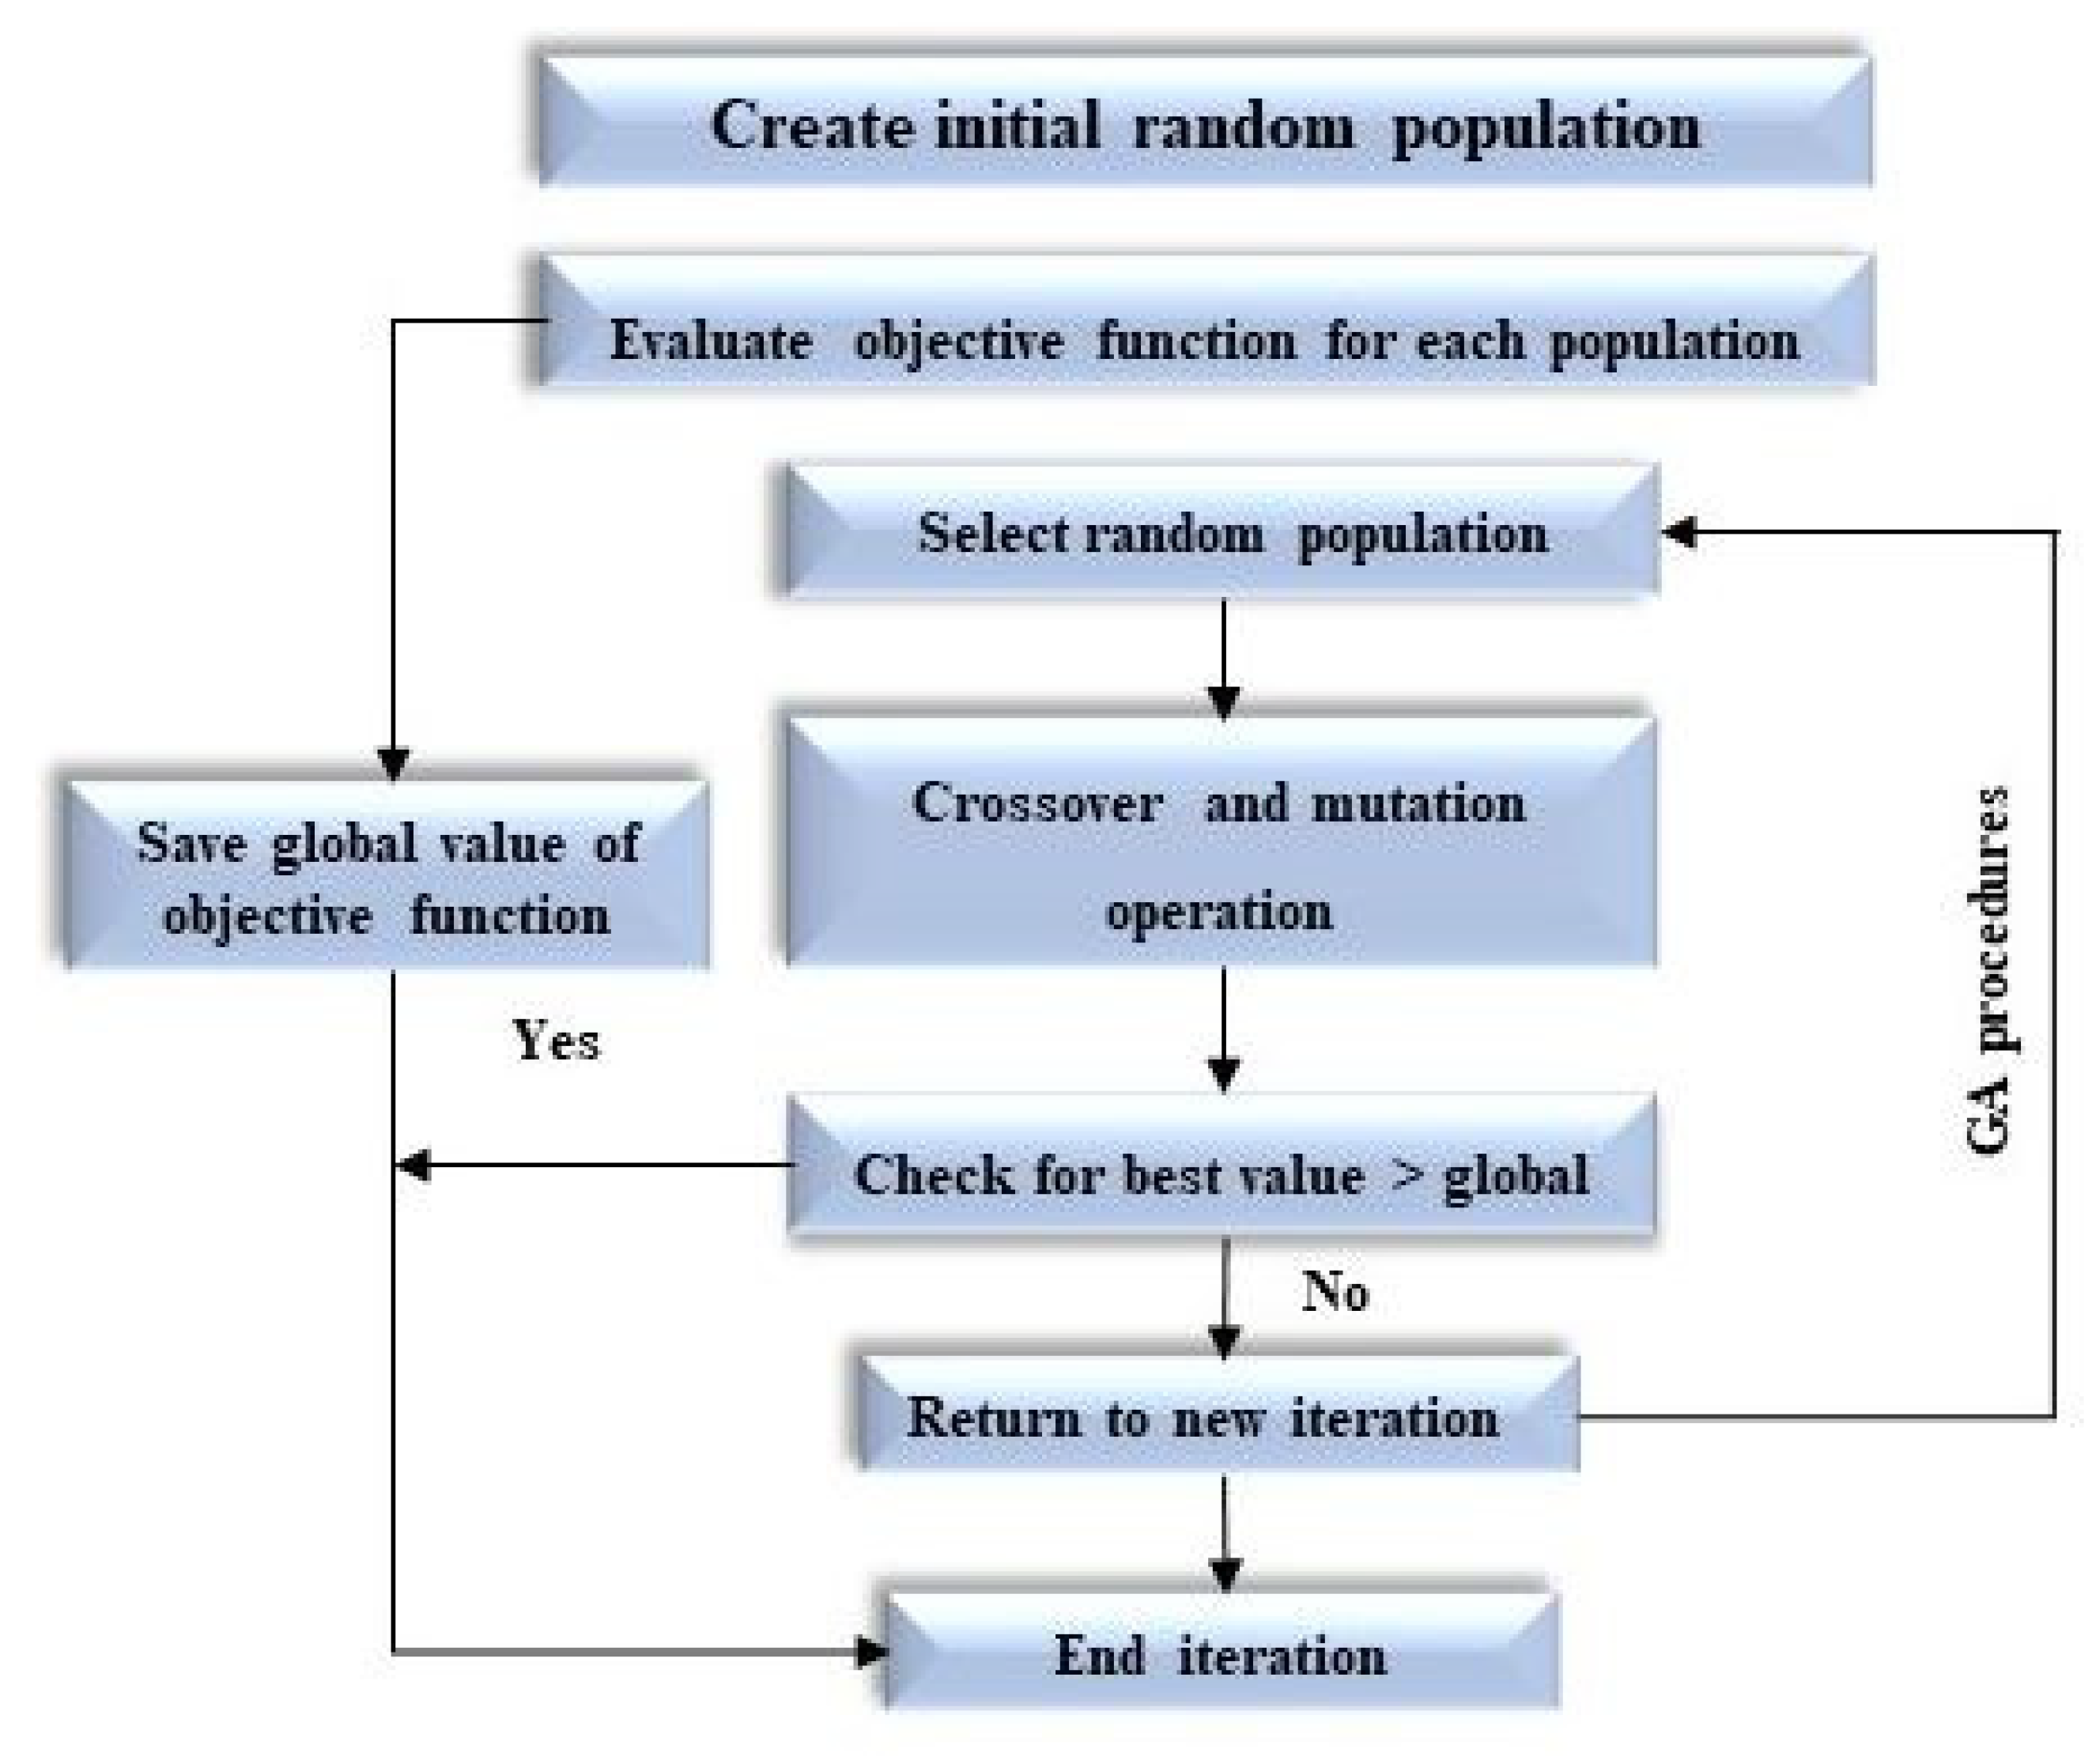
As shown in Figure 3, the GA generates a set of solutions for random values of the MSF-BR operating variables. These random values generate a set of solutions to the objective function used in the problem. By comparing all the resulting solutions, the best solution will be selected from them. After finding the best solution, the GA will be used again via crossover and mutation operations to recalculate the objective function, compare it with the current solution, and extract the best solution among all the solutions.
After the components of the objective function are identified, they are optimized to allow adjustment of operating variables and ensure the optimal process gain output ratio. As mentioned previously, the optimization problem is to find the best combination of operating variables that maximizes the GOR and minimizes the RR, while satisfying the imposed constraints. The genetic algorithm was applied over a 12-month period (January to December) to provide seasonal operational recommendations.
Clarification is required regarding the fact that this study selected an MSF-BR plant that is scheduled to be maintained and cleaned during the month of December for all condenser tubes and stages. This study was conducted across all 12 months of the year to provide recommendations. This involves selecting December as the appropriate month for maintenance, ensuring that December is indeed the right choice. Based on Tf temperature, this determination was made from the perspective of improving plant gain output ratio and production ratio.
In order to be able to adapt our seasonal operation strategy to the entire year, the best seasonal operation strategy can be developed by solving the optimization problem. Consequently, solving the optimization problem can lead to a wide range of solutions for MSF-BR. In order to be able to adapt our seasonal operation strategy to the entire year, the best seasonal operation strategy can be developed by solving the optimization problem. Consequently, solving the optimization problem can lead to a wide range of solutions for MSF-BR. For example, as reported in Table 5, if we investigate the operating minimum and maximum limitation (Table 3) variables and their corresponding obj-f for March, the results reveal that the solutions did not incorporate the optimum GOR and obj-f. This is attributed to the restricted temperature (20.5 °C), indicating that the maximum GOR and obj-f of 9.36 and 9.26, respectively, were achieved at Ts = 105.8 °C, n = 23, To = 96 °C, Mcw = 530.8 kg/s, and Mf = 2084.88 kg/s. It is also worth noting that the number of HJS remains constant for all the solutions. Also, the minimum GOR (1.08) and obj-f (0.19) resulted when the Ts, To, Mf, Mcw, and n, were 107.95 °C, 103.48 °C, 1723.83 kg/s, 1468.33 kg/s, and 15, respectively. Also, it must be noted that when Mf and Mcw were reduced by 35% and 51%, respectively, the obj-f increased 28% when the operating parameters were held constant (Ts = 113.8 °C, T0 = 89.7 °C, n = 19).
Figure 4 shows a graphical representation of the results for all months. The values of the operating state associated with optimum condition that were obtained by the GA technique do not guarantee a global optimal solution [47]. Furthermore, the optimization results indicate that the thermal energy ratio decreases as the gain output ratio increases. The results illustrated in Figure 4 show that the rising and falling obj-f behavior is consistent across all months. Examining the months from December to May reveals that the highest obj-f values for all were above 8, with the maximum obj-f achieved in February. In the months from June to November, the obj-f values followed a similar trend in that they all surpassed, with the highest obj-f occurring in September (RR < 0.2 and GOR > 9.5). Furthermore, the values obtained in September were less dense (points) compared to the other months, meaning that the number of obtained solutions was less than that obtained in other months. The results obtained revealed that the Ts was in the range of 98.21 °C (January) to 115.45 °C (June), To was in the range of 90.1 °C (January) to 107.71 °C (August), the Tn was in the range of 32.24 °C (January) to 40.13 °C (June), J was in the range of 1–2 for all months except May, and n was in the range of 19 (January) to 25 (August). These values were reflected in the obj-f and GOR values.
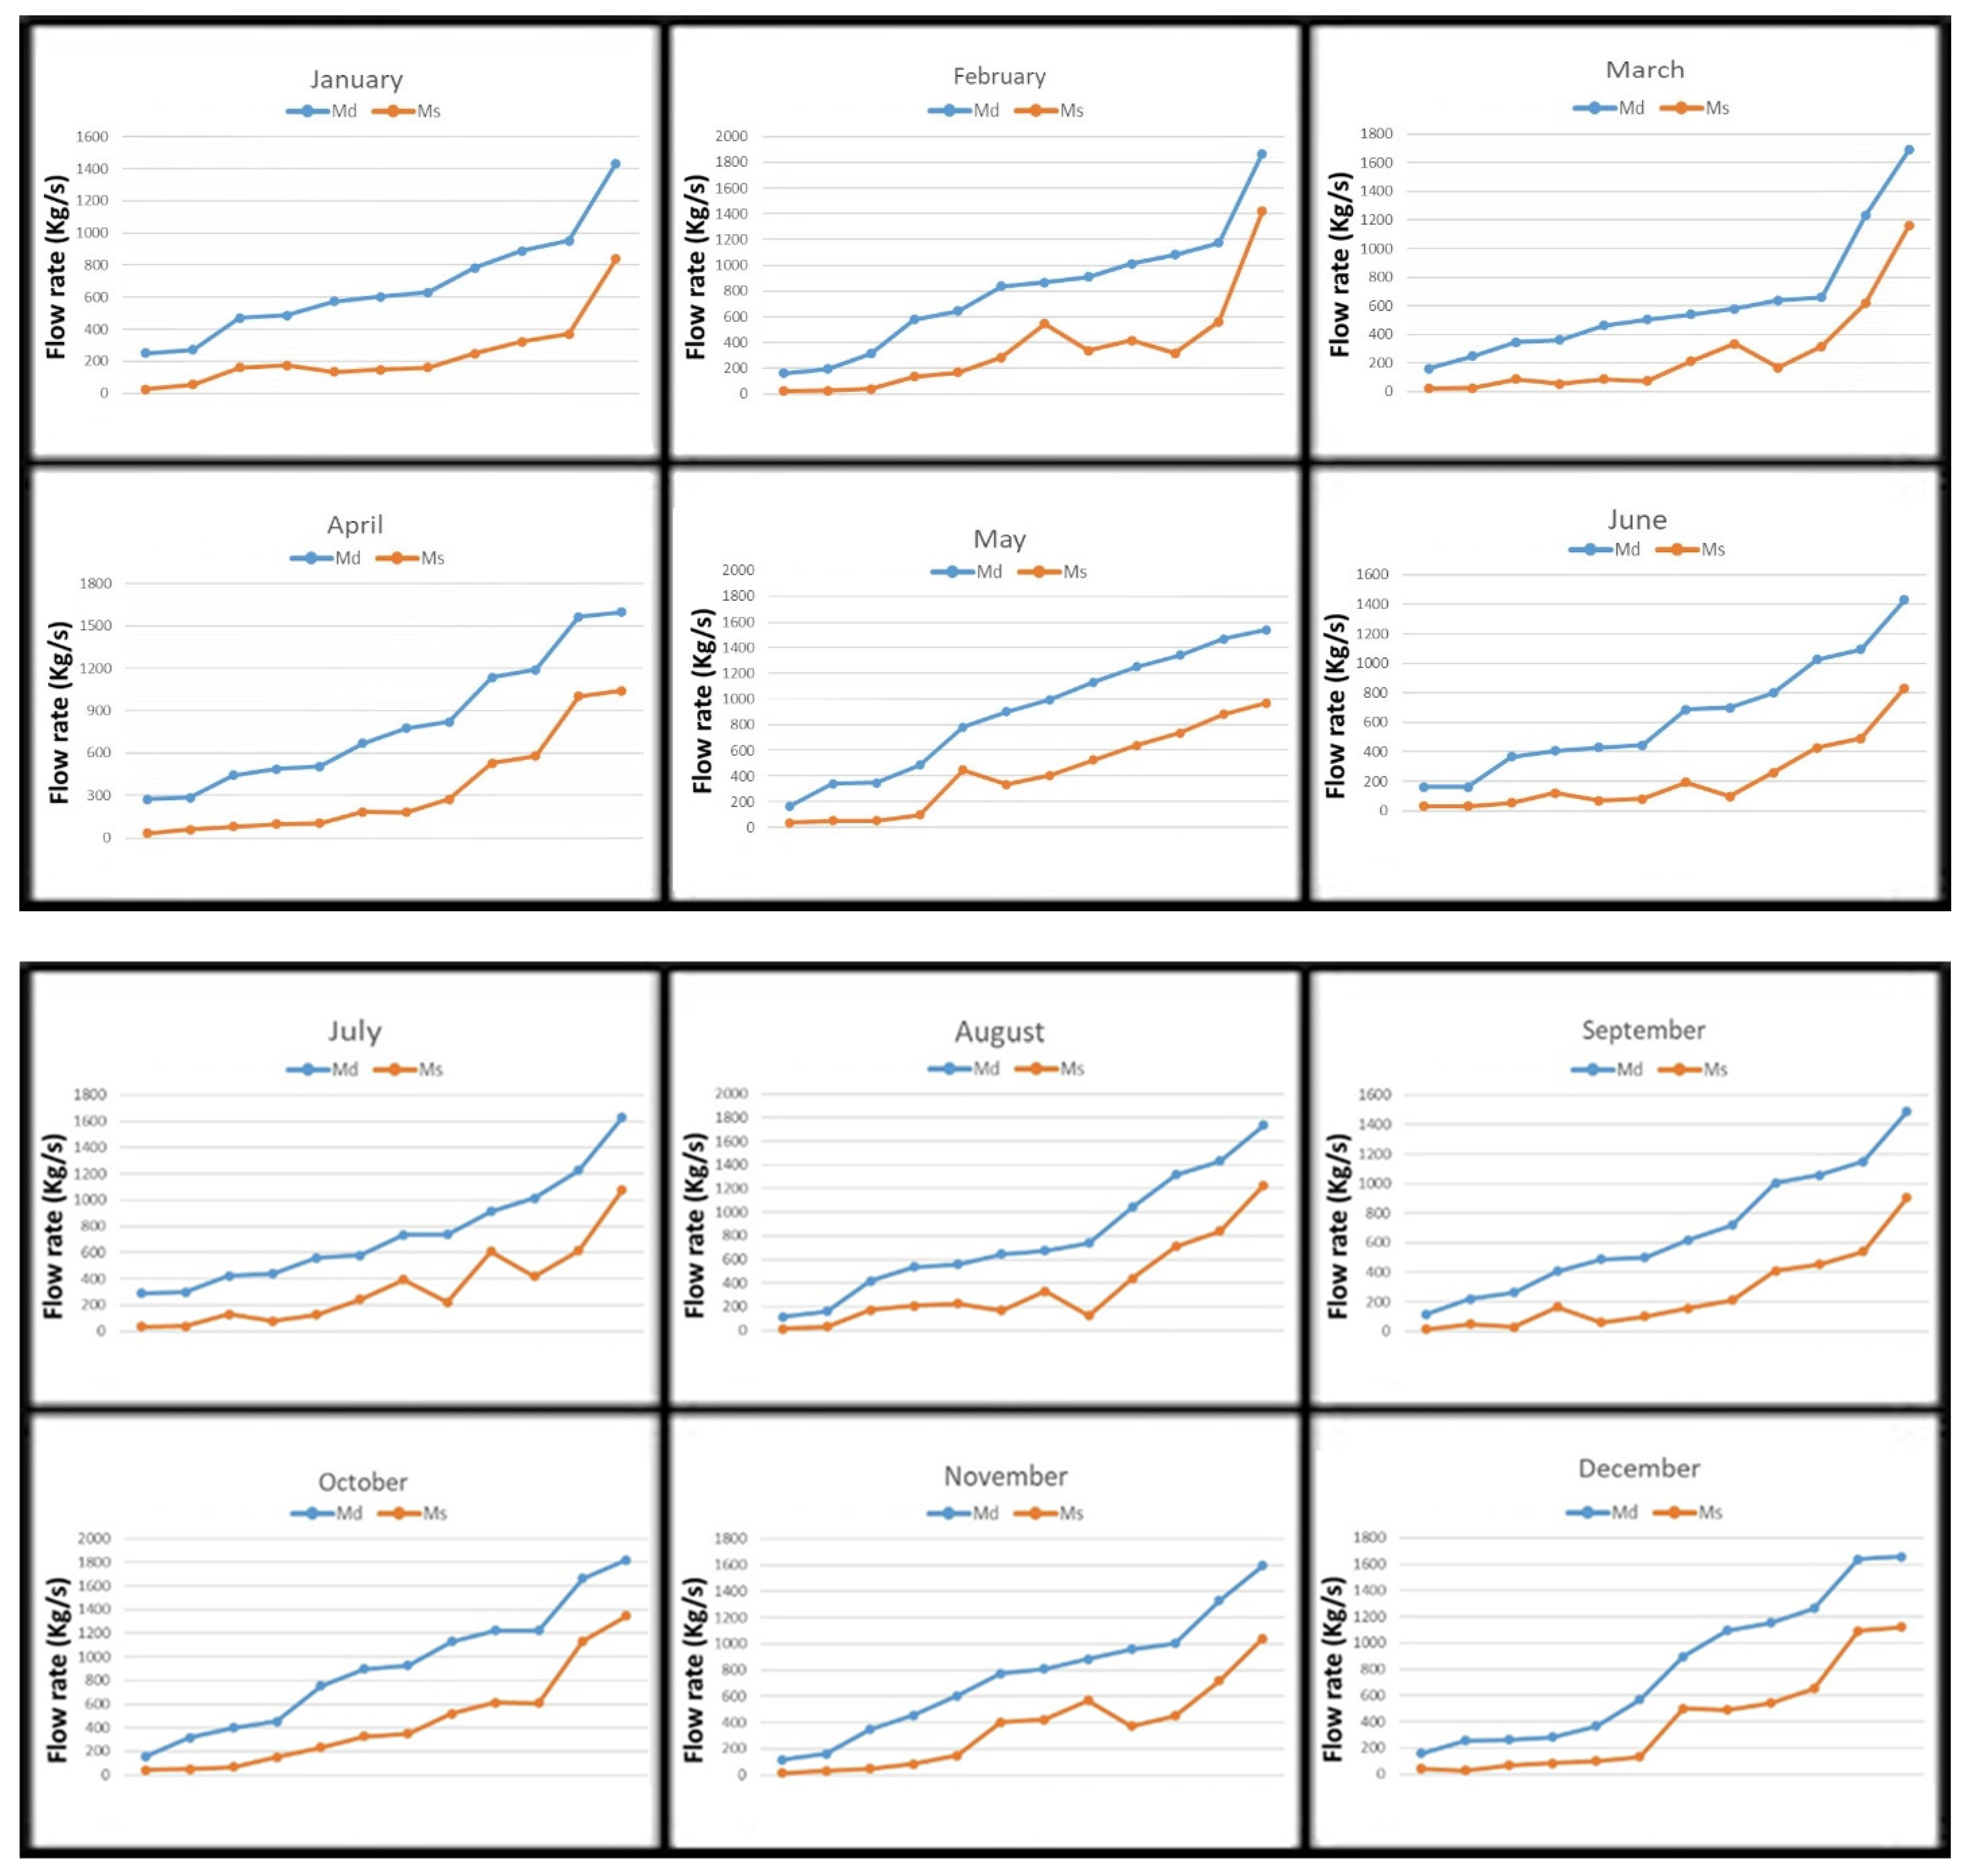
The rate of steam increases the rate of distillation production, according to a comparative study of the optimization findings. Figure 5 illustrates the variety in production capacity over all months regarding the steam flow rate. The results revealed that an increase in the steam flow rate difference by a factor of 26.47 achieved a difference by a factor of 7.91 increase in the production rate (160.38 to 1428.49 kg/s) in June, while in October, when the steam flow differed by a factor of by 85.37, only a difference by a factor of 15.14 increase was observed in the distilled production rate. It is necessary to indicate that the results outlined in Figure 5, and supported by Table 5 and Figure 4, demonstrate that the increase in production capacity is correlated with the increase in drive steam flow rate in the heater, which drives the desalination process across all stages of MSF-BR. The maximum increase in production capacity does not necessarily imply the optimal solution or the highest gain output ratio for the plant. It is crucial to establish connections between various operation factors and link different solutions for the optimal gain output ratio and obj-f.
The results have revealed the obj-f for all months of the year (Table 5 and Figure 4 and Figure 5) and the results of optimal solutions during station operation. It has been determined that December is not the most suitable period for maintenance. Instead, the optimal choice is to schedule maintenance in January, as it proves to be the least favorable month in terms of GOR improvement. The increase in the steam flow rate difference by a factor of 27.13 (41.31 to 1120.65 kg/s) achieved a difference by a factor of 10.41 increase in the production rate (159.19 to 1120.65 kg/s) in December (Figure 5), while an increase in steam flow difference by a factor of 33.29 led to an increase difference of by a factor of only 5.72, Also, the GORs were 9.14 and 8.87, and the obj-fs were 1.15 and 8.79, respectively, in December and January.
Summative assessments of the results obtained for 12 months (January to December) are displayed in Table 6 and are as follows: the values of the current operating parameters, the values of their equivalent obj-f, and the difference between the obj-f values at specific Tf and the optimum value of the obj-f obtained by the GA. The optimum obj-f obtained by the GA (9.26) was achieved by the optimum solutions for the Ts, To, n, J, Mf, Mcw, and Tf of 98.68 °C, 95.62 °C, 21, 2, 1571.18 kg/s, 1624.24 kg/s, and 33.39 °C. The maximum difference between the obj-f and optimum obj-f (0.101) was achieved in January with GORs of 8.87 and 8.79 for obj-f, while the minimum difference was achieved in June with GORs of 9.73 and 9.64 for obj-f. Also, as reported in Table 5, the best GOR and obj-f among all months were in June, with 9.64 and 9.59 for the GOR and obj-f, respectively. The closest month to the optimum solution with respect to Tf = 33.39 °C was August at Tf = 33.8 °C, which achieved 9.59 and 9.4 for the GOR and obj-f, respectively.
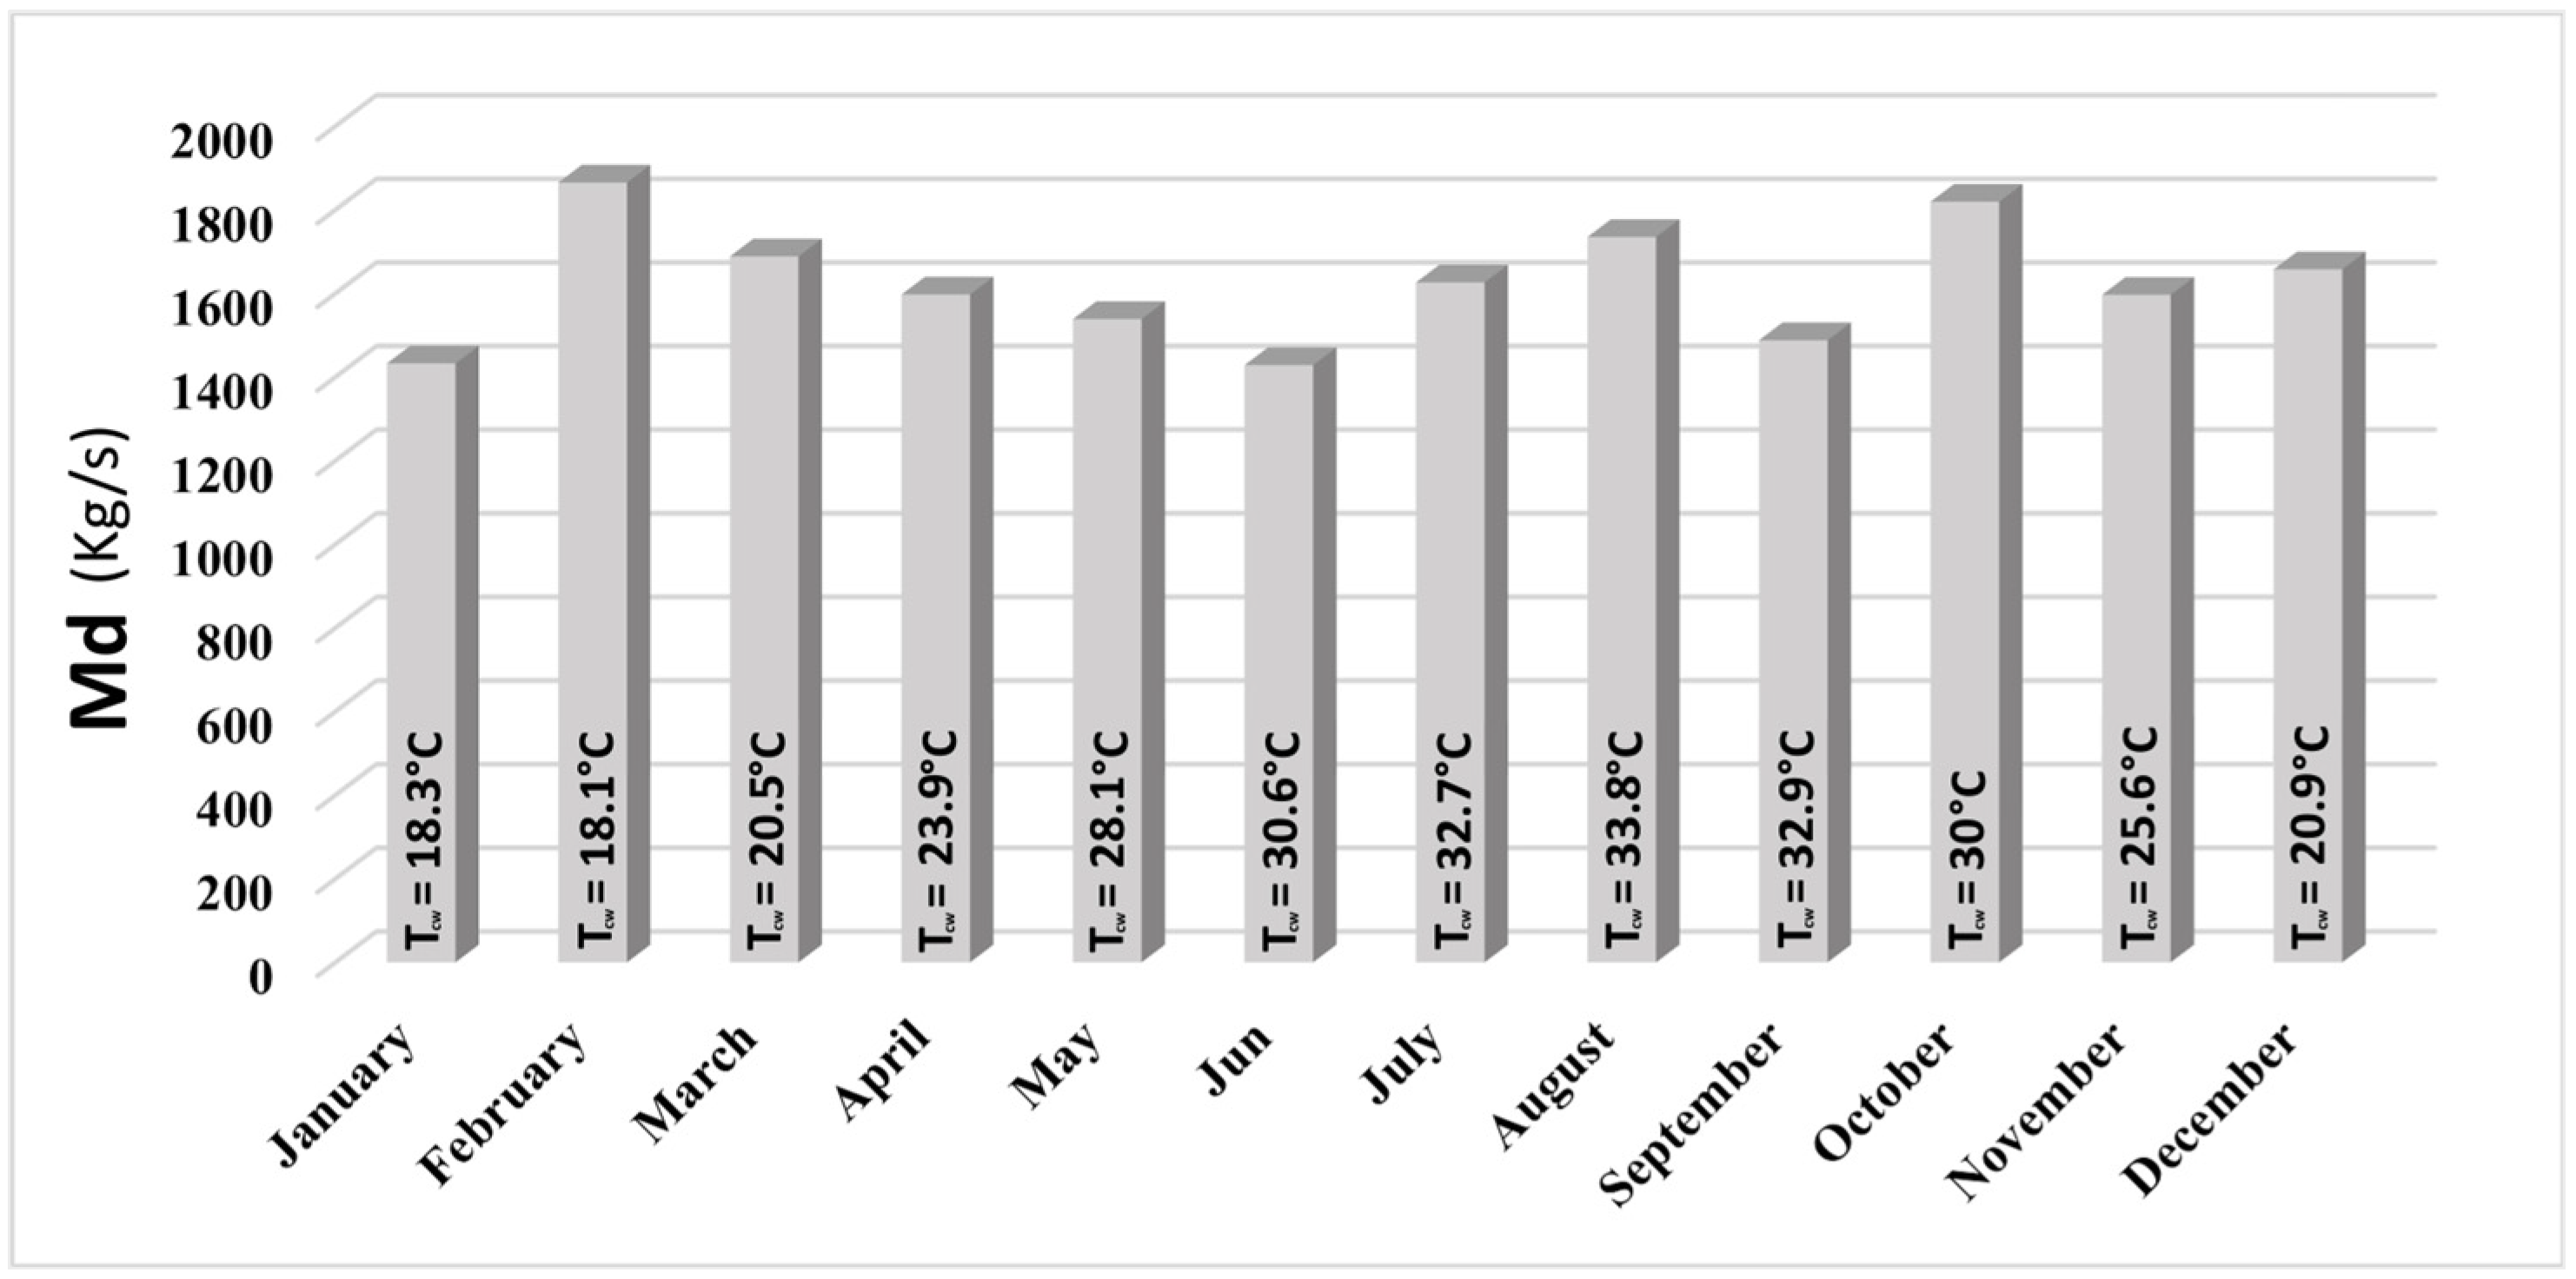
Based on values in Table 3, Figure 6 shows all the operation variables fixed at their minimum limitation values. Only n and J varied between the minimum and maximum limitations, taking the highest production capacity of the plant for each month. This condition was reflected in the GOR value. In addition, the maximum production capacity Md was achieved in February (Tf = 18.1 °C) at the minimum limitation of operation variable values, while the minimum resulted in Jun (1428.487 kg/s) and January (1432.647 kg/s).
As reported in Table 7, the results obtained in this investigation revealed that the GOR achieved an increment of 42.87% in comparison with the GOR of the current operation of the MSF-BR plant [37] and by 29.39% in comparison with the investigation study implemented by Ben Ali and Kairouani [30]. The obtained difference might be attributed to the fact that the MSF-BR operation is run under operating conditions that deviate from the optimum operating conditions proposed by the GA technique. Furthermore, the current values of the operating state are associated with an optimum condition that was not obtained by the GA resolution. However, a minimum deviation of only 2% was recorded in July, which emphasizes the fact that the real operating conditions are almost at the optimal level. However, a maximum deviation of 10% was noted in January.

4. Conclusions

In this study, MATLAB R2021a software was applied to a GA to identify the optimum operation parameters for the MSF-BR Al-Khafji desalination plant in Saudi Arabia. For this optimization problem, a variety of seawater temperatures were considered, and two objectives were investigated. The first was to maximize the gain output ratio of the plant, and the second was to minimize the thermal energy ratio. In addition, the optimal period to apply plant maintenance was investigated. The results show that the optimum obj-f was 9.79, which was reached at Tf = 33.39 °C, Ts = 98.67 °C, To = 95.62 °C, Mcw = 1624.24 kg/s, Mf = 1571.18 kg/s, n = 21, and J = 2. The GOR obtained in this study achieved an increment of 42.87% in comparison with the current operation of the Al-Khafji desalination plant. The highest GOR (9.73) and the lowest thermal energy ratio (0.0836) were achieved in July with a difference of 0.015 with the optimum obj-f. Also, the optimum month to conduct maintenance on the plant was January, with an improvement in the GOR of 1.9% in comparison with December (the current period of maintenance). This analysis concluded that an ideal plant operating policy for the entire year could be achieved using the optimization technique created in this investigation.

Author Contributions

Conceptualization, K.A.b.A. and A.A.B.; methodology, L.A.-S. and A.K.; software, L.A.-S. and K.A.b.A.; validation, A.A.B.; formal analysis, K.A.b.A., A.K., E.G. and L.A.-S.; investigation, A.A.B., B.A., L.A.-S. and A.K.; resources and data curation, K.A.b.A. and L.A.-S.; writing, review, and editing, K.A.b.A., A.A.B., E.G. and B.A.; visualization, L.A.-S.; supervision, K.A.b.A. and E.G.; project administration, K.A.b.A. and L.A.-S. All authors have read and agreed to the published version of the manuscript.

Funding

This research received no external funding.

Data Availability Statement

All data are available in submission.

Conflicts of Interest

The authors declare no conflict of interest.

Nomenclature

AiHeat transfer area, HRS, m2
AjHeat transfer area, HJS, m2
AhHeat transfer area, BH, m2
BHBrine heater
BPEiBoiling point elevation, °C
CpThe specific heat capacity, kJ/kg. °C
EinInput energy supplied to heater, kJ
EoutOutput energy recovered by condenser, kJ
GAGenetic algorithm
HJSThe heat rejection section
HRSThe heat recovery section
JHeat rejection stage number
LTMDLog mean temperature reference, °C
LXxLower bound
MbBrine flow rate, kg/s
McwCooling seawater flow rate, kg/s
MEEMultiple effect evaporation
MdDistillate flow rate, kg/s
jRejection stage number
rRecycled brine
NEANon-equilibrium allowance
MfMake up seawater flow rate, kg/s
MrRecycled brine flow rate, kg/s
MsSteam flow rate, kg/s
MSFMulti-stage flash
MSF-OTMulti-stage flash, once-through
nStage number
obj-fObjective function
GORGain output ratio
RRRecovery ratio
TbBrine temperature, °C
TOTop brine temperature, °C
TfSeawater feed temperature, °C
TTDThe terminal temperature difference, °C
TviTemperature vapor, °C
UOverall heat transfer coefficient
UXxUpper bound
XSalt concentration, ppm
λEnthalpy, kJ/kg
sSteam
iStage number

References

  1. Hawaidi, E.; Mujtaba, I. Simulation and optimization of MSF desalination process for fixed freshwater demand: Impact of brine heater fouling. Chem. Eng. J. 2010, 165, 545–553. [Google Scholar] [CrossRef]
  2. Buros, O.K. The ABCs of Desalting; International Desalination Association: Topsfield, MA, USA, 2000. [Google Scholar]
  3. Nosheen, M.; Khan AASalman, M.S.; Shafqat SSajid, M.; Rizwan MAslam, M.; Ijaz, F. Comparative study of adsorptive removal of oxyanion (Cr2O4−2) from aqueous media over unmodified and magnetically modified Melia azedarach. IOP Conf. Ser. Mater. Sci. Eng. 2020, 1101, 012031. [Google Scholar] [CrossRef]
  4. Sajid, M.; Bari, S.; Rehman, M.S.U.; Ashfaq, M.; Guoliang, Y.; Mustafa, G. Adsorption characteristics of paracetamol removal onto activated carbon prepared from Cannabis sativum Hemp. Alex. Eng. J. 2022, 61, 7203–7212. [Google Scholar] [CrossRef]
  5. Sajid, M.; Ahamad, M.I.; Shafqat, S.S.; Pasha, M.K.; Asim, M. De-Colorization of Azo Dyes C.B-10X Blue and C.B.M-10X Blue by Ozonation for Wastewater Treatment. UW J. Sci. Technol. 2020, 4, 1–7. [Google Scholar]
  6. Al-Fulaij, H.; Cipollina, A.; Bogle, D.; Ettouney, H. Once t hrough m ultistage fl ash d esalination: gPROMS d ynamic and s teady s tate m odeling. Desalination Water Treat. 2010, 18, 46–60. [Google Scholar] [CrossRef]
  7. Khawaji, A.D.; Kutubkhanah, I.K.; Wie, J.-M. Advances in seawater desalination technologies. Desalination 2008, 221, 47–69. [Google Scholar] [CrossRef]
  8. Abduljawad, M.; Ezzeghni, U. Optimization of Tajoura MSF desalination plant. Desalination 2010, 254, 23–28. [Google Scholar] [CrossRef]
  9. Alrawashdeh, K.A.B.; Al-Zboon, K.K.; Al Qodah, Z. Modeling and Investigation of Multistage Flash-Mixing Brine in Aqaba City, Jordan. Math. Model. Eng. Probl. 2021, 8, 905–914. [Google Scholar] [CrossRef]
  10. Alrawashde, K.; Talat, N.; Alshorman, A. Multi Stage Flashing Small Scale Plant Combined CHP Plant Driven by Biogas Plant. Int. J. Appl. Sci. Technol. 2017, 7, 51–59. [Google Scholar]
  11. Mistry, K.H.; McGovern, R.K.; Thiel, G.P.; Summers, E.K.; Zubair, S.M.; Lienhard V, J.H. Entropy Generation Analysis of Desalination Technologies. Entropy 2011, 13, 1829–1864. [Google Scholar] [CrossRef]
  12. Manesh, M.H.K.; Kabiri, S.; Yazdi, M.; Petrakopoulou, F. Exergoeconomic modeling and evaluation of a combined-cycle plant with MSF and MED desalination. J. Water Reuse Desalin. 2020, 10, 158–172. [Google Scholar] [CrossRef]
  13. Khorshidi, J.; Pour, N.S.; Zarei, T. Exergy Analysis and Optimization of Multi-effect Distillation with Thermal Vapor Compression System of Bandar Abbas Thermal Power Plant Using Genetic Algorithm. Iran. J. Sci. Technol. Trans. Mech. Eng. 2019, 43, 13–24. [Google Scholar] [CrossRef]
  14. Zhu, G.; Neises, T.; Turchi, C.; Bedilion, R. Thermodynamic evaluation of solar integration into a natural gas combined cycle power plant. Renew. Energy 2015, 74, 815–824. [Google Scholar] [CrossRef]
  15. Kotb, O. Optimum numerical approach of a MSF desalination plant to be supplied by a new specific 650MW power plant located on the Red Sea in Egypt. Ain Shams Eng. J. 2015, 6, 257–265. [Google Scholar] [CrossRef]
  16. Said, S.A. MSF Process Modelling, Simulation and Optimisation: Impact of Noncondensable Gases and Fouling Factor on Design and Operation. Ph.D. Thesis, University of Bradford, Yorkshire, UK, 2012. Available online: http://hdl.handle.net/10454/5721 (accessed on 31 July 2024).
  17. El-Ghonemy, A. Performance test of a sea water multi-stage flash distillation plant: Case study. Alex. Eng. J. 2018, 57, 2401–2413. [Google Scholar] [CrossRef]
  18. El-Dessouky, H.T.; Ettouney, H.M. Fundamentals of Salt Water Desalination; Elsevier: Hamilton, ON, Canada, 2002. [Google Scholar]
  19. Mabrouk, A.N.; Fath, H.E. Technoeconomic study of a novel integrated thermal MSF–MED desalination technology. Desalination 2015, 371, 115–125. [Google Scholar] [CrossRef]
  20. Mjalli, F.; Abdel-Jabbar, N.; Qiblawey, H.; Ettouney, H. Neural and genetic based techniques for solving the MSF model as opposed to conventional numerical methods. In Proceedings of the 17th European Symposium on Computer Aided Process Engineering—ESCAPE17, Bucharest, Romania, 27–30 May 2007; pp. 1–6. [Google Scholar]
  21. Marseguerra, M.; Zio, E.; Martorell, S. Basics of genetic algorithms optimization for RAMS applications. Reliab. Eng. Syst. Saf. 2006, 91, 977–991. [Google Scholar] [CrossRef]
  22. Eiben, A.E.; Smith, J.E. Introduction to Evolutionary Computing; Springer: New York, NY, USA, 2003. [Google Scholar]
  23. Reeves, C.R.; Rowe, J.E. Genetic Algorithms—Principles and Perspectives: A Guide to GA Theory; Kluwer Aca-demic/Plenum Publishers: New York, NY, USA, 2003. [Google Scholar]
  24. El-Dessouky, H.T.; Ettouney, H.M.; Al-Roumi, Y. Multi-stage flash desalination: Present and future outlook. Chem. Eng. J. 1999, 73, 173–190. [Google Scholar] [CrossRef]
  25. Al-Hinai, A.; Al-Mahrouqi, D.A.S. Multi-stage flash desalination: A review. Water Sci. Technol. 2013, 67, 1230–1240. [Google Scholar]
  26. Chapter 6 Multi-Stage Flash Desalination. Available online: https://www.coursehero.com/file/10223245/Multistage-Flash-Desalination/ (accessed on 31 July 2024).
  27. Al-Sofi, M.A.-K. Fouling phenomena in multi stage flash (MSF) distillers. Desalination 1999, 126, 61–76. [Google Scholar] [CrossRef]
  28. Gambier, A.; Badreddin, E. Dynamic modeling of a single-stage MSF plant for advanced control purposes. In Proceedings of the 2005 IEEE Conference on Control Applications, Toronto, ON, Canada, 28–31 August 2005. [Google Scholar]
  29. Hanshik, C.; Jeong, H.; Jeong, K.-W.; Choi, S.-H. Improved productivity of the MSF (multi-stage flashing) desalination plant by increasing the TBT (top brine temperature). Energy 2016, 107, 683–692. [Google Scholar] [CrossRef]
  30. Ben Ali, M.; Kairouani, L. Multi-objective optimization of operating parameters of a MSF-BR desalination plant using solver optimization tool of Matlab software. Desalination 2016, 381, 71–83. [Google Scholar] [CrossRef]
  31. Alsehli, M.; Choi, J.-K.; Aljuhan, M. A novel design for a solar powered multistage flash desalination. Sol. Energy 2017, 153, 348–359. [Google Scholar] [CrossRef]
  32. Hu, S.G.; Zhou, S.X.; Liang, S.Y. Thermoeconomic optimization analysis of MSF seawater desalination system. Technol. Water Treat 2000, 26, 13–17. [Google Scholar]
  33. Mussati, S.; Aguirre, P.; Scenna, N.J. Optimal MSF plant design. Desalination 2001, 138, 341–347. [Google Scholar] [CrossRef]
  34. Mazzotti, M.; Rosso, M.; Beltramini, A.; Morbidelli, M. Dynamic modeling of multistage flash desalination plants. Desalination 2000, 127, 207–218. [Google Scholar] [CrossRef]
  35. Lappalainen, J.; Korvola, T.; Alopaeus, V. Modelling and dynamic simulation of a large MSF plant using local phase equilibrium and simultaneous mass, momentum, and energy solver. Comput. Chem. Eng. 2017, 97, 242–258. [Google Scholar] [CrossRef]
  36. Al Ghamdi, A.; Mustafa, I. Exergy analysis of a MSF desalination plant in Yanbu, Saudi Arabia. Desalination 2016, 399, 148–158. [Google Scholar] [CrossRef]
  37. Ali, M.B.; Kairouani, L. Solving equations describing the steady-state model of MSF desalination process using solver opti-mization tool of MATLAB software. Desalin. Water Treat. 2013, 52, 7473–7483. [Google Scholar] [CrossRef]
  38. Alrawashdeh, K.A.B.; Al-Zboon, K.K.; Al-Samrraie, L.A.; Momani, R.; Momani, T.; Gul, E.; Bartocci, P.; Fantozzi, F. Performance of dual multistage flashing—Recycled brine and solar power plant, in the framework of the water-energy nexus. Energy Nexus 2022, 5, 100046. [Google Scholar] [CrossRef]
  39. Helal, A.M.; Medani, M.S.; Soliman, M.A.; Flower, J.R. A tridiagonal matrix model for multistage flash desalination plants. Comput. Chem. Eng. 1986, 10, 327–342. [Google Scholar] [CrossRef]
  40. Rosso, M.; Beltramini, A.; Mazzotti, M.; Morbidelli, M. Modeling multistage flash desalination plants. Desalination 1997, 108, 365–374. [Google Scholar] [CrossRef]
  41. www.climatestotravel.com. (n.d.). Saudi Arabia Climate: Average Weather, Temperature, Precipitation, Best Time. Available online: https://www.climatestotravel.com/climate/saudi-arabia (accessed on 12 March 2020).
  42. Holland, J.H. Adaptation in Natural and Artificial Systems; University of Michigan Press: Ann Arbor, MI, USA, 1975. [Google Scholar]
  43. Coello, C.A. An updated survey of GA-based multiobjective optimization techniques. ACM Comput. Surv. 2000, 32, 109–143. [Google Scholar] [CrossRef]
  44. Coello, C. An updated survey of evolutionary multiobjective optimization techniques: State of the art and future trends. In Proceedings of the Congress on Evolutionary Computation, Washington, DC, USA, 6–9 July 1999. [Google Scholar]
  45. Lei, X.; Shi, Z. Overview of multi-objective optimization methods. J. Syst. Eng. Electron. 2004, 15, 142–146. Available online: https://ieeexplore.ieee.org/stamp/stamp.jsp?arnumber=6077796 (accessed on 31 July 2024).
  46. Holland, J.H. Adaptation in Natural and Artificial Systems, 2nd ed.; MIT Press: Cambridge, MA, USA, 1992. [Google Scholar]
  47. Leardi, R. Genetic algorithms in chemometrics and chemistry: A review. J. Chemom. 2001, 15, 559–569. [Google Scholar] [CrossRef]
  48. Kumar, M.; Husian, M.; Upreti NGupta, D. Genetic algorithm: Review and application. Int. J.-Form. Manag. 2010, 2, 451–454. [Google Scholar] [CrossRef]
  49. Srinivas, N.; Deb, K. Multiobjective optimization using nondominated sorting in genetic algorithms. Evol. Comput. 1994, 2, 221–248. [Google Scholar] [CrossRef]
Figure 1. The main sections of the MSF-RB desalination plant configuration.
Chemengineering 08 00083 g001
Figure 2. The flashing process inside the flashing chamber and the flow chart of the MSF-BR.
Chemengineering 08 00083 g002
Figure 3. The GA obj-f solver algorithm principle was used in this study.
Chemengineering 08 00083 g003
Figure 4. Optimization problem resolution over the entire year, including December (maintenance period).
Chemengineering 08 00083 g004
Figure 5. The relation between production capacity and the drive steam flow rate within a set of solutions during all months.
Chemengineering 08 00083 g005
Figure 6. The effect of seawater temperature on the plant’s production capacity at minimum operation variable values.
Chemengineering 08 00083 g006
Table 1. Specification of sections of MSF-BR plant—Al-Khobar.
SectionStage NumberTube Characterization
Length (m)Internal Diameter (mm)Thickness
(mm)
MaterialTube Number
BH112.2221219Cu-Ni (70-30)3800
HRS1312.222769Cu-Ni (90-10)4300
HRJ310.7241219Titanium3800
Table 2. Seawater temperature in Al-Khobar by month.
MonthAverage T (°C)MonthAverage T (°C)MonthAverage T (°C)
January18.3May28.1September32.9
February18.1June30.6October30
March20.5July32.7November25.6
April23.9August33.8December−20.9
Table 3. Optimization variable limits.
VariableLower LimitUpper Limit
Mf (kg/s)15003000
Mcw (kg/s)4502100
Ts (°C)95120
To (°C)85110
n1525
J14
Table 4. MSF-BR model of plant illustrated in Figure 1 and Figure 2.
StateEquationBasic TheoryEquation Number
Flow rate of brine, flash chamber M b i 1 = M b i   +   M d i Mass balance(4)
Salt concentration, flash chamber X b i   =   X b i 1    M b i 1   M b i Salt balance(5)
Distillated water production—by each stage HRS and HJS M d i =   M b i 1 λ v i   c p T b i 1   T b i Energy balance
C p i = f X , T     λ v i = f T v i
(6)
Accumulation—distillated water—at each stage of HJS k i 1 M d k = M c w +   M f   C p j   t j      t j + 1 M d j λ v j C p j 1   T d j 1   T d j Energy balance-HJS
T d j = T v j = T b j N E A j B P E j
C p j = f X j   ,   t j '    λ v i = f T v i
(7)
Accumulation—distillated water—at each stage of HRS k j 1 M d k = M r   +   M f   C p i   t i t i + 1 M d i     λ v i C p i 1   T d i 1    T d i Energy balance-HRS
T d i = T v i = T v i N E A i B P E i
C p i 1 = f X i   ,   t i
(8)
Heat transfer area, HRS A i   = M r + M f   C p i t j   t j + 1 U i L M T D i Energy balance-HRS
L M T D i =   t i t i + 1 / I n T v i t i + 1 / T v i t i
(9)
Heat transfer area, HJS A j   = M c w + M f   C p i t j   t j + 1 U j L M T D j Energy balance-HJS
L M T D j =   t j t j + 1 / I n T v j t j + 1 / T v j t j
(10)
Flow rate of steam M s = U s A h L M T D s   = M r   + M f   C p h T 0 t 1 Brine heater section(11)
Flow rate of cooling water 0 = M d + M b M f Mass balance − over all(12)
Flow rate of make up M f = M r   X n   + M r + M f   X b 0 X c w Mass balance − mixer(13)
Flow rate of blow down brine M b = M f   X n X c w Salat balance − over all(14)
Table 5. Results of solving the March case’s optimization issue (Tf = 20.5 °C).
Ts (°C)To (°C)Mf (kg/s)Mcw (kg/s)nJGORRRObj-f
105.661104.33521964.057554.62591941.9171050.5029351.41417
112.733799.751492402.8031893.232346.0019580.1579675.843991
117.776593.903212884.7491329.1151842.571880.3661472.205733
113.823789.665932669.9461544.631944.537730.2075834.330147
96.9325588.643121683.3461933.4261642.3176010.4153931.902209
108.3028100.81592096.6381572.7782447.6404620.1247757.515688
98.218797.351722490.0531857.0642348.1611410.1179718.04317
95.3491696.701582457.4941263.6392349.0105230.1071648.903359
105.8396.381152084.758530.78872349.3639380.1018549.262084
110.5279102.73532596.0111138.0492446.123430.1555525.967878
100.717598.463962954.551071.9941842.0853620.4629621.6224
110.3457100.54732969.9471075.2892042.7021470.3532162.348931
107.9545103.48091723.8361468.3361541.0847310.8885090.196223
119.104886.658472278.641681.5921642.5396420.3684272.171215
100.167103.2041525.851610.1061942.0195880.4799381.53965
115.9026101.1152242.4591679.5551641.3355550.7125620.622992
106.833785.11352151.181700.37161948.1115720.1167127.994861
100.872391.410632799.224538.47061641.9969430.481181.515763
118.7617102.40791729.073988.27751641.2768180.743570.533248
109.3614100.49651863.8281836.7251641.3741730.6977280.676445
113.773287.519471742.623748.92961945.7098140.16475.545114
105.0725105.14592835.506724.0642444.9465280.1942764.752252
117.38592.47391683.5921040.0672146.7103260.1398496.570476
112.7033101.71542351.926517.81842243.8504790.2469743.603506
116.6859107.0211570.4712088.7822545.4661170.1733855.292732
Table 6. Plant operation parameters with correlation GOR and obj-function in comparison with the optimum solution.
MonthTs (°C)To (°C)nJMf (kg/s)Mcw (kg/s)Tf (°C)GORRRObj-f
Optimum solution98.6756195.618622121571.1791624.24433.399.8909110.0972999.793612
January98.2152790.178541922526.842824.518518.38.8736510.0743368.799315
February101.626195.80412121978.542777.405218.19.5284720.0916639.436809
March112.2477105.04432421668.97835.69620.59.1005410.0960789.004462
April104.525298.785172111645.494849.103123.99.1301160.0916949.038421
May104.840499.377022331799.8081043.24528.19.0270560.0983138.928743
June115.4485107.40922412459.566896.273630.69.6426960.0961579.546538
July98.8936492.454421912968.9631191.74432.79.7261840.083589.642604
August113.0475107.70822522584.6161076.99533.89.5861530.0994089.486744
September102.609295.754162121851.7371171.2832.99.6035150.0822459.52127
October110.4569101.92082321624.305495.3513309.2774360.0879979.189439
November108.686101.44792212874.3351806.26225.69.6524550.0915619.560894
December104.122696.018032122436.0111345.57520.99.1489440.0849449.064
Table 7. Comparison between the GOR of a predicted operation of MSF-BR, the current operational state, and Ref [40].
ParametersActual Operating PlantRef [40]This Study
GOR6.927.649.89
Ts9798.698.89
Obj-f6.257.239.79
Ms37.4736.530.96
Md259.4279306.23
Mf1577.81591.82968.96
Mcw1561.11708.11191.74
Mr1763.91549.63119.09
Disclaimer/Publisher’s Note: The statements, opinions and data contained in all publications are solely those of the individual author(s) and contributor(s) and not of MDPI and/or the editor(s). MDPI and/or the editor(s) disclaim responsibility for any injury to people or property resulting from any ideas, methods, instructions or products referred to in the content.