Article

Photocatalytic Degradation of Tartrazine and Naphthol Blue Black Binary Mixture with the TiO2 Nanosphere under Visible Light: Box-Behnken Experimental Design Optimization and Salt Effect

1
UniLaSalle-Ecole des Métiers de l’Environnement, Cyclann, Campus de Ker Lann, 35170 Bruz, France
2
Department of Chemistry, Faculty of Science, University of Maroua, Maroua 814, Cameroon
3
Laboratory of Industrial Process Engineering Sciences, University of Sciences and Technology Houari Boumediene, Algiers 16111, Algeria
4
Institut de Chimie de Clermont-Ferrand, Université Clermont Auvergne, F-63000 Clermont-Ferrand, France
*
Authors to whom correspondence should be addressed.
ChemEngineering 2024, 8(3), 50; https://doi.org/10.3390/chemengineering8030050
Submission received: 29 January 2024 / Revised: 12 April 2024 / Accepted: 25 April 2024 / Published: 3 May 2024

Abstract

:
In this study, TiO2 nanospheres (TiO2-NS) were synthesized by the solvothermal method. Firstly, the synthesized nanomaterial was characterized by X-ray diffraction (XRD), Fourier Transformed Infrared (FTIR), scanning electron microscopy (SEM) and UV-Vis Diffuse Reflectance Spectroscopy (DRS). To study the photocatalytic degradation of Tartrazine (TTZ) and Naphthol Blue Black (NBB) in a binary mixture, the influence of some key parameters such as pH, pollutant concentration and catalyst dose was taken into account under visible and UV light. The results show a 100% degradation efficiency for TTZ after 150 min of UV irradiation and 57% under visible irradiation at 180 min. The kinetic study showed a good pseudo-first-order fit to the Langmuir–Hinshelwood model. Furthermore, in order to get closer to the real conditions of textile wastewater, the influence of the presence of salt on TiO2-NS’s photocatalytic performance was explored by employing NaCl as an inorganic ion. The optimum conditions provided by the Response Surface Methodology (RSM) were low concentrations of TTZ (2 ppm) and NBB (2.33 ppm) and negligible salt (NaCl) interference. The percentage of photodegradation was high at low pollutant and NaCl concentrations. However, this yield became very low as NaCl concentrations increased. The photocatalytic treatment leads to 31% and 53% of mineralization yield after 1 and 3 h of visible light irradiation. The synthesis of TiO2-NS provides new insights that will help to develop an efficient photocatalysts for the remediation of contaminated water.

1. Introduction

World population growth and climate change have given rise to an alarming decline in freshwater resources and their availability [1], thus posing a major challenge worldwide. The increase in industrialization, urbanization, and unlimited anthropogenic activities has led to the generation of wastewater originating from various manufacturing [2] and processing industries, such as petroleum hydrocarbons [3], textile, agriculture, dyeing, cosmetics, food, and pharmaceuticals [4].
The contamination of water by emerging pollutants is a major environmental concern. Emerging pollutants refer to contaminants for which there is currently no regulation requiring monitoring, or public reporting of their presence in our water supply or wastewaters. There are many types, such as pesticides, pharmaceuticals, drugs, cosmetics, personal care products, surfactants, cleaning products, industrial formulations and chemicals, food additives, food packaging, metalloids, rare earth elements, nanomaterials, microplastics, pathogens, and dyes [5,6,7]. Their main sources are domestic discharges, hospital effluents, landfill leachates, livestock and aquaculture, and agricultural and industrial wastewaters [5]. Therefore, dyes released into the environment via wastewater cause a major problem in water quality and, consequently, human health. For instance, TTZ [8] and NBB [9,10], the model compounds for this study, are acid azo dyes with sulfonic groups acting as auxochromes that are highly water-soluble and have high stability. Unfortunately, their by-products are known to be mutagenic and carcinogenic aromatic compounds [11].
The removal of these toxic organic pollutants from water is essential to ensuring sustainable water remediation and management [12]. On this basis, water treatment methods such as advanced oxidation processes (AOPs) have been used so far, and are considered to be the best method for treating organic wastewater. This is due to their high mineralization efficiency [13], rapid oxidation reaction rate, and potential for use in treating a wide range of emerging contaminants not treatable by conventional techniques [14]. They are implicated in the oxidation via mineralization of organic pollutants by generating reactive oxygen species (ROS), including hydroxyl radicals (HO) and sulfates [15]. Photocatalysis among AOPs has proven to be a potential means for the elimination of micropollutants present in water [16]. The photocatalysis process is based on the photoexcitation of a semiconductor by light irradiation (ultraviolet light (UV) or visible light (VL)) to degrade organic pollutants into CO2 and H2O [17].
The use of semiconductors such as TiO2, ZnO, Fe2O3, ZnS, and V2O5 has been reported in the literature for their use in wastewater treatment [18,19,20,21,22]. Titanium dioxide (TiO2) is one of the most studied metal oxide photocatalysts, thanks to its high chemical stability and excellent photocatalytic activity. Photodegradation using TiO2 as a catalyst has attracted extensive interest owing to its great advantages (optical–electronic properties, low-cost, chemical stability, and non-toxicity) related to the complete removal of organic pollutants from wastewater. Interest also comes from its efficiency and high availability compared to other semiconductors. The high photocatalytic activity of TiO2 has been strongly recognized in the literature [23,24,25].
Owing to its large band gap (3.0–3.2 eV) [26], TiO2 has some limitations, such as rapid electron hole recombination and low quantum yield, and it can only be excited by UV light irradiation, which is only about 5% of the solar power spectrum [27]. To address this problem, efforts have been made to modify TiO2 to increase visible light absorption by modifying its nanostructures. Various methods of producing TiO2 nanoparticles with improved and large surface areas exist, such as solvothermal methods, the sol-gel method, chemical precipitation, and ultrasonic irradiation [28,29]. The most common methods used to improve the photocatalytic efficiency of TiO2 involve increasing its photoresponse range and reducing photogenerated-carrier coupling. The morphology, size, and structure of a heterojunction can be modified by doping with elements, thereby improving photocatalytic efficiency. These methods have made it possible to synthesize various TiO2-based nanoparticles and apply them in photocatalysis, in particular TiO2 nanorods [30], TiO2 nanosheets [31], TiO2 nanofibers [32], TiO2 nanowires [33], TiO2 nanotubes [34], and TiO2 nanospheres [35]. Studies report that the use of spherical mesoporous TiO2 nanostructures enhances mass and charge transfers within the porous regions during photocatalytic reactions [36]. Moreover, it has been observed that catalysts with spherical shapes larger than 200 nm facilitates easy separation and reusability [37].
In this work, the solvothermal method has been used to synthesize TiO2-NS, as a simple method for the preparation of visible light-active photocatalysts. TiO2-NS was characterized by different techniques, and its photocatalytic performance was examined in relation to the degradation of a binary dye solution of Tartrazine and Naphthol Blue Black as target pollutants. Response surface methodology (RSM) was used as an efficient tool to study the effects of key parameters and highlight the optimum conditions. Finally, the mineralization performances of photocatalysts in TTZ elimination, in addition to stability and reusability, were addressed.

2. Material and Method

2.1. Reagents

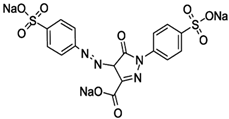
Naphthol Blue Black, Titanium (IV) isopropoxide 97% and Sodium chloride (NaCl ≥ 99.0%) were purchased from SIGMA-ALDRICH Corporation (Saint-Louis, MO, USA) Tartrazine dye powder were purchased from ThermoScientific Chemicals (Haverhill, MA, USA), hydrochloric acid (HCl ≥ 37%) was purchased from Honeywell (Diegem, Belgium), hydroxide sodium (NaOH ≥ 98%) was from Organics (Chicago, IL, USA) and Isopropanol (CH3CH(OH)CH3 ≥ 99.7%) was obtained from MERCK Company (Darmstadt, Germany). These were all used for this study. The physico-chemical properties of Tartrazine and Naphthol Blue Black are listed in Table 1.

2.2. Catalyst Synthesis

TiO2-NS was prepared according to the protocols found in the literature [38]. Into 35 mL of ethanol, 10 mL of Titanium (IV) isopropoxide was added dropwise under stirring, which resulted in a white suspension. Ultrapure water (5 mL) was also added dropwise into the suspension and stirred continuously for 2 h. The suspension was heated at 115 °C for 12 h in a Teflon-lined autoclave reactor, then filtered and washed several times with ultrapure water. The TiO2 nanospheres obtained were dried at 100 °C for 12 h and then calcined at 350 °C for 3 h in air.

2.3. Characterization

The specific surface area was studied by the Brunauer–Emmett–Teller (BET) method with the ASAP 2020 V4.04 (V4.04 H) apparatus. The structural changes in TiO2 nanospheres were examined using a Jobin Yvon Raman spectrophotometer model T64000. The laser wavelength was 514.5 nm (2.41 eV), and the power was 100 mW. The measurement was carried out in the solid state by dispersing the sample powder on a glass solid in air at room temperature. Fourier transform infrared (FT-IR) analysis was utilized to evaluate the surface chemistry or the functional groups of the synthesized materials. This analysis was carried out with an average of 128 scans in ATR mode with a diamond crystal from 4000 to 400 cm−1. The synthetized TiO2-NS was structurally and morphologically characterized by scanning electron microscopy (SEM) using a JEOL 6060-LV apparatus. The UV-Vis diffuse reflectance spectra (UV-Vis DRS) of the synthesized material were recorded with a Cary 300 instrument with a scan rate of 600 nm/min. The fluorescence X was used to determine the chemical composition of the samples using a Panalytical Epsilon 3 with an Ag anode tube. Pollutant concentration was monitored using a UV-Vis spectrophotometer SHIMADZU UV-1800 (Marne La Vallée, France) and mineralization was assessed using a VCsn TOCmeter SHIMADZU (Marne La Vallée, France).

2.4. Photocatalytic Treatment

The photocatalytic degradation efficiency of TiO2-NS was assessed via the photodegradation of Tartrazine (TTZ) and a binary mixture of Tartrazine (TTZ) and Naphthol Blue Black (NBB) dye solution. Visible light (λmax = 800 nm) and ultraviolet light (λmax = 254 nm of UV-C), from sources with 11 W of power, were used in performing the Tartrazine photodegradation, and a visible light source was used for the photodegradation of the binary mixture. A TTZ solution (5 ppm) was prepared, and binary mixture solutions used in the experiments were also prepared at different concentrations (with a molar concentration of 1:1 ratio). A mass of the catalyst was dispersed into 200 mL of solutions. The mixture was left in the dark and continuously stirred at 900 rpm for 60 min to achieve adsorption–desorption equilibrium before light irradiation. After reaching the adsorption–desorption equilibrium, the dye solution was exposed to light for 180 min. At 30 min time intervals, 3 mL samples of the solution were collected from the photoreactor and filtered to remove the photocatalysts using a syringe filter (pore size 0.45 µm). A spectrophotometer (SHIMADZU UV-1800) was used to measure the absorbances of TTZ and NBB at their maximum absorption peak intensity (λmax) values of 426 nm and 618 nm, respectively. The photocatalytic degradation and the mineralization were estimated using Equations (1a) and (1b), respectively.
R ( % ) = C 0 C t C 0 × 100
M i n e r a l i z a t i o n ( % ) = T O C 0 T O C t T O C 0 × 100
where C0 and Ct are the initial concentration and concentration at time t, in mg/L of pollutant, respectively. The TOC0 and TOCt are the total organic carbon values at time 0 min and t, respectively.

3. Results and Discussions

3.1. Characterization

3.1.1. X-ray Diffraction, Raman Spectroscopy, Fourier Transformer Infrared (FTIR) and X-ray Fluorescence of TiO2-NS

The XRD diffractograms of TiO2 nanospheres are shown in Figure 1a. Peaks at 2Ɵ equal to 25.2°, 37.9°, 48.1°, 53.9°, 55.1°, 62.8°, and 68.9°, corresponding to the (101), (112), (200), (105), (211), (204), and (116) planes, respectively, are attributed to the anatase phase of TiO2 [39,40]. Figure 1b shows the Raman spectra of the prepared TiO2 nanospheres. The bands observed around 394, 513, and 637 cm−1 correspond to the anatase crystalline phase of TiO2, which are related to the B1g, A1g, and Eg Raman modes, respectively [41]. No peaks characteristic of other phases or impurities were detected, indicating that the prepared TiO2 nanospheres obtained were of high purity. The broadening of the Raman spectroscopy peaks can be attributed to the size of the TiO2 nanocrystals. Figure 1c shows the FTIR peaks of TiO2 nanospheres. We only observe bands around 421 cm−1, which can be attributed to Ti–O stretching vibrations [42]. These results are in good agreement with those of the Raman analysis, and confirm the high purity of TiO2 nanospheres. The elemental composition study helps in the identification of inorganic elements present in the materials. Figure 1d presents the different results, and shows the presence of elements such as Cl, Ti and Cu in TiO2 nanospheres. We have noted a considerable amount of the element Ti in the nanospheres. The presence of the elements Cl and Cu in the TiO2 nanospheres could be explained by the impurities present in the reagents used in the synthesis of these nanospheres, as the degree of purity of the titanium tetraisoproxide used was 97%. The formation of TiO2 is the result of heat treatment during the synthesis process. This result regarding the elemental composition testifies to the successful formation of TiO2-NS.

3.1.2. SEM Analysis and Specific Surface Area of TiO2-NS

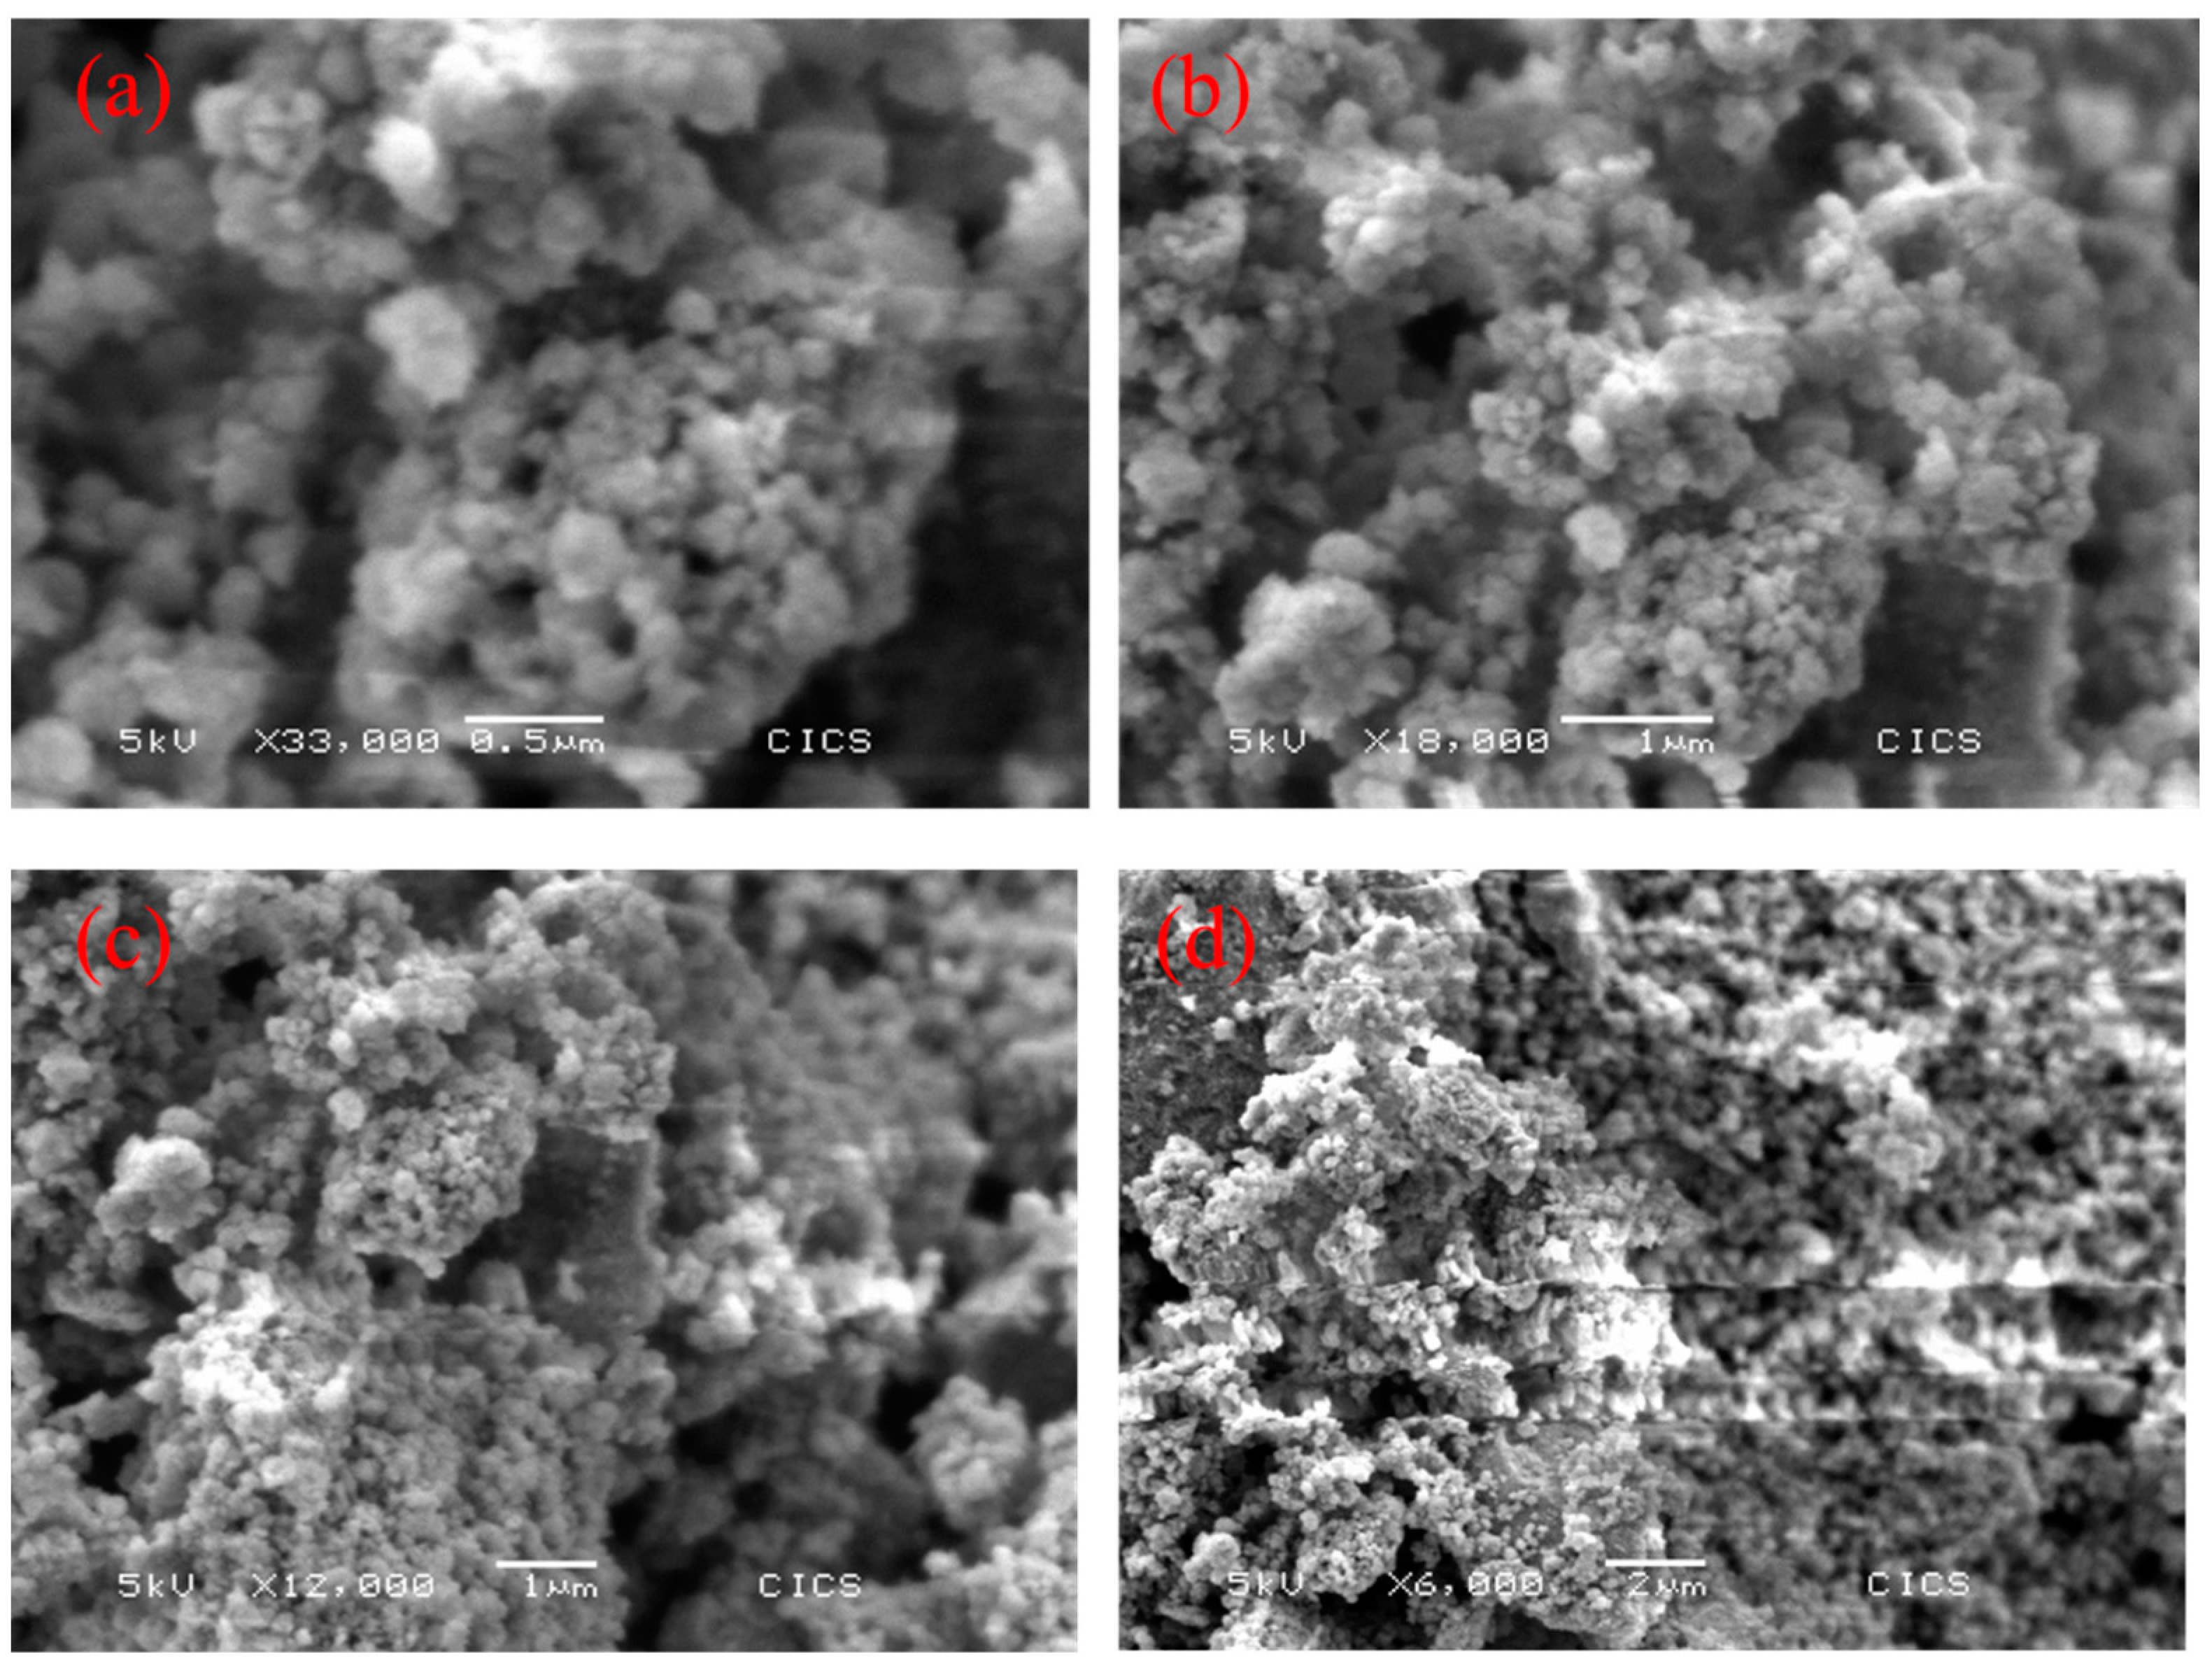
The surface morphologies of the TiO2 nanoparticles were examined by scanning electron microscopy (SEM), which revealed that TiO2 has a spherical shape with better dispersion (Figure 2). A weak agglomeration of the nanoparticles was also observed, which may be due to the aggregation of the primary TiO2 particles at a high calcination temperature, which is necessary to accelerate the crystal growth of the nanoparticles. The BET theory, using the N2 adsorption–desorption isotherm, was employed to study the specific surface area (Table 2). According to the BET results, TiO2-NS had a moderate surface area of 33.3 m2/g, signifying that the TiO2-NS would be able to fix contaminants and facilitate the photocatalytic process.

3.1.3. UV-Vis Diffuse Reflectance Spectroscopy (DRS)

The optical properties of TiO2 nanospheres were studied using UV-Vis diffuse reflectance spectra (Figure 3). It can be seen in Figure 3a that TiO2 nanospheres absorb UV light. As in our previous work, the band gap energy was calculated using the Kubelka–Munk equation [43,44]. Consequently, Figure 3b shows a slight decrease in the bandgap energy of TiO2-NS (2.9 eV) compared with that of commercial TiO2, as described in the literature, which could be beneficial to photodegradation in the visible range. The activity in the visible range could be explained by the difference in the morphology, surface chemical composition and crystal composition of TiO2-NS compared to the commercial and other forms of TiO2 synthesized differently. It is highly likely that a large number of defects (such as oxygen vacancies, etc.) exist, and lead to a reduction in the bandgap value, resulting in (slight) absorption in the visible range. Similarly, the presence of a small amount of copper, a transition metal, could also explain the activity of TiO2-NS in the visible range, as explained in the literature. The literature shows an increase in the bandgap for 3% Cu-doped TiO2, corresponding to an 18% enhancement in the efficiency of bare TiO2 [45]. In addition, 10% Cu-doped TiO2 enhanced hydrogen generation under irradiation in the visible range by reducing the band gap energy of the material [46].

3.2. Photocatalytic Activity of TiO2-NS under UV and Visible Light

The photocatalytic activity of TiO2-NS was evaluated under UV and visible light for the degradation of TTZ at 5 ppm. The degradation efficiencies of the pollutant after 180 min of irradiation are shown in Figure 4. In order to examine the potential role of the photolysis of TTZ, the first experiment was carried out using only UV radiation (in the absence of the photocatalyst). It can be seen that in the absence of TiO2-NS, the degradation efficiency remained unchanged with increasing irradiation time (Figure 4), indicating the negligible photolysis of TTZ. In fact, the results show that the catalyst played a crucial role in the photodegradation of TTZ under light irradiation. Indeed, a significant increase in photocatalytic activity was observed due to the presence of TiO2-NS. These results also reveal the weak sorption of the dye over a period of 60 min in the dark, with the absorbance of TTZ after adsorption–desorption equilibrium decreasing by 10%. On the other hand, it is worth noting that under UV light, we observed that the degradation efficiency of TTZ reached 100% after 150 min of irradiation, while in the case of visible light exposure, a gradual increase in the degradation efficiency of TTZ as per the degradation efficiency obtained was 57% (Figure 4) after 180 min of irradiation, which demonstrates the ability of TiO2-NS to perform photodegradation under visible light. Similar results have been reported on the photocatalytic performance of TiO2-NS in the degradation of organic contaminants [47,48]. These results demonstrate that TiO2-NS can be excited by visible light for dye degradation purposes.

3.3. Catalyst Dose Effect

The catalyst dosage is a crucial factor in the photocatalytic reaction [49]. Consequently, the effect of TiO2−NS dose on the tartrazine photodegradation (at 5 ppm of initial concentration) under visible light irradiation was studied by varying the catalyst concentration from 0.1 g/L to 0.3 g/L. As reflected in Figure 5, the degradation efficiency of tartrazine increases from 52% to 100% when enhancing the photocatalyst concentration from 0.1 g/L to 0.3 g/L, which may be explained by the abundance of active sites on the photocatalyst surface, leading to the generation of a great quantity of ROS (OH, HO2…) [50].

3.3.1. Initial TZZ Concentration Effect and Kinetics of Degradation

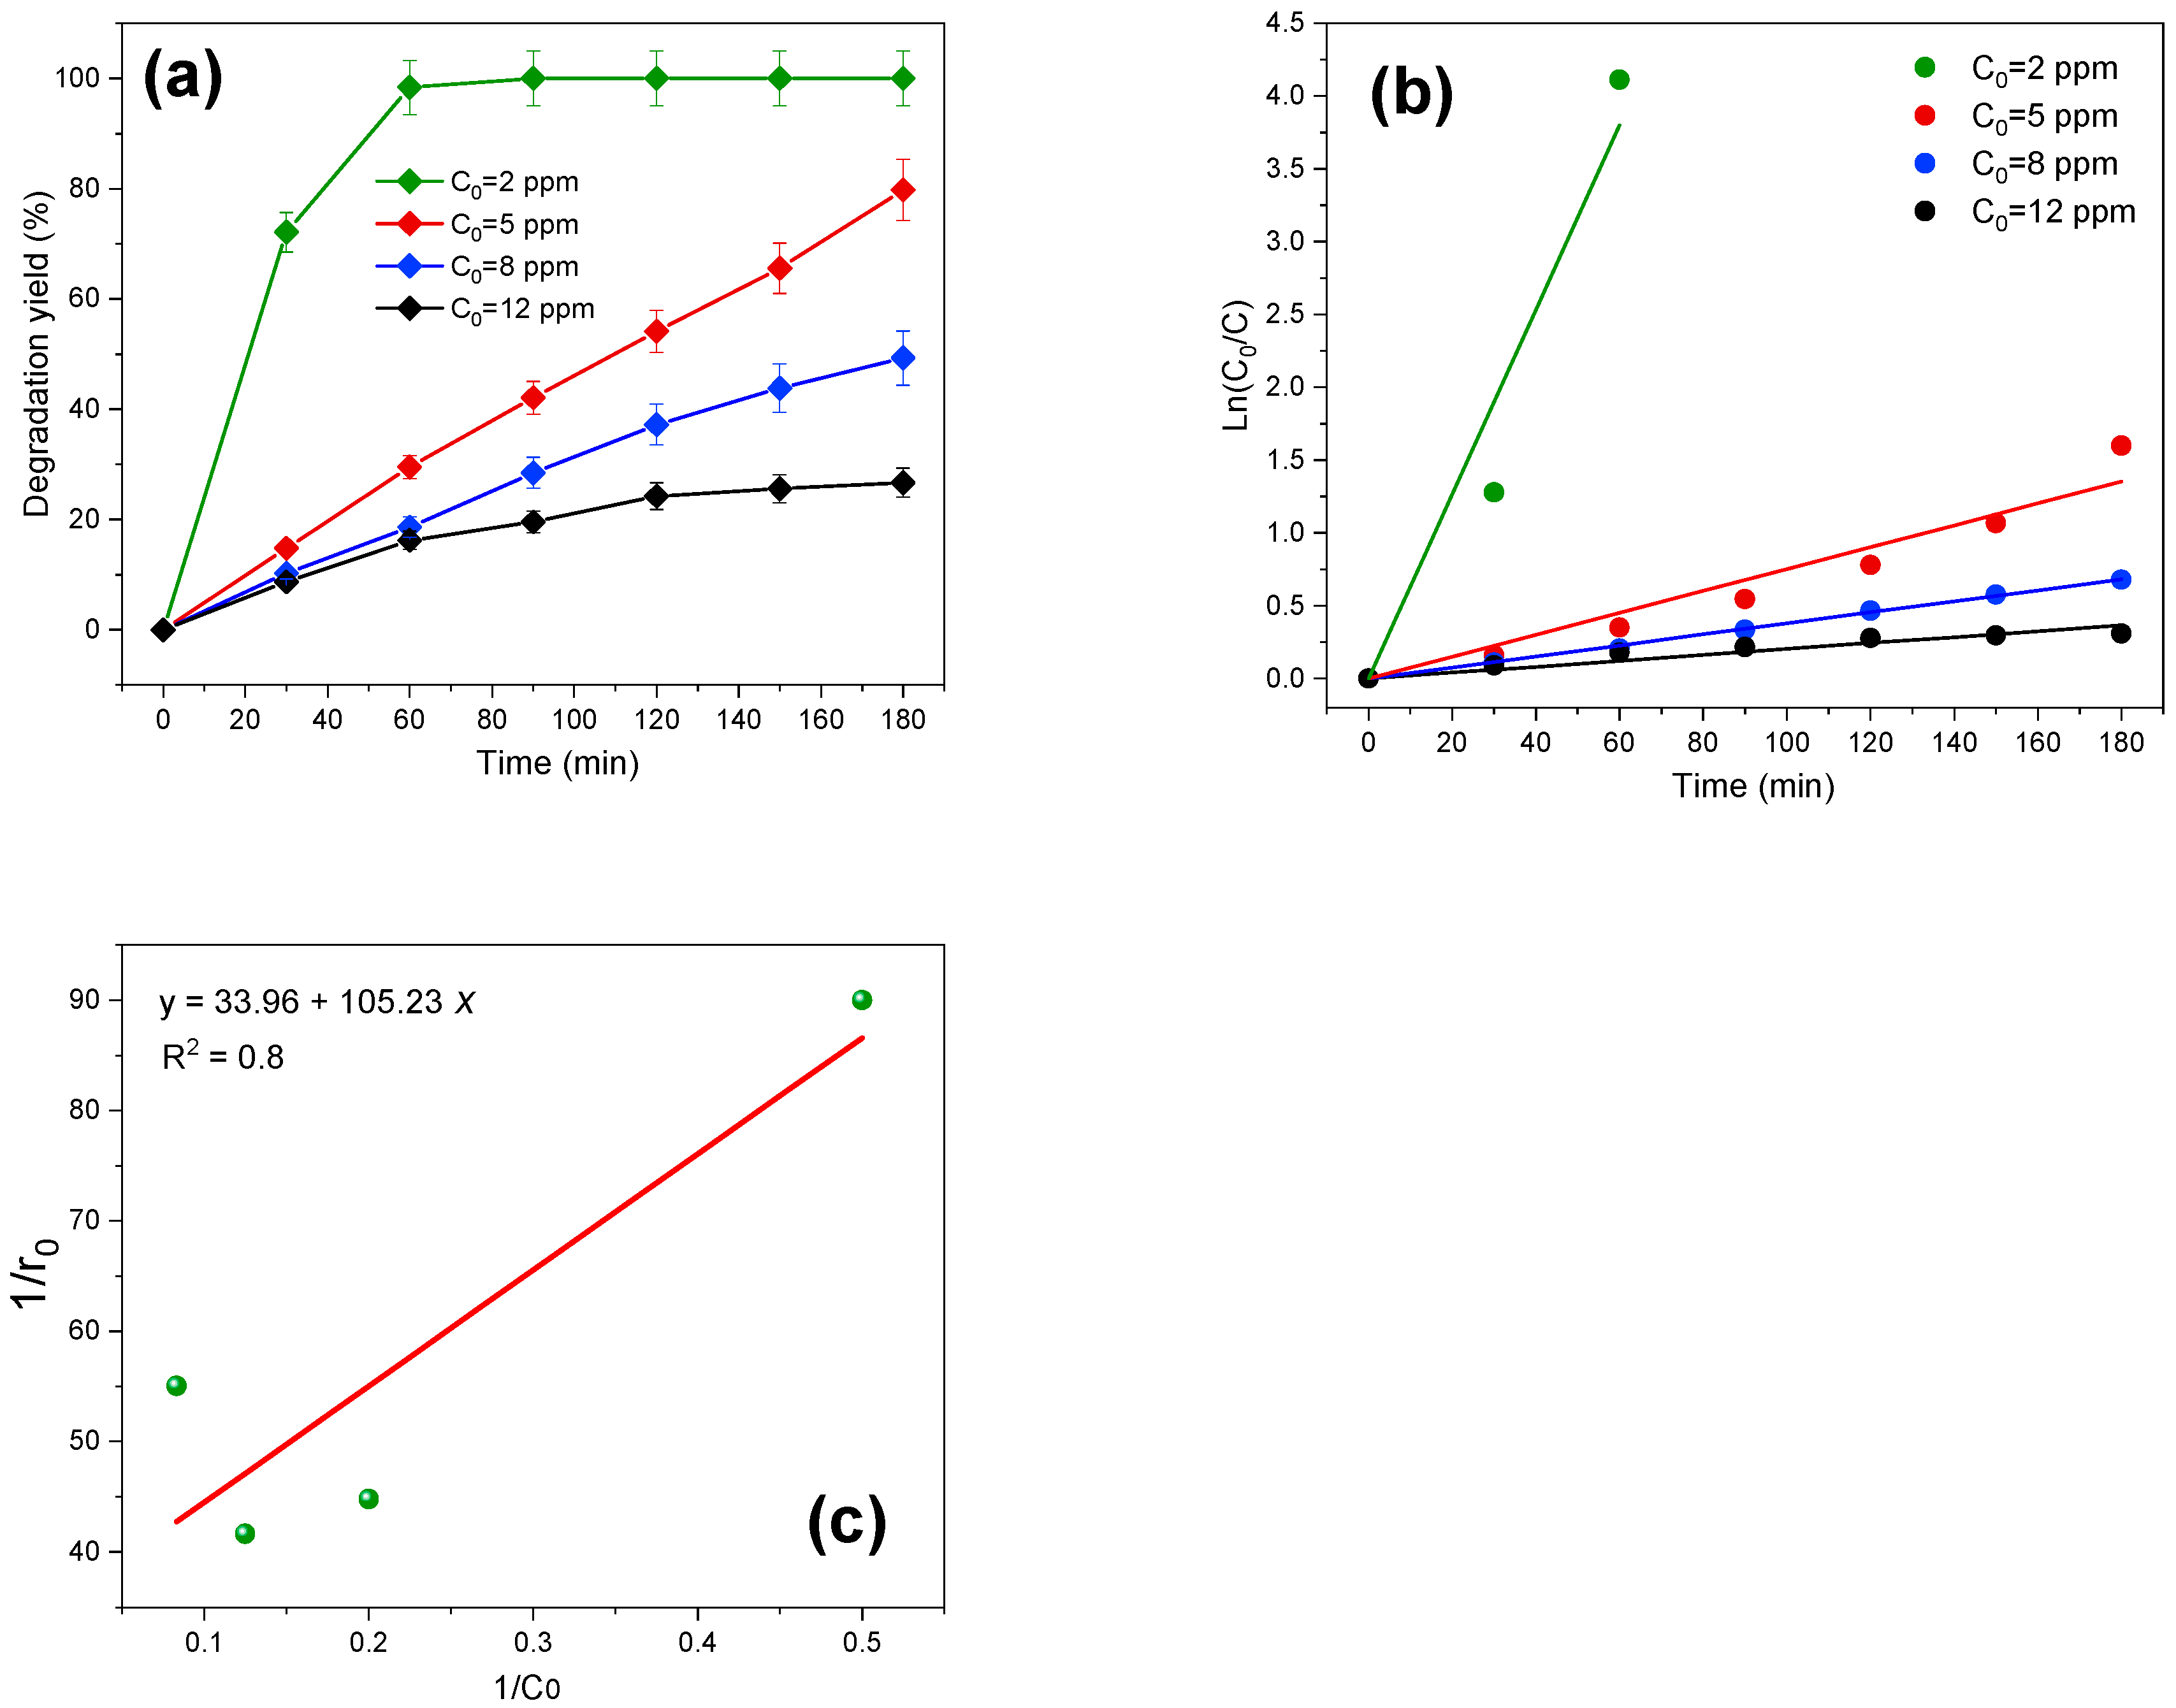
The influence of the initial TTZ concentration on degradation was studied for concentrations of 2 to 12 ppm. Figure 6a shows that increasing the dye concentration decreases the photodegradation rate. This can be attributed to the number of active sites available when using the same amount of catalyst for different dye concentrations [51]. With a low initial concentration, TiO2-NS produces a sufficient number of active sites for the adsorption of TTZ molecules. With higher initial concentrations, the number of available active sites and the amount of produced ROS are not sufficient for adsorbing/degrading the high number of dye molecules and intermediate products, which reduces the efficiency of dye degradation [52].
The kinetic analysis of TTZ was carried out by determining the rate of pseudo-first-order reaction (k) using (Equation (2)) [53].
L n C 0 C = k × t
where k is the rate of pseudo-first-order reaction (min−1) and t is the reaction time in min.
The slope of the straight-line Ln (C0/C) as a function of time was used to define the value of the pseudo-first-order reaction rate (k). As shown in Figure 6b, the R2 (correlation coefficient) values obtained for TTZ concentrations of 2, 5, 8, and 12 ppm were 0.973, 0.976, 0.999, and 0.972, respectively, demonstrating that the pseudo-first-order kinetic model describes the degradation of TTZ by TiO2-NS. We also note that k increases inversely with contaminant concentration, as has already been documented in previous studies [54]. For the initial TTZ concentration of 2 ppm, the degradation efficiency reaches 100% after 60 min of visible light irradiation, and then there are no kinetics for modeling after this time. Similar behaviors were reported by Zeghioud et al. [55] and Mouhamadou et al. [56].
The photocatalytic degradation reactions of several organic pollutants have been described by the Langmuir–Hinshelwood model (L-H) (Equation (3)) [57], because it takes into consideration the interaction between radicals and substrate molecules that are adsorbed on the surfaces of catalysts throughout the process [55].
r 0 = d C 0 d t = k × K × C 0 1 + K C 0
where r 0 (mg∙min−1∙L−1) denotes the initial reaction rate, k (mg∙min−1∙L−1) is the apparent L-H rate and K (L∙mg−1) is the adsorption/desorption equilibrium constant.
The linearized form of the L-H model is commonly applied to describe the mechanism of heterogenous photocatalytic reactions, according to Equation (4) [58,59].
1 r 0 = 1 k × K × C 0 + 1 k
The linear plot of 1 r 0 versus 1 C 0 (Figure 6c) was used to calculate the constant values of k and K, which were discovered to be, respectively, 0.029 mg∙min−1∙L−1 and 0.32 L∙mg−1. As seen in Table 3, these values are significantly lower than those reported in previous studies for organic degradation compounds. This could be explained by the pollutant’s high molecular weight, which would slow down the degradation process. Additionally, this variance in the L-H model’s constants may be explained by the source of light used for irradiation and the UV lamp’s low intensity value.

3.3.2. Effect of pH

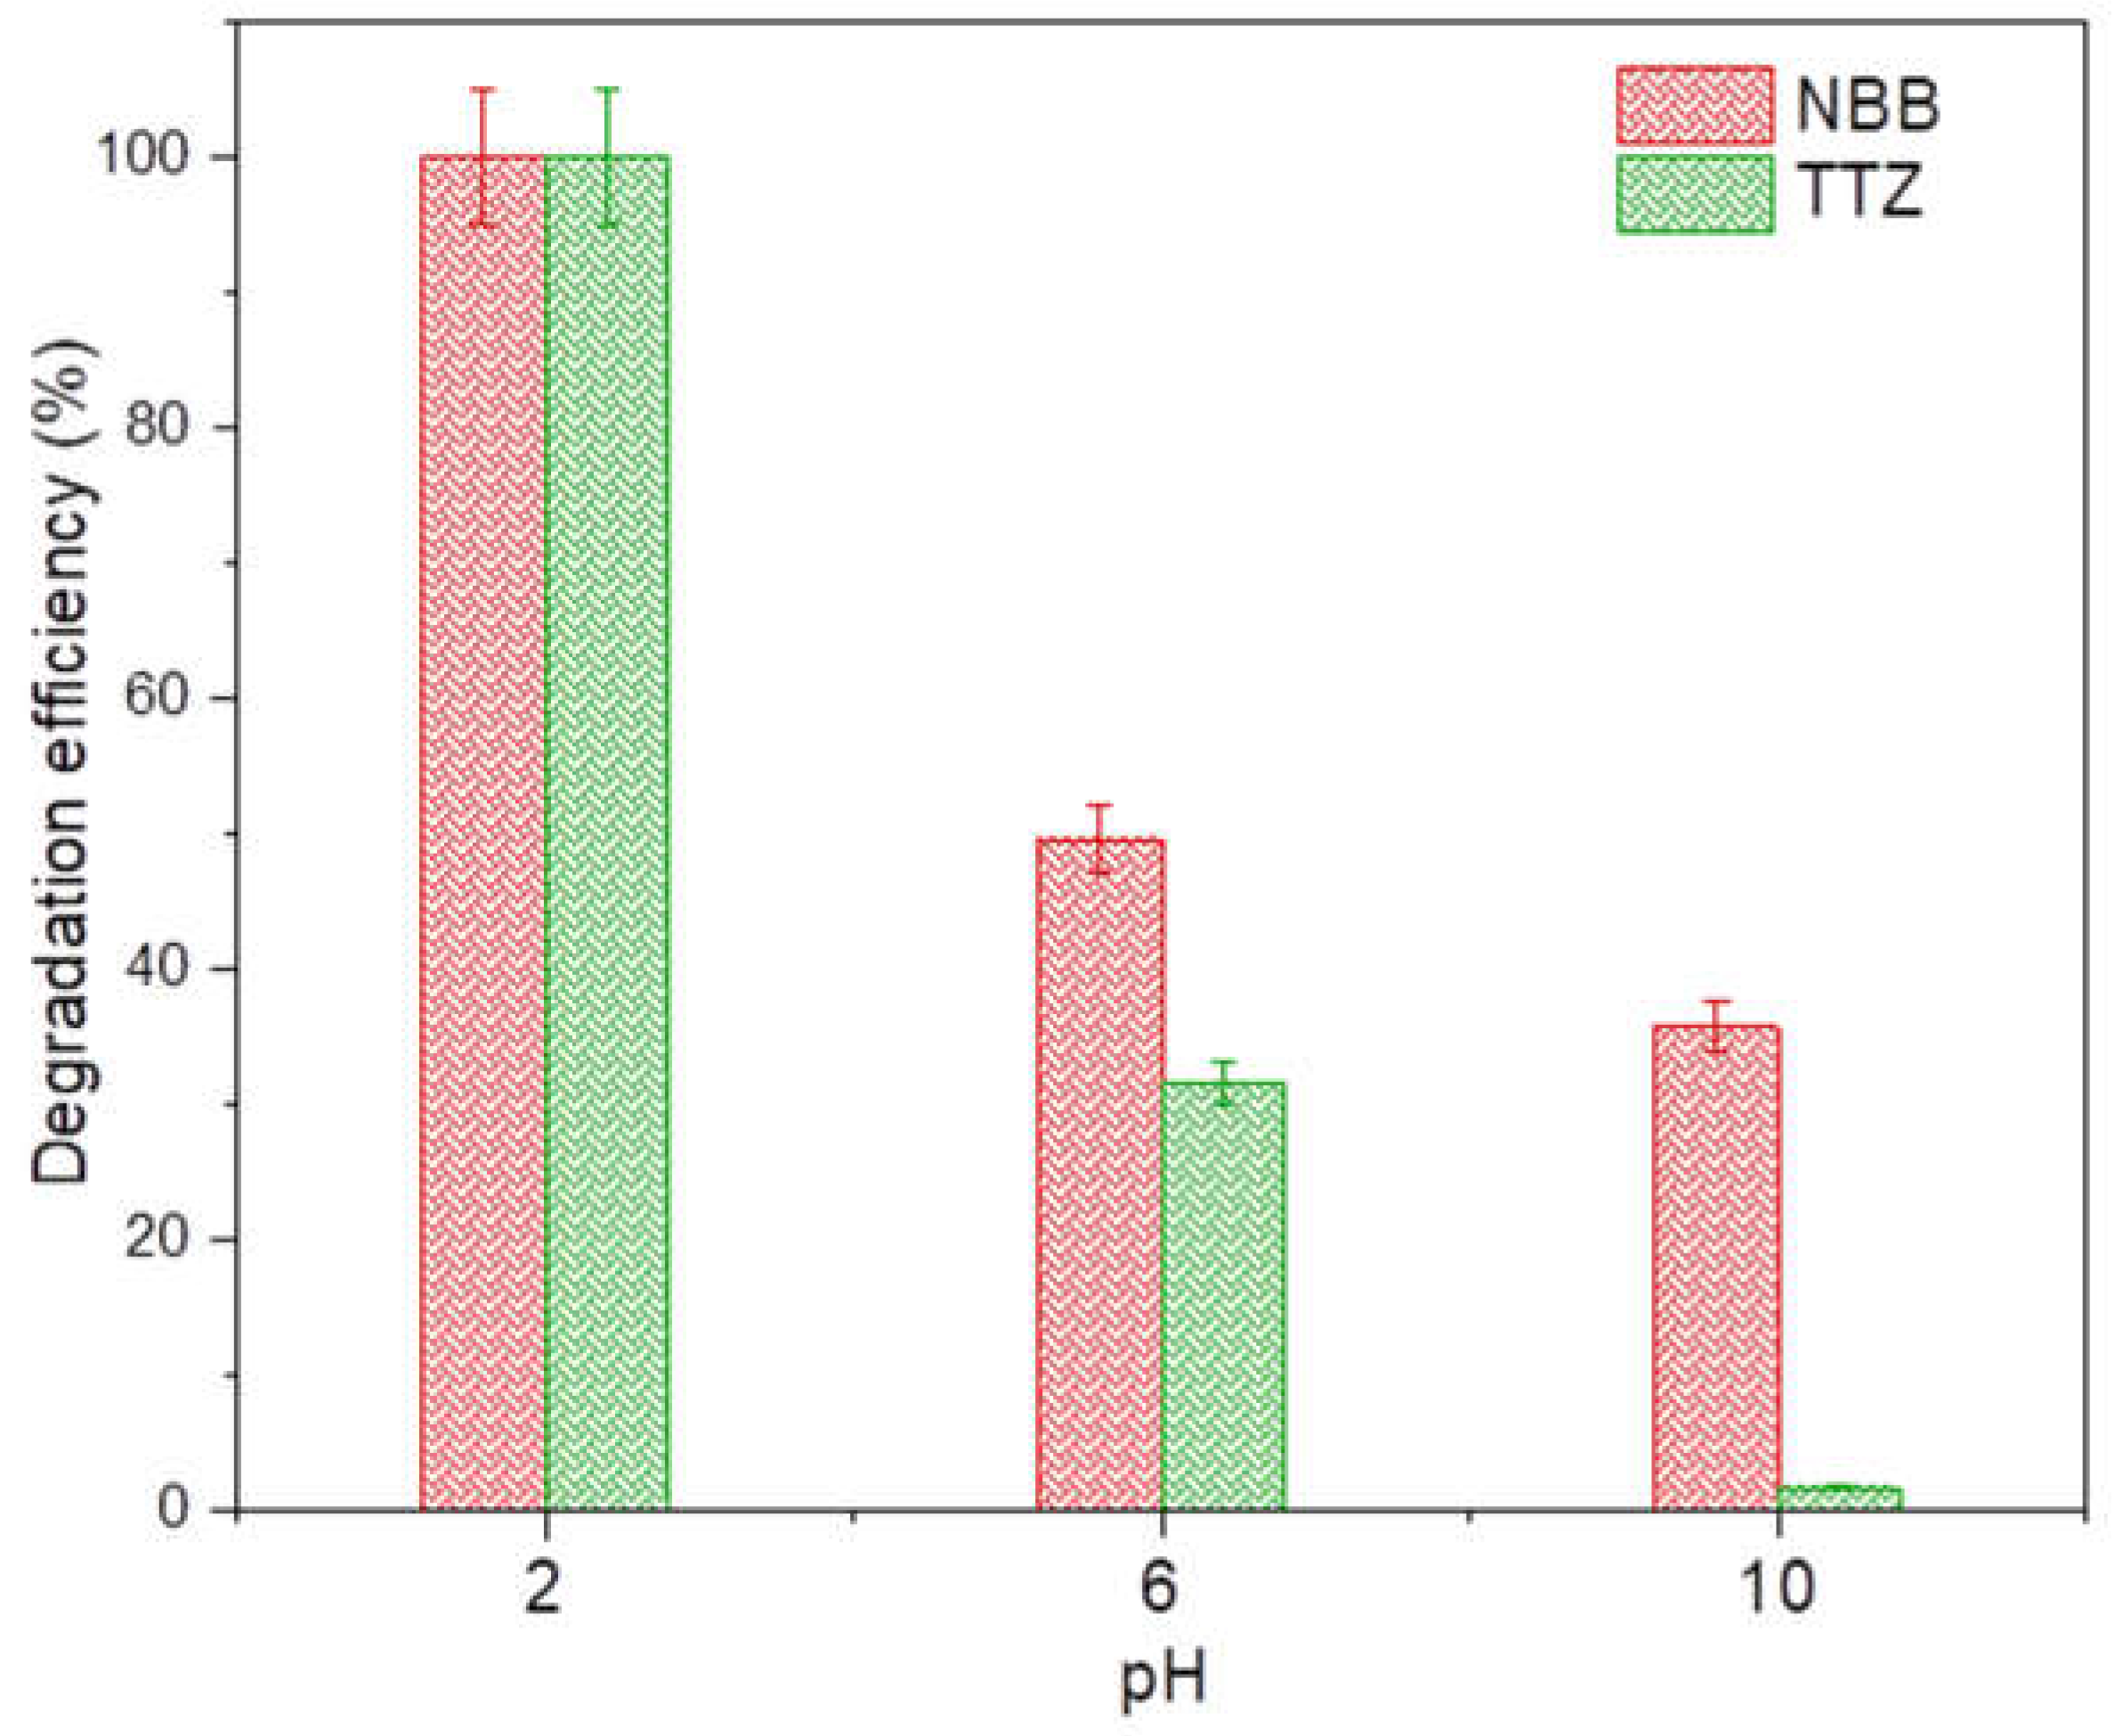
pH value is one of the most important parameters influencing the rate of degradation of organic compounds in the photocatalytic process in numerous ways. To study the effect of pH on the degradation efficiency of TTZ and NBB in a binary mixture solution under VL, all experiments were carried out at various pH values, constant initial dye concentrations (CTTZ: 2 ppm, CNBB: 2.33 ppm) and a TiO2 catalyst dosage of 40 mg. The pH of the solution was varied between 2 and 10 by adding the required volume of HCl or NaOH solution. From Figure 7, we can clearly see that the degradation efficiency values of the dyes for different pH increased in the pattern pH 10 < pH 6 < pH 2. Maximum degradation was yielded at pH 2 for both dyes, with 100% degradation efficiency. At a natural pH of 6 of the binary mixture of TTZ and NBB, the degradation efficiencies of TTZ and NBB were 31% and 50%, respectively. Finally, at pH 10, the degradation efficiencies were the lowest for the two dyes, at 2% for TTZ and 36% for NBB.
The pH of the solution influences the charge on the surface of the photocatalyst and also the ionic species of dye in the solution. At an acidic pH, the adsorption of the dye on the surface of TiO2 is higher than that at a neutral or basic pH, which can be attributed to the fact that TiO2 shows an amphoteric characteristic [63]. In this case, TiO2 has a negatively charged surface at acidic pH, and is positively charged at basic pH [64]. The following equations express the phenomenon [65].
Acidic pH:
Ti-OH + H+ → TiOH2+
Basic pH:
Ti-OH + OH → TiO + H2O
TTZ and NBB are anionic dyes [63,65]; their degradation efficiency increases at acidic pH because of the positive charge of TiO2 in the acidic solution. The adsorption and degradation decreased as the pH increased because of the negative charge of TiO2 in the basic solution.

3.4. Binary System Study

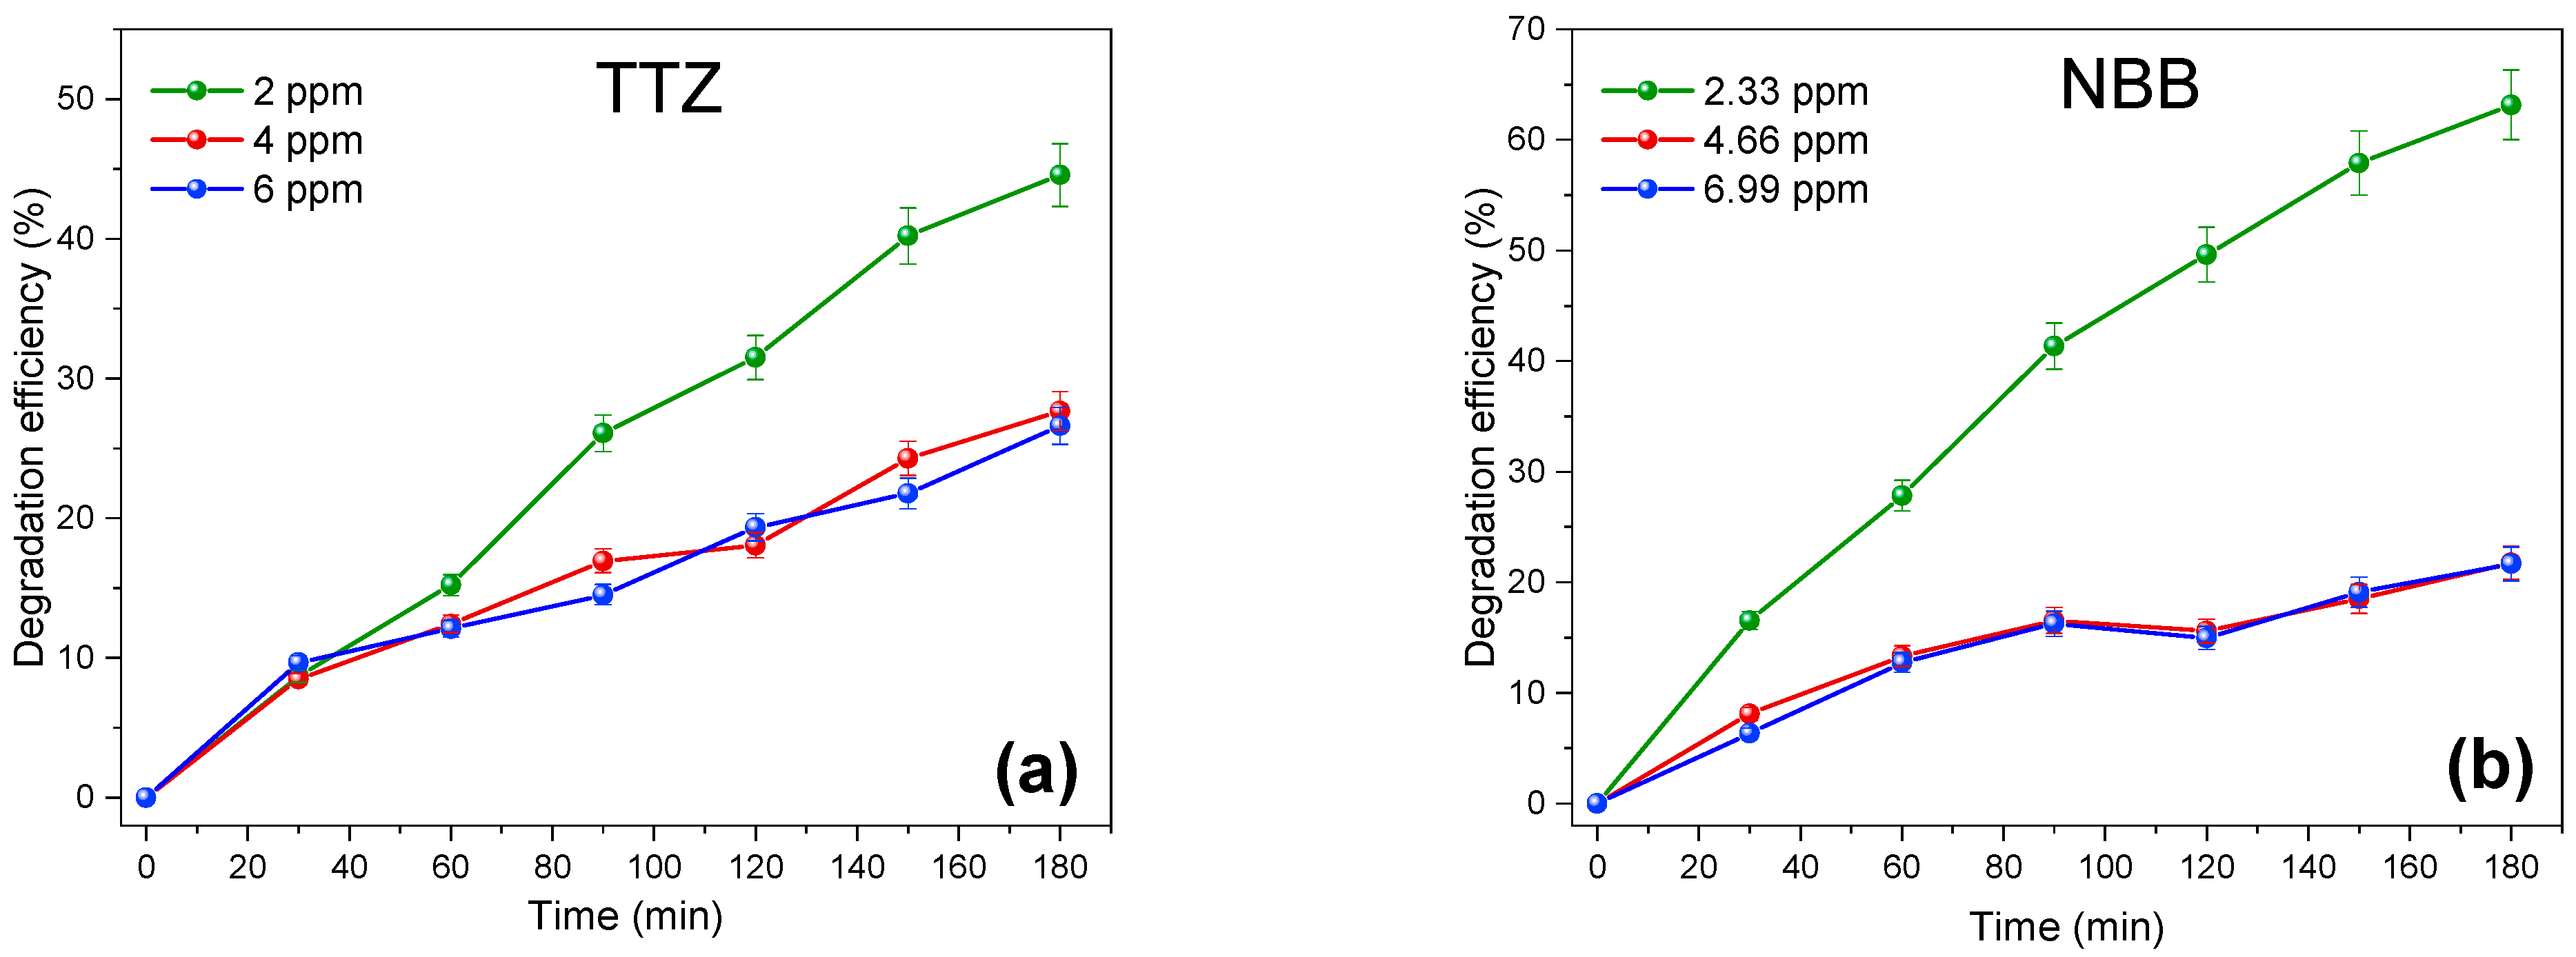
In order to get closer to real conditions, we evaluated the performance of the synthesized TiO2-NS photocatalyst on the simultaneous degradation of two azo dyes, namely, Tartrazine (TTZ) and Naphthol Blue Black (NBB). Indeed, the mixture of dyes most likely to be encountered on an industrial scale is composed of azo dyes, because they represent 60% of commercial dyes [66,67]. As reflected in Figure 8, higher photocatalytic performances were obtained regarding NBB compared to TTZ. Indeed, NBB degradation at 2.33 ppm was 64% (Figure 8b), whereas in the case of TTZ at 2 ppm, it was only 45% (Figure 8a) after 180 min of irradiation. This may be explained by a greater involvement of OH radicals in the case of NBB.
The degradation efficiency of the dyes decreased with an increase in the initial dye concentration, as observed in Figure 8. Additionally, this also indicates that higher initial concentrations of TTZ (4 ppm, 6 ppm) and NBB (4.66 ppm, 6.99 ppm) resulted in degradation efficiencies of approximately 22% and 27%, respectively. This may be due to the reduced generation of radical species on the surface of the photocatalyst. The amount of dye that saturates the surface of the photocatalyst is important for photodegradation; as the active sites on the TiO2-NS photocatalyst become occupied by dye molecules, the generation of OH radicals on the surface of the photocatalyst decreases [68,69]. As the concentration of dye molecules increases, fewer photons reach the catalyst surface of TiO2-NS, thereby reducing the formation of OH and decreasing the photodegradation efficiency [70].

3.5. Experimental Design Results

3.5.1. Optimization of Parameters Using Response Surface Methodology (RSM)

The design of experiments offers a systematic approach to distinguishing the importance of certain variables to the results, their interactions, and the effects of controlling them on achieving the optimal response [71]. To determine the relationship between the various experimental parameters and the results obtained, response surface methodology (RSM) is one of the most widely used empirical modeling techniques for the multivariate optimization of experimental results [56,72]. The RSM was used to analyze and optimize the photocatalytic degradation of TTZ and NBB using TiO2 nanospheres. For this study, 13 trials were performed, and the degradation removal rates are presented in Table 4. The degradation efficiencies ranged from 15.38% to 44.55% (TTZ) and from 21.75% to 63.14% (NBB).
On the basis of the experimental data presented in Table 4, a polyfunctional equation describing the photodegradation process was established, expressed as follows (Equations (5) and (6)):
(Degradation yield TTZ + 17)−1.83 = −0.0019+ 0.0007CTTZ + 0.0005CNBB + 0.0005CNaCl − 0.0001CTTZ × CNBB − 0.0002CTTZ × CNaCl − 6 × 10⁻⁵CNBB × CNaCl − 3 × 10⁻⁵CNaCl2 + 4 × 10⁻⁵CTTZ × CNBB × CNaCl + 8 × 10⁻⁶CTTZ × CNaCl2.
(Degradation yield NBB)0.3 = 4899 − 0.311CTTZ − 0.383CNBB − 0.112CNaCl + 0.043CTTZ × CNBB − 0.003CTTZ × CNaCl + 0.007CNBB × CNaCl + 0.013CNaCl2 − 0.002CNBB × CNaCl2.
This empirical linear regression (Equations (5) and (6)) provides clear information on the positive or negative effects of the main variables, while the numerical coefficient is related to the significance of the effect. It is clear from Equations (5) and (6) that the TTZ concentration plays the most important role in the process, followed by the NBB concentration, and finally the NaCl concentration.To validate the model, an analysis of variance (ANOVA) was applied, the results of which are presented in Table 5 and Table 6. The statistical significance of the model is attributed to the F value [73]. F values of 110 (TTZ) and 193.93 (NBB) imply that the model is highly significant. There are only 0.13% (TTZ) and 0.01% (NBB) chances that an F value of this magnitude is due to noise [74,75]. The very low probability values of p-value ˂ 0.0013 (TTZ) and p-value ˂ 0.0001 (NBB) confirm that the model is highly significant at the 95% confidence level. According to Sohrabi and Shahnaz, a model is significant when the p-value is ˂0.05 [73,76].
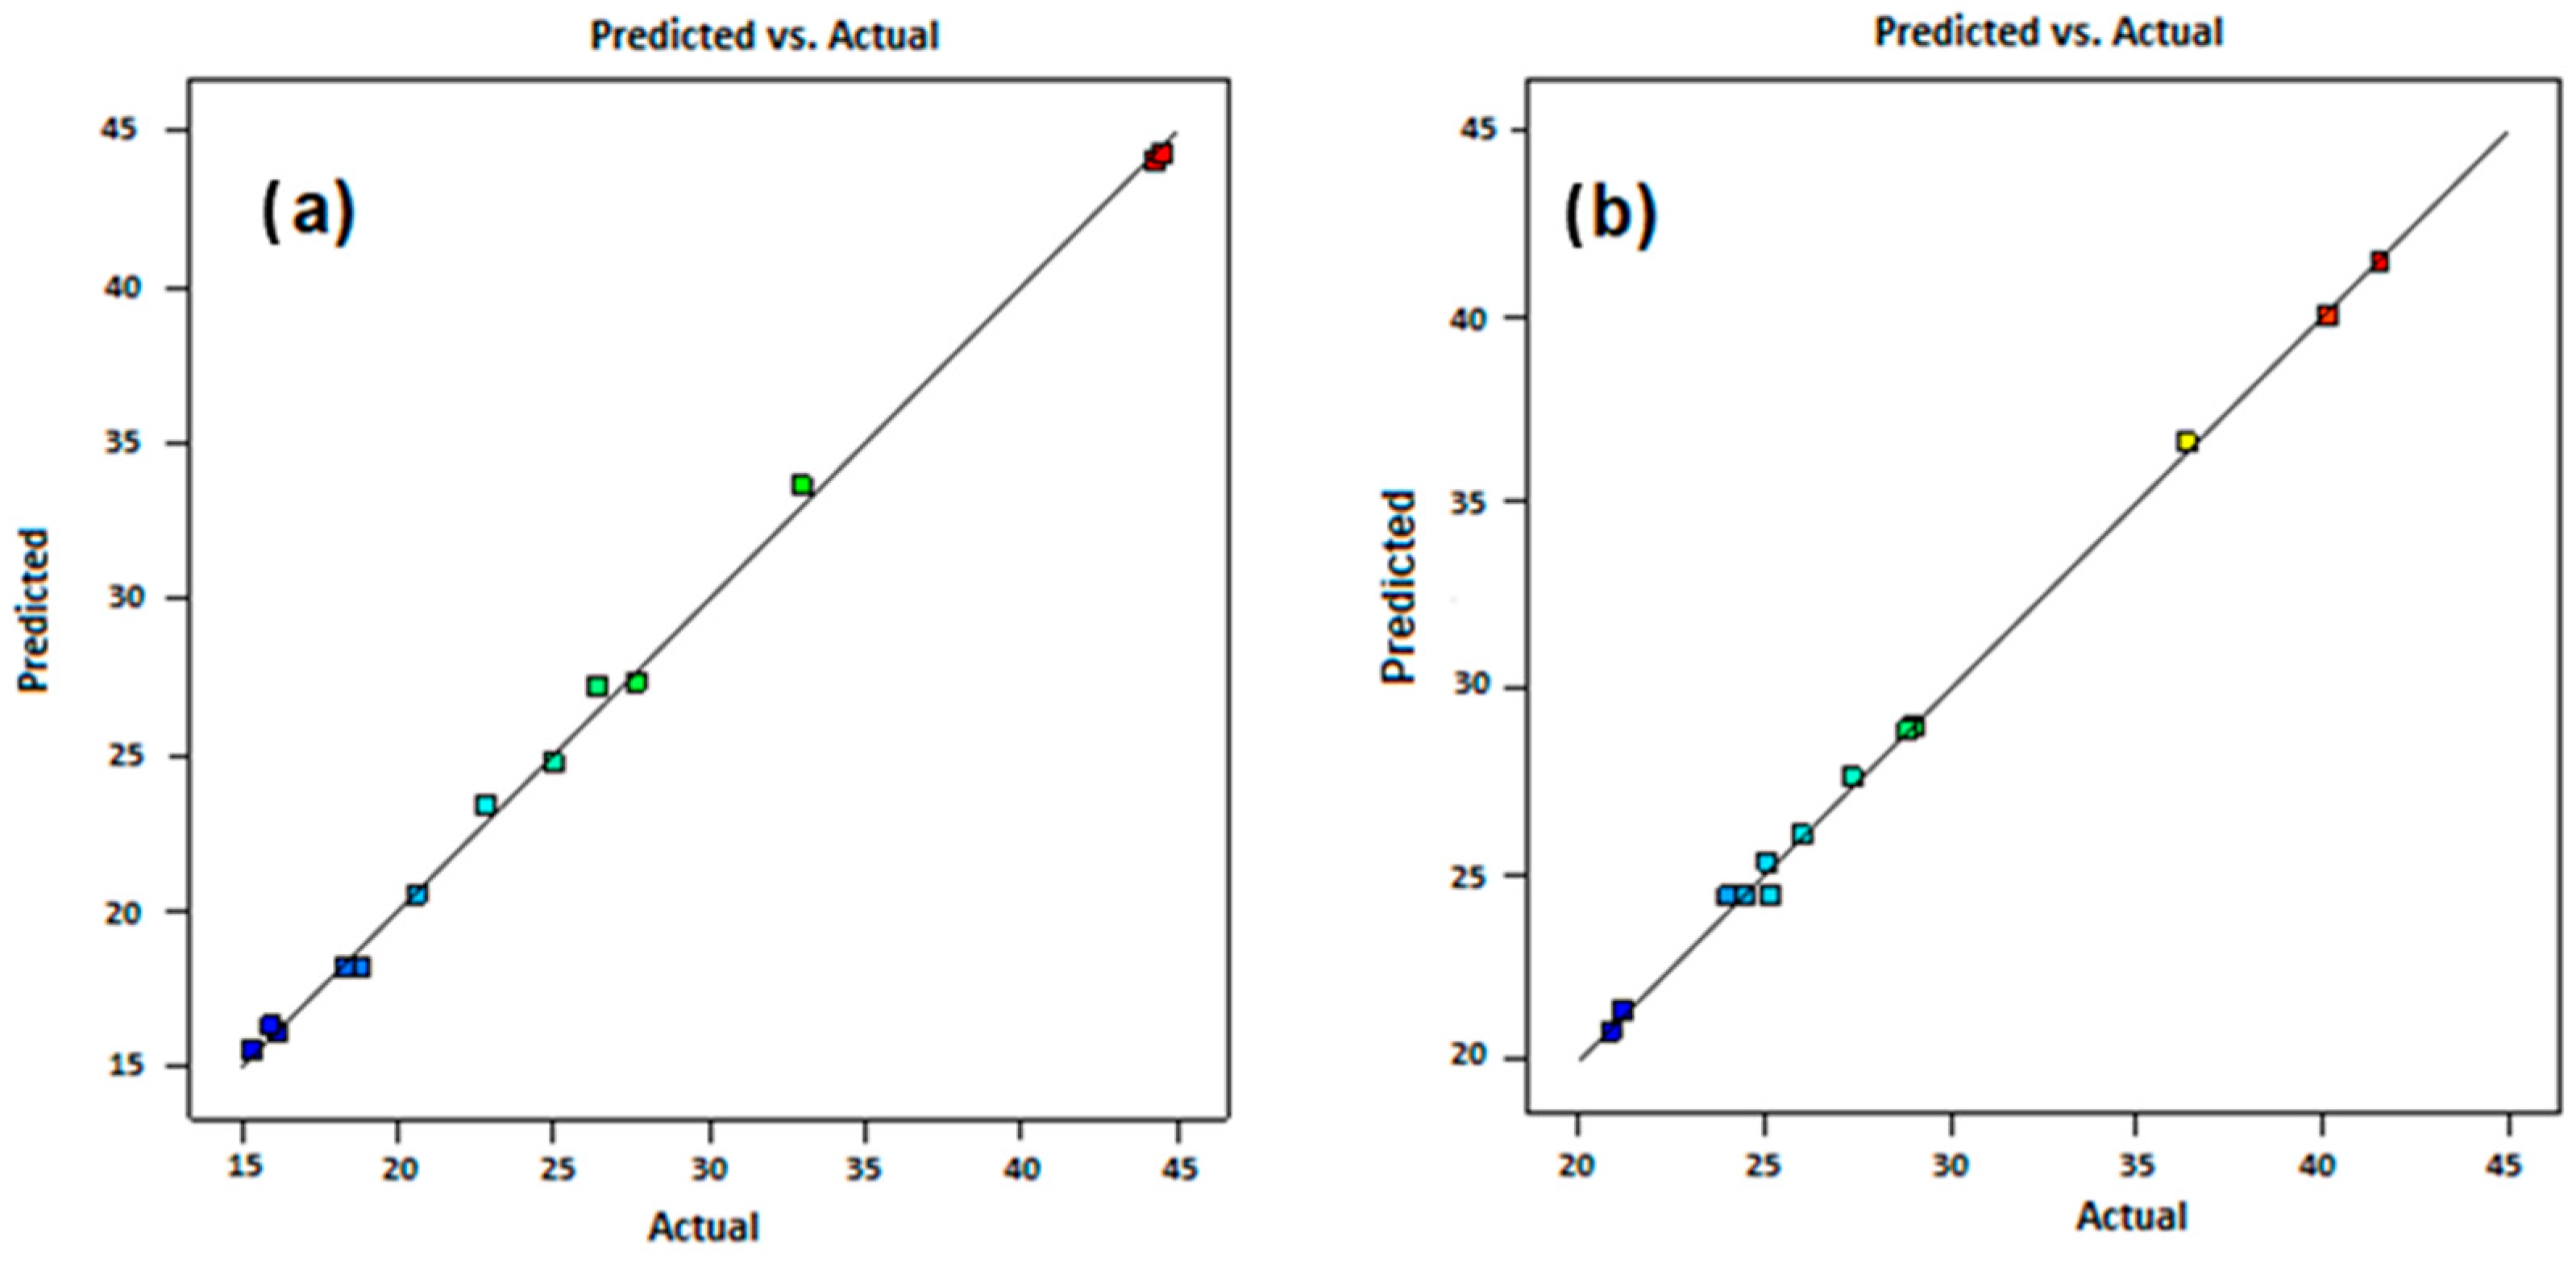
The values of the R2, adjusted R2 and predicted R2 coefficients of the applied Box Behnken Design (BBD) model were 0.9970, 0.9879, and 0.7922 (TTZ) and 0.9974, 9923, and 9805 (NBB), respectively (Table 5 and Table 6). These R2 values correspond to the level of agreement between the degradation rates obtained experimentally and those predicted by the proposed model, as shown in Figure 9. The adequate accuracies, which measure the signal-to-noise ratio, are 29.6421 (TTZ) and 42.6727 (NBB), which are well above the lowest acceptable value of 4. This practically means that the proposed model can be safely used to navigate the design region, within the limit of the variables determined previously (Table 4).

3.5.2. Response Surface 3D Graph and Contour Plots of the Interactive Effects

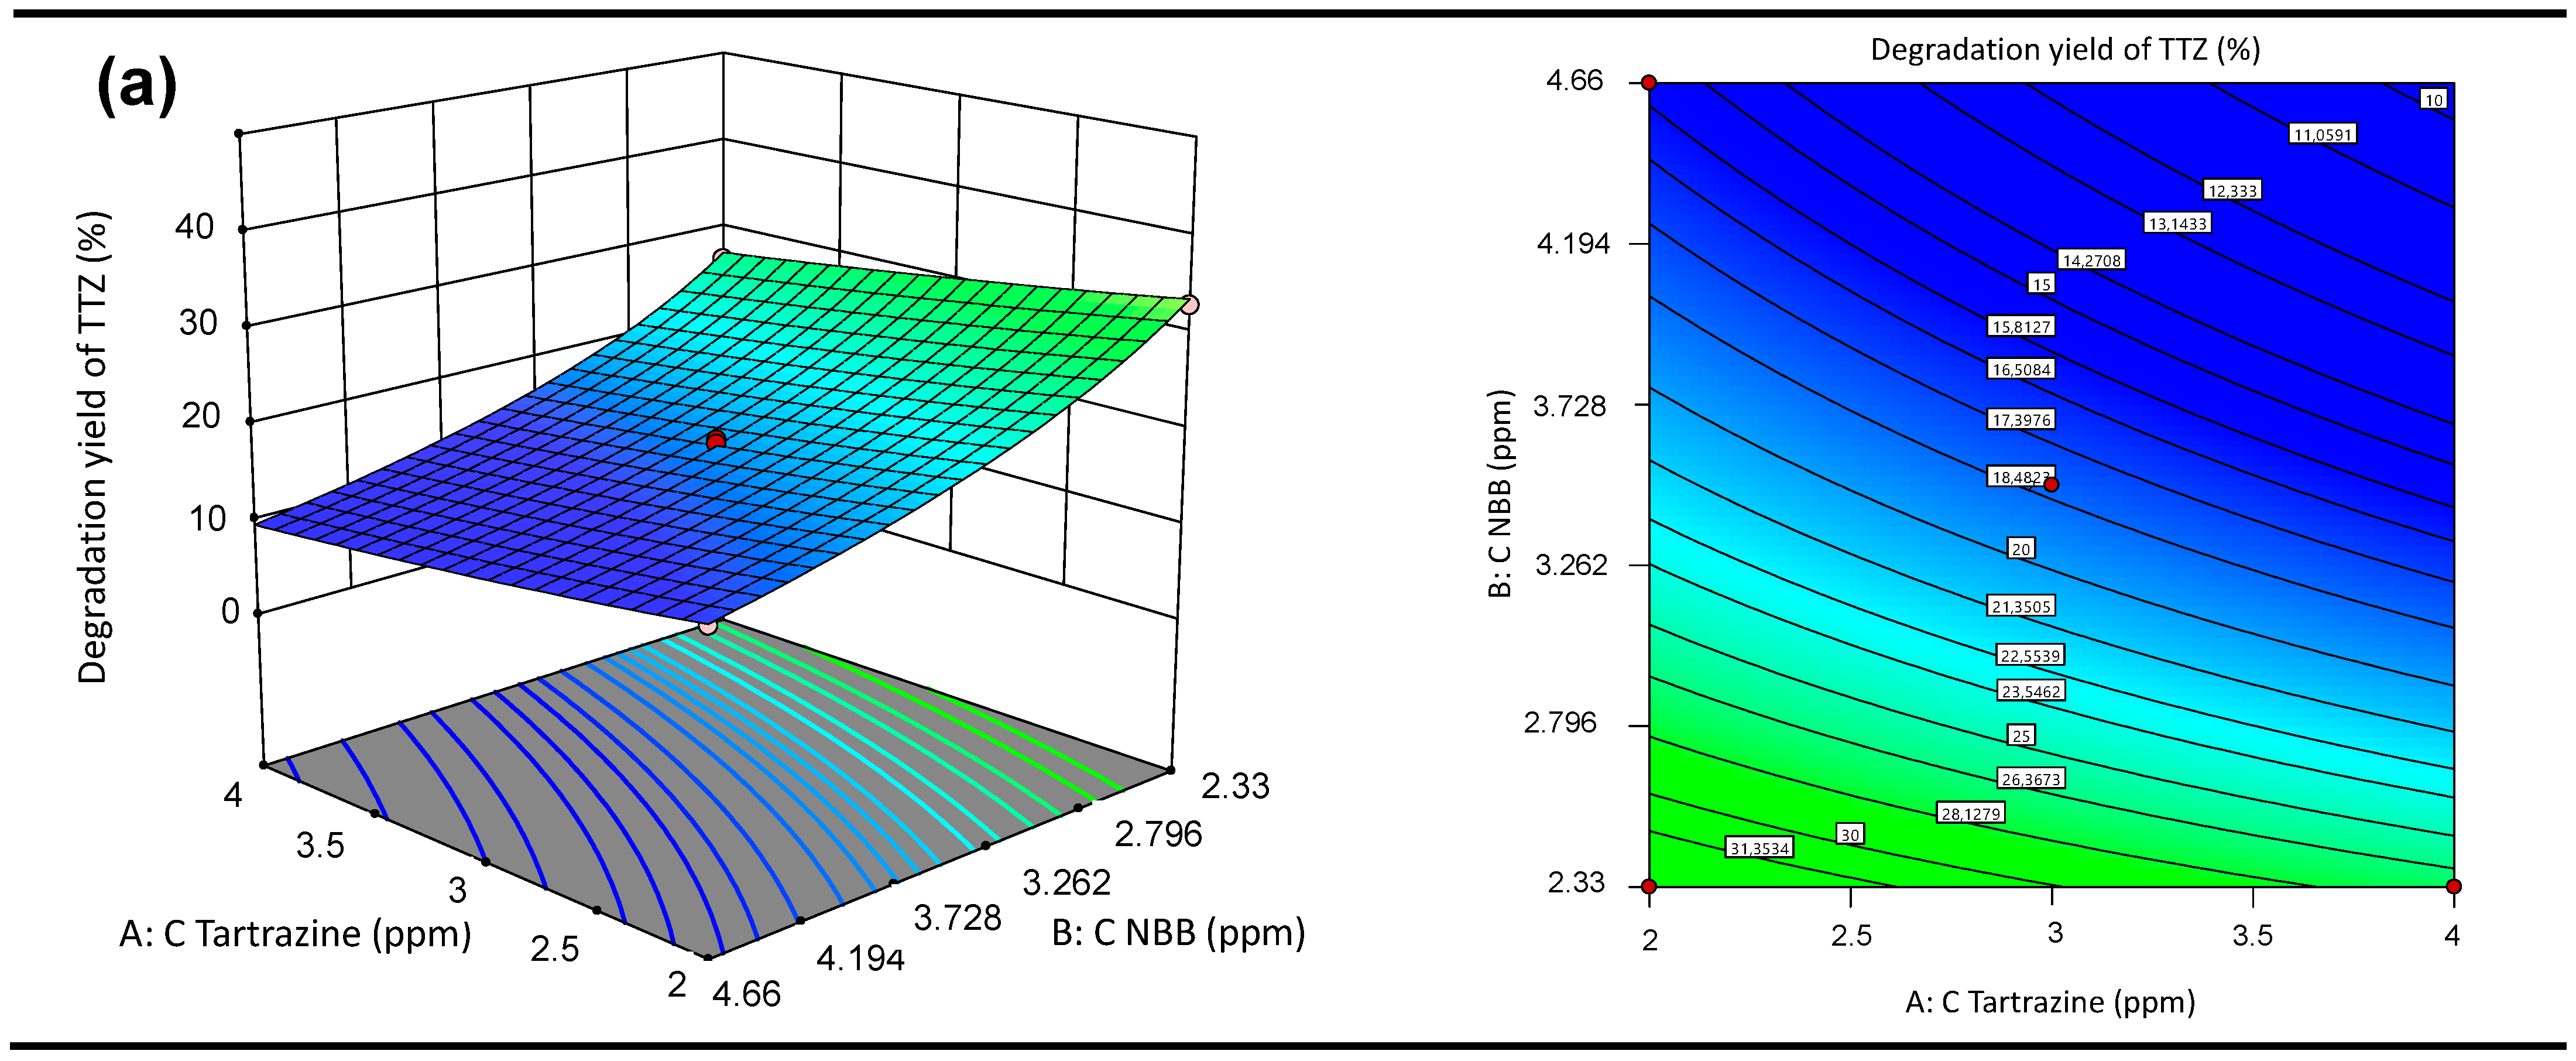
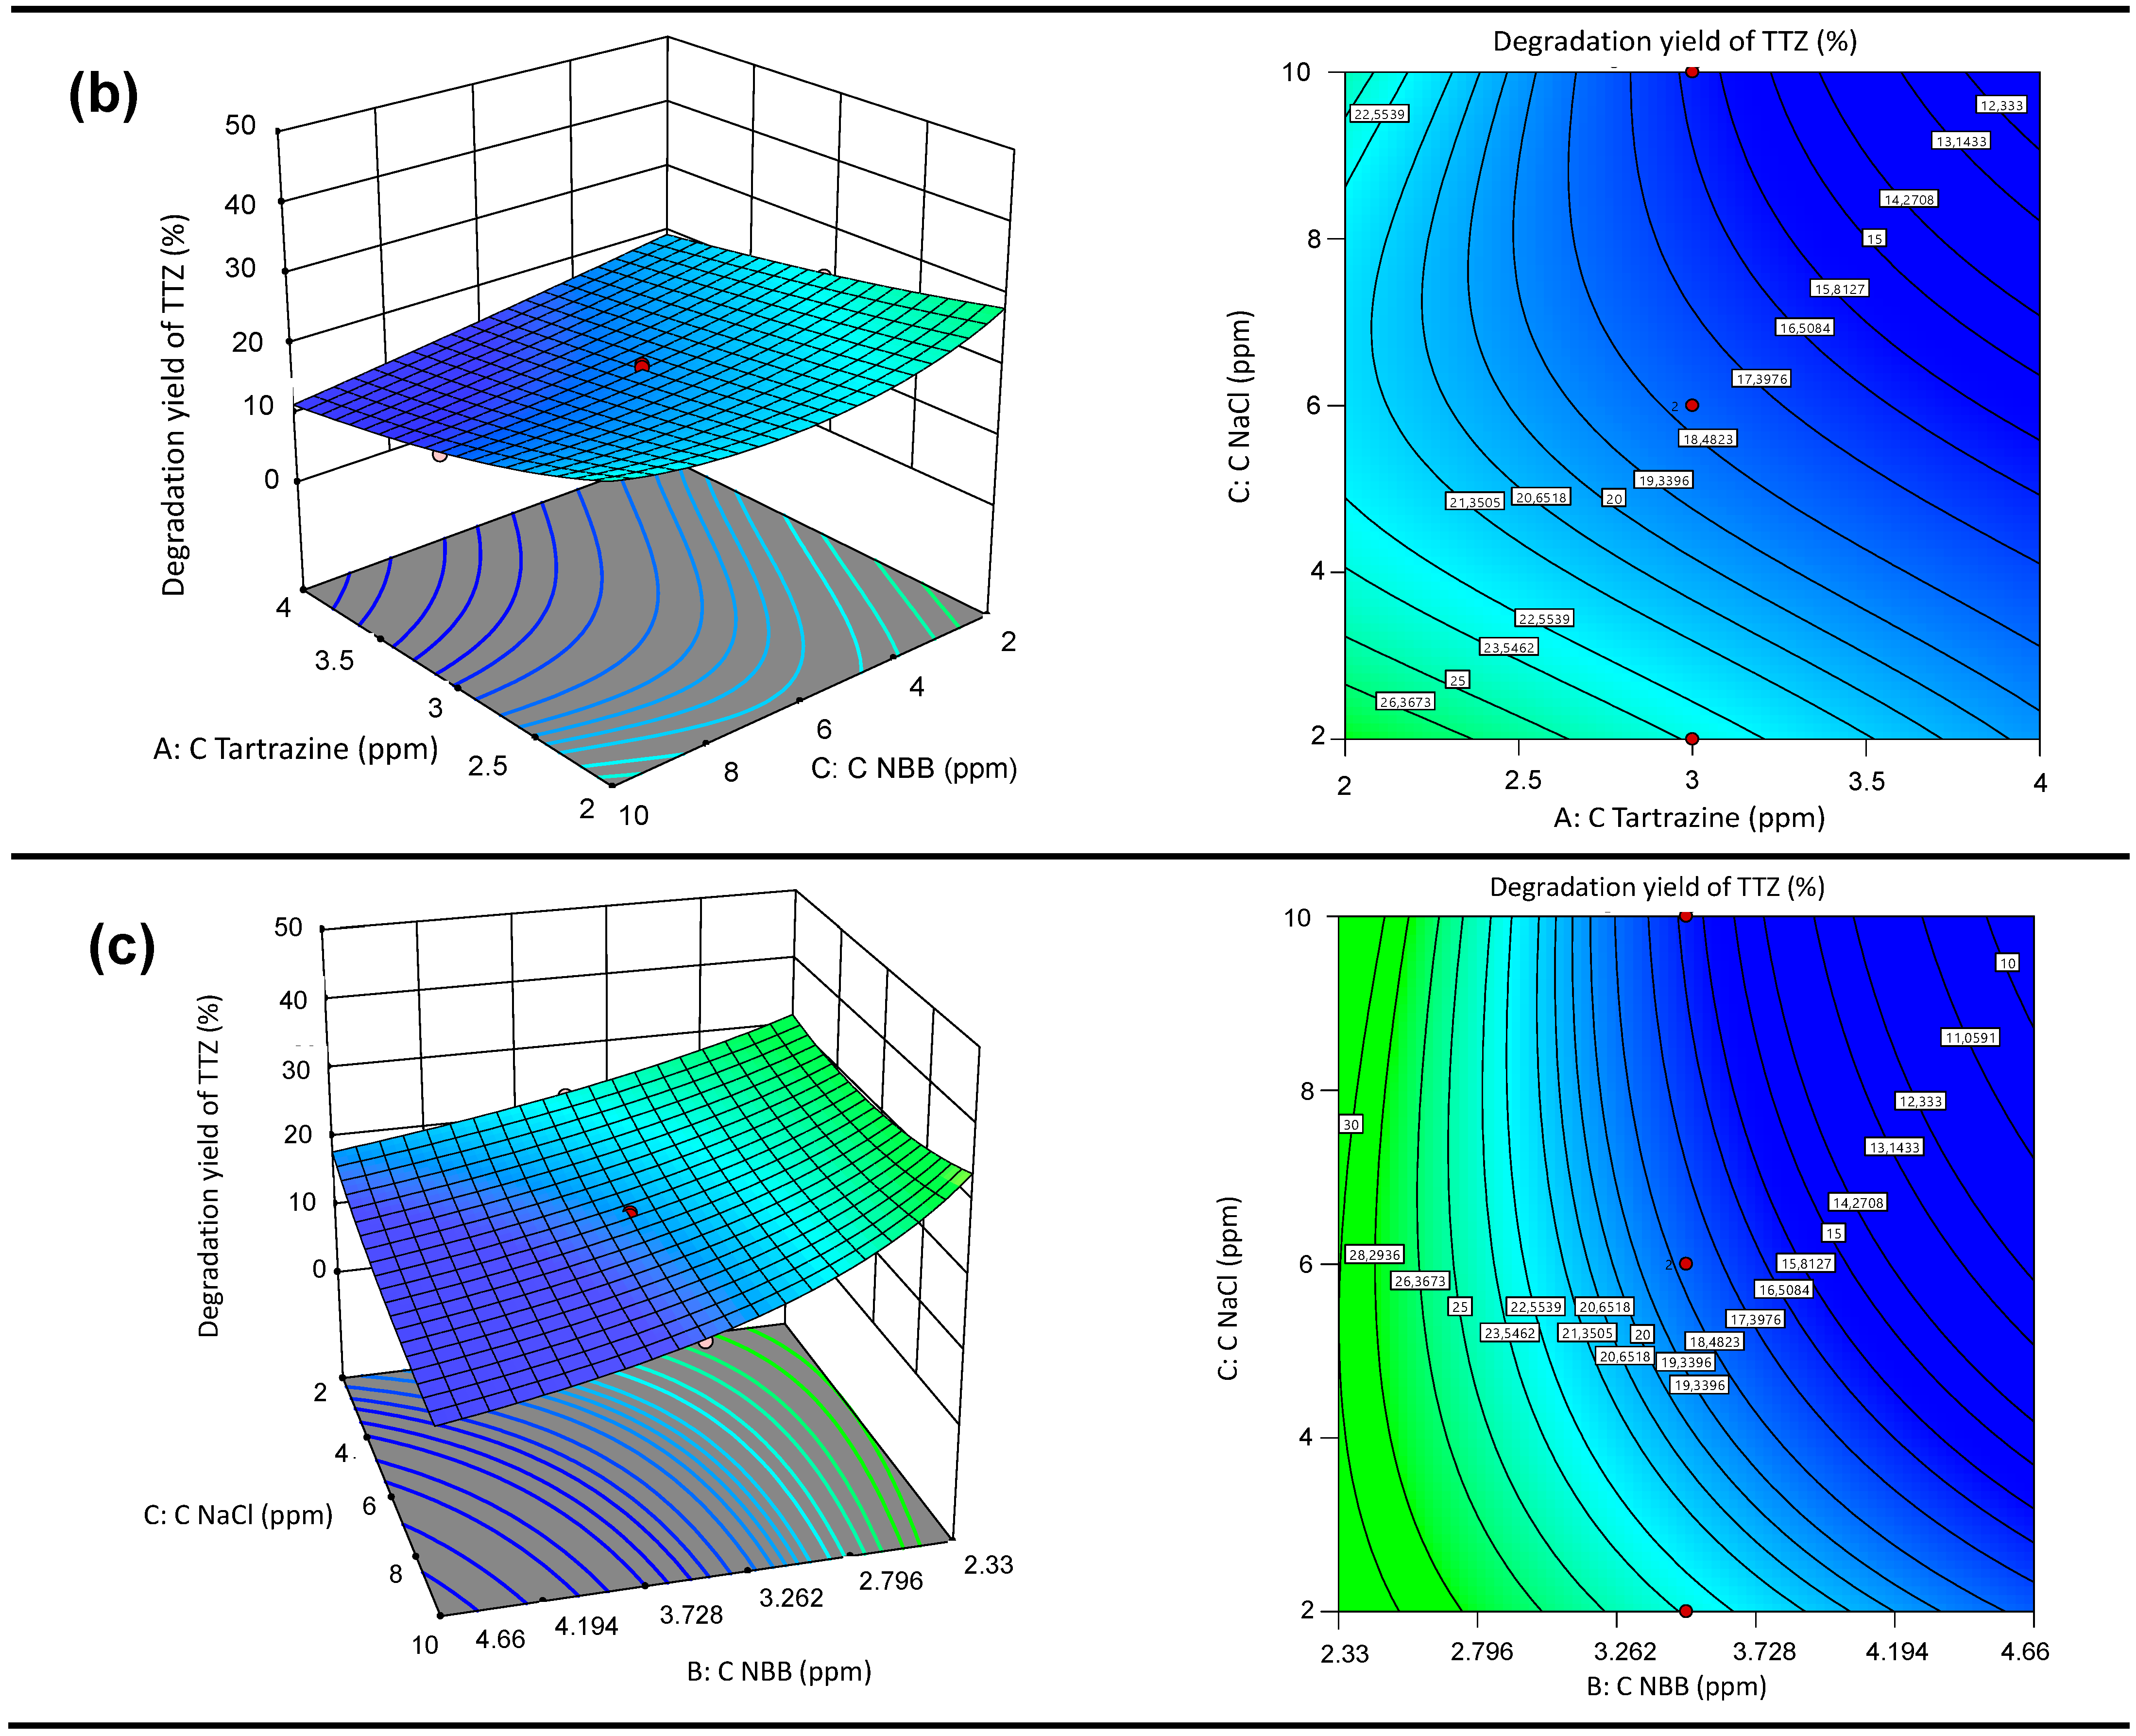
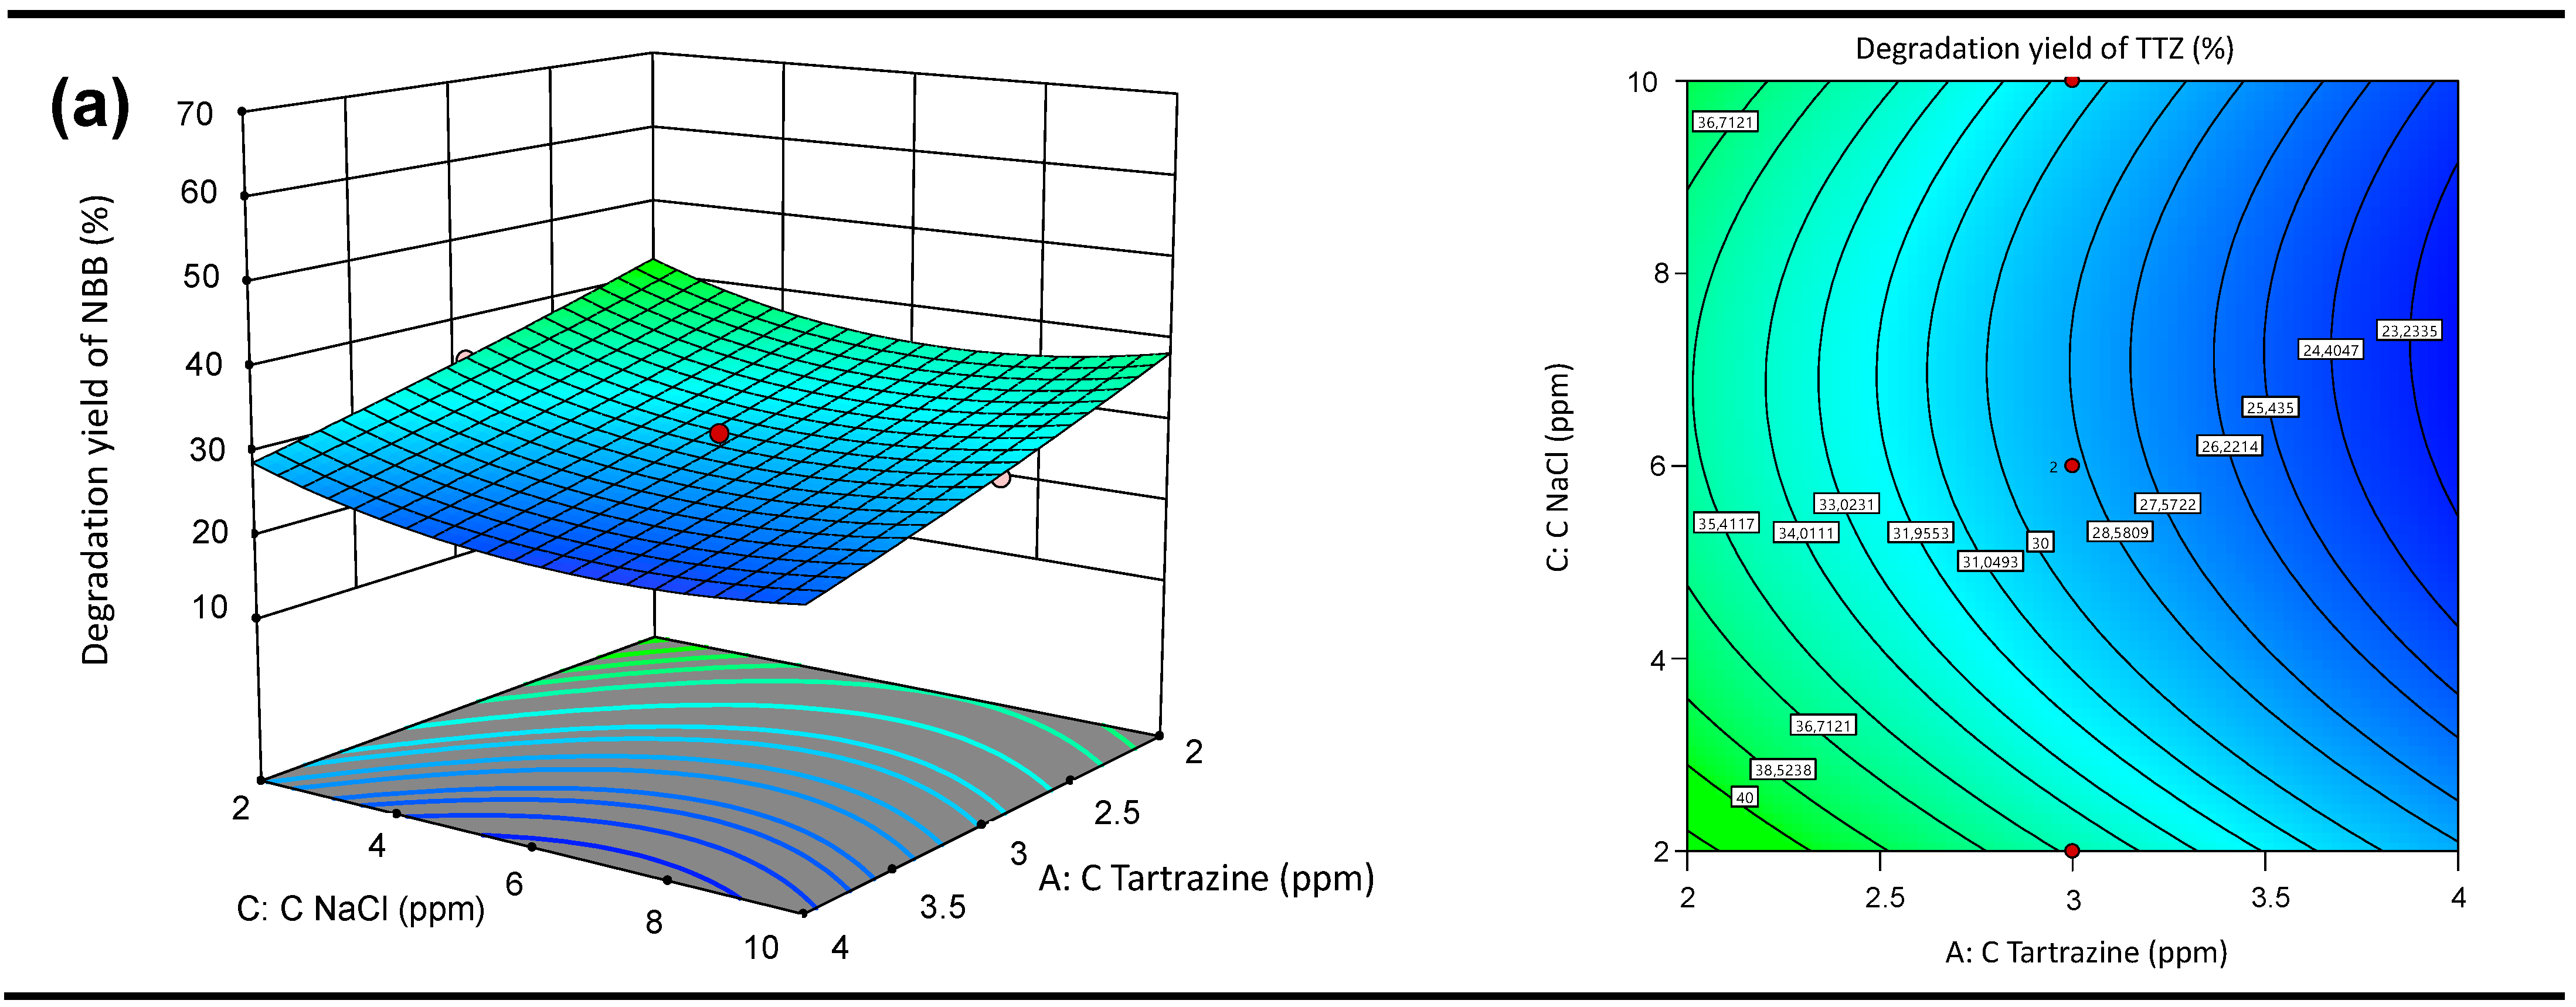
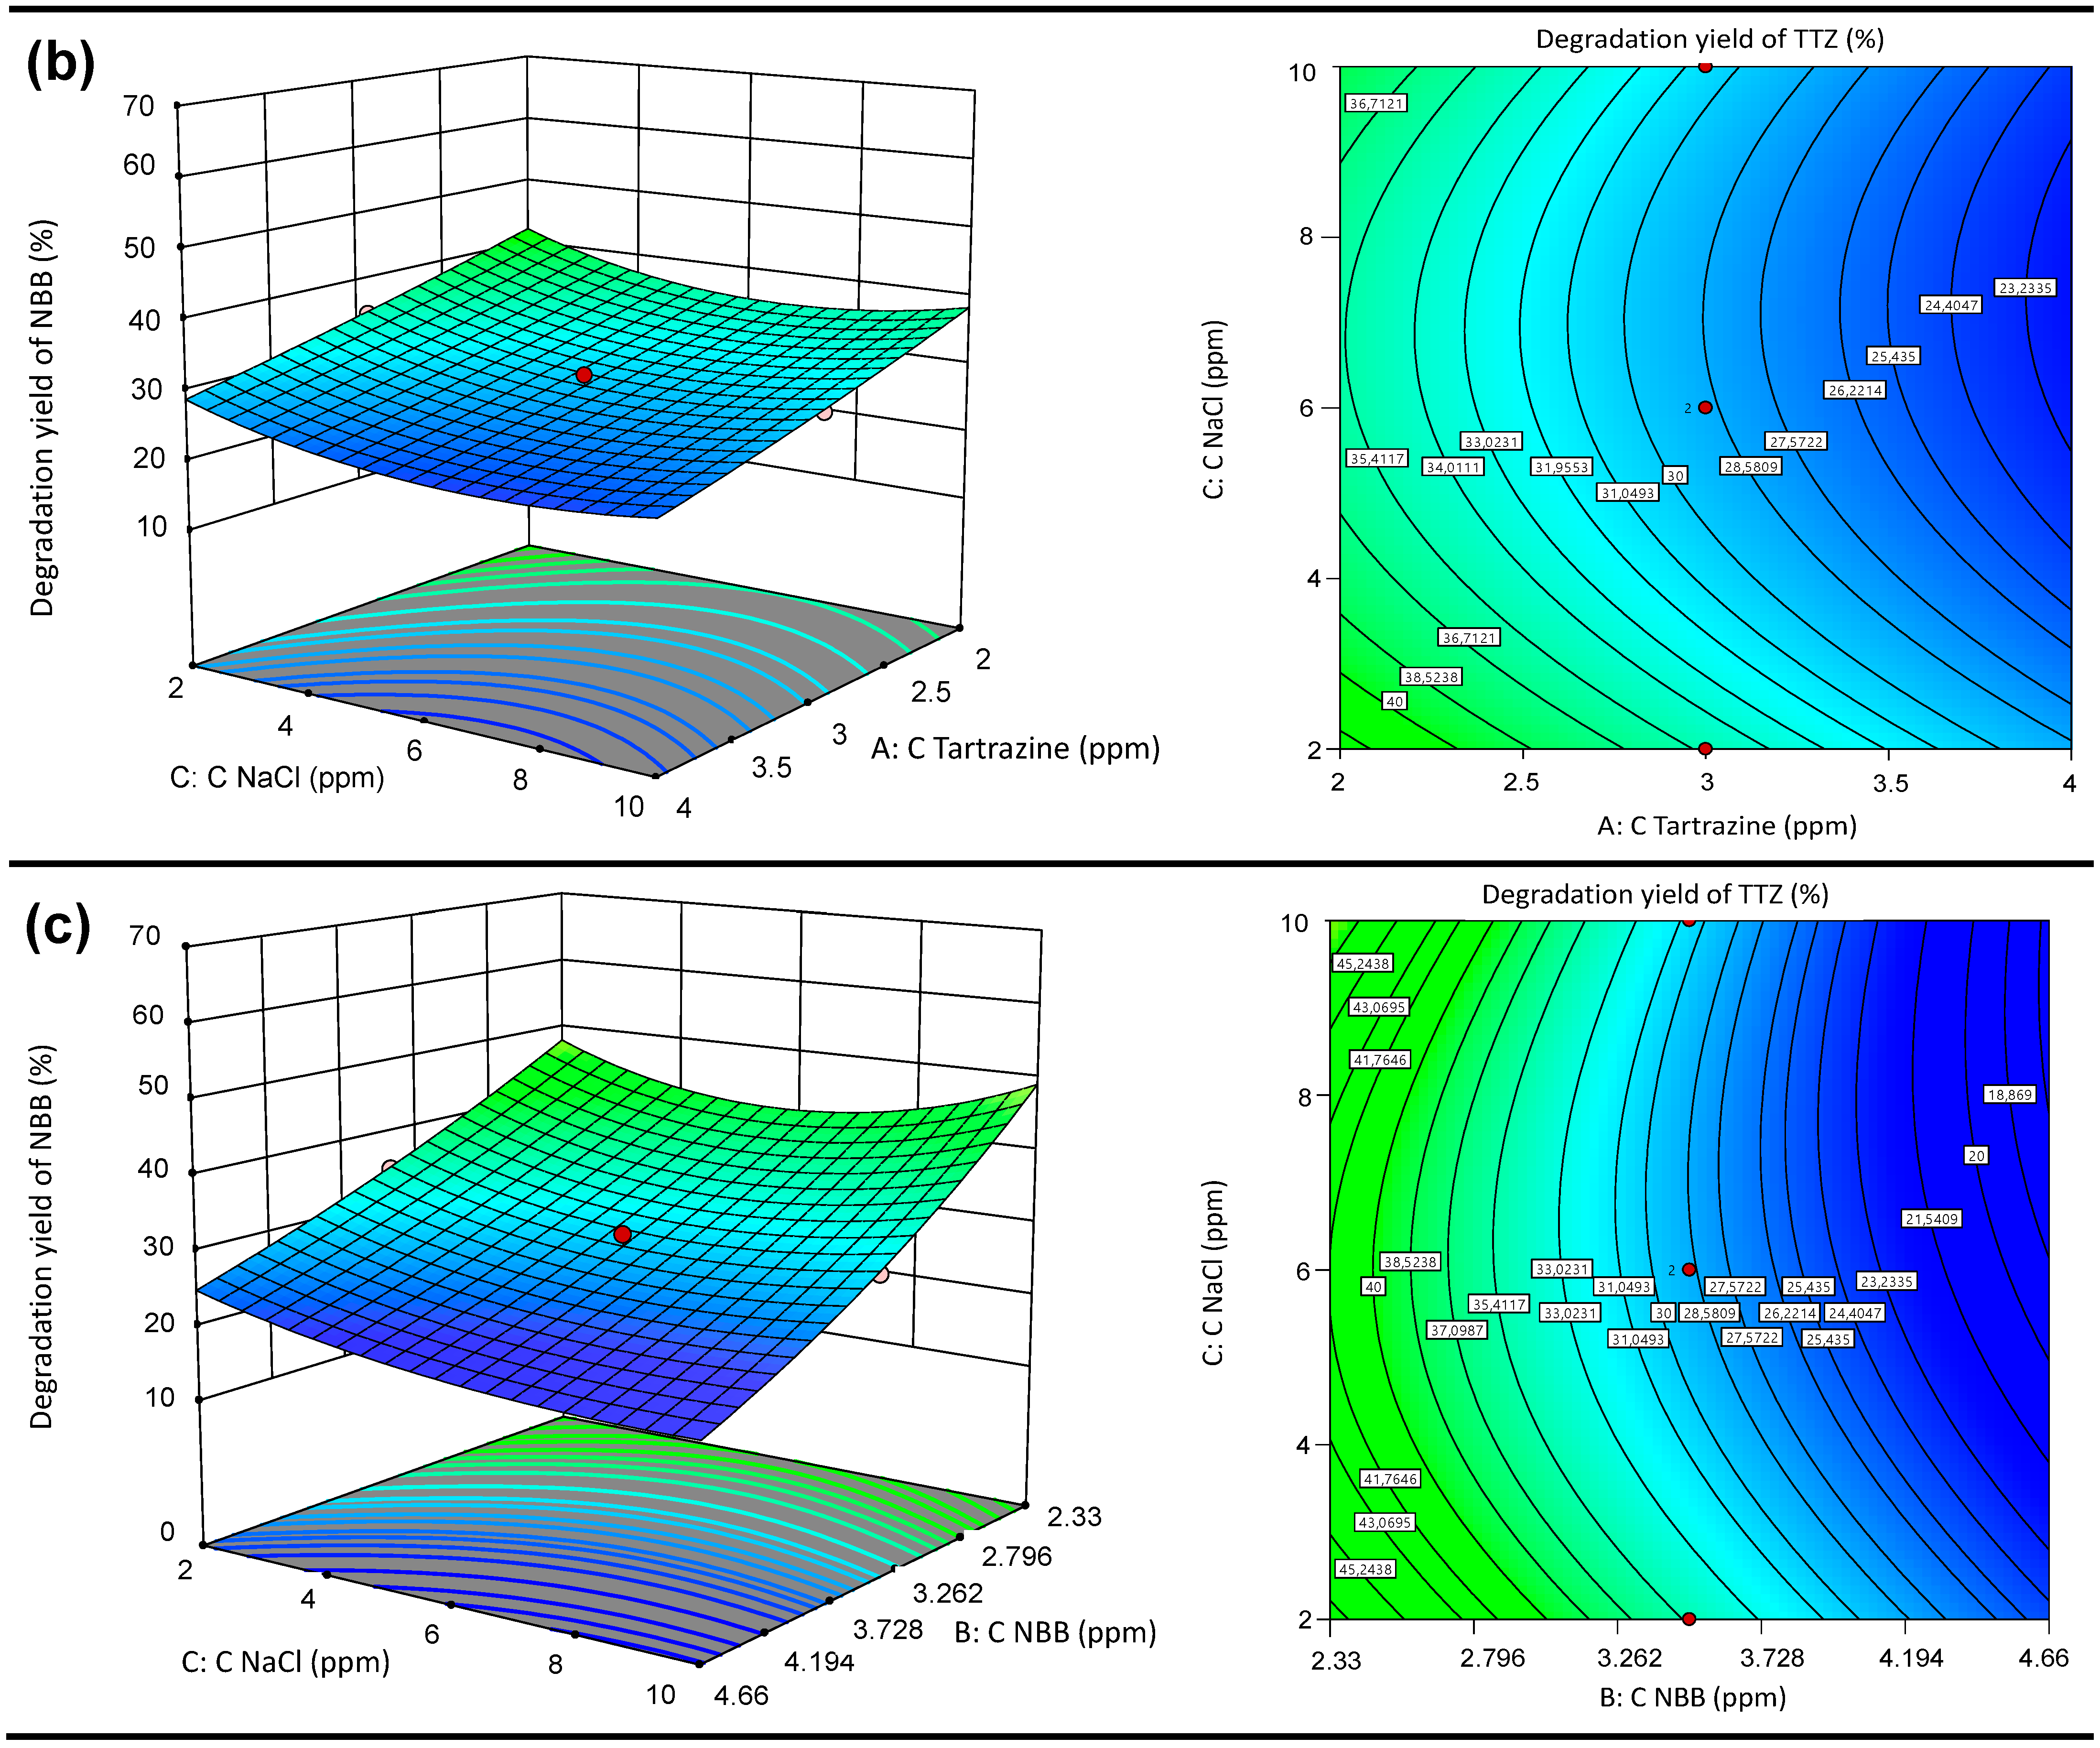
The 3D response surfaces and contours are graphical representations of the regression equation applied for optimizing the reaction conditions, and represent a very useful approach to revealing the factors affecting the reaction system. The results obtained from the combined interaction of three factors are shown in Figure 10 (TTZ) and Figure 11 (NBB).
Figure 10a and Figure 11a show the simultaneous influences of TTZ concentration and NBB concentration on the photodegradation of TTZ and NBB, respectively. As can be seen from the graphs, the interactive effects of TTZ concentration and NBB concentration on both TTZ and NBB removal reveal an exponential response surface. Furthermore, the combined effects of the factors suggest that TTZ and NBB removal rates decrease with increasing concentrations. The corresponding contour plots (Figure 10a ) were applied to facilitate a better understanding of the information relating to the interaction effect of the factors on the response. The green region tending towards yellow on the graph indicates maximum degradation.
Figure 10b and Figure 11b show the combined effects of TTZ concentration and NaCl salt interference on TTZ and NBB dye removal. It is evident that the percentage removal of TTZ and NBB exhibits an exponential response surface. The rate of photodegradation is high at low NaCl concentrations for both dyes, as shown in Figure 10c and Figure 11c. These results show that the response increases with decreasing dye and NaCl concentrations in the medium. The corresponding contour plots (Figure 10b,c and Figure 11b,c) give greater visibility to the factors influencing the response. The green area of the contour corresponds to a high percentage of elimination.

3.6. Mineralization

In order to evaluate TTZ mineralization in the presence of the synthesized TiO2-NS photocatalyst, the TOC removal yields were determined. The degradation efficiency and mineralization yield of TTZ versus the irradiation time are depicted in Figure 12. As can be seen in this last figure, the mineralization results obtained confirm the trend observed relating to contaminant degradation. Indeed, both degradation and mineralization yields increase with irradiation time. Obviously, the degradation of almost all total organic pollutants happens promptly, while TOC drops by only ~31% after 1 h of light exposure, which clearly shows the creation of intermediate transformation products [77,78]. On the other hand, in this study, a highly satisfying mineralization yield was obtained after 180 min, representing 53%. However, a longer irradiation time is necessary to reach the complete mineralization of the pollutant. Although further analysis is required to identify intermediate products, the overall mechanism remains as follows:
Pollutants + ROS → intermediate products
Intermediate products + ROS → CO2 + H2O + minerals ions

3.7. Reuse Test of Photocatalyst

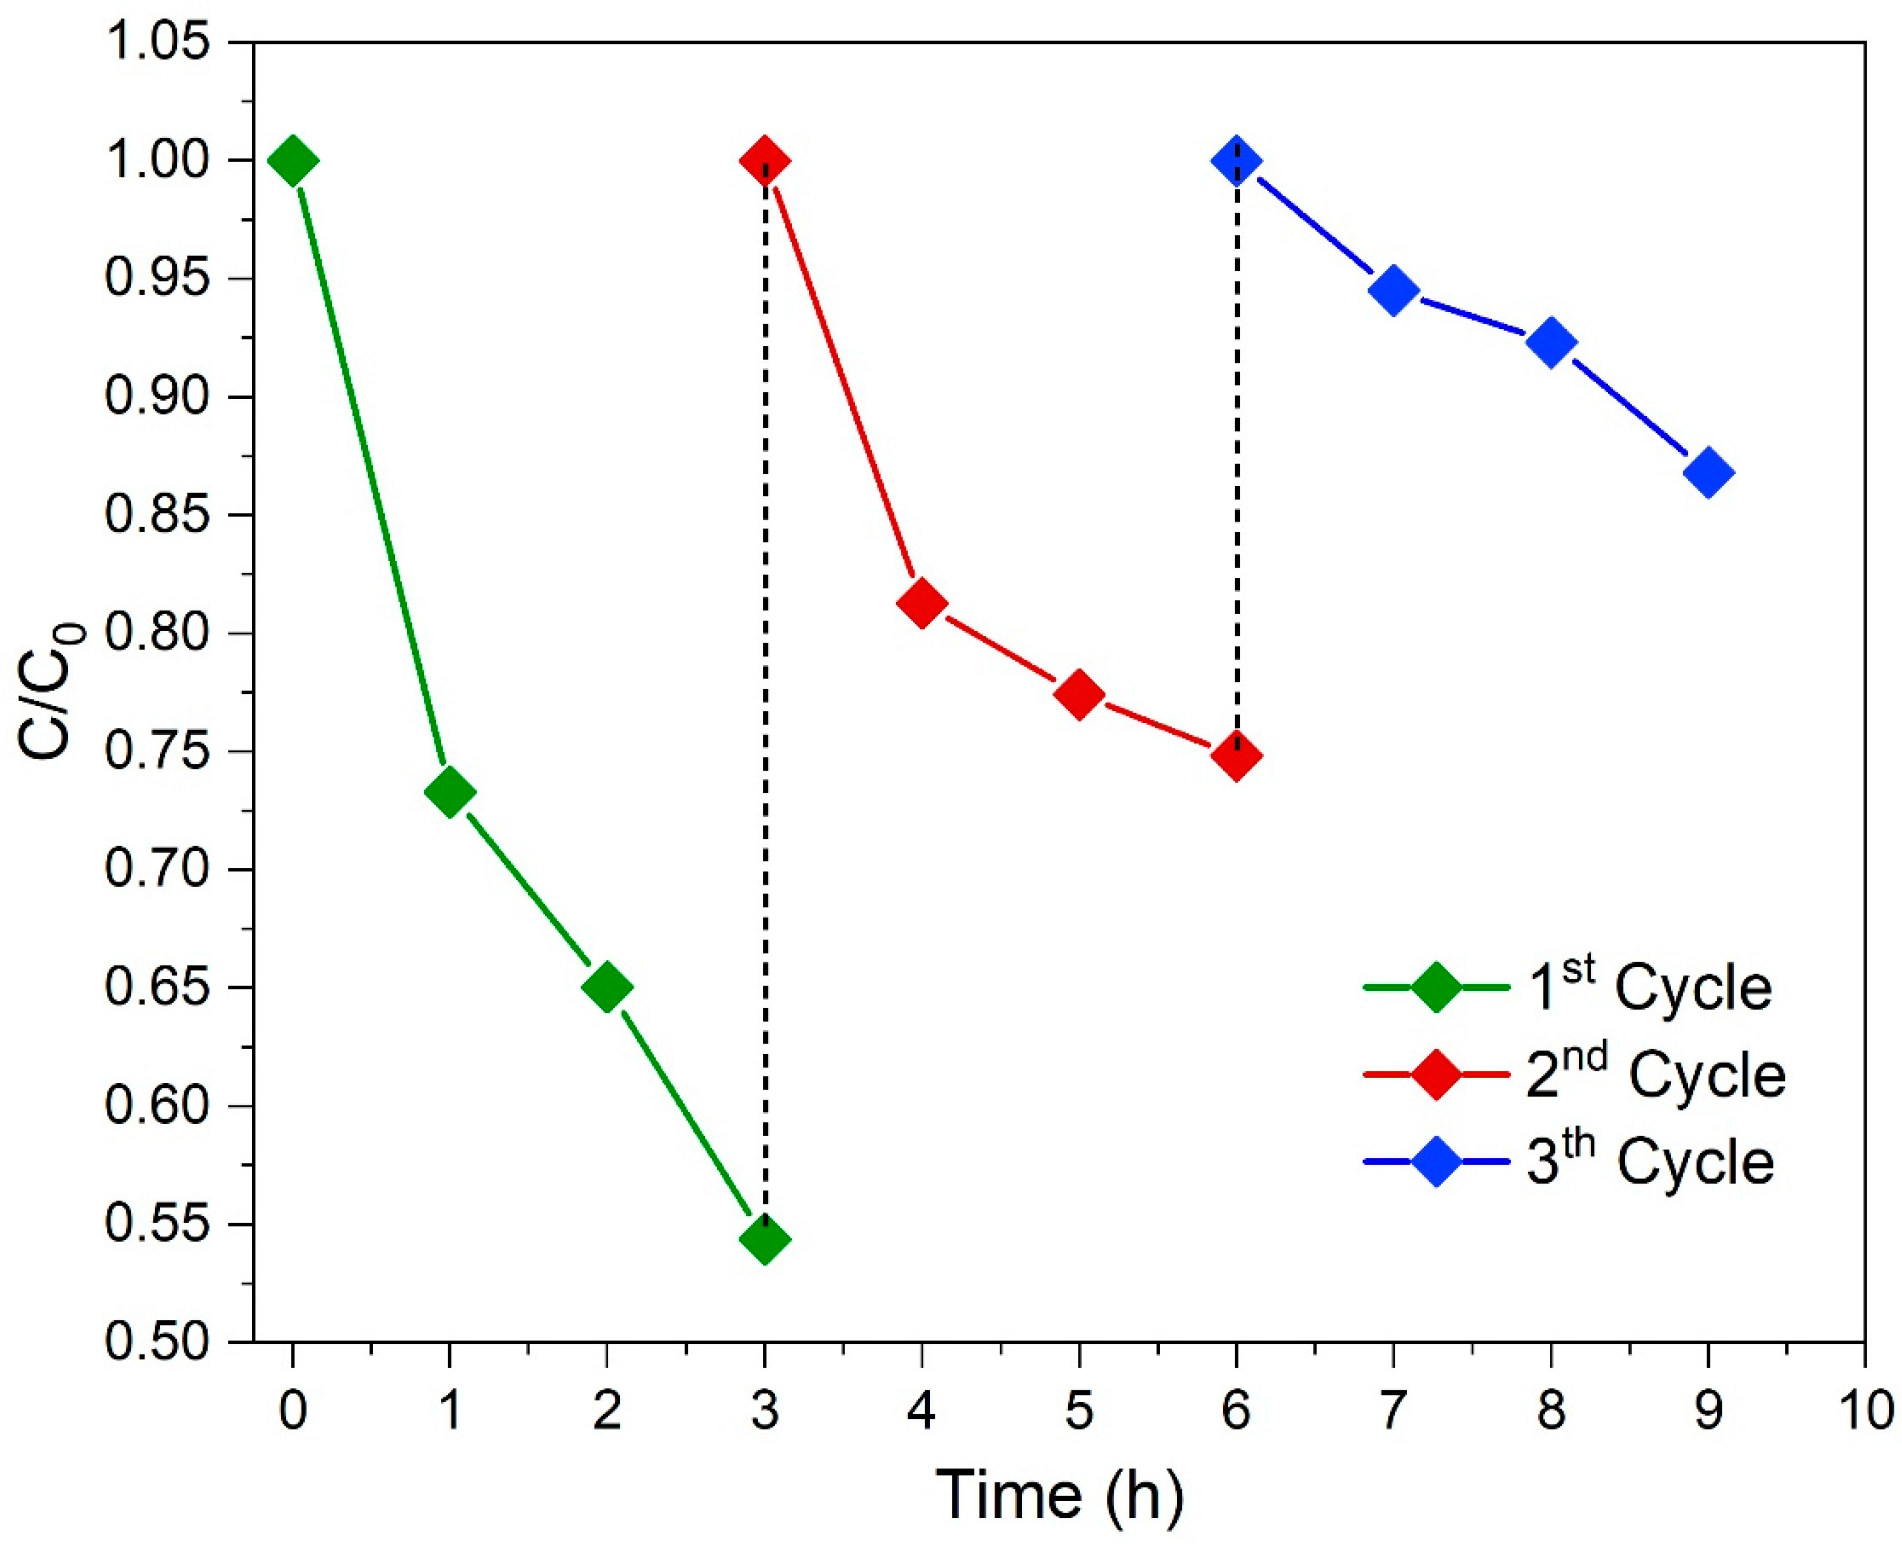
The reusability of the photocatalyst is a crucial factor from both environmental and financial perspectives [57]. In order to examine this parameter, TiO2-NS underwent three cycles of photocatalysis under the same operating conditions (TTZ concentration, photocatalyst dosage, and irradiation source). As can be seen in Figure 13, in the third cycle, the pollutant degradation decreased. The loss of photocatalyst active sites, the loss of matter during handling and physical solicitation, and irreversible chemical adsorption could explain the diminution in photoactivity of synthesized materials observed after each cycle [23]. After a certain number of cycles, the photocatalyst would not be reusable, but it has the advantage of being simple to synthesize, as well as inexpensive.

4. Conclusions

The structural modification of TiO2 is a promising route that can lead to a photocatalyst active in the visible range, which can be used in water treatment. The photocatalytic efficiency of TiO2 nanospheres used in the removal of TTZ dye has been successfully demonstrated. Characterization techniques provide information on surface chemistry and inorganic constituents (FTIR, XRF), crystallinity (Raman spectroscopy), morphology (SEM), specific surface area (BET), and band gap energy (DRS). The experimental data from the pseudo-first-order kinetic model best describe the degradation of TTZ by TiO2-NS. The optimized parameters obtained by RSM provide a better understanding of the combined effects of the factors in the reaction system in achieving optimum photodegradation process. Optimization using response surface methodology indicates that pollutant concentration is the most important factor, while NaCl salt interference had a much smaller effect on the photodegradation of the dyes TTZ and NBB. The analysis of variance in the BBD showed good statistical results and provided an effective model for the reaction system. The TiO2 nanospheres developed showed satisfactory performance in the removal of TTZ and NBB dyes by photocatalysis in the visible range. This study has identified a material that is effective in removing organic contaminants from wastewater. Consequently, its characteristics and qualities make it a suitable photocatalyst for wastewater treatment to remove contaminants.

Author Contributions

Conceptualization, S.D. and A.K.; methodology, H.Z.; software, A.A.; validation, P.B., S.D. and H.Z.; formal analysis, C.C.; investigation, B.T.; resources, F.H.; data curation, H.Z.; writing—original draft preparation, F.H.; writing—review and editing, S.D.; visualization, A.A.; supervision, P.B.; project administration, A.K.; funding acquisition, A.K. All authors have read and agreed to the published version of the manuscript.

Funding

The authors would like to acknowledge the Erasmus+ International Credit Mobility for the Grant (Grant agreement number: 2019-1-FR01-KA107-060920) between UniLaSalle Polytechnic Institute and University of Maroua. This work was supported by the International Research Center “Innovation Transportation and Production Systems” of the I-SITE CAP 20-25.

Data Availability Statement

Data are contained within the article.

Acknowledgments

The authors would like to thank Ivane LELIEVRE for her technical help and Marie-Anne Hairan for meticulously proofreading the English language of this paper (UniLaSalle-Ecole des Metirs de l’Environnement de Rennes). The authors thank Christelle Blavignac, Centre Imagerie Cellulaire Sante—UCA PARTNER, for her technical support and expertise.

Conflicts of Interest

The authors declare no conflict of interest.

References

  1. Patil, N.S.; Chetan, N.L.; Nataraja, M.; Suthar, S. Climate change scenarios and its effect on groundwater level in the Hiranyakeshi watershed, Groundw. Sustain. Dev. 2020, 10, 100323. [Google Scholar] [CrossRef]
  2. Adimalla, N.; Qian, H. Groundwater quality evaluation using water quality index (WQI) for drinking purposes and human health risk (HHR) assessment in an agricultural region of Nanganur, south India. Ecotoxicol. Environ. Saf. 2019, 176, 153–161. [Google Scholar] [CrossRef] [PubMed]
  3. Xia, L.; Zhang, K.; Wang, X.; Guo, Q.; Wu, Y.; Du, Y.; Zhang, L.; Xia, J.; Tang, H.; Zhang, X.; et al. 0D/2D Schottky junction synergies with 2D/2D S-scheme heterojunction strategy to achieve uniform separation of carriers in 0D/2D/2D quasi CNQDs/TCN/ZnIn2S4 towards photocatalytic remediating petroleum hydrocarbons polluted marine. Appl. Catal. B Environ. 2023, 325, 122387. [Google Scholar] [CrossRef]
  4. Zubair, M.; Aziz, H.A.; Ihsanullah, I.; Ahmad, M.A.; Al-Harthi, M.A. Biochar supported CuFe layered double hydroxide composite as a sustainable adsorbent for efficient removal of anionic azo dye from water. Environ. Technol. Innov. 2021, 23, 101614. [Google Scholar] [CrossRef]
  5. Rodriguez-Narvaez, O.M.; Peralta-Hernandez, J.M.; Goonetilleke, A.; Bandala, E.R. Treatment technologies for emerging contaminants in water: A review. Chem. Eng. J. 2017, 323, 361–380. [Google Scholar] [CrossRef]
  6. Gogoi, A.; Mazumder, P.; Tyagi, V.K.; Chaminda, G.G.T.; An, A.K.; Kumar, M. Occurrence and fate of emerging contaminants in water environment: A review. Groundw. Sustain. Dev. 2018, 6, 169–180. [Google Scholar] [CrossRef]
  7. Xia, L.; Sun, Z.; Wu, Y.; Yu, X.-F.; Cheng, J.; Zhang, K.; Sarina, S.; Zhu, H.-Y.; Weerathunga, H.; Zhang, L.; et al. Leveraging doping and defect engineering to modulate exciton dissociation in graphitic carbon nitride for photocatalytic elimination of marine oil spill. Chem. Eng. J. 2022, 439, 135668. [Google Scholar] [CrossRef]
  8. De Lima Barizão, A.C.; Silva, M.F.; Andrade, M.; Brito, F.C.; Gomes, R.G.; Bergamasco, R. Green synthesis of iron oxide nanoparticles for tartrazine and bordeaux red dye removal. J. Environ. Chem. Eng. 2020, 8, 103618. [Google Scholar] [CrossRef]
  9. Dalhatou, S.; Pétrier, C.; Laminsi, S.; Baup, S. Sonochemical removal of naphthol blue black azo dye: Influence of parameters and effect of mineral ions. Int. J. Environ. Sci. Technol. 2015, 12, 35–44. [Google Scholar] [CrossRef]
  10. Dalhatou, S.; Laminsi, S.; Pétrier, C.; Baup, S. Competition in sonochemical degradation of Naphthol Blue Black: Presence of an organic (nonylphenol) and a mineral (bicarbonate ions) matrix. J. Environ. Chem. Eng. 2019, 7, 102819. [Google Scholar] [CrossRef]
  11. Perveen, S.; Nadeem, R.; Nosheen, F.; Asjad, M.I.; Awrejcewicz, J.; Anwar, T. Biochar-Mediated Zirconium Ferrite Nanocomposites for Tartrazine Dye Removal from Textile Wastewater. Nanomaterials 2022, 12, 2828. [Google Scholar] [CrossRef] [PubMed]
  12. Nemiwal, M.; Zhang, T.C.; Kumar, D. Recent progress in g-C3N4, TiO2 and ZnO based photocatalysts for dye degradation: Strategies to improve photocatalytic activity. Sci. Total Environ. 2021, 767, 144896. [Google Scholar] [CrossRef] [PubMed]
  13. Ichipi, E.O.; Tichapondwa, S.M.; Chirwa, E.M.N. Plasmonic effect and bandgap tailoring of Ag/Ag2S doped on ZnO nanocomposites for enhanced visible-light photocatalysis. Adv. Powder Technol. 2022, 33, 103596. [Google Scholar] [CrossRef]
  14. Kanakaraju, D.; Glass, B.D.; Oelgemöller, M. Advanced oxidation process-mediated removal of pharmaceuticals from water: A review. J. Environ. Manag. 2018, 219, 189–207. [Google Scholar] [CrossRef]
  15. Olmez-Hanci, T.; Arslan-Alaton, I. Comparison of sulfate and hydroxyl radical based advanced oxidation of phenol. Chem. Eng. J. 2013, 224, 10–16. [Google Scholar] [CrossRef]
  16. Guaraldo, T.T.; Wenk, J.; Mattia, D. Photocatalytic ZnO Foams for Micropollutant Degradation. Adv. Sustain. Syst. 2021, 5, 2000208. [Google Scholar] [CrossRef]
  17. Zhu, D.; Zhou, Q. Action and mechanism of semiconductor photocatalysis on degradation of organic pollutants in water treatment: A review, Environ. Nanotechnology. Monit. Manag. 2019, 12, 100255. [Google Scholar] [CrossRef]
  18. Sharma, K.; Raizada, P.; Hasija, V.; Singh, P.; Bajpai, A.; Nguyen, V.H.; Rangabhashiyam, S.; Kumar, P.; Nadda, A.K.; Kim, S.Y.; et al. ZnS-based quantum dots as photocatalysts for water purification. J. Water Process Eng. 2021, 43, 102217. [Google Scholar] [CrossRef]
  19. Sajid, M.M.; Shad, N.A.; Javed, Y.; Khan, S.B.; Zhang, Z.; Amin, N.; Zhai, H. Preparation and characterization of Vanadium pentoxide (V2O5) for photocatalytic degradation of monoazo and diazo dyes. Surf. Interfaces 2020, 19, 100502. [Google Scholar] [CrossRef]
  20. Hitam, C.N.C.; Jalil, A.A. A review on exploration of Fe2O3 photocatalyst towards degradation of dyes and organic contaminants. J. Environ. Manag. 2020, 258, 110050. [Google Scholar] [CrossRef]
  21. Goktas, S.; Goktas, A. A comparative study on recent progress in efficient ZnO based nanocomposite and heterojunction photocatalysts: A review. J. Alloys Compd. 2021, 863, 158734. [Google Scholar] [CrossRef]
  22. Paumo, H.K.; Dalhatou, S.; Katata-Seru, L.M.; Kamdem, B.P.; Tijani, J.O.; Vishwanathan, V.; Kane, A.; Bahadur, I. TiO2 assisted photocatalysts for degradation of emerging organic pollutants in water and wastewater. J. Mol. Liq. 2021, 331, 115458. [Google Scholar] [CrossRef]
  23. Hsu, C.-Y.; Mahmoud, Z.H.; Abdullaev, S.; Ali, F.K.; Naeem, Y.A.; Mizher, R.M.; Karim, M.M.; Abdulwahid, A.S.; Ahmadi, Z.; Habibzadeh, S.; et al. Nano titanium oxide (nano-TiO2): A review of synthesis methods, properties, and applications. Case Stud. Chem. Environ. Eng. 2024, 9, 100626. [Google Scholar] [CrossRef]
  24. Pelaez, M.; Nolan, N.T.; Pillai, S.C.; Seery, M.K.; Falaras, P.; Kontos, A.G.; Dunlop, P.S.M.; Hamilton, J.W.J.; Byrne, J.A.; O’Shea, K.; et al. A review on the visible light active titanium dioxide photocatalysts for environmental applications. Appl. Catal. B Environ. 2012, 125, 331–349. [Google Scholar] [CrossRef]
  25. Al Zoubi, W.; Al-Hamdani, A.A.S.; Sunghun, B.; Ko, Y.G. A review on TiO2-based composites for superior photocatalytic activity. Rev. Inorg. Chem. 2021, 41, 213–222. [Google Scholar] [CrossRef]
  26. Ibhadon, A.O.; Fitzpatrick, P. Heterogeneous photocatalysis: Recent advances and applications. Catalysts 2013, 3, 189–218. [Google Scholar] [CrossRef]
  27. Karthigadevi, G.; Manikandan, S.; Karmegam, N.; Subbaiya, R.; Chozhavendhan, S.; Ravindran, B.; Chang, S.W.; Awasthi, M.K. Chemico-nanotreatment methods for the removal of persistent organic pollutants and xenobiotics in water—A review. Bioresour. Technol. 2021, 324, 124678. [Google Scholar] [CrossRef]
  28. Nyamukamba, P.; Okoh, O.; Mungondori, H.; Taziwa, R.; Zinya, S. Synthetic Methods for Titanium Dioxide Nanoparticles: A Review. In Titanium Dioxide-Material for a Sustainable Environment; IntechOpen: Rijeka, Croatia, 2018. [Google Scholar] [CrossRef]
  29. Irshad, M.A.; Nawaz, R.; Rehman, M.Z.U.; Adrees, M.; Rizwan, M.; Ali, S.; Ahmad, S.; Tasleem, S. Synthesis, characterization and advanced sustainable applications of titanium dioxide nanoparticles: A review. Ecotoxicol. Environ. Saf. 2021, 212, 111978. [Google Scholar] [CrossRef] [PubMed]
  30. Gupta, T.; Samriti; Cho, J.; Prakash, J. Hydrothermal synthesis of TiO2 nanorods: Formation chemistry, growth mechanism, and tailoring of surface properties for photocatalytic activities. Mater. Today Chem. 2021, 20, 100428. [Google Scholar] [CrossRef]
  31. Guo, W.; Zhang, F.; Lin, C.; Wang, Z.L. Direct growth of TiO2 nanosheet arrays on carbon fibers for highly efficient photocatalytic degradation of methyl orange. Adv. Mater. 2012, 24, 4761–4764. [Google Scholar] [CrossRef]
  32. Konni, M.; Dwarapureddi, B.K.; Dash, S.; Raj, A.; Karnena, M.K. Titanium dioxide electrospun nanofibers for dye removal-A review. J. Appl. Nat. Sci. 2022, 14, 450–458. [Google Scholar] [CrossRef]
  33. Shehab, M.A.; Sharma, N.; Valsesia, A.; Karacs, G.; Kristály, F.; Koós, T.; Leskó, A.K.; Nánai, L.; Hernadi, K.; Németh, Z. Preparation and photocatalytic performance of TiO2 nanowire-based self-supported hybrid membranes. Molecules 2022, 27, 2951. [Google Scholar] [CrossRef] [PubMed]
  34. Assadi, A.A.; Karoui, S.; Trabelsi, K.; Hajjaji, A.; Elfalleh, W.; Ghorbal, A.; Maghzaoui, M.; Assadi, A.A. Performance for Wastewater Treatment under Visible Light. Materials 2022, 15, 1463. [Google Scholar] [CrossRef] [PubMed]
  35. Huang, D.; Liu, H.; Bian, J.; Li, T.; Huang, B.; Niu, Q. High Specific Surface Area TiO2 Nanospheres for Hydrogen Production and Photocatalytic Activity. J. Nanosci. Nanotechnol. 2019, 20, 3217–3224. [Google Scholar] [CrossRef] [PubMed]
  36. Srinivasan, M.; White, T. Degradation of Methylene Blue by Three-Dimensionally Ordered Macroporous Titania. Environ. Sci. Technol. 2007, 41, 4405–4409. [Google Scholar] [CrossRef] [PubMed]
  37. Wang, X.; Caruso, R.A. Enhancing photocatalytic activity of titania materials by using porous structures and the addition of gold nanoparticles. J. Mater. Chem. 2011, 21, 20–28. [Google Scholar] [CrossRef]
  38. Pugazhenthiran, N.; Murugesan, S.; Valdés, H.; Selvaraj, M.; Sathishkumar, P.; Smirniotis, P.G.; Anandan, S.; Mangalaraja, R.V. Photocatalytic oxidation of ceftiofur sodium under UV–visible irradiation using plasmonic porous Ag-TiO2 nanospheres. J. Ind. Eng. Chem. 2022, 105, 384–392. [Google Scholar] [CrossRef]
  39. Haider, A.J.; Al-Anbari, R.H.; Kadhim, G.R.; Salame, C.T. Exploring potential Environmental applications of TiO2 Nanoparticles. Energy Procedia 2017, 119, 332–345. [Google Scholar] [CrossRef]
  40. Askari, M.B.; Banizi, Z.T.; Seifi, M.; Dehaghi, S.B.; Veisi, P. Synthesis of TiO2 nanoparticles and decorated multi-wall carbon nanotube (MWCNT) with anatase TiO2 nanoparticles and study of optical properties and structural characterization of TiO2/MWCNT nanocomposite. Optik 2017, 149, 447–454. [Google Scholar] [CrossRef]
  41. Kader, S.; Al-Mamun, M.R.; Suhan, M.B.K.; Shuchi, S.B.; Islam, M.S. Enhanced photodegradation of methyl orange dye under UV irradiation using MoO3 and Ag doped TiO2 photocatalysts. Environ. Technol. Innov. 2022, 27, 102476. [Google Scholar] [CrossRef]
  42. Rahimnejad, S.; Setayesh, S.R.; Gholami, M.R. A credible role of copper oxide on structure of nanocrystalline mesoporous titanium dioxide. J. Iran. Chem. Soc. 2008, 5, 367–374. [Google Scholar] [CrossRef]
  43. Yuan, Y.J.; Shen, Z.; Wu, S.; Su, Y.; Pei, L.; Ji, Z.; Ding, M.; Bai, W.; Chen, Y.; Yu, Z.T.; et al. Liquid exfoliation of g-C3N4 nanosheets to construct 2D-2D MoS2/g-C3N4 photocatalyst for enhanced photocatalytic H2 production activity. Appl. Catal. B Environ. 2019, 246, 120–128. [Google Scholar] [CrossRef]
  44. Talami, B.; Zeghioud, H.; Dalhatou, S.; Bonnet, P.; Caperaa, C.; Ligny, R.; Assadi, A.A.; Massai, H.; Kane, A. A new sunlight active photocatalyst based on CuO-TiO2-Clay composite for wastewater remediation: Mechanistic insights and degradation optimization. Water Air Soil Pollut. 2024, 235, 104. [Google Scholar] [CrossRef]
  45. Perarasan, T.; Peter, I.J.; Kumar, A.M.; Rajamanickam, N.; Ramachandran, K.; Mohan, C.R. Copper doped titanium dioxide for enhancing the photovoltaic behavior in solar cell. Mater. Today Proc. 2019, 35, 66–68. [Google Scholar] [CrossRef]
  46. Yoong, L.S.; Chong, F.K.; Dutta, B.K. Development of copper-doped TiO2 photocatalyst for hydrogen production under visible light. Energy 2009, 34, 1652–1661. [Google Scholar] [CrossRef]
  47. Liang, J.; Wang, J.; Yu, K.; Song, K.; Wang, X.; Liu, W.; Hou, J.; Liang, C. Enhanced photocatalytic performance of Nd3+-doped TiO2 nanosphere under visible light. Chem. Phys. 2020, 528, 110538. [Google Scholar] [CrossRef]
  48. Ma, H.; Zheng, W.; Yan, X.; Li, S.; Zhang, K.; Liu, G.; Jiang, L. Polydopamine-induced fabrication of Ag-TiO2 hollow nanospheres and their application in visible-light photocatalysis. Colloids Surf. A Physicochem. Eng. Asp. 2020, 586, 2–7. [Google Scholar] [CrossRef]
  49. Kerour, A.; Boudjadar, S.; Bourzami, R.; Allouche, B. Eco-friendly synthesis of cuprous oxide (Cu2O) nanoparticles and improvement of their solar photocatalytic activities. J. Solid State Chem. 2018, 263, 79–83. [Google Scholar] [CrossRef]
  50. Javanroudi, S.R.; Fattahi, N.; Sharafi, K.; Arfaeinia, H.; Moradi, M. Chalcopyrite as an oxidants activator for organic pollutant remediation: A review of mechanisms, parameters, and future perspectives. Heliyon 2023, 9, e19992. [Google Scholar] [CrossRef]
  51. Kiwaan, H.A.; Atwee, T.M.; Azab, E.A.; El-Bindary, A.A. Photocatalytic degradation of organic dyes in the presence of nanostructured titanium dioxide. J. Mol. Struct. 2020, 1200, 127115. [Google Scholar] [CrossRef]
  52. Isai, K.A.; Shrivastava, V.S. Photocatalytic degradation of methylene blue using ZnO and 2%Fe–ZnO semiconductor nanomaterials synthesized by sol–gel method: A comparative study. SN Appl. Sci. 2019, 1, 1247. [Google Scholar] [CrossRef]
  53. Baaloudj, O.; Nasrallah, N.; Kebir, M.; Khezami, L.; Amrane, A.; Assadi, A.A. A comparative study of ceramic nanoparticles synthesized for antibiotic removal: Catalysis characterization and photocatalytic performance modeling. Environ. Sci. Pollut. Res. 2021, 28, 13900–13912. [Google Scholar] [CrossRef]
  54. Aissani, T.; Yahiaoui, I.; Boudrahem, F.; Cherif, L.Y.; Fourcad, F.; Amrane, A.; Aissani-Benissad, F. Sulfamethazine degradation by heterogeneous photocatalysis with ZnO immobilized on a glass plate using the heat attachment method and its impact on the biodegradability. React. Kinet. Mech. Catal. 2020, 131, 471–487. [Google Scholar] [CrossRef]
  55. Zeghioud, H.; Khellaf, N.; Amrane, A.; Djelal, H.; Elfalleh, W.; Assadi, A.A.; Rtimi, S. Photocatalytic performance of TiO2 impregnated polyester for the degradation of Reactive Green 12: Implications of the surface pretreatment and the microstructure. J. Photochem. Photobiol. A Chem. 2017, 346, 493–501. [Google Scholar] [CrossRef]
  56. Mouhamadou, S.; Dalhatou, S.; Obada, D.O.; Fryda, L.; Mahieu, A.; Bonnet, P.; Caperaa, C.; Kane, A.; Massai, H.; Zeghioud, H. Synthesis of piliostigma reticulatum decorated TiO2 based composite and its application towards Cr(VI) adsorption and bromophenol blue degradation: Nonlinear kinetics, equilibrium modelling and optimisation photocatalytic parameters. J. Environ. Chem. Eng. 2023, 11, 109273. [Google Scholar] [CrossRef]
  57. Almansba, A.; Kane, A.; Nasrallah, N.; Maachi, R.; Lamaa, L.; Peruchon, L.; Brochier, C.; Béchohra, I.; Amrane, A.; Assadi, A.A. Innovative photocatalytic luminous textiles optimized towards water treatment: Performance evaluation of photoreactors. Chem. Eng. J. 2021, 416, 129195. [Google Scholar] [CrossRef]
  58. Kumar, K.V.; Porkodi, K.; Rocha, F. Langmuir-Hinshelwood kinetics—A theoretical study. Catal. Commun. 2008, 9, 82–84. [Google Scholar] [CrossRef]
  59. Almansba, A.; Kane, A.; Nasrallah, N.; Wilson, J.M.; Maachi, R.; Lamaa, L.; Peruchon, L.; Brochier, C.; Amrane, A.; Assadi, A.A. An engineering approach towards the design of an innovative compact photo-reactor for antibiotic removal in the frame of laboratory and pilot-plant scale. J. Photochem. Photobiol. A Chem. 2021, 418, 113445. [Google Scholar] [CrossRef]
  60. Nasr, O.; Mohamed, O.; Al-Shirbini, A.S.; Abdel-Wahab, A.M. Photocatalytic degradation of acetaminophen over Ag, Au and Pt loaded TiO2 using solar light. J. Photochem. Photobiol. A Chem. 2019, 374, 185–193. [Google Scholar] [CrossRef]
  61. Tamaddon, F.; Nasiri, A.; Yazdanpanah, G. Photocatalytic degradation of ciprofloxacin using CuFe2O4@methyl cellulose based magnetic nanobiocomposite. MethodsX 2020, 7, 74–81. [Google Scholar] [CrossRef]
  62. Singh, P.; Vishnu, M.C.; Sharma, K.K.; Borthakur, A.; Srivastava, P.; Pal, D.B.; Tiwary, D.; Mishra, P.K. Photocatalytic degradation of Acid Red dye stuff in the presence of activated carbon-TiO2 composite and its kinetic enumeration. J. Water Process Eng. 2016, 12, 20–31. [Google Scholar] [CrossRef]
  63. Chekir, N.; Tassalit, D.; Benhabiles, O.; Merzouk, N.K.; Ghenna, M.; Abdessemed, A.; Issaadi, R. A comparative study of tartrazine degradation using UV and solar fixed bed reactors. Int. J. Hydrogen Energy 2017, 42, 8948–8954. [Google Scholar] [CrossRef]
  64. Zyoud, A.H.; Zubi, A.; Hejjawi, S.; Zyoud, S.H.; Helal, M.H.; Zyoud, S.H.; Qamhieh, N.; Hajamohideen, A.R.; Hilal, H.S. Removal of acetaminophen from water by simulated solar light photodegradation with ZnO and TiO2 nanoparticles: Catalytic efficiency assessment for future prospects. J. Environ. Chem. Eng. 2020, 8, 104038. [Google Scholar] [CrossRef]
  65. Surya, L.; Sheilatin; Praja, P.V.; Sepia, N.S. Preparation and characterization of titania/bentonite composite application on the degradation of naphthol blue black dye. Res. J. Chem. Environ. 2018, 22, 48–53. [Google Scholar]
  66. Essandoh, M.; Garcia, R.A. Efficient removal of dyes from aqueous solutions using a novel hemoglobin/iron oxide composite. Chemosphere 2018, 206, 502–512. [Google Scholar] [CrossRef]
  67. Ahmedi, A.; Abouseoud, M.; Couvert, A.; Amrane, A. Enzymatic degradation of Congo Red by turnip (Brassica rapa) peroxidase. Z. Naturforsch. Sect. C J. Biosci. 2012, 67, 429–436. [Google Scholar] [CrossRef]
  68. Christy, E.J.S.; Amalraj, A.; Rajeswari, A.; Pius, A. Enhanced photocatalytic performance of Zr(IV) doped ZnO nanocomposite for the degradation efficiency of different azo dyes. Environ. Chem. Ecotoxicol. 2021, 3, 31–41. [Google Scholar] [CrossRef]
  69. Dhatshanamurthi, P.; Shanthi, M. Enhanced photocatalytic degradation of azo dye in aqueous solutions using Ba@Ag@ZnO nanocomposite for self-sensitized under sunshine irradiation. Int. J. Hydrogen Energy 2017, 42, 5523–5536. [Google Scholar] [CrossRef]
  70. Rauf, M.A.; Meetani, M.A.; Hisaindee, S. An overview on the photocatalytic degradation of azo dyes in the presence of TiO2 doped with selective transition metals. Desalination 2011, 276, 13–27. [Google Scholar] [CrossRef]
  71. Karthikeyan, P.; Elanchezhiyan, S.S.D.; Ali, H.; Banu, T.; Farzana, M.H.; Min, C. Chemosphere Hydrothermal synthesis of hydroxyapatite-reduced graphene oxide (1D e 2D) hybrids with enhanced selective adsorption properties for methyl orange and hexavalent chromium from aqueous solutions. Chemosphere 2021, 276, 130200. [Google Scholar] [CrossRef]
  72. Hassan, F.; Bonnet, P.; Marie, J.; Dikdim, D.; Bandjoun, N.G.; Caperaa, C.; Dalhatou, S.; Kane, A.; Zeghioud, H. Synthesis and Investigation of TiO2/g-C3N4 Performance for Photocatalytic Degradation of Bromophenol Blue and Eriochrome Black T: Experimental Design Optimization and Reactive Oxygen Species Contribution. Water 2022, 14, 3331. [Google Scholar] [CrossRef]
  73. Shahnaz, T.; Sharma, V.; Subbiah, S.; Narayanasamy, S. Multivariate optimisation of Cr (VI), Co (III) and Cu (II) adsorption onto nanobentonite incorporated nanocellulose/chitosan aerogel using response surface methodology. J. Water Process Eng. 2020, 36, 101283. [Google Scholar] [CrossRef]
  74. Zhang, J.; Fu, D.; Xu, Y.; Liu, C. Optimization of parameters on photocatalytic degradation of chloramphenicol using TiO2 as photocatalyist by response surface methodology. J. Environ. Sci. 2010, 22, 1281–1289. [Google Scholar] [CrossRef] [PubMed]
  75. Çatlıoğlu, F.; Akay, S.; Turunç, E.; Gözmen, B.; Anastopoulos, I.; Kayan, B.; Kalderis, D. Preparation and application of Fe-modified banana peel in the adsorption of methylene blue: Process optimization using response surface methodology. Environ. Nanotechnol. Monit. Manag. 2021, 16, 100517. [Google Scholar] [CrossRef]
  76. Sohrabi, S.; Akhlaghian, F. Modeling and optimization of phenol degradation over copper-doped titanium dioxide photocatalyst using response surface methodology. Process Saf. Environ. Prot. 2016, 99, 120–128. [Google Scholar] [CrossRef]
  77. Evgenidou, E.; Chatzisalata, Z.; Tsevis, A.; Bourikas, K.; Torounidou, P.; Sergelidis, D.; Koltsakidou, A.; Lambropoulou, D.A. Photocatalytic degradation of a mixture of eight antibiotics using Cu-modified TiO2 photocatalysts: Kinetics, mineralization, antimicrobial activity elimination and disinfection. J. Environ. Chem. Eng. 2021, 9, 105295. [Google Scholar] [CrossRef]
  78. Malesic-Eleftheriadou, N.; Evgenidou, E.; Kyzas, G.Z.; Bikiaris, D.N.; Lambropoulou, D.A. Removal of antibiotics in aqueous media by using new synthesized bio-based poly(ethylene terephthalate)-TiO2 photocatalysts. Chemosphere 2019, 234, 746–755. [Google Scholar] [CrossRef]
Figure 1. (a) XRD diffractogram, (b) Raman spectra, (c) FTIR spectra and (d) Elemental Composition of TiO2−NS.
Chemengineering 08 00050 g001
Figure 2. SEM images of TiO2-NS at different magnifications: (a) ×33,000 (0.5 μm), (b) ×18,000 (1 μm), (c) ×12,000 (1 μm) and (d) ×6000 (2 μm).
Chemengineering 08 00050 g002
Figure 3. (a) Diffuse reflectance spectra and (b) Plot of transferred Kubelka-Munk Versus energy of TiO2−NS.
Chemengineering 08 00050 g003
Figure 4. Adsorption equilibrium and photocatalytic degradation of tartrazine with TiO2−NS catalyst under UV and visible light (C0: 5 ppm. CTiO2−NS: 0.2 g/L. V: 200 mL. natural pH: 6).
Chemengineering 08 00050 g004
Figure 5. Effect of catalyst dose on tartrazine degradation under visible light (C0: 5 ppm. Vsolution: 200 mL. Natural pH: 6).
Chemengineering 08 00050 g005
Figure 6. (a) Effect of initial Tartrazine concentration with 200 mL of solution and 40 mg of catalyst at natural pH, under visible light irradiation; (b) PFO kinetics for tartrazine degradation under visible light ([TTZ]0 = 2–12 ppm. Vsolution: 200 mL. Natural pH: 6. CTiO2-NS: 0.2 g/L. Reaction time = 180 min), (c) Langmuir–Hinshelwood plot for photodegradation of tartrazine under visible light ([TTZ]0 = 2–12 ppm. Vsolution: 200 mL.Natural pH: 6. CTiO2-NS: 0.2 g/L. Reaction time = 180 min).
Chemengineering 08 00050 g006
Figure 7. Photocatalytic degradation of binary solution of TTZ and NBB with TiO2 nanosphere catalyst under visible light at different pH values (CTTZ: 2 ppm. CNBB: 2.33 ppm. CTiO2-NS: 0.2 g/L. Vsolution: 200 mL. Treatment duration: 120 min, 10 ppm of NaCl presence).
Chemengineering 08 00050 g007
Figure 8. (a) Photocatalytic degradation of Tartrazine (TTZ) (CNBB: 2.33 ppm. mTiO2-NS: 40 mg. Vsolution: 200 mL. Natural pH: 6, 10 ppm of NaCl presence) and of (b) Naphthol Blue Black (NBB) (CTTZ: 2 ppm. mTiO2-NS: 40 mg. Vsolution: 200 mL. natural pH: 6, 10 ppm of NaCl presence) in binary solution under visible light.
Chemengineering 08 00050 g008
Figure 9. Predicted vs. experimental results of degradation efficiency in binary system: (a) Tartrazine; (b) Naphthol Blue Black.
Chemengineering 08 00050 g009
Figure 10. RSM surfaces plots and 2D contour plots of the interaction effects between: (a) TTZ and NBB concentrations; (b) TTZ and NaCl concentrations and (c) NaCl and NBB concentrations.
Chemengineering 08 00050 g010aChemengineering 08 00050 g010b
Figure 11. RSM surfaces plots and 2D contour plots of the interaction effects between (a) NBB and TTZ concentrations; (b) NaCl and Tartrazine concentrations; and (c) NBB and NaCl concentrations.
Chemengineering 08 00050 g011aChemengineering 08 00050 g011b
Figure 12. Mineralization of tartrazine with TiO2 nanosphere catalyst under visible light (C0: 6 ppm. CTiO2-NS: 0.2 g/L. Vsolution: 200 mL. Natural pH: 6).
Chemengineering 08 00050 g012
Figure 13. Reusability cycles of TiO2-NS for photocatalytic degradation of tartrazine under visible light (C0: 6 ppm. mTiO2-NS: 100 mg. Vsolution: 200 mL. natural pH: 6).
Chemengineering 08 00050 g013
Table 1. Physico-chemical properties of dyes.
DyeMolecular FormulaStructureλmax (nm)
TartrazineC16H9N4Na3O9S2Chemengineering 08 00050 i001426
Naphthol Blue BlackC22H14N6Na2O9S2Chemengineering 08 00050 i002618
Table 2. Specific surface area data.
MaterialsSBET (m2/g)Pore Volume (cm3/g)Pore Size (Å)Nanoparticle Size (Å)
TiO2-NS33.30.2201.0470.9
Table 3. Langmuir–Hinshelwood model constants reported by previous studies related to the organic compound’s degradation.
PollutantPhotocatalystIrradiation Sourcek (mg∙min−1.L−1)K (L∙mg−1)Ref.
AcetaminophenTiO2Simulated solar light0.3850.0970[60]
CiprofloxacinCuFe2O4UV-C light irradiation0.141 0.202[61]
Acid Red dyeActivated carbon-TiO2 compositeUV light irradiation1.780.06[62]
Reactive green 12TiO2 loading on polyesterUV light irradiation0.0350.796[55]
TartrazineSynthesized TiO2-NSVisible light irradiation0.0290.32This work
Table 4. Experimental design to assess the mutual effects of second pollutant presence and NaCl on the photocatalytic degradation TTZ and NBB.
Factor 1Factor 2Factor 3Response 1Response 2
RunA: CTTZB: CNBBC: CNaClDegradation Yield TZDegradation Yield NBB
(ppm)(ppm)(ppm)(%)(%)
122.331044.5563.14
222.33632.9752.71
333.4951015.9430.2
422.33244.3260.31
542.3322538.06
624.66615.3822.33
742.33626.4432
842.331027.6837.74
933.495618.3730.33
1033.495222.8234.74
1124.661016.1521.75
1224.66220.6128.99
1333.495618.7928.09
Table 5. ANOVA table and fit statistics of Tartrazine degradation.
SourceSum of SquaresdfMean SquareF-Valuep-Value
Model2.001 × 10−692.224 × 10−7110.000.0013Significant
A-CTTZ9.303 × 10−819.303 × 10−846.020.0065
B-CNBB8.724 × 10−718.724 × 10−7431.590.0002
C-CNaCl1.199 × 10−711.199 × 10−759.290.0046
AB4.421 × 10−814.421 × 10−821.870.0185
AC3.440 × 10−813.440 × 10−817.020.0258
BC1.004 × 10−711.004 × 10−749.650.0059
C22.006 × 10−812.006 × 10−89.920.0513
ABC4.730 × 10−814.730 × 10−823.400.0168
AC23.452 × 10−813.452 × 10−817.070.0257
Residual6.064 × 10−932.021 × 10⁻⁹
R20.9970
Adjusted R20.9879
Predicted R20.7922
Adeq Precision29.6421
Table 6. ANOVA table and fit statistics of Naphthol Blue Black degradation.
SourceSum of SquaresdfMean SquareF-Valuep-Value
Model1.1180.1389193.93<0.0001Significant
A-C tartrazine0.078010.0780108.870.0005
B-C NBB0.162310.1623226.570.0001
C-C NaCl0.020810.020829.090.0057
AB0.005910.00598.170.0460
AC0.000810.00081.180.3388
BC0.020610.020628.770.0058
C20.033910.033947.360.0023
BC20.002210.00223.020.1573
Residual0.002940.0007
R20.9974
Adjusted R20.9923
Predicted R20.9805
Adeq Precision42.6727
Disclaimer/Publisher’s Note: The statements, opinions and data contained in all publications are solely those of the individual author(s) and contributor(s) and not of MDPI and/or the editor(s). MDPI and/or the editor(s) disclaim responsibility for any injury to people or property resulting from any ideas, methods, instructions or products referred to in the content.