

Method for Intensive Gas–Liquid Dispersion in a Stirred Tank

 and
and 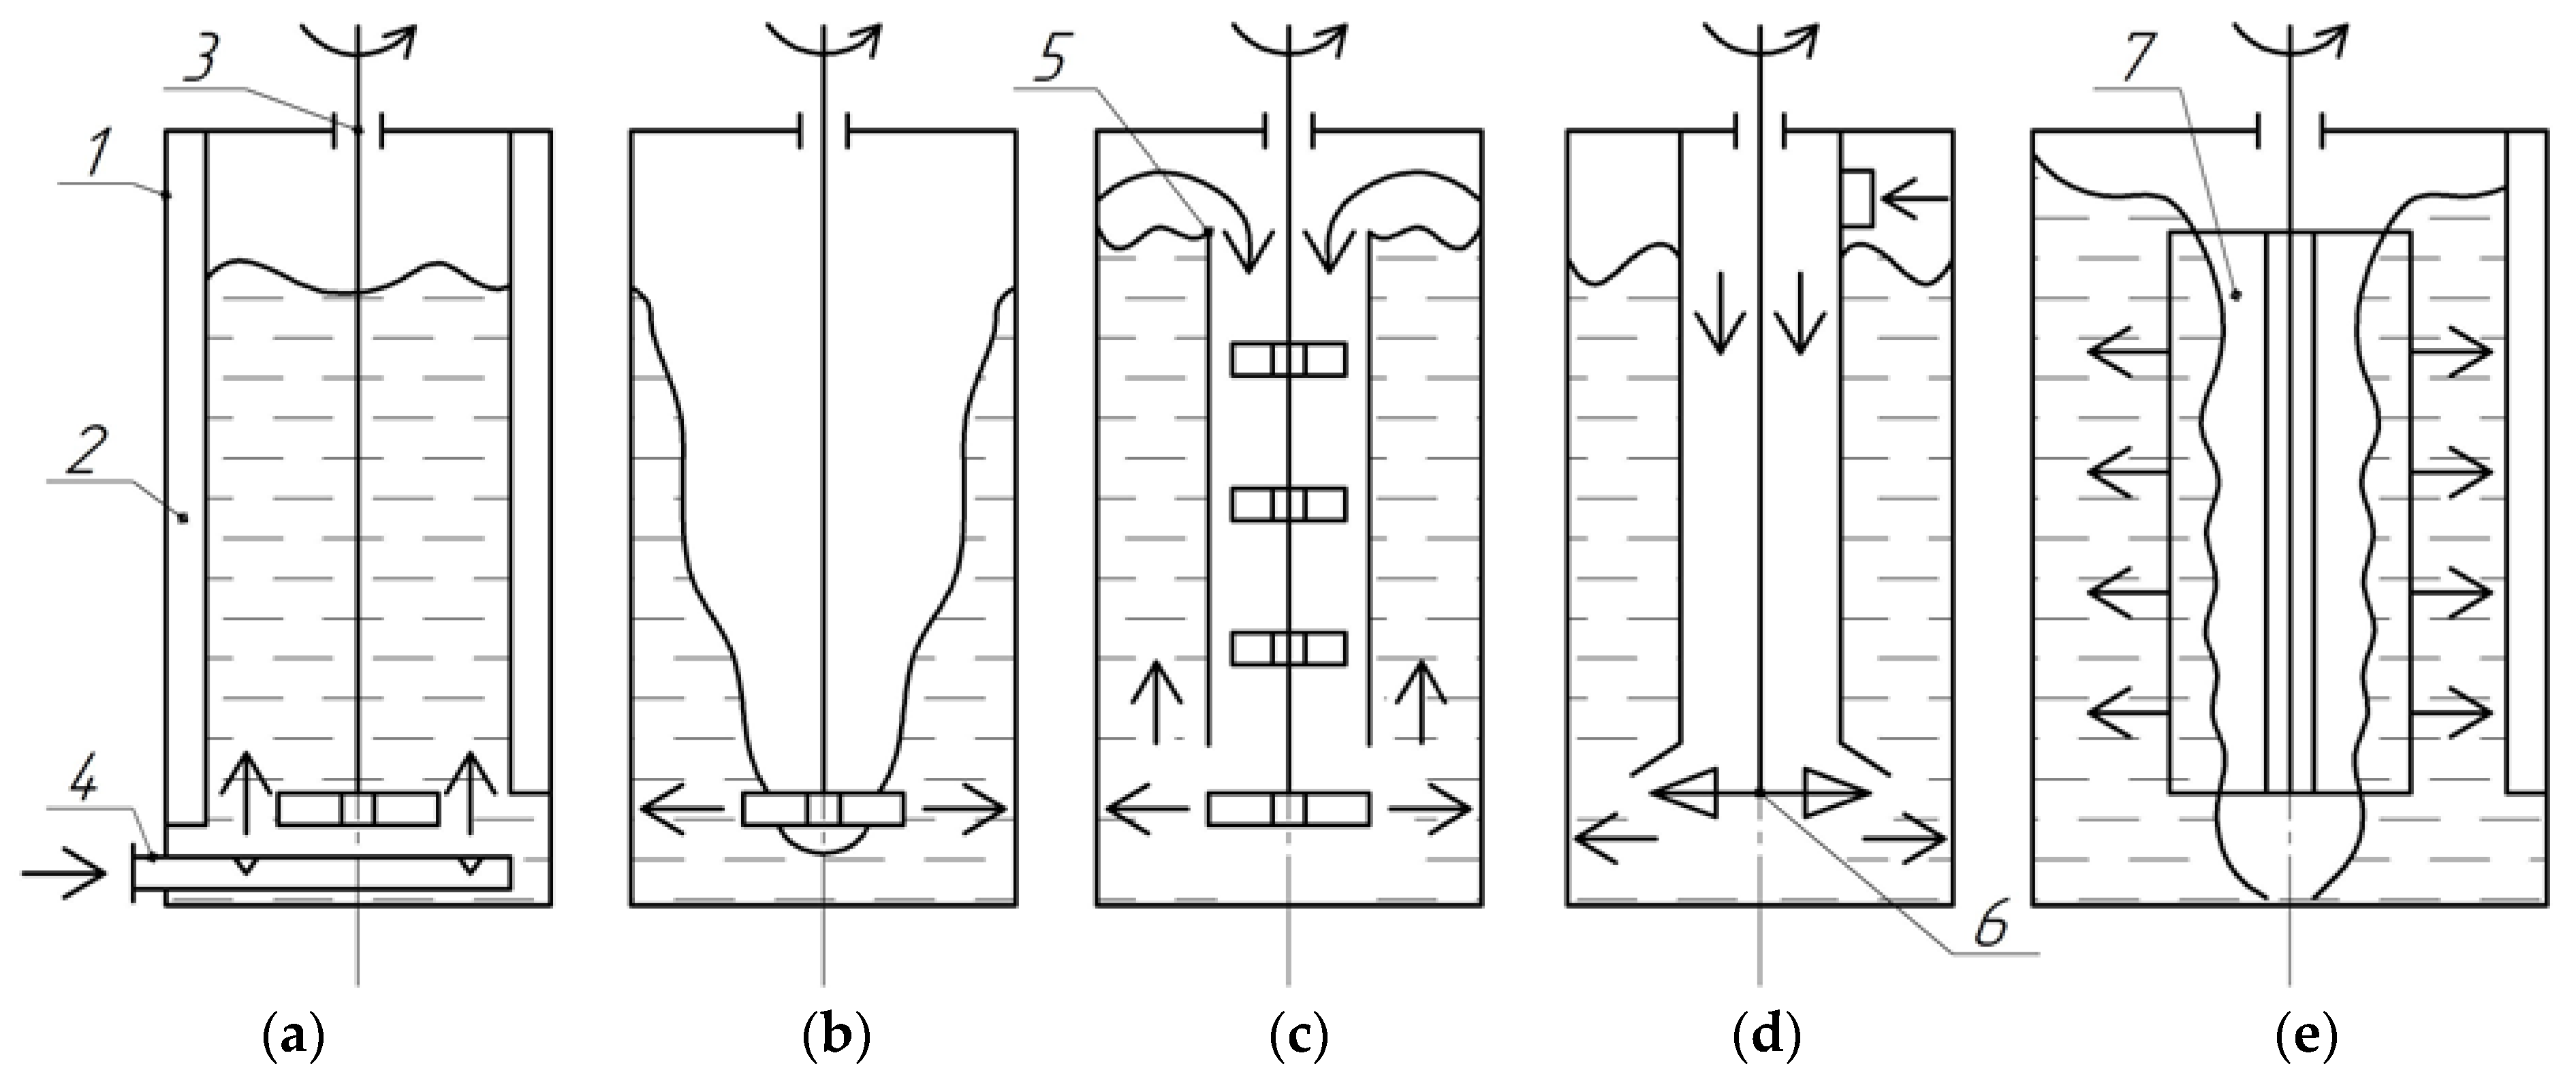
Abstract
1. Introduction
2. Materials and Methods
3. Results and Discussion
3.1. Gas–Liquid Dispersion Conditions
3.2. Simulation Results
3.3. Gas Content and Phase Interface
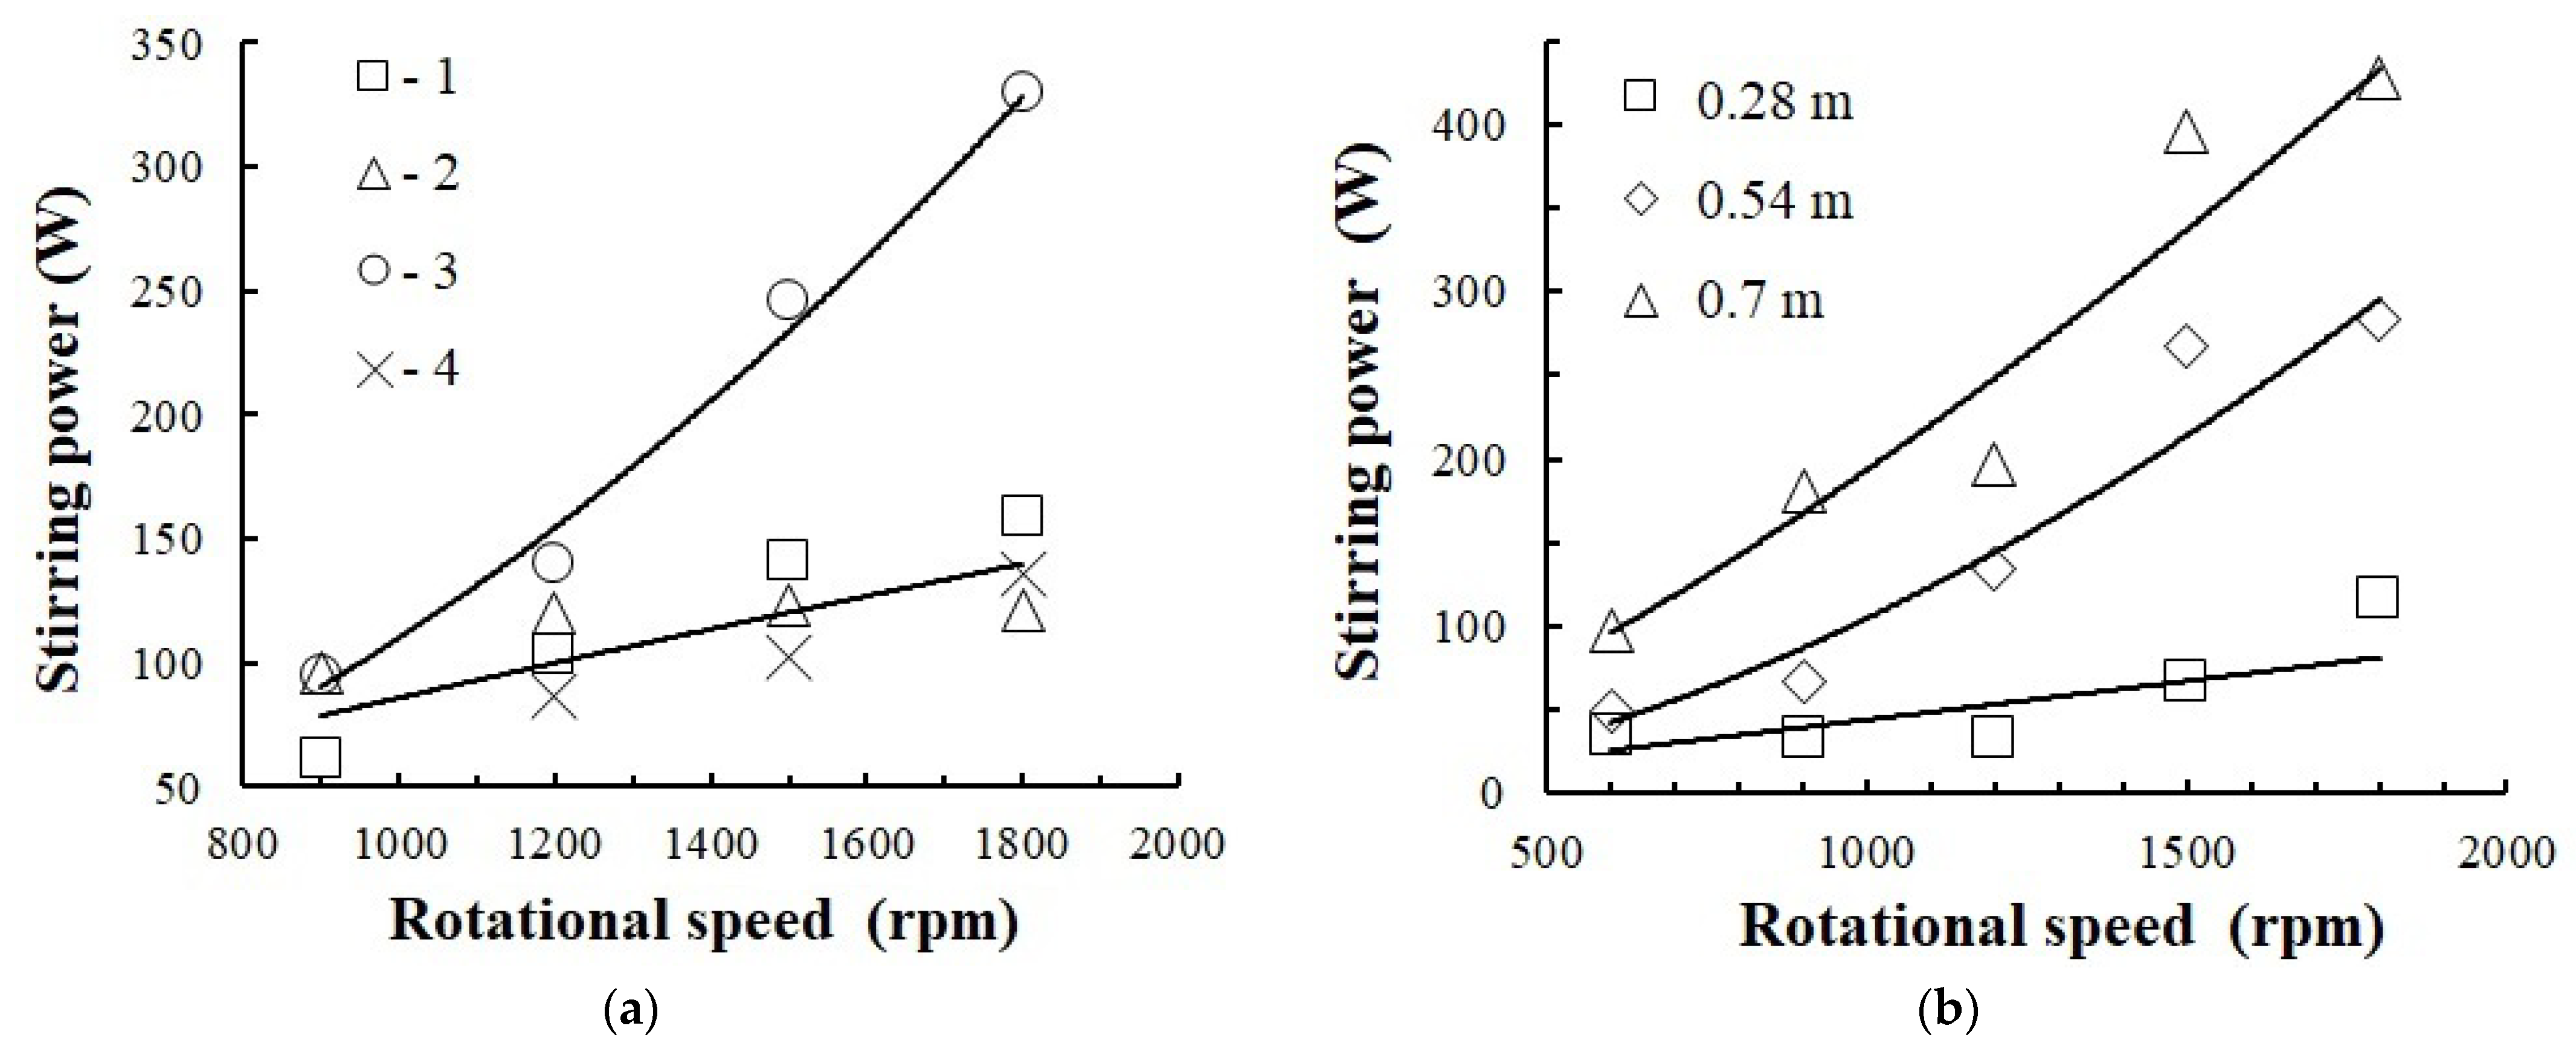
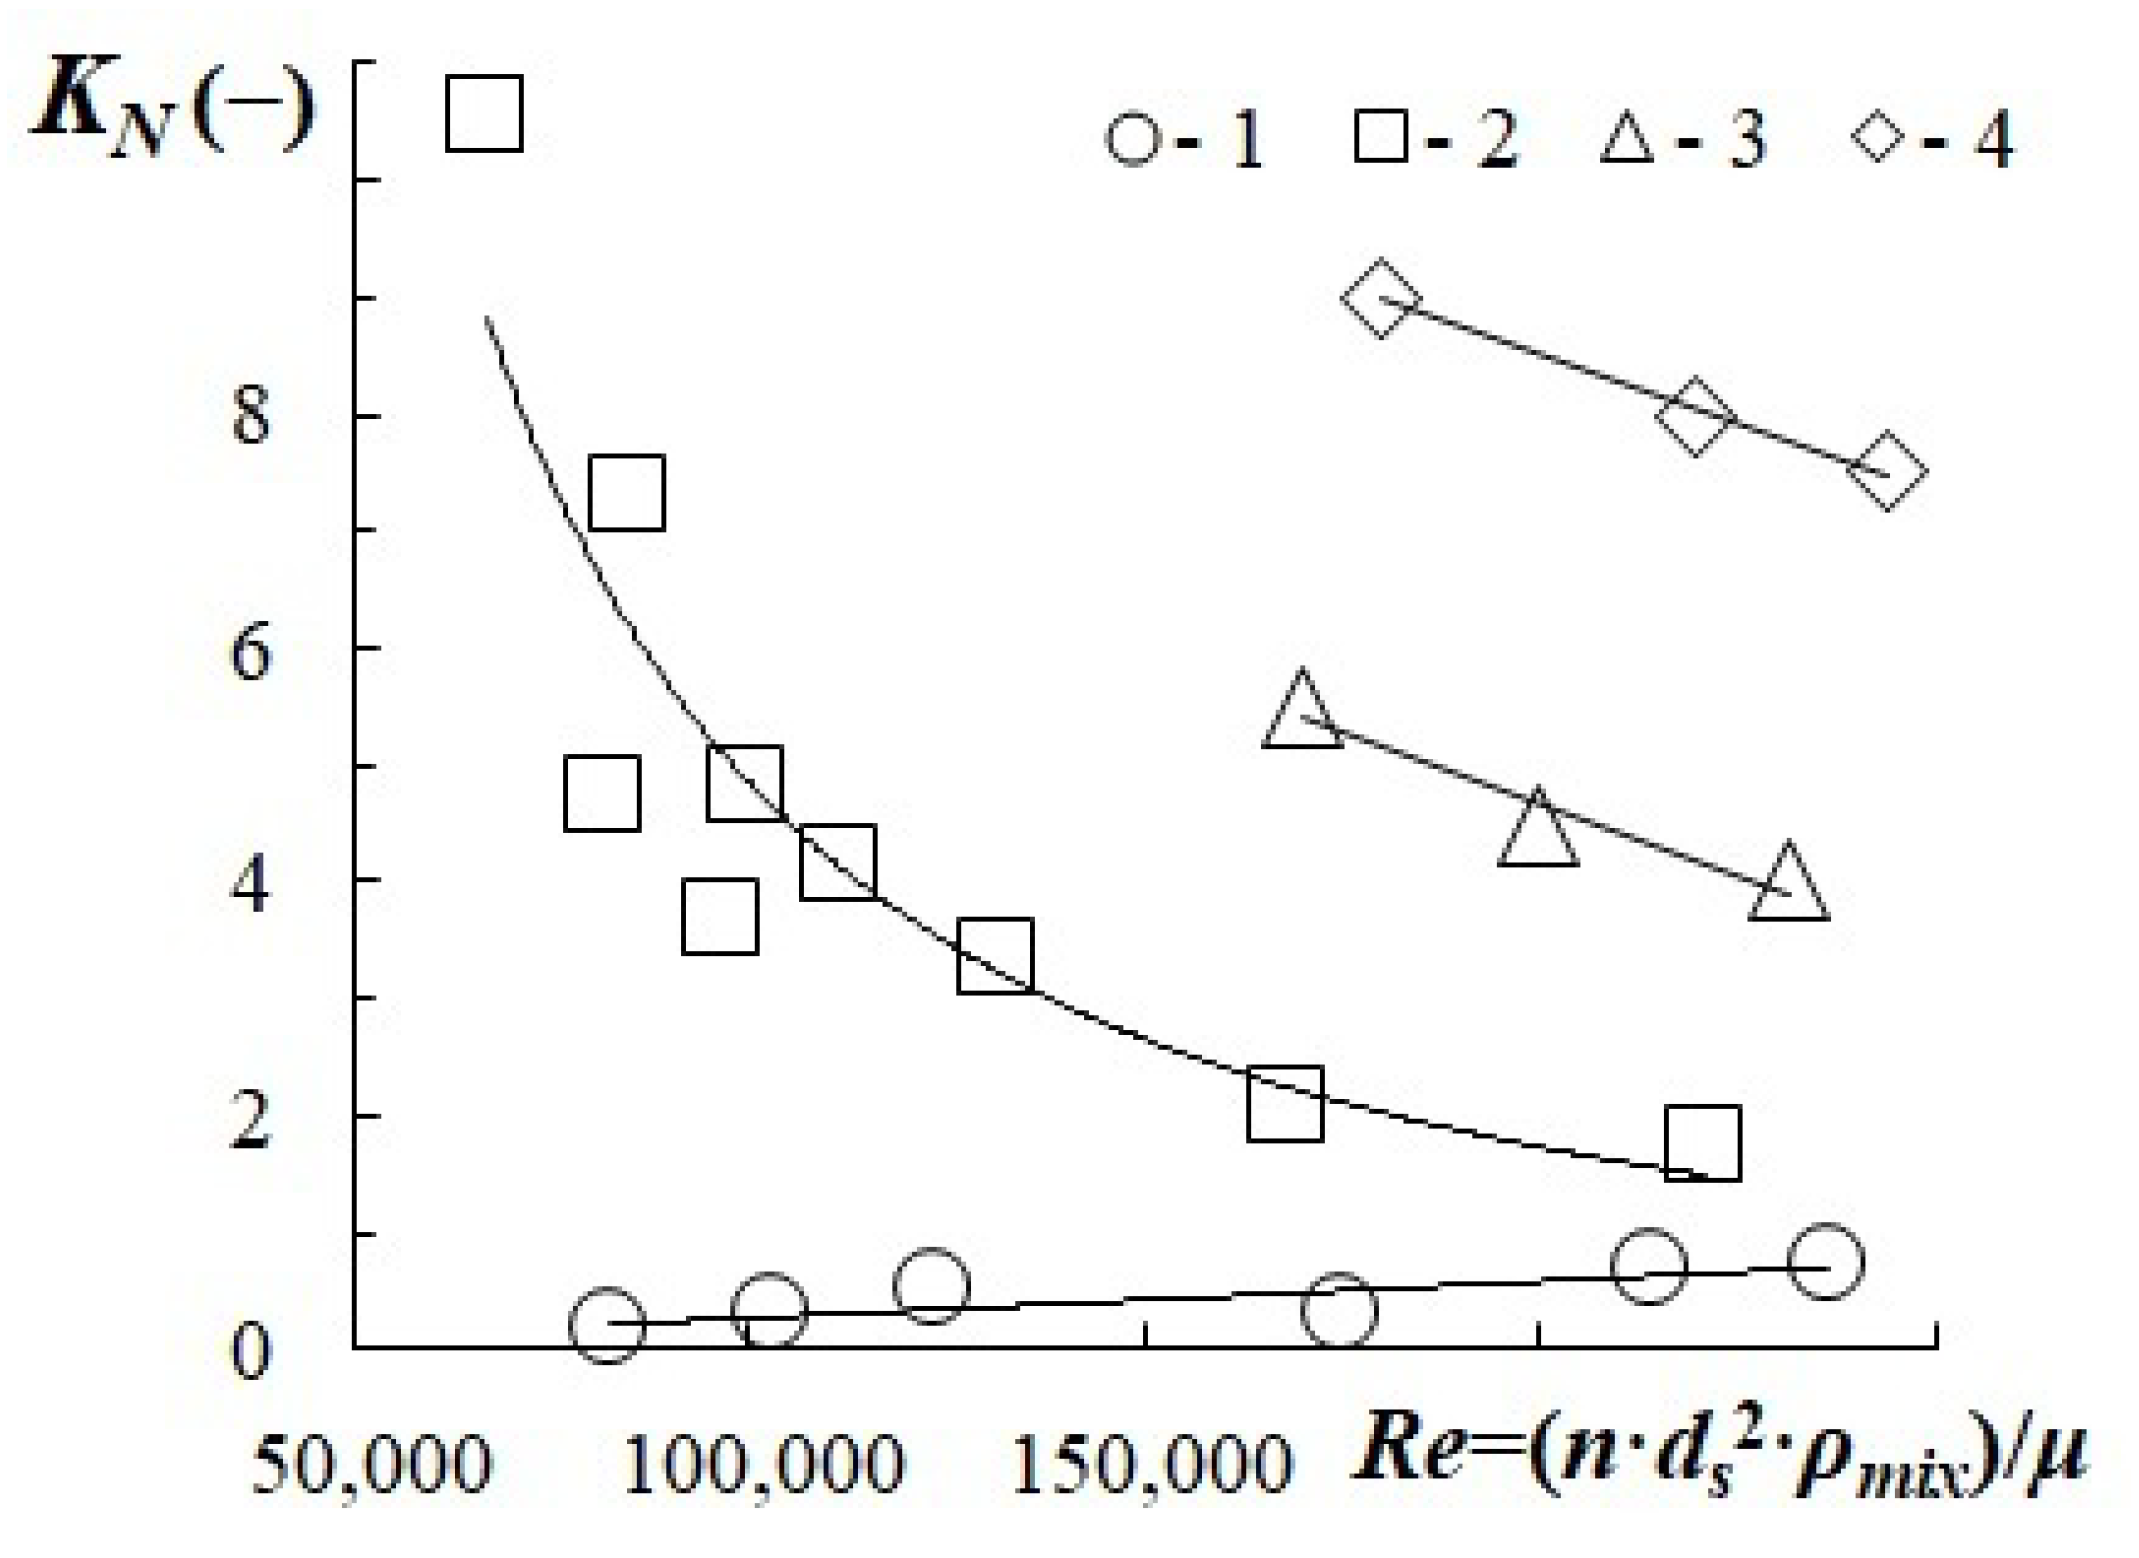
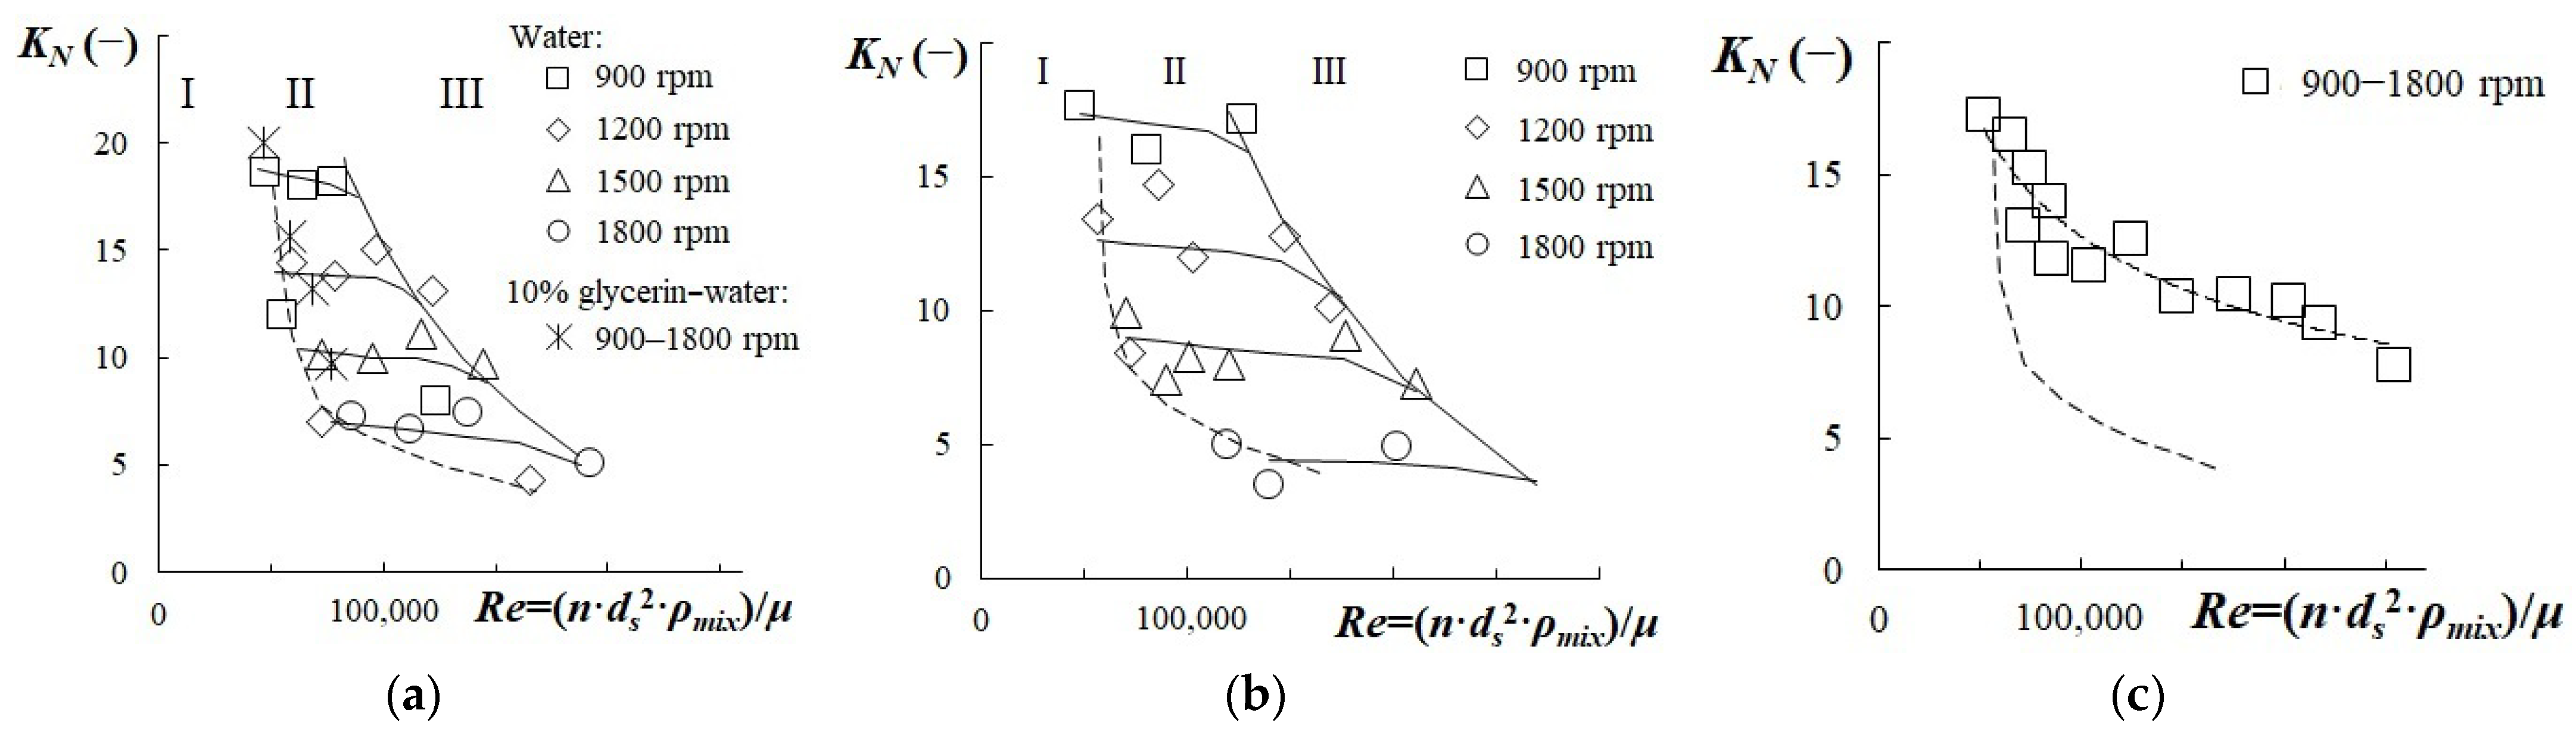
3.4. Stirring Power
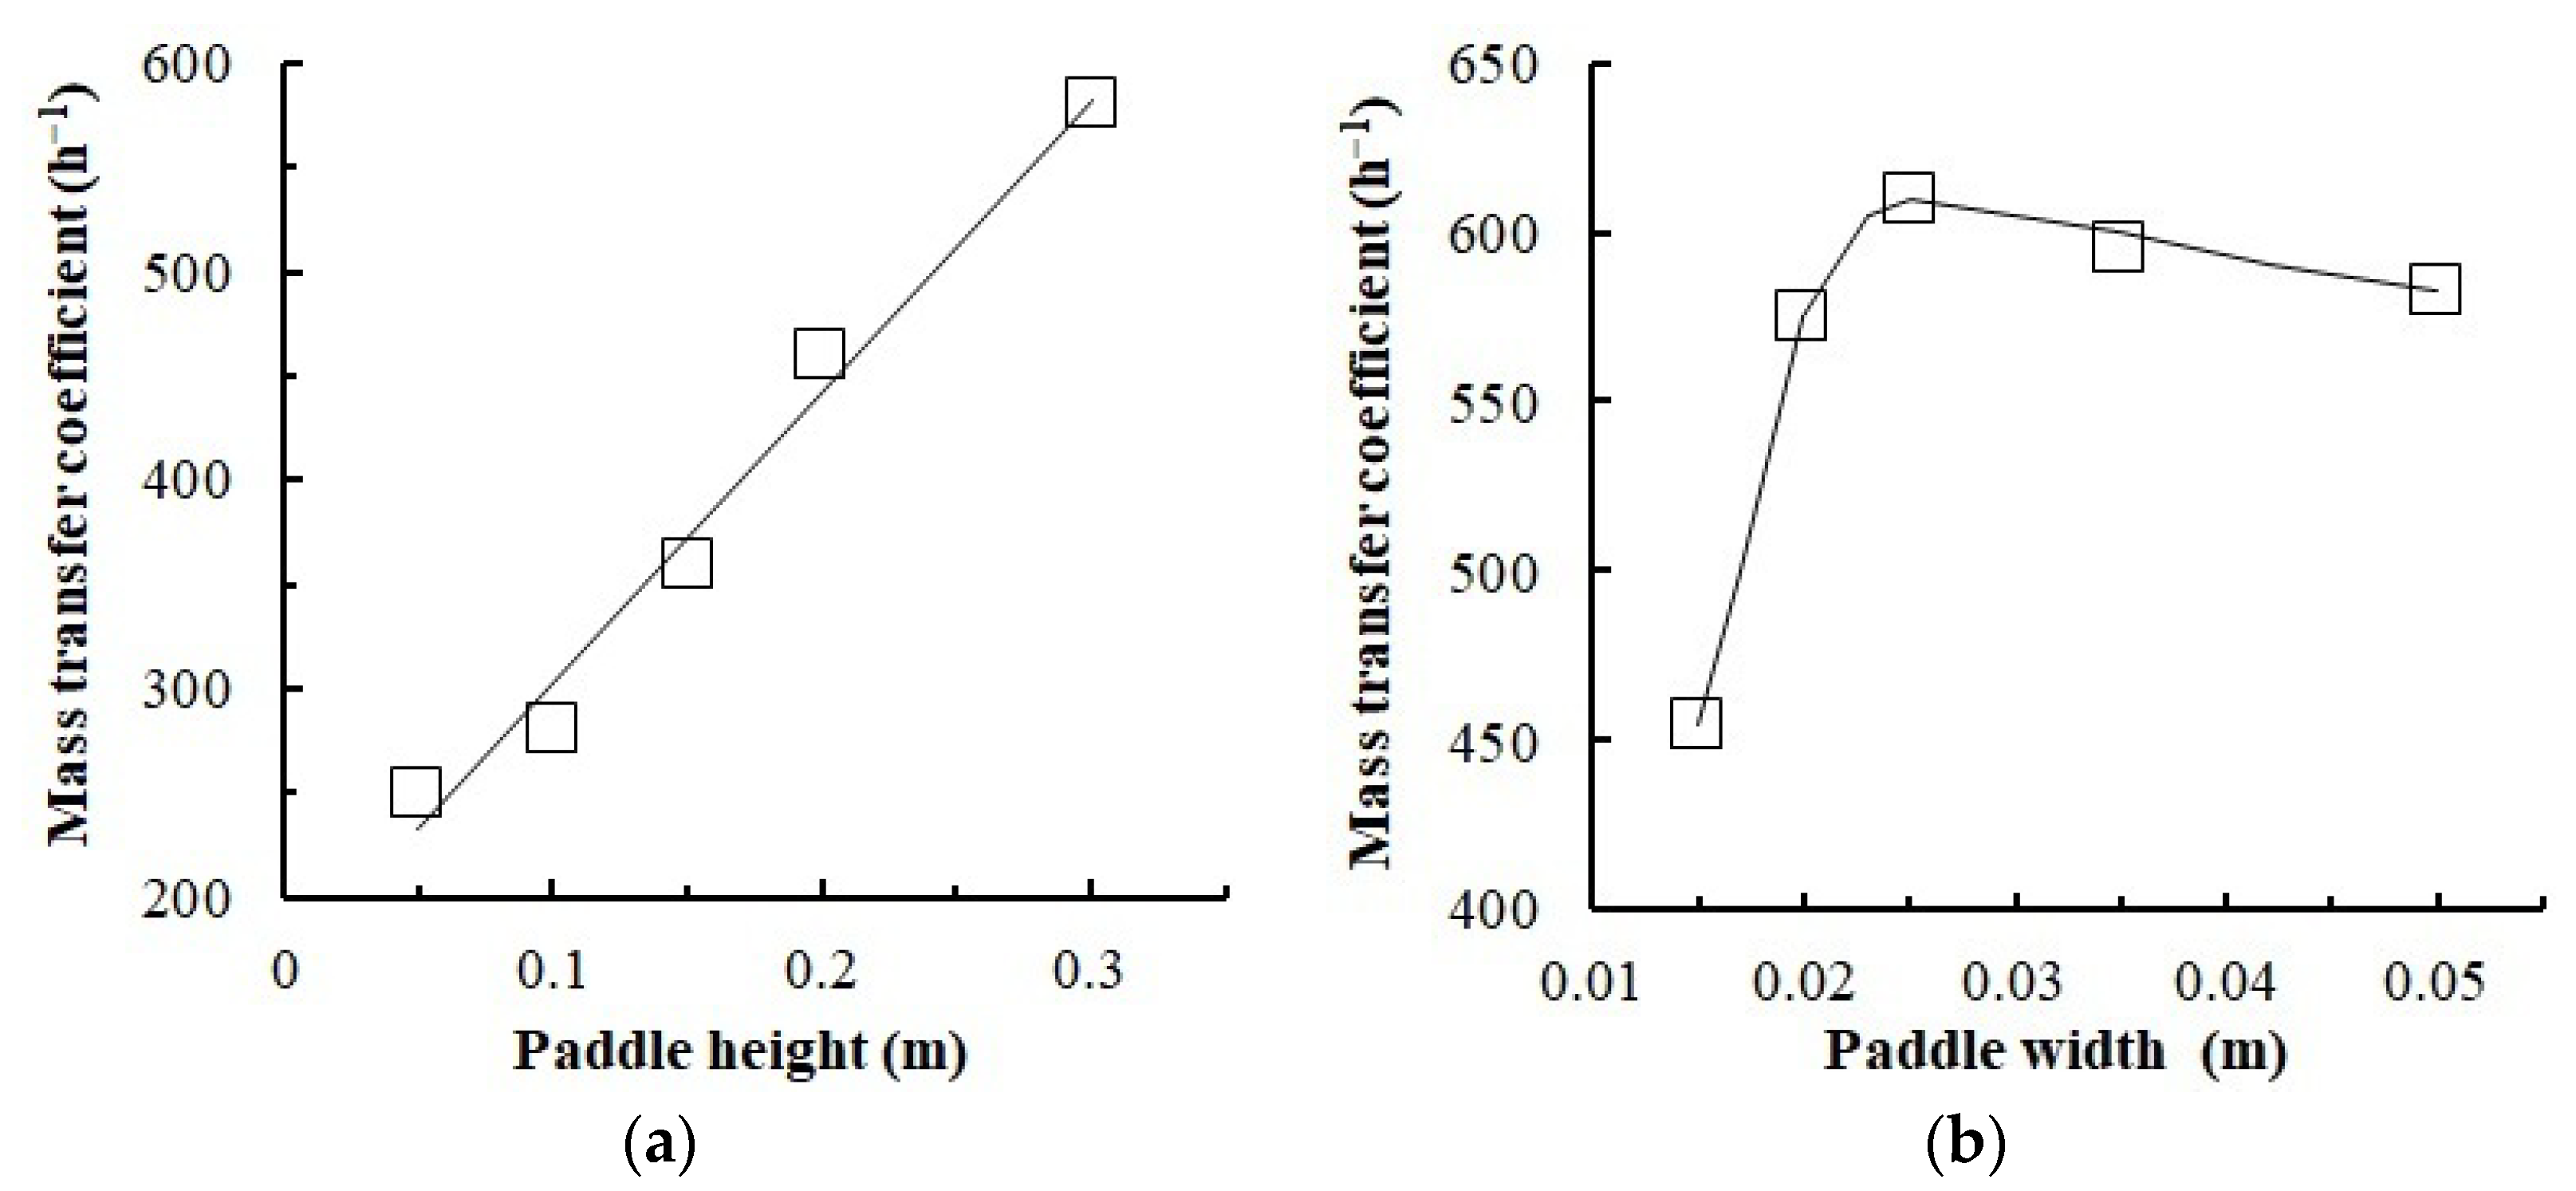
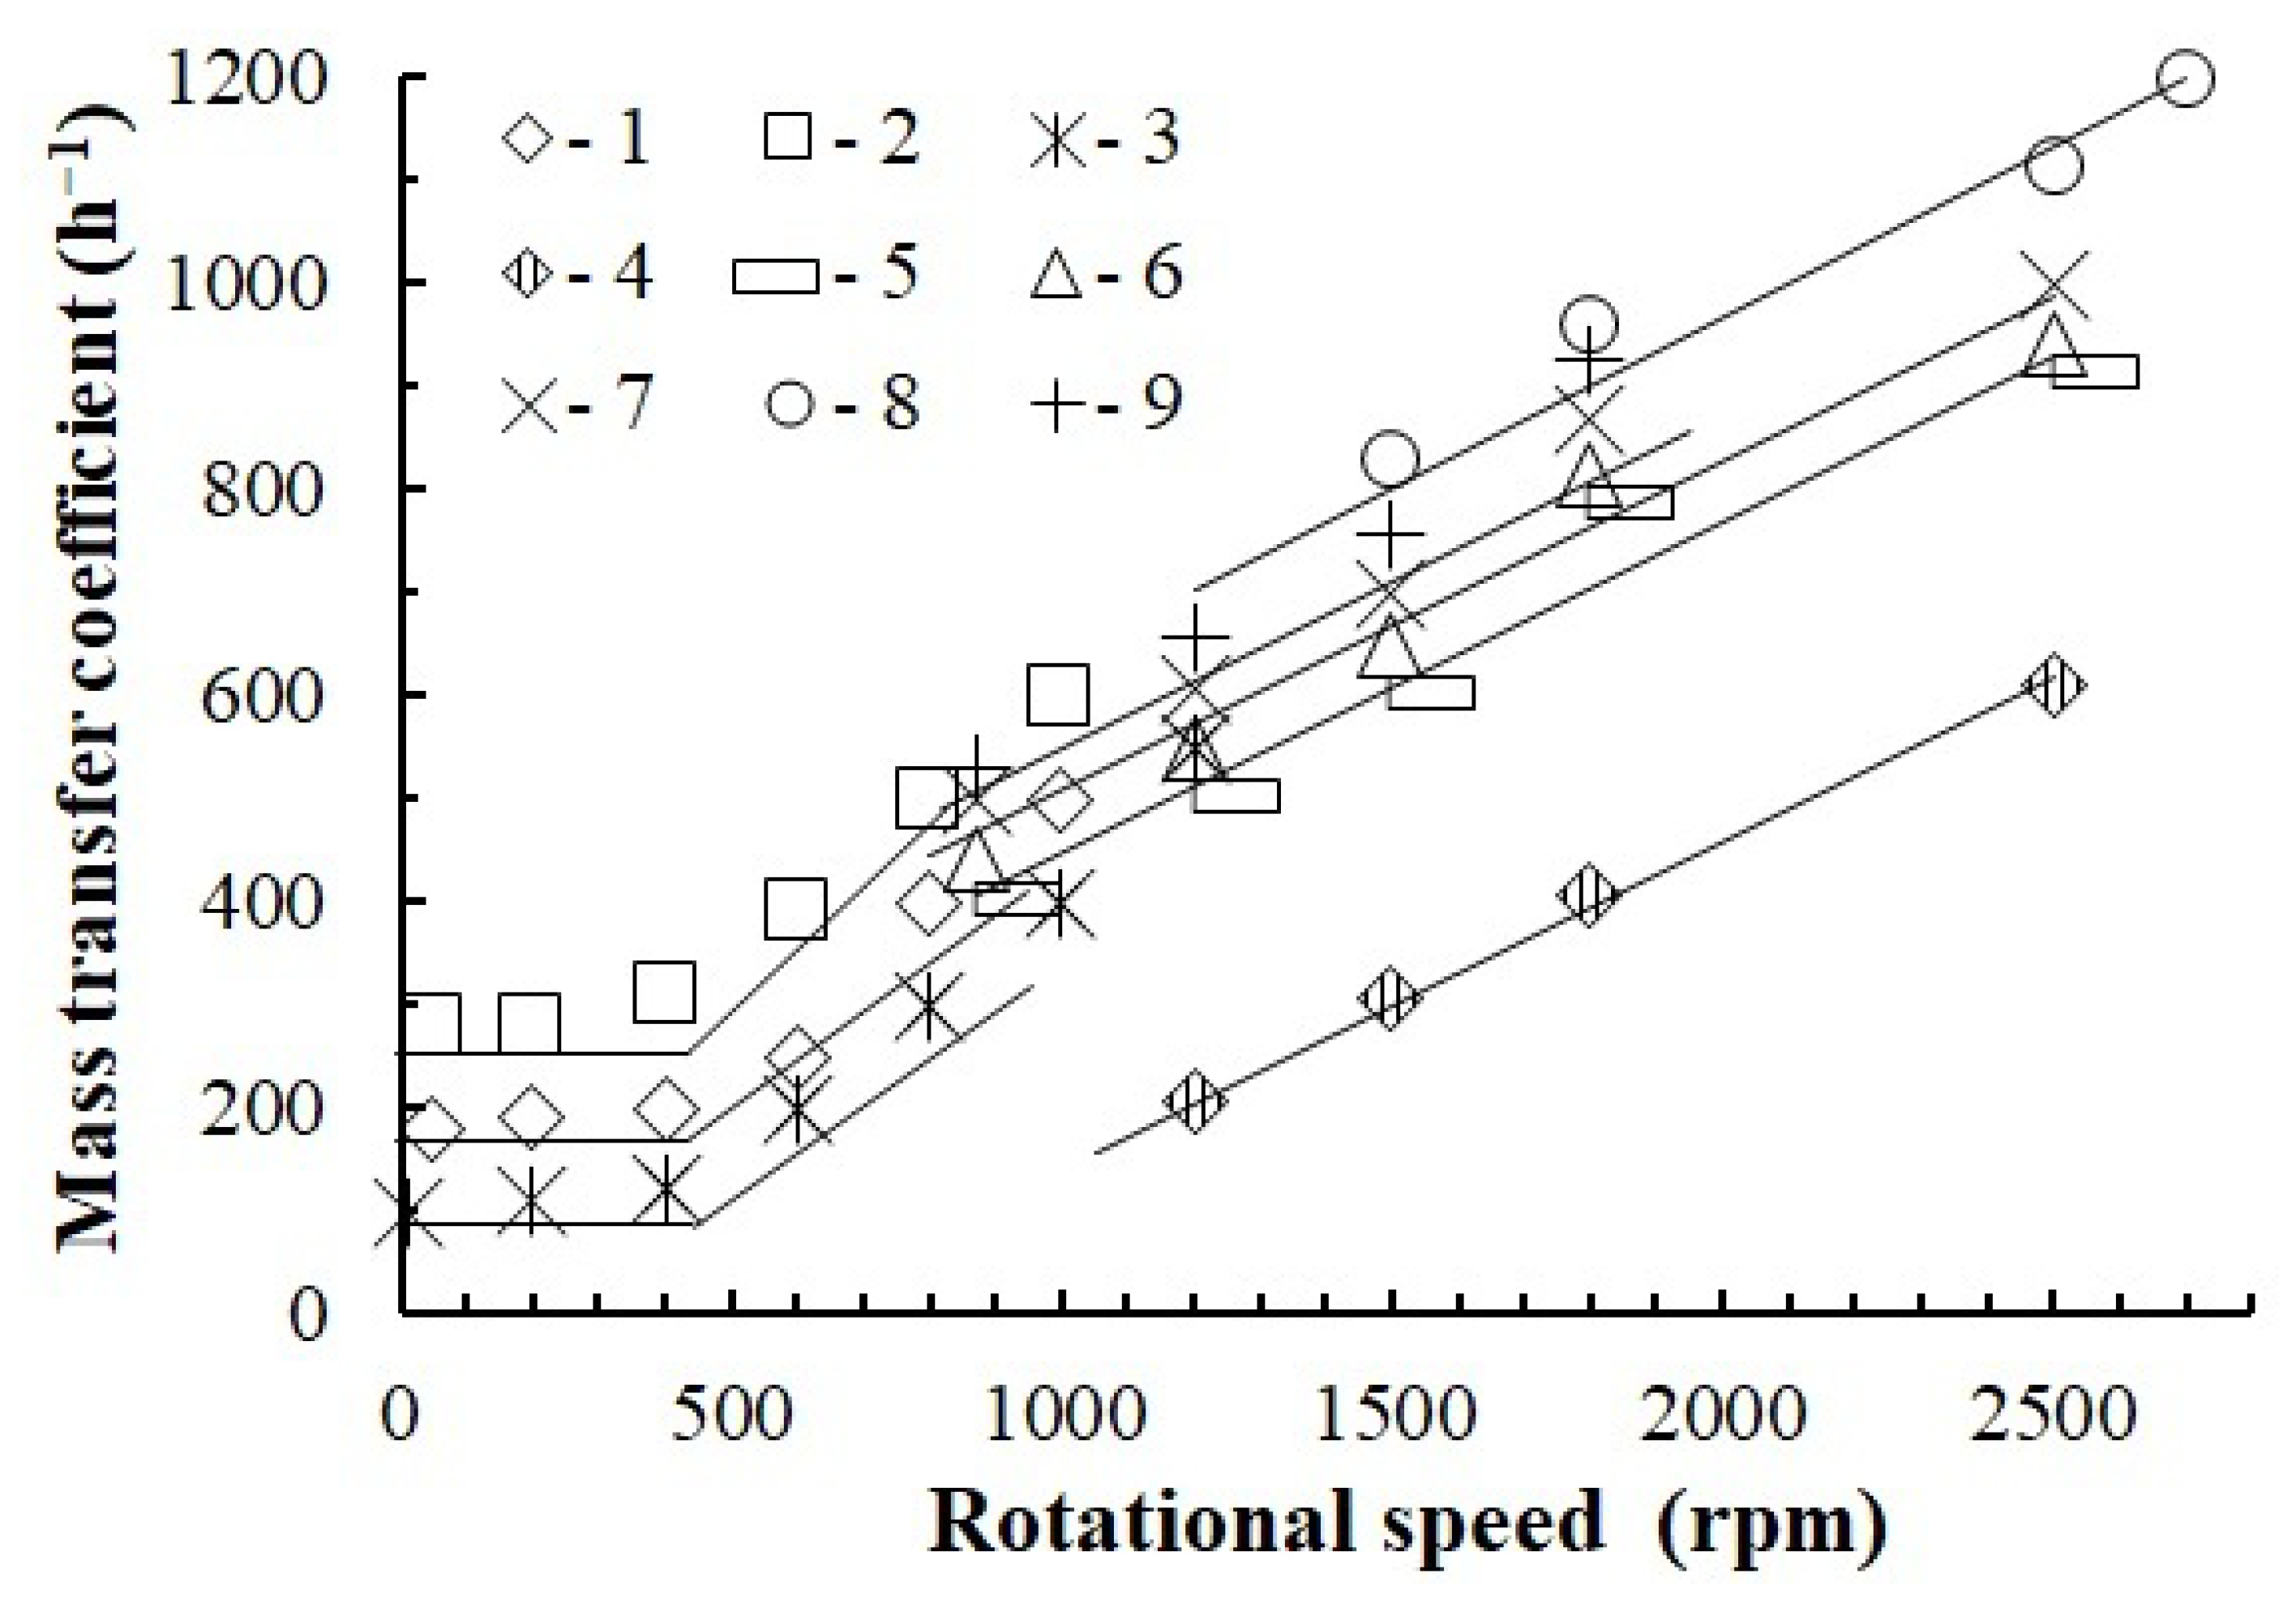
3.5. Mass Transfer Experiments
4. Conclusions
- A new method of gas dispersion from an open vortex cavity in a stirrer apparatus was developed to intensify the mass exchange without additional mechanical gas feeding to simplify the general stirrer structure and increase the liquid layer height. The dispersion method can efficiently be used to develop high-performance bioreactors, chemical reactors, aerotanks, and floatation plants. Used in various units, this method allows modifying the mass transfer coefficient and gas content across a broad range of values.
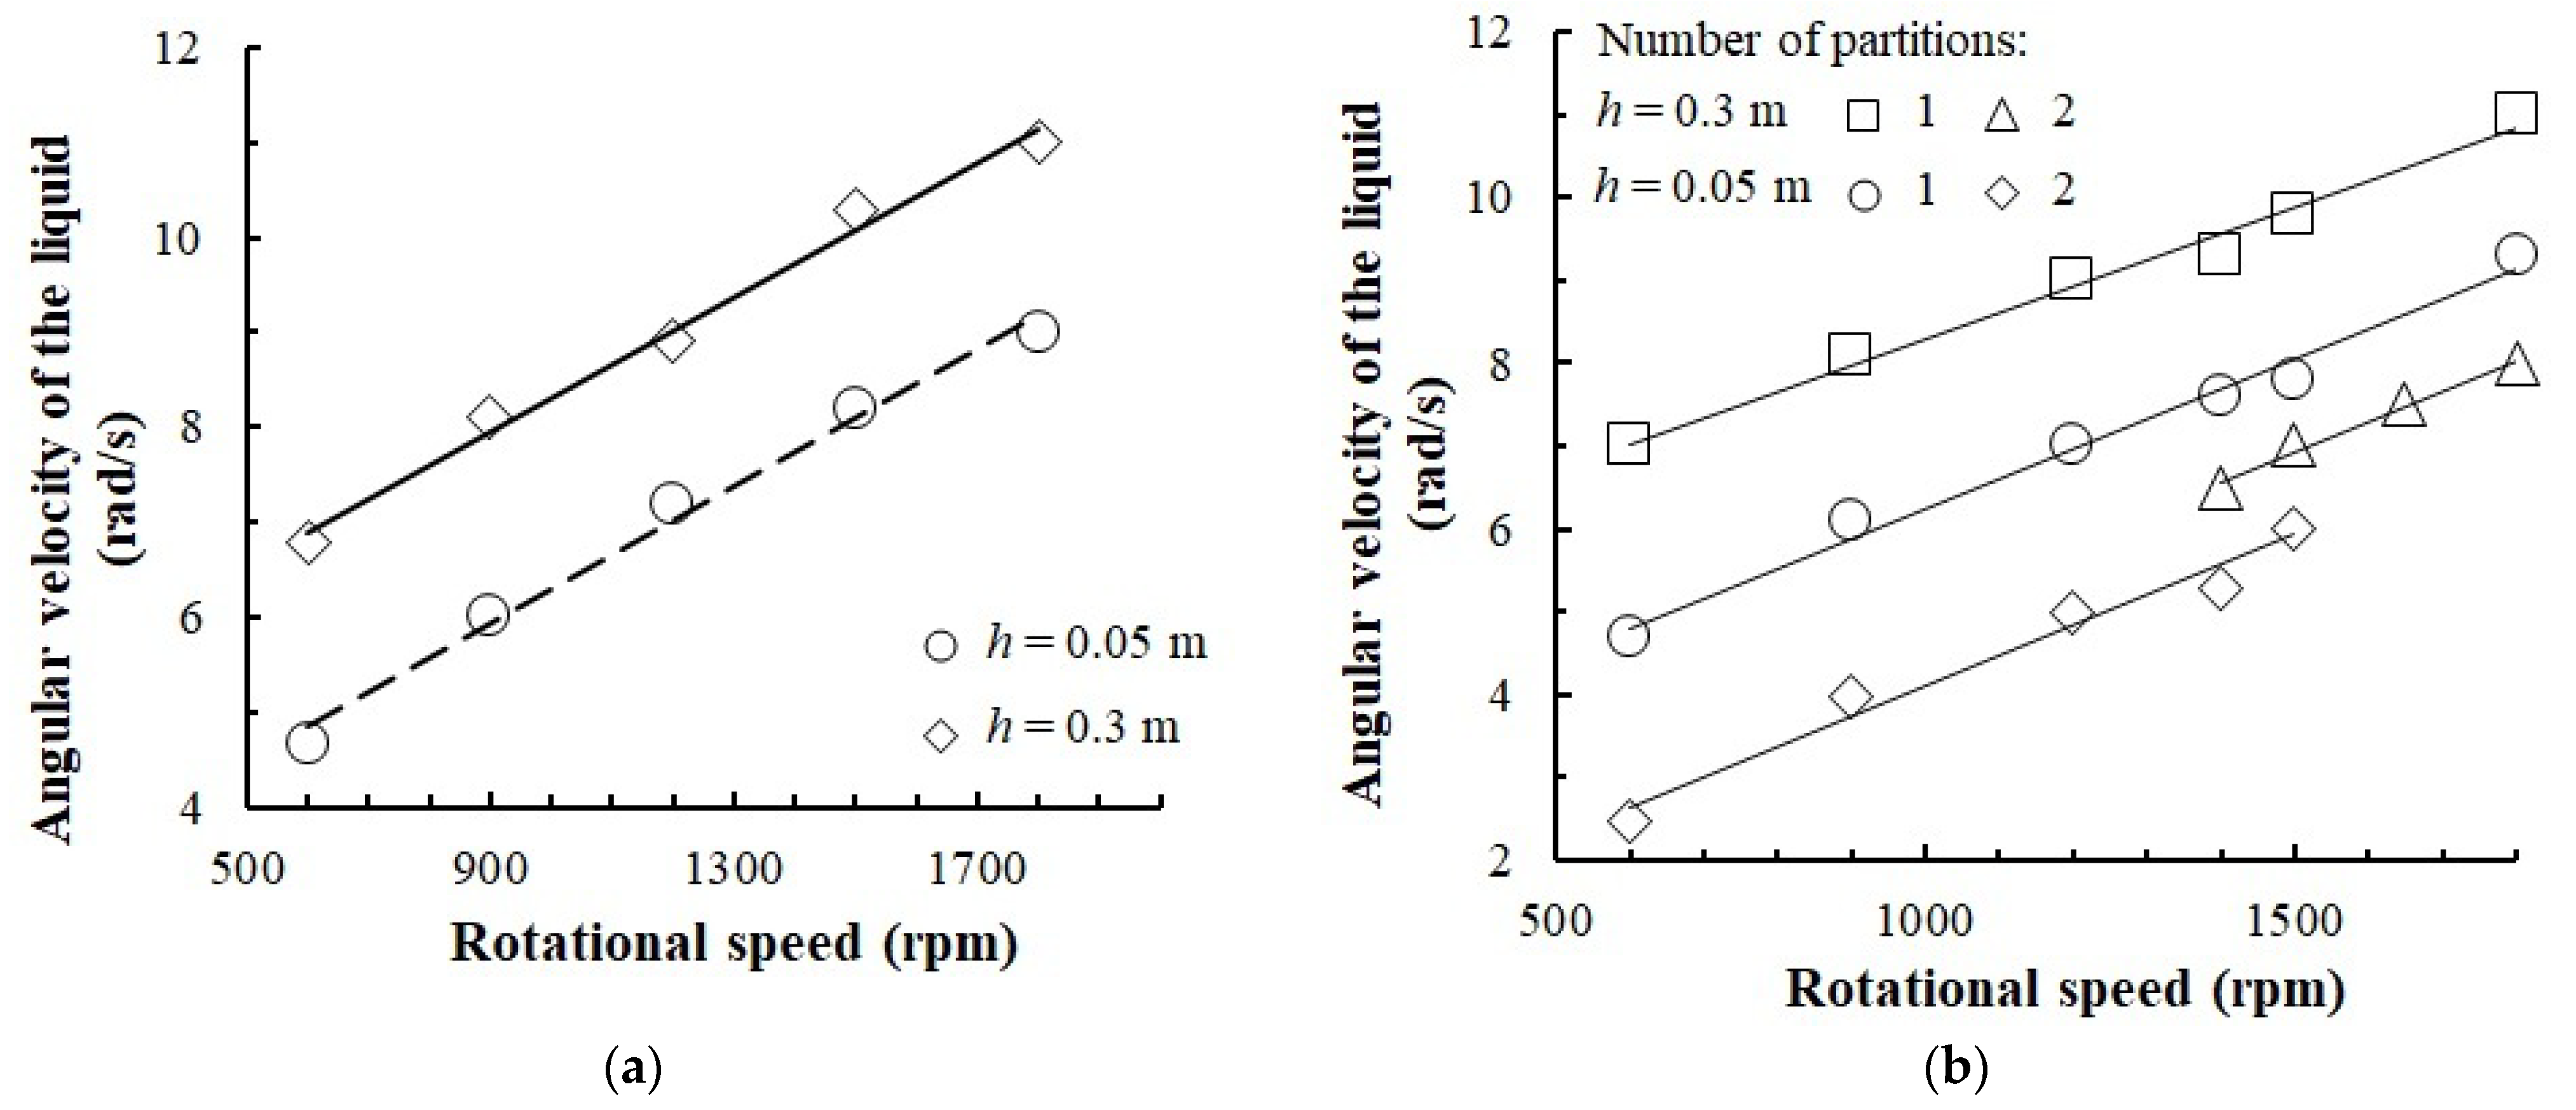
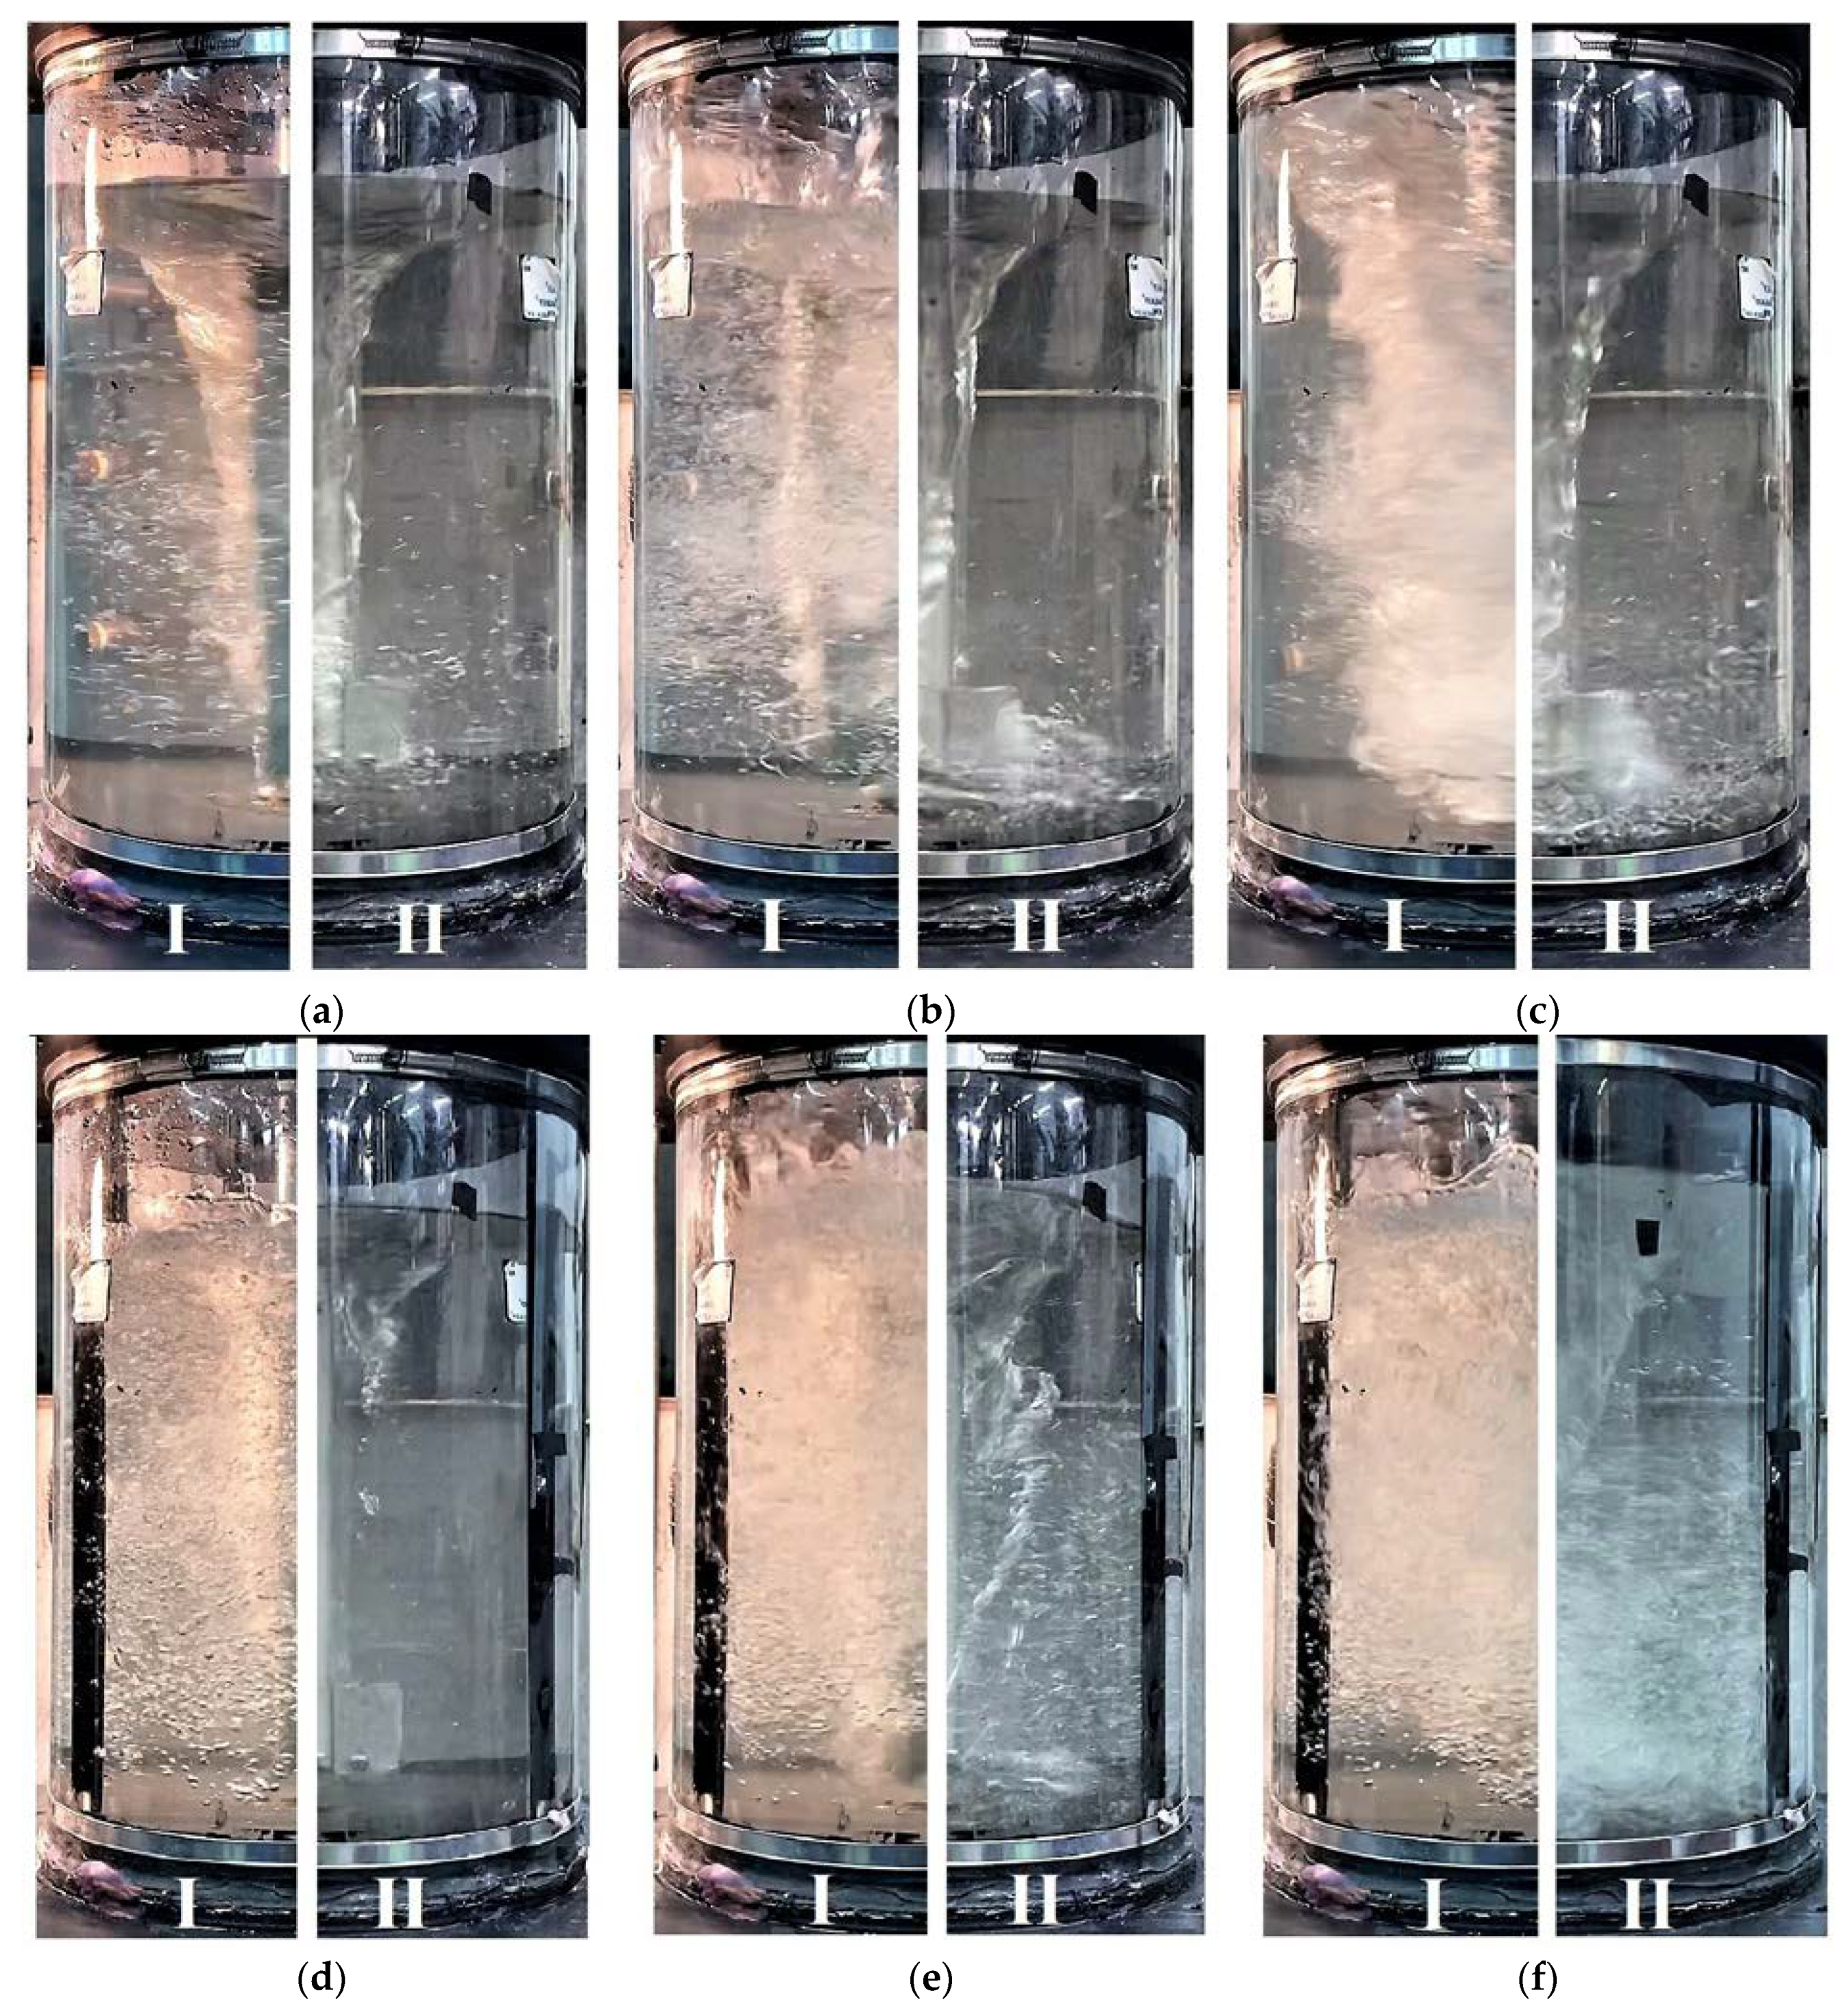
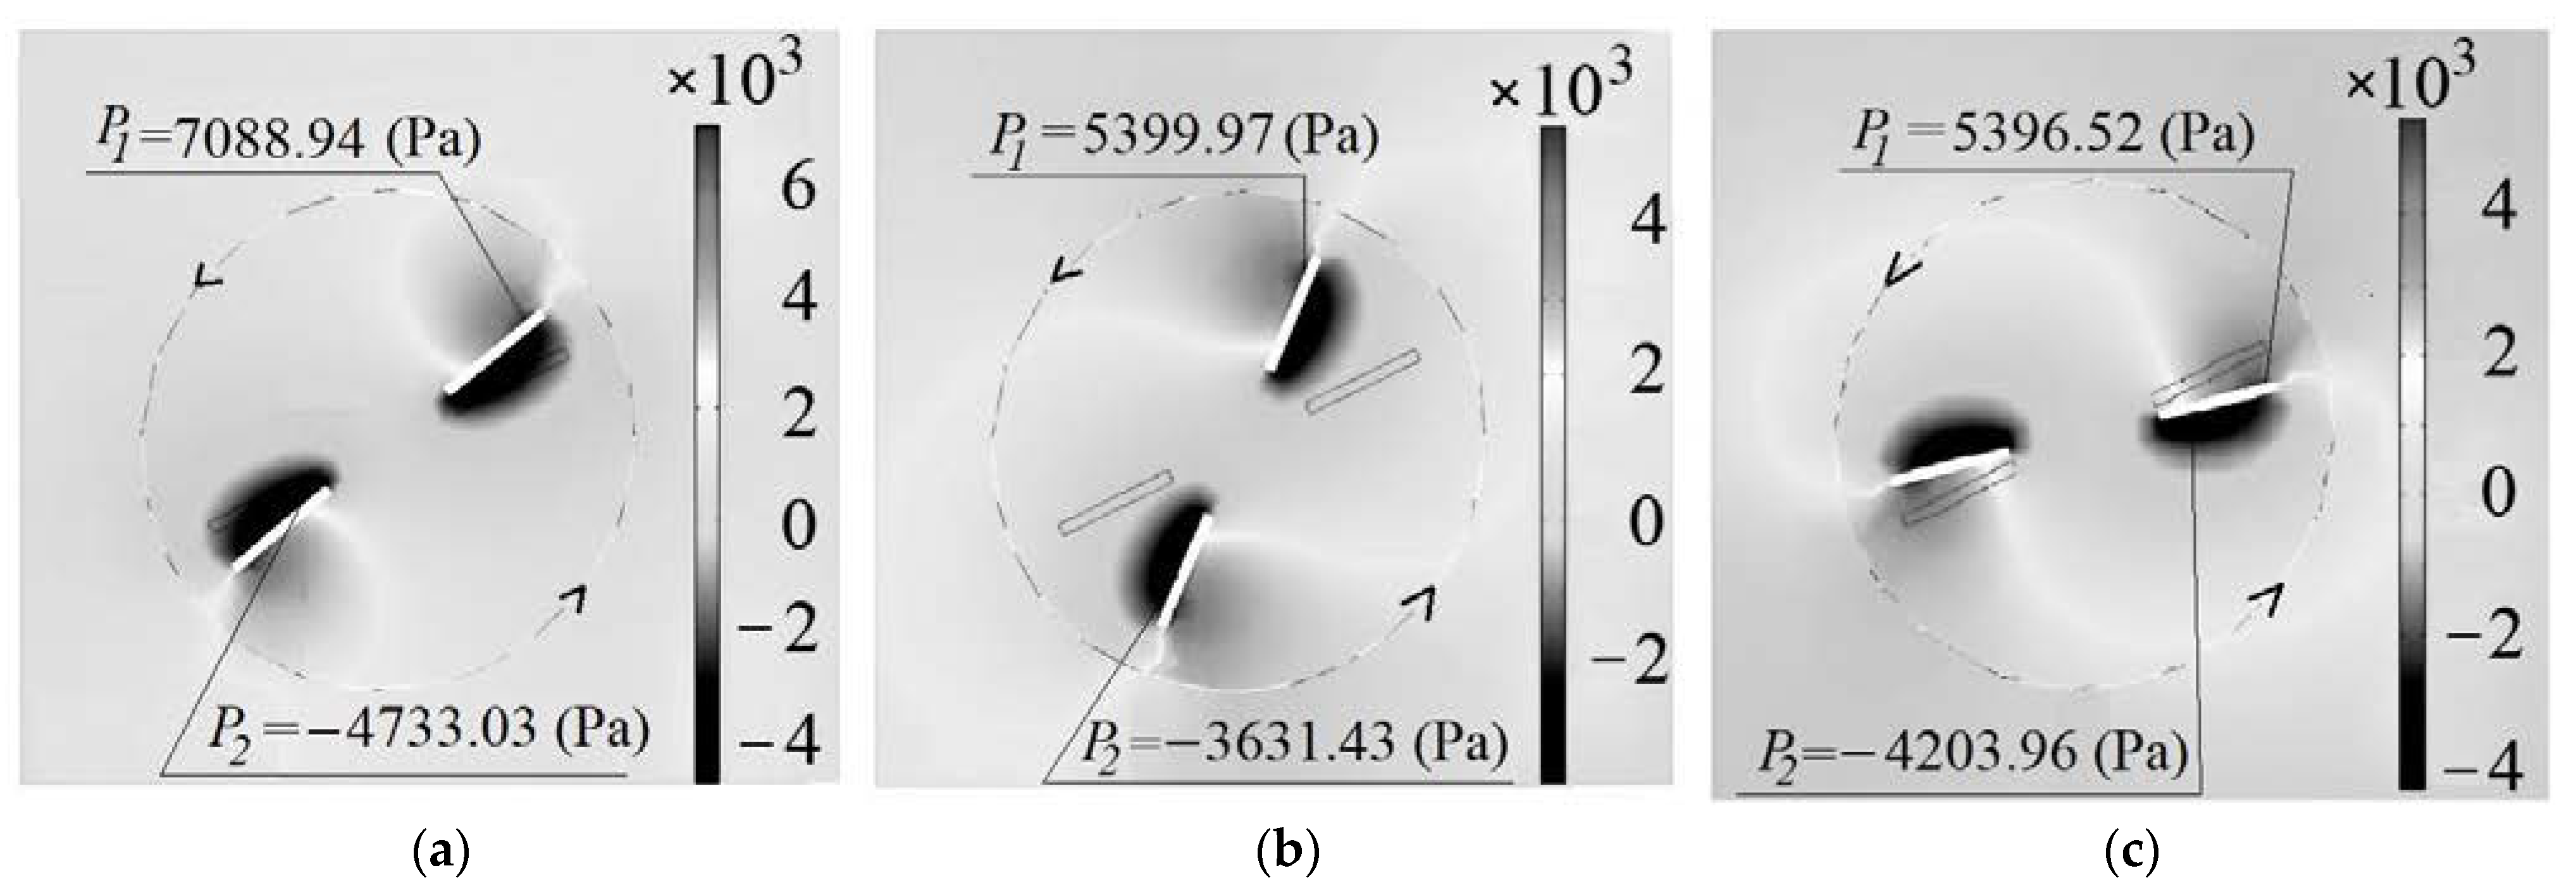
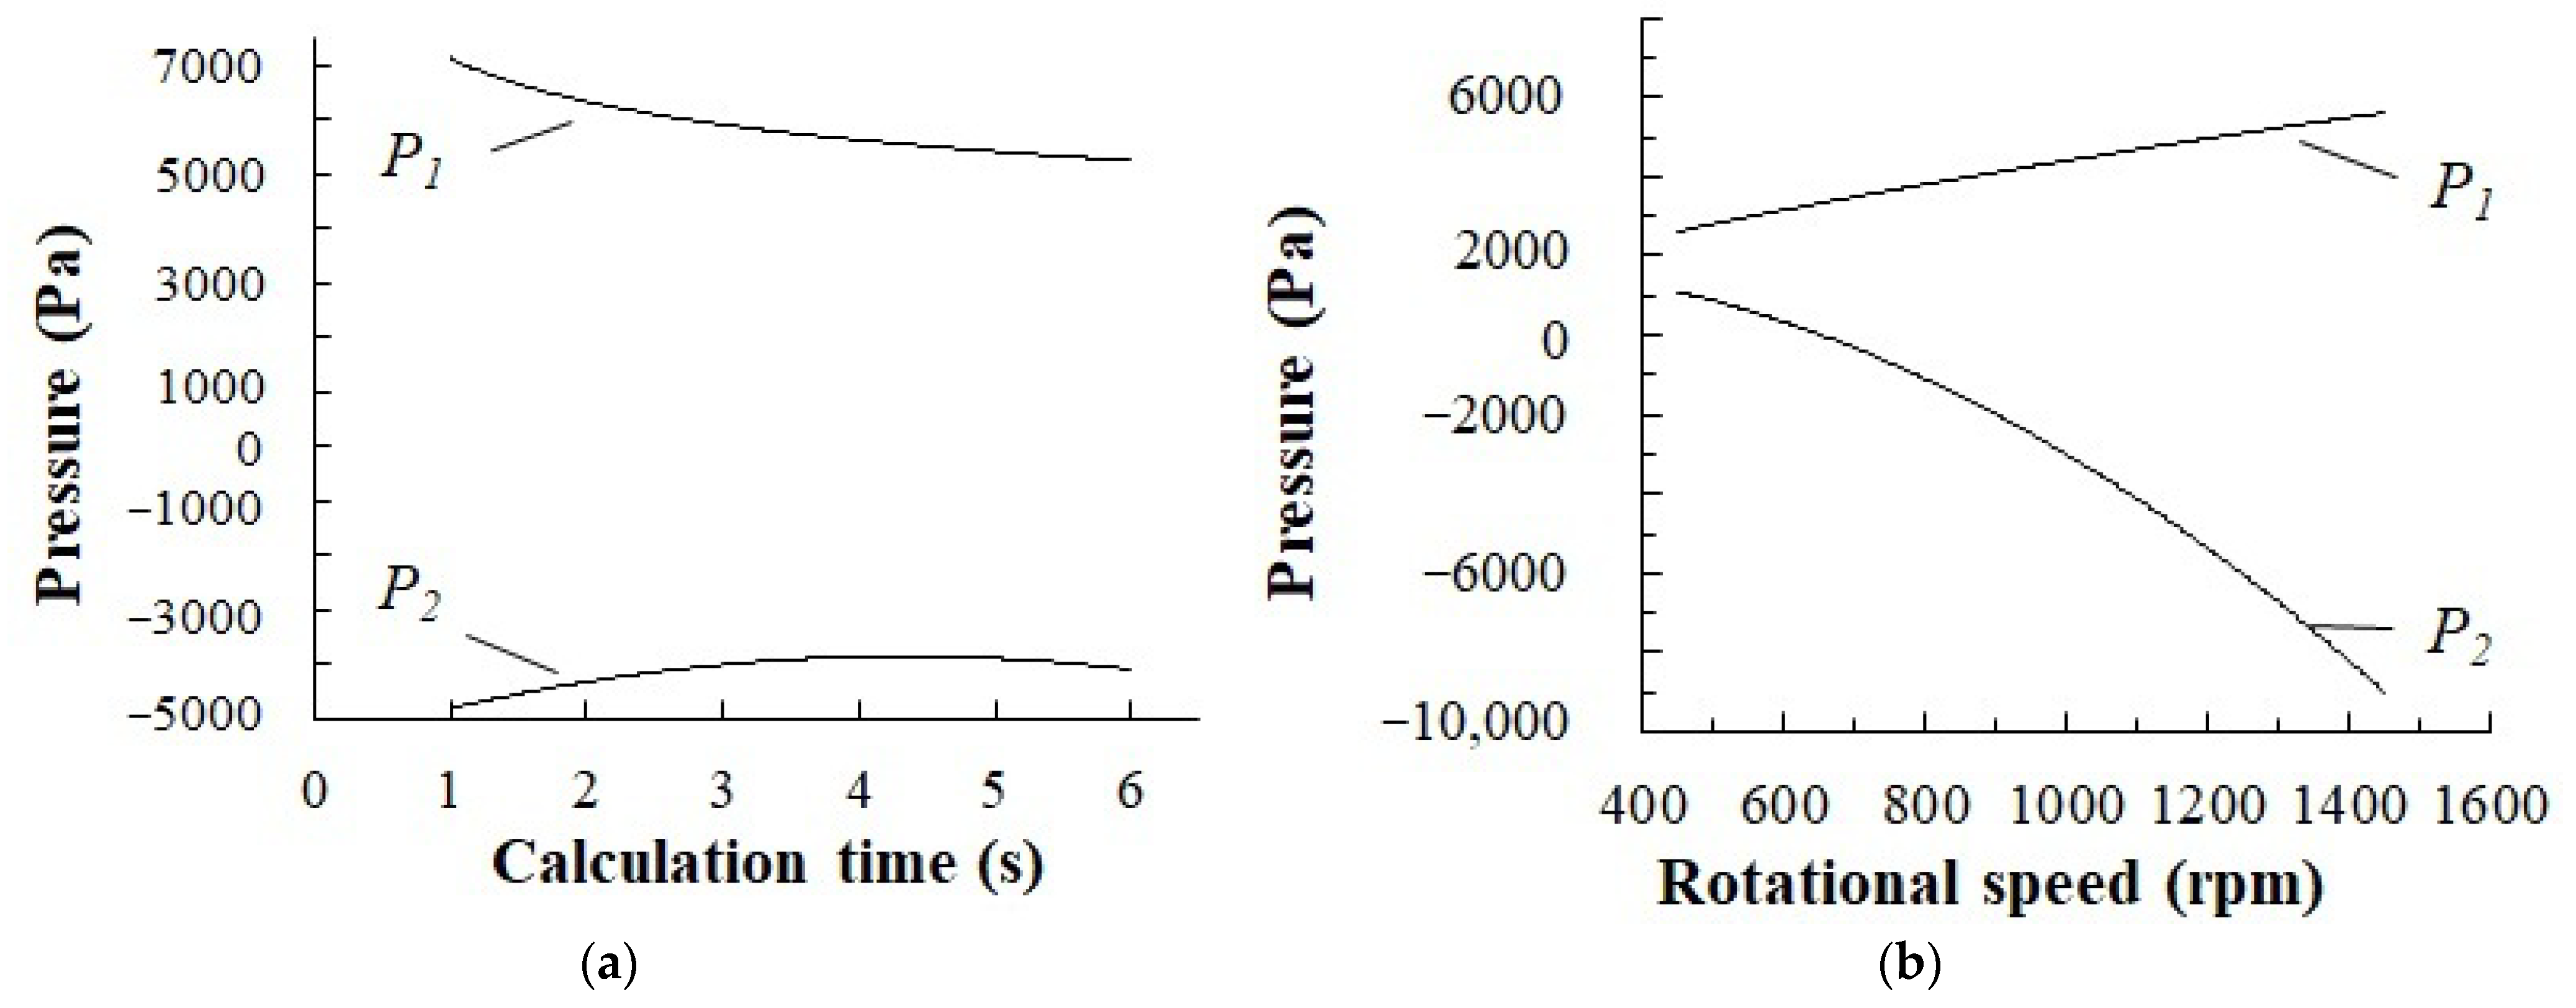
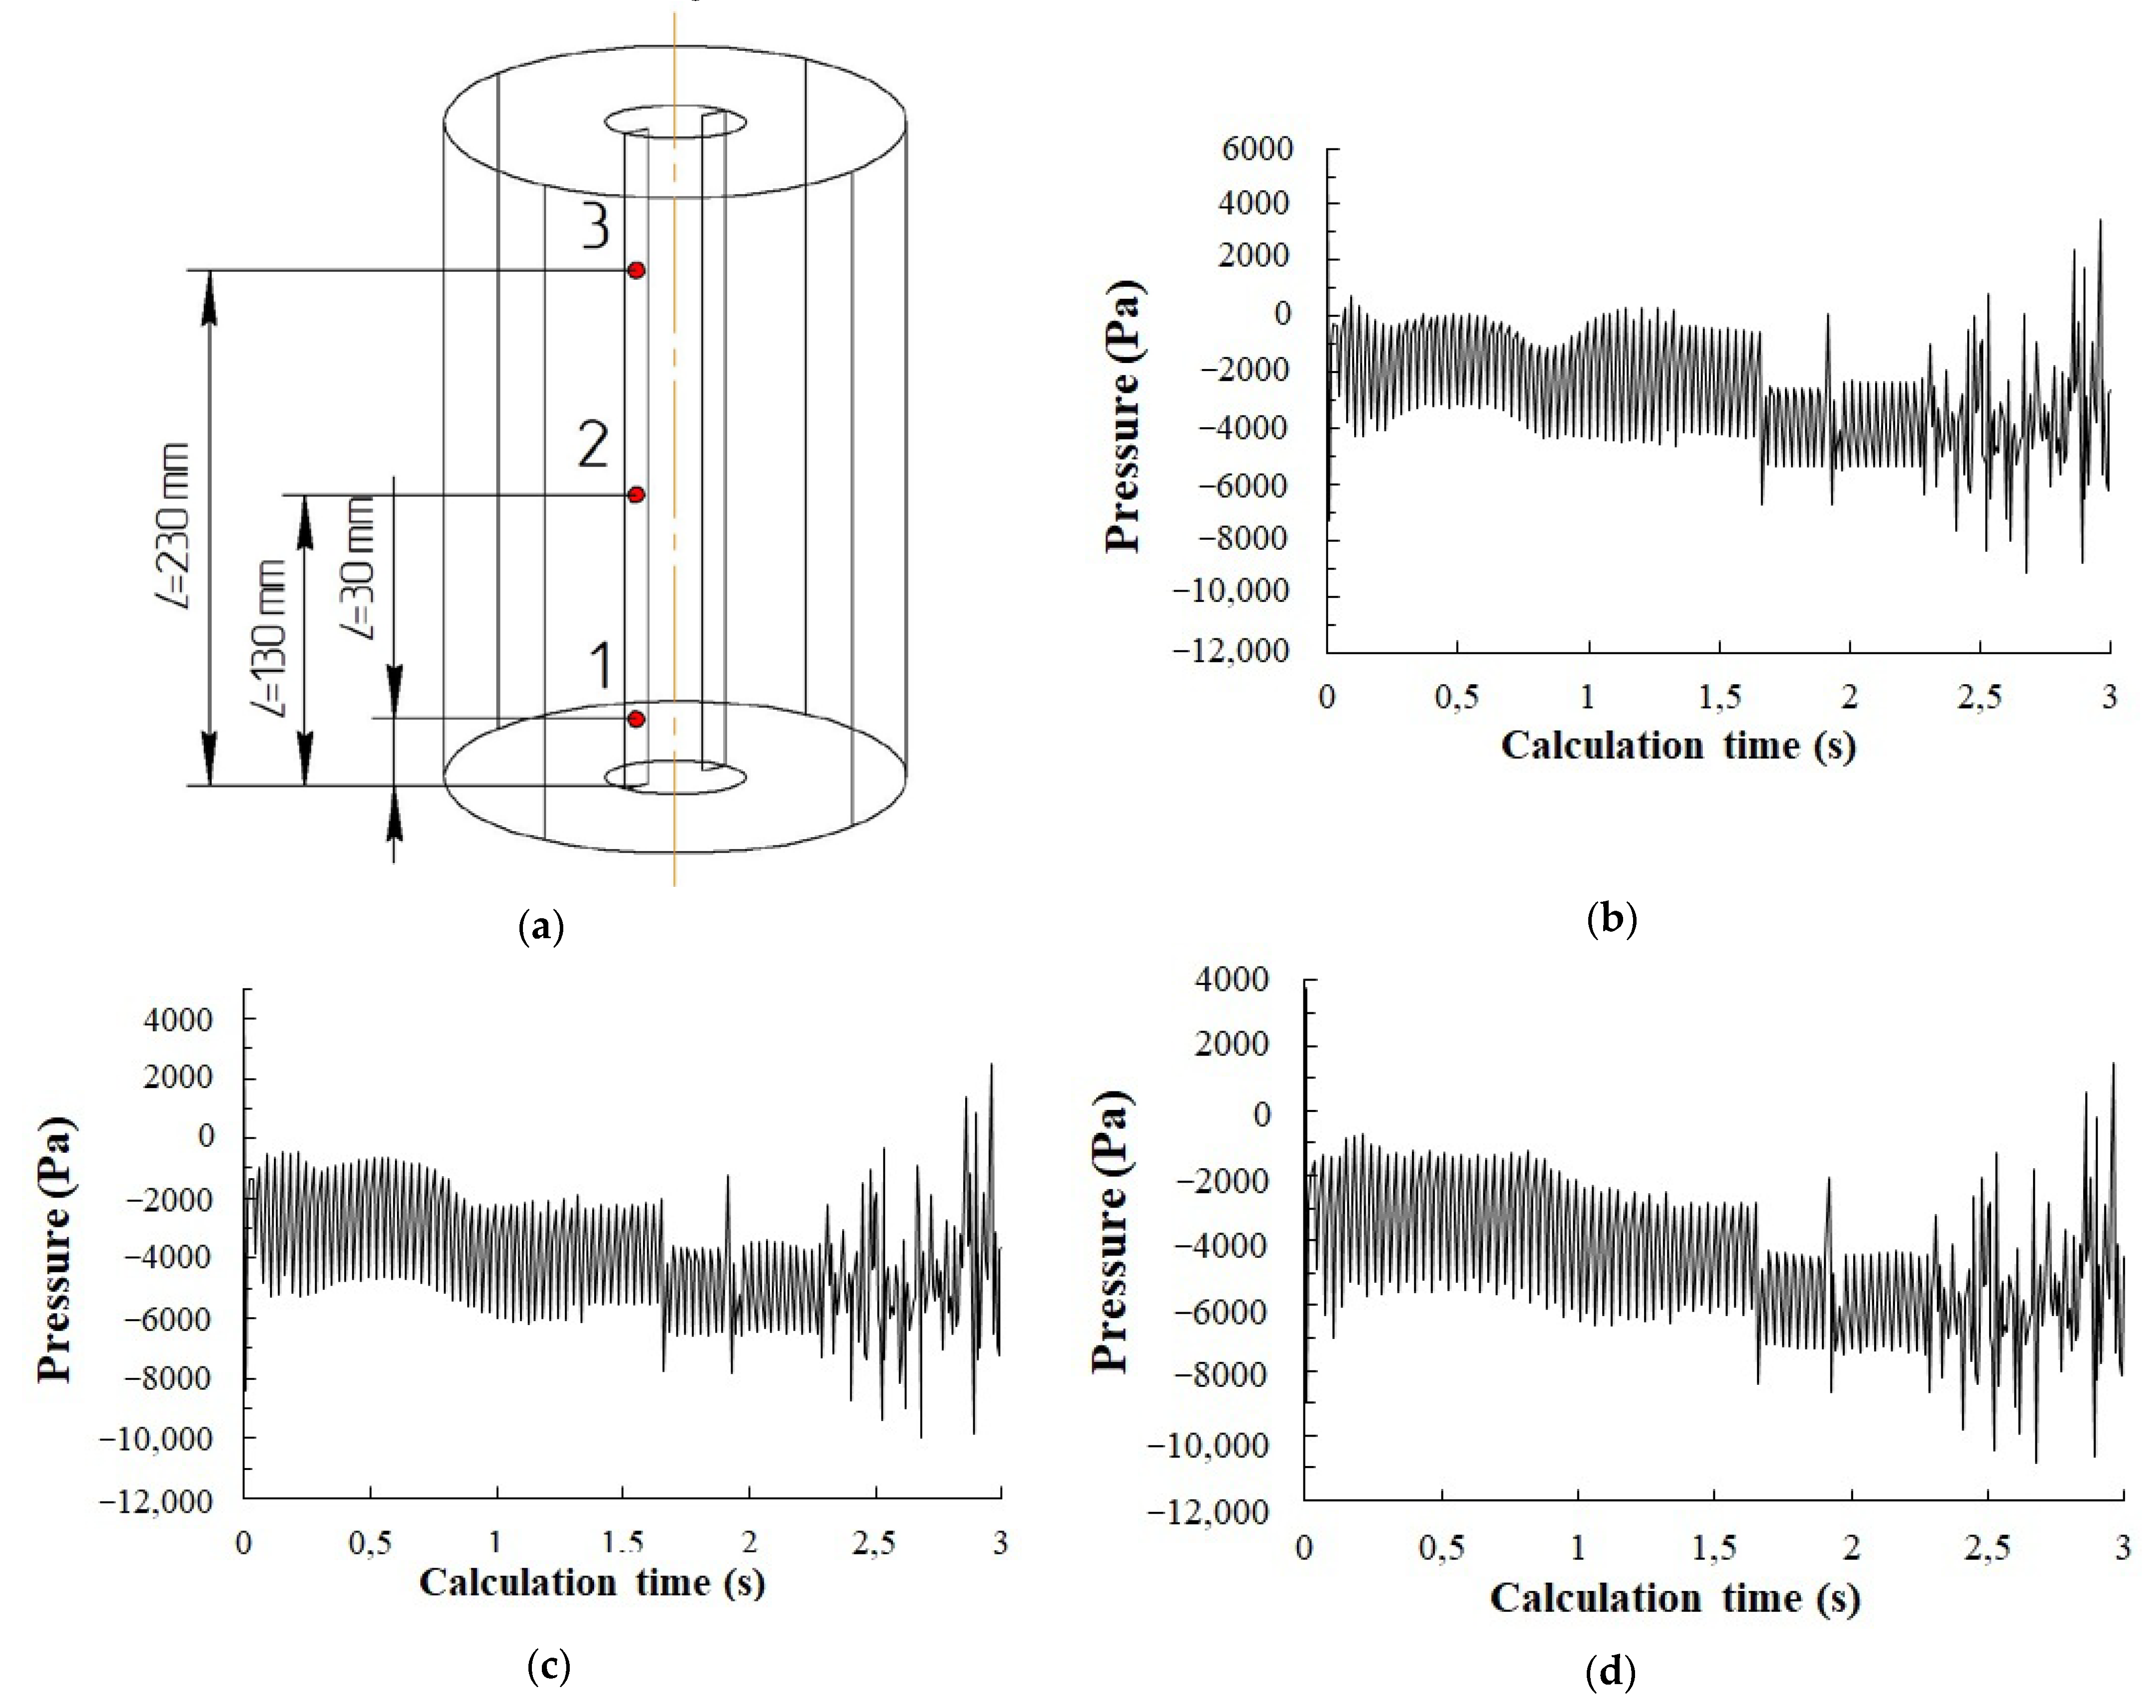
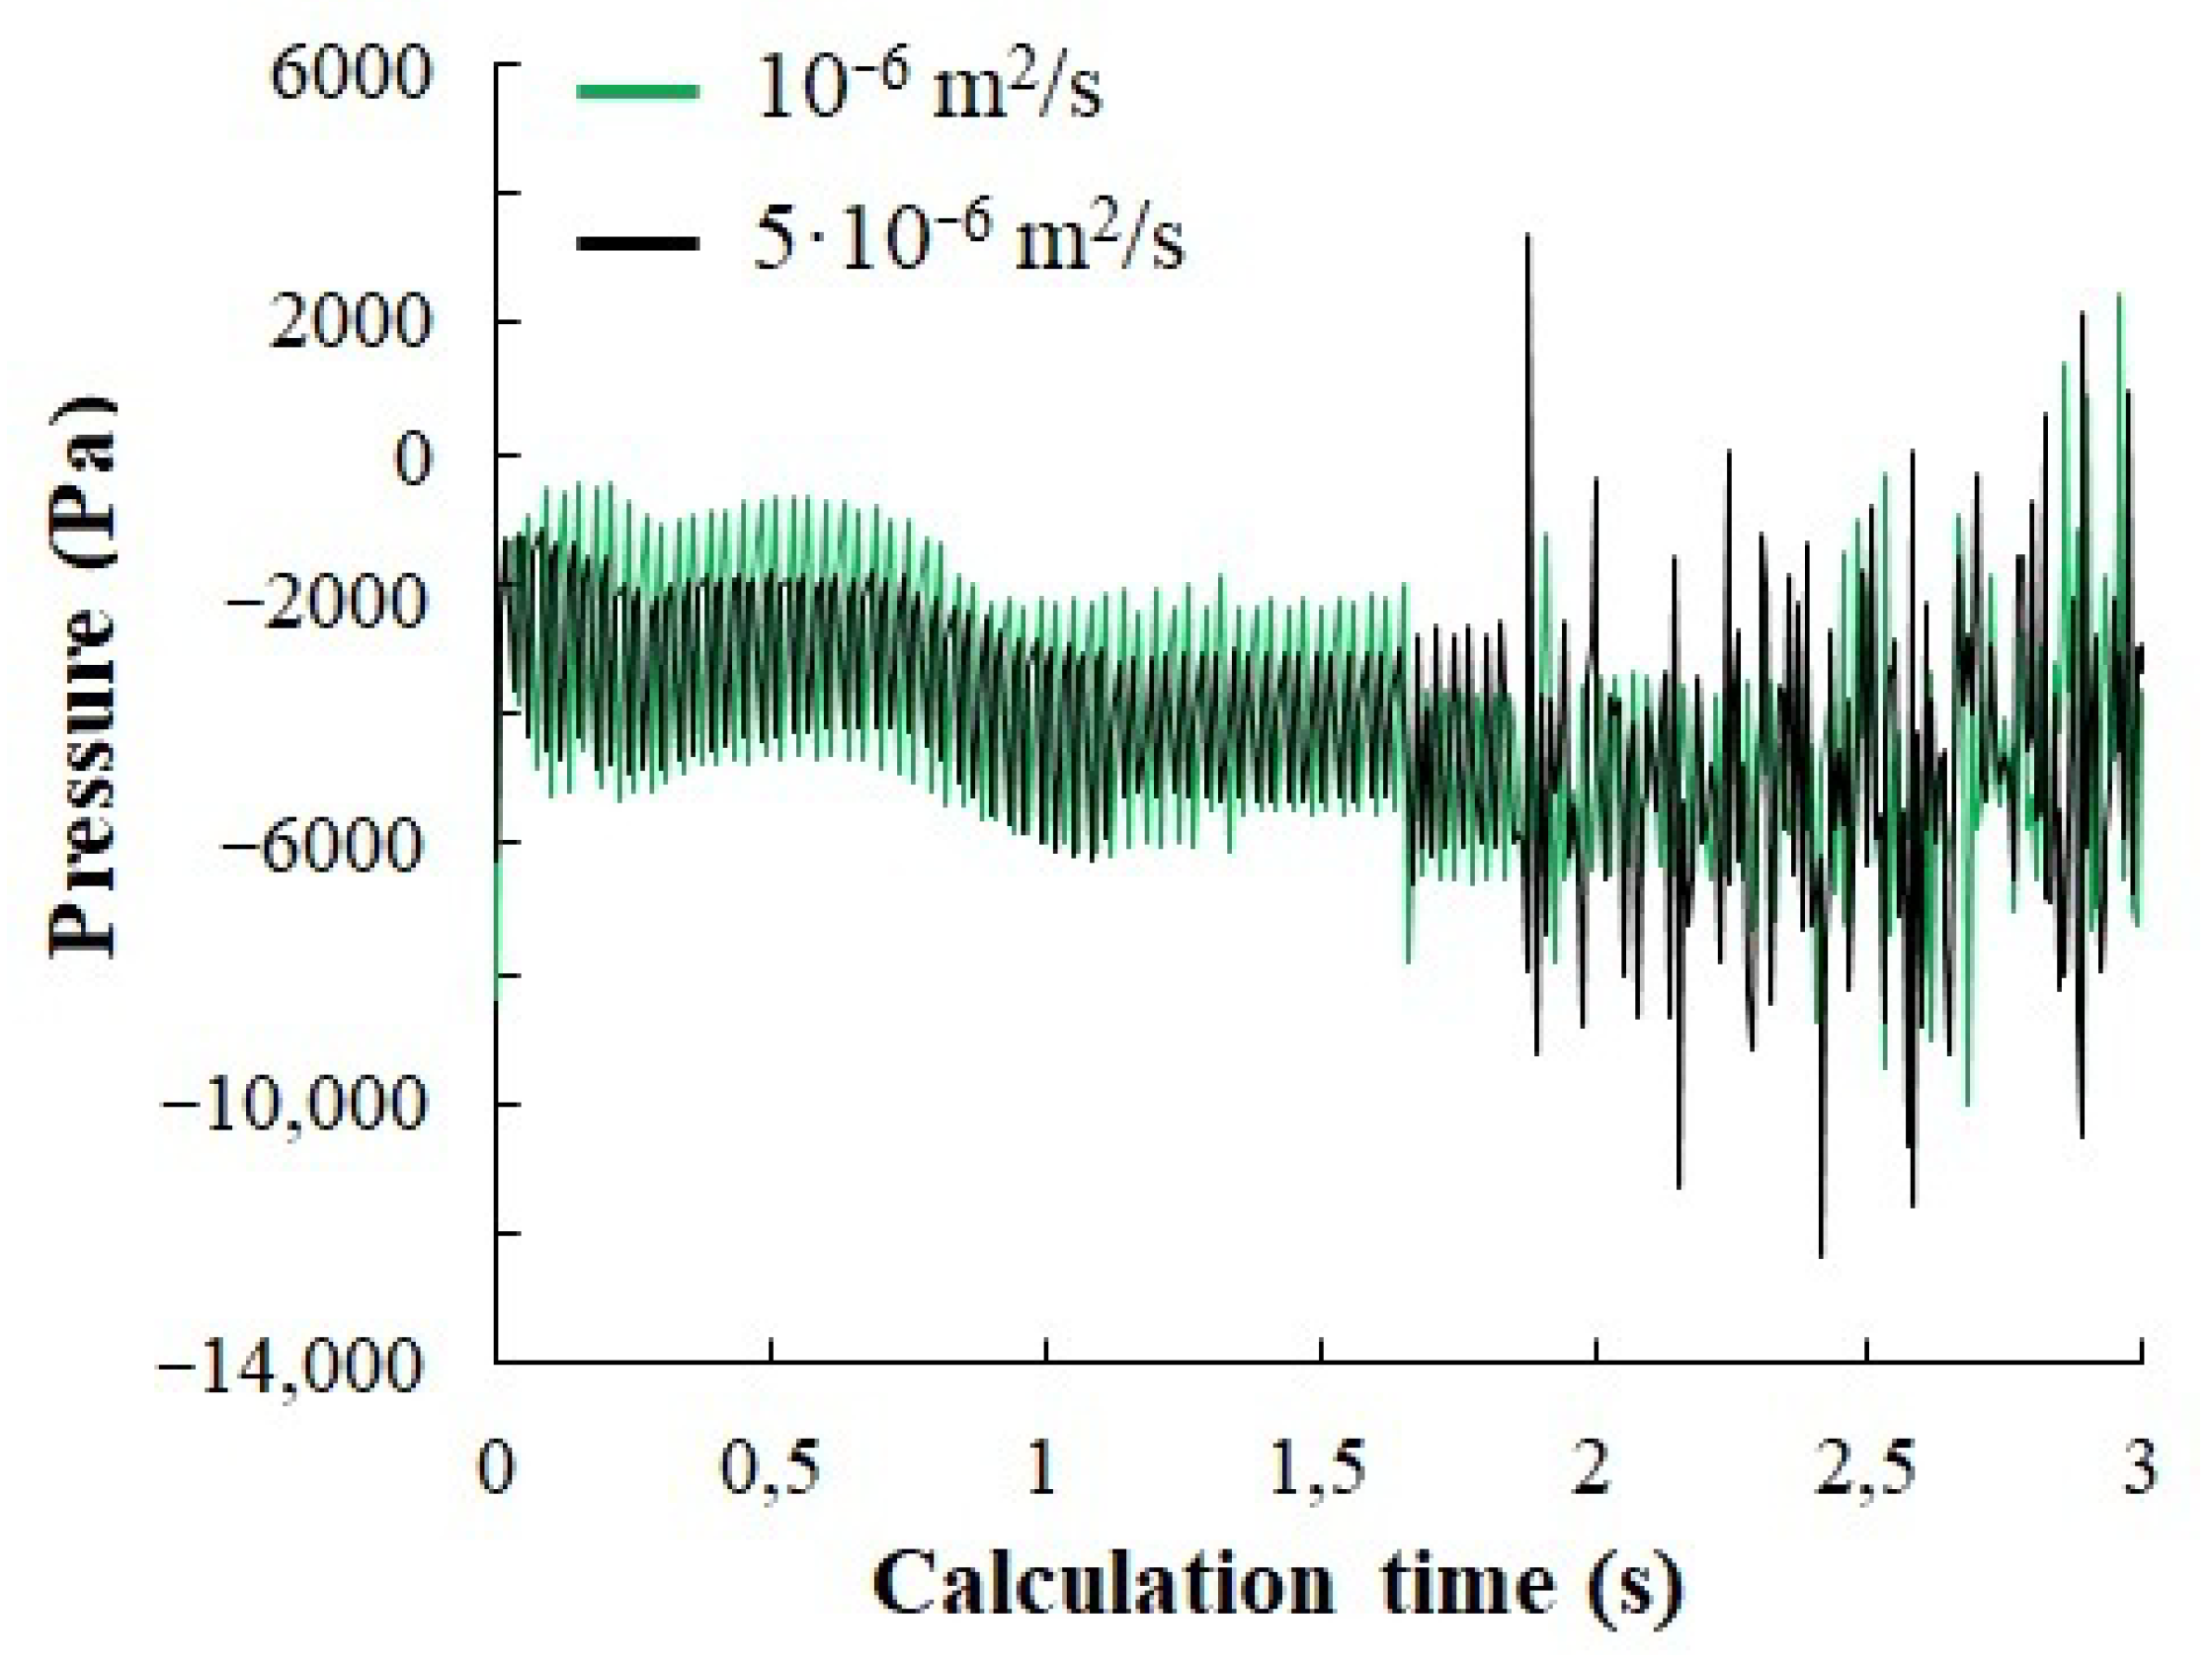
- The presence of reduced pressure regions in liquid behind the rotating stirrer paddle has been experimentally found and confirmed through the numerical simulation method. Intensive gas dispersion has been discovered to occur as the pressure drop between the liquid region behind the paddle and the vortex gas cavity exceeds 1000 Pa. A condition for the intensive dispersion of gas from the vortex cavity into the reduced pressure region is the need to keep the gas cavity open in the stirrer location, to keep the liquid on the paddle surface and to maintain the stirrer rotation velocity of 600 rpm or more.
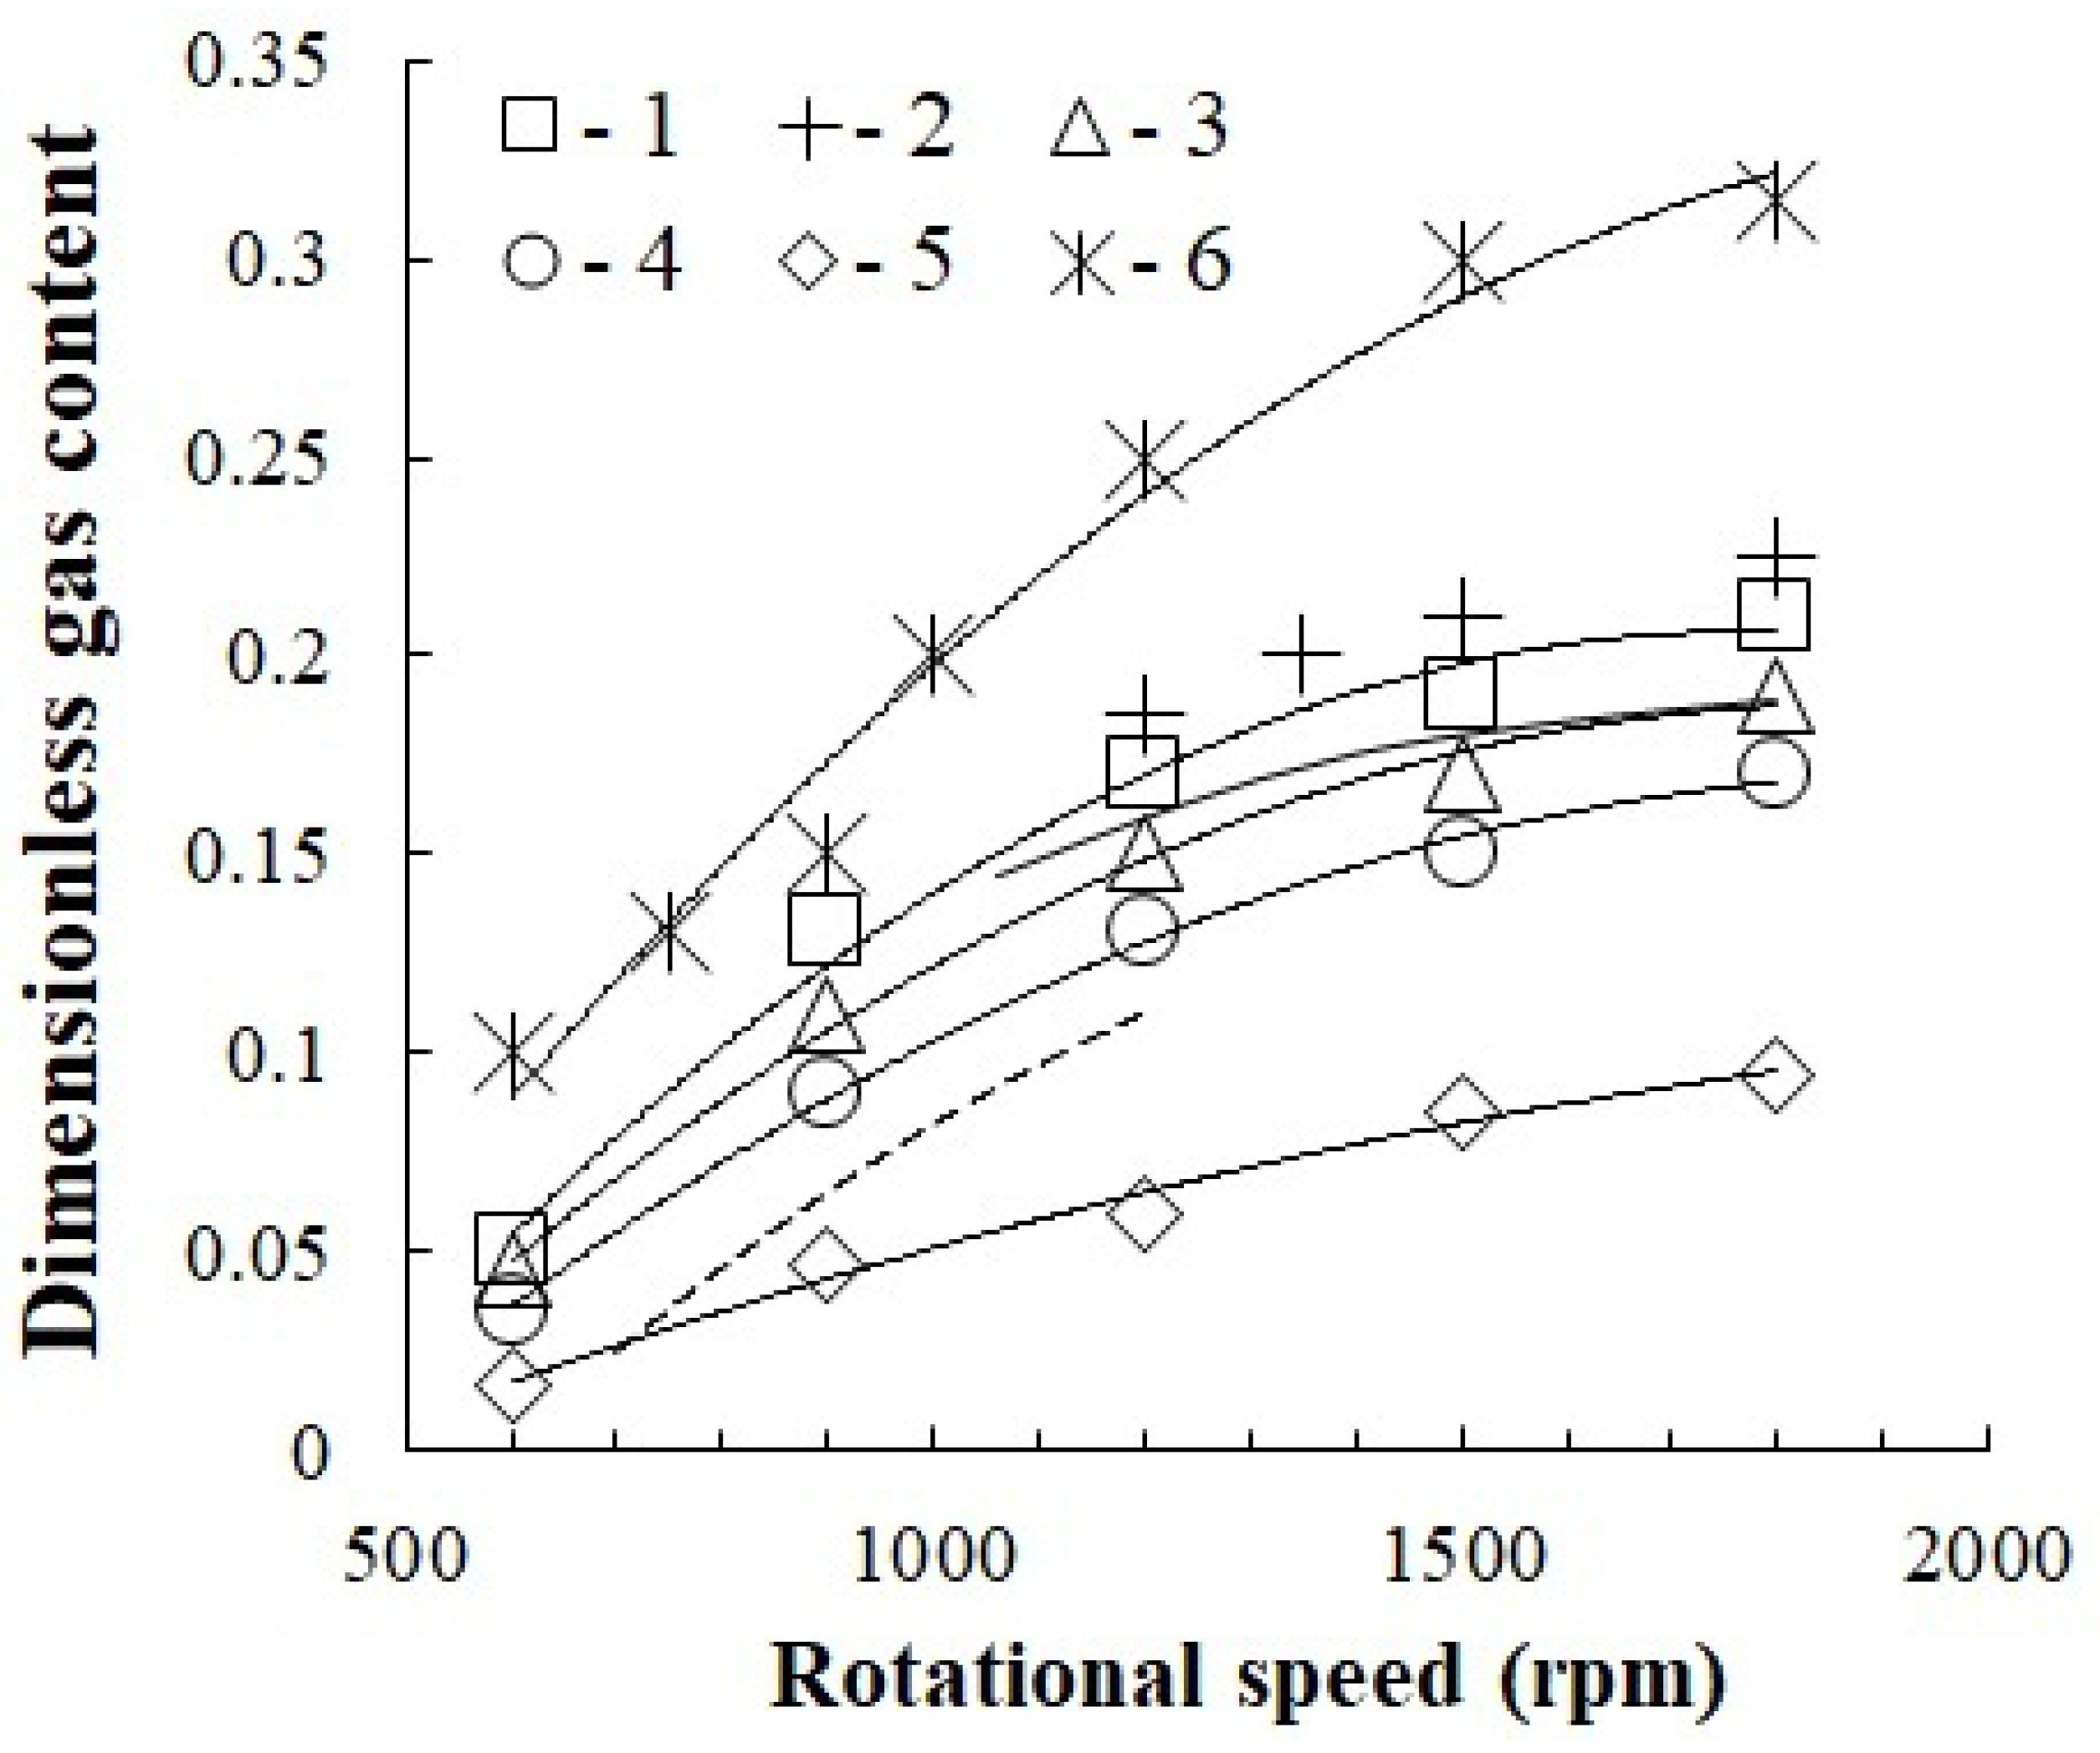
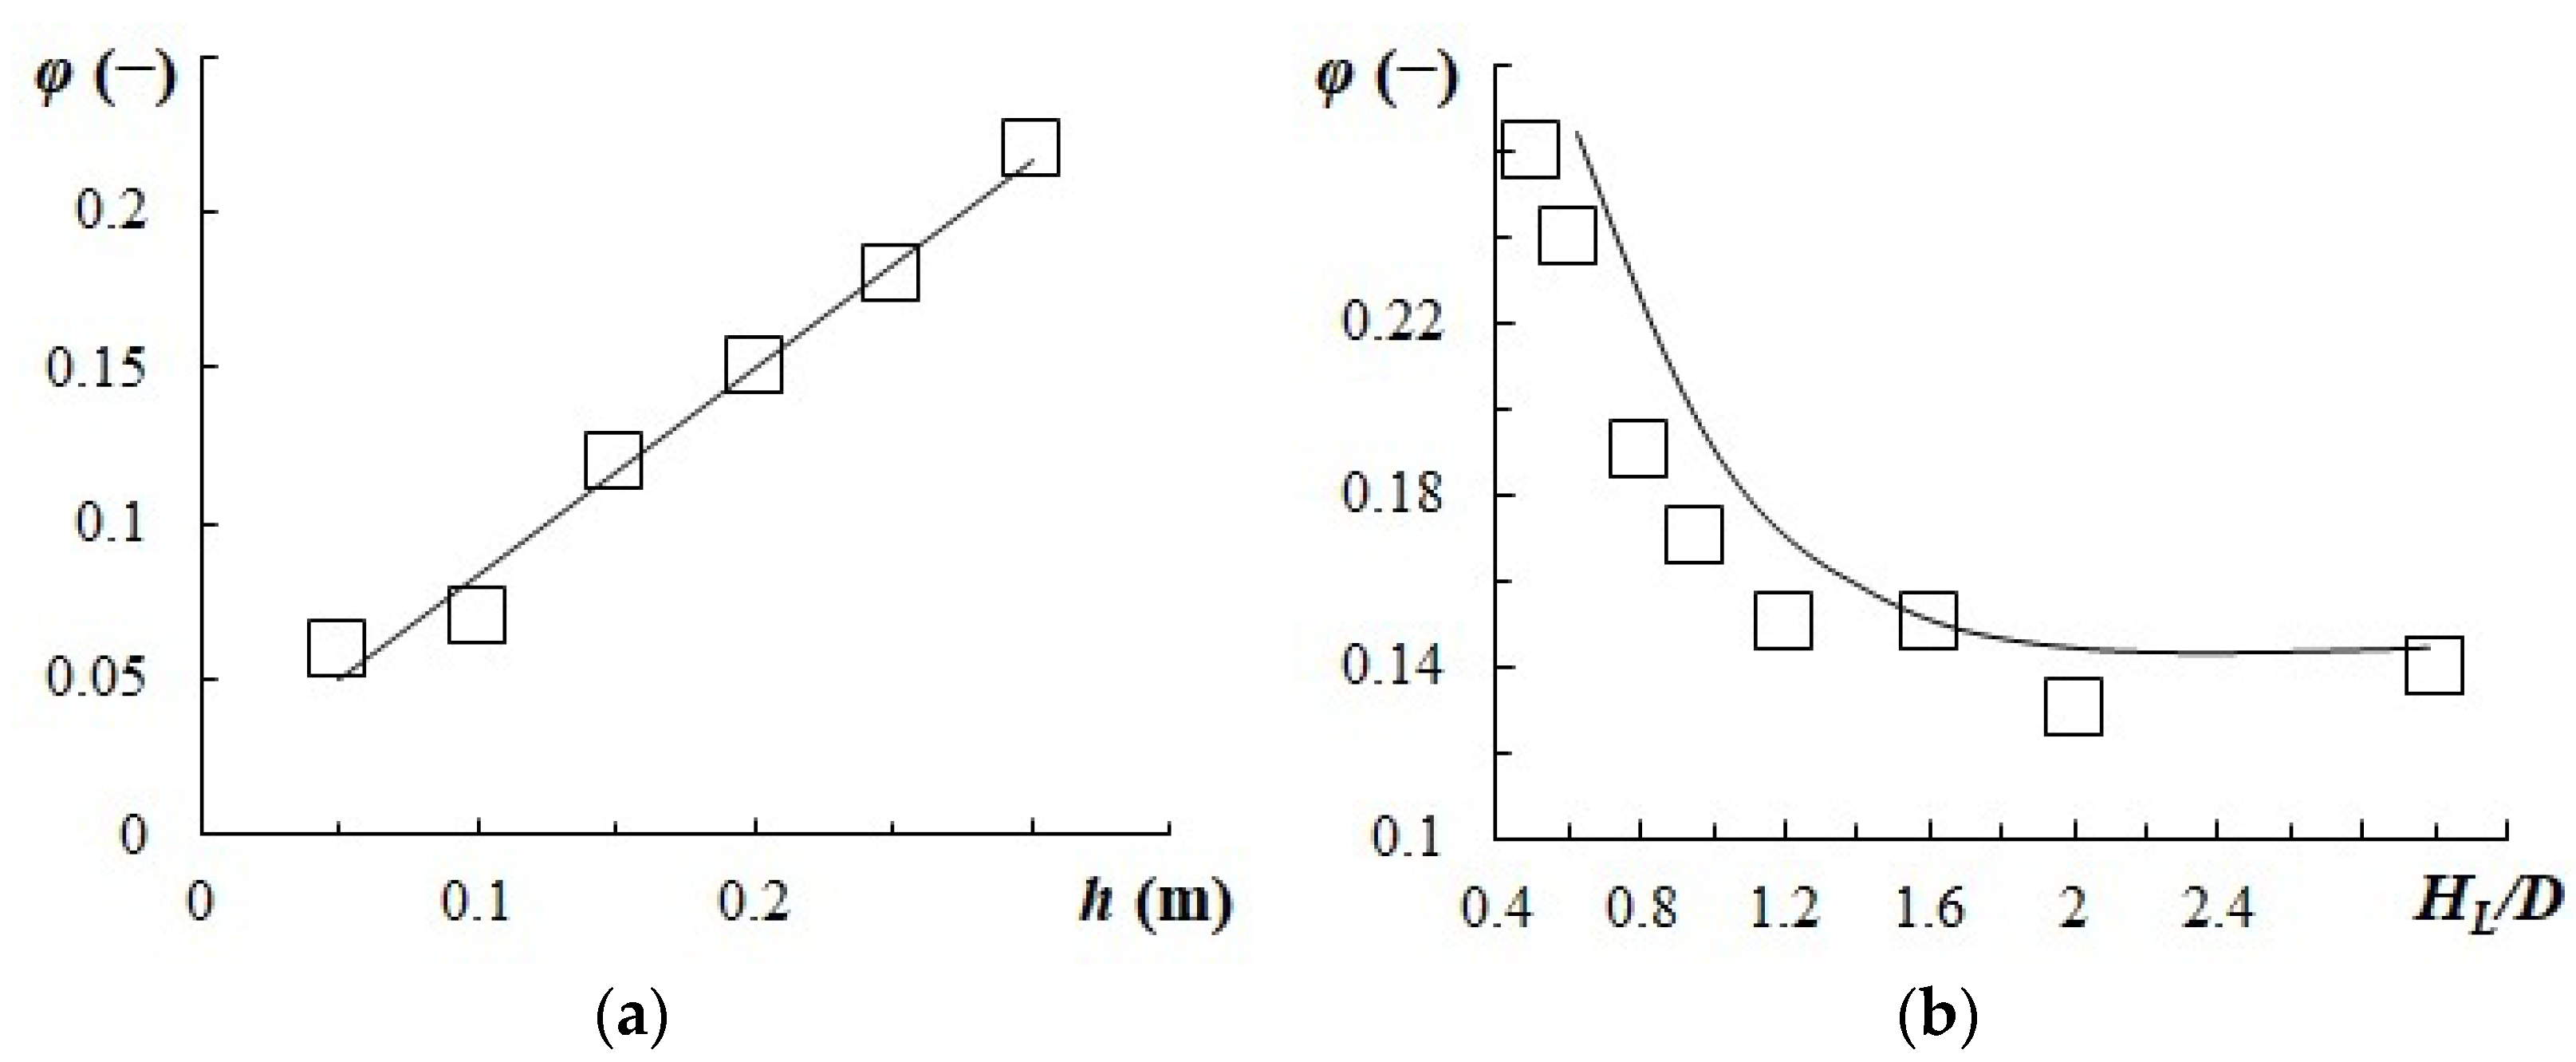
- The gas content value, gas bubble diameter, and phase surface were determined from the experiment. An increase in the paddle height was shown to lead to higher gas content and energy dissipation.
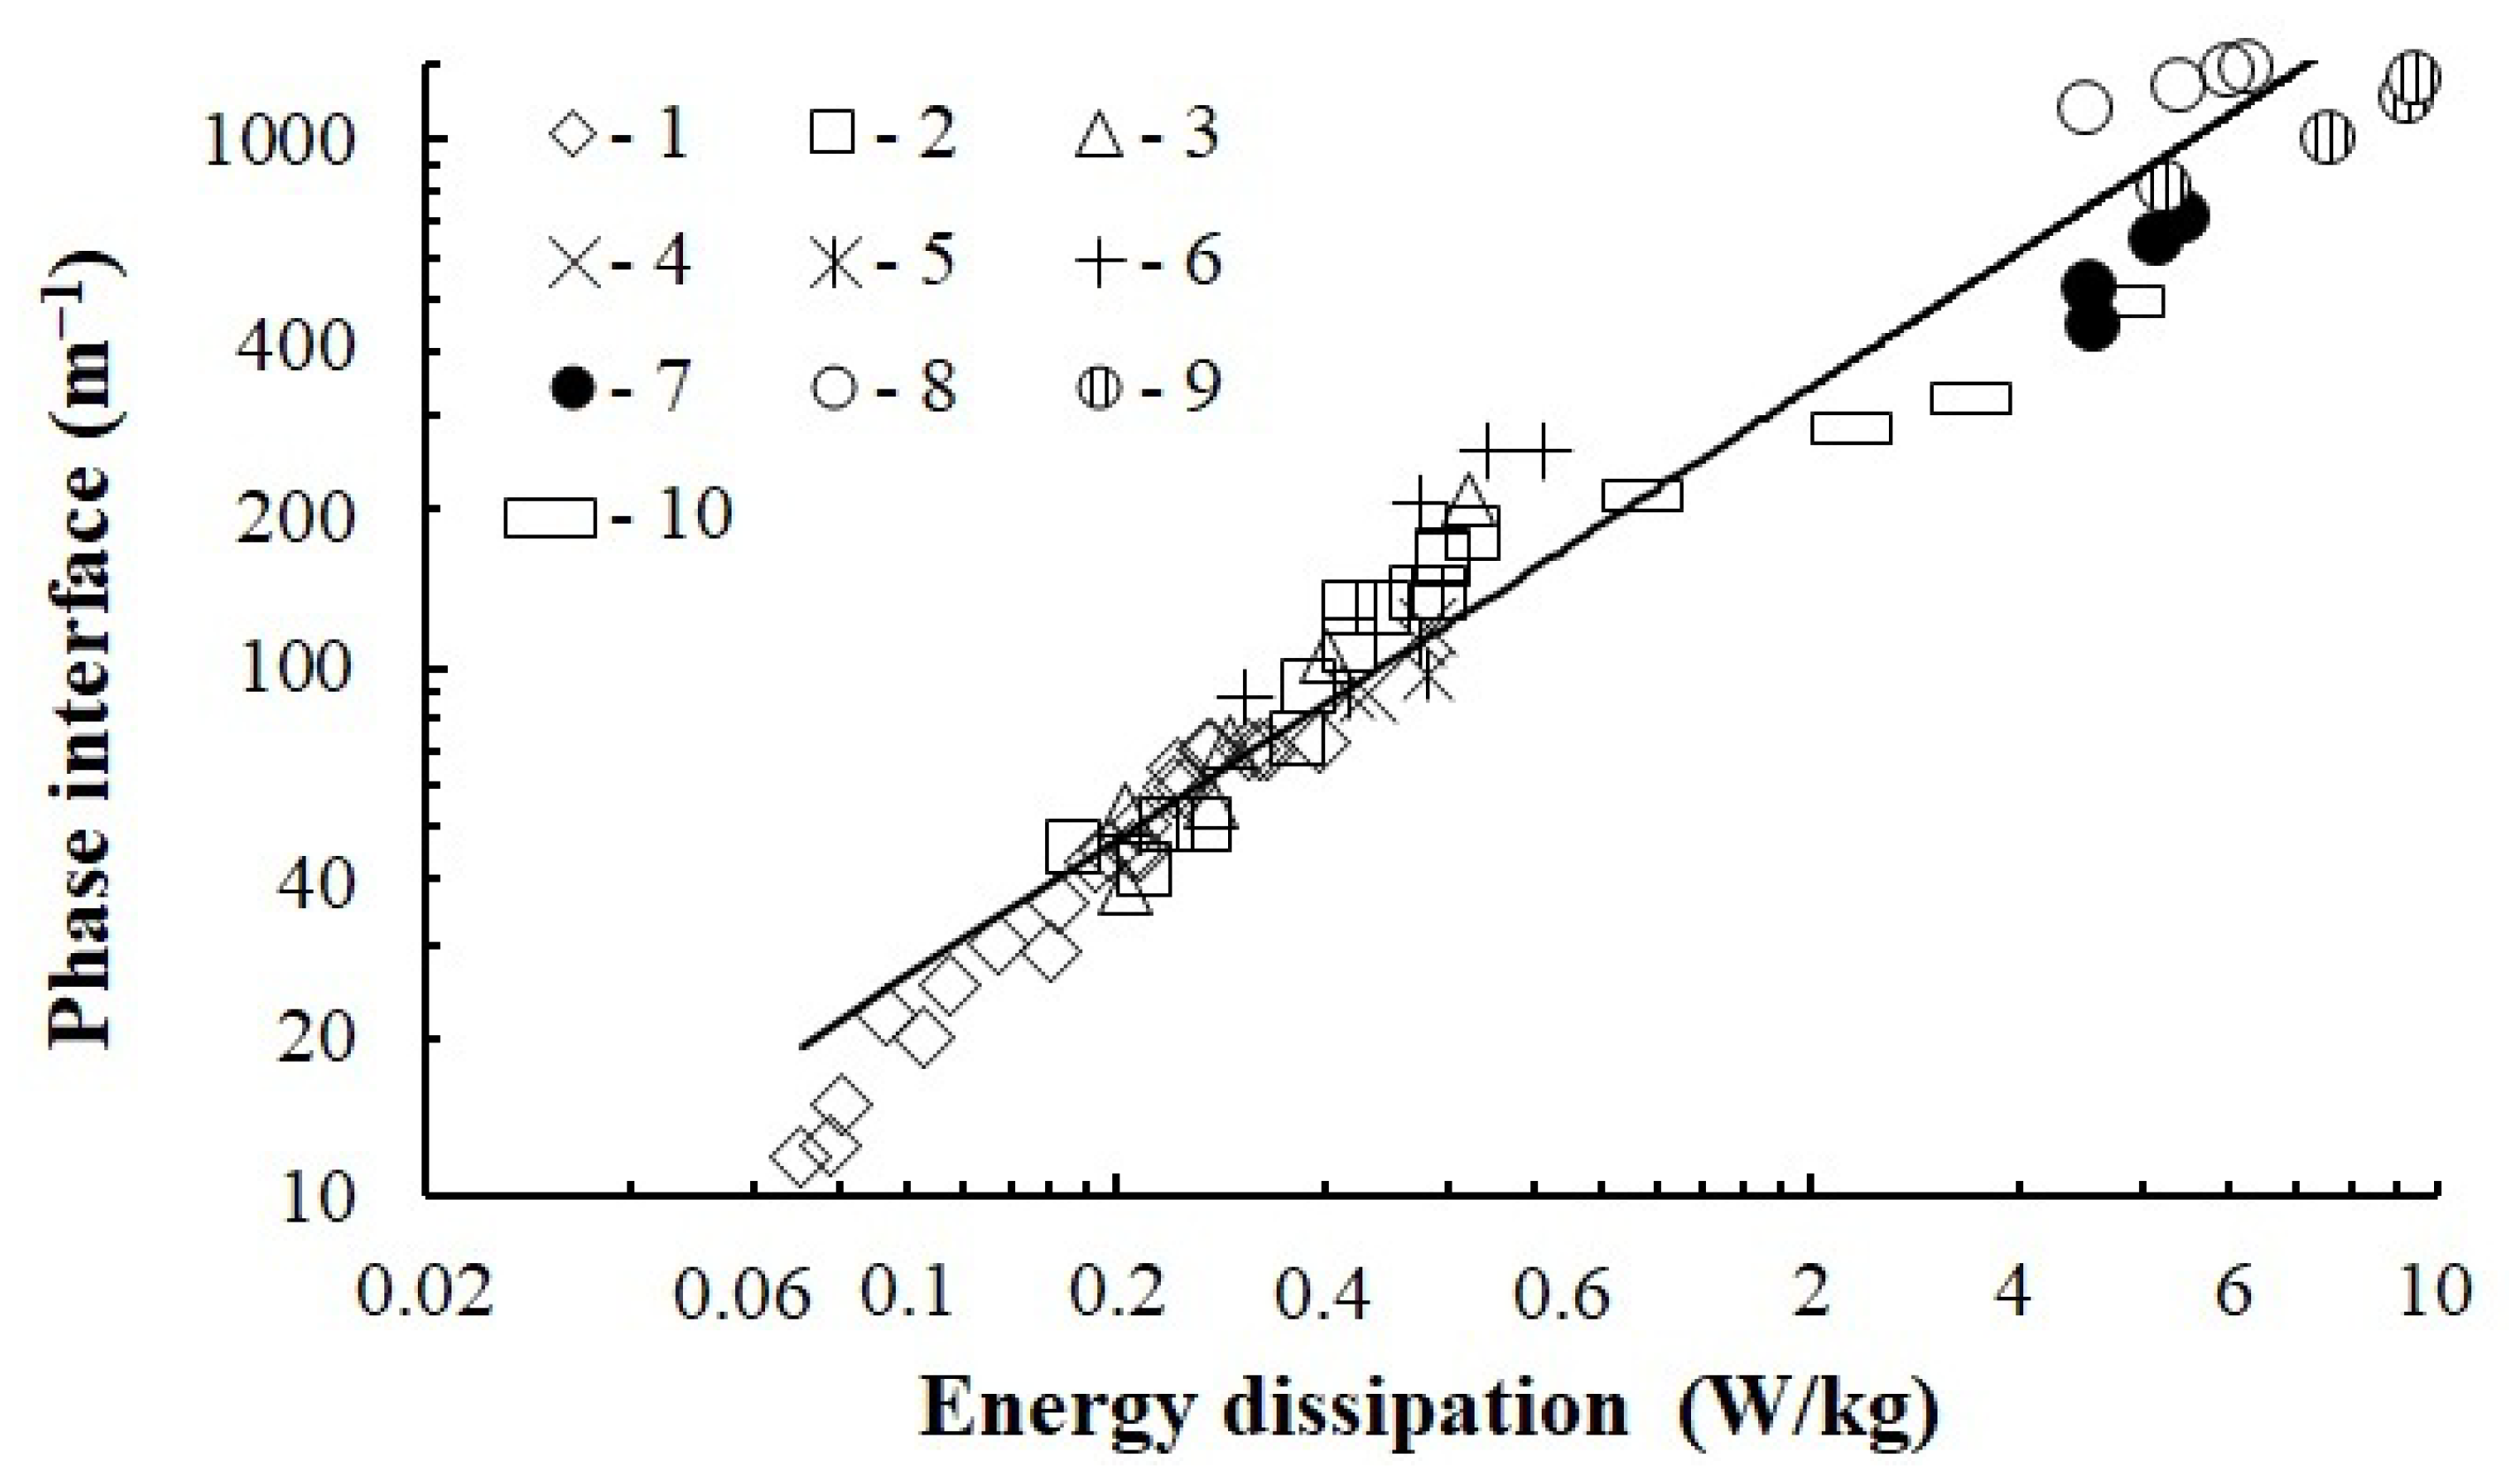
- With the presented method, gas–liquid dispersion allows developing the phase separation border to 1000 m−1 and the mass exchange coefficient to 1200 h−1 without mechanical gas feeding into the apparatus.
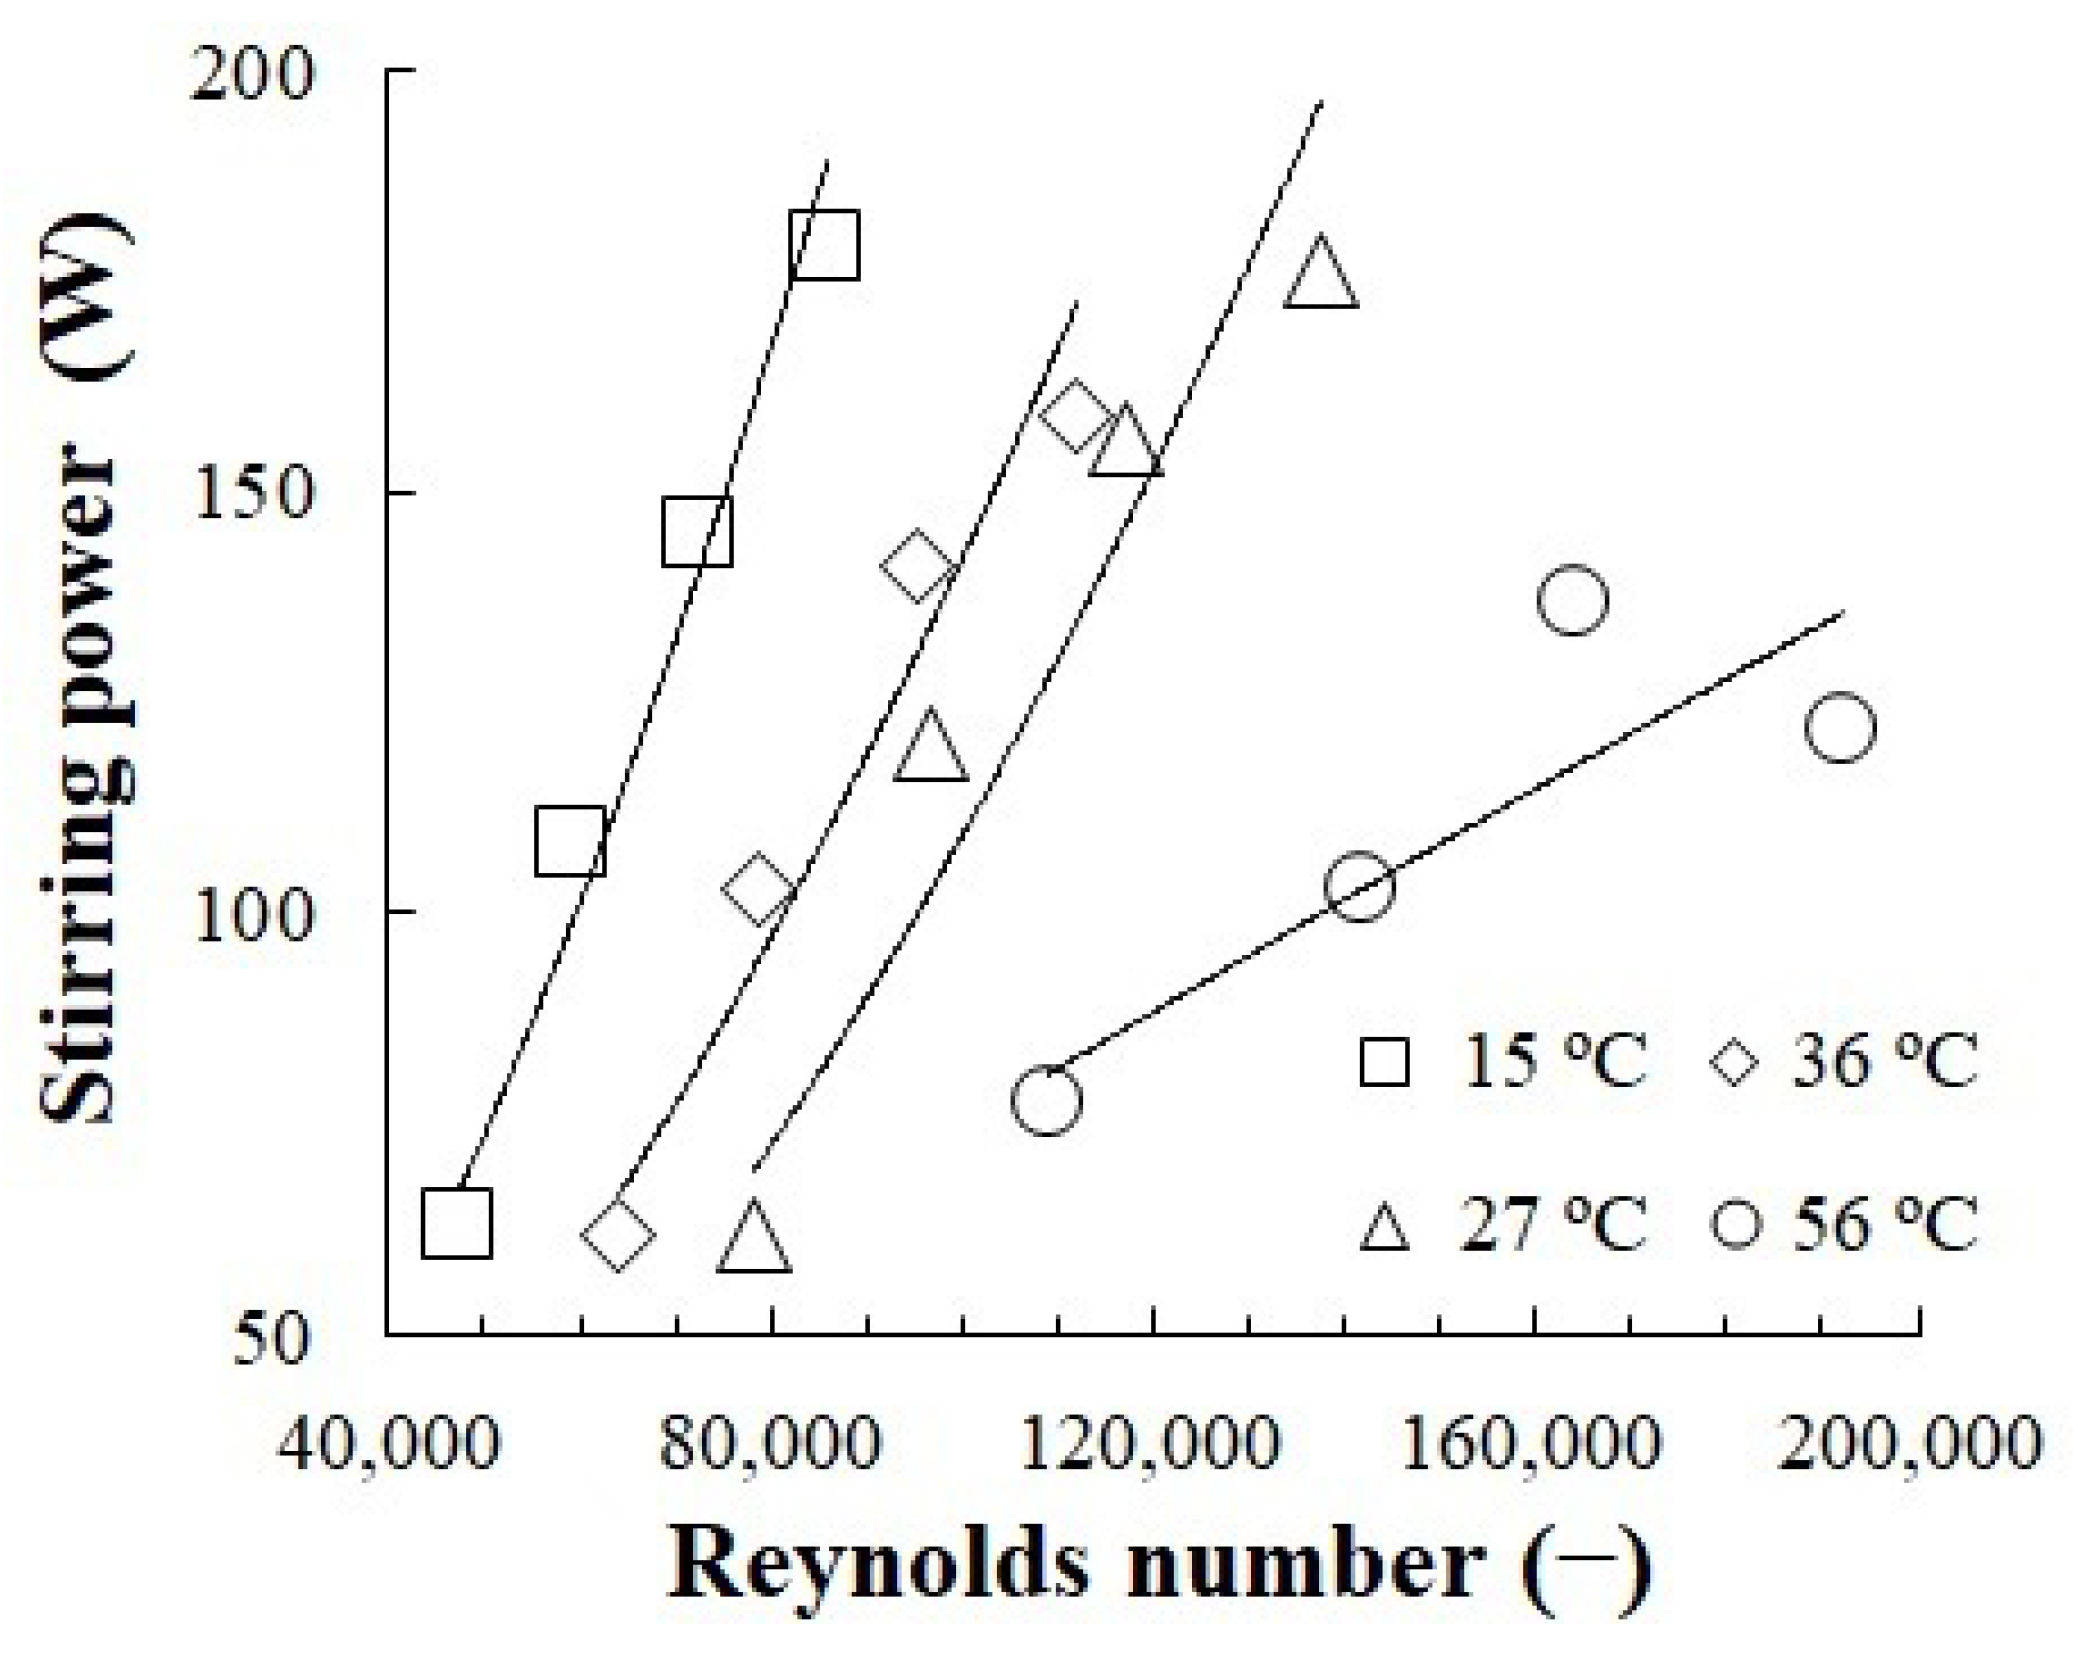
- The dependency of the stirrer power criterion on Reynolds number was determined. An increase in the gas content was proven to lead to a decrease in the KN value. At rotation speeds of 1200–2400 rpm and a gas content of 0.15–0.2, the power criterion calculated by factoring in the gas content value in the intensive dispersion region equals to KN = 4–5.
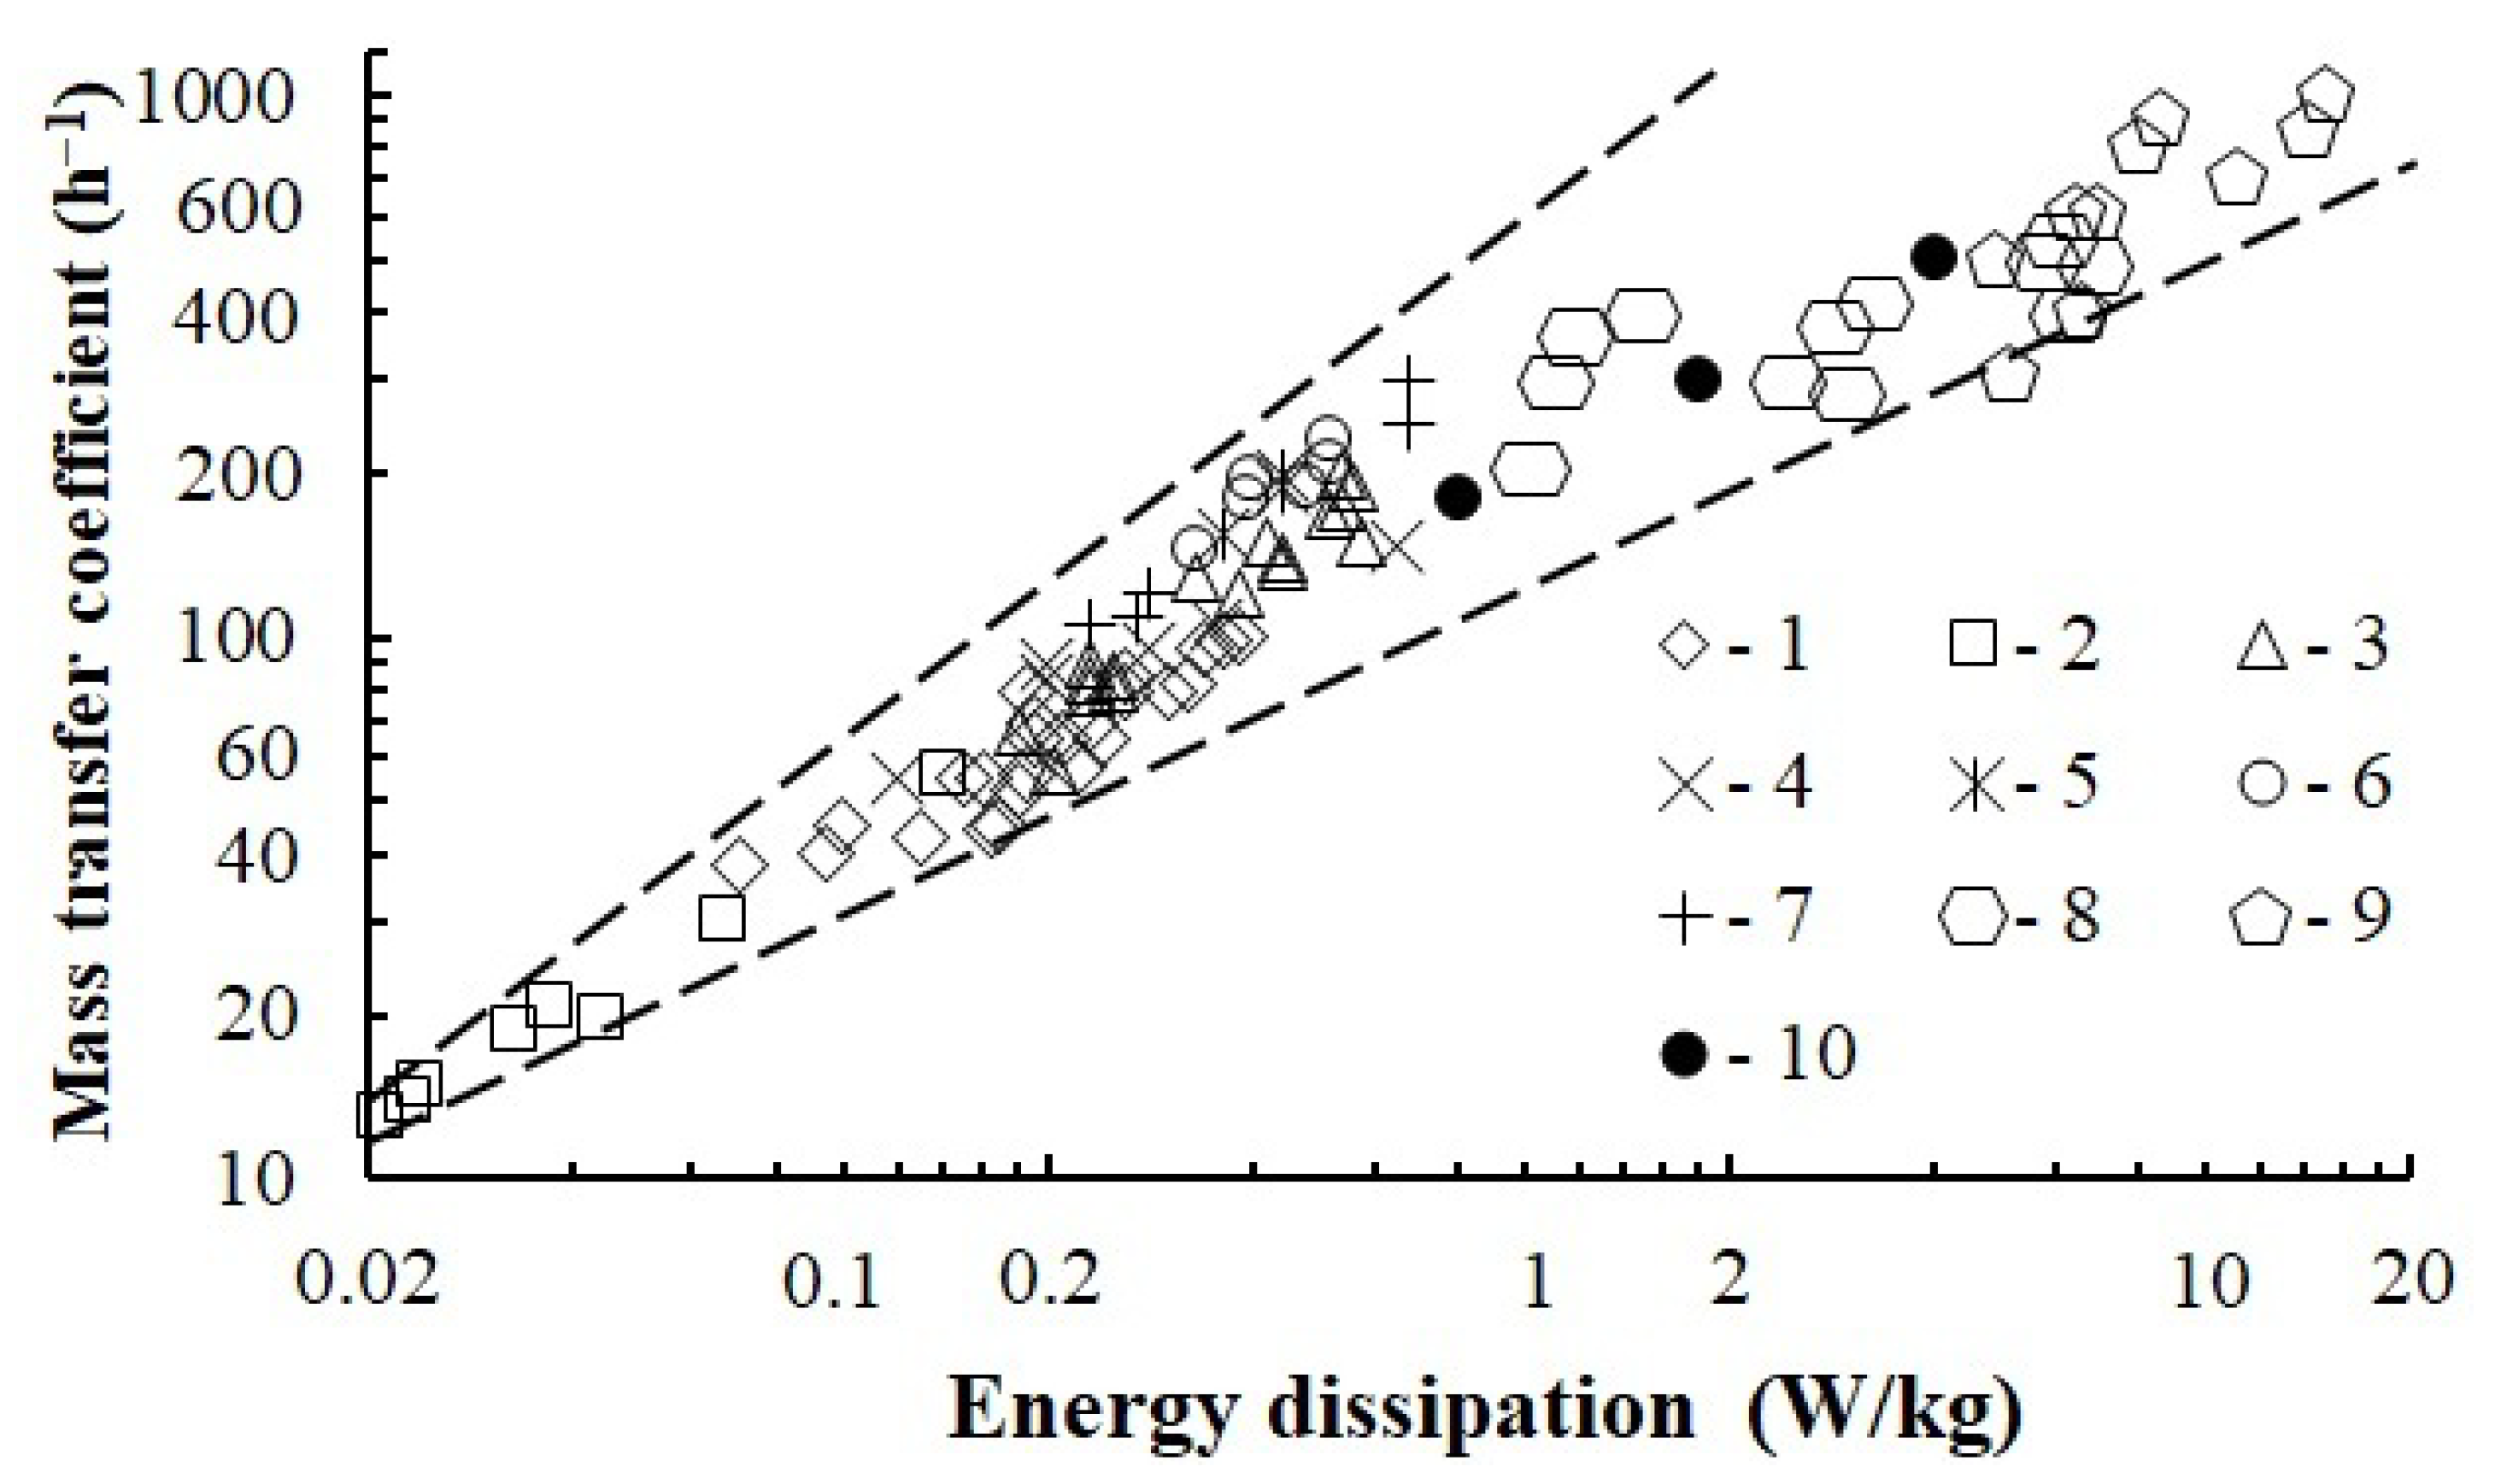
- The study demonstrates that with the intensive gas dispersion method, the mass transfer coefficient values are comparable with those calculated for the apparatus with a turbine stirrer with a gas supply of 7–20 m3/h. In this case, energy dissipation of the rotating stirrer reaches 25 W/kg.
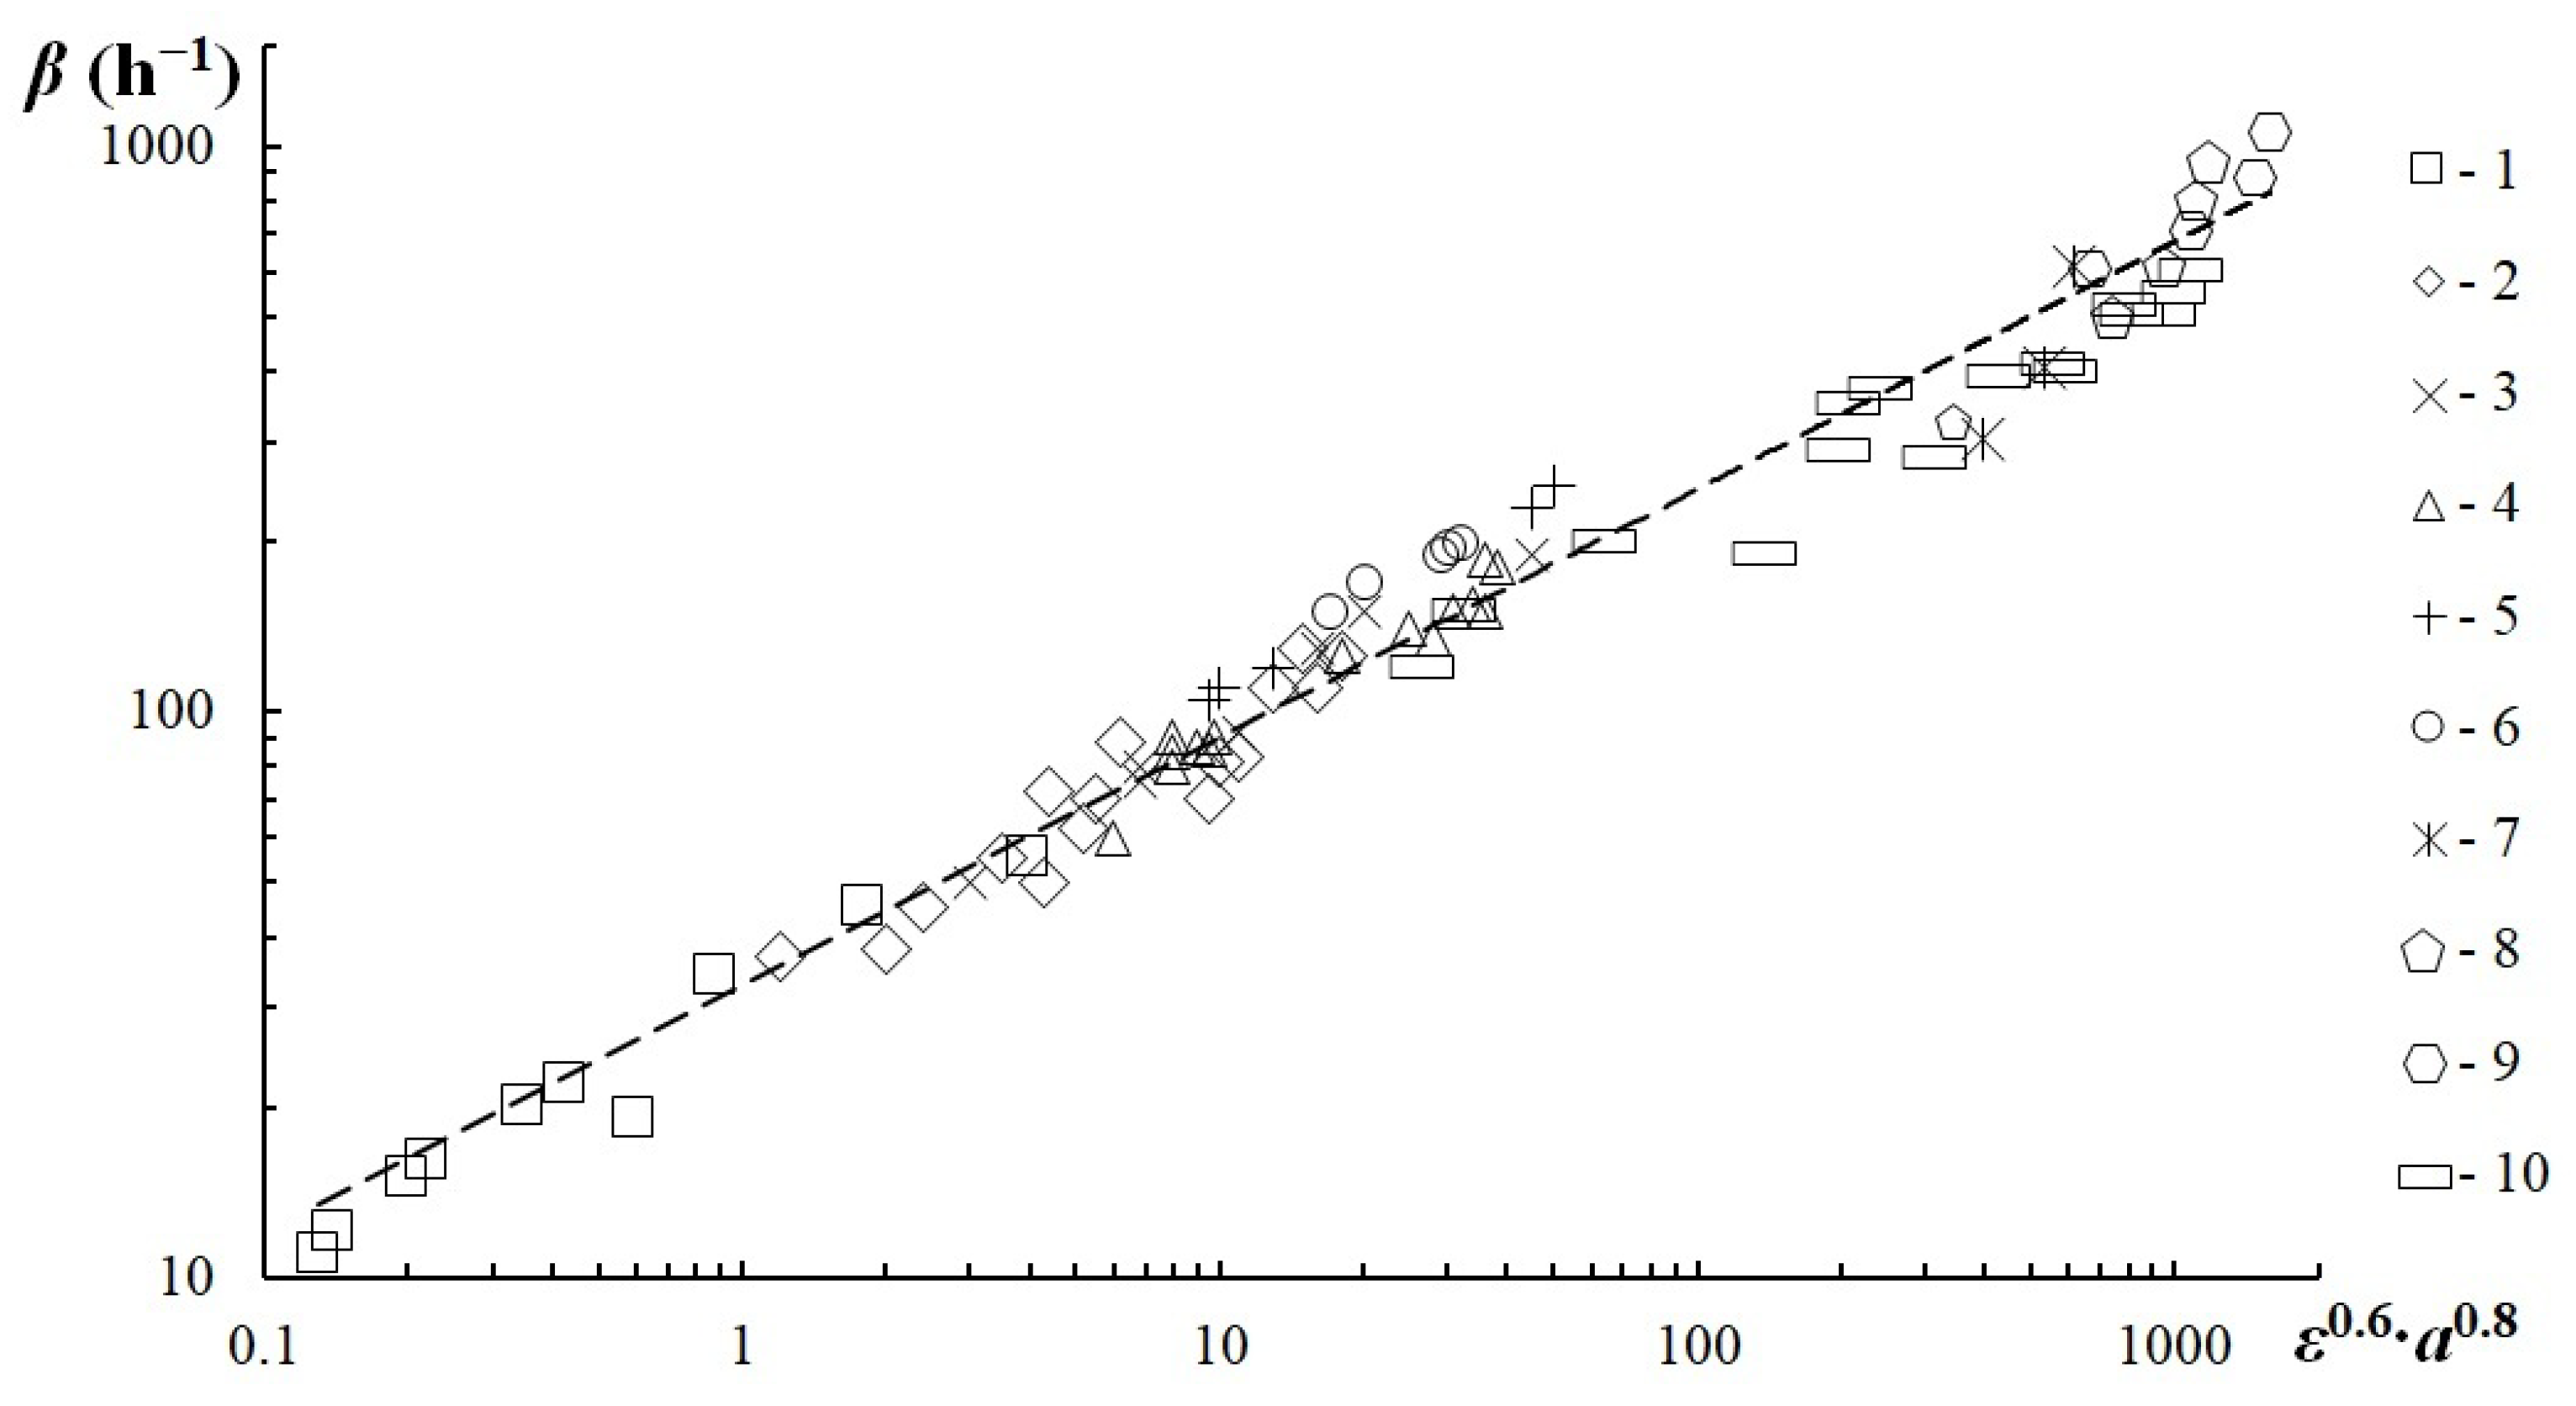
- The dependency for calculating the mass transfer coefficient inside the apparatus with the dispersion method developed was made to factor in energy dissipation and phase surface in further calculations.
Author Contributions
Funding
Data Availability Statement
Acknowledgments
Conflicts of Interest
Abbreviations
| A | coefficient |
| a | interphase surface (m−1) |
| b | width paddle (m) |
| c | oxygen concentration in the liquid (kg/m3) |
| D | body shell diameter (m) |
| Dl | oxygen diffusion coefficient in water (m2/s) |
| d | diameter (m) |
| E | internal energy of gas (W) |
| H | height (m) |
| h | height paddle (m) |
| KN | dimensionless power criterion |
| L | readout altitude (m) |
| m | liquid mass (kg) |
| N | stirring power (W) |
| n | rotational speed (rpm) |
| Ni | number of a certain size of bubbles (pcs) |
| P | pressure (Pa) |
| Q | liquid flow rate (m3/s) |
| Re | Reynolds number |
| Sc | Schmidt criterion |
| Sh | Sherwood criterion |
| s | stirrer pitch (m) |
| T | time (s) |
| u | velocity (m/s) |
| V | volume of liquid (m3) |
| β | mass transfer coefficient (h−1) |
| ε | energy dissipation (W/kg) |
| μ | medium dynamic viscosity coefficient (Pa·s) |
| ν | kinematic viscosity of the fluid (m2/s) |
| ρ | density (kg/m3) |
| σ | surface tension coefficient (N/m) |
| φ | dimensionless gas content |
| Indices | |
| * | steady-state |
| b | bubble |
| g | gas |
| g-l | gas–liquid |
| L | liquid |
| mix | mixture |
| s | stirrer |
| 0 | initial |
| 1 | maximum |
| 2 | minimum |
References
- Scargiali, F.; Busciglio, A.; Grisafi, F.; Brucato, A. Oxygen transfer performance of unbaffled stirred vessels in view of their use as biochemical reactors for animal cell growth. Chem. Eng. Trans. 2012, 27, 205–210. [Google Scholar]
- Tsao, G.T.N. Vortex behavior in the waldhof fermentor. Biotechnol. Bioeng. 1968, 10, 177–188. [Google Scholar] [CrossRef]
- Sokolov, V.N.; Yablokova, M.A. Microbiological Industry Equipment; Mashinostroenie: Leningrad, Russia, 1988; 278p. [Google Scholar]
- Rao, A.; Kumar, B.; Patel, A. Vortex behavior in an unbaffled surface aerator. Sci. Asia 2009, 35, 183–188. [Google Scholar] [CrossRef]
- Guan, X.; Li, X.; Yang, N.; Liu, M. CFD simulation of gas-liquid flow in stirred tanks: Effect of drag models. Chem. Eng. J. 2020, 386, 121554. [Google Scholar] [CrossRef]
- Scargiali, F.; Busciglio, A.; Grisafi, F.; Brucato, A. Gas–liquid–solid operation of a high aspect ratio self-ingesting reactor. Int. J. Chem. React. Eng. 2012, 10, 839–845. [Google Scholar] [CrossRef]
- Poncin, S.; Nguyen, C.; Midoux, N.; Breysse, J. Hydrodynamics and volumetric gas–liquid mass transfer coefficient of a stirred vessel equipped with a gas-inducing impeller. Chem. Eng. Sci. 2002, 57, 3299–3306. [Google Scholar] [CrossRef]
- Saravanan, K.; Mundale, V.D.; Joshi, J.B. Gas Inducing Type Mechanically Agitated Contactors. Ind. Eng. Chem. Res. 1994, 33, 2226–2241. [Google Scholar] [CrossRef]
- Newell, R.; Grano, S. Hydrodynamics and scale up in Rushton turbine flotation cells: Part 2. Flotation scale-up for laboratory and pilot cells. Int. J. Miner. Process. 2006, 81, 65–78. [Google Scholar] [CrossRef]
- Sokolov, V.N.; Domansky, I.V. Gas-Liquid Reactors; Mashinostroenie: Leningrad, Russia, 1976; 216p. [Google Scholar]
- Busciglio, A.; Caputo, G.; Scargiali, F. Free-surface shape in unbaffled stirred vessels: Experimental study via digital image analysis. Chem. Eng. Sci. 2013, 104, 868–880. [Google Scholar] [CrossRef]
- Deshpande, S.S.; Kar, K.K.; Walker, J.; Pressler, J.; Su, W. An experimental and computational investigation of vortex formation in an unbaffled stirred tank. Chem. Eng. Sci. 2017, 168, 495–506. [Google Scholar] [CrossRef]
- Ciofalo, M.; Brucato, A.; Grisafi, F.; Torraca, N. Turbulent flow in closed and free-surface unbaffled tanks stirred by radial impellers. Chem. Eng. Sci. 1996, 51, 3557–3573. [Google Scholar] [CrossRef]
- Rielly, C.D.; Evans, G.M.; Davidson, J.F.; Carpenter, K.J. Effect of vessel scale up on the hydrodynamics of a self-aerating concave blade impeller. Chem. Eng. Sci. 1992, 47, 3395–3402. [Google Scholar] [CrossRef]
- Hsu, Y.C.; Chen, T.Y.; Chen, J.H.; Lay, C.W. Ozone Transfer into Water in a Gas-Inducing Reactor. Ind. Eng. Chem. Res. 2002, 41, 120–127. [Google Scholar] [CrossRef]
- Conway, K.; Kyle, A.; Rielly, C. Gas–liquid–solid operation of a vortex-ingesting stirred tank reactor. Chem. Eng. Res. Des. 2002, 80, 839–845. [Google Scholar] [CrossRef]
- Hsu, Y.C.; Huang, C.J. Characteristics of a new gas-induced reactor. AIChE J. 1996, 42, 3146–3152. [Google Scholar] [CrossRef]
- Joshi, J.B.; Sharma, M.M. Mass transfer and hydrodynamic characteristics of gas inducing type of agitated contactors. Can. J. Chem. Eng. 1977, 55, 683–695. [Google Scholar] [CrossRef]
- Forrester, S.E.; Rielly, C.D. Modelling the increased gas capacity of self-inducing impellers. Chem. Eng. Sci. 1994, 49, 5709–5718. [Google Scholar] [CrossRef]
- Heim, A.; Krasa-wski, A.; Rzyski, E.; Stelmach, J. Aeration of bioreactors by self-aspirating impellers. Chem. Eng. J. Biochem. Eng. J. 1995, 58, 59–63. [Google Scholar] [CrossRef]
- Hultholm, S.E.; Lilya, L.; Nyman, B. Stirring Apparatus and Method of Gas Mixing in a Closed Reactor. EAPO Patent EA003815B1, 6 June 2003. Available online: https://www.eapo.org/ru/publications/publicat/viewpubl.php?id=003815 (accessed on 3 February 2023).
- Greenshields, C.J. OpenFOAM The Open Source CFD Toolbox: User Guide; OpenFOAM Foundation Ltd.: London, UK, 2022; 237p, Available online: http://foam.sourceforge.net/docs/Guides-a4/OpenFOAMUserGuide-A4.pdf (accessed on 3 February 2023).
- Chen, G.; Xiong, Q.; Morris, P.J.; Paterson, E.G.; Sergeev, A.; Wang, Y.-C. OpenFOAM for Computational Fluid Dynamics. Not. AMS 2014, 61, 354–363. [Google Scholar] [CrossRef]
- Li, L.; Gu, Z.; Xu, W.; Tan, Y.; Fan, X.; Tan, D. Mixing mass transfer mechanism and dynamic control of gas-liquid-solid multiphase flow based on VOF-DEM coupling. Energy 2023, 272, 127015. [Google Scholar] [CrossRef]
- Voinov, N.A.; Frolov, A.S.; Zemtsov, D.A. Method for Saturation of Liquid with Gas in Apparatus with a Mixer. Paten RU 2790167 C1, 14 February 2023. Available online: https://patenton.ru/patent/RU2790167C1 (accessed on 15 February 2023).
- Adamiak, R.; Karcz, J. Effects of Type and Number of Impellers and Liquid Viscosity on the Power Characteristics of Mechanically Agitated Gas-Liquid Systems. Chem. Pap. 2007, 61, 16–23. [Google Scholar] [CrossRef]
- Cudak, M. Hydrodynamic Characteristics of Mechanically Agitated Air-Aqueous Sucrose Solutions. Chem. Process Eng. 2014, 35, 97–107. [Google Scholar] [CrossRef]
- Hassan, I.T.M.; Robinson, C.W. Stirred-Tank Mechanical Power Requirement and Gas Holdup in Aerated Aqueous Phases. AIChE J. 1977, 23, 48–56. [Google Scholar] [CrossRef]
- Lee, B.W.; Dudukovic, M.P. Determination of flow regime and gas holdup in gas–liquid stirred tanks. Chem. Eng. Sci. 2014, 109, 264–275. [Google Scholar] [CrossRef]
- Alves, S.S.; Maia, C.I.; Vasconcelos, J.M.T. Experimental and modelling study of gas dispersion in a double turbine stirred tank. Chem. Eng. Sci. 2002, 57, 487–496. [Google Scholar] [CrossRef]
- Leshev, I.; Peev, G. Film flow on a horizontal rotating disk. Chem. Eng. Process. Process Intensif. 2003, 42, 925–929. [Google Scholar] [CrossRef]
- Fasano, J.B.; Myers, K.J.; Janz, E.E. Effect of geometric variations on the performance of gas dispersion impellers with semicircular blades. Can. J. Chem. Eng. 2011, 89, 961–968. [Google Scholar] [CrossRef]
- Garcia-Ochoa, F.; Gomez, E. Theoretical prediction of gas–liquid mass transfer coefficient, specific area and hold-up in sparged stirred tanks. Chem. Eng. Sci. 2004, 59, 2489–2501. [Google Scholar] [CrossRef]
- Karcz, J.; Siciarz, R.; Bielka, I. Gas hold-up in a reactor with dual system of impellers. Chem. Pap. 2004, 58, 404–409. Available online: http://fez.schk.sk/view/changeme:5192 (accessed on 4 February 2023).
- Kerdouss, F.; Bannari, A.; Proulx, P. CFD modeling of gas dispersion and bubble size in a double turbine stirred tank. Chem. Eng. Sci. 2006, 61, 3313–3322. [Google Scholar] [CrossRef]
- Bates, R.L.; Fondy, P.L.; Corpstein, R.R. Examination of Some Geometric Parameters of Impeller Power. Ind. Eng. Chem. Process Des. Dev. 1963, 2, 310–314. [Google Scholar] [CrossRef]
- Furukawa, H.; Kato, Y.; Inoue, Y.; Kato, T.; Tada, Y.; Hashimoto, S. Correlation of Power Consumption for Several Kinds of Mixing Impellers. Int. J. Chem. Eng. 2012, 2012, 106496. [Google Scholar] [CrossRef]
- Khabibrakhmanov, R.B.; Mukhachev, S.G. Power and mass transfer characteristics of a bioreactor with perforated disc stirrers. Proc. Univ. Appl. Biochem. Biotechnol. 2019, 9, 737–749. [Google Scholar] [CrossRef]
- Scargiali, F.; Busciglio, A.; Grisafi, F.; Brucato, A. Simplified dynamic pressure method for measurement in aerated bioreactors. Biochem. Eng. J. 2010, 49, 165–172. [Google Scholar] [CrossRef]
- Scargiali, F.; Russo, R.; Grisafi, F.; Brucato, A. Mass transfer and hydrodynamic characteristics of a high aspect ratio self-ingesting reactor for gas–liquid operations. Chem. Eng. Sci. 2007, 62, 1376–1387. [Google Scholar] [CrossRef]
- Osipov, A.V.; Bogatykh, S.A. On the Optimization of Geometric Reactors with a Circulation Loop; Mashinostroenie: Leningrad, Russia, 1972; pp. 103–108. [Google Scholar]
- Dyakonov, S.G.; Elizarov, V.I.; Laptev, A.G. Model of mass transfer in the bubbling layer of a contact device based on the concept of an active (inlet) section. Theor. Found. Chem. Eng. 1991, 25, 783–795. [Google Scholar]
- Ramm, V.M. Gas Absorption; Khimiya: Moscow, Russia, 1976; 656p. [Google Scholar]
- Litmans, B.A.; Kukurechenko, I.S.; Tumanov, Y.V. Investigation of mass transfer in the liquid phase in a bubbling apparatus with mechanical agitation at high energy inputs. Theor. Found. Chem. Eng. 1974, 8, 344–350. [Google Scholar]
- Voinov, N.A.; Zhukova, O.P.; Nikolaev, N.A. Hydrodynamics of the Vortex Stage with Tangential Swirlers. Theor. Found. Chem. Eng. 2010, 44, 213–219. [Google Scholar] [CrossRef]
- Shahbazi, B.; Rezai, B.; Chehreh Chelgani, S.; Koleini, S.M.J.; Noaparast, M. Estimation of diameter and surface area flux of bubbles based on operational gas dispersion parameters by using regression and ANFIS. Int. J. Min. Sci. Technol. 2013, 23, 343–348. [Google Scholar] [CrossRef]
- Jasak, H. Dynamic Mesh Handling in OpenFOAM. In Proceedings of the 47th AIAA Aerospace Sciences Meeting Including The New Horizons Forum and Aerospace Exposition, Orlando, FL, USA, 5–8 January 2009. [Google Scholar] [CrossRef]
- Voinov, N.A.; Frolov, A.S.; Bogatkova, A.V.; Zemtsov, D.A.; Zhukova, O.P. Hydrodynamics and mass transfer at the vortex stage and during bubbling. Theor. Found. Chem. Eng. 2019, 6, 972–983. [Google Scholar] [CrossRef]
- Voinov, N.A.; Gurulev, K.V.; Volova, T.G. Mass exchange in a bioreactor with a mixer during cultivation of hydrogen-oxidizing bacteria ralstonia eutropha in a mode of polyhydroxyalkanoate synthesis. Biotechnol. Russ. 2005, 3, 98–107. [Google Scholar]


Disclaimer/Publisher’s Note: The statements, opinions and data contained in all publications are solely those of the individual author(s) and contributor(s) and not of MDPI and/or the editor(s). MDPI and/or the editor(s) disclaim responsibility for any injury to people or property resulting from any ideas, methods, instructions or products referred to in the content. |
© 2023 by the authors. Licensee MDPI, Basel, Switzerland. This article is an open access article distributed under the terms and conditions of the Creative Commons Attribution (CC BY) license (https://creativecommons.org/licenses/by/4.0/).
Share and Cite
Voinov, N.A.; Frolov, A.S.; Bogatkova, A.V.; Zemtsov, D.A.; Zhukova, O.P. Method for Intensive Gas–Liquid Dispersion in a Stirred Tank. ChemEngineering 2023, 7, 30. https://doi.org/10.3390/chemengineering7020030
Voinov NA, Frolov AS, Bogatkova AV, Zemtsov DA, Zhukova OP. Method for Intensive Gas–Liquid Dispersion in a Stirred Tank. ChemEngineering. 2023; 7(2):30. https://doi.org/10.3390/chemengineering7020030
Chicago/Turabian StyleVoinov, Nikolai A., Alexander S. Frolov, Anastasiya V. Bogatkova, Denis A. Zemtsov, and Olga P. Zhukova. 2023. "Method for Intensive Gas–Liquid Dispersion in a Stirred Tank" ChemEngineering 7, no. 2: 30. https://doi.org/10.3390/chemengineering7020030
APA StyleVoinov, N. A., Frolov, A. S., Bogatkova, A. V., Zemtsov, D. A., & Zhukova, O. P. (2023). Method for Intensive Gas–Liquid Dispersion in a Stirred Tank. ChemEngineering, 7(2), 30. https://doi.org/10.3390/chemengineering7020030