Abstract
The removal of color from dye wastewater is crucial, since dyes are extremely toxic and can cause cancer in a variety of life forms. Studies must be done to use cost-effective adsorbents for the removal of color from dye effluents to protect the environment. To our knowledge, virtually no research has been done to describe the possibility of using Calotropis gigantea leaf extract zinc hydroxide nanoparticles (CG-Zn(OH)2NPs) as an adsorbent for the decolorization of Coomassie violet (CV) from the aqueous emulsion, either in batch mode or continuously. In the present batch investigation, CV dye is removed from the synthetic aqueous phase using CG-Zn(OH)2NPs as an adsorbent. The synthesized nanoparticles were characterized using various instrumental techniques such as Fourier transform infrared spectroscopy (FT-IR), X-ray diffraction (XRD), thermogravimetric analysis (TGA), field emission scanning electron microscopy (FE-SEM), energy dispersive X-ray spectroscopy (EDS) and Brunauer–Emmett–Teller (BET) surface area and pore volume, a particle size analyser, and zero-point charge. The decolorization efficacy of CV dye from an aqueous phase by the adsorbent was examined in batch mode by varying process parameters. The consequences of various experimental variables were optimized using response surface methodology (RSM) to achieve the maximum decolorization efficiency (90.74%) and equilibrium dye uptake, qe (35.12 mg g−1). The optimum pH, dye concentration, CG-Zn(OH)2NPs adsorbent dosage, and particle size were found to be 1.8, 225 mg L−1, 5 g L−1, and 78 μm, respectively for CV dye adsorption capacity at equilibrium. The adsorbent zero-point charge was found to be at pH 8.5. The Langmuir isotherm model provided a good representation of the equilibrium data in aqueous solutions, with a maximum monolayer adsorption capability (qmax) of 40.25 mg g−1 at 299 K. The dye adsorption rate follows a pseudo-second-order kinetic model at various dye concentrations, which indicated that the reaction is more chemisorption than physisorption. The negative values of ΔG and positive values of ΔH at different temperatures indicate that the adsorption process is spontaneous and endothermic, respectively. Reusability tests revealed that the prepared nanoparticles may be used for up to three runs, indicating that the novel CG-Zn(OH)2NPs seems to be a very promising adsorbent for the removal of Coomassie violet dye from wastewater.
1. Introduction
One of the most active areas of modern material science research is nanotechnology. With its applications in science and technology for the creation, enhancement, and utility of nanostructures, nanotechnology is rapidly expanding [1]. The dimensions of nanoparticles range from 1 to 100 nm. Due to the growing demand for nanoparticles in several fields, such as medicine, biosensing, catalysis, antibacterial, antioxidant, etc. green nanoparticle synthesis has received a lot of attention from researchers over the past two decades [2]. In nanobiotechnology, which employs environmentally friendly methods for the synthesis of nanoparticles using algae, fungi, and plants, the principles of green chemistry have played a significant role [3]. The textile dyeing and garment sector have major economic and social significance worldwide, owing to their rapid industrial development over the past decade [4]. This sector is becoming a source of excessive discharge of pollutants into various ecological areas, and immediate attention must be paid to the circumstances of a crucial need for clean water for a growing world population [5]. The synthetic dye Coomassie violet (CV) is a water-soluble anionic dye and is used in textiles, leather, paper, rubber, cosmetics, printing, and the plastics industries to colour products; it is extremely tough to remove from water bodies due to its complex aromatic molecular structure [6]. Without adequate treatment, the industry discharges effluent that contains a significant quantity of dyes, heavy metals, and dissolved organic components, which can raise the effluent’s toxicity and chemical oxygen demand (COD) [7,8]. In addition to posing a significant threat to human and livestock health, industrial effluent contamination of water bodies also causes aquatic organisms to die, and prevents sunlight from reaching them, which in turn affects the dissolved oxygen concentration, reducing their ability to produce photosynthesis and making them immune to photochemical action [9]. The removal of color from dye wastewater is crucial, since dyes are extremely toxic and can cause cancer in a variety of life forms. According to reports, the majority of azo dyes are the major cause of chromosomal abnormalities in mammalian cells, splenic sarcomas, hepatocarcinoma, and bladder cancer in humans. A low concentration of CV (less than 1 mg L−1) can be the reason for skin infection, dermatitis, and allergenic reactions, and can lead to cancer-causing, bio-accumulative, toxic, carcinogenic, and mutagenic effects in aquatic organisms and humans [10]. Before being discharged into the receiving water bodies, the effluents must be treated to reduce their dye concentration to an acceptable and tolerable level [11]. Due to their intricate structure, CV dyes are poisonous, even at low concentrations, and are very challenging to remove. Because of this, their concentrations must be lowered to safe levels before being released into the environment. Therefore, the removal of CV from wastewater is of utmost importance to protect the environment and the aquatic life, before the discharge of the effluents into the environment [12].
Conventional treatment methods such as the Fenton process, electrochemical treatment, photocatalytic degradation, biodegradation, ozonation, coagulation, membrane filtration, and sonication have been proposed for the removal of dyes and hazardous chemicals from effluents [13]. However, these technologies have several drawbacks, including high capital and operating cost, the complexity of the treatment processes, the issue of disposing of sludge, and the requirement of a lot of energy and chemicals which could pollute the water [14]. These procedures are inefficient and expensive, making them unsuitable for India, a developing nation. Amongst the various methods used, adsorption is one of the most effective, economical, and efficient methods for removing hazardous chemicals and dyes from wastewater [15]. This method has several advantages, the most important of which are its adaptability, simplicity of design, ease of operation, insensitivity to toxic pollutants, the ability to recover and reuse adsorbent, and the absence of the production of toxic substances [16]. The principles of green chemistry have played a significant role in nanobiotechnology, as it relies on the participation of green and environmentally friendly routes, using plants for the synthesis of metal nanoparticles [17]. The plant extract-mediated synthesis routes of nanoparticles are easy to use, biocompatible, cost-effective, and non-toxic methods that do not pose a biohazard [18]. They contain terpenoids, flavonoids, and phenol derivatives, as well as plant enzymes such as hydrogenases and reductases, which reduce metal salts and prevent nanoparticle aggregation by acting as reducing and capping agents [19]. Phytochemical analysis of leaves revealed the presence of carbohydrates, tannins, alkaloids, steroids, triterpenoids, flavonoids, saponins, sugars, and protein [20]. There are various metal oxide nanoparticles such as TiO2, CuO, Fe2O3, MgO, and Zn(OH)2, extracted from different plant leaves, that have been studied for the removal of pollutants from aqueous solutions [21]. Of these, zinc hydroxide nanoparticles (Zn(OH)2NPs) have gained more interest because of their ease of production, fewer chemical requirements, and good chemical and electrical properties. The Zn(OH)2NPs are employed in a variety of fields, including those of environmental, pharmacology, chemical sensing, textiles, electronics, catalysis, healthcare, cosmetics, and semiconductors [18,22]. Additionally, these nanoparticles are more eco-friendly, because they do not result in the formation of harmful substances. Modified Zn(OH)2NPs have been reported to have good semiconductor properties, UV filtering, wound healing, and antimicrobial properties. The green synthesized nanoparticles exhibit great medicinal applications in the fields of targeted drug delivery, wound healing, cytotoxicity, bioimaging and analgesics, with anticancer, anti-diarrheal, antipyretic, insecticidal, anti-inflammatory, antibacterial, and antioxidant properties [23,24]. They are also used in the manufacturing of paints and rubber, the degradation of bacterial biofilm, dyes, and the removal of heavy metals, sulfur, and arsenic from wastewater [25].
Many studies have reported the use of plant leaf extracts such as Ocimum sanctum, Pterocladia Capillacea, Nephelium lappaceum, Ligustrum lucidum, Rosmarinus officinalis, and Croton bonplandianum as a reducing agent for the synthesis of green nanoparticles and for the removal of colour from simulated dye effluents [26,27]. These green synthesized Zn(OH)2 nanoparticles provide an attractive alternative for the treatment of dye wastewater, especially if the adsorbent is insensitive to toxic pollutants. Khan et al. [28] investigated preparing zinc oxide nanoparticles (ZnO-NPs) using Passiflora foetida fruit peel following a regulated ultrasound cavitation method, and studied the photocatalytic activity to degrade Methylene blue and Rhodamine. Faizal et al. [29] studied bio-augmented ZnO-NPs prepared from aqueous fruit extracts of Myristica fragrans, and their use as a photocatalytic agent to degrade Methylene blue. Kaliannan et al. [30] studied the synthesis and use of nano silica from Saccharum officinarum leaves as an adsorbent to remove heavy metal ions Pb2+ and Zn2+ from aqueous solutions. Ahodashti et al. [31] synthesized silver nanoparticles using Convolvulus fruticosus leaf extract, and studied their photocatalytic degradation of Basic blue and Eriochrome black contaminants. Manojkumar et al. [32] examined the green synthesis of zinc oxide nanoparticles using Brassica oleracea var. botrytis leaf extract, and their photocatalytic degradation of Thiazine dye. Ahmed et al. [4] utilized an eco-friendly method to synthesize silver nanoparticles from a locally isolated bacterial strain Bacillus marisflavi TEZ7, and employed them as photocatalysts to degrade azo dyes such as Direct blue, Methyl red, and Reactive black. Nonetheless, a literature review revealed that only a few studies on the preparation of Zn(OH)2 have been reported, and no study on the application of Zn(OH)2-based green synthesized nanoparticles on Coomassie violet dye adsorption has been published. The expulsion of CV colour from wastewater utilizing zinc hydroxide nanoparticle adsorbent prepared from Calotropis gigantea leaf extract (CGLE) is an area that has not been investigated a lot. Studies need to be conducted to evaluate the use of Calotropis gigantea leaf extract zinc hydroxide nanoparticles (CG-Zn(OH)2NPs) for the removal of colour from wastewater. The results of different parameters on the elimination of CV from dye wastewater were based on previously published works, but not for the CG-Zn(OH)2NPs adsorbent and CV dye combination. To our knowledge, virtually no research has been done to describe the possibility of using CG-Zn(OH)2NPs as an adsorbent for the decolorization of CV from the aqueous emulsion, either in batch mode or continuously. The use of low-cost adsorbents to remove the color from wastewater requires further research. As a result, an effort has been undertaken to use green synthesized nanoparticles to remove CV dye from wastewater. Utilizing the CG-Zn(OH)2NPs adsorbent, response surface methodology (RSM) studies have not yet been carried out to optimize the process parameters for the decolorization of CV dye. In batch investigations, a kinetics and isotherm model that is appropriate for a decolorizing CV from synthetic dye wastewater using CG-Zn(OH)2NPs adsorbent must be developed. The Calotropis gigantea leaves are economically feasible, widely accessible natural materials in India, as they can easily be cultivated from seeds. The leaves of C. gigantea contain pinoresinol, medioresinol, uzarigenin, calotropin, calactin, calacitnic acid, calacitnic acid methyl ester, etc. which have been used for the production of secondary metabolites [23]. The green synthesized nanoparticles have shown excellent performance at the laboratory scale for the treatment of dye wastewater. The present study aims to synthesize nanoparticles by a simple alkaline precipitation method and investigate the CG-Zn(OH)2NPs’ adsorption capacity on Coomassie violet as a model anionic dye. The effects of different parameters such as initial pH, the dosage of adsorbent, initial adsorbate concentration, size of the adsorbent particle, shaking rate, and ionic strength on the adsorption process were investigated, and the process independent variables were optimized using central composite response surface design. Using the optimal value of various experimental parameters, isotherm, thermodynamic, kinetic, desorption, and reusability studies were carried out.
2. Materials and Methods
2.1. Reagents and Materials Required
An anionic dye, Coomassie violet analytical reagent grade (Molecular formula = C41H44N3NaO6S2, dye content = 50%, molecular weight = 761.92, λmax = 545 nm, purity = 99.8%), supplied by Sigma Aldrich, Bengaluru, India, is used in the study. All other chemicals such as sodium chloride, hydrochloric acid, sodium hydroxide, methanol, ethanol, sodium nitrate, magnesium chloride, and zinc nitrate used are of analytical grade and were collected from Merck, Mumbai, India. Calotropis gigantea plant leaves for the preparation of zinc hydroxide nanoparticles were gathered nearby in Udupi District, Karnataka State, India.
2.2. Preparation of CV Dye Stock Solution
A stock solution of CV dye (1 g L−1) was prepared by dissolving 1 g of CV dye powder in 1000 mL distilled water and the decolorization experiments were performed by adding pH-adjusted distilled water (using 0.1 N HCl or 0.1 N NaOH) to the stock solution to obtain the required concentration range. The dye solution’s final pH was measured as the required range after dilution. Figure S1 depicts the CV dye structure.
2.3. Green Synthesis of Zinc Hydroxide Nanoparticles
Fresh leaves of Calotropis gigantea (CG) were washed thoroughly with distilled water to remove dust and other adhering impurities and dried under sunlight for 24 h (3 days). The dried CG leaves were powdered and stored for further experiments. Around 20 g of CG leaves’ powder was put in a 250 mL beaker containing 150 mL of distilled water, and was stirred using the magnetic stirrer at 373 K for 0.5 h. The contents were cooled and filtered with Whatman No. 1 filter paper (pore size 11 µm, sheet size 125 mm Ø) to obtain a yellowish-green leaf extract and to remove the residues. The filtrate extract was stored in a refrigerator at 277 K for the synthesis of CG-Zn(OH)2NPs [32]. To obtain CG-Zn(OH)2NPs, 100 mL of prepared leaf extract was mixed with 250 mL of 0.05 M zinc nitrate (Zn(NO3)2), and the contents were mixed thoroughly at 500 rpm for 5 min. Then, 100 mL of 1 M NaOH solution was added dropwise to this mixture and placed at 343 K in a water bath until a pale white precipitate was obtained, which indicated the formation of zinc hydroxide nanoparticles, and the supernatant was discarded. The semi-solid (precipitate) was dried in the hot-air oven at 343 K for 24 h, and the final product was ground and screened to obtain particles <100 μm in size [33]. The pale white CG-Zn(OH)2NPs powder was stored in an airtight bottle for further use in adsorption studies. The phytochemicals present in the plant leaf extract can act as reducing agents, converting the metal precursors into metal nanoparticles. Phytochemical materials contain antioxidants and toxic-free compounds; consequently, they are capable of acting as stabilizing as well as reducing agents [32]. Figure 1 depicts the schematic representation CG-Zn(OH)2NP synthesis. The possible reaction mechanisms in the preparation of CG-Zn(OH)2NPs are given below [34].
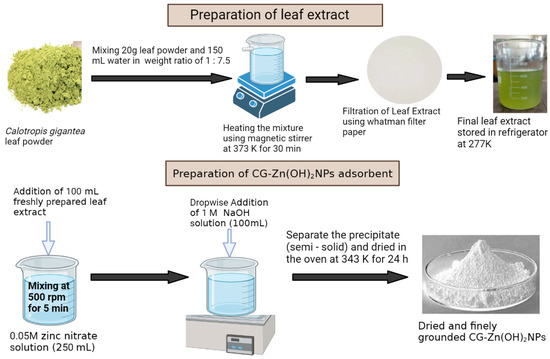
Figure 1.
Bio-synthesis of Calotropis gigantea leaf extract zinc hydroxide nanoparticles (CG-Zn(OH)2NPs) adsorbent.
2.4. Analytical Measurements
A digital pH meter (Systronics 335, Bengaluru, Karnataka State, India) was used to observe the dye solution pH, and a particle size analyzer (Cilas 1064, Orleans, France) was used to determine the CG-Zn(OH)2NPs adsorbent particle size. Using a Brunauer– Emmett–Teller (BET) surface area analyzer (Smart Instruments, Dombivli, Maharashtra State, India), the prepared adsorbent surface area and pore volume were calculated. Field-emission scanning electron microscopy (FESEM) (Carl Zeiss, Oberkochen, Germany) was used to examine the surface morphology of the adsorbent before and after adsorption. Energy-dispersive X-ray spectroscopy (EDS) (Carl Zeiss, Oberkochen, Germany) was used to determine the elemental composition of the adsorbent. The thermal stability of the prepared adsorbent was evaluated using a thermogravimetric analyzer (TGA) (TA Instruments, Newcastle, USA). The crystallinity of the adsorbent was examined using an X-ray diffraction analyzer (XRD) analyzer (Rigaku Ultima IV, Tokyo, Japan). The functional groups in the adsorbent and CV dye molecules loaded on the particle surface were determined using Fourier transform infrared spectroscopy (FT-IR) (Shimadzu 8400S, Kyoto, Japan) analysis. Using a precalibrated double-beam UV/visible spectrophotometer (Shimadzu UV-1800, Kyoto, Japan), the absorbance at the wavelength of 545 nm was measured to determine the unknown residual dye concentration after CV dye adsorption.
2.5. Batch Adsorption Experiments
The adsorption studies were carried out in batch mode to investigate the effectiveness of CG-Zn(OH)2NPs as an adsorbent for the decolorization of CV anionic organic dye from effluent at room temperature. Batch adsorption experiments were conducted in 250 mL Erlenmeyer flasks with 100 mL CV dye solution by changing the degree of one variable and keeping the degree of different factors consistent. The adsorption isotherm studies were performed by changing the initial dye concentration with a constant amount of nanoparticle dosage. The solutions were then put on a mechanical shaker and shaken at 150 rpm for 24 h at 299 K. After the adsorbent reached equilibrium, the feed solution was centrifuged to isolate the adsorbent and the clear fluid was examined for remaining CV dye concentration, utilizing a UV/visible spectrophotometer. Kinetic studies were performed by analyzing the different residual concentrations of CV dye at regular time intervals. The quantity of CV dye that accumulated on the particle surface at equilibrium (qe) and at time t (qt) was computed using Equations (1) and (2), respectively [10,35].
The percentage of dye removal is calculated by Equation (3) [10]:
where Co and Ce are the starting and saturation concentrations of CV in the solutions (mg L−1), respectively. Ct stands for dye concentration at contact time ‘t’ (mg L−1), V refers to CV dye solution volume (L), and W refers to the dry CG-Zn(OH)2NPs’ adsorbent mass (g).
2.6. Experimental Design and Optimization of Process Parameters
A response surface methodology was used to optimize the process parameters within the limited number of runs and investigate the relationship between decolorization efficiency and operating variables. The experimental design was built using Minitab 16 software; central composite design (CCD) was applied to lead decolorization experiments, and a regression model was proposed. The CCD utilizes a multilevel design with axial points along with a central point to fit the quadratic model [36]. The initial pH (X1), initial concentration of CV dye (X2), adsorbent dosage (X3), and adsorbent particle (X4) are considered important factors to examine the dye removal efficiency and equilibrium dye uptake (qe). Agitation speed and temperature were held constant. The response variables in this study are the decolorization efficiency and equilibrium dye uptake (qe). Various groups of process factors were utilized to analyze the common impact of different parameters utilizing statistically designed runs. The variable levels were coded as −1 (low), 0 (middle), and 1 (high). The number of experiments (N) was calculated as follows [37].
where k refers to the factor number and cp is the central point replicate number. The coded values of experimental factors were acquired from Equation (5):
where xi is the non-dimensional value of the experimental factor, Xi refers to the actual value of an independent variable, Xo for the value of Xi at the middle point and denotes the step change. A second-order polynomial regression equation, as shown in Equation (9), is used to predict the response by considering the input parameters [10,37].
where Yp is the calculated response variable obtained from RSM; αo is the coefficient offset term, and αi, αii, and αij refer to the regression coefficients for the linear, quadratic, and interaction effects, respectively. Each coefficient of sign recommends the direction of the relationship with the response variable. In this study, 31 trials with various groupings and seven repeats at the middle points were performed. An analysis of variance was performed, given the proposed model, to figure out the association between the factors and the response. The nature of fit for the regression model was denoted by the regression coefficient (R2, R2adj, R2pred), which has been calculated by corresponding the trial results with the anticipated response values. The statistical importance was verified by the F-test in a similar program. The probability level, P, has been used to verify the importance of each of the relations between the variables, and t-tests were utilized to assess the significance of the regression coefficient. Model terms were chosen or dismissed based on the probability value, with a 95% certainty level. For linear, square, and interaction effects, smaller p values (less than 0.05) and larger t-test values are more important in the selected model at the corresponding coefficient terms [38,39]. The calculated responses (Yp) are contrasted with the experimental results (Ya) to confirm the predicted results acquired by RSM. The model equation’s acceptable precision is predicted using the absolute average deviation (AAD) and the root mean square error (RMSE). The following Equations (7) and (8) are used to calculate the AAD and RMSE, respectively. Table 1 displays the experimental ranges and levels of various factors for the CV dye decolorization process.
N = k2+ 2k + cp

Table 1.
Experimental range and levels of various process factors for CV dye decolorization using CG-Zn(OH)2NPs adsorbent.
2.7. Equilibrium Isotherm Modeling Studies
Adsorption isotherms are crucial in optimizing the usage of adsorbents for the removal of adsorbates from the aqueous phase, because they explain the interaction between adsorbate concentrations and particle surfaces. The pertinent adsorption equilibria are necessary for the study and design of the sorption process. The adsorption isotherm plays an important role in finding the adsorption capacity of the adsorbent [40]. It expresses the equilibrium relationship at a constant temperature between the amount of dye adsorbed on the particle surface (mg g−1) and the concentration of adsorbate that remains in the aqueous phase (mg L−1). The solute uptake capacities of adsorbent for various pollutants in effluent were dependent on the surface properties of the solid particles and the interaction of adsorbent with solute. Various isotherm models were applied to the experimental equilibrium data to predict the homogeneous or heterogeneous nature of the adsorption. The traditional isotherm models used in the study are Langmuir (Equation (9)), Freundlich (Equation (10)), and Temkin (Equation (11)), and are shown below, respectively.
Langmuir isotherm [41]
Freundlich isotherm [42]
Temkin isotherm [42]
where KL is the Langmuir isotherm constant expressed as L mg−1, qm refers to the utmost adsorption capacity of the adsorbent, expressed in mg g−1 to form a monolayer, qe is the adsorption capacity at saturation in mg g−1, KF is the Freundlich constant in L g−1, 1/n is the constant of adsorption intensity (heterogeneity factor), KT refers to Temkin isotherm constant in L g−1, suggests the heat of adsorption, is the adsorption energy in kJ mole−1, and T refers to the absolute temperature in K and R for the universal gas constant, expressed as J mole−1 K−1. The features of the Langmuir isotherm can be explained by the equilibrium parameter, RL, which evaluates whether the adsorption is favourable or not, and the dimensionless separation factor is expressed by the following Equation (12) [41]:
The value of RL = 0, RL = 1, 0 < RL< 1, and RL > 1 suggests that the process is irreversible, linear, favourable, and unfavourable, respectively. The correlation coefficients R2, Chi-square error , and adsorption capacity at equilibrium qe, were evaluated to determine the model’s applicability and suitability [7]. An origin software tool was used to perform linear regression, and the least-squares method was extensively utilized to evaluate the isotherm constants. Equation (13) was used to determine the value of [9,10]:
where qe,expt and qe,calc are the saturation experimental adsorption capacities of CV (mg g−1) and the isotherm model values that correspond to them.
2.8. Thermodynamic Studies
The thermodynamic investigation is essential to explain the nature of the adsorption process. The effect of temperature on the decolorization of CV onto the CG-Zn(OH)2NPs adsorbent was analyzed by carrying out equilibrium experiments at various initial dye solution concentrations at temperatures ranging from 299 K to 323 K. The adsorption equilibrium constant, Ka (L g−1), was calculated from Equation (14) [43]:
The thermodynamic parameters such as Gibbs free energy change, ΔG (kJ mole−1), enthalpy change, ΔH (kJ mole−1), and entropy change, ΔS (kJ mole−1 K−1) of the adsorption process for the decolorization of CV dye were evaluated via Equations (15) and (16), below [44].
The activation energy, Ea (kJ mole−1), of the adsorption process can be calculated using the Arrhenius equation (17), which can be expressed as [45]
where A is the frequency factor of Arrhenius.
2.9. Kinetic Modeling Studies
To design an industrial-scale adsorption column, a study of adsorption kinetics is necessary to identify the rate-limiting step and adsorption mechanism, both of which are crucial for determining the process efficacy. The kinetics of CV dye adsorption at different concentrations on the CG-Zn(OH)2NPs adsorbent were analyzed by fitting the kinetic data using pseudo-first order and pseudo-second order kinetic models, as shown in Equations (18) and (19), respectively, to determine the rate constants [42,46].
Kinetic model of Lagergren’s pseudo-first order:
Model of Ho’s pseudo-second-order kinetics:
where K1 refers to pseudo-first order rate constant (min−1) and K2 to the adsorption equilibrium rate constant of pseudo-second order (g mg−1 min−1). The initial adsorption rate, h (mg g−1 min−1), is expressed by Equation (20) [9]:
h = K2 qe2
The intra-particle diffusion model explains the adsorption diffusion mechanism, which is described by the Weber and Morris Equation (21) [47]:
where Ki is the constant for the intra-particle diffusion rate (mg g−1 min−1/2) and C is the constant for the film thickness. The kinetic model is assessed by the normalized standard deviation (NSD), and it is provided by the following Equation (22) [43]:
where Np indicates the amount of experimental data. The highest R2 and lowest NSD values were used to select the best-fit model. The rate-limiting step in the adsorption process was predicted using the Bangham and Boyd kinetic models, as shown in Equations (23) and (24), respectively [48].
Bangham kinetic model:
where m refers to the mass of CG-Zn(OH)2NPs adsorbent used per volume of solution (g L−1), ko represents the Banghams constant (L2 g−1), and α is the constant.
The Boyd kinetic model is as follows:
where Bt is a mathematical function of F, and F is the ratio of dye uptake on the particle surface at any time ‘t’ to saturation (qt/qe).
Bt = −0.4977 − ln (1 − F)
2.10. Regeneration and Reusability Studies
The chemical regeneration of the CG-Zn(OH)2NPs adsorbent was tested to assess its potential for practical applications in large-scale industries. The process would be more cost-effective if the spent adsorbent could be reused and had a high regeneration capacity [10]. The recycle evaluation was carried out to assess the adsorbent’s productivity as well as its stability for the uptake of CV dye from wastewater. To desorb the CV dye from the CG-Zn(OH)2NPs adsorbent, various desorbing reagents, such as methanol, ethanol, and NaOH, were used to regenerate the adsorbent accumulated with adsorbate molecules [34]. The initial dye concentration of 200 mg L−1 is used to begin the decolorization of CV with an optimal dose of adsorbent (6 g L−1). After shaking the dye solution with the adsorbent at 150 rpm for 24 h, the adsorption’s effectiveness is evaluated. After reaching saturation, the utilized adsorbent is separated in each Erlenmeyer flask by centrifugation and washed several times with deionized water. The renewed adsorbent is then dried at 335 K and subjected to a variety of desorbing reagent treatments in distinct batches before being reused to examine its reusability for subsequent cycles [43]. Three cycles of adsorption and desorption experiments were carried out altogether. The following Equation (25) was used to determine the efficiency of desorbed dye from the adsorbent particle surface [6]:
All of the experiments were repeated twice to ensure reproducibility, and the average values obtained are reported in Section 3.
3. Results and Discussion
3.1. Selection of Suitable Plant Leaf Extract Zinc Hydroxide Nanoparticles for the Removal of CV Dye from Wastewater
Various plant leaves such as Thunbergia grandiflora, Clitoria ternatea, Peltophorum pterocarpum, and Calotropis gigantea leaves were initially chosen to prepare the zinc hydroxide nanoparticles separately and then to select the best adsorbent among them. The same procedure was followed to prepare other plant leaf extract Zn(OH)2 nanoparticles, and it has been given in Section 2.3. Adsorption experiments were performed using the above plant leaves to extract zinc hydroxide nanoparticles in separate batches at 299 K in order to evaluate the maximum efficacy of CV dye decolorization, and the experimental results are shown in Figure S2 of Supplementary Materials. These results showed that maximum decolorization efficacy (93.84%) of CV was observed utilizing the adsorbent CG-Zn(OH)2NPs with an initial adsorbate concentration of 100 mg L−1 at pH 2 [6]. This might be due to the availability of more binding sites on the CG-Zn(OH)2NPs surface. The CG-Zn(OH)2NPs adsorbent was found to have a greater surface area and pore volume than other adsorbents, with values of 7.36 m2 g−1 and 4.84 mm3 g−1, respectively. As a result, CG-Zn(OH)2NPs fine powder was chosen for further study out of four different adsorbent options because it produced the best results.
3.2. Characterization of the Calotropis gigantea Leaf Extract Zinc Hydroxide Nanoparticles Adsorbent
The BET surface area and pore volume of the CG-Zn(OH)2NPs adsorbent were found to be 7.36 m2 g−1 and 4.84 mm3 g−1, respectively, with an average particle size of 65.38 µm. The powder addition method was used to determine the nanoparticles’ pH point of zero charge (pHpzc) [49]. Figure 2 depicts a plot of the CG-Zn(OH)2NPs adsorbent’s ΔpH (pHinitial – pHfinal) against the initial pH values. The pHzpc was found to be 8.5, which is the initial pH at which the pH becomes 0. If the solution’s pH is lower than the pHzpc, active sites on the surface of the particles will be positively charged. If the solution’s pH is higher than pHzpc, the adsorbent has a negative charge. This may be due to the solution’s OH− ions will deprotonate the binding sites. At pH < pHzpc, anion adsorption on any adsorbent will therefore be advantageous.
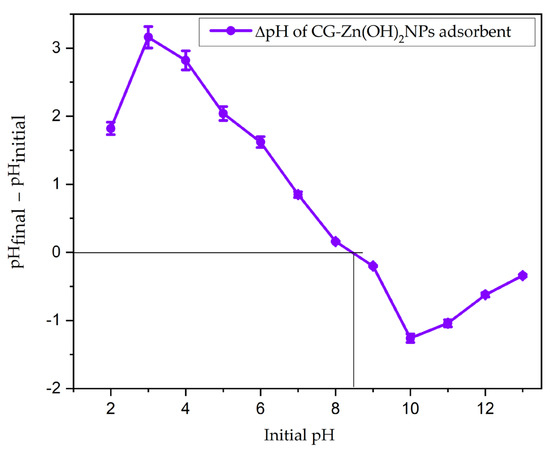
Figure 2.
Zero-point charge (pHzpc) plot of CG-Zn(OH)2NPs. (Sodium chloride concentration: 0.1 M; CG-Zn(OH)2NPs dosage: 10 g L−1; adsorbent particle size: 65.38 µm; shaking speed: 150 rpm: contact time 24 h; temperature: 299 K).
FT-IR spectra of the CG-Zn(OH)2NPs adsorbent before and after CV dye removal is shown in Figure 3. Table 2 describes the assigned functional groups. A frequency shift was observed (Figure 3) in the band intensities of hydroxyl (3433 cm−1), carbonyl (1629 cm−1), aromatic ester/anhydride/alcohol/and phenol (1348 cm−1), alcohol and ether (1001 cm−1), the carboxylic acid (744 cm−1), and sulfur (609 cm−1) groups in the FT-IR spectra of CV loaded with nanoparticle surface. This demonstrated that the CG-Zn(OH)2NPs adsorbent’s surface contained the aforementioned functional groups. With the anionic CV dye molecules, these groups may serve as potential binding sites for hydrogen bonding and electrostatic interactions [50]. The probable mechanism of interaction between CV dye with CG-Zn(OH)2NPs is shown in Figure 4. A similar type of mechanism is also reported in the literature [51].
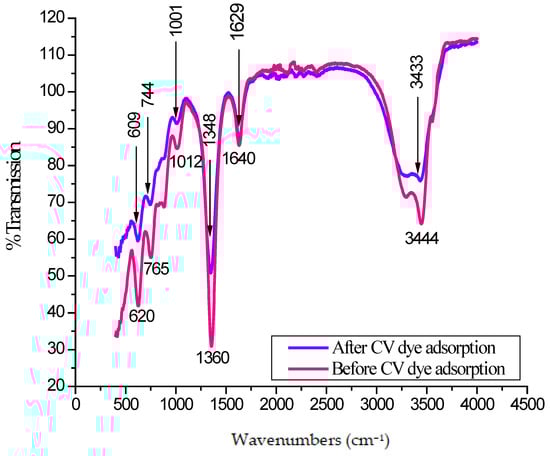
Figure 3.
Fourier transform infrared spectroscopy (FT-IR) spectrum of CG-Zn(OH)2NPs before and after Coomassie violet (CV) dye removal.
Table 2.
FT-IR spectral characteristics functional group assignment to observed frequencies.
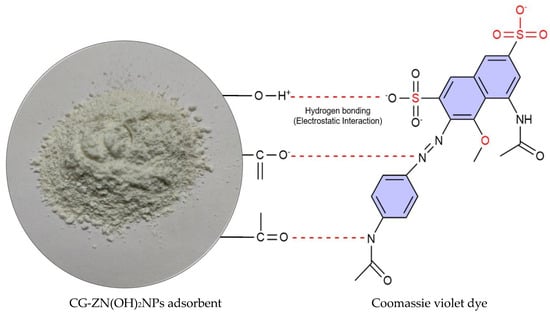
Figure 4.
Proposed mechanism for CV dye adhesion onto CG-Zn(OH)2NPs adsorbent.
In the XRD pattern of diffraction peaks of the CG-Zn(OH)2NPs, as revealed in Figure 5, the diffraction peaks were observed at angles of 2ϴ = 9.04, 18.42, 25.28, 27.06, 29.51, 33.28, 34.62, and 38.84 corresponding to (002), (111), (101), (111), (220), (211), (020), and (002) the (h k l) planes, respectively. The peaks obtained were in concordance with the standard hexagonal crystalline structure of CG-Zn(OH)2NPs [52]. The size of the crystal was determined by utilizing Debye Scherrer’s Equation (26), given the premise of the full width at half-maximum (FWHM) of the sharp pinnacle [53]:
where D refers to the mean size of the crystal (nm), K is a constant value of 0.9, λ for the wavelength of X-ray (1.540562 Å), β represents full width at half maximum intensity, and θ is the Bragg angle. The CG-Zn(OH)2NPs’ mean crystallite size of 26.79 nm confirmed the nano size of the synthesized nanoparticle. Additionally, the absence of additional peaks supported the purity of the products, and the sharp, clear, and extremely intense diffraction peaks confirmed the high crystallinity of the CG-Zn(OH)2NPs [54].
D = Kλ/βcos θ
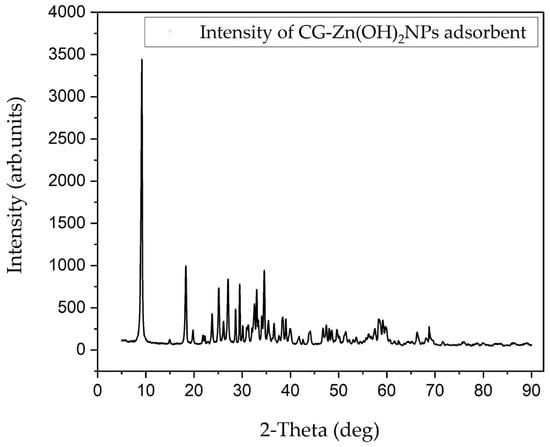
Figure 5.
CG–Zn(OH)2NPs adsorbent’s X-ray diffraction (XRD) pattern before CV dye adsorption.
Figure 6a,b depict the CG-Zn(OH)2NPs adsorbent before and after CV dye adsorption, respectively, using FE-SEM. At 10 KX magnification, the adsorbent exhibits a flower-shaped morphology and a rough surface with irregularly spaced small pores, as shown in Figure 6a. This showed that the size of the synthesized nanoparticle was within the nanoscale of nanostructures. A similar type of flower-shaped Zn(OH)2NP was described in the literature [55]. The agglomerations image may be the result of interactions between Zn(OH)2NPs and biomolecules in the CG leaf extract. The adhesion of CV dye molecules onto particle surfaces with irregular pores is facilitated by rough surfaces, which may allow for the diffusion of adsorbate molecules through the adsorbent’s pores [43]. Figure 6b depicts that the dye molecules were loaded onto the nanoparticle surface after adsorption, and it can be observed that the particle surface became smoother.
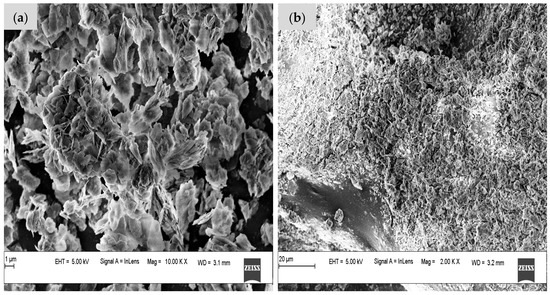
Figure 6.
Field emission scanning electron microscopy (FE-SEM) images of CG-Zn(OH)2NPs (a) before CV dye removal, and (b) after CV dye removal.
An EDS analysis of CG-Zn(OH)2NPs before and after CV dye removal is shown in Figure 7a,b, respectively. The sharp peaks in the EDS spectrum (Figure 7a) confirmed the presence of zinc (1 keV, 9 keV, and 9.5 keV) and oxygen (0.5 keV), both of which were comparable with the published report [56]. The elemental composition of the adsorbent was determined using analytical FE-SEM with EDS at 20 keV. The formation of Zn(OH)2NPs was observed when the weight proportions of zinc and oxygen were, respectively 70.18% and 16.46%, as depicted in Figure 7a [57]. The spectrum also revealed trace amounts of carbon (6.18%), nitrogen (3.24%), and sodium (2.36%) in addition to zinc and oxygen. Zn(OH)2NPs formation and capping by biomolecules were confirmed by the presence of carbon [58]. The weight and atomic percentage of elemental carbon, oxygen, nitrogen, sodium, and sulphur enhanced after adsorption, indicating that the surface of the adsorbent particle is loaded with dye anions (Figure 7b).
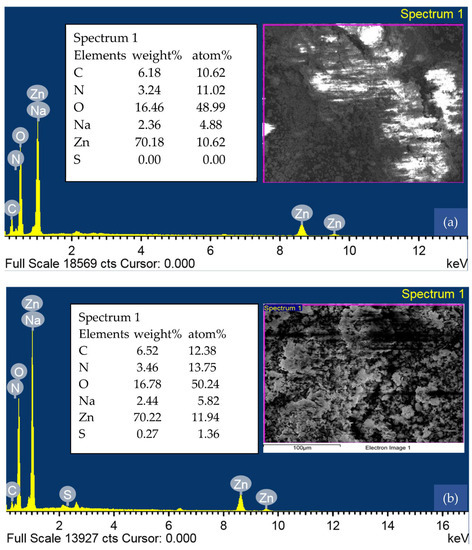
Figure 7.
Energy dispersive X-ray spectroscopy (EDS) analysis of CG-Zn(OH)2NPs (a) before CV dye removal, and (b) after CV dye removal.
A TGA of CG-Zn(OH)2NPs adsorbent at various temperatures is shown in Figure 8. It revealed substantial weight losses with rising temperatures from 299 K to 1066 K. In the temperature range of 299 K to 397 K, a rapid weight loss of 14.10% was observed, which may have been caused by the CG-Zn(OH)2NPs’ dehydration of their moisture content [59]. The steep weight reduction noted from 425 K to 606 K (23.03%) might be attributable to the thermo-oxidative deterioration of CG-Zn(OH)2NPs (Zn salt) [60]. The formation of stable CG-Zn(OH)2NPs appears to have been confirmed by the formation of a plateau region at temperatures above 606 K, and the total weight loss after exposure to 1066 K was approximately 45%. The nanoparticles remained as carbonaceous residue, even at 1066.32 K, and showed a thermal stability of 55.12%.
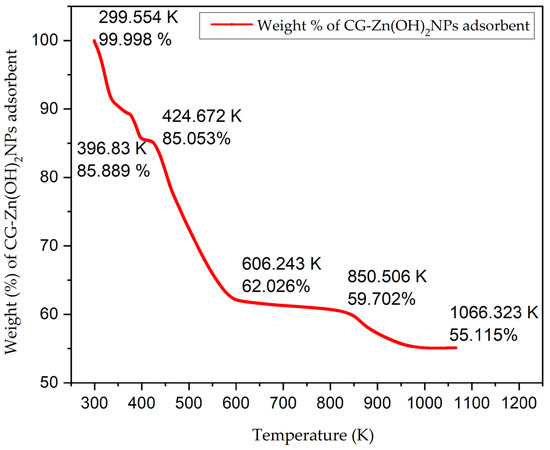
Figure 8.
Thermogravimetric analysis (TGA) of CG-Zn(OH)2NPs before CV dye removal.
3.3. Analysis of Batch Adsorption Studies for the Removal of CV Dye from Simulated Effluent
As a change in pH causes variation in the degree of ionization of adsorbate and the surface properties of adsorbent, the pH has an important role in the adsorption process, which in turn affects the amount of adsorption [43]. With an initial dye concentration of 200 mg L−1, the effect of initial pH on CV removal was investigated by varying the pH of the dye solution from 2 to 12, and the results are depicted in Figure S3. As can be seen in Figure S3, as the pH of the aqueous phase increased from 2 to 12, the decolorization efficacy of CV decreased from 83.65% to 16.84%. This may be due to the decreased attractive forces between the CV dye molecules and the functional groups on the particle surface. The presence of excess OH− ions will deprotonate the active sites on the surface of the adsorbent, increasing the number of negatively charged sites as the pH of the solution rises [61]. Electrostatic repulsion prevents CV dye anions from adhering to an adsorbent with a negatively charged surface site. At pH 2, the CV decolorization efficiency reached its maximum value (83.65%). The anionic dye molecules and the solid particles’ protonated binding sites interact strongly and electrostatically at pH 2 [7]. The effect of CG-Zn(OH)2NPs’ dosage on the decolorization of CV was examined by differing the particle dosage from 1.5–10.5 g L−1, with an initial adsorbate concentration of 200 mg L−1 at pH 2. Figure 9 shows that when the adsorbent dosage is increased from 1.5 to 10.5 g L−1, the dye concentration in the solution at equilibrium (Ce) drops from 104.27 mg L−1 to 20.12 mg L−1, but the decolorization efficacy rises from 47.86% to 89.94%. This could be because the adsorbent has a larger surface area and there are more binding sites for the adhesion of CV dye [62]. However, as the adsorbent dosage rises, the dye uptake at equilibrium (qe) decreases from 63.82 to 17.98 mg g−1. This is primarily because there is less of a driving force between the adsorbate concentration in the solution and the particle surface [61]. As a result, as the dosage of the nanoparticles increases, there is less competition for the available binding sites for dye adsorption (an increase in the unsaturation of adsorption active sites on the solid surface) [7].
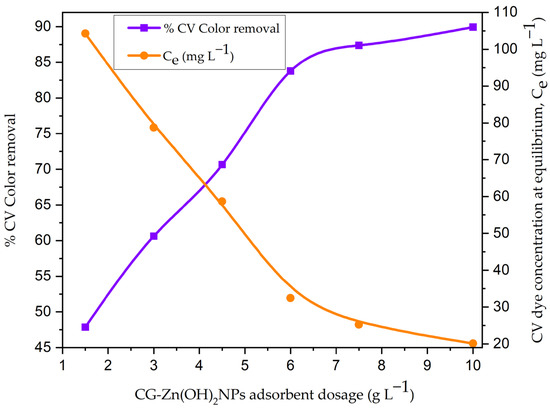
Figure 9.
Effect of CG-Zn(OH)2NPs adsorbent dosage on CV dye decolorization (initial pH: 2; initial dye concentration: 200 mg L−1; Calotropis gigantea leaf extract zinc hydroxide (CG-Zn(OH)2) particle size: 65.38 µm; shaking speed: 150 rpm; contact time: 24 h; temperature: 299 K).
The impact of particle size on the adsorption of CV onto the nanoparticle surface is shown in Figure S4. The ratio of decolorization efficiency to particle size is inverse. Figure S4 demonstrates that as the particle size decreased from 724 to 55 µm, the CV decolorization efficiency gradually increased from 66.18% to 87.55%. The larger surface area of nanoparticles per unit mass of adsorbent that is exposed for surface adsorption may be the reason for the higher decolorization efficiency (87.55%) [63]. Additionally, the diffusion path of the smaller particles will be shorter, allowing the adsorbate molecule to penetrate the surface of the particles deeper and more quickly, achieving the maximum percentage of color removal. The influence of shaking speed on the decolorization efficiency of CV was examined by differing the shaking speed from 0 to 180 rpm. Figure S5 represents the decolorization efficiency of CV rose from 39.85% to 85.19% with a rising shaking speed. The reduction in the thickness of the external boundary layer surrounding the nanoparticle surface may have increased turbulence, which in turn increased external film diffusion and CV dye molecules’ uptake, leading to the increase in percentage decolorization [34]. Increasing the adsorbent–dye solutions’ contact surface and facilitating the diffusion of adsorbate molecules to the particle surface could explain this phenomenon [7]. To investigate the effect of electrolytes on the adsorptive removal of CV, various concentrations of sodium chloride (NaCl), sodium nitrate (NaNO3), and magnesium chloride (MgCl2) were added in separate batches. Figure 10 depicts the results of varying the electrolyte concentration in 200 mg L−1 of CV dye solution from 0 to 1.5% (w/v). It demonstrates that CV adsorption rises in response to an increase in electrolyte concentration. This is because there is more positive charge on the surface of the nanoparticle, which means there is less force to repel the adsorbent and CV dye molecules [64]. To put it another way, this could be because of an increase in ionic strength that causes dye molecules in solution to aggregate (dimerize) more, which in turn makes CV easier to adsorb [65]. This aggregation has been suggested to be explained by several intermolecular forces, including van der Waals forces, ion–dipole forces, and dipole–dipole forces. The addition of salt to the dye solutions may increase the forces that exist between dye molecules [66].
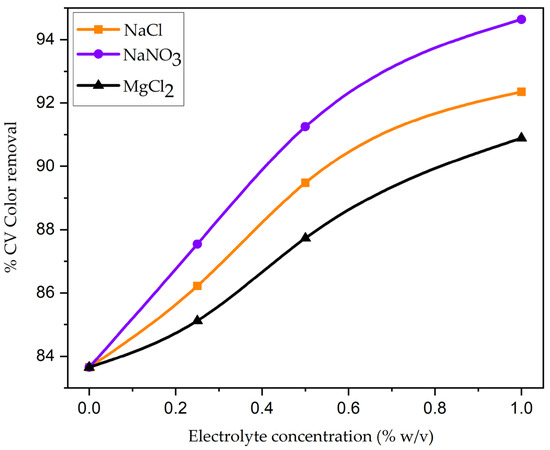
Figure 10.
Effect of electrolytes on the removal of CV dye using CG-Zn(OH)2NPs adsorbent. (Initial pH: 2; initial adsorbate concentration: 200 mg L−1; dosage of CG-Zn(OH)2NPs adsorbent: 6 g L−1; size of adsorbent particle: 65.38 μm; shaking speed: 150 rpm; contact time: 8 h; temperature: 299 K).
3.4. Analysis of Factorial Experimental Design and Optimization of Process Parameters
The central composite design was used to optimize the process independent variables for batch decolorization of CV using CG-Zn(OH)2NPs adsorbent because it is more effective and only requires a small number of runs. Table 3 presents a comparison of predicted response values to 31 sets of experimental results for batch adsorption. The results for decolorization efficiency and adsorption capacity at equilibrium (qe) were investigated by analysis of variance (ANOVA) and are reported in Table 4 and Table 5, respectively.
Table 3.
Batch decolorization experiments using the CCD matrix for CV dye removal by CG-Zn(OH)2NPs to test the adsorbent’s ability.
Table 4.
Analysis of variance (ANOVA) for decolorization efficiency of CV dye using CG-Zn(OH)2NPs adsorbent from the data of central composite design (CCD) experiments in 24 full factorial designs.
Table 5.
ANOVA for equilibrium dye uptake of CV onto CG-Zn(OH)2NPs adsorbent.
From Table 4, the coefficients for the linear effect of various process parameters (X1, X2, X3, and X4) were an important effect on decolorization efficiency (P = 0.000). The coefficients of the quadratic effect of nanoparticle dosage (X3) and particle size (X4) are the first and second significant factors (P = 0.000, P = 0.039), respectively. Both the initial dye concentration (X2) and the initial pH (X1) of the variable have non-significant coefficients of the quadratic effect. The most significant factor, with a significance level of P = 0.015, is the X1X2 interaction effect coefficient, which plays a positive role. However, it did not appear that the coefficients of the other interactive effects (X1X3, X1X4, X2X3, X2X4, X3X4) among the variables were important. The regression model Equation (27) for % decolorization efficiency is
% CV dye removal = 83.91 − 1.5492 X1 − 2.9817 X2 + 2.7758 X3 − 1.7633 X4 + 0.1215 X12 − 0.4185 X22 − 1.7435 X32 − 0.5623 X42 + 0.9062 X1 X2 + 0.1050 X1 X3 + 0.0825 X1X4 + 0.1538 X2X3 − 0.1612 X2X4 − 0.4475 X3X4
From Table 5, the coefficients for the linear effect of various process parameters (X1, X2, X3, and X4) had an important effect on equilibrium dye uptake (P = 0.000). The coefficient of the quadratic effect of initial dye concentration (X2) is the first important factor (P = 0.000). The coefficients of the quadratic effect of the independent variables X1, X3, and X4 are not important. The first and most significant factor is the coefficient of the interaction effect of X1X2 (P = 0.072). However, it did not appear that the coefficients of the other interactive effects (X1X3, X1X4, X2X3, X2X4, X3X4) among the variables were important. The regression model Equation (28) for the adsorption capacity at equilibrium is
CV dye adsorption capacity at equilibrium = 27.97 − 0.5018 X1 + 2.1644 X2 − 3.6906 X3 − 0.5871 X4 + 0.1111 X12 − 0.5745 X22 + 0.0689 X32 − 0.1168 X42 + 0.2656 X1 X2 + 0.0953 X1 X3 + 0.0471 X1X4 − 0.2401 X2X3 − 0.1466 X2X4 − 0.0461 X3X4
The calculated values of decolorization efficiency (Equation (25)) and adsorption capacity at equilibrium (Equation (26)) match the experimental values fairly well, with R2 values of 0.9574 and 0.9897, respectively. This suggests that the aforementioned model equations (25,26) could accurately describe more than 95% of the response variations. The high accuracy of the chosen models is demonstrated by the regression models’ adequate precision (>4) and R2 values (95.74% for decolorization efficiency and 98.97% for adsorption capacity at equilibrium) [67]. Additionally, this indicates that the model accounts for at least 4.5% of the variation. The measure of goodness of fit, the adjusted R2 (92.01% for decolorization efficiency and 98.07% for adsorption capacity at equilibrium), is useful for comparing the model to various process-independent variables. By making use of the degrees of freedom in its calculations, it adjusts the R2 value to account for the number of terms in the model and the sample size. The predicted residual sum of squares (PRESS) statistics can be used to calculate the predicted R2 (75.72% for decolorization efficiency and 94.10% for adsorption capacity at equilibrium), which can prevent the model from overfitting. The models have greater predictive potential if the predicted R2 value is higher. This could mean that an overfit model will not be able to predict any new observations nearly as well as it fits the data that are already there. The residual error, which measures the difference between the experimental and calculated response values, is used to determine the model’s suitability. Lower RMSE (0.9612 for decolorization efficiency and 0.3964 for adsorption capacity at equilibrium) and AAD (95% for decolorization efficiency and 1.145% for adsorption capacity at equilibrium) values provide the best-fit model. The response variation and their appearance in a normal distribution cannot be explained by the model [68].
3.4.1. Analysis of Contour and Response Surface Plots
To determine the optimal response level for each factor and to investigate how the variables interact with one another, contour and response surface plots were used. Figure 11a,b depict contour plots of the decolorization efficiency of CV from simulated effluent. Figure 11a depicts the contour plot of adsorption efficiency as a role of initial pH and adsorbate concentration. It exits when the pH is between 1.6 and 1.625 and the initial adsorbate concentration is between 150 and 153 mg L−1, and the effect is important. Figure 11b depicts that the maximum percentage color removal occurs when the CG-Zn(OH)2NPs dosage ranges between 6 and 8 g L−1 and the particle size ranges from 42 to 105 µm, and the effect is important. Figure 12a,b depict contour plots for equilibrium dye uptake. Figure 12a demonstrates that the pH ranges between 1.6 and 2.4, the adsorbate concentration is between 210 and 250 mg L−1, and the effect is important. When the CG-Zn(OH)2NPs size is between 42 and 147 µm and the particle dosage is between 4 and 4.25 g L−1, as shown in Figure 12b, the predicted dye uptake at equilibrium is maximum, and the effect is substantial.
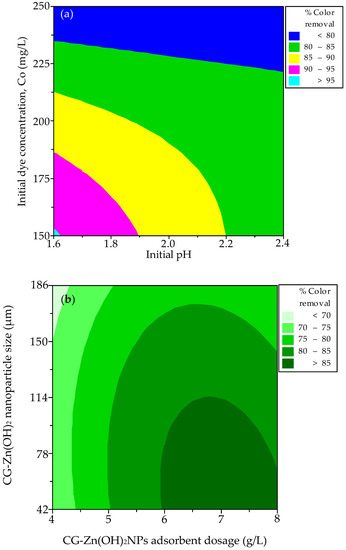
Figure 11.
Contour plots for the interaction between (a) initial concentration of the adsorbate and initial pH, and (b) size of the CG-Zn(OH)2 nanoparticle and adsorbent dosage on decolorization of CV dye.
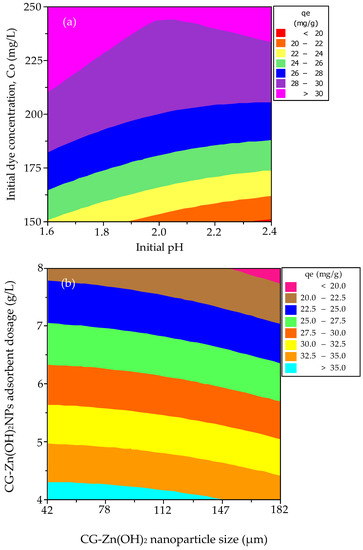
Figure 12.
Contour plots for the interaction between (a) initial adsorbate concentration and initial pH, and (b) dosage of the CG-Zn(OH)2NPs adsorbent and particle size on equilibrium dye uptake of CV.
Figure 13a,b depict the surface plots for the decolorization efficiency of CV from synthetic dye wastewater. Figure 13a demonstrates the surface plot of the response variable as a role of initial pH and the dosage of CG-Zn(OH)2NPs. It reveals that an increase in particle dosage and a decrease in pH both result in an increase in CV decolorization efficiency. Color removal from an aqueous phase is significantly influenced by the pH range of 1.6–2.4 and the dosage of the adsorbent, which ranges from 4 to 8 g L−1. Figure 13b depicts that with a decrease in initial dye concentration and particle size, the % color removal improves. The response surface plot of particle size in the range of 42 to 186 μm vs. the initial dye concentration in the range of 150–250 mg L−1 shows a significant effect on decolorization. The response surface plots for the equilibrium dye uptake of CV are shown in Figure 14a,b. Figure 14a suggests that the dye adsorption capacity at equilibrium decreases with an increase in pH and an increase in CG-Zn(OH)2NPs’ dosage. The response plot of nanoparticle dosage ranging between 4 and 8 g L−1 vs. the initial pH of the dye solution in the range of 1.6–2.4 shows a significant effect on equilibrium dye uptake. Similarly, Figure 14b exhibits that with an increase in the dye concentration and a decrease in the particle size, the adsorption capacity (qe) improves. The response surface plot of dye concentration in the range of 150–250 mg L−1 vs. the adsorbent particle size in the range of 42 and 182 μm shows a significant effect on the uptake of CV from aqueous solution. The calculated values of response variables acquired from the regression model equations are closely related to those values found from the experiment and response surface plots under optimum conditions.
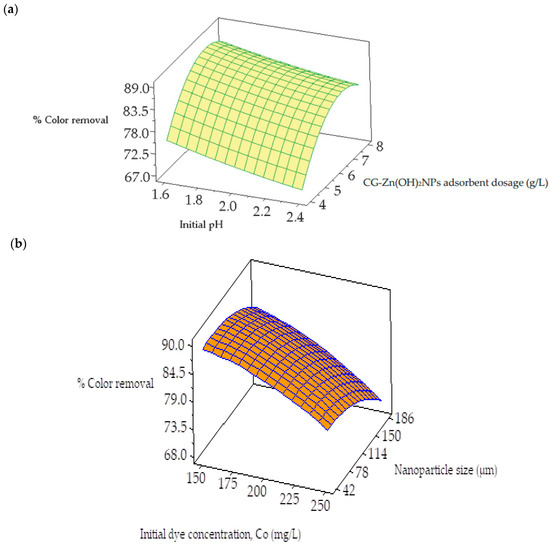
Figure 13.
Response surface plots for the interaction between (a) CG-Zn(OH)2NPs adsorbent dosage and initial pH, and (b) CG-Zn(OH)2 nanoparticle size and initial adsorbate concentration on decolorization of CV dye.
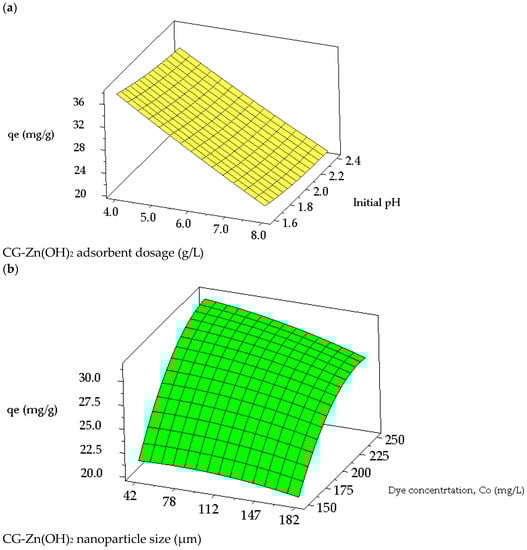
Figure 14.
Response surface plots for the interaction between (a) initial pH and dosage of CG-Zn(OH)2NPs adsorbent, and (b) initial adsorbate concentration and particle size on adsorption capacity of CV at equilibrium.
3.4.2. Validation of Process Model
Four solutions with varying ideal initial conditions are used to forecast the optimal conditions for CV dye removal and equilibrium dye uptake by CG-Zn(OH)2NPs adsorbent, which is reported in Table 6 and Table 7, respectively. Various experiments were conducted under different levels of the independent variables, and the process outcome was compared with the anticipated responses. From Table 6, the maximum decolorization efficiency (90.74%) was attained in experiment number 3, compared with the other three experiments. Experiment number 4 had the highest equilibrium adsorption capacity (35.12 mg g−1), as shown in Table 7, when compared to the other three trials. Table 8 provides the optimal process parameter values for maximum response. The design of empirical models could also be used to describe the relationship between experimental parameters and the response in CV dye decolorization, as the comparison between the experimental and calculated responses demonstrates a positive relationship between them. The optimization studies made it abundantly clear that the RSM is an appropriate approach for predicting the ideal conditions for maximum colour removal percentage and equilibrium adsorption capacity.
Table 6.
Process model validation for % CV dye decolorization using CG-Zn(OH)2NPs adsorbent. (Shaking speed: 150 rpm; contact time: 24 h; temperature: 299 K).
Table 7.
Process model validation for CV dye adsorption capacity at equilibrium using CG-Zn(OH)2NPs adsorbent. (Shaking speed: 150 rpm; contact time: 24 h; temperature: 299 K).
Table 8.
Optimum values of the process parameters for maximum percentage color removal and adsorption capacity of CV dye at equilibrium. (Shaking speed: 150 rpm; contact time: 24 h; temperature: 299 K).
3.5. Adsorption Isotherm Models Inference
The interaction between the CV dye molecules and CG-Zn(OH)2NPs adsorbent at a constant temperature was analyzed, and the empirical results were incorporated into Langmuir, Freundlich, and Temkin isotherm models. Figure 15, Figures S6 and S7 depict linearized plots for the Langmuir, Freundlich, and Temkin isotherm models, respectively, and Table 9 provides the model parameters derived from these plots. The R2 and 2 values of the three models rank in the following order: Langmuir > Temkin > Freundlich isotherms. When compared to the Temkin isotherm (R2 = 0.9884, 2 = 1.403) and Freundlich (R2 = 0.9642, 2 = 2.615) models, it was found that the Langmuir model had a higher regression coefficient (R2 = 0.9994, 2 = 0.045). This indicates that in comparison to other isotherm models, the empirical saturation data for CV dye adsorption with zinc hydroxide nanoparticles fit the Langmuir model very well. The graphical representation of various non-linear isotherm models is shown in Figure 16. It shows that the experimental dye adsorption capacity at equilibrium (qe) for CV dye removal fitted very well with the Langmuir isotherm model. The adsorption was homogeneous; the energy of adsorption is the same in the entire particle surface, and there is no interaction between the adjacent solute molecules on the solid surface, as assumed by the Langmuir isotherm, with the formation of a unimolecular layer at the binding sites [69]. The utmost monolayer capacities of the adsorbent (qmax) and Langmuir constant (KL) at 299 K were estimated as 40.26 mg g−1 and 0.1092 L mg−1, respectively. This demonstrates that 40.26 mg of CV dye could be absorbed by 1 g of the prepared adsorbent. The uniform distribution of active sites on the surface of the particle might be the reason why the data are more consistent with the Langmuir isotherm. Figure S8 depicts the separation factor and RL values obtained with the CG-Zn(OH)2NPs adsorbent at various initial adsorbate concentrations. It exhibits that the values of RL diminished from 0.268 to 0.0296 with a rise in initial dye concentration. In addition, the positive uptake of the adsorption process was confirmed by the fact that the value of RL fell within the range of 0 to 1 at various initial dye concentrations (25 to 300 mg L−1), and the process was found to be more favorable at higher concentrations. The adsorption is advantageous once more, as demonstrated by the value of the Freundlich constant, n (1.8584), which is between 1 and 10 [70].
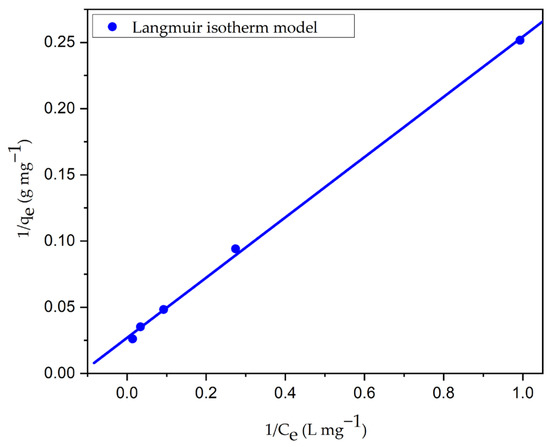
Figure 15.
Langmuir isotherm plot for decolorization of CV dye using CG-Zn(OH)2NPs adsorbent. (Initial pH: 2; initial adsorbate concentration: 25–300 mg L−1; dosage of CG-Zn(OH)2NPs adsorbent: 6 g L−1; size of adsorbent particle: 78 µm; shaking speed: 150 rpm; contact time: 24 h; temperature: 299 K).
Table 9.
Parameters of an equilibrium isotherm model for CV dye adsorption onto CG-Zn(OH)2NPs adsorbent.
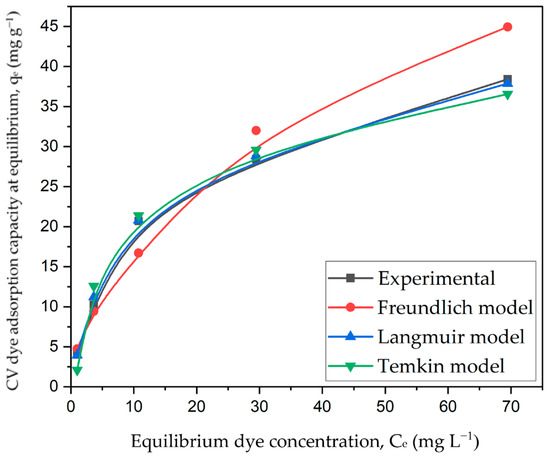
Figure 16.
Non-linear isotherm plot for decolorization of CV dye using CG-Zn(OH)2NPs adsorbent. (Initial pH: 2; initial adsorbate concentration: 25–300 mg L−1 dosage of CG-Zn(OH)2NPs adsorbent: 6 g L−1; size of adsorbent particle: 78 µm; shaking speed: 150 rpm; contact time: 24 h; temperature: 299 K).
Comparison of Maximum Adsorption Capacity (qmax) with Reported Adsorbents for the Decolorization of CV Dye
Table 10 shows the various adsorbents’ maximum monolayer adsorption capacities (qmax) for the decolorization of CV dye. The prepared CG-Zn(OH)2NPs adsorbent has a higher adsorption capacity (40.26 mg g−1) for decolorizing CV dye than the reported adsorbents, as shown in the table. The CG-Zn(OH)2NPs adsorbent was found to be an auspicious adsorbent for the removal of CV from simulated effluent, according to the findings.
Table 10.
Comparison of maximum unimolecular layer CV dye adsorption capacity of numerous adsorbents evaluated by the Langmuir isotherm model.
3.6. Inference from Thermodynamic Studies for the Removal of CV Dye
The process’s favorability is typically indicated by adsorption at a different temperature. Figure S9 depicts the dye concentrations at equilibrium (Ce), the amount of adsorbate loaded onto the CG-Zn(OH)2NPs adsorbent at saturation (qe), and that at various temperatures. It demonstrates that as the temperature rises from 299 to 333 K, the equilibrium dye uptake increased from 40.234 to 49.636 mg g−1. The adsorbent particle’s pore volume increased from 4.84 mm3 g−1 at 299 K to 9.36 mm3 g−1 at 323 K, allowing more dye molecules to rapidly pierce deeper into the surface of the particle [9], resulting in an increase in CV dye’s qmax from 40.26 mg g−1 at 299 K to 52.58 mg g−1 at 323 K. At higher temperatures, the enhancement in adsorption capacity at equilibrium and the percentage colour removal suggest that the adsorption process is rapid and endothermic. This phenomenon might be caused by an increase in the transfer of adsorbate molecules across the external boundary layer and within the internal pores of the nanoparticle leading to a decrease in the swelling of the dye molecules with rising temperature [84]. Adsorbate molecules may gain sufficient energy to interact with active sites on the surface of the particle. The chemical interaction among CV adsorbate molecules and the adsorbent, the creation of new uptake active sites on the particle surface, and the increased rate of CV dye molecules’ intra-particle diffusion into the adsorbent’s pores could be the causes of the increase in dye uptake at higher temperatures [85]. The values of the thermodynamic parameters are reported in Table 11 after being calculated by plotting ln Ka vs. 1/T (Figure 17). They indicate that the adsorption was a spontaneous and attainable process, because the values of free energy change increased with a drop in temperature. Additionally, the negative values of ΔG increase with temperature rise, indicating that higher temperatures encourage the uptake of adsorbate molecules. The adsorption process is endothermic, as evidenced by the positive values of ΔH (42.5364 kJ mole−1) and ΔS (0.1524 kJ mole−1 K−1), with higher randomness of CV adsorbate molecules on the surface of the particle than in the dye effluent, favoring solid–liquid interactions. The adsorption activation energy (Ea) was evaluated from the plot of Arrhenius (Figure 18) and the values fall within the range of 40.09 and 45.92 kJ mole−1 (Table S1), at different adsorbate concentrations ranging from 25 to 300 mg L−1. The chemisorptive process of dye molecules onto the CG-Zn(OH)2NPs adsorbent is supported by the values of Ea (43.02 kJ mole−1 greater than 40 kJ mole−1) and ΔH (42.5364 kJ mole−1 greater than 25 kJ mole−1) [86]. At higher temperatures, these might confirm the strong covalent bond between CV adsorbate molecules and the solid particle’s binding sites.
Table 11.
Thermodynamic parameters for the adsorption of CV dye onto CG-Zn(OH)2NPs adsorbent.
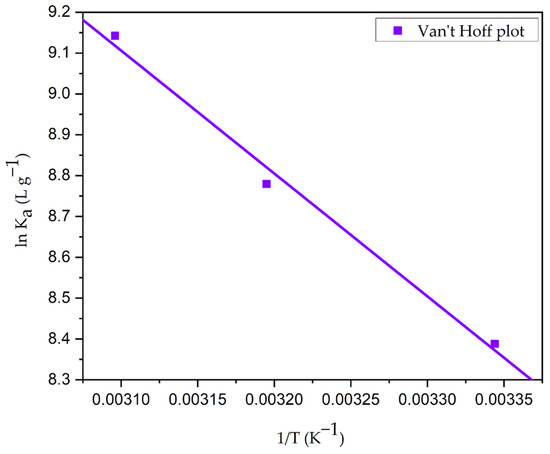
Figure 17.
Van ‘t Hoff plot of CV dye adhesion to the CG-Zn(OH)2NPs adsorbent. (Initial pH: 2; initial adsorbate concentration: 25–300 mg L−1; dosage of CG-Zn(OH)2NPs adsorbent: 6 g L−1; size of adsorbent particle: 78 µm; shaking speed: 150 rpm; contact time: 24 h; temperature: 299–323 K).
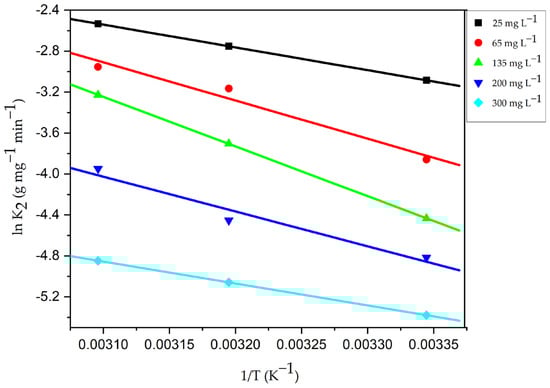
Figure 18.
Arrhenius plot for adhesion of CV dye onto CG-Zn(OH)2NPs adsorbent. (Initial pH: 2; initial adsorbate concentration: 25–300 mg L−1; dosage of CG-Zn(OH)2NPs adsorbent: 6 g L−1; size of adsorbent particle: 78 µm; shaking speed: 150 rpm; contact time: 24 h; temperature: 299–323 K).
3.7. Adsorption Kinetic Models Inference
The kinetics for the adhesion of CV onto the CG-Zn(OH)2NPs was quick at the beginning of the operation. Nevertheless, the adsorption rate decreased gradually with time. The binding sites attained equilibrium at about 45 min for 25 mg L−1, 125 min for 65 mg L−1, 200 min for 135 mg L−1, 250 min for 200 mg L−1, and 340 min for 300 mg L−1. Figure S10 demonstrated that the decolorization efficiency of CV gradually diminished from 95.26 to 76.45%; however, the qe value enhanced from 3.97 to 38.22 mg g−1 with the rise in dye concentration from 25 to 300 mg L−1. The adhesion of dye molecules to the binding sites on the particle surface and the enhanced competition among the more dye molecules at the fixed binding sites of the solid adsorbent account for the diminished percentage of color removal with increasing dye concentration. As a result, the percentage of color removed decreases because the adsorbent surface lacks binding sites [85]. With an increase in the initial adsorbate concentration, the initial adsorption rate (h) raised from 0.722 to 6.79 mg g−1 min−1. The driving force between the adsorbate molecules in the solid and liquid phases has increased due to the diffusion of molecules from the feed solution to the surface of the particle, increasing the values of qe and h [9,43]. Figure 19 and Figure S11 depict the pseudo-second order and pseudo-first order kinetic plots at different initial adsorbate concentrations, respectively, and Table 12 lists the experimental results of kinetic parameters. The kinetic plots show that in comparison to the pseudo-first order plots, the pseudo-second order plots are more linear. According to Table 12, it was observed that a higher value of regression coefficient, R2 (0.9999), and a lower value of normalized standard deviation (NSD) (0.647–0.143%) and a close relationship among the calculated and empirical qe data at different initial adsorbate concentrations imply that the examined adhesion process obeys a pseudo-second order model. This further indicates that chemisorption, which involves the sharing of electrons between the adsorbate molecules and the adsorbent as covalent forces, can increase the amount of adsorption [87]. The adsorption experiments were carried out at pH 2. The nanoparticles’ pH point of zero charge was found to be at pH 8.5. Therefore, at pH 2, the surface of the CG-Zn(OH)2NPs adsorbent will be positively charged, which expedites the binding of negatively charged anionic dye. The predicted value of activation energy and enthalpy change in the examined adhesion process once more demonstrate the entanglement of the chemisorption, which is reported in the above Section 3.6. The pseudo-first order kinetic model’s qe values were significantly different from the empirical data; the higher value of NSD and lower value of R2 indicate that this model is invalid for the adhesion of CV. As the dye concentration increased from 25 to 300 mg L−1, the rate constant K2 diminished from 0.0457 to 0.0046 g mg−1 min−1. At lower concentrations, there is less competition for binding sites on the surface of the particles, whereas at higher concentrations, there is more competition for surface sites [42].
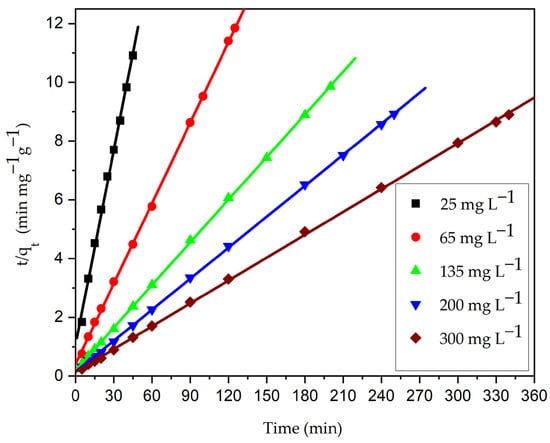
Figure 19.
Ho’s pseudo-second order kinetic plot for adhesion of CV dye onto CG-Zn(OH)2NPs adsorbent. (Initial pH: 2; initial adsorbate concentration: 25–300 mg L−1; CG-Zn(OH)2NPs adsorbent dosage: 6 g L−1; size of adsorbent particle: 78 µm; shaking speed: 150 rpm; temperature: 299 K; contact time: 24 h).
Table 12.
Parameters of the kinetic model for the CV dye adhesion onto the CG-Zn(OH)2NPs adsorbent.
Adsorption Rate Mechanism Inference
Figure 20 depicts the plot that results from fitting the intra-particle diffusion model to kinetic experimental data. Table 12 shows the parameters of the model. In Figure 20, the plot of qt vs. t1/2 is made of three straight-line portions. The boundary layer diffusion of dye molecules to the surface of the particle is represented by the first linear portion. The high beginning pace of CV decolorization was because of the accessibility of more binding sites on the surface of the particle during an initial couple of moments [6,9]. Within 15 min, the CG-Zn(OH)2NPs adsorbent was able to adsorb nearly 65% of CV, indicating a strong electrostatic interaction among the adsorbate molecules and the adsorbent’s exterior surface. The progressive adsorption stage, during which pore diffusion controls the rate, accounts for the second linear portion which follows intra-particle diffusion. This suggests that adsorbate molecules have diffused into the solid particle’s pores from the adsorbent surface. The adsorbent’s pore diffusion begins to slow down in the third region as a result of the low concentration of adsorbate in the dye solution and the final saturation of active sites in the adsorbent’s pores. The intercept value C is obtained by extrapolating the second linear portion to the y-axis. A large intercept value indicates a greater film diffusion effect. The process is primarily controlled by pore diffusion, with a small influence from external boundary layer diffusion, as evidenced by the diminished intercept value. Furthermore, the fact that the plots at each concentration did not traverse the origin suggests that the rate-controlling step was not intra-particle diffusion [88]. Hence, external film diffusion controls the overall rate of adsorption, followed by CV dye anions’ pore diffusion to the particle interior surface, which has a small effect. It was observed that the adhesion process can be controlled in the initial phases by external boundary layer diffusion; while the adsorbent surface is accumulated with dye molecules, it might be controlled in later phases by pore diffusion [43]. Moreover, the kinetic expressions of Bangham and Boyd were utilized for the analysis of the experimental data. Both the Boyd plot (Figure 21a) and the Bangham plot (Figure 21b) were found to be non-linear, and did not traverse through the origin. This suggests that the reaction’s overall rate is mostly controlled by the diffusion of the external boundary layer [89].
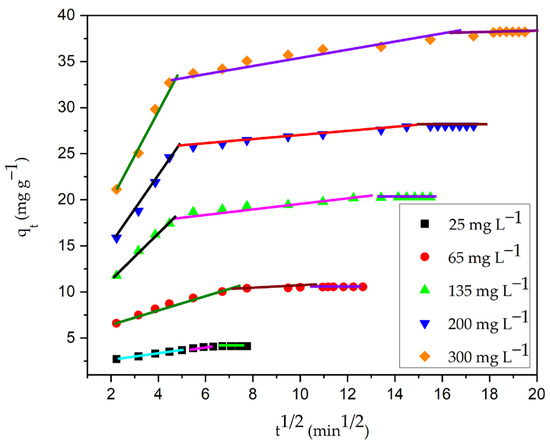
Figure 20.
Intra-particle diffusion plot for decolorization of CV dye using CG-Zn(OH)2NPs adsorbent. (Initial pH: 2; initial dye concentration: 25–300 mg L−1; CG-Zn(OH)2NPs adsorbent dosage: 6 g L−1; adsorbent particle size: 78 µm; agitation speed: 150 rpm; contact time: 24 h; temperature: 299 K).
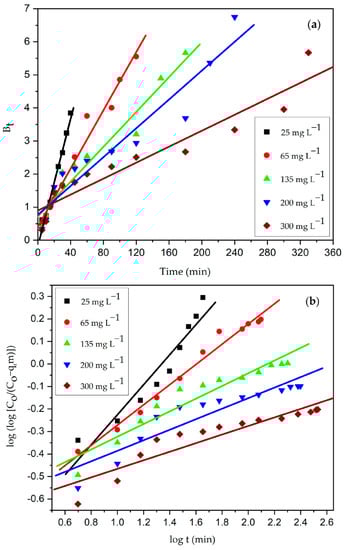
Figure 21.
(a) Boyd and (b) Bangham plot for adhesion of CV dye onto CG-Zn(OH)2NPs adsorbent. (Initial pH: 2; initial adsorbate concentration: 25–300 mg L−1; dosage of CG-Zn(OH)2NPs adsorbent: 6 g L−1; size of adsorbent particle: 78 µm; shaking speed: 150 rpm; contact time: 24 h; temperature: 299 K).
3.8. Inference from CG-Zn(OH)2NPs Adsorbent Regeneration and Reusability Studies
Desorption experiments were conducted to remove CV from CG-Zn(OH)2NPs adsorbent saturated with adsorbate molecules, and the results are demonstrated in Figure S12. When compared to the other reagents, it was observed that NaOH is a superior desorbing reagent for regenerating a solid particle loaded with CV adsorbate molecules. The CV dye desorption efficiency diminished as the number of runs increased using the alkali NaOH. With different desorbing reagents, the desorption efficacy in all runs was determined to be in the order of ethanol< methanol < NaOH. In the third run, the maximum CV desorption efficacy with NaOH was determined to be 60.24%. This could be due to the insufficient shaking speed or the small volume of the desorbing reagent, both of which might impede the subsequent expulsion of loaded adsorbate molecules from the surface of the particle to the desorbing reagent [34]. Figure S13 depicts the consequence of different runs of reusability studies for the adhesion of CV. It demonstrates that using the reagent NaOH in the desorption process, 75.35% color removal was maintained after 24 h in the second run, compared to 63.49% in the third run. Additionally, as the number of runs increased, the dye adsorption efficacy progressively diminished as well. This could be because there are deficiencies of active sites on the surface of the particle (inadequate desorption of loaded adsorbate molecules on the adsorbent) [90]. Using the desorbing reagent NaOH, the regenerated adsorbent can be efficiently reused for up to three cycles to eliminate CV dye from the aqueous phase, with a substantial loss in adsorption efficacy.
4. Conclusions
This research work reflects the potentiality of Calotropis gigantea leaf extract zinc hydroxide nanoparticles as an efficient and preferential adsorbent for the expulsion of toxic Coomassie violet dye from an aqueous solution. The co-precipitation method was used to synthesize the nanoparticles, and the prepared adsorbent was characterized by particle size, zero-point charge, surface area, surface morphology, functional group, elemental composition, crystalline structure, and thermal stability, using suitable instrumental analysis. The peaks in FT-IR studies showed that the particle surface contains plentiful hydroxyl, carbonyl, carboxylic acid, and ester/anhydride/alcohol/phenol groups. The influence of reaction parameters such as initial pH, adsorbate concentration, the dosage of adsorbent, size of the adsorbent particle, shaking speed, ionic strength concentration, and temperature on dye adsorption was studied. According to the results of the experiments, the percentage colour removal of CV decreased as the initial pH, adsorbate concentration and particle size increased; it also increased when the concentration of adsorbent and electrolyte was increased. It was observed that the equilibrium dye uptake increased with a rise in temperature and initial adsorbate concentration. Using a central composite design, the batch experiments were carried out to optimize important process parameters to achieve the highest percentage of colour removal (90.74%) and equilibrium dye uptake (35.12 mg g−1). The predicted response values fitted well with the experimental values (R2 = 0.9574, RMSE = 0.9612, and AAD = 0.95% for % colour removal, and R2 = 0.9897, RMSE = 0.3964, and AAD = 1.145% for equilibrium dye uptake). An analysis of variance confirmed the accuracy of the model by using a larger value of F, a lower value of P, a non-significant lack of fit, and the maximum value of regression coefficient. The optimum pH, dye concentration, CG-Zn(OH)2NPs adsorbent dosage, and particle size were found to be 1.9, 175 mg L−1, 7 g L−1, and 78 μm, respectively for CV colour removal. Similarly, the optimum pH, dye concentration, CG-Zn(OH)2NPs adsorbent dosage, and particle size were found to be 1.8, 225 mg L−1, 5 g L−1, and 78 μm, respectively for CV dye adsorption capacity at equilibrium. The empirical saturation data were appropriately fitted with the Langmuir isotherm model, with a highest unimolecular layer adsorption capacity (qmax) of 40.26 mg g−1 at 299 K. The CG-Zn(OH)2NPs adsorbent has superior adsorption capacity as compared to the other reported adsorbents. Thermodynamic parameters depicted the negative value of ΔG and the positive values of ΔH, and ΔS confirmed that the adsorption process is spontaneous and endothermic with increases in the randomness of the system; thus, the adsorption is favorable at higher temperatures. This supports the possibility of chemisorption of CV with zinc hydroxide nanoparticles. The adsorption process was described by a pseudo-second order rate equation, as demonstrated by kinetic studies. Intra-particle diffusion, Bangham’s model, and Boyd’s model demonstrated that external film diffusion is the rate-limiting step that mostly controls the overall rate of adsorption. Desorption and reusability studies were performed in various runs, and it was confirmed that the CG-Zn(OH)2NPs adsorbent can be effectively recovered (58.73% in the third run) using the reagent NaOH, and reused up to three runs to adsorb CV dye in aqueous solutions (62.49% in the third run) with a considerable reduction in adsorption efficiency. Desorption studies show that the % desorption decreased with the increase in the number of runs for all various desorbing reagents. The experimental results concluded that CG-Zn(OH)2NPs are an effective and promising adsorbent for the removal of color from synthetic CV dye wastewater with good regeneration efficiency. The better decolorization efficiency of synthetic dye effluent suggests that the Calotropis gigantea leaf extract zinc hydroxide nanoparticles adsorbent may be used effectively to decolorize anionic dyes from industrial effluents.
Supplementary Materials
The following supporting information can be downloaded at: https://www.mdpi.com/article/10.3390/chemengineering7020031/s1, Figure S1: Chemical structure of Coomassie violet (CV) dye, Figure S2: Selection of suitable plant leaf extract zinc hydroxide nanoparticles for the removal of CV dye from wastewater, Figure S3: Effect of initial pH on decolorization of CV dye using Calotropis gigantea leaf extract zinc hydroxide nanoparticles (CG-Zn(OH)2NPs) adsorbent, Figure S4: Effect of Calotropis gigantea leaf extract zinc hydroxide (CG-Zn(OH)2) adsorbent particle size on CV dye decolorization, Figure S5: Effect of agitation speed on decolorization of CV dye using CG-Zn(OH)2NPs adsorbent, Figure S6: Freundlich isotherm plot for decolorization of CV dye using CG-Zn(OH)2NPs adsorbent, Figure S7: Temkin isotherm plot for decolorization of CV dye using CG-Zn(OH)2NPs adsorbent, Figure S8: Separation factor for decolorization of CV dye using CG-Zn(OH)2NPs adsorbent, Figure S9: Effect of temperature on decolourisation of CV dye using CG-Zn(OH)2NPs adsorbent, Figure S10: Effect of initial dye concentration on decolorization of CV dye using CG-Zn(OH)2NPs adsorbent, Figure S11: Lagergren pseudo-first order kinetic plot for decolorization of CV dye using CG-Zn(OH)2NPs adsorbent, Figure S12: Desorption efficiency of CV dye from CG-Zn(OH)2NPs adsorbent in various runs, Figure S13: Reusability of CG-Zn(OH)2NPs adsorbent for the decolorization of CV dye in various runs, Table S1: Activation energy for decolorization of CV dye using CG-Zn(OH)2NPs adsorbent at various initial dye concentrations.
Author Contributions
Conceptualization, V.P.; methodology, V.P., K.N., S.S., S.M. and H.S.K.; software, V.P., K.N., S.S. and S.M.; validation, K.N., H.S.K., S.S. and S.M.; formal analysis, V.P., K.N., S.S., S.M. and H.S.K.; investigation, V.P., K.N. and H.S.K.; resources, V.P., S.S. and S.M.; data curation, V.P., K.N. and H.S.K.; writing—original draft preparation, V.P., K.N., S.S. and S.M.; writing—review and editing, V.P., K.N. and H.S.K.; visualization, V.P., K.N. and H.S.K.; supervision, V.P., K.N. and H.S.K. All authors have read and agreed to the published version of the manuscript.
Funding
This research received no external funding.
Data Availability Statement
The data used to support the findings of this study are available from the corresponding author upon request.
Acknowledgments
The authors would like to thank the Department of Chemical engineering, Manipal Institute of Technology (MIT), Manipal Academy of Higher Education (MAHE) for providing all the facilities to perform the research work. In addition, the authors thank DST-PURSE Laboratory, Mangalore University, Mangalagangotri, Mangalore for providing the FE-SEM/EDS and FT-IR facilities.
Conflicts of Interest
The authors declare that they have no potential conflict of interest regarding the publication of this article.
References
- Naghizadeh, A.; Mizwari, Z.M.; Ghoreishi, S.M.; Lashgari, S.; Derazkola, S.M.; Rezaie, B. Biogenic and eco-benign synthesis of silver nanoparticles using jujube core extract and its performance in catalytic and pharmaceutical applications: Removal of industrial contaminants and in-vitro antibacterial and anticancer activities. Environ. Technol. Innov. 2021, 23, 101560. [Google Scholar] [CrossRef]
- Khormali, K.; Mizwari, Z.M.; Ghoreishi, S.M.; Derazkola, S.M.; Khezri, B. Novel Dy2O3/ZnO-Au ternary nanocomposites: Green synthesis using pomegranate fruit extract, characterization and their photocatalytic and antibacterial properties. Bioorg. Chem. 2021, 115, 105204. [Google Scholar] [CrossRef] [PubMed]
- Ahmed, S.F.; Mofijur, M.; Rafa, N.; Chowdhury, A.T.; Chowdhury, S.; Nahrin, M.; Islam, S.; Ong, H.C. Green approaches in synthesising nanomaterials for environmental bioremediation: Technological advancements, applications, benefits and challenges. Environ. Res. 2022, 204, 111967. [Google Scholar] [CrossRef] [PubMed]
- Ahmed, T.; Noman, M.; Shahid, M.; Niazi, M.B.K.; Hussain, S.; Manzoor, N.; Wang, X.; Li, B. Green synthesis of silver nanoparticles transformed synthetic textile dye into less toxic intermediate molecules through LC-MS analysis and treated the actual wastewater. Environ. Res. 2020, 191, 110142. [Google Scholar] [CrossRef] [PubMed]
- Khan, R.; Saxena, A.; Shukla, S.; Sekar, S.; Senapathi, V.; Wu, J. Environmental contamination by heavy metals and associated human health risk assessment: A case study of surface water in Gomti river basin, India. Environ. Sci. Pollut. Res. 2021, 28, 56105–56116. [Google Scholar] [CrossRef]
- Divya, J.M.; Palak, K.; Vairavel, P. Optimization, kinetics, equilibrium isotherms, and thermodynamics studies of Coomassie violet dye adsorption using Azadirachta indica (neem) leaf adsorbent. Desalination Water Treat. 2020, 190, 353–382. [Google Scholar] [CrossRef]
- Parimelazhagan, V.; Yashwath, P.; Pushparajan, D.A.; Carpenter, J. Rapid removal of toxic Remazol brilliant blue-R dye from aqueous solutions using Juglans nigra shell biomass activated carbon as potential adsorbent: Optimization, isotherm, kinetic, and thermodynamic investigation. Int. J. Mol. Sci. 2022, 23, 12484. [Google Scholar] [CrossRef]
- Badawi, A.K.; Elkodous, M.A.; Aliv, G.A.M. Recent advances in dye and metal ion removal using efficient adsorbents and novel nano-based materials: An overview. RSC Adv. 2021, 11, 36528–36553. [Google Scholar] [CrossRef]
- Vairavel, P.; Rampal, N.; Jeppu, G. Adsorption of toxic Congo red dye from aqueous solution using untreated coffee husks: Kinetics, equilibrium, thermodynamics and desorption study. Int. J. Environ. Anal. Chem. 2021; in press. [Google Scholar] [CrossRef]
- Debamita, C.; Nakul, R.; Gautham, J.P.; Vairavel, P. Process optimization, isotherm, kinetics, and thermodynamics studies for removal of Remazol Brilliant Blue—R dye from contaminated water using adsorption on guava leaf powder. Desalination Water Treat. 2020, 185, 318–343. [Google Scholar] [CrossRef]
- Wamg, H.; Xing, H.; Yan, K.; Han, D.; Chen, J. Oyster shell derived hydroxyapatite microspheres as an effective adsorbent for remediation of Coomassie brilliant blue. Adv. Powder Technol. 2022, 33, 103425. [Google Scholar] [CrossRef]
- Ewuzie, U.; Saliu, O.D.; Dulta, K.; Ogunniyi, S.; Bajeh, A.O.; Iwuozor, K.O.; Ighalo, J.O. A review on treatment technologies for printing and dyeing wastewater (PDW). J. Water Process. Eng. 2022, 50, 103273. [Google Scholar] [CrossRef]
- Sun, L.; Mo, Y.; Zhang, L. A mini review on bio-electrochemical systems for the treatment of azo dye wastewater: State-of-the-art and future prospects. Chemosphere 2022, 294, 133801. [Google Scholar] [CrossRef]
- Senthil Kumar, P.; Joshiba, G.J.; Femina, C.C.; Varshini, P.; Priyadharshini, S.; Arun Karthick, M.S.; Jothirani, R. A critical review on recent developments in the low-cost adsorption of dyes from wastewater. Desalination Water Treat. 2019, 172, 395–416. [Google Scholar] [CrossRef]
- Liu, Z.; Khan, T.A.; Islam, M.A.; Tabrez, U. A review on the treatment of dyes in printing and dyeing wastewater by plant biomass carbon. Bioresour. Technol. 2022, 354, 127168. [Google Scholar] [CrossRef] [PubMed]
- Benettayeb, A.; Seihoub, F.Z.; Pal, P.; Ghosh, S.; Usman, M.; Chia, C.H.; Usman, M.; Sillanpaa, M. Chitosan Nanoparticles as Potential Nano-Sorbent for Removal of Toxic Environmental Pollutants. Nanomaterials 2023, 13, 447. [Google Scholar] [CrossRef]
- Batra, V.; Kaur, I.; Pathania, D.; Sonu; Chaudhary, V. Efficient dye degradation strategies using green synthesized ZnO-based nanoplatforms: A review. Appl. Surf. Sci. Adv. 2022, 11, 100314. [Google Scholar] [CrossRef]
- Haque, S.; Faidah, H.; Ashgar, S.S.; Abujamel, T.S.; Mokhtar, J.A.; Almuhayawi, M.S.; Harakeh, S.; Singh, R.; Srivastava, N.; Gupta, V.K. Green Synthesis of Zn(OH)2/ZnO-Based Bionanocomposite using Pomegranate Peels and Its Application in the Degradation of Bacterial Biofilm. Nanomaterials 2022, 12, 3458. [Google Scholar] [CrossRef]
- Kordy, M.G.M.; Abdel-Gabbar, M.; Soliman, H.A.; Aljohani, G.; BinSabt, M.; Ahmed, I.A.; Shaban, M. Phyto-capped Ag nanoparticles: Green synthesis, characterization, and catalytic and antioxidant activities. Nanomaterials 2022, 12, 373. [Google Scholar] [CrossRef]
- Mitra, S.; Islam, F.; Das, R.; Urmee, H.; Akter, A.; Idris, A.M.; Kandaker, M.U.; Almikhlafi, M.A.; Sharma, R.; Emran, T.B. Pharmacological potential of Avicennia alba leaf extract: An experimental analysis focusing on antidiabetic, anti-inflammatory, analgesic, and antidiarrheal activity. BioMed Res. Int. 2022, 2022, 7624189. [Google Scholar] [CrossRef]
- Singh, J.; Dutta, T.; Kim, K.; Rawat, M.; Samddar, P.; Kumar, P. Green’ synthesis of metals and their oxide nanoparticles: Applications for environmental remediation. J. Nanobiotechnol. 2018, 16, 84. [Google Scholar] [CrossRef]
- Rajivgandhi, G.; Gnanamangai, B.M.; Prabha, T.H.; Poornima, S.; Maruthupandy, M.; Alharbi, N.S.; Kadaikunnan, S.; Li, W. Biosynthesized zinc oxide nanoparticles (ZnO NPs) using actinomycetes enhance the anti-bacterial efficacy against K. Pneumoniae. J. King Saud Univ. Sci. 2022, 34, 101731. [Google Scholar] [CrossRef]
- Patil, S.P. Calotropis gigantea assisted green synthesis of nanomaterials and their applications: A review. Beni-Suef Univ. J. Basic Appl. Sci. 2020, 9, 14. [Google Scholar] [CrossRef]
- Kemala, P.; Idroes, R.; Khairan, K.; Ramli, M.; Jalil, Z.; Idroes, G.M.; Tallei, T.E.; Helwani, Z.; Safitri, E.; Iqhrammullah, M.; et al. Green synthesis and antimicrobial activities of silver nanoparticles using Calotropis gigantea from Ie Seu-Um Geothermal area, Aceh Province, Indonesia. Molecules 2022, 27, 5310. [Google Scholar] [CrossRef]
- Agarwal, H.; Venkatkumar, S.; Rajeshkumar, S. A review on green synthesis of zinc oxide nanoparticles—An eco-friendly approach. Resour.-Effic. Technol. 2017, 3, 406–413. [Google Scholar] [CrossRef]
- Kaur, M.; Gautam, A.; Guleria, P.; Singh, K.; Kumar, V. Green synthesis of metal nanoparticles and their environmental applications. Curr. Opin. Environ. Sci. Health 2022, 29, 100390. [Google Scholar] [CrossRef]
- Aswathi, V.P.; Meera, S.; Ann Maria, C.G.; Nidhin, M. Green synthesis of nanoparticles from biodegradable waste extracts and their applications: A critical review. Nanotechnol. Environ. Eng. 2022; in press. [Google Scholar] [CrossRef]
- Khan, M.; Ware, P.; Shimpi, N. Synthesis of ZnO nanoparticles using peels of Passiflora foetida and study of its activity as an efficient catalyst for the degradation of hazardous organic dye. SN Appl. Sci. 2021, 3, 528. [Google Scholar] [CrossRef]
- Faisal, S.; Jan, H.; Shah, S.A.; Shah, S.; Khan, A.; Akbar, M.T.; Rizwan, M.; Jan, F.; Wajidullah; Akhtar, N.; et al. Green Synthesis of Zinc Oxide (ZnO) Nanoparticles Using Aqueous Fruit Extracts of Myristica fragrans: Their Characterizations and Biological and Environmental Applications. ACS Omega 2021, 6, 9709–9722. [Google Scholar] [CrossRef]
- Kaliannan, D.; Palaninaicker, S.; Palanivel, V.; Mahadeo, M.A.; Ravindra, B.N.; Jae-Jin, S. A novel approach to preparation of nano-adsorbent from agricultural wastes (Saccharum officinarum leaves) and its environmental application. Environ. Sci. Pollut. Res. 2019, 26, 5305–5314. [Google Scholar] [CrossRef]
- Ahodashti, M.S.; Mizwari, Z.M.; Hashemi, Z.; Rajabalipour, S.; Ghoreishi, S.M.; Derazkola, S.M.; Ebrahimzadeh, M.A. Discovery of high antibacterial and catalytic activities of biosynthesized silver nanoparticles using C. fruticosus (CF-AgNPs) against multi-drug resistant clinical strains and hazardous pollutants. Environ. Technol. Innov. 2021, 23, 101607. [Google Scholar] [CrossRef]
- Manojkumar, U.; Kaliannan, D.; Srinivasan, V.; Balasubramanian, B.; Kamyab, H.; Mussa, Z.H.; Palaniyappan, J.; Mesbah, M.; Chelliapan, S.; Palaninaicker, S. Green synthesis of zinc oxide nanoparticles using Brassica oleracea var. botrytis leaf extract: Photocatalytic, antimicrobial and larvicidal activity. Chemosphere 2023, 323, 138263. [Google Scholar] [CrossRef]
- Abel, S.; Tesfaye, J.L.; Shanmugam, R.; Dwarampudi, L.P.; Lamessa, G.; Nagaprasad, N.; Benti, M.; Krishnaraj, R. Green synthesis and characterizations of zinc oxide (ZnO) nanoparticles using aqueous leaf extracts of coffee (Coffea arabica) and its application in environmental toxicity reduction. J. Nanomater. 2021, 3413350. [Google Scholar] [CrossRef]
- Zafar, M.N.; Dar, Q.; Nawaz, F.; Zafar, M.N.; Iqbal, M.; Nazar, M.F. Effective adsorptive removal of azo dyes over spherical ZnO nanoparticles. J. Mater. Res. Technol. 2019, 8, 713–725. [Google Scholar] [CrossRef]
- Liang, D.; Tian, X.; Zhang, Y.; Zhu, G.; Gao, Q.; Liu, J.; Yu, X. A weed-derived hierarchical porous carbon with a large specific surface area for efficient dye and antibiotic removal. Int. J. Mol. Sci. 2022, 23, 6146. [Google Scholar] [CrossRef] [PubMed]
- Necer, I.L.; Oukebdane, K.; Didi, M.A. Central composite design optimization study of the sorption of Bemacid blue Anthraquinone dye by Fe3O4-bentonite from a cupric medium. Int. J. Environ. Anal. 2022; in press. [Google Scholar] [CrossRef]
- Vairavel, P.; Murty, V.R. Optimization of batch process parameters for Congo red color removal by Neurospora crassa live fungal biomass with wheat bran dual adsorbent using response surface methodology. Desalination Water Treat. 2018, 103, 84–101. [Google Scholar] [CrossRef]
- Kaur, P.; Kumari, S.; Sharma, P. Response surface methodology adhering central composite design for the optimization of Zn (II) adsorption using rice husk nanoadsorbent. Chem. Phys. Lett. 2022, 801, 139684. [Google Scholar] [CrossRef]
- Taheri, S.; Sedghi-Asl, M.; Ghaedi, M.; Mohammadi-Asl, Z.; Rahmanian, M. Magnetic layered double hydroxide composite as new adsorbent for efficient Cu (II) and Ni (II) ions removal from aqueous samples: Adsorption mechanism investigation and parameters optimization. J. Environ. Manage. 2023, 329, 117009. [Google Scholar] [CrossRef]
- Oraon, A.; Ram, M.; Gupta, A.K.; Dutta, S.; Saxena, V.K.; Gaurav, G.K. An efficient waste garlic skins biochar nanocomposite: An advanced cleaner approach for secondary waste utilization. J. Mol. Liq. 2022, 364, 119997. [Google Scholar] [CrossRef]
- Yu, L.; Bi, J.; Song, Y.; Wang, M. Isotherm, thermodynamics, and kinetics of Methyl orange adsorption onto magnetic resin of chitosan microspheres. Int. J. Mol. Sci. 2022, 23, 13839. [Google Scholar] [CrossRef]
- Brahma, D.; Saikia, H. Synthesis of ZrO2/MgAl-LDH composites and evaluation of its isotherm, kinetics and thermodynamic properties in the adsorption of Congo red dye. Chem. Thermodyn. Therm. Anal. 2022, 7, 100067. [Google Scholar] [CrossRef]
- Meghana, C.; Juhi, B.; Rampal, N.; Vairavel, P. Isotherm, kinetics, process optimization and thermodynamics studies for removal of Congo red dye from aqueous solutions using Nelumbo nucifera (lotus) leaf adsorbent. Desalination Water Treat. 2020, 207, 373–397. [Google Scholar] [CrossRef]
- Loutfi, M.; Mariouch, R.; Mariouch, I.; Belfaquir, M.; ElYoubi, M.S. Adsorption of Methylene blue dye from aqueous solutions onto natural clay: Equilibrium and kinetic studies. Mater. Today Proc. 2023, 72, 3638–3643. [Google Scholar] [CrossRef]
- Gemici, B.T.; Ozel, H.U.; Ozel, H.B. Removal of Methylene blue onto forest wastes: Adsorption isotherms, kinetics and thermodynamic analysis. Environ. Technol. Innov. 2021, 22, 101501. [Google Scholar] [CrossRef]
- Akin, K.; Ugraskan, V.; Isik, B.; Cakar, F. Adsorptive removal of Crystal violet from wastewater using sodium alginate-gelatin-montmorillonite ternary composite microbeads. Int. J. Biol. Macromol. 2022, 223, 543–554. [Google Scholar] [CrossRef] [PubMed]
- Danish, M.; Ansari, K.B.; Danish, M.; Khatoon, A.; Khan Rao, R.A.; Zaidi, S.; Aftab, R.A. A comprehensive investigation of external mass transfer and intraparticle diffusion for batch and continuous adsorption of heavy metals using pore volume and surface diffusion model. Sep. Purif. Technol. 2022, 292, 120996. [Google Scholar] [CrossRef]
- Benjelloun, M.; Miyah, Y.; Evrendilek, G.A.; Zerrouq, F.; Lairini, S. Recent advances in adsorption kinetic models: Their application to dye types. Arab. J. Chem. 2021, 14, 103031. [Google Scholar] [CrossRef]
- Mosoarca, G.; Popa, S.; Vancea, C.; Dan, M.; Boran, S. Removal of Methylene blue from aqueous solutions using a new natural lignocellulosic adsorbent–Raspberry (Rubus idaeus) leaves powder. Polymers 2022, 14, 1966. [Google Scholar] [CrossRef]
- Piras, A.; Olla, C.; Reekmans, G.; Kelchtermans, A.; Sloovere, D.; Elen, K.; Carbonaro, C.M.; Fusaro, L.; Adriaensens, P.; Hardy, A.; et al. Photocatalytic performance of undoped and Al-doped ZnO nmanoparticles in the degradation of Rhodamine B under UV-visible light: The role of defects and morphology. Int. J. Mol. Sci. 2022, 23, 15459. [Google Scholar] [CrossRef]
- Ahamad, Z.; Nasar, A. Utilization of Azadirachta indica Sawdust as a Potential Adsorbent for the Removal of Crystal Violet Dye. Sustain. Chem. 2023, 4, 110–126. [Google Scholar] [CrossRef]
- Ardekani, P.S.; Karimi, H.; Ghaedi, M.; Asfaram, A.; Purkait, M.K. Ultrasonic assisted removal of Methylene blue on ultrasonically synthesized zinc hydroxide nanoparticles on activated carbon prepared from wood of cherry tree: Experimental design methodology and artificial neural network. J. Mol. Liq. 2017, 229, 114–124. [Google Scholar] [CrossRef]
- Raja, A.; Ashokkumar, S.; Pavithra, R.; Jayachandiran, J.; Prasad, C.; Kaviyarasu, K.; Ganapathi Raman, R.; Swaminathan, M. Eco-friendly preparation of Zinc oxide nanoparticles using Tabernaemontana divaricate and its photocatalytic and antimicrobial activity. J. Photochem. Photobiol. B Biol. 2018, 181, 53–58. [Google Scholar] [CrossRef]
- Awadh, A.A.; Shet, A.R.; Patil, L.R.; Shaikh, I.A.; Alshahrani, M.M.; Nadaf, R.; Mahnashi, M.H.; Desai, S.V.; Muddapur, U.M.; Achappa, S.; et al. Sustainable synthesis and characterization of zinc oxide nanoparticles using Raphanus sativus extract and its biomedical applications. Crystals 2022, 12, 1142. [Google Scholar] [CrossRef]
- Ivanov, K.I.; Kolentsova, E.N.; Nguyen, N.C.; Peltekov, A.B.; Angelova, V.R. Synthesis and stability of zinc hydroxide nitrate nanoparticles. Bulg. Chem. Commun. 2017, 49, 225–230. Available online: http://www.bcc.bas.bg/bcc_volumes/Volume_49_Special_G_2017/BCC-49-G-Ivanov-225-230.pdf (accessed on 3 January 2017).
- Sharwani, A.A.; Narayanan, K.B.; Khan, M.E.; Han, S.S. Photocatalytic degradation activity of goji berry extract synthesized silver-loaded mesoporous zinc oxide (Ag@ZnO) nanocomposites under simulated solar light irradiation. Sci. Rep. 2022, 12, 10017. [Google Scholar] [CrossRef]
- Ramya, V.; Kalaiselvi, V.; Karthik Kannan, S.; Shkir, M.; Ghramh, H.A.; Ahmad, Z.; Nithiya, P.; Vidhya, N. Facile synthesis and characterization of zinc oxide nanoparticles using Psidium guajava leaf extract and their antibacterial applications. Arab. J. Sci. Eng. 2022, 47, 909–918. [Google Scholar] [CrossRef]
- Yusof, H.M.; Rahman, N.A.; Mohamad, R.; Zaidan, U.H.; Samsudin, A.A. Optimization of biosynthesis zinc oxide nanoparticles: Desirability-function based response surface methodology, physicochemical characteristics, and its antioxidant properties. OpenNano 2022, 8, 100106. [Google Scholar] [CrossRef]
- Subashini, K.; Prakash, S.; Sujatha, V. Biological applications of green synthesized zinc oxide and nickel oxide nanoparticles mediated poly(glutaric acid-co-ethylene glycol-co-acrylic acid) polymer nanocomposites. Inorg. Chem. Commun. 2022, 139, 109314. [Google Scholar] [CrossRef]
- Aldeen, T.S.; Mohamed, H.E.; Maaza, M. ZnO nanoparticles prepared via a green synthesis approach: Physical properties, photocatalytic and antibacterial activity. J. Phys. Chem. Solids 2022, 160, 110313. [Google Scholar] [CrossRef]
- Benettayeb, A.; Morsli, A.; Elwakeel, K.Z.; Hamza, M.F.; Guibal, E. Recovery of Heavy Metal Ions Using Magnetic Glycine-Modified Chitosan-Application to Aqueous Solutions and Tailing Leachate. Appl. Sci. 2021, 11, 8377. [Google Scholar] [CrossRef]
- Khani, R.; Roostaei, B.; Bagherzade, G.; Moudi, M. Green synthesis of copper nanoparticles by fruit extract of Ziziphus spina-christi (L.) Willd.: Application for adsorption of triphenylmethane dye and antibacterial assay. J. Mol. Liq. 2018, 255, 541–549. [Google Scholar] [CrossRef]
- Bilal, M.; Ihsanullah, I.; Shah, M.H.; Reddy, V.B.; Aminabhavi, T.M. Recent advances in the removal of dyes from wastewater using low-cost adsorbents. J. Environ. Manag. 2022, 321, 115981. [Google Scholar] [CrossRef] [PubMed]
- Chemingui, H.; Rezma, S.; Lafi, R.; Alhalili, Z.; Missaoui, T.; Harbi, I.; Smiri, M.; Hafiane, A. Investigation of Methylene blue adsorption from aqueous solution onto ZnO nanoparticles: Equilibrium and Box-Behnken optimisation design. Int. J. Environ. Anal. Chem. 2021; in press. [Google Scholar] [CrossRef]
- Tehrani, M.S.; Zare-Dorabei, R. Highly efficient simultaneous ultrasonic-assisted adsorption of Methylene blue and Rhodamine B onto metal organic framework MIL-68(Al): Central composite design optimization. RSC Adv. 2016, 6, 27416. [Google Scholar] [CrossRef]
- Kerzabi, Y.; Benomara, A.; Merghache, S. Removal of Methyl violet 2B dye from aqueous solution by adsorption onto raw and modified carobs (Ceratonia siliqua L.). Glob. Nest J. 2022, 24, 706–719. [Google Scholar] [CrossRef]
- Messaoudi, N.E.; Khomri, M.E.; Fernine, Y.; Bouich, A.; Lacherai, A.; Jada, A.; Sher, F.; Lima, E.C. Hydrothermally engineered Eriobotrya japonica leaves/MgO nanocomposites with potential applications in wastewater treatment. Groundw. Sustain. Dev. 2022, 16, 100728. [Google Scholar] [CrossRef]
- Montgomery, D.C.; Runger, G.C. Applied Statistics and Probability for Engineers, 7th ed.; John Wiley & Sons Ltd.: New York, NY, USA, 2020. [Google Scholar]
- Delpiano, G.R.; Tocco, D.; Medda, L.; Magner, E.; Salis, A. Adsorption of Malachite green and Alizarin red S dyes using Fe-BTC metal organic framework as adsorbent. Int. J. Mol. Sci. 2021, 22, 788. [Google Scholar] [CrossRef] [PubMed]
- Chandra, C.; Khan, F. Nano-scale zerovalent copper: Green synthesis, characterization and efficient removal of uranium. J. Radioanal. Nucl. Chem. 2020, 324, 589–597. [Google Scholar] [CrossRef]
- Namasivayam, C.; Yamuna, R.T.; Arasi, D.J.S.E. Removal of Acid violet from wastewater by adsorption on waste red mud. Environ. Geol. 2001, 41, 269–273. [Google Scholar] [CrossRef]
- Anjaneya, O.; Santoshkumar, M.; Anand, S.N.; Karegoudar, T.B. Biosorption of Acid violet dye from aqueous solutions using native biomass of a new isolate of Penicillium sp. Int. Biodeterior. Biodegrad. 2009, 63, 782–787. [Google Scholar] [CrossRef]
- Ata, S.; Din, M.I.; Rasool, A.; Qasim, I.; Mohsin, I.U. Equilibrium, thermodynamics, and kinetic sorption studies for the removal of Coomassie brilliant Blue on wheat bran as a low-cost adsorbent. J. Anal. Methods Chem. 2012, 2012, 405980. [Google Scholar] [CrossRef] [PubMed]
- Kannan, N.; Murugavel, S. Comparative study on the removal of Acid violet by adsorption on various low-cost adsorbents. Glob. Nest J. 2008, 10, 395–403. [Google Scholar] [CrossRef]
- Kadeche, A.; Ramdani, A.; Adjdir, M.; Guendouzi, A.; Taleb, S.; Kaid, M.; Deratani, A. Preparation, characterization and application of Fe-pillared bentonite to the removal of Coomassie blue dye from aqueous solutions. Res. Chem. Intermed. 2020, 46, 4985–5008. [Google Scholar] [CrossRef]
- Abbas, M.; Cherfi, A.; Kaddour, S.; Aksil, T. Adsorption in simple batch experiments of Coomassie blue G-250 by apricot stone activated carbon-Kinetics and isotherms modelling. Desalination Water Treat. 2016, 57, 15037–15048. [Google Scholar] [CrossRef]
- De Sales, P.F.; Magriotis, Z.M.; Rossi, M.; Resende, R.F.; Nunes, C.A. Optimization by Response Surface Methodology of the adsorption of Coomassie blue dye on natural and acid-treated clays. J. Environ. Manag. 2013, 130, 417–428. [Google Scholar] [CrossRef] [PubMed]
- Namasivayam, C.; Kanchana, N. Waste banana pith as adsorbent for color removal from wastewaters. Chemosphere 1992, 25, 1691–1705. [Google Scholar] [CrossRef]
- Rajeshwari, S.; Namasivayam, C.; Kadirvelu, K. Orange peel as an adsorbent in the removal of Acid violet 17 (acid dye) from aqueous solutions. Waste Manag. 2001, 21, 105–110. [Google Scholar] [CrossRef]
- Senturk, I.; Alzein, M. Adsorption of Acid Violet 17 onto Acid-activated pistachio shell: Isotherm, kinetic and thermodynamic studies. Acta Chim. Slov. 2020, 67, 55–69. [Google Scholar] [CrossRef]
- Sharma, G.; Naushad, M.; Kumar, A.; Rana, S.; Sharma, S.; Bhatnagar, A.; Stadler, F.J.; Ghfar, A.A.; Khan, M.R. Efficient removal of Coomassie brilliant blue R-250 dye using starch/poly(alginic acid-cl-acrylamide) nanohydrogel. Process Saf. Environ. Prot. 2017, 109, 301–310. [Google Scholar] [CrossRef]
- Sumanjit; Walia, T.P.S.; Kaur, R. Removal of health hazards causing acidic dyes from aqueous solutions by the process of adsorption. Online J. Health Allied Scs. 2007, 6, 1–10. Available online: https://web-archive.southampton.ac.uk/cogprints.org/5929/1/2007-3-3.pdf (accessed on 24 January 2008).
- Mallampati, R.; Tan, K.S.; Valiyaveettil, S. Utilization of corn fibers and luffa peels for extraction of pollutants from water. Int. Biodeterior. Biodegrad. 2015, 103, 8–15. [Google Scholar] [CrossRef]
- Chakhtouna, H.; Benzeid, H.; Zari, N.; Qaiss, A.; Bouhfid, R. Microwave-assisted synthesis of MIL–53(Fe)/biochar composite from date palm for Ciprofloxacin and Ofloxacin antibiotics removal. Sep. Purif. Technol. 2023, 308, 122850. [Google Scholar] [CrossRef]
- Omer, A.S.; El-Naeem, G.A.; Abd-Elhamid, A.I.; Farahat, O.M.; El-Bardan, A.A.; Soliman, H.M.A.; Nayl, A.A. Adsorption of Crystal violet and Methylene blue dyes using a cellulose-based adsorbent from sugercane bagasse: Characterization, kinetic and isotherm studies. J. Mater. Res. Technol. 2002, 19, 3241–3254. [Google Scholar] [CrossRef]
- Mahmood, U.B.; Eisa, M.Y.; Hammed, A.K. Adsorption of the Eosin yellow dye by nickel oxide nanoparticles catalyzes via oxalate co-precipitation method: Isotherm, kinetic and thermodynamic studies. Phys. Scr. 2021, 96, 124056. [Google Scholar] [CrossRef]
- Mehta, J.; Dhaka, R.K.; Dilbaghi, N.; Lim, D.K.; Hassan, A.A.; Kim, K.; Kumar, S. Recent advancements in adsorptive removal of organophosphate pesticides from aqueous phase using nanomaterials. J. Nanostruct. Chem. 2022; in press. [Google Scholar] [CrossRef]
- Rathee, G.; Awasthi, A.; Sood, D.; Tomar, R.; Tomar, V.; Chandra, R. A new biocompatible ternary layered double hydroxide adsorbent for ultrafast removal of anionic organic dyes. Sci. Rep. 2019, 9, 16225. [Google Scholar] [CrossRef] [PubMed]
- Aniagorb, C.O.; Menkitia, M.C. Kinetics and mechanistic description of adsorptive uptake of Crystal violet dye by lignified elephant grass complexed isolate. J. Environ. Chem. Eng. 2018, 6, 2105–2118. [Google Scholar] [CrossRef]
- Munagapati, V.S.; Wen, H.Y.; Gollakota, A.; Wen, J.C.; Lin, K.Y.; Shu, C.M.; Reddy, G.M.; Zyryanov, G.V.; Wen, J.H.; Tian, Z. Removal of sulfonated azo Reactive red 195 textile dye from liquid phase using surface-modified lychee (Litchi chinensis) peels with quaternary ammonium groups: Adsorption performance, regeneration, and mechanism. J. Mol. Liq. 2022, 368, 120657. [Google Scholar] [CrossRef]


Disclaimer/Publisher’s Note: The statements, opinions and data contained in all publications are solely those of the individual author(s) and contributor(s) and not of MDPI and/or the editor(s). MDPI and/or the editor(s) disclaim responsibility for any injury to people or property resulting from any ideas, methods, instructions or products referred to in the content. |
© 2023 by the authors. Licensee MDPI, Basel, Switzerland. This article is an open access article distributed under the terms and conditions of the Creative Commons Attribution (CC BY) license (https://creativecommons.org/licenses/by/4.0/).