Article

Two-Step Conversion of CO2 to Light Olefins: Laboratory-Scale Demonstration and Scale-Up Considerations

1
VTT Technical Research Centre of Finland Ltd., P.O. Box 1000, FI-02044 Espoo, Finland
2
School of Chemical Engineering, Aalto University, AALTO, P.O. Box 16100, FI-00076 Espoo, Finland
*
Author to whom correspondence should be addressed.
ChemEngineering 2022, 6(6), 96; https://doi.org/10.3390/chemengineering6060096
Submission received: 7 October 2022 / Revised: 15 November 2022 / Accepted: 30 November 2022 / Published: 6 December 2022

Abstract

:
The highly selective production of light olefins from CO2 was demonstrated for the first time with a laboratory-scale process comprising consecutive reverse water gas shift (RWGS) and Fischer–Tropsch (FT) reactors. The RWGS reaction, catalyzed by rhodium washcoated catalyst at 850 °C yielded good quality syngas with conversion values close to the thermodynamic equilibrium and without experiencing catalyst deactivation from carbon formation or sintering. For the FT synthesis, a packed bed Fe-Na-S/α-Al2O3 catalyst was used. The highest light olefin selectivity observed for the FT-synthesis was 52% at 310 °C, GHSV of 2250 h−1 and H2/CO ratio of 1. However, the optimal conditions for the light olefin production were determined to be at 340 °C, a GHSV of 3400 h−1 and a H2/CO ratio of 2, as the CO conversion was markedly higher, while the light olefin selectivity remained at a suitably high level. In addition to the experimental results, considerations for the further optimization and development of the system are presented. The combined RWGS–FT process seems to work reasonably well, and initial data for basic process design and modeling were produced.

1. Introduction

Light olefins, such as ethylene, propylene, and butylene, are important chemical building blocks for the chemical industry, as they are used in the production of many common chemical products, such as plastics (polyethylene and polypropylene) and epoxides. Traditionally, light olefins have been produced at a large scale from fossil-based hydrocarbon sources by steam cracking and this remains as the primary production technique at present, despite being one of the most energy-intensive processes of the chemical industry [1,2]. The reasons for its success and continued use are the high technological maturity and availability of the low-cost raw materials. However, in recent years, research efforts towards alternative routes of light olefin production have increased tremendously [3,4]. These alternatives include, for example, the dehydrogenation of alkanes, oxidative coupling of methane, Fischer–Tropsch synthesis (FTS) and methanol to olefins (MTO). The interesting aspect of these alternatives is their lower energy intensity and their capability (excluding the dehydrogenation of alkanes) of utilizing CO2 as a feed material, thus offering the potential of mitigating CO2 emissions [5]. The key step in the utilization of CO2 in these chemical reaction pathways is often the production of syngas, a mixture of hydrogen and carbon monoxide, which is used as the raw material to carry out these syntheses. With a dissociation energy of 750 kJ/mol, CO2 is a very stable molecule, so it is often beneficial to first convert it to a more reactive CO, instead of directly using it for synthesis. Nevertheless, CO2 can also be used directly as a feed material for methanol synthesis and methanation [6,7,8]. One widely studied method of producing syngas from CO2 is the reverse water gas shift (RWGS) reaction (Equation (1)) [9], which converts carbon dioxide and hydrogen into carbon monoxide and water, where water is usually separated from the product, leaving a mixture of CO, CO2 and H2. The thermodynamic equilibrium molar fractions of the RWGS reaction at different temperatures are presented in Figure 1. While the RWGS reaction is equimolar in terms of CO2 and H2, excess hydrogen is often used to boost CO2 conversion. Usually, the H2/CO2 ratio is between one and four [10]. Despite being able to convert CO2 with good conversion and high selectivity towards CO, the RWGS has two main disadvantages: the use of expensive rare metal catalysts, such as platinum, palladium or rhodium, and the use of a high temperature, often over 800 °C [11]. High temperatures are needed for the RWGS due to the endothermic nature of the reaction (∆H0 = 42.1 kJ/mol), which favors high temperatures, and due to carbon formation at lower temperatures (<600 °C). Efforts have been made to alleviate these disadvantages; for example, copper catalysts have been widely studied as a replacement for the rare metal catalysts [12,13,14,15]. However, these catalysts suffer from low conversions because they cannot handle temperatures of over a few hundred degrees Celsius. Perhaps the closest competitor to the noble metals used in RWGS catalysis in terms of performance is nickel, which is another cheap and well-researched alternative [16,17,18,19,20]. Nickel catalysts yield CO2 conversions that are close to the equilibrium value and are comparable to those obtained with noble metal catalysts at similar operating temperatures (around 800 °C). However, they often exhibit carbon formation, especially at lower temperatures [17,20], and have a higher CH4 selectivity than the noble metals [16,18]. To carry out the RWGS reaction at lower temperature, different methods to bypass the thermodynamic equilibrium limit have been proposed to enhance the conversion past the otherwise low values. Such methods include membrane reactors [21,22], zeolite sorbents [23], chemical looping [24,25,26] and plasma catalysis [27,28,29]. However, these methods lack conversion and efficiency compared to the conventional high-temperature reactors and, thus, are not currently suitable for commercial applications.
From syngas, light olefins can be produced through Fischer–Tropsch synthesis. The Fischer–Tropsch synthesis yields hydrocarbons ranging from methane to compounds with over 70 carbon atoms (heavy waxes). The FTS can be used to produce alkanes (Equation (2)) and alkenes (Equation (3)). The Fischer–Tropsch product distribution is determined by the process conditions, specifically by the temperature, pressure, syngas composition, catalyst and residence time [30,31,32]. The primary use of Fischer–Tropsch synthesis is the production of liquid fuels from gases (Gas-to-Liquid) [33,34], coal (Coal-to-Liquid) [30,35] and biomass (Biomass-to-Liquid) [36,37], with processes optimized to produce hydrocarbons in the range of C6–C20. These processes often utilize a low-temperature Fischer–Tropsch (LTFT) synthesis with a reaction temperature around 210–230 °C and a cobalt catalyst [38].
CO 2 + H 2 CO + H 2 O H 0 = 42   kJ / mol
2 n + 1   H 2 + n   CO   C n H 2 n + 2 + n   H 2 O H 0 = 152   kJ / mol
2 n   H 2 + n   CO   C n H 2 n + n   H 2 O H 0 = 156   kJ / mol
The possibility of using Fischer–Tropsch to produce light olefins has been actively studied in the past but has also attracted some attention in recent years [32,39,40,41,42,43,44,45,46,47,48,49]. To produce these lighter products, higher temperatures in the range of 300–350 °C, lower pressures and iron catalysts are often used. These general process conditions capable of producing lighter products (the so-called high-temperature Fischer–Tropsch, or HTFT) have been known for a long time and not many changes have been suggested in recent decades. Instead, catalysts have been in the focal point of Fischer–Tropsch research, especially different promoter effects. The purpose of these studies has been to decrease the methane selectivity and increase the light olefin selectivity of the iron FT catalyst. It was found that the combination of sodium and sulfur can promote the catalyst’s activity towards light olefin production and simultaneously reducing the methane selectivity [39,50]. The iron catalysts are also useful for FTS due their water gas shift (WGS) activity, which helps to balance the H2/CO ratio in the FT reactor [51].
The aim of this work is to study how light olefins can be produced from CO2 and hydrogen using an integrated process consisting of a RWGS and FT reactors as well as to produce initial data for basic process design and modeling.

2. Materials and Methods

2.1. Catalyst Preparation

All the catalysts used in the experiments were prepared at VTT. The RWGS reaction was catalyzed with Rh/α-Al2O3, which was washcoated on the inside wall of the reactor. An Rh catalyst was chosen as it is highly active for RWGS and less prone to coking, compared to the Ni catalyst. The FT reaction was catalyzed using 5 wt-% Fe-Na-S/α-Al2O3 due to its low methane selectivity and high light olefin selectivity [50]. The Rh/α-Al2O3 catalyst was prepared using the incipient wetness impregnation. This catalyst powder was mixed with alumina sol and water to prepare a slurry for the washcoating of the reactor tube. The total weight of the washcoated Rh catalyst was 0.35 g. The iron FT catalyst was prepared from ammonium iron (III) citrate precursor (J.T. Baker), which had trace amounts of Na and S as impurities, similarly to Torres Galvis et al. [50]. The particle size of the α-Al2O3 support was 0.25–0.35 mm. The iron precursor was dissolved in water and the catalyst was prepared by the incipient wetness impregnation method. The amount of catalyst used in the experiments was 9.4 g. Prior to starting the experiments, the FT catalyst was activated in a carbon monoxide flow of 1 NL/min at 270 °C for approximately 20 h to carburize the iron particles to iron carbide, the active phase of iron FT catalysts [52]. The RWGS catalyst did not require any additional activation.

2.2. Experimental Setup

The experiments were carried out on two consecutive laboratory-scale reactors: the RWGS reactor, which comprised a straight, 255 mm long Inconel pipe with 4 mm inside diameter, and the FT reactor, which comprised a coiled stainless-steel pipe with 6 mm inside diameter. The FT reactor pipe was coiled to make it more compact, making it easier to fit a heating element around it. The length of the packed bed inside the FT reactor was 710 mm. The RWGS reactor was placed inside a furnace and operated at 850 °C in all the experiments. The FT reactor was heated with an insulated heating element and the temperature varied between 310 and 340 °C. In all experiments, the system was pressurized to 6 bar. The reactant gases (H2 and CO2) were fed to the RWGS reactor from gas cylinders using Bronkhorst mass flow controllers. A small amount of O2 was also fed to the RWGS reactor to decrease coking. After both reactors, a Peltier element was used to cool the fluid to condensate water and other possible liquid products, which were collected in liquid traps.
ABB online gas analyzer AO2020 with Caldos 25, Magnos 206 and Uras 26 analyzer modules were used to analyze H2, CO, CO2, CH4 and O2 contents in the product gas. The gas analyzer setup was accompanied with a SCC-C sample gas cooler to separate the condensates and a SCC-F sample gas feed unit to control the flow of samples and condensates. The product gas was directed from the ABB online gas analyzer to the Agilent 490 Micro GC. Agilent 490 Micro GC was used to analyze the composition of gaseous hydrocarbons, such as ethane, ethylene, propane, propylene, C4 paraffins and C4 olefins. C5 paraffins and olefins were also detected in some cases. Agilent 490 Micro GC comprised three columns. The first column, 10 m CP-Molsieve 5Å, was used to analyze H2, N2, O2, CO and CH4 composition. The second column, 10 m PoraPlot U, was used to analyze the CO2 content and the third column, 10 m Al2O3/KCl, was used to measure the C2–C5 hydrocarbon composition. Argon was used as a carrier gas in the first column and helium in the second and third columns. Before the experiments, the micro-GC was calibrated using Agilent RGA Gas Calibration Standard. A schematic of the experimental setup is presented in Figure 2.

2.3. Experimental Work

The reverse water gas shift reactor was first tested on its own to observe its behavior and determine the composition of the RWGS outlet gas mixture, i.e., the FT inlet gas mixture, in different process conditions. Three different inlet flow rates of 1, 1.5 and 2 NL/min were tested. The reactor outlet flow rates were calculated from mass balances and verified with Kimmon SK25 gas meter. The studied H2/CO2 ratios were 3:1, 2:1, 1.5:1 and 1:1.
The effect of three different parameters on the selectivity of light olefins were studied in the experiments: the flow rate and composition (H2/CO2 ratio) of inlet gas to the RWGS reactor and the temperature of the FT reactor. Based on the obtained RWGS results, the feed compositions chosen for the FT experiments were an inlet H2/CO2 ratio of 2, presenting the optimal case where the FT inlet H2/CO ratio is close to 2, and an inlet H2/CO2 ratio of 1 to observe the Fe catalyst’s ability to balance the H2/CO ratio with WGS activity. The flow rates studied were 1 and 1.5 NL/min. The flow rate of 2 NL/min was also tested, but it was observed that the temperature difference across the FT reactor rose to over 20 °C. This causes undesired operation conditions, as it makes it harder to determine the effect of the reactor temperature on the system, because the temperature varies so greatly across the reactor length. Finally, four different FT reactor temperatures of 310, 320, 330 and 340 °C were used. The dimensions and studied reaction conditions of the two reactors are presented in Table 1. For comparison, a single step CO2 to light olefins experiment was also carried out where CO2 and H2 were fed directly to the FT reactor. In this experiment, the H2/CO2 ratio of the feed was 2, the inlet flow rate was 1 NL/min, the reactor temperature was 340 °C and the pressure was 6 bar.
The experiments were carried out by first directing the inlet gas flow through the bypass lines to the online gas analyzer to obtain an inlet sample. Once a stable measurement was obtained, the gases were directed to the RWGS reactor, and the analyzer measurement was left to stabilize again. Once the RWGS reaction had reached a steady state, the flow was directed also through the FT reactor, after which the micro-GC measurements were also started. Once the micro-GC measurements were stabilized, the setpoint was typically run for approximately 1–2 h to ensure that the system reached steady state and enough data were gathered. After this, new setpoint values were set for the process and it was left to stabilize again. Usually, the inlet flow rate and composition were kept constant during one day of operation and only the FT reactor temperature was changed to avoid the need for new inlet measurements. Thus, in general, four different set points were studied in a day.

2.4. Calculation Methods

In some experiments where the carbon monoxide conversion was low, carbon dioxide was also consumed in the FT reactor. Thus, the carbon dioxide conversion was also considered when calculating the selectivities according to Equation (4).
S C i = i · n ˙ i , o u t ( n ˙ C O , i n n ˙ C O , o u t ) + ( n ˙ C O 2 , i n n ˙ C O 2 , o u t )
where S C i is the selectivity of CO2 or hydrocarbon (%); n ˙ i , o u t is the molar flow of component i out of the reactor (mmol/s); n ˙ C O , i n is the molar flow of carbon monoxide into the reactor (mmol/s); n ˙ C O , o u t is the molar flow of carbon monoxide out of the reactor (mmol/s); n ˙ C O 2 , i n is the molar flow of carbon dioxide into the reactor (mmol/s); and n ˙ C O 2 , o u t is the molar flow of carbon dioxide out of the reactor (mmol/s).
Volumetric flow rates were converted to gas hourly space velocities (GHSVs) for easier comparison. This was conducted using Equation (5).
G H S V = V ˙ i n V c a t
where V ˙ i n is the inlet volumetric flow rate (NTP); and V c a t is the volume of the catalyst.
The volumetric inlet flow rates of 1, 1.5 and 2 NL/min (60, 90 and 120 NL/h) correspond to GHSVs of approximately 18,750, 28,000 and 37,500 h−1 in the RWGS reactor, respectively, and approximately 2250, 3400 and 4550 h−1 in the FT reactor, respectively. The GHSV of the FT reactor varies slightly depending on the H2/CO2 ratio of the RWGS inlet gas as different amounts of water are produced at different gas compositions, which amounts to slightly different FT inlet flow rates after the removal of the RWGS product water. To better compare between different processing conditions, the light (C2–C4) olefin yields were calculated, as shown in Equation (6).
Y C 2 C 4 , O = n ˙ C 2 C 4 , O m c a t = n ˙ C O , i n   ·   X C O   ·   S C 2 C 4 , O m c a t
where Y C 2 C 4 , O is the light olefin yield (mmol/h∙gcat); n ˙ C 2 C 4 , O is the molar flow of light olefins out of the FT reactor (mmol/h); m c a t is the weight of the catalyst (g); n ˙ C O , i n is the molar flow of CO in to the FT reactor; X C O is the CO conversion; and S C 2 C 4 , O is the light olefin selectivity.

3. Results

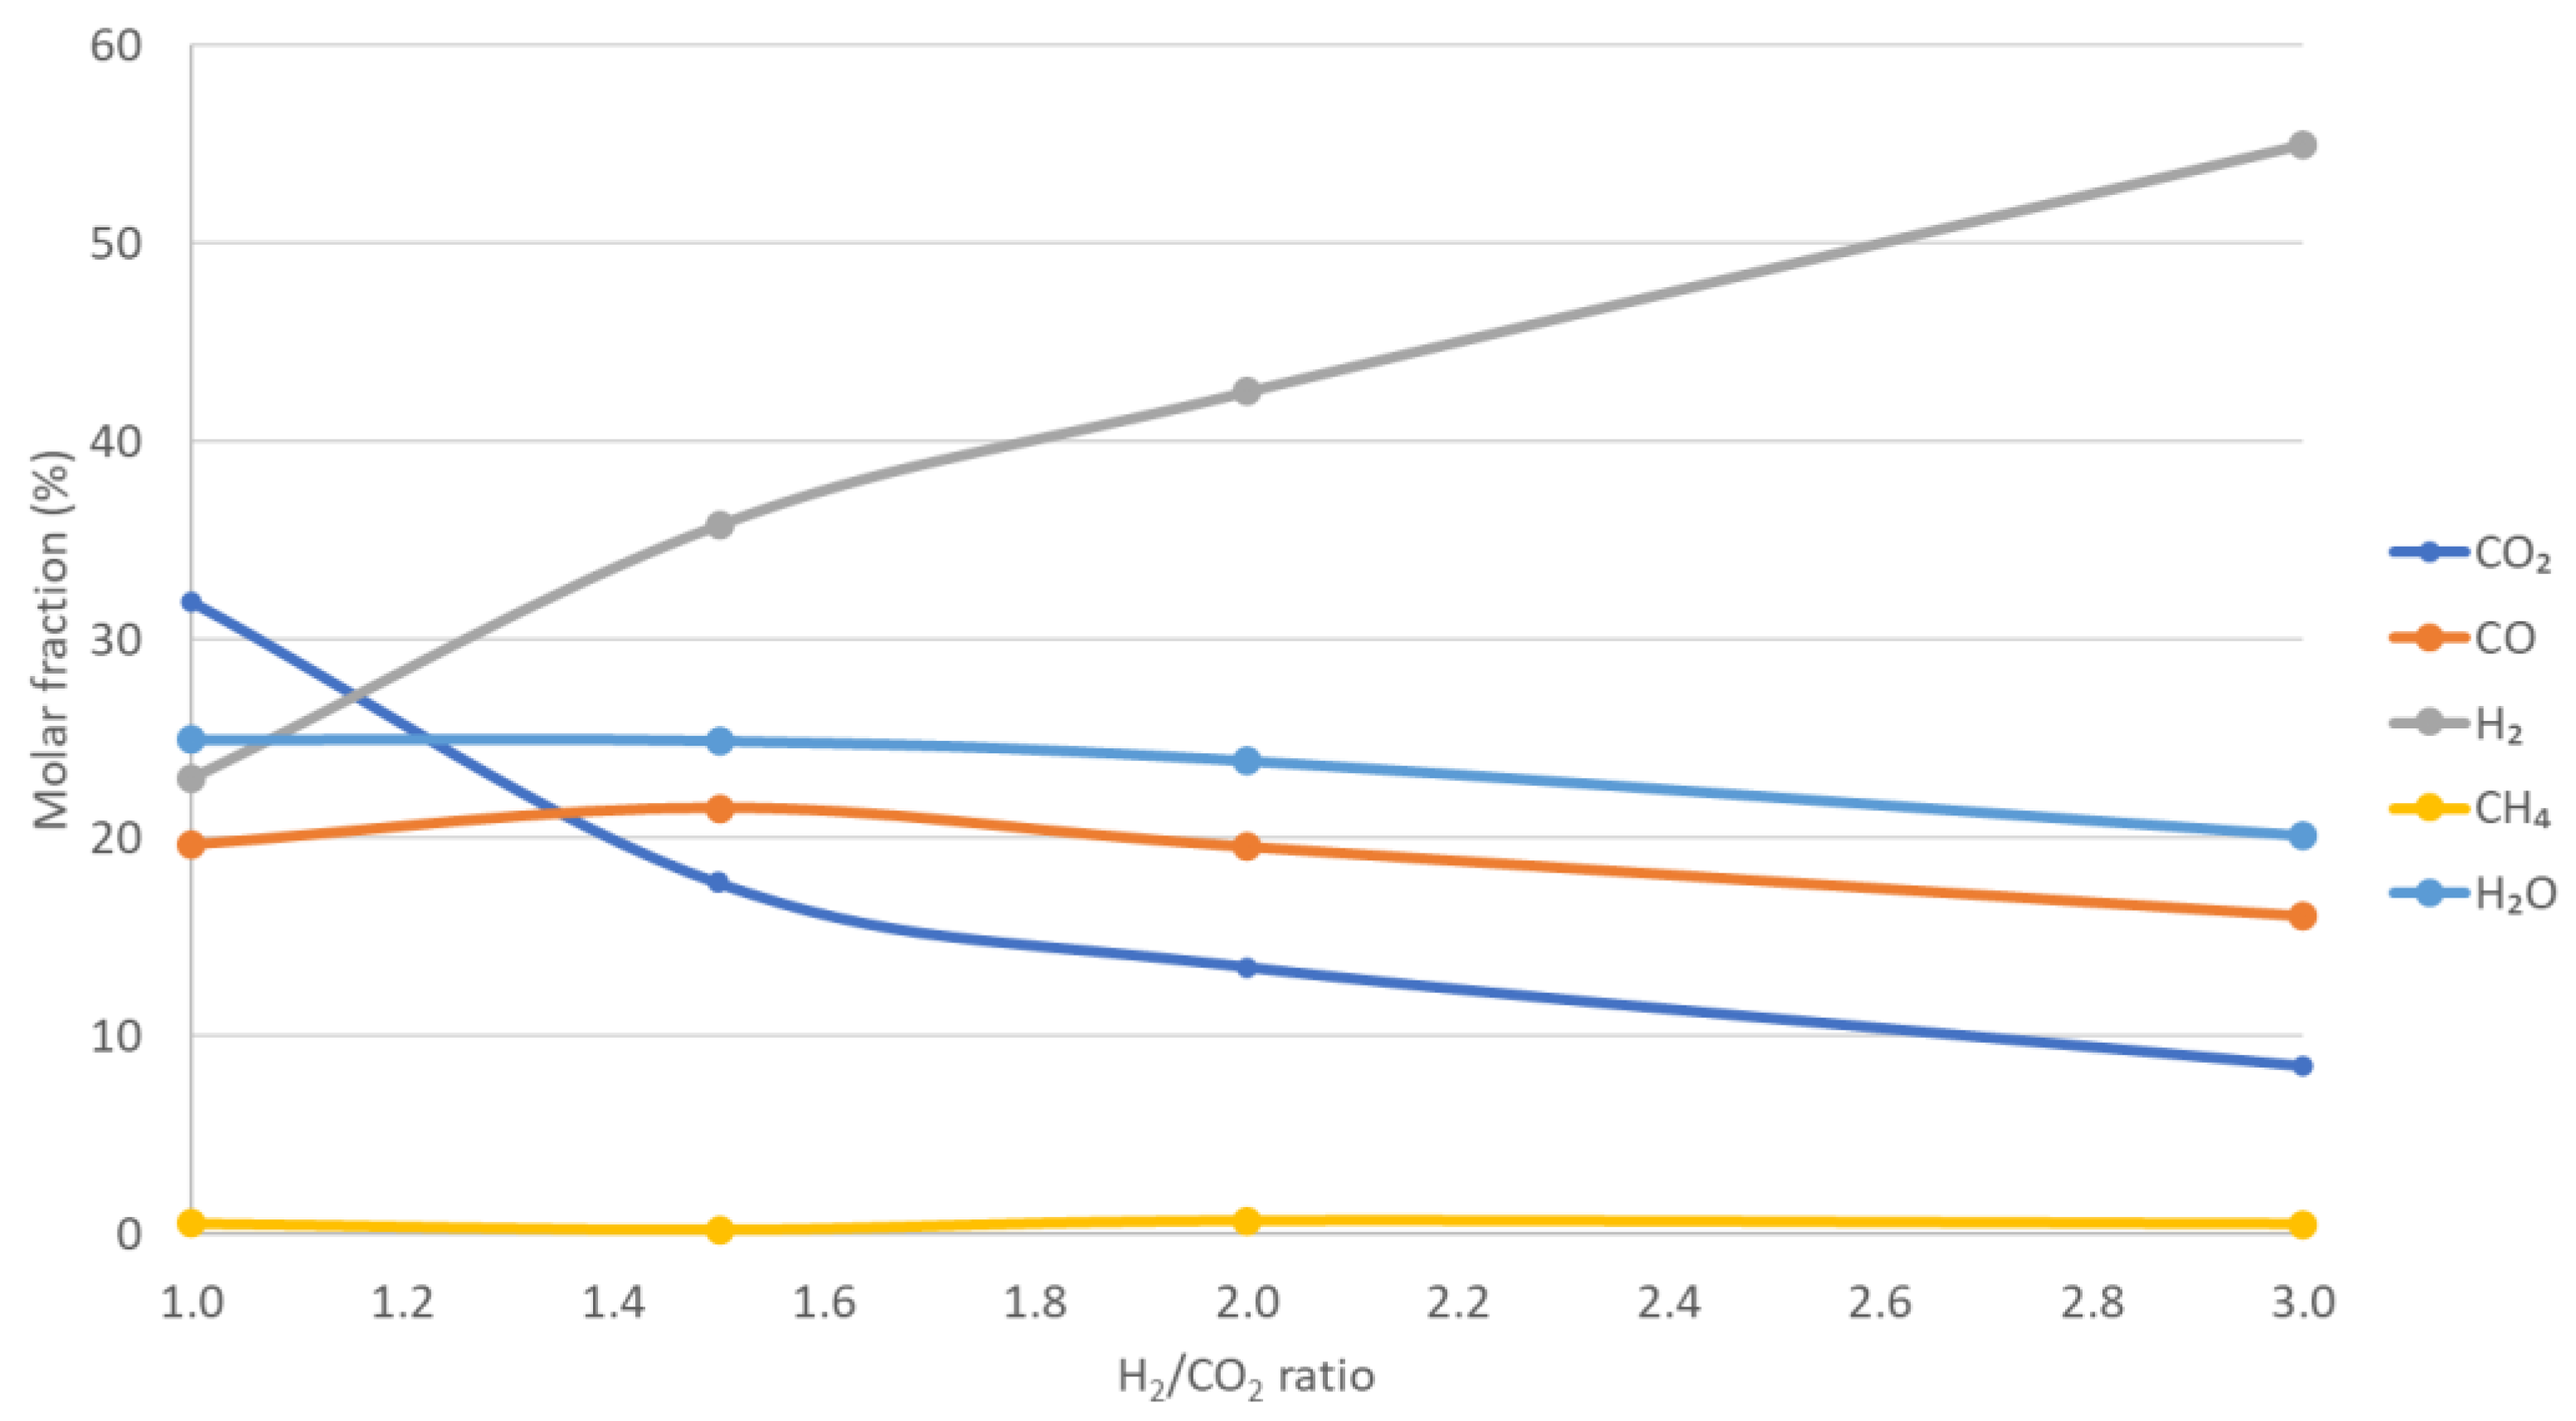
3.1. Reverse Water Gas Shift Results

In the RWGS reaction, the CO2 conversion increased with the increase in H2/CO2 feed ratio or lowering the GHSV. At lower GHSVs, the CO2 conversions were close to equilibrium and, as the GHSV was increased, the conversions shifted further away from the equilibrium. The CO2 conversion at different GHSVs is presented in Figure 3. The RWGS inlet compositions with the corresponding outlet compositions are presented in Table 2. The difference between the RWGS inlet and outlet (FT inlet) flows is caused by the removal of the RWGS water between the reactors.
The RWGS outlet gas composition was mostly dependent on the feed gas H2/CO2 ratio. This dependency is presented in Figure 4. The GHSV also has a minor effect on the outlet gas composition as it affects the CO2 conversion. Thus, with higher GHSVs, the RWGS outlet gas contains slightly more H2 and CO2 and less CO and water. With lower GHSVs, the opposite is true.
Some methane was always produced in the RWGS reactor as well. This is most likely caused by methanation, which is favored in the lower temperature regions inside the reactor, namely the top of the reactor, where the gas enters the reactor at a cooler temperature and the furnace heating is not as powerful. The lower temperature causes the methanation reaction to become more favorable, lowering the selectivity towards CO. The amount of methane produced in the RWGS reactor is dependent on the feed gas composition, GHSV, temperature and the catalyst used, with the feed gas composition being the most important factor. The methane selectivities of the RWGS reaction with the studied experimental setup are presented in Figure 5. The methane selectivity rises linearly in proportion to the H2/CO2 ratio as the methanation reaction uses the excess hydrogen available.

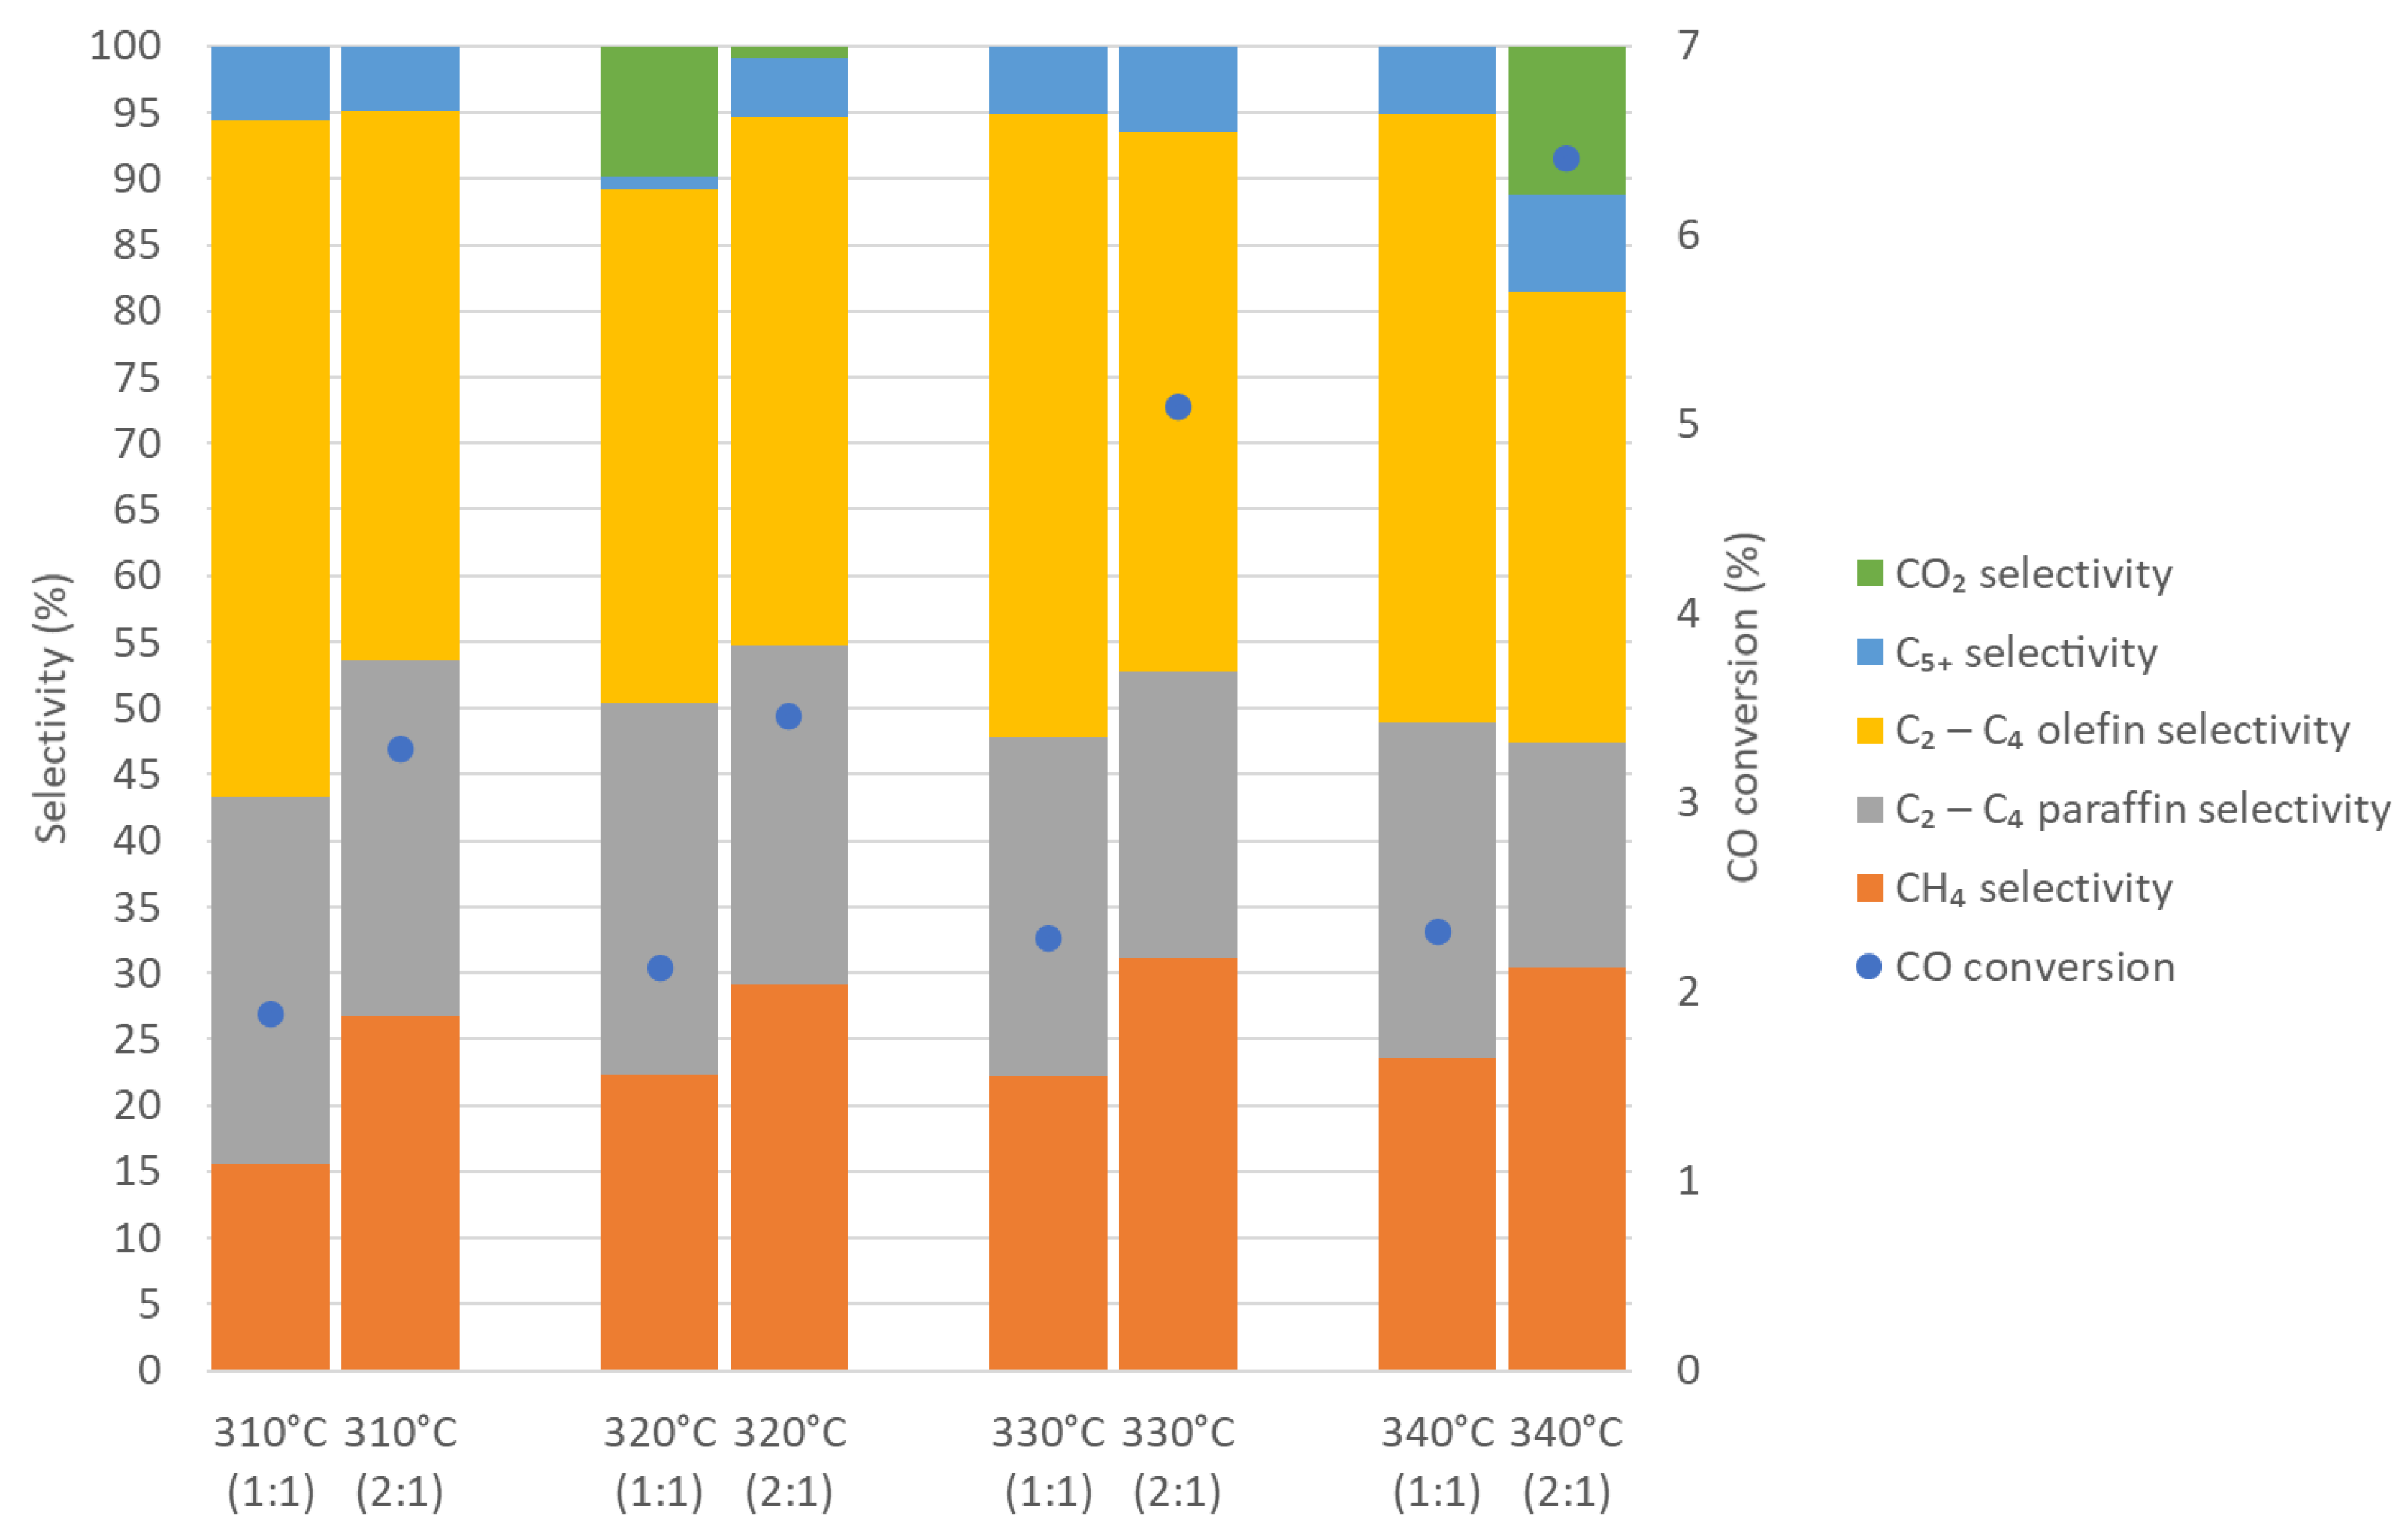
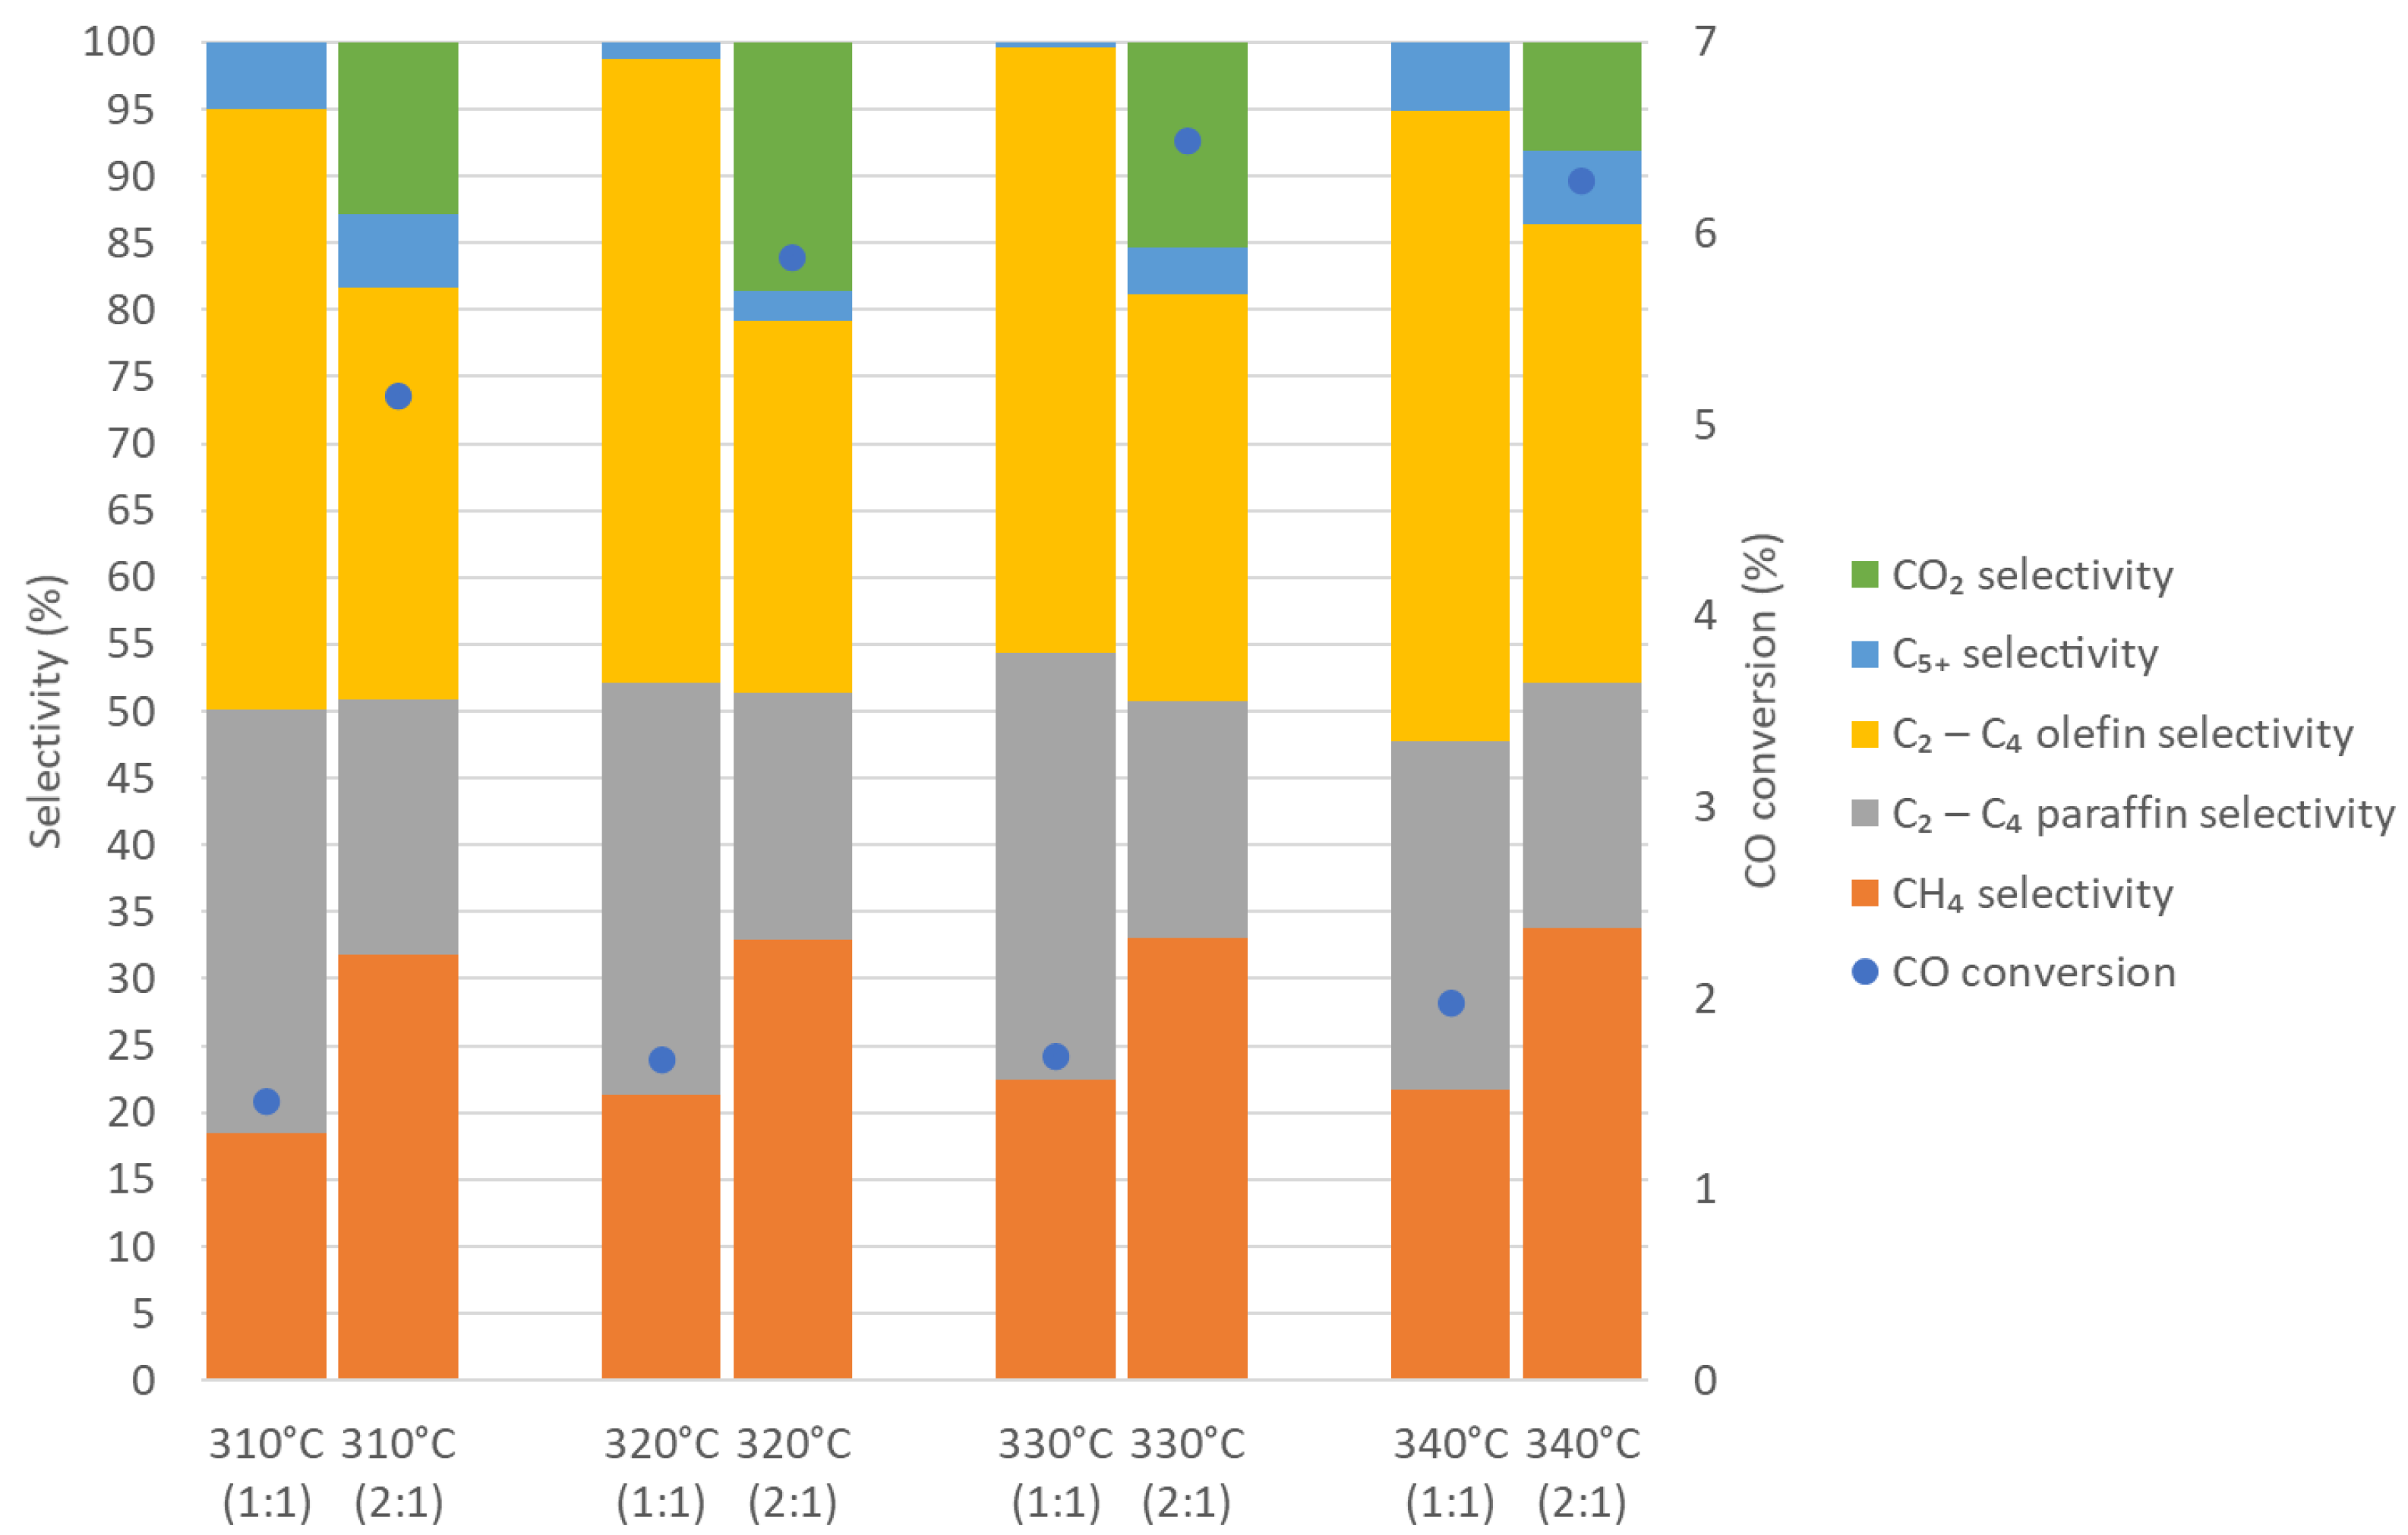
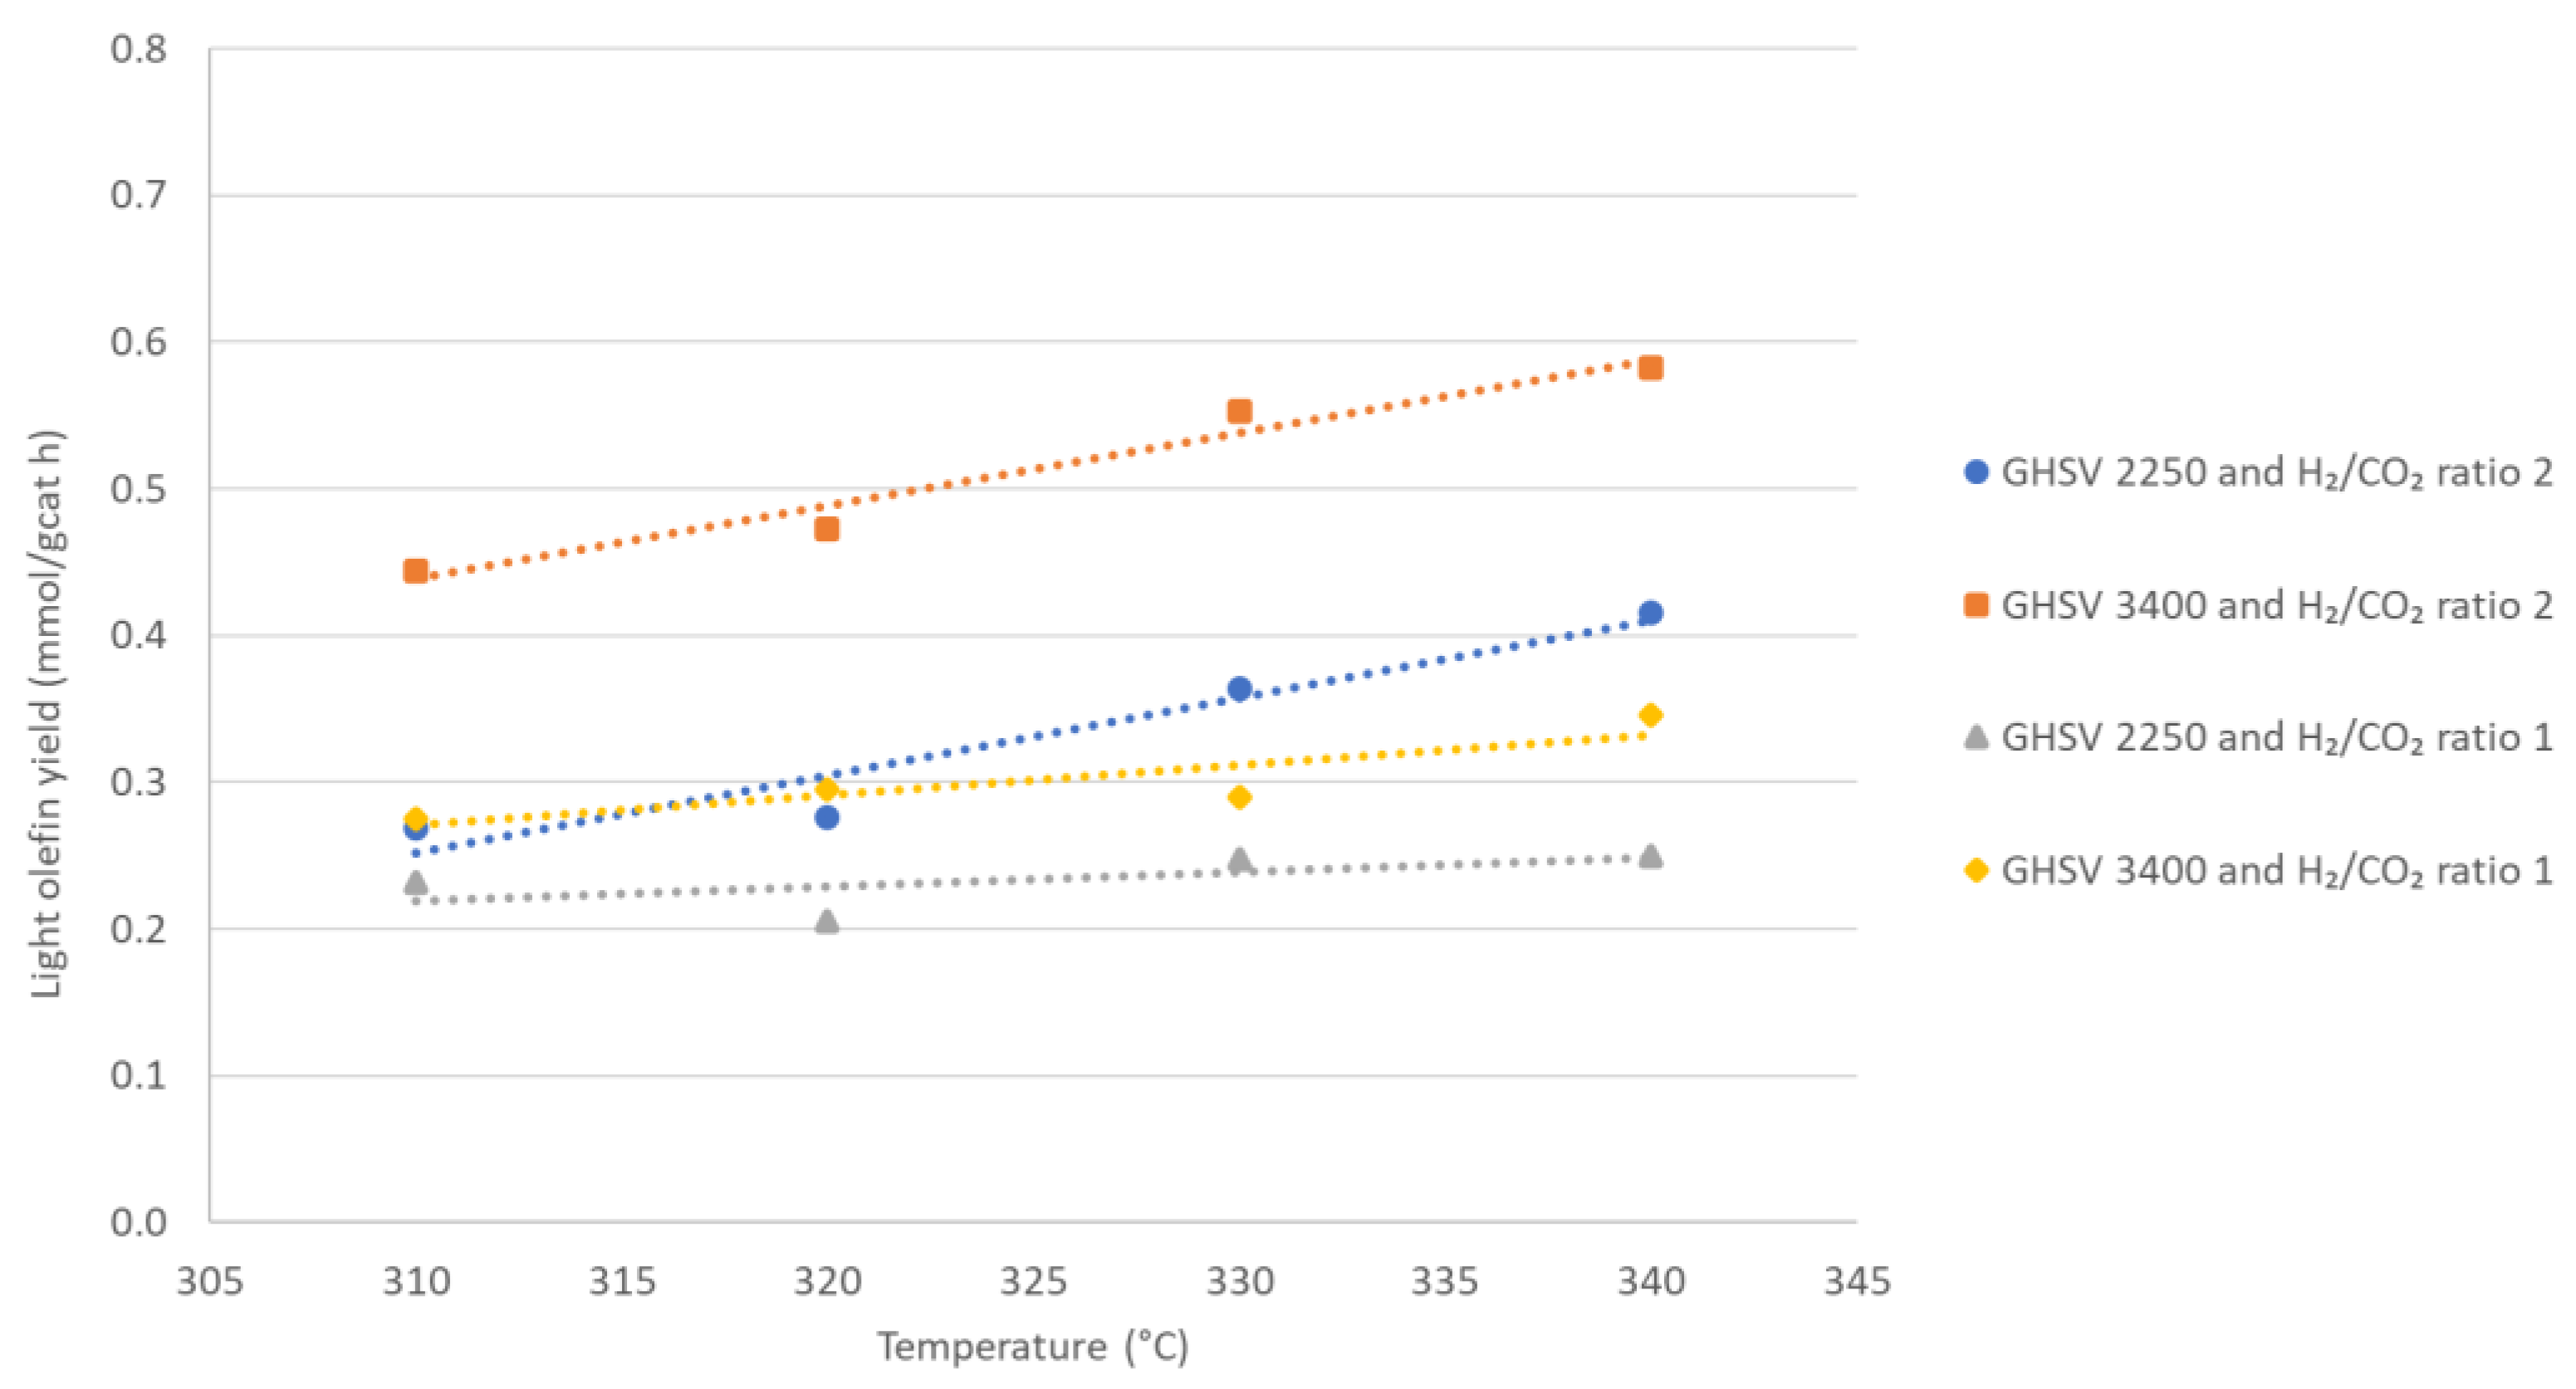
3.2. Fischer–Tropsch Results

The effect of GHSV and H2/CO2 ratio on CO conversion, methane selectivity, light paraffin selectivity and light olefin selectivity is shown in Table 3. Here, the H2/CO2 ratio refers to the composition of RWGS inlet gas, highlighting the integration of the two reactors. The exact gas composition and the H2/CO ratio of the RWGS product gas can be seen in Figure 4 and Table 2. With a higher H2/CO2 ratio, the CO conversion is higher, and it increases more rapidly as a function of GHSV. With a lower H2/CO2 ratio, the CO conversion is lower and remains mostly unaffected by the GHSV. A similar trend can be observed for the methane selectivity. The light paraffin and olefin selectivities showed close to identical behavior in relation to the studied parameters. Both selectivities remained quite stable at low GHSV, regardless of the H2/CO2 ratio. At higher GHSV, the selectivities of paraffins and olefins increased when a lower H2/CO2 ratio was used, and light olefin selectivity increased more rapidly as a function of the H2/CO2 ratio. The higher GHSV causes a higher light olefin selectivity at low H2/CO2 ratio because the methane selectivity is unaffected by the GHSV and the light olefin secondary reactions are suppressed when the residence time is lower. The H2/CO2 ratio, increasing the GHSV, decreases the olefin and paraffin selectivities because, with a higher conversion, the methane selectivity is higher.
The effect of temperature and H2/CO2 ratio on the hydrocarbon and CO2 selectivities as well as CO conversion are presented in Figure 6 (GHSV 2250 h−1) and Figure 7 (GHSV 3400 h−1).
General trends observed from the above figures show that the CO conversion and methane selectivity increase as a function of temperature. The light hydrocarbon selectivities decrease as a function of temperature at a lower space velocity and remain quite stable, regardless of temperature changes, at a higher space velocity.
The selectivity to the C5+ products was low in all experiments. This is a desired result as the aim was to attain a high selectivity to light hydrocarbons. In the case where C5+ was practically zero, a large amount of CO was converted to CO2 and H2 by the WGS reaction suppressing the chain growth. At hydrogen poor conditions and at a suitable temperature, WGS competes with FTO on the iron catalysts.
To compare the total production of light olefins between experiments and different process conditions, the light olefin yields were calculated. These are presented in Figure 8. The highest yield was at the process conditions where the light olefin selectivity was the lowest and the lowest yield was at conditions where the light olefin selectivity was the highest. This is because the overall conversion is much higher at H2/CO2 ratio of 2 and, with a higher space velocity, the overall throughput is so much higher that the lower light olefin selectivity is compensated.
For comparison, an experiment with a one-step conversion of CO2 to light olefins was also carried out. The light olefin yield of the one-step conversion was much lower compared to that obtained with the two-step process. This was because the water gas shift activity of the iron catalyst converted the CO2 mainly to CO and the light olefin selectivity was only 2.2%. As a result, the light olefin yield was over four times lower than that in the two-step process. In the one0 step experiment, the CO2 conversion was 14%, CO selectivity 74.4%, CH4 selectivity 21.7% and the light paraffin selectivity 1.7%.

4. Discussion

The RWGS reaction yielded important results in terms of conversion, selectivity and carbon formation in relation to the reaction equilibrium that are comparable to results obtained at similar conditions in the literature [11,16,17,53]. At 850 °C, with a space velocity under 25,000 h−1, the conversion is very close to the reaction equilibrium, 65% with H2/CO2 ratio of 2. Similar findings were made, for example, by Benzinger et al. [16] and Wolf et al. [17] in their studies of Ni-catalyzed RWGS at high temperatures, and Kim et al. [54] with platinum catalysts at similar conditions. The CH4 selectivities observed in the present study were slightly higher compared to the catalysts used in the above-mentioned studies. However, rhodium catalysts generally have slightly higher CH4 selectivities and the ones observed in this study are comparable to those listed, for example, in the review of Su et al. [11].
In all of the experiments, the RWGS reaction did not exhibit catalyst deactivation due to carbon formation or sintering and no carbon residues were observed in the reactor when the reactor was inspected after the experiments. This is consistent with earlier work at VTT, which led to a filed IPR on the applicability of the Rh catalyst in this process [54]. The carbon formation was suppressed by operating at a high temperature, using high space velocities and continuously co-feeding a small amount (2 vol-%) of O2 to the reactor. Some carbon deposition was observed, however, at the RWGS reactor outlet during the equipment maintenance. It is probable that the whole RWGS reactor was not isothermal at 850 °C and some parts remained at a lower temperature, allowing suitable conditions for carbon formation. This would also explain the formation of methane in the RWGS reactor.
The FT product selectivities obtained in this study are close to those seen in the literature [39,44,50,55,56]. For example, Torres Galvis et al. [50] studied different iron catalysts, either unpromoted or promoted with sodium and sulfur, for FT olefin production. The results are also similar to those of Han et al. [44], who studied different rare-earth metal-promoted Fe catalysts. Their reaction conditions were similar to those used in this study and the light olefin selectivities observed were in the range of 23–66% for Torres Galvis et al. and 22–36% for Han et al. The selectivity ranges of both studies were similar to those observed in the present study. In addition, the combined olefin and paraffin selectivities of the present study were close to those obtained by Han et al. and Botes et al. [39], who used Fe catalysts promoted with Na and S and observed combined C2–C4 selectivities (olefins+paraffins) between 20 and 80%. In our study, the combined C2–C4 selectivities were between 50 and 80%. The most considerable difference between our research and that found in the most comparable Fischer–Tropsch literature is that, in our system, the FT CO conversion was significantly lower compared to those reported by the groups cited above. We observed CO conversions of 2–7% in our study, compared to the 10–75% conversions reported in the literature, despite using similar catalyst and operation conditions. This is, at least to some degree, explained by the higher pressure used in the cited studies. Torres Galvis et al. and Botes et al. used a pressure of 20 bar and Han et al. used a pressure of 10 bar, which are all higher than the pressure used in our experiments (6 bar). A higher pressure has been shown to increase the CO conversion but also decrease the light olefin selectivity [57]. We chose to study only one pressure setting in this study to keep the research matrix relatively simple. The 6-bar pressure was chosen mainly to study the production of light olefins at a lower pressure but also due to some constraints in the available laboratory equipment.
Another reason for the lower conversion is the mass transfer limitations of the FT catalyst bed, which are caused by design challenges of the two-reactor system. In the comparable studies, only one-reactor systems were used to study the FT reaction, whereas in our study, with the two-reactor setup, the complexity of reactor and experimental design increased significantly. In the RWGS-FT system, the effect is amplified as the two reactions have strikingly different optimal conditions. For example, the optimal GHSVs of the two reactions were approximately 25,000–40,000 h−1 and 2000–5000 h−1 for RWGS and FT, respectively. This limits the available configurations in small-scale laboratory systems, causing unavoidable trade-offs in the design of the system. In our experimental setup, we chose to use optimal conditions for the RWGS reactors to produce high-quality syngas and avoid carbon formation to make sure that the system could be operated continuously for several hours. This caused a trade-off where the dimensions of the FT reactor would be suboptimal. The requirement to have a low space velocity in the FT reactor implied using a long reactor with larger cross-sectional diameter. Furthermore, the use of long packed bed sets constraints the particle size of the catalyst in the bed. To avoid an excessive pressure drop in the packed bed, large catalyst particles had to be used. In this study, a catalyst with a particle diameter of 0.25–0.35 mm was used and the pressure drop remained low, at 0.1–0.2 bar, over the length of the FT reactor, depending on the flow rate. Smaller particles of around 0.1–0.15 mm were also tested, but they clogged the reactor completely and could not be used. The use of larger particles probably caused higher mass transfer limitations in the interface between reactant gases and catalyst particles, reducing the reaction activity. One indication that the reaction is mass-transfer-limited is the increase in CO conversion in the FT reactor as a function of GHSV (Table 3). Typically, conversion decreases as a function of GHSV as the residence time is shorter, but here, we observed the opposite effect, where a higher GHSV caused a higher gas velocity, which decreased the mass-transfer limitations and increased conversion. The increase in conversion also explains the increase in methane selectivity as a function of GHSV. Fischer–Tropsch to olefin (FTO) catalysts have been widely studied and reviewed, for example, by Yahyazadeh et al. [58], in which highly active and olefin-selective FT catalysts do exist. However, in many cases, there is a trade-off between high activity and high light olefin selectivity, meaning that the perfect FTO catalyst has not been discovered yet, but many promising alternatives are available. Thus, one can be reasonably optimistic that it would be possible to design and construct a larger scale RWGS-FT system for highly optimized light olefin production, where the shortcomings of the smaller scale system can be improved with a better reactor design. Nevertheless, it is important to test these concepts first in a smaller scale to observe how the integrated systems work and to gain a deeper insight for scale up.
In this research, the two main objectives were to demonstrate that an integrated two-reactor system can be operated in series to yield a product mixture with high selectivity towards light olefins and to study the interactions between the RWGS reaction conditions and the FT product distribution. Considering the RWGS reactor, the most important parameters for the light olefin production are the CO2 conversion and outlet gas composition. A high CO2 conversion is essential to produce enough syngas for the FT reactor to obtain a reasonable light olefin yield. However, while it is possible to increase the RWGS CO2 conversion by increasing the amount of H2 in the feed, this quickly results in a suboptimal FT inlet composition as the higher H2/CO2 and H2/CO ratios cause harm to both reactors. In the RWGS reactor, the higher amount of H2 increases methane selectivity, which is an undesired side product as it acts as an inert in the FT reactor. In the FT reactor, on the other hand, the higher H2/CO ratio reduces the selectivity towards light olefins as the higher amount of hydrogen in the inlet gas increases the formation of methane and light paraffins. Therefore, it is better to use an RWGS inlet H2/CO2 ratio of 2, or slightly below. At this level, the conversion of both RWGS and FT, as well as the light olefin selectivity, are still reasonably high. The lower conversion can be also alleviated to some extent by recycling the unreacted product gases back to the RWGS reactor to increase the overall CO2 conversion. As shown by Equation (1), the RWGS reaction is highly endothermic. This heat can be generated by recycling part of the effluent of the FT step to the RWGS reactor, where it will be partially oxidized to synthesize gas, eventually increasing the yield of the desired olefins. Although recycling may significantly improve the process economics, there are also open questions. For instance, the inclusion of hydrocarbons to the feed of the RWGS will increase the coking of the catalyst, although it is not known exactly how severe this is or how it depends on the composition of the feed. However, it can be anticipated that coking is more severe when then recycling stream contains olefins. It would also be beneficial if the FT effluent could be fractionated cost-efficiently so that especially more of the less desired products, such as methane, are recycled.
The other parameter affecting the whole integrated reactor setup is the RWGS inlet flow rate, as it determines the residence times of both reactors. While the RWGS reaction benefits from shorter residence time and longer residence time promotes carbon formation, the FT reaction, forming long carbon chains, requires considerably longer residence. However, having a slightly higher space velocity in the FT reactor increases the light olefin selectivity as the product mixture exits the reactor before secondary olefin reactions occur. It was observed that a GHSV of around 3400 h−1 is optimal for the FT reactor for light olefin production, but with a better reactor design, even higher space velocities could be potentially used and a higher light olefin yield could be obtained. In our system, this space velocity for the FT means that the RWGS space velocity would be approximately 28,000 h−1. This is near the optimal space velocity for the RWGS as, at this point, the conversion is close to the thermodynamic equilibrium, whereas with higher space velocities, the conversion starts to decrease.
Based on the results of this research, it is evident that considerable attention must be paid to the dimensions of the reactors in an integrated two-reactor system. While the pressure of the process and the temperatures of the two reactors are easier to adjust to the optimal values, parameters such as space velocity are much harder to optimize in a two-reactor system. In addition, to fully optimize this integrated two-reactor system for scale up, kinetic models for the two reactions and a detailed model of the whole process are needed. These models are needed to better optimize the reactors, i.e., their dimensions, length of the catalyst bed and catalyst properties, such as particle and pore size. A kinetic model for FTO process with iron catalyst has been proposed by Turan et al. [59], but a kinetic model for Rh-catalyzed RWGS is not currently available. Similarly, process models for RWGS+FT Power-to-Liquid processes are available, for example, as described by Marchese et al. [60], but a model for CO2 to light olefins process does not exist.

5. Conclusions

The aim of this work was to study CO2 conversion with a dual reactor unit consisting of integrated RWGS and FT reactors. It can be stated that the combination seemed to work reasonably well and initial data for basic process design and modeling were produced.
To optimize the light olefin yield of the Fischer–Tropsch synthesis, a trade-off must be made between the light olefin selectivity and the conversion. As noted in this study, the highest light olefin selectivity was obtained with H2/CO ratio of 1, where the methane formation and secondary reactions are suppressed. Yet, the CO conversion with this ratio is too low for competitive olefin production, so the optimal H2/CO ratio is higher, between 1.5 and 2. Similarly, the space velocity needs to be optimized in such a way that the throughput of the reactor is as high as possible, while maintaining sufficient CO conversion and light olefin selectivity. In our system, the optimal conditions for light olefin production were a GHSV of 3400 h−1, H2/CO ratio of 2 and temperature of 340 °C. Further optimization could be achieved with the help of a kinetic model.
Given that the experiments in this study were performed in a suboptimal packed bed FT reactor, the improvements needed for a higher conversion are relatively easy to achieve. For example, the reactor used here lacked a proper heat-transfer system to cool the FT reactor, which caused temperature gradients across the reactor that lead to unfavorable reaction conditions. In addition, a multichannel FT reactor could be used for the easier optimization of the space velocity in the FT reactor. Furthermore, the CO2 conversion of the overall process as well as the FT product yield can be improved by recycling the unreacted product gases back to the start of the process. Thus, a lower once-through conversion can be efficiently compensated. However, this increases the design complexity significantly, as it alters the RWGS inlet gas composition and flow rate, both of which are parameters that greatly affect both reactions. Thus, to further optimize this two-step process, kinetic and process models of the system will be constructed and studied rigorously.

Author Contributions

The manuscript was written with the contribution of all authors. Methodology, formal analysis, and investigation, A.B. and S.K.; project administration and supervision, M.R., P.S. and V.A. All authors contributed to the discussion of the experimental results and the commenting and editing of the manuscript. All authors have read and agreed to the published version of the manuscript.

Funding

This work was supported by the BECCU project (https://www.beccu.fi/) (accessed on 1 October 2022), which received funding from Business Finland (Funding decision number 3834/31/2019).

Data Availability Statement

Not applicable.

Conflicts of Interest

The authors declare no conflict of interest.

References

  1. Akah, A.; Williams, J.; Ghrami, M. An Overview of Light Olefins Production via Steam Enhanced Catalytic Cracking. Catal. Surv. Asia 2019, 23, 265–276. [Google Scholar] [CrossRef]
  2. Corma, A.; Corresa, E.; Mathieu, Y.; Sauvanaud, L.; Al-Bogami, S.; Al-Ghrami, M.S.; Bourane, A. Crude Oil to Chemicals: Light Olefins from Crude Oil. Catal. Sci. Technol. 2017, 7, 12–46. [Google Scholar] [CrossRef] [Green Version]
  3. Amghizar, I.; Vandewalle, L.A.; van Geem, K.M.; Marin, G.B. New Trends in Olefin Production. Engineering 2017, 3, 171–178. [Google Scholar] [CrossRef]
  4. Zimmermann, H. Light Olefins—Challenges from New Production Routes? In Opportunities and Challenges at the Interface between Petrochemistry and Refinery; U.S. Department of Energy: Washington, DC, USA, 2007; pp. 75–86. [Google Scholar]
  5. Numpilai, T.; Cheng, C.K.; Limtrakul, J.; Witoon, T. Recent Advances in Light Olefins Production from Catalytic Hydrogenation of Carbon Dioxide. Process Saf. Environ. Prot. 2021, 151, 401–427. [Google Scholar] [CrossRef]
  6. Guil-López, R.; Mota, N.; Llorente, J.; Millán, E.; Pawelec, B.; Fierro, J.L.G.; Navarro, R.M. Methanol Synthesis from CO2: A Review of the Latest Developments in Heterogeneous Catalysis. Materials 2019, 12, 3902. [Google Scholar] [CrossRef] [Green Version]
  7. Marlin, D.S.; Sarron, E.; Sigurbjörnsson, Ó. Process Advantages of Direct CO2 to Methanol Synthesis. Front. Chem. 2018, 6, 446. [Google Scholar] [CrossRef]
  8. Rönsch, S.; Schneider, J.; Matthischke, S.; Schlüter, M.; Götz, M.; Lefebvre, J.; Prabhakaran, P.; Bajohr, S. Review on Methanation—From Fundamentals to Current Projects. Fuel 2016, 166, 276–296. [Google Scholar] [CrossRef]
  9. Saeidi, S.; Najari, S.; Fazlollahi, F.; Nikoo, M.K.; Sefidkon, F.; Klemeš, J.J.; Baxter, L.L. Mechanisms and Kinetics of CO2 Hydrogenation to Value-Added Products: A Detailed Review on Current Status and Future Trends. Renew. Sustain. Energy Rev. 2017, 80, 1292–1311. [Google Scholar] [CrossRef]
  10. Zhu, M.; Ge, Q.; Zhu, X. Catalytic Reduction of CO2 to CO via Reverse Water Gas Shift Reaction: Recent Advances in the Design of Active and Selective Supported Metal Catalysts. Trans. Tianjin Univ. 2020, 26, 172–187. [Google Scholar] [CrossRef] [Green Version]
  11. Su, X.; Yang, X.; Zhao, B.; Huang, Y. Designing of Highly Selective and High-Temperature Endurable RWGS Heterogeneous Catalysts: Recent Advances and the Future Directions. J. Energy Chem. 2017, 26, 854–867. [Google Scholar] [CrossRef]
  12. Zhang, X.; Zhu, X.; Lin, L.; Yao, S.; Zhang, M.; Liu, X.; Wang, X.; Li, Y.W.; Shi, C.; Ma, D. Highly Dispersed Copper over β-Mo2C as an Efficient and Stable Catalyst for the Reverse Water Gas Shift (RWGS) Reaction. ACS Catal. 2017, 7, 912–918. [Google Scholar] [CrossRef]
  13. Zhou, G.; Xie, F.; Deng, L.; Zhang, G.; Xie, H. Supported Mesoporous Cu/CeO2-δ Catalyst for CO2 Reverse Water–Gas Shift Reaction to Syngas. Int. J. Hydrogen Energy 2020, 45, 11380–11393. [Google Scholar] [CrossRef]
  14. Zhao, K.; Bkour, Q.; Hou, X.; Kang, S.W.; Park, J.C.; Norton, M.G.; Yang, J.-I.; Ha, S. Reverse Water Gas Shift Reaction over CuFe/Al2O3 Catalyst in Solid Oxide Electrolysis Cell. Chem. Eng. J. 2018, 336, 20–27. [Google Scholar] [CrossRef]
  15. Bahmanpour, A.M.; Héroguel, F.; Klllç, M.; Baranowski, C.J.; Artiglia, L.; Röthlisberger, U.; Luterbacher, J.S.; Kröcher, O. Cu-Al Spinel as a Highly Active and Stable Catalyst for the Reverse Water Gas Shift Reaction. ACS Catal. 2019, 9, 6243–6251. [Google Scholar] [CrossRef]
  16. Benzinger, W.; Daymo, E.; Hettel, M.; Maier, L.; Antinori, C.; Pfeifer, P.; Deutschmann, O. Reverse Water Gas Shift (RWGS) over Ni—Spatially-Resolved Measurements and Simulations. Chem. Eng. J. 2019, 362, 430–441. [Google Scholar] [CrossRef]
  17. Wolf, A.; Jess, A.; Kern, C. Syngas Production via Reverse Water-Gas Shift Reaction over a Ni-Al2O3 Catalyst: Catalyst Stability, Reaction Kinetics, and Modeling. Chem. Eng. Technol. 2016, 39, 1040–1048. [Google Scholar] [CrossRef]
  18. Li, S.; Xu, Y.; Chen, Y.; Li, W.; Lin, L.; Li, M.; Deng, Y.; Wang, X.; Ge, B.; Yang, C.; et al. Tuning the Selectivity of Catalytic Carbon Dioxide Hydrogenation over Iridium/Cerium Oxide Catalysts with a Strong Metal–Support Interaction. Angew. Chem. Int. Ed. 2017, 56, 10761–10765. [Google Scholar] [CrossRef]
  19. Kaiser, P.; Unde, R.B.; Kern, C.; Jess, A. Production of Liquid Hydrocarbons with CO2 as Carbon Source Based on Reverse Water-Gas Shift and Fischer-Tropsch Synthesis. Chem. Ing. Tech. 2013, 85, 489–499. [Google Scholar] [CrossRef]
  20. Yang, L.; Pastor-Pérez, L.; Gu, S.; Sepúlveda-Escribano, A.; Reina, T.R. Highly Efficient Ni/CeO2-Al2O3 Catalysts for CO2 Upgrading via Reverse Water-Gas Shift: Effect of Selected Transition Metal Promoters. Appl. Catal. B Environ. 2018, 232, 464–471. [Google Scholar] [CrossRef]
  21. Dzuryk, S.; Rezaei, E. Intensification of the Reverse Water Gas Shift Reaction by Water-Permeable Packed-Bed Membrane Reactors. Ind. Eng. Chem. Res. 2020, 59, 18907–18920. [Google Scholar] [CrossRef]
  22. Samimi, F.; Hamedi, N.; Rahimpour, M.R. Green Methanol Production Process from Indirect CO2 Conversion: RWGS Reactor versus RWGS Membrane Reactor. J. Environ. Chem. Eng. 2019, 7, 102813. [Google Scholar] [CrossRef]
  23. Ghodhbene, M.; Bougie, F.; Fongarland, P.; Iliuta, M.C. Hydrophilic Zeolite Sorbents for In-Situ Water Removal in High Temperature Processes. Can. J. Chem. Eng. 2017, 95, 1842–1849. [Google Scholar] [CrossRef]
  24. Lee, M.; Kim, Y.; Lim, H.S.; Jo, A.; Kang, D.; Lee, J.W. Reverse Water–Gas Shift Chemical Looping Using a Core–Shell Structured Perovskite Oxygen Carrier. Energies 2020, 13, 5324. [Google Scholar] [CrossRef]
  25. Daza, Y.A.; Kent, R.A.; Yung, M.M.; Kuhn, J.N. Carbon Dioxide Conversion by Reverse Water-Gas Shift Chemical Looping on Perovskite-Type Oxides. Ind. Eng. Chem. Res. 2014, 53, 5828–5837. [Google Scholar] [CrossRef]
  26. Wenzel, M.; Rihko-Struckmann, L.; Sundmacher, K. Continuous Production of CO from CO2 by RWGS Chemical Looping in Fixed and Fluidized Bed Reactors. Chem. Eng. J. 2018, 336, 278–296. [Google Scholar] [CrossRef] [Green Version]
  27. Li, J.; Sun, Y.; Wang, B.; Xiao, H.; Wu, J.; Chen, L.; Fu, M.; Ye, D. Effect of Plasma on Catalytic Conversion of CO2 with Hydrogen over Pd/ZnO in a Dielectric Barrier Discharge Reactor. J. Phys. D Appl. Phys. 2019, 52, 244001. [Google Scholar] [CrossRef]
  28. Zeng, Y.; Tu, X. Plasma-Catalytic CO2 Hydrogenation at Low Temperatures. IEEE Trans. Plasma Sci. 2016, 44, 405–411. [Google Scholar] [CrossRef] [Green Version]
  29. Oshima, K.; Shinagawa, T.; Nogami, Y.; Manabe, R.; Ogo, S.; Sekine, Y. Low Temperature Catalytic Reverse Water Gas Shift Reaction Assisted by an Electric Field. Catal. Today 2014, 232, 27–32. [Google Scholar] [CrossRef]
  30. Klerk, A.D. Fischer-Tropsch Refining; Wiley-VCH Verlag GmbH & Co.: Weinheim, Germany, 2011. [Google Scholar]
  31. Maitlis, P.M.; de Klerk, A. Greener Fischer-Tropsch Processes; Wiley-VCH Verlag GmbH & Co.: Weinheim, Germany, 2012. [Google Scholar]
  32. Shafer, W.D.; Gnanamani, M.K.; Graham, U.M.; Yang, J.; Masuku, C.M.; Jacobs, G.; Davis, B.H. Fischer-Tropsch: Product Selectivity-the Fingerprint of Synthetic Fuels. Catalysts 2019, 9, 259. [Google Scholar] [CrossRef] [Green Version]
  33. Wood, D.A.; Nwaoha, C.; Towler, B.F. Gas-to-Liquids (GTL): A Review of an Industry Offering Several Routes for Monetizing Natural Gas. J. Nat. Gas Sci. Eng. 2012, 9, 196–208. [Google Scholar] [CrossRef]
  34. Wilhelm, D.J.; Simbeck, D.R.; Karp, A.D.; Dickenson, R.L. Syngas Production for Gas-to-Liquids Applications: Technologies, Issues and Outlook. Fuel Process. Technol. 2001, 71, 139–148. [Google Scholar] [CrossRef]
  35. Liu, Z.; Shi, S.; Li, Y. Coal Liquefaction Technologies-Development in China and Challenges in Chemical Reaction Engineering. Chem. Eng. Sci. 2010, 65, 12–17. [Google Scholar] [CrossRef]
  36. Rafati, M.; Wang, L.; Dayton, D.C.; Schimmel, K.; Kabadi, V.; Shahbazi, A. Techno-Economic Analysis of Production of Fischer-Tropsch Liquids via Biomass Gasification: The Effects of Fischer-Tropsch Catalysts and Natural Gas Co-Feeding. Energy Convers. Manag. 2017, 133, 153–166. [Google Scholar] [CrossRef] [Green Version]
  37. Swanson, R.M.; Platon, A.; Satrio, J.A.; Brown, R.C. Techno-Economic Analysis of Biomass-to-Liquids Production Based on Gasification. Fuel 2010, 89 (Suppl. 1), S11–S19. [Google Scholar] [CrossRef] [Green Version]
  38. Ngamcharussrivichai, C.; Liu, X.; Li, X.; Vitidsant, T.; Fujimoto, K. An Active and Selective Production of Gasoline-Range Hydrocarbons over Bifunctional Co-Based Catalysts. Fuel 2007, 86, 50–59. [Google Scholar] [CrossRef]
  39. Botes, G.F.; Bromfield, T.C.; Coetzer, R.L.J.; Crous, R.; Gibson, P.; Ferreira, A.C. Development of a Chemical Selective Iron Fischer Tropsch Catalyst. Catal. Today 2016, 275, 40–48. [Google Scholar] [CrossRef]
  40. Sun, J.; Yang, G.; Peng, X.; Kang, J.; Wu, J.; Liu, G.; Tsubaki, N. Beyond Cars: Fischer-Tropsch Synthesis for Non-Automotive Applications. ChemCatChem 2019, 11, 1412–1424. [Google Scholar] [CrossRef]
  41. Todic, B.; Nowicki, L.; Nikacevic, N.; Bukur, D.B. Fischer-Tropsch Synthesis Product Selectivity over an Industrial Iron-Based Catalyst: Effect of Process Conditions. Catal. Today 2016, 261, 28–39. [Google Scholar] [CrossRef] [Green Version]
  42. Lin, T.; Gong, K.; Wang, C.; An, Y.; Wang, X.; Qi, X.; Li, S.; Lu, Y.; Zhong, L.; Sun, Y. Fischer-Tropsch Synthesis to Olefins: Catalytic Performance and Structure Evolution of Co2C-Based Catalysts under a CO2 Environment. ACS Catal. 2019, 9, 9554–9567. [Google Scholar] [CrossRef]
  43. Xie, J.; Yang, J.; Dugulan, A.I.; Holmen, A.; Chen, D.; de Jong, K.P.; Louwerse, M.J. Size and Promoter Effects in Supported Iron Fischer-Tropsch Catalysts: Insights from Experiment and Theory. ACS Catal. 2016, 6, 3147–3157. [Google Scholar] [CrossRef]
  44. Han, Z.; Qian, W.; Zhang, H.; Ma, H.; Sun, Q.; Ying, W. Effect of Rare-Earth Promoters on Precipitated Iron-Based Catalysts for Fischer-Tropsch Synthesis. Ind. Eng. Chem. Res. 2020, 59, 14598–14605. [Google Scholar] [CrossRef]
  45. Wu, X.; Ma, H.; Zhang, H.; Qian, W.; Liu, D.; Sun, Q.; Ying, W. High-Temperature Fischer-Tropsch Synthesis of Light Olefins over Nano-Fe3O4@MnO2 Core-Shell Catalysts. Ind. Eng. Chem. Res. 2019, 58, 21350–21362. [Google Scholar] [CrossRef]
  46. Portillo, A.; Ateka, A.; Ereña, J.; Aguayo, A.T.; Bilbao, J. Conditions for the Joint Conversion of CO2 and Syngas in the Direct Synthesis of Light Olefins Using In2O3-ZrO2/SAPO-34 Catalyst. Ind. Eng. Chem. Res. 2021, 61, 29. [Google Scholar] [CrossRef] [PubMed]
  47. Liu, Z.; Jia, G.; Zhao, C.; Xing, Y. Selective Iron Catalysts for Direct Fischer-Tropsch Synthesis to Light Olefins. Ind. Eng. Chem. Res. 2021, 60, 6137–6146. [Google Scholar] [CrossRef]
  48. Dewilde, J.F.; Ho, C.R.; Conner, J.; Smith, A.; Kirilin, A.V.; Malek, A.; Witt, P.M. Kinetics of Direct Olefin Synthesis from Syngas over Mixed Beds of Zn-Zr Oxides and SAPO-34. Ind. Eng. Chem. Res. 2021, 60, 14166–14175. [Google Scholar] [CrossRef]
  49. Zhang, P.; Meng, F.; Yang, L.; Yang, G.; Liang, X.; Li, Z. Syngas to Olefins over a CrMnGa/SAPO-34 Bifunctional Catalyst: Effect of Cr and Cr/Mn Ratio. Ind. Eng. Chem. Res. 2021, 60, 13214–13222. [Google Scholar] [CrossRef]
  50. Torres Galvis, H.M.; Koeken, A.C.J.; Bitter, J.H.; Davidian, T.; Ruitenbeek, M.; Dugulan, A.I.; de Jong, K.P. Effect of Precursor on the Catalytic Performance of Supported Iron Catalysts for the Fischer-Tropsch Synthesis of Lower Olefins. Catal. Today 2013, 215, 95–102. [Google Scholar] [CrossRef]
  51. Bukur, D.B.; Todic, B.; Elbashir, N. Role of Water-Gas-Shift Reaction in Fischer–Tropsch Synthesis on Iron Catalysts: A Review. Catal. Today 2016, 275, 66–75. [Google Scholar] [CrossRef] [Green Version]
  52. Luo, M.; Hamdeh, H.; Davis, B.H. Fischer-Tropsch Synthesis: Catalyst activation of low alpha iron catalyst. Catal. Today 2009, 140, 127–134. [Google Scholar] [CrossRef]
  53. Kim, S.S.; Lee, H.H.; Hong, S.C. A Study on the Effect of Support’s Reducibility on the Reverse Water-Gas Shift Reaction over Pt Catalysts. Appl. Catal. A Gen. 2012, 423–424, 100–107. [Google Scholar] [CrossRef]
  54. Kaisalo, N.; Simell, P.; Frilund, C.; Vidal Vazquez, F.; Hannula, I. Method and Apparatus for Producing Carbon Monoxide. U.S. Patent US20210246034A1, 12 March 2019. [Google Scholar]
  55. Gong, W.; Ye, R.P.; Ding, J.; Wang, T.; Shi, X.; Russell, C.K.; Tang, J.; Eddings, E.G.; Zhang, Y.; Fan, M. Effect of Copper on Highly Effective Fe-Mn Based Catalysts during Production of Light Olefins via Fischer-Tropsch Process with Low CO2 Emission. Appl. Catal. B Environ. 2020, 278, 119302. [Google Scholar] [CrossRef]
  56. Song, F.; Yong, X.; Wu, X.; Zhang, W.; Ma, Q.; Zhao, T.; Tan, M.; Guo, Z.; Zhao, H.; Yang, G.; et al. FeMn@HZSM-5 Capsule Catalyst for Light Olefins Direct Synthesis via Fischer-Tropsch Synthesis: Studies on Depressing the CO2 Formation. Appl. Catal. B Environ. 2022, 300, 120713. [Google Scholar] [CrossRef]
  57. Liu, Y.; Teng, B.T.; Guo, X.H.; Li, Y.; Chang, J.; Tian, L.; Hao, X.; Wang, Y.; Xiang, H.W.; Xu, Y.Y.; et al. Effect of Reaction Conditions on the Catalytic Performance of Fe-Mn Catalyst for Fischer-Tropsch Synthesis. J. Mol. Catal. A Chem. 2007, 272, 182–190. [Google Scholar] [CrossRef]
  58. Yahyazadeh, A.; Dalai, A.K.; Ma, W.; Zhang, L. Fischer–Tropsch Synthesis for Light Olefins from Syngas: A Review of Catalyst Development. Reactions 2021, 2, 227–257. [Google Scholar] [CrossRef]
  59. Turan, A.Z.; Ataç, Ö.; Kurucu, O.A.; Ersöz, A.; Sarıoğlan, A.; Okutan, H. Kinetic Modeling of Fischer–Tropsch-to-Olefins Process via Advanced Optimization. Int. J. Chem. Kinet. 2022, 54, 3–15. [Google Scholar] [CrossRef]
  60. Marchese, M.; Giglio, E.; Santarelli, M.; Lanzini, A. Energy Performance of Power-to-Liquid Applications Integrating Biogas Upgrading, Reverse Water Gas Shift, Solid Oxide Electrolysis and Fischer-Tropsch Technologies. Energy Convers. Manag. X 2020, 6, 100041. [Google Scholar] [CrossRef]
Figure 1. Thermodynamic equilibrium molar fractions of the reverse water gas shift reaction at different temperatures. H2/CO2 ratio = 2, P = 6 bar. Calculated with Outotec HSC Chemistry 9 Equilibrium compositions calculator, using HSC DB9 database.
Chemengineering 06 00096 g001
Figure 2. Schematic of the experimental setup.
Chemengineering 06 00096 g002
Figure 3. CO2 conversion in the RWGS reactor as a function of GHSV at 850 °C. Equilibrium conversions showed as dashed lines. Equilibrium concentrations were calculated with Aspen Plus v11. Dashed lines are only for illustrative purposes.
Chemengineering 06 00096 g003
Figure 4. RWGS outlet gas composition as a function of the H2/CO2 ratio after the removal of water. GHSV: 35,800 h−1; pressure: 6 bar; temperature: 850 °C.
Chemengineering 06 00096 g004
Figure 5. RWGS methane selectivity as a function of the inlet H2/CO2 ratio. GHSV: 35,800 h−1; pressure: 6 bar; temperature: 850 °C.
Chemengineering 06 00096 g005
Figure 6. CO conversion and selectivities as a function of temperature and H2/CO2 ratio. GHSV: 2250 h−1.
Chemengineering 06 00096 g006
Figure 7. CO conversion and selectivities as a function of temperature and H2/CO2 ratio. GHSV: 3400 h−1.
Chemengineering 06 00096 g007
Figure 8. Light olefin yield at different process conditions.
Chemengineering 06 00096 g008
Table 1. Dimensions and reaction conditions of the RWGS and FT reactors.
PropertyRWGS ReactorFT Reactor
Reactor length (mm)255710
Reactor inside diameter (mm)46
Temperature (°C)850310–340
GHSV (h−1)20,000–50,0002000–3500
Pressure/bar6
H2/CO2 and H2/CO-molar ratio1–3
Table 2. RWGS inlet composition with the corresponding RWGS outlet (FT inlet) composition after the removal of water.
RWGS InletRWGS Outlet, FT Inlet
Volumetric Flow Rate (NL/min)H2/CO2 RatioVolumetric Flow Rate (NL/min)H2/CO Ratio
12.00.72.0
11.50.81.5
11.011.1
1.52.01.12.2
1.51.51.31.7
1.51.01.41.2
22.01.52.4
21.51.71.9
21.01.91.4
Table 3. Effect of GHSV and H2/CO2 ratio on CO conversion and product selectivities.
GHSV (h−1)2250225034003400
H2/CO2 molar ratio1212
CO conversion (%)2.13.51.75.9
CH4 selectivity (%)22.429.121.332.9
Light olefin selectivity (%)39.939.846.527.8
Light paraffin selectivity (%)28.025.730.918.4
Publisher’s Note: MDPI stays neutral with regard to jurisdictional claims in published maps and institutional affiliations.

