1. Introduction
Adsorption desalination is a novel kind of desalination that uses an adsorption–desorption process to operate. Adsorbents and adsorbate are the two main components of the adsorption and desorption process with porous material [
1]. The surface area of the adsorbents adsorbs and desorbs the adsorbate. In the process of adsorption cycle, the adsorbents adsorb the adsorbate for a certain amount of time. While in the desorption cycle, the adsorbents reject the adsorbate adsorbed during adsorption cycle. The ability to adsorb is highly functioning when the adsorbent is subjected to low temperature circumstances, whereas the desorption takes place when the adsorbent is exposed to hot temperature conditions [
2].
In contrast, desorption takes place when the adsorbent is exposed to hot temperature conditions. A chiller’s ability to perform well is therefore directly proportional to the adsorbent’s capacity to absorb vapour and how rapidly the bed can adsorb or desorb liquid refrigerant [
2]. To offer a high adsorption capacity, a solid adsorbent with a large surface area is preferred, because it assist in producing a large amount of water to determine a change in the heat of adsorption (Δ
Hads). It is therefore important to understand the amount of vapour adsorbed, as this knowledge is utilized to calculate the energy used by an adsorption chiller [
3].
Calculating isosteric heat is equivalent to determining the change in heat of adsorption Δ
Hads using molecular simulations and observational calculations. They are both approaches to determine the change in heat of adsorption (Δ
Hads) [
4,
5]. New strategies have been presented during recent years for the understanding of adsorption information, particularly for the examination of micropore and mesopore sizes. Determining Δ
Hads for an adsorption chiller built into a small lab single unit is a perplexing process with no clear underlying notion. There is a need to take desalination into consideration, fueled by water scarcity in the world as whole [
1,
4].
It is not surprising that, when viewed in the context of more traditional theories of surface coverage and pore filling, it is difficult to obtain a balanced picture of the significance of recent advances in areas such as energy adsorption and density functional theory for a small lab-scale adsorption chiller. This study intends to bridge the gap in literature on the adsorptive process on a small lab scale by the intensity of the linkage between the adsorbate and adsorbent. The goal of this work is not only to discuss these methodologies, but also to provide a computational method for researchers to utilize with data from gas sorption isotherms [
1].
This extensive overview of the numerous ways for determining the isotherm graph procedure using methods such as Freundlich–Langmuir, isotherm enthalpy, and intensity may be useful for researchers transitioning to adsorption porous studies [
5,
6]. According to the current review, the Langmuir adsorption model is the most widely utilized. However, it, like other existing models, fails to fully reflect sorption phenomena in shale formations, which are characterized by surface heterogeneity and the presence of many components. As a result, efforts have been made to develop and improve the model for use in shale formations [
7].
The Freundlich model, on the other hand, describes a multi-layer adsorption process, while advances in molecular simulation offer the possibility of a more accurate representation of the sorption mechanism. However, independent of governing factors, both the Langmuir and Freundlich models have frequently been used to determine the maximum adsorption capacity of adsorbents. Hence, since both models have their own shortcomings, the Freundlich and the Langmuir models were combined to form a Freundlich–Langmuir model. This combination is suitable for predicting adsorption on heterogeneous surfaces and avoids the Freundlich model’s limitation of increased adsorbate concentration [
7].
As a result, at low adsorbate concentrations, this model reduces to the Freundlich model, while it predicts using the Langmuir model at high adsorbate concentrations. It also evaluates the adsorption isosteric enthalpy of adsorption between the adsorbent with Clausius–Clapeyron equation to quantify the intensity of contact between an adsorbate and a solid adsorbent. In conclusion, this isotherm combination is a practical and useful model for studying adsorption equilibrium. For the reasons stated above, this article uses the Clausius–Clapeyron relationship and Freundlich–Langmuir theory to simulate the isosteric adsorption of the used adsorbents [
6,
7].
The testing method can be categorized as either direct operation or indirect operation. Due to the high cost of these technologies, the indirect technique is by far the most popular method of determining isosteric enthalpy. This study uses the indirect method but introduces computed steps using Origin software. The bulk of research in the literature related to isosteric adsorption using the Clausius–Clapeyron model explains only the fundamental formula. It is very rare to find clear details based on the fundamental formulas or graphs of the isotherms with step-by-step explanations of how the process is conducted [
8].
Linear regression analysis has become one of the most widely used tools for defining the best fitting adsorption models in recent years. The use of nonlinear isotherm modelling has grown in popularity in tandem with the advancement of computer technology. In the process of adsorption desalination, the adsorption materials should, in general, fulfil the criteria of acceptability for sorption applications, which include an excellent detection limit, low energy usage, and high operating endurance [
5]. If the adsorbents used do not meet these criteria, then they are not suitable for the adsorption desalination process.
Two criteria commonly used to analyze an adsorptive process are the adsorption isotherm and the isosteric heat. The isotherm represents the adsorption capacity, whereas the isosteric heat represents the intensity of contacts on adsorbate and the adsorbents used [
9]. A common approach for determining surface qualities is the adsorption process of gasses on porous adsorbents, as well as separating and capturing gases and vapours [
10]. Adsorption isosteric heat is defined as the enthalpy change obtained from adsorption isotherms at two or more temperatures for a fixed number of adsorbed molecules [
11].
The adsorbed vapour measurements are made in relation to the strong mass at the point where a vapour is adsorbed onto a pore space [
10]. The pore structure of the solid adsorbent determines the adsorption isotherm [
12]. Surface area, pore volume, and pore size distribution are all retrieved from gas adsorption isotherms to form the pore structure [
13]. All adsorption models are based on the adsorption equilibrium. The implementation of both kinetic and dynamic adsorption models requires knowledge of the adsorption equilibrium [
14,
15].
1.1. Adsorption Equilibrium
The adsorption equilibrium is the accumulation of adsorbents on the adsorbent surface at a constant rate. The adsorbed vapour measurements are made in relation to the strong mass at the point where a vapour is adsorbed onto a previously empty strong surface or pore space. Van der Waals forces and hydrophobic interactions produce the attraction (not covalent bonding) [
5]. The state of equilibrium is achieved after a protracted period during which adsorbing molecules settle on the adsorbent surfaces [
15]. Working pairs for adsorption are typically chosen depending on the temperature of the available heat source and the cooling load [
16].
The thermo-physical characteristics, kinetics, and equilibrium isotherms of an adsorption working pair are important parameters that affect the effectiveness of an adsorption chiller. Furthermore, the vapour uptake is dependent on the temperature (T), the partial weight of the pressure (P) balance, and the adsorbate–solid interaction strength. The effect in the listed parameters does affect the vapour production. For a vapour adsorbed on a strong mass at a constant temperature, the adsorbed sum per unit mass of the strong mass (Q) is then merely a fraction of P [
17]. The adsorption isotherm is the relationship between Q and P at a particular temperature.
Because the adsorption process is exothermic, temperature has a large influence on the quantity of adsorbate adsorbed. Exothermic processes that operate at greater temperatures, according to Le Chatelier’s principle, prefer circumstances that produce less heat [
18]. As a result, at a given pressure, the amount of adsorbate adsorbed at equilibrium decreases as temperature rises [
18]. Q is often exhibited as a detail of the relative pressure where P is standardized to the immersion vapour pressure of the adsorbate at temperature T. Adsorption equilibrium is expressed in three ways:
Adsorption isotherm.
Adsorption isobar.
Adsorption isostere.
1.2. Adsorption Isostere
The effect of isosteric heat (Δ
Hads) on the combination of adsorbent and adsorbate is among the most important thermodynamic factors for the development of realistic gas classification, gas storage, and adsorption cooling systems [
4]. Isosteric heat is a degree of the power of an adsorbate’s interaction with a solid adsorbent. Understanding isosteric heat is an essential and relevant criterion for adsorption system heat control, as it assists in building a better adsorption chiller [
10]. The adsorption isostere is calculated using origin software and the Clausius–Clapeyron model equation. The study further graphically shows the enthalpy change that occurs in vapour extracted from the primary phase until it reaches the adsorbed gas phase.
The adsorbent’s ability to absorb water vapour is a direct function of cycle performance. As a result, the adsorbent employed in the cycle should have strong adsorbate (water vapour) absorption, as well as the capacity to regenerate at a low temperature. The adsorbent material is usually a hydrophilic porous substance with a large surface area that forms transient hydrogen bonds with water molecules. Adsorbate molecules on the adsorbent surface have a lower activation energy than during the main gas phase; hence, heat is released during adsorption. The heat emitted when an adsorptive adheres to a surface is known as the isosteric enthalpy of adsorption, or Δ
Hads [
10].
The isosteric enthalpy of adsorption is the opposite of the isosteric enthalpy of desorption and is emitted during the adsorption process (
Hads = 0 kJ/mol). Δ
Hdes is essential for the reverse desorption procedure (Δ
Hads = –Δ
Hdes) in the case of physisorption [
5]. As a result, adsorption enthalpy is a crucial measure in adsorption processes and is used to gain a better understanding of adsorbate–adsorbent interactions. Because
Hads classifies interactions between adsorbed species and adsorbents based on the intensity of contact, interactions between adsorbed species and adsorbents can be categorized, for example, as weak physisorption [
9].
Similarly, Δ
Hads is used to calculate the regeneration energy for adsorbate desorption. Regeneration energies are particularly significant in pressure swing studies, since the energy needed in desorption is proportional to the ultimate tensile strength [
5]. Calculations based on experiments and adsorption isotherm models are two sorts approaches to determining Δ
Hads. The experimental method is made up of direct and indirect processes. There has been little research employing the direct technique to identify Δ
Hads, since it is sophisticated and expensive to conduct. This study used the indirect technique of adsorption isotherms to derive the isosteric heat as a function of adsorption.
This method of isotherm commonly estimates the adsorbate–adsorbent interaction energy with at least two adsorption isotherms collected using at least six different temperatures near to each other. Because the isosteric adsorption fluctuates with temperature, it is recommended to use more than one adsorption isotherm with Δ
T = 10 °C [
5]. Utilizing a large temperature difference among adsorption isotherms will cause artificial mistakes in the computed result [
14]. Isosteric enthalpy is computed using Equation (1):
ΔHads(ma) is usually expressed as ΔHads without (ma). It is, however, the result of gas uptake. m represents the adsorption’s isosteric heat. This work introduces ΔHads(ma) because to compute the isosteric enthalpy of adsorption as the result of vapour uptake. ΔHads(ma) is determined utilizing information from more than one test of adsorption isotherms at six unique temperatures: T1 up to T6. The temperatures T1-T6 have distinct values but are near to each other. According to the literature, the temperature differential should be between 10 and 20 degrees Celsius. All the adsorption isotherms have (ma) vs. (P1/P2) data points.
1.3. The Clausius–Clapeyron Formula
The Clausius–Clapeyron formula links the adsorption isotherm’s temperature dependence with the adsorption heat effects. The Clausius–Clapeyron equation is derived from the use of two approximations: an adsorbed phase with a small molar volume and a gaseous phase that possesses perfect gas behavior. Researchers from several fields of study are now investigating adsorbent materials to improve the performance of adsorption chillers. Understanding the isosteric heat of adsorption provides for a better calculation of the vapour uptake duration by determining the capacity of the integrated material to swiftly disperse the heat generated in the framework [
6,
19].
1.4. Objectives
This study aims to evaluate the adsorption isosteric enthalpy of adsorption in between the adsorbent by using the Clausius–Clapeyron equation to quantify the intensity of contact between an adsorbate and a solid adsorbent by comparing the combination of two computed isotherms (Freundlich–Longmuir) with experimental data for a laboratory scale.
2. Materials and Methods
The isosteric heat is the difference in enthalpy derived using the adsorption isotherm at a minimum of two temperatures [
6,
18]. Under constant temperature and pressure, a discrete volume of gas transitions itself from the large gaseous state to its adsorbed phase, with the heat dispersed to the surrounding environment. The purpose of this study is to discuss the approach used in determining the adsorbate interaction strength and to provide useful graphs with equations used to calculate the isosteric enthalpy of adsorption. The research carried out with the use of two isotherms and six temperatures (283 K, 293 K, 303 K, 313 K, 323 K, and 333 K) using the gravimetric method [
8].
The adsorbents were dried in an oven, cooled to the isobaric adsorption temperature, and then weighed. Seawater was poured into the evaporator, which heated the seawater until it boiled. The adsorbents were placed on top of the adsorption-chiller reactor bed, vacuumed, and sealed. From there, the adsorbents were cooled by the coil linked to the heat exchanger from the cooling refrigerator until it reached saturation and became hydrophilic. During saturation, the vapour was discharged from the evaporator to be absorbed by the saturated adsorbents for a period. Each step of vapour up-take was recorded with operational conditions using the data logger.
The Clausius–Clapeyron formula was used to determine the isosteric enthalpy of adsorption from two adsorption isotherms at various but close temperatures, with Δ
T of 10 °C. For the given experimental data, a full computational explanation of the Clausius–Clapeyron model equation for determining Δ
Hads is provided [
5,
13]. A logarithmic scale of the amount of vapour adsorbed (
ma) in relation to the pressure isotherm graph at a low control pressure area was used to assess and confirm the quality of the crucial and underlying isotherm [
11]. The vapour up-take weight was recorded using the data logger.
The Freundlich–Langmuir isotherm was utilized, which corresponds to the Freundlich–Langmuir Equation (2). This is the formula for calculating the isosteric heat of gas-phase adsorption using experimental data. It is vital to recognize that temperature and pressure are separate factors; thus, if the temperature changes, the pressure may be adjusted to maintain the same Δ
Hads [
5].
where:
P is the pressure in kPa;
y is the affinity constant (1/kPa);
x is the maximal loading in kg/kg;
z is the heterogeneity exponent.
ma is the mass adsorbed (vapour uptake) in kg/kg.
After that, the formula is rearranged to form the Freundlich–Langmuir equation as follows:
Then, using the resulting pressures (P1 to P6) under equal vapour adsorbed (loadings), the Hads (ma) is determined (m). The isosteric heat of adsorption is determined through graphing lnP1-6 vs. 1/T1-6 for the isosteric adsorptions, that is, designed for equivalent uptake at the six temperatures, utilizing m vs. P1-6 data triples from the Freundlich–Langmuir and straight-line fits. With uniform uptake, the gradient m of a linear-regression with six data points at lnP1-6 vs. T1-6 provides ΔHads (ma). There are mai in relation to pi data points in each adsorption isotherm. The data triple ma in relation to P1/P2 is utilized for a uniform vapour uptake of ma.
The data pairs
lnP2 vs. 1/
T2 and
lnP1 vs. 1/
T1 define a straight line with a negative slope for a given value of
ma.
This method yields a heat of adsorption Δ
Hads(
ma) for all the empirically observed and interpolated loading
ma. This enables the plotting of Δ
Hads(
ma) as a function of fractional loading by specifying:
3. Results and Discussion
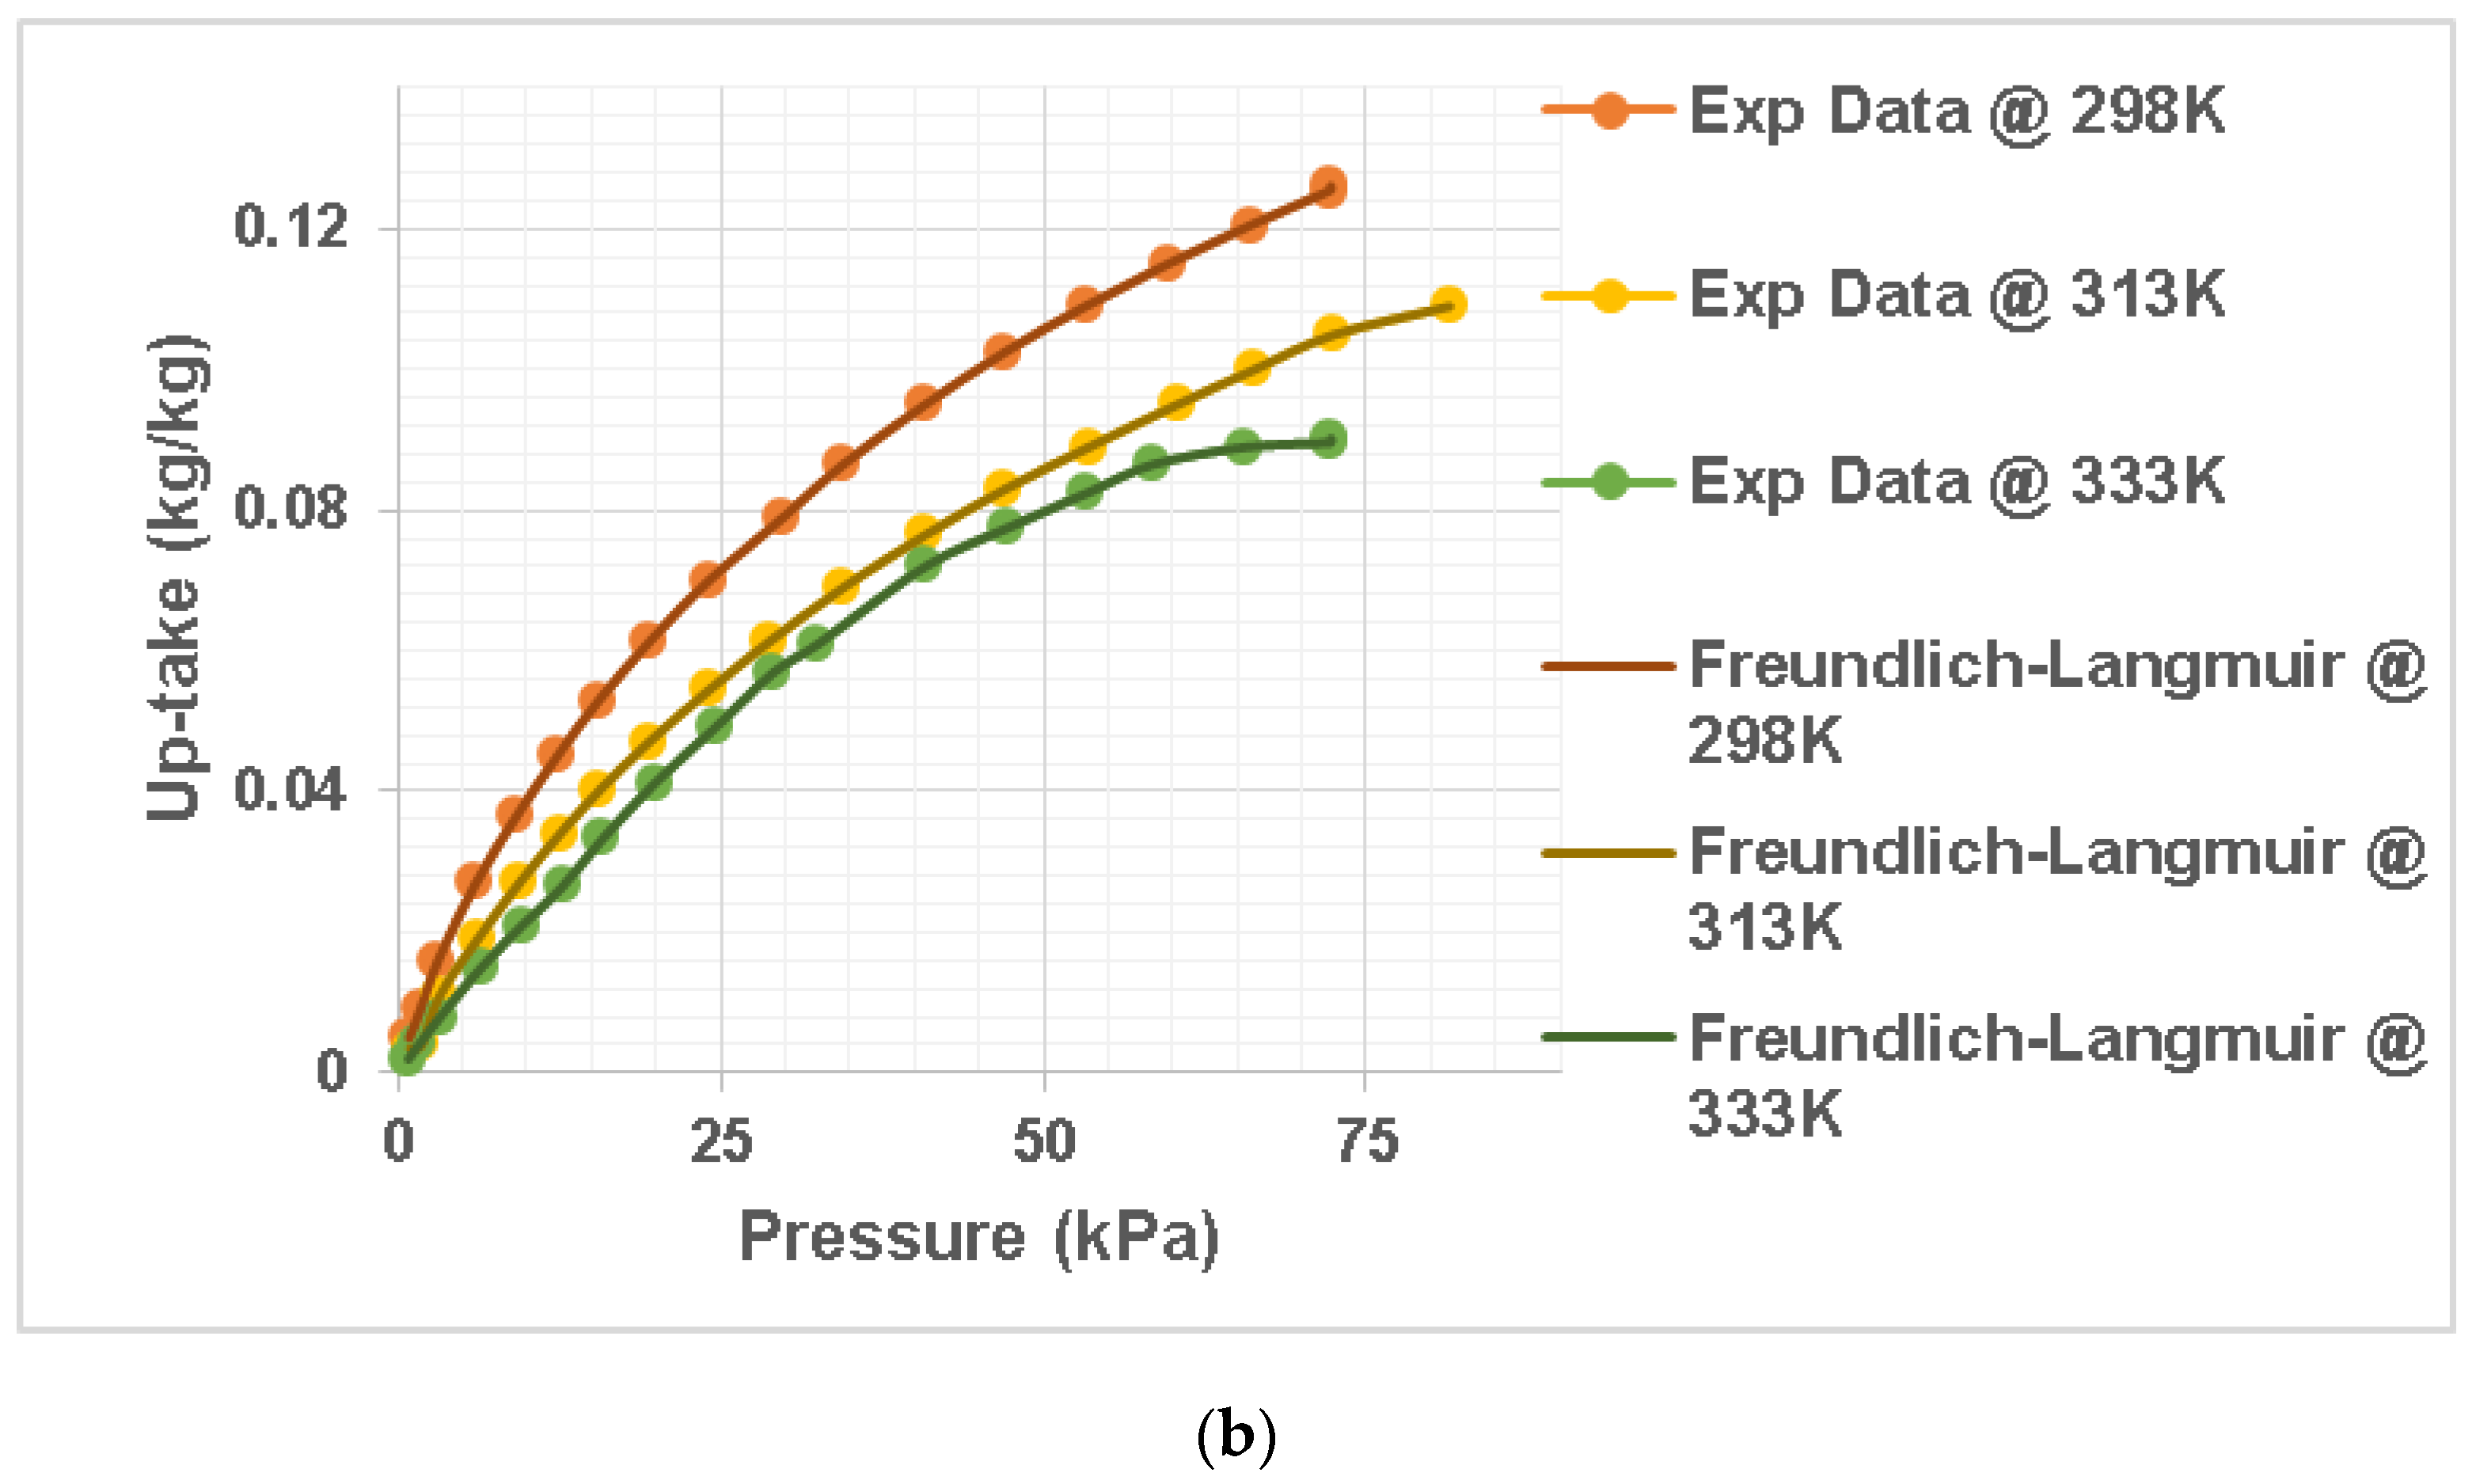
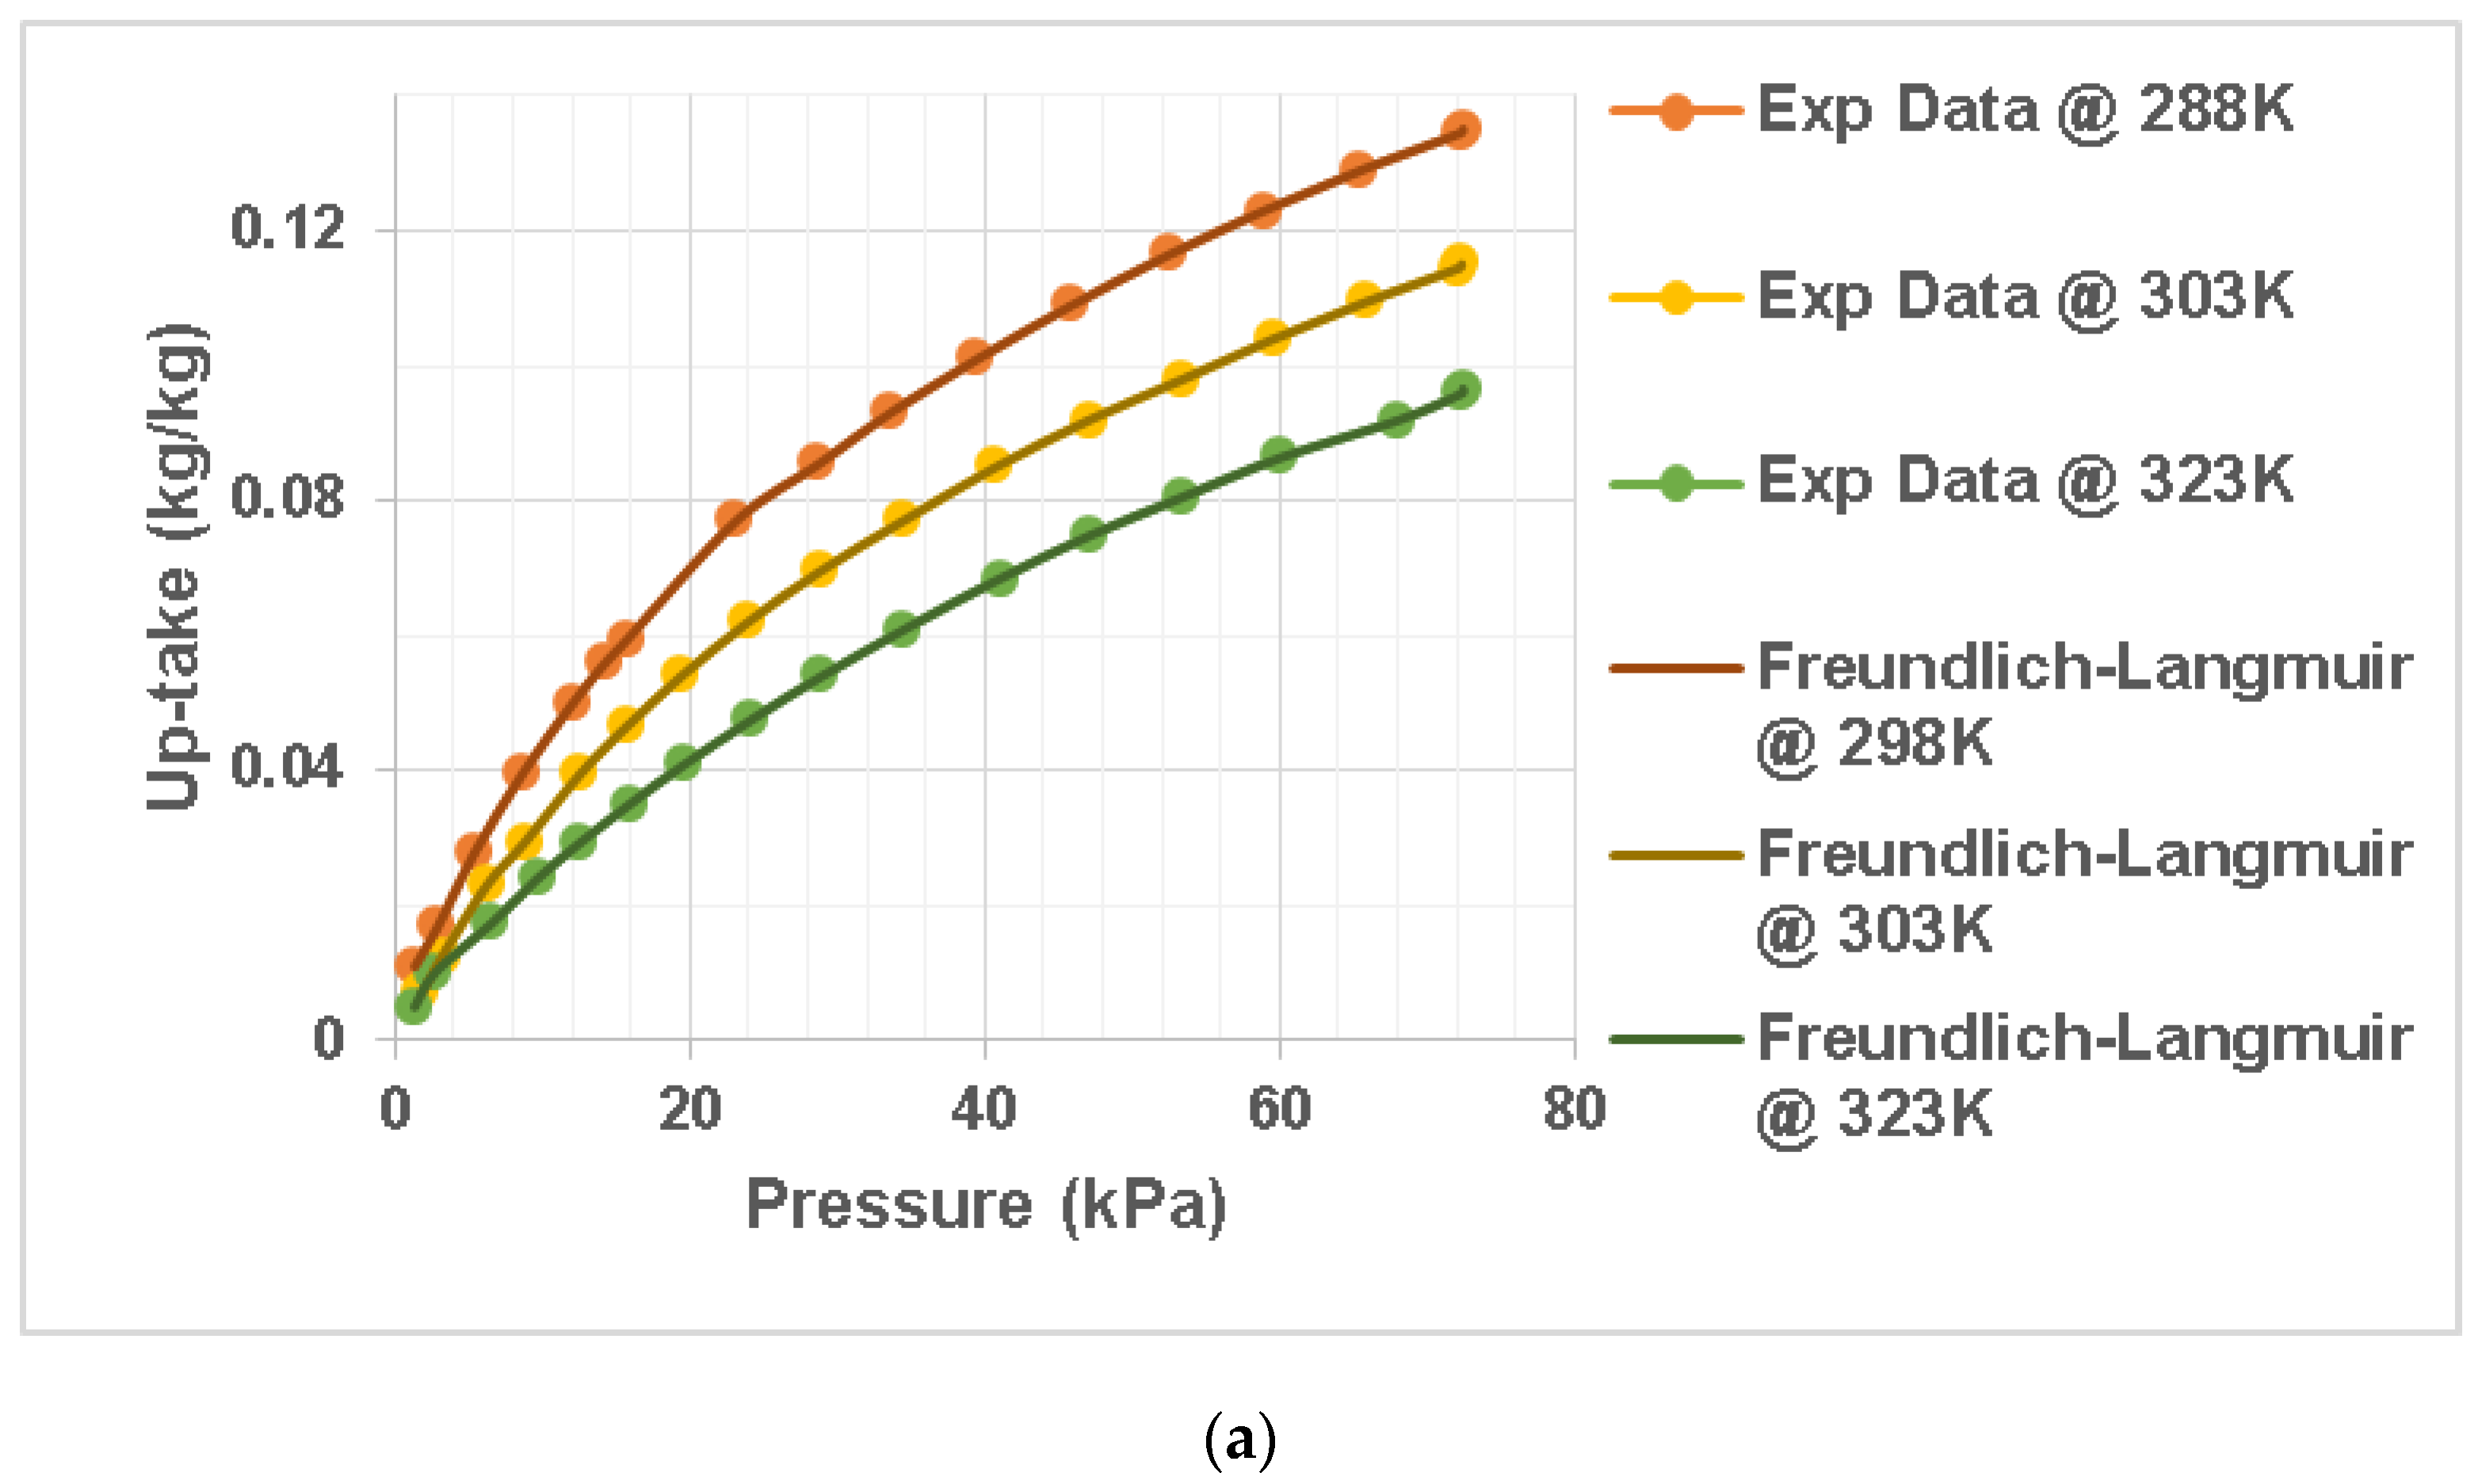
Vapour data from silica gel were extrapolated using the nonlinear prediction model with the Langmuir–Freundlich model for comparing the experimental data to the simulation, using computer software called Origin. Data from the test versus data from the isotherm model were used to demonstrate the suitability of the model equations in
Figure 1a,b. The regression error among experiment and simulation data were calculated with Origin software as well. The graph in
Figure 2 and
Figure 3 demonstrates the final findings. The adsorbate–adsorbent interaction energy was calculated indirectly using adsorption isotherms obtained at similar but different temperatures (T
283 K–333 K).
Data for the six temperatures were extrapolated utilizing Langmuir and the Freundlich nonlinear equation. These six adsorption isotherms were used to calculate the isosteric heat of adsorption (Δ
Hads) using the Clausius–Clapeyron model equation. Adsorption equilibrium data were measured at 283 K, 293 K, 303 K, 313 K, 323 K, and 333 K on silica gel in the pressure range of 0.08 kPa to 73 kPa (
Figure 1). The Langmuir–Freundlich model was used to fit the collected data (Equation (2)) using the Origin program.
Figure 1 shows the quantity of vapour adsorbed on the silica gel, and the results show that as the pressure increased, the vapour uptake increased.
Figure 1 shows the simulation-projected values and experiment results for all models. The vapour uptake adsorbed on the silica gel appears to decrease as the temperature rises. This is because, at greater temperatures, the adsorbed molecules absorb more energy, leading to evaporation [
20]. The models (Langmuir and Freundlich) were also found to be sufficiently accurate in estimating the adsorbed vapour uptake on silica gel, with a regression error of less than 4% at all temperatures used. According to the literature, an advantageous isotherm has a convex shape and reflects a significant amount of adsorbate at a lower pressure [
18].
An unreliable isotherm, on the other hand, has a concave form and high pressure is needed to accomplish cost-effective adsorption. Irreversible adsorption is the pinnacle of the preferred model, with maximal adsorption occurring at very low partial pressures.
Figure 1 presents the recommended curve as stated in the literature. These results for vapour adsorption on silica gel are close to the Langmuir isotherm. After the fit on
Figure 1 was generated from Origin using a nonlinear fit with code relating to Equation (2), the new computed values were generated to form an exponential graph.
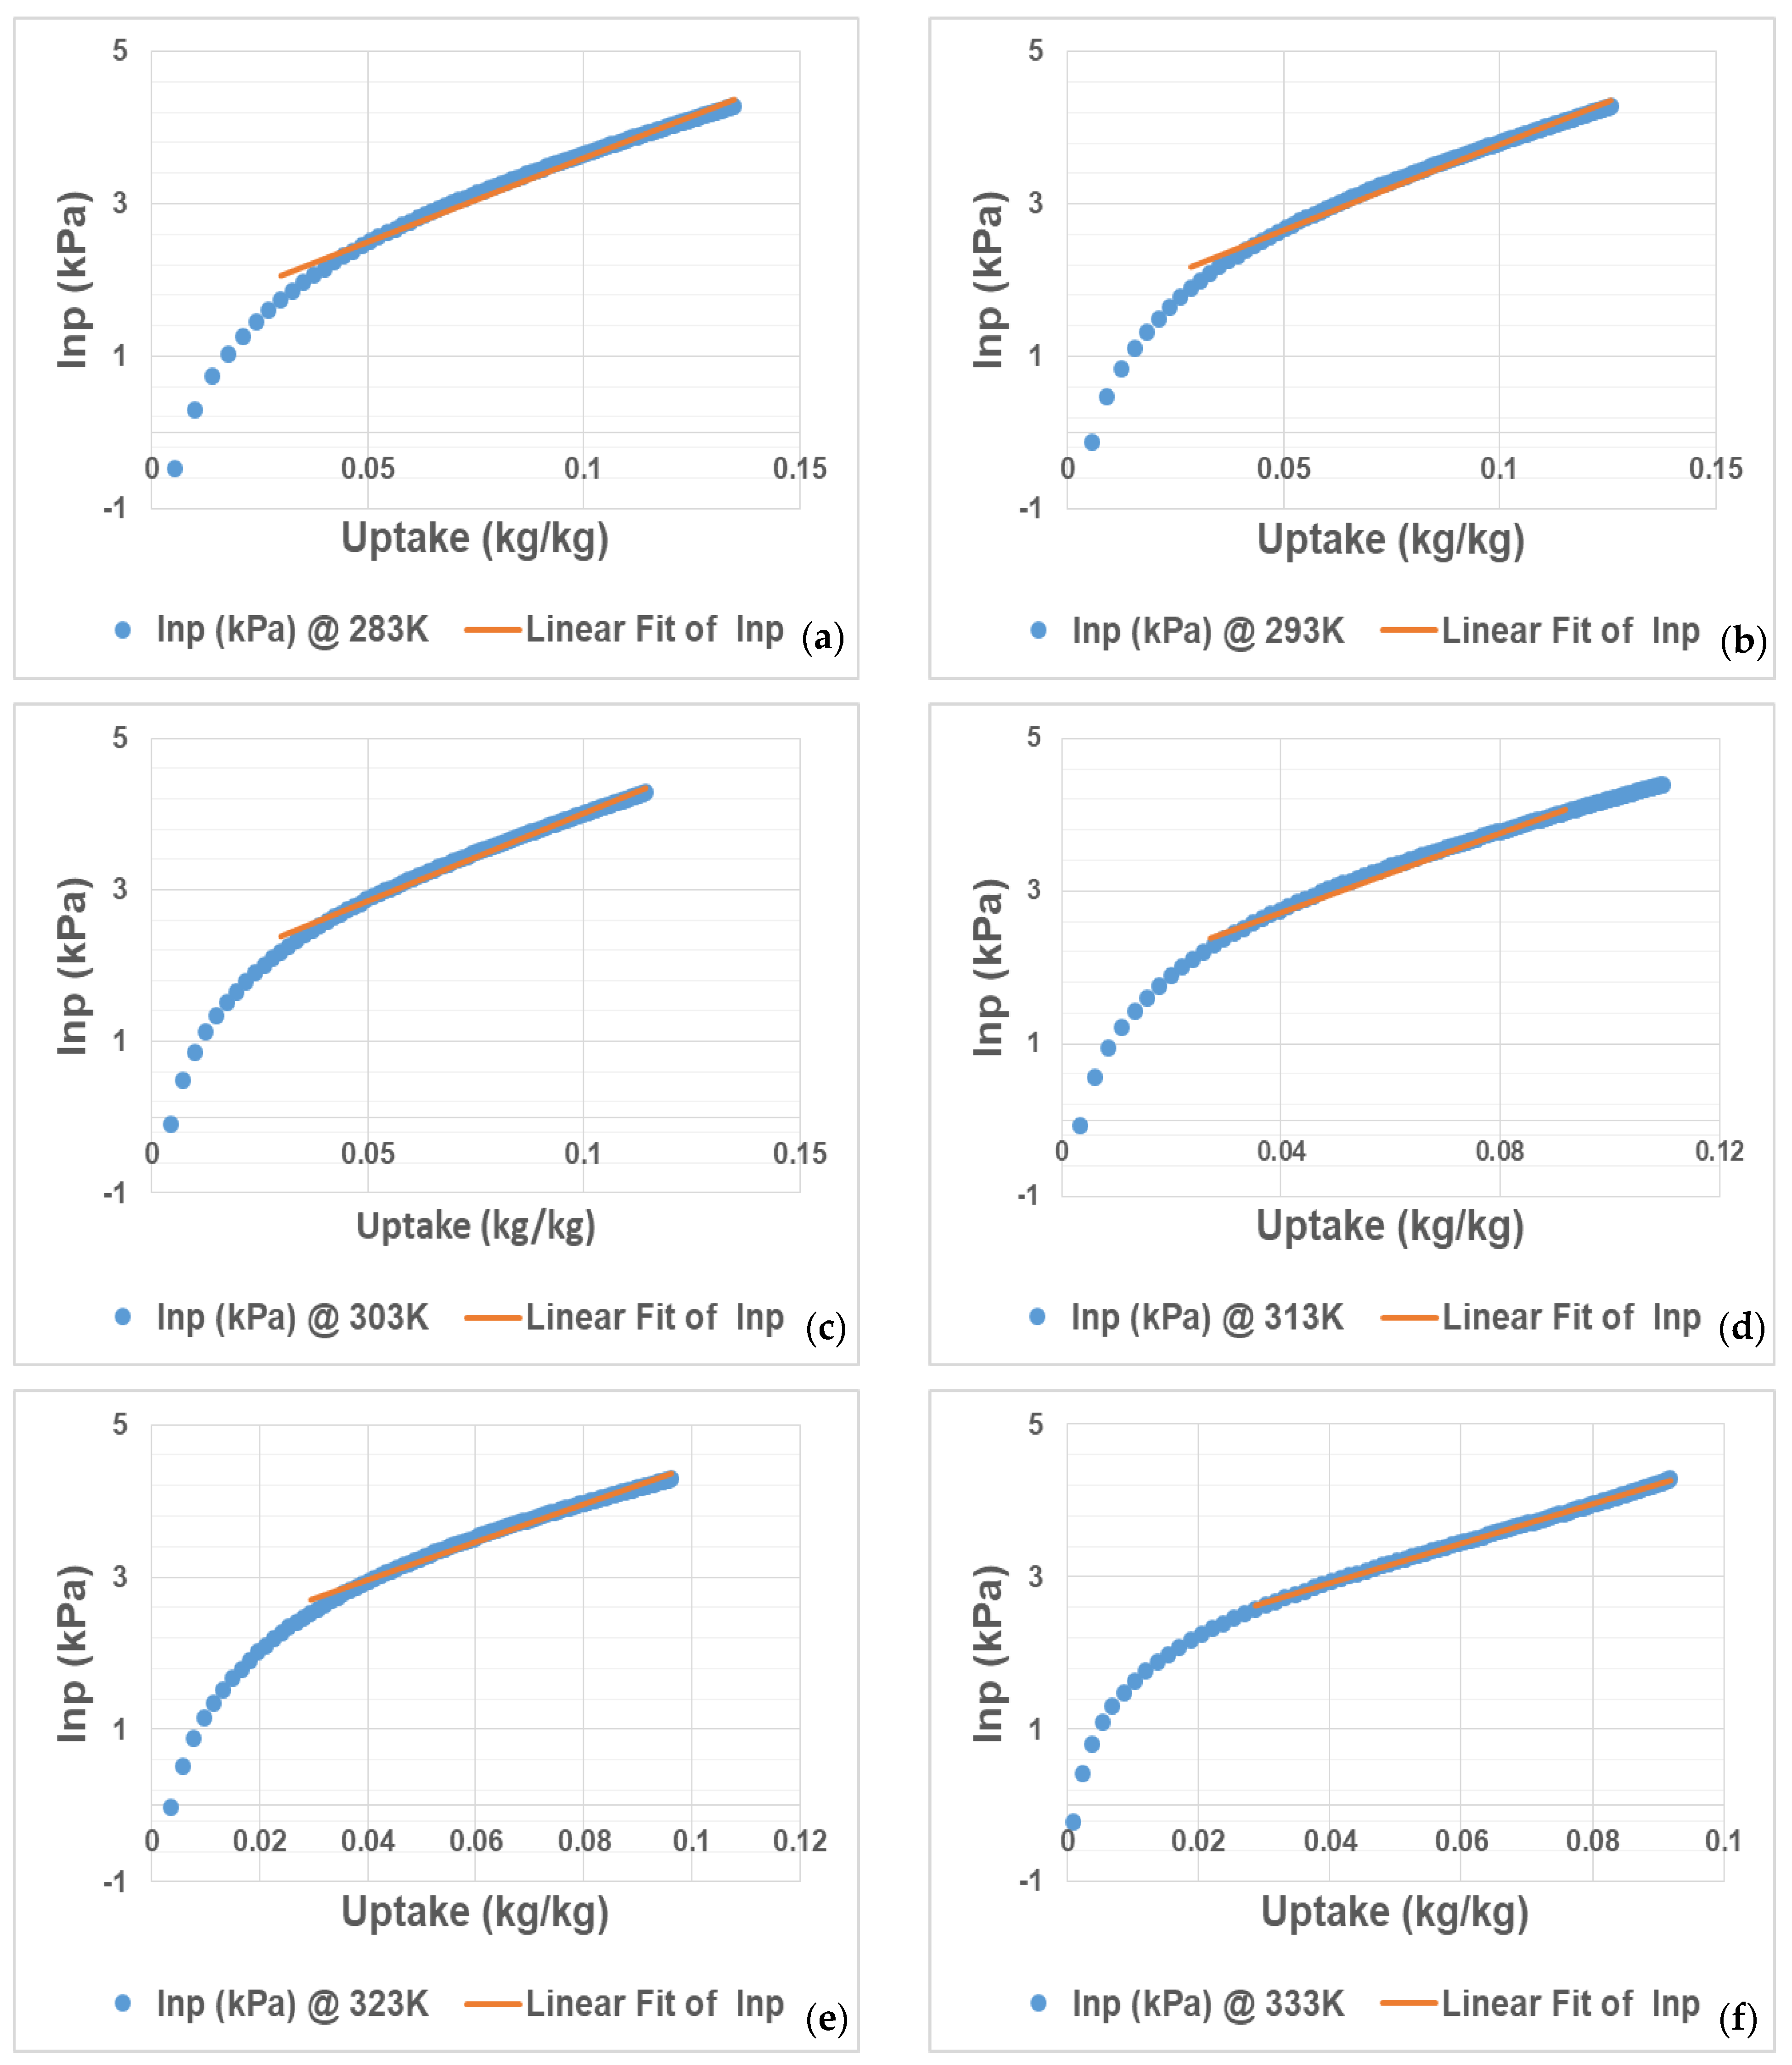
From an exponential graph, Origin software was used to form linear regression using the values of lnp vs. uptake as shown in
Figure 2. The linear regression at six temperatures offers a continuous uptake vs. lnp2 data triples, but only within a narrow uptake area, as demonstrated in the adsorption model of lnp against the uptake plot. Only a few parts of lnp versus uptake can be estimated using a linear regression, as seen in
Figure 2. When compared to the Freundlich–Langmuir fit, the approximation linear regression at six temperatures provides a continuum of uptake in relation to calculated lnp data, but only over a limited uptake region.
The relationship of lnp versus uptake becomes linear throughout a larger uptake range only for gases operating under adsorbents with low affinity. Because of the enhanced contact among the adsorbents and vapour uptake, a linear regression of lnp against uptake is not practicable for adsorbents with high regeneration; hence, the isotherm was fitted using the Freundlich–Langmuir model as indicated in
Figure 1. It is also noted in
Figure 2 that the straight line lies only in a certain region; hence, the 10 uptake loadings are introduced in
Figure 3. The six isotherms were fitted by a linear function as a first approximation, which was then utilized to produce
Hads(
m).
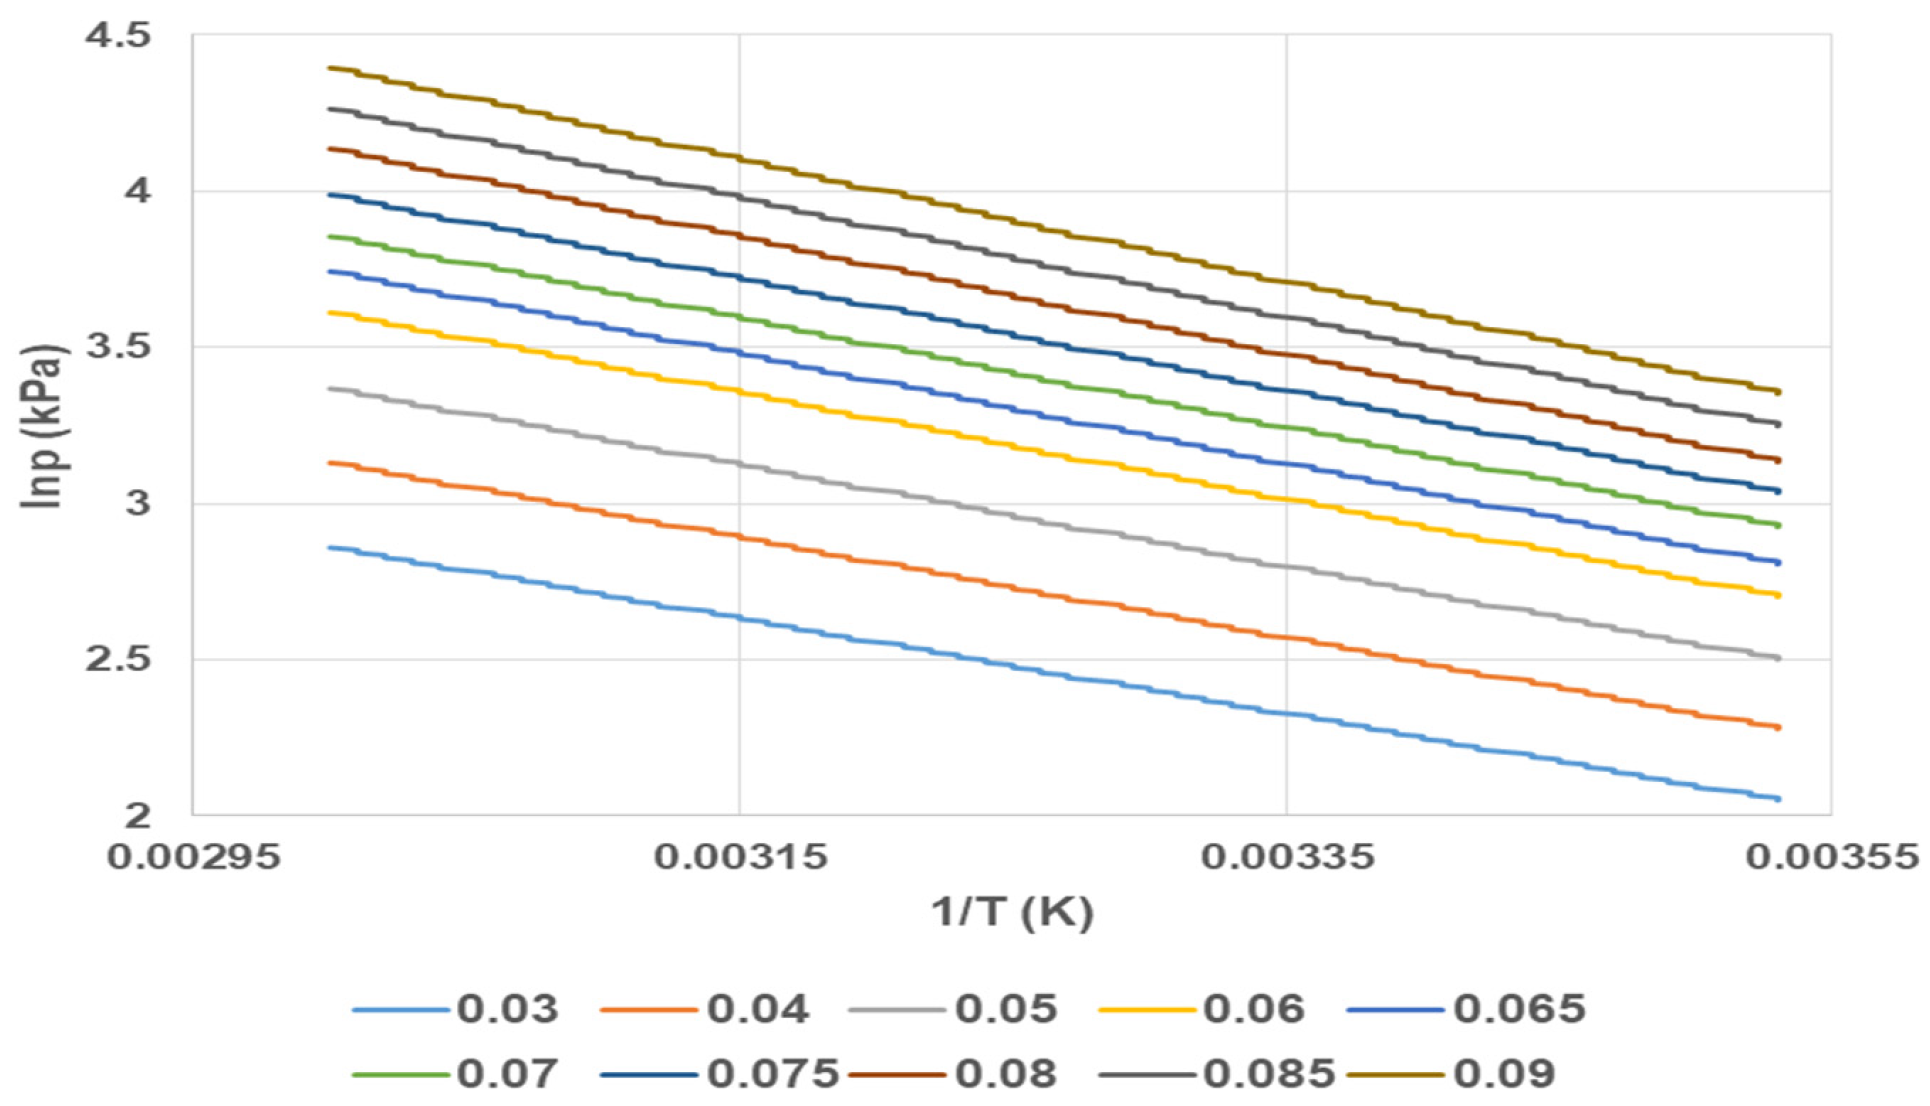
The pressures derived (
PA-
PF) at equal loadings are utilized to calculate
Hads (m). The isosteric heat of adsorption was determined through the graph of lnp vs. 1/
T to form isosteric adsorptions. That was derived from vapour uptake between six temperatures (
TA-
TF), and the vapour uptake vs.
PA-F data triples from the linear regression graph (
Figure 3). The gradient m of the linear regression with six data points at
lnPA-F versus 1/
TA-F, assuming equal loading vapour uptake, provides
Hads (m) according to Equation (5). For didactic purposes, the graph of lnp vs. 1/
T is shown in
Figure 3 with 10 uptake loadings.
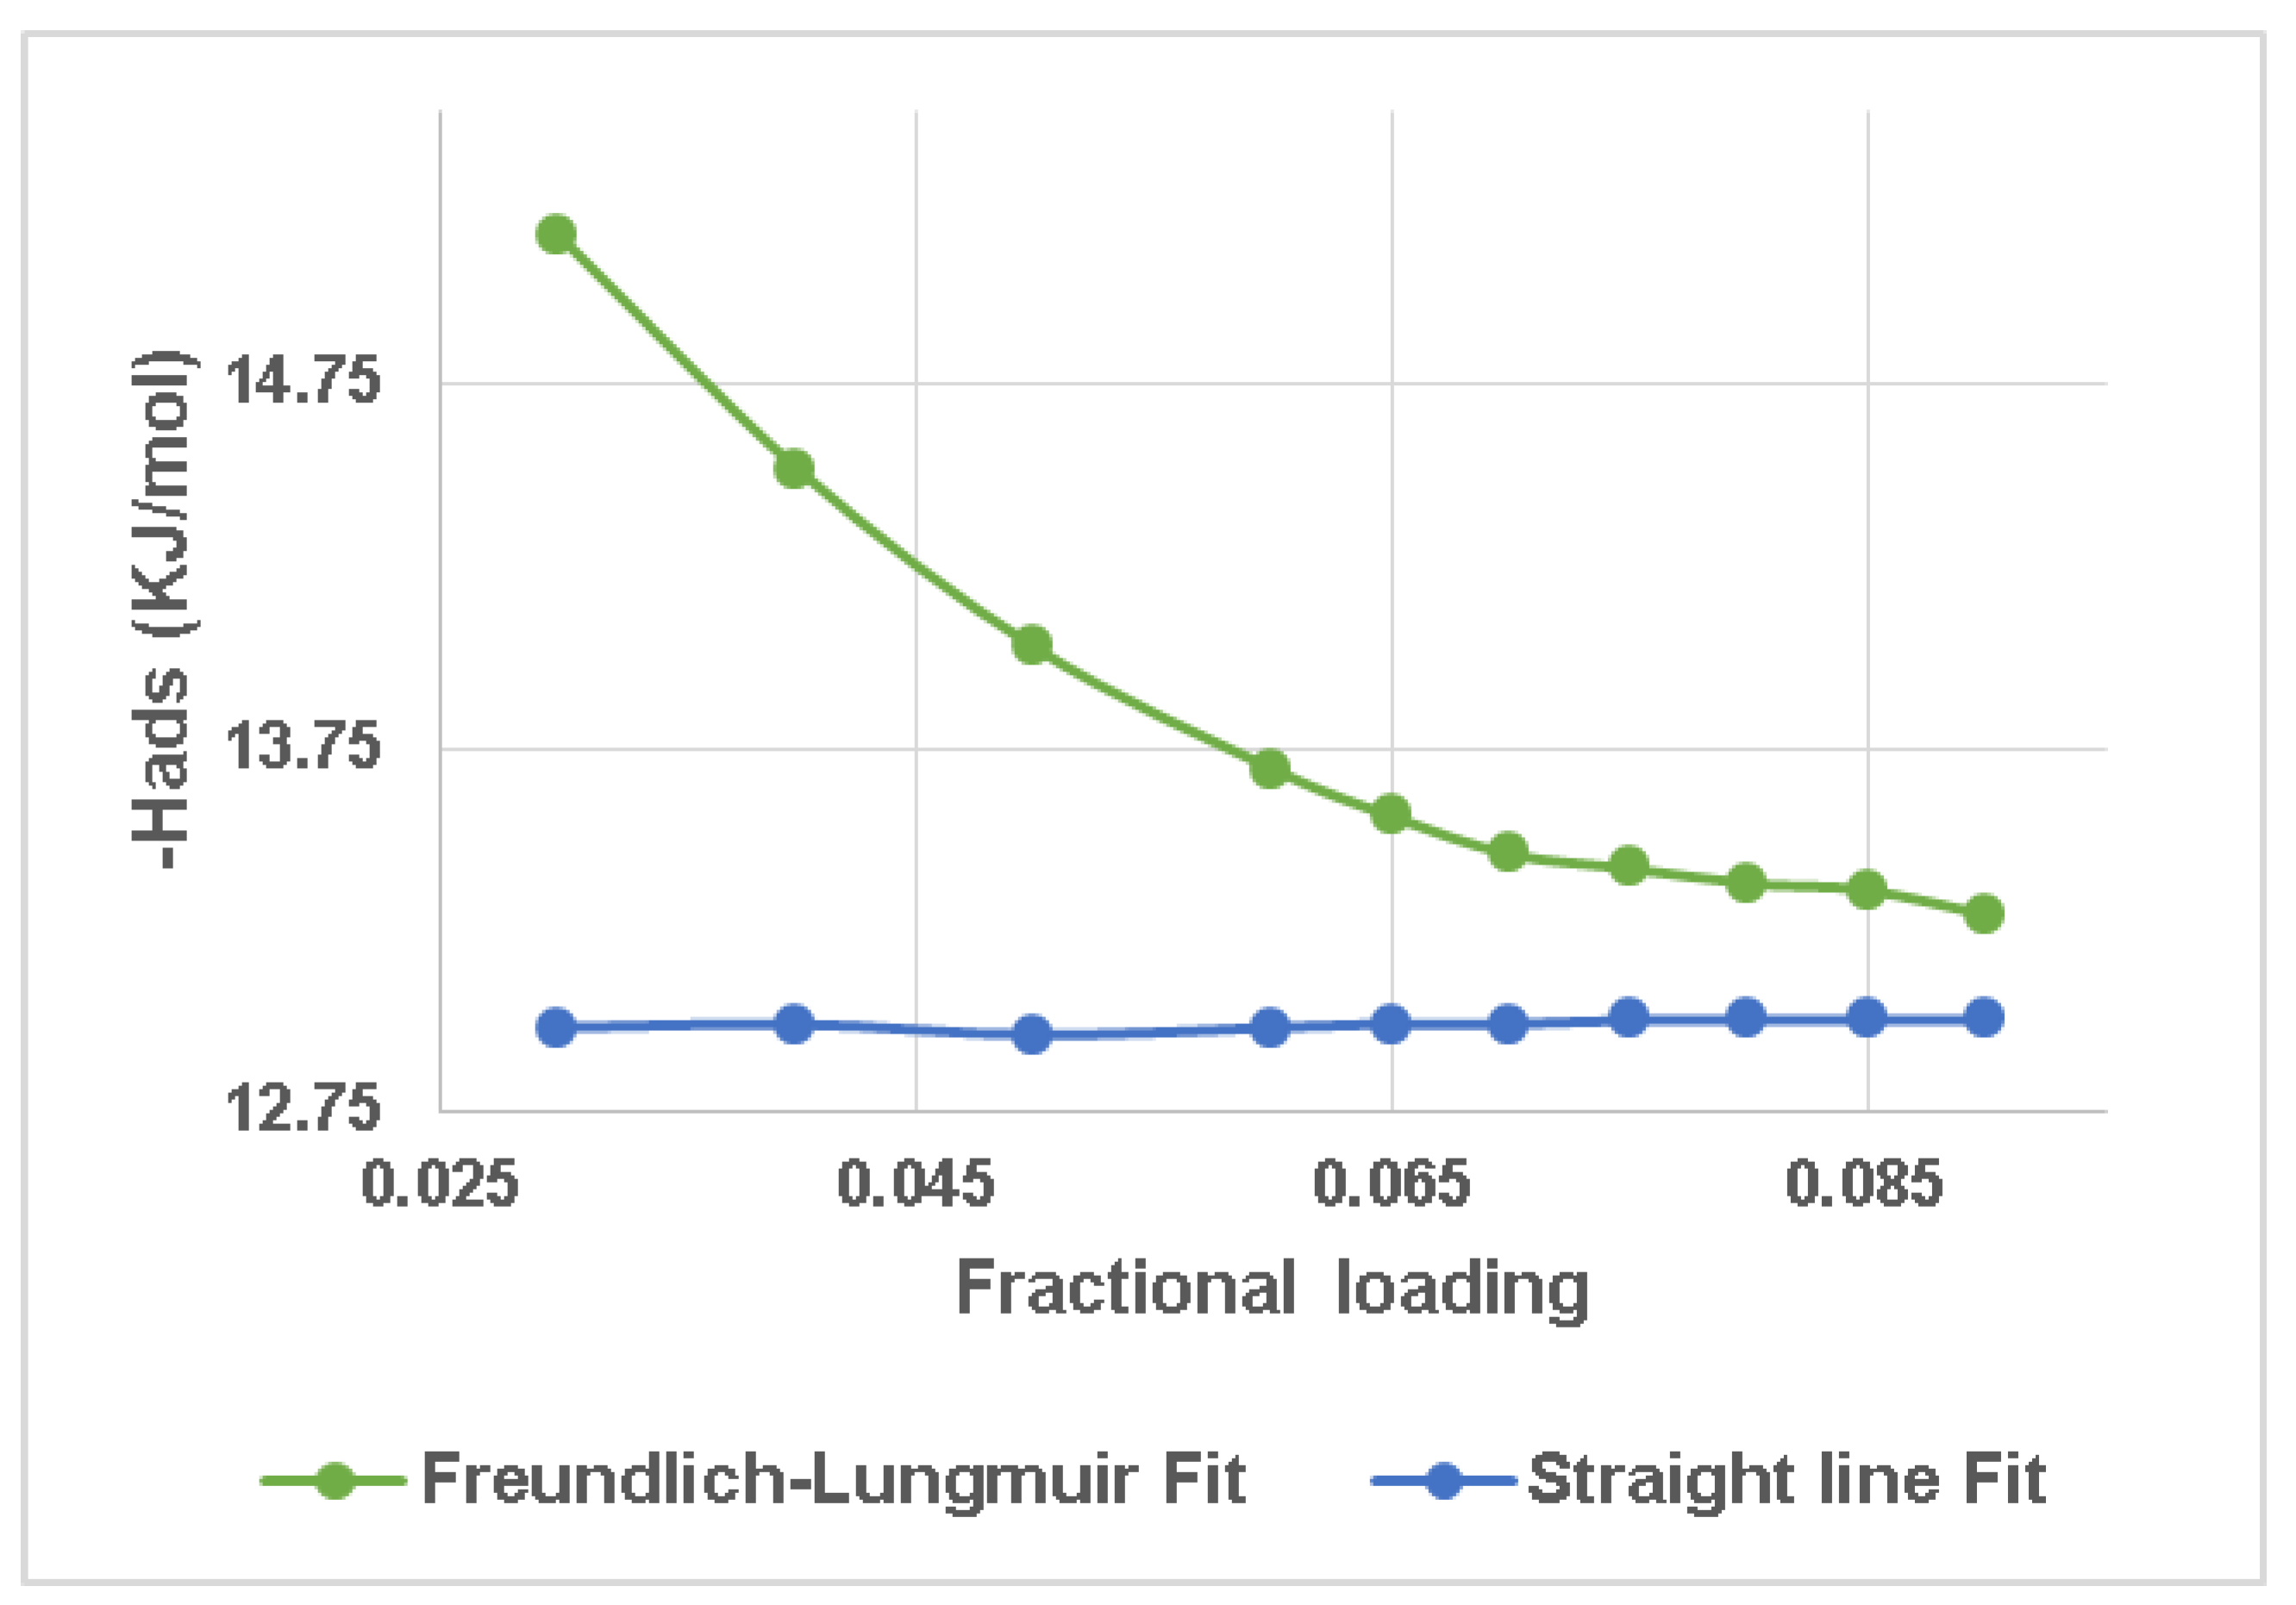
The gradient in
Figure 3 was used to obtain the values represented in
Figure 4. In
Figure 4, the isosteric enthalpy, Δ
Hads, calculated from the Freundlich–Langmuir model, is compared to the linear regression fit of a graph of lnp versus the vapour uptake plot in the range of 10 fractional vapour uptake loadings. For the isosteric enthalpy with greater adsorption, both fit approaches produce identical findings; however, this is not the case in the low-uptake area. The lnp vs. n plot approach greatly underrated
Hads(
m). The gradients of all six linear regression fits in
Figure 3 were almost same, resulting in a special situation of a fixed
Hads unaffected by loading.
In
Figure 4, Δ
Hads explains the degree of the adsorbate–adsorbent energy states. The value is expected to alter with uptake in the process of adsorption. A strong degree among both the adsorbents and vapour uptake explains the high adsorption enthalpy value. At low pressure, pore spaces with the strongest affinity for the adsorbed molecules are commonly saturated. For extremely low loadings, pore gaps were associated with higher (negative)
Hads values, as seen in
Figure 4. This shows that even though the methods followed were different, the values of the Δ
Hads found were in the same region.
The results of the proposed equations using Origin software are compared to the results of the approximation formulas that are highly recommended in assessing gases. The results of the Clausius–Clapeyron-like equations (Equation (4)) provide precise predictions for isosteric temperatures of adsorption with a moderately difference from that derived using the straight line. The approximate equations and software used have the benefit of requiring only adsorption isotherm data, rather than rigorous equations that require additional information, such as the heat of vaporization or the excess enthalpy of mixing.
The basic parameters of any adsorbate–adsorbent system are the adsorption properties. Experimental isotherms for silica gel were derived in this study and were used to develop an adsorption chiller. In comparison to other methods that require many models with multiple steps to be followed to find the isosteric heat, the present study found an improvement in accuracy using measured adsorption data. The observed isotherm data was used to calculate the isosteric heat, which is helpful in deciding which adsorbent to utilize on a reactor bed to obtain a high intensity of engagement between the adsorbate and the adsorbents.


