1. Introduction
Global climate change poses a very real risk to human civilization and natural biosystems. Unmitigated release of GHG emissions remains a major contributor to anthropogenic global warming and as such is the key challenge facing human civilization for the future [
1]. The IEA reported that the global emission of CO
2 in 2020 reduced by 5.8% during the COVID-19 pandemic and this is the largest reduction since the Second World War. This drop in CO
2 emissions is attributed to lockdown in most countries that decreased fossil fuel usage in transportation and other sectors. The European Union has set objectives to systematically reduce its CO
2 emissions by 2020, 2030 and 2050. By 2050, GHG emissions should be reduced by 80–95% compared with 1990. Furthermore, with 80% of total fossil fuel, 20% of these energy resources should come from renewable energy by 2020 [
2]. However, the member states should ensure 10% of transport fuels are renewable energy to reduce CO
2 emissions; hence biomass is an excellent potential source. Biomass being 10% of total world energy, the EU estimated its use to increase by 27% come 2050. Biomass and waste can be exploited as energies through different ways, one being through gasification. Here the carbonaceous material can be converted into syngas. However, the EU believes its large-scale implementation is being hindered by the high cost of investments and transportation.
Qatar plans by 2030 to have 20% of its energy are drawn from renewable sources. By 2016, the country had not substantially reduced GHG emissions, as a submission from Intended Nationally Determined Contribution (INDC), [
3]. Following 2000 the CO
2 emissions in Qatar increased from 24 MtCO
2 to 94 MtCO
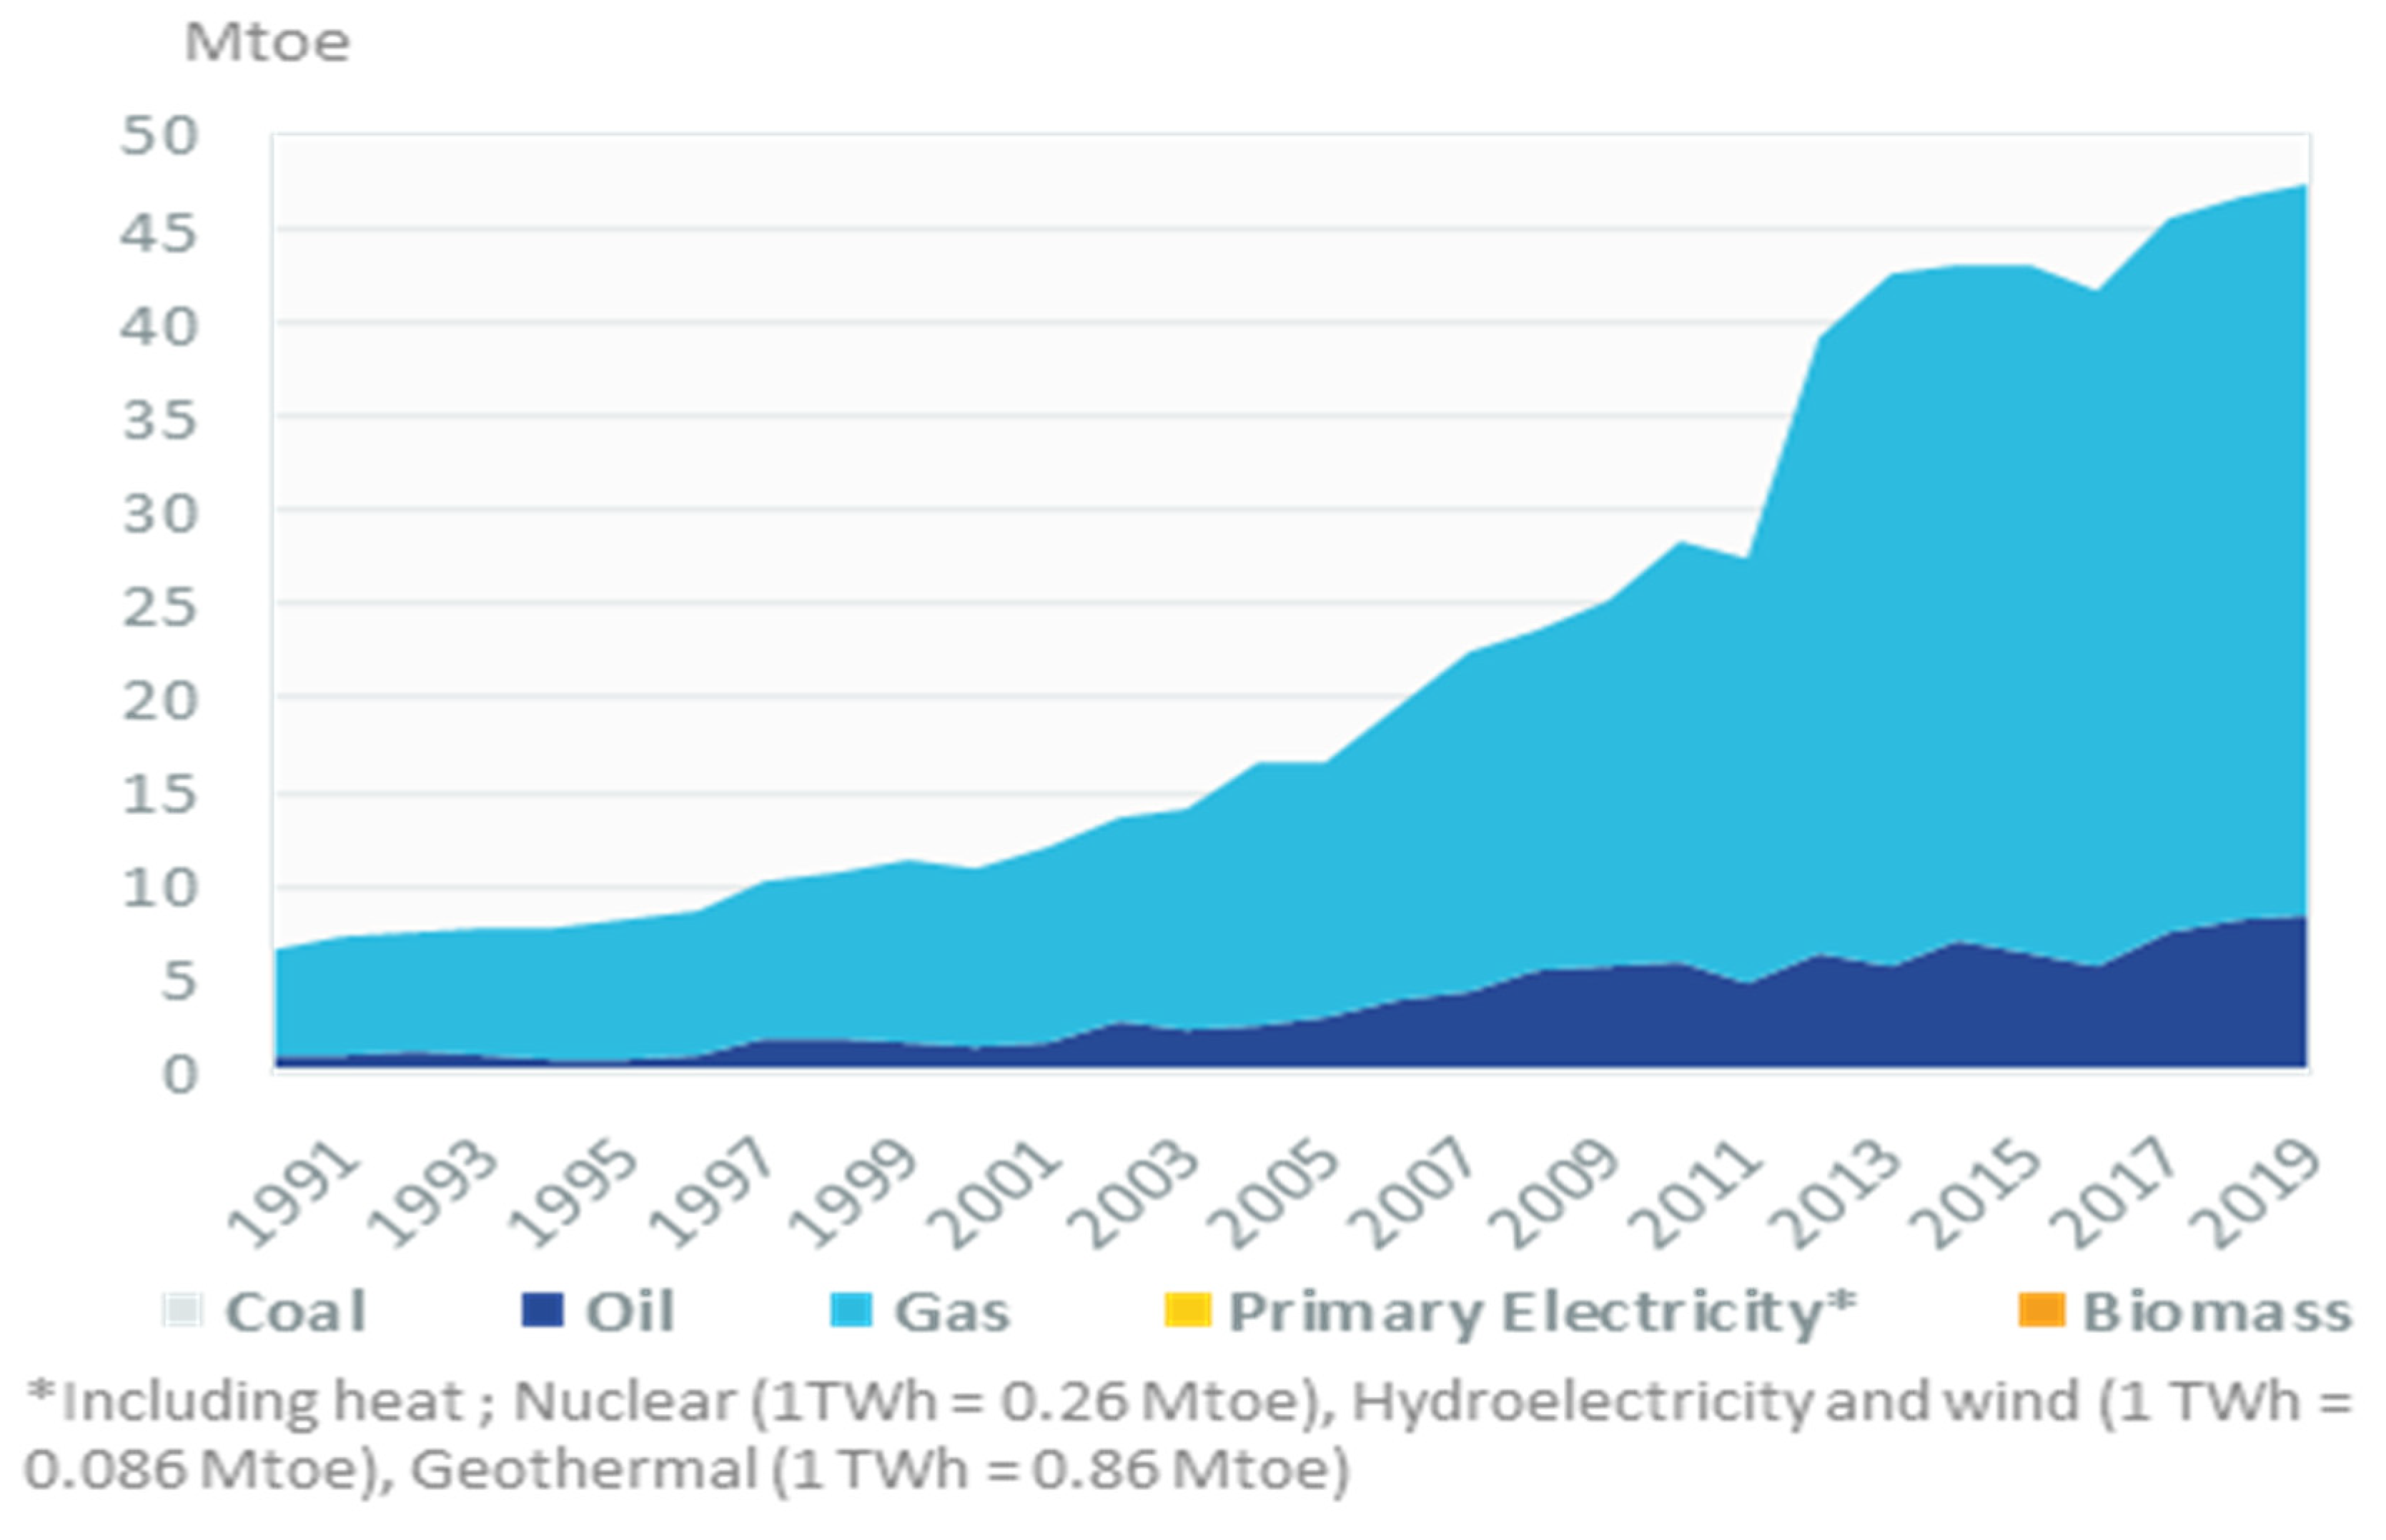
2 in 2019 (+7%/year). In 2017 the country had still not invested in the use of biomass energy and the majority of energy came from fossil fuels, as shown in
Table 1 and
Figure 1, [
4]. In addition,
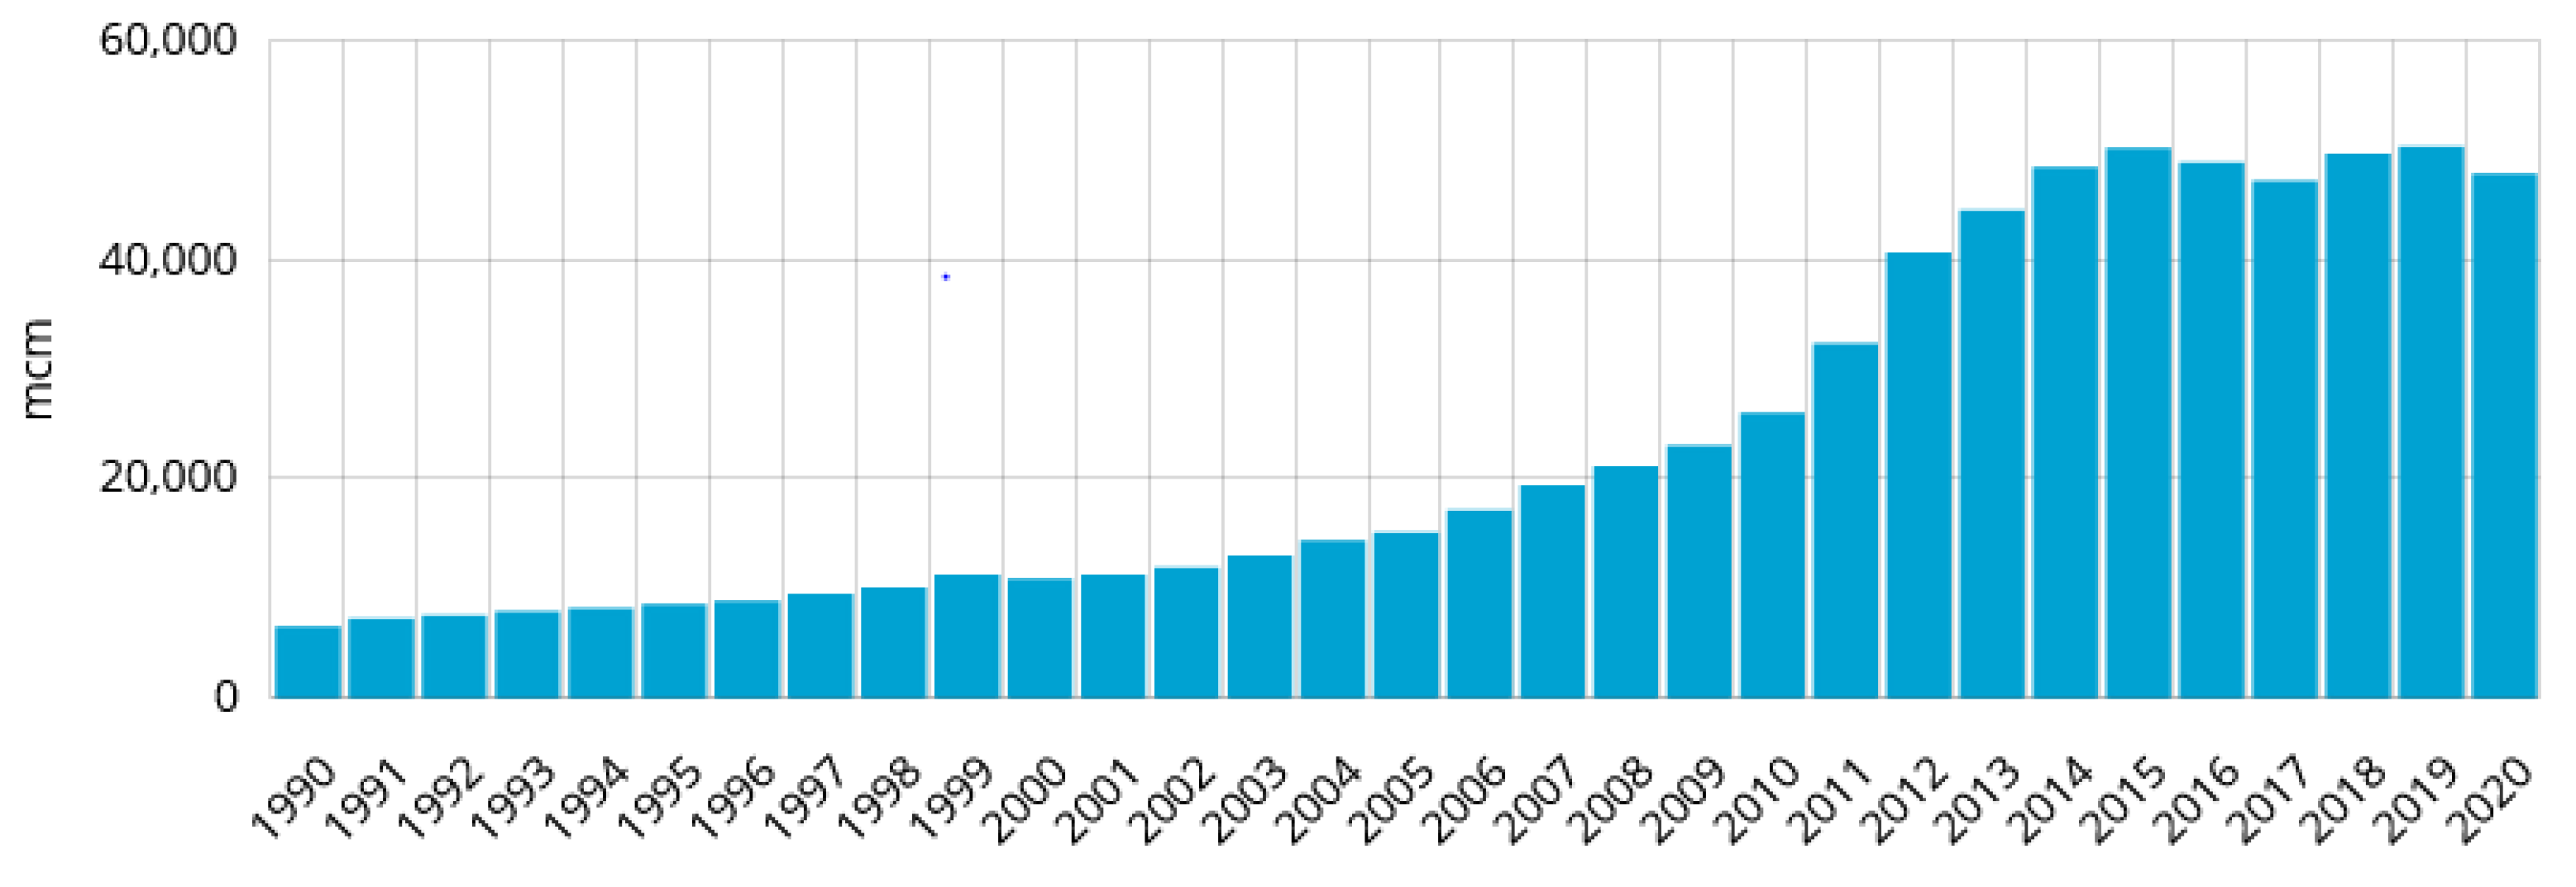
Figure 2 shows Qatar natural gas consumption from 1990 to 2000.
By 2020, the use of renewable energy increased slightly to reduce the countries emissions by 2% [
4]. Furthermore, using biogas energy is believed to reduce greenhouse gas emissions through the transport industry by 60% compared with fossil fuels in the coming years.
Qatar’s location is ideal for using the solar photovoltaic system due to maximum radiation of 2163 kWh/m
2 on average with long sunrise hours, [
5]. The country planned to utilize 2% of its energy from solar power by 2020, and by 2030 electricity production should rise to 20% from this sector. Using solar energy benefits the nation both economically and environmentally. Qatar managed to save an equivalent of 0.24 million tonnes of oil when it used solar energy. The saved gas and oil made a milestone in the extension of the reserves and a reduction in the emissions of CO
2 by 0.51 million tonnes. In 2030, it is estimated the emissions to be reduced by 5.5 million tonnes. Furthermore, solar PV development was estimated to diversify Qatar’s economy and natural resources due to this innovation and entrepreneurship to help transition from carbon to a knowledge-oriented economy.
Moreover, by 2020 Qatar estimated it would have saved the cost of electricity distribution to
$6 billion since it was growing both economy and population-wise, [
5]. These demand response strategies were vital in the reduction of cost investments. However, the adoption of this technique still slags due to the lack of structures needed to regulate renewable energy. Lack of awareness in the sector of Renewable Energy Technology also hinders such projects since energy access in Qatar is not a challenge.
Qatar created the Domestic Solid Waste Management Centre (DSWMC) facility to facilitate the treatment and supply of electricity to its grid system. The centre would turn the domestic wastes into clean energy. This facility marks the first-ever to be created in the Middle East. The organic wastes would also be processed into other raw products to be used in other industries, for example, fertilizer. About 1000 tonnes of other wastes are estimated to be friendly burned within the environment, with less than 5% taken as landfill. To go green also in the use of biogas, the Ministry of Municipality and Environment, in collaboration with Qatar University’s College of Engineering, established another project to produce biogas of biomethane gas to power vehicles. This project was aimed at reducing the overdependence of fossil fuels in the transport sector. Biofuel is also estimated to reduce the cost of operating vehicles [
6]. To minimize emissions from such plants, appropriate measures should be put in place to reduce risks. Filtering gases before being released into the atmosphere, as an example can be applied to such plants in Qatar.
In response to the threat of climate challenge, several renewable energy solutions exist and are being devised to meet globally agreed contributions. One of the renewable solutions is biomass gasification technology to produce low and zero-carbon electricity. Gasification is a thermochemical conversion process in which carbonaceous materials dissociate in an oxygen-starved thermal reactor at high temperatures to form producer synthesis gas (syngas). It is a partial oxidation reaction of solid biomass and produces calorific value between 4–7 MJ/Nm
3 under an air atmosphere suitable for engine, boiler and turbine operation, [
7]. The SRF considered within this paper consists of wood waste, cardboard, paper, polyethylene plastic segregated from MSW and can be used as alternative solid fuel in gasification. The process of air gasification converts SRF into syngas by a thermal reduction process, which can subsequently be used to generate energy in a gas engine [
8]. Syngas is predominantly composed of carbon monoxide (CO), hydrogen (H
2), oxygen (O
2), CO
2, CH
4 and N
2, [
9].
Qatar’s economy and power generation infrastructure are highly dependent on oil and natural gas. In addition to this, electricity generation via thermodynamic cycles requires water cooling towers. Since Qatar does not have natural freshwater sources, it relies heavily on seawater desalination which is inherently an energy-intensive process. The same water, in addition to being used domestically, is used in the agricultural sector [
10]. Therefore, the use of electricity generated by fossil fuels is at the heart of resource consumption.
The growth in population and economic development is expected to increase in future, which will result in greater fossil fuel use unless sustainable development principles are pursued. According to Kahramaa [
11], the national body responsible for electricity, the annual electricity demand in Qatar increases at about 8% per year, which is among the highest growth rates globally. The total energy transmitted in 2016 was 39,667 GWh, an increase of 2.1% over the previous year [
11]. Considering that Qatar currently generates almost all of its electricity using indigenous natural gas, the carbon emissions and environmental impact from this electricity generation are important considerations for the country’s government [
12]. In view of these challenges, the Qatar national vision 2030, as well as the national development strategy, highlights the sustainable use of natural resources as well as preserving the natural environment for future generations as key national objectives [
13].
The environmental statistics of Qatar documents that the current major disposal route is landfilling with composting as a treatment being used to reduce a small amount of organic material. Overall, in the country the total waste arisings is 5,946,811 tonnes for the year 2018, with 77,606 tonnes treated in waste management facilities. This accounts for only 11.9% of the total waste generated in the country being treated, while the rest is landfilled. The largest waste stream in Qatar is currently from the construction sector with total arisings of 3,006,287 tonnes in 2018. Of this, only 50,306 tonnes were processed by the different waste treatment facilities in Qatar, which is only 1.7% of this amount of construction waste.
It is therefore understandable that the Qatar government has set a target of treating 38% of the waste as these current practices are environmentally unsustainable and need to change [
14]. This paper aims to analyze the environmental impacts of SRF gasification on electricity generation using four scenarios:
MSW landfills only with no further treatment (baseline).
Biogas capture from landfill.
Biogas capture and SRF gasification.
Biogas capture and SRF gasification with solar technology.
These scenarios were compared with previously published work by Al-Maaded et al. [
15]. The research herein is the first LCA that considers SRF gasification as an alternative method to reduce MSW landfills and produce sustainable energy in line with Qatar’s national vision 2030.
2. Methodology
LCA has been widely used to assess the environmental impact of biomass gasification and waste treatments [
16]. Different LCA studies for Qatar have been previously conducted and have been published in the literature [
17,
18,
19,
20,
21]. Conducting LCA involves four steps: goal and scope definition, inventory analysis, life cycle impact assessment (LCIA) and interpretation [
22]. To apply this process in Qatar, the environmental impact of the mass and energy flows were acquired from literature, government environmental statistic reports [
23], and the ReCiPe2016 model database [
24]. The environmental impact categories were obtained from ReCiPe2016 based on Qatar specific data and calculated using Microsoft Excel
®. The theoretical framework and the study design were based on the ISO 14040 standard.
This LCA methodology provides a harmonized characterization method for calculating environmental impacts, known as midpoint and endpoint levels. Its predecessor (ReCiPe2008) only considered European characterization factors, while this improvement included presenting the global scale [
25]. Problem shifting is a vital issue that arises with LCA process that encompasses many different process stages, is that improving one stage may worsen another stage along the process chain. Concerning the scope and system boundary selection, the system boundary can be kept small to facilitate data collection, but it may introduce ‘problem shifting’ which needs to be tackled if a credible analysis is carried out. However, expanding the analysis boundary results in problems of availability of data and accuracy of the analysis [
26]. The largest system boundary that could be considered is called ‘cradle-to-grave’ which includes the process of extracting resources from the earth, their transportation, manufacturing and utilization in the process in question, and finally disposal again into the earth. Therefore, the challenge of data collection and availability needs to be considered hand-in-hand with study boundary selection to conduct a reliable LCA [
27].
Out of the 18 midpoint impact factors, only five categories—climate change, terrestrial acidification, marine ecotoxicity, water depletion and fossil depletion—which had significant values relating to Qatar were considered. The endpoint stage was to reduce MSW landfills in Qatar by producing electricity from SRF gasification. In addition, the other impact categories with negligible values were neglected in this analysis due to an abundance of data in the literature; hence it was deemed that further analysis was not necessary. For this study, the midpoint impact factors are calculated based on medium-term (100 years) impact [
25]. The full list of indicators for the corresponding impact categories and associated reference substances is provided in
Table 2.
In order to calculate the midpoint impact category, the following formula was used:
The indicator result refers to the emission of a substance for any process, CF refers to the ReCiPe2016 characterization factor, while the inventory result is the amount of emitted substance per year. For example, the indicator result can be the ‘Global warming’ impact category in kg CO
2-eq, the characterization factors are given in
Table 2, while the subcategory example is CO
2 and CH
4. Finally, the inventory result is the mass flow per year. Application of the above formula to each process, in each scenario results in calculating the impact for each ReCiPe2016 mid-point category per year.
3. Goal and Scope of the Current Study
The scope of this study is limited to the state of Qatar’s geographical boundaries. As a result, the environmental impact of oil and gas exports beyond this boundary is unconsidered. The functional unit used in this analysis is environmental impact per tonne of dry MSW processed. While this is the functional unit, the results are presented for one year based on the waste disposal data from 2018 [
14].
The main assumptions used in this study are as follows:
The system boundary starts when the MSW is collected and delivered to the waste management plant (be it landfilling or further processing). The transport emissions from the city to the landfill site are not considered in all scenarios due to no relevant data available in the literature for Qatar. Therefore, it is more sensible to focus on the different environmental impacts associated with MSW processing, and as each scenario considers the transportation emissions will be nominally the same, so the comparison between all scenarios will be more reliable.
According to Al-Maaded et al. [
15], the bulk of the MSW comprises of paper and plastic. Glass and metals comprise 13% of the MSW, which have not been considered in this study. To conduct the analysis, a comparison has to be made between different scenarios within the case study goal and system boundary. Therefore, the goal of this analysis is to quantify the reduction in environmental impact caused by the implementation of MSW treatment to produce SRF for gasification technology; variables other than the additional waste treatment are kept constant. In this way, a certain improvement upon the baseline scenario can be compared objectively with the baseline case. Additionally, the baseline is selected to represent the actual MSW treatment situation in Qatar.
The following scenarios are defined for comparison:
Baseline: In this scenario, MSW landfilling only with no further treatment. The wastes are buried in a controlled environment known as a landfill [
28]. The organic fraction of wastes in the landfill decompose under anaerobic conditions, releasing landfill gas, also known as biogas that mainly comprises 58%
, and 41%
, which has an environmental impact and is accounted for in the baseline scenario [
29].
Scenario 1: In addition to the baseline, this scenario adds biogas capture to the landfill. In this case, about 50% of the biogas is collected, treated and burnt to generate electricity, releasing only CO
2 to the environment. The remaining 50% is either burnt in flares or released into the atmosphere [
30].
Scenario 2: In addition to the technologies deployed in Scenario 1, this scenario adds the production of SRF to generate electricity via air gasification. According to Al-Maaded et al. [
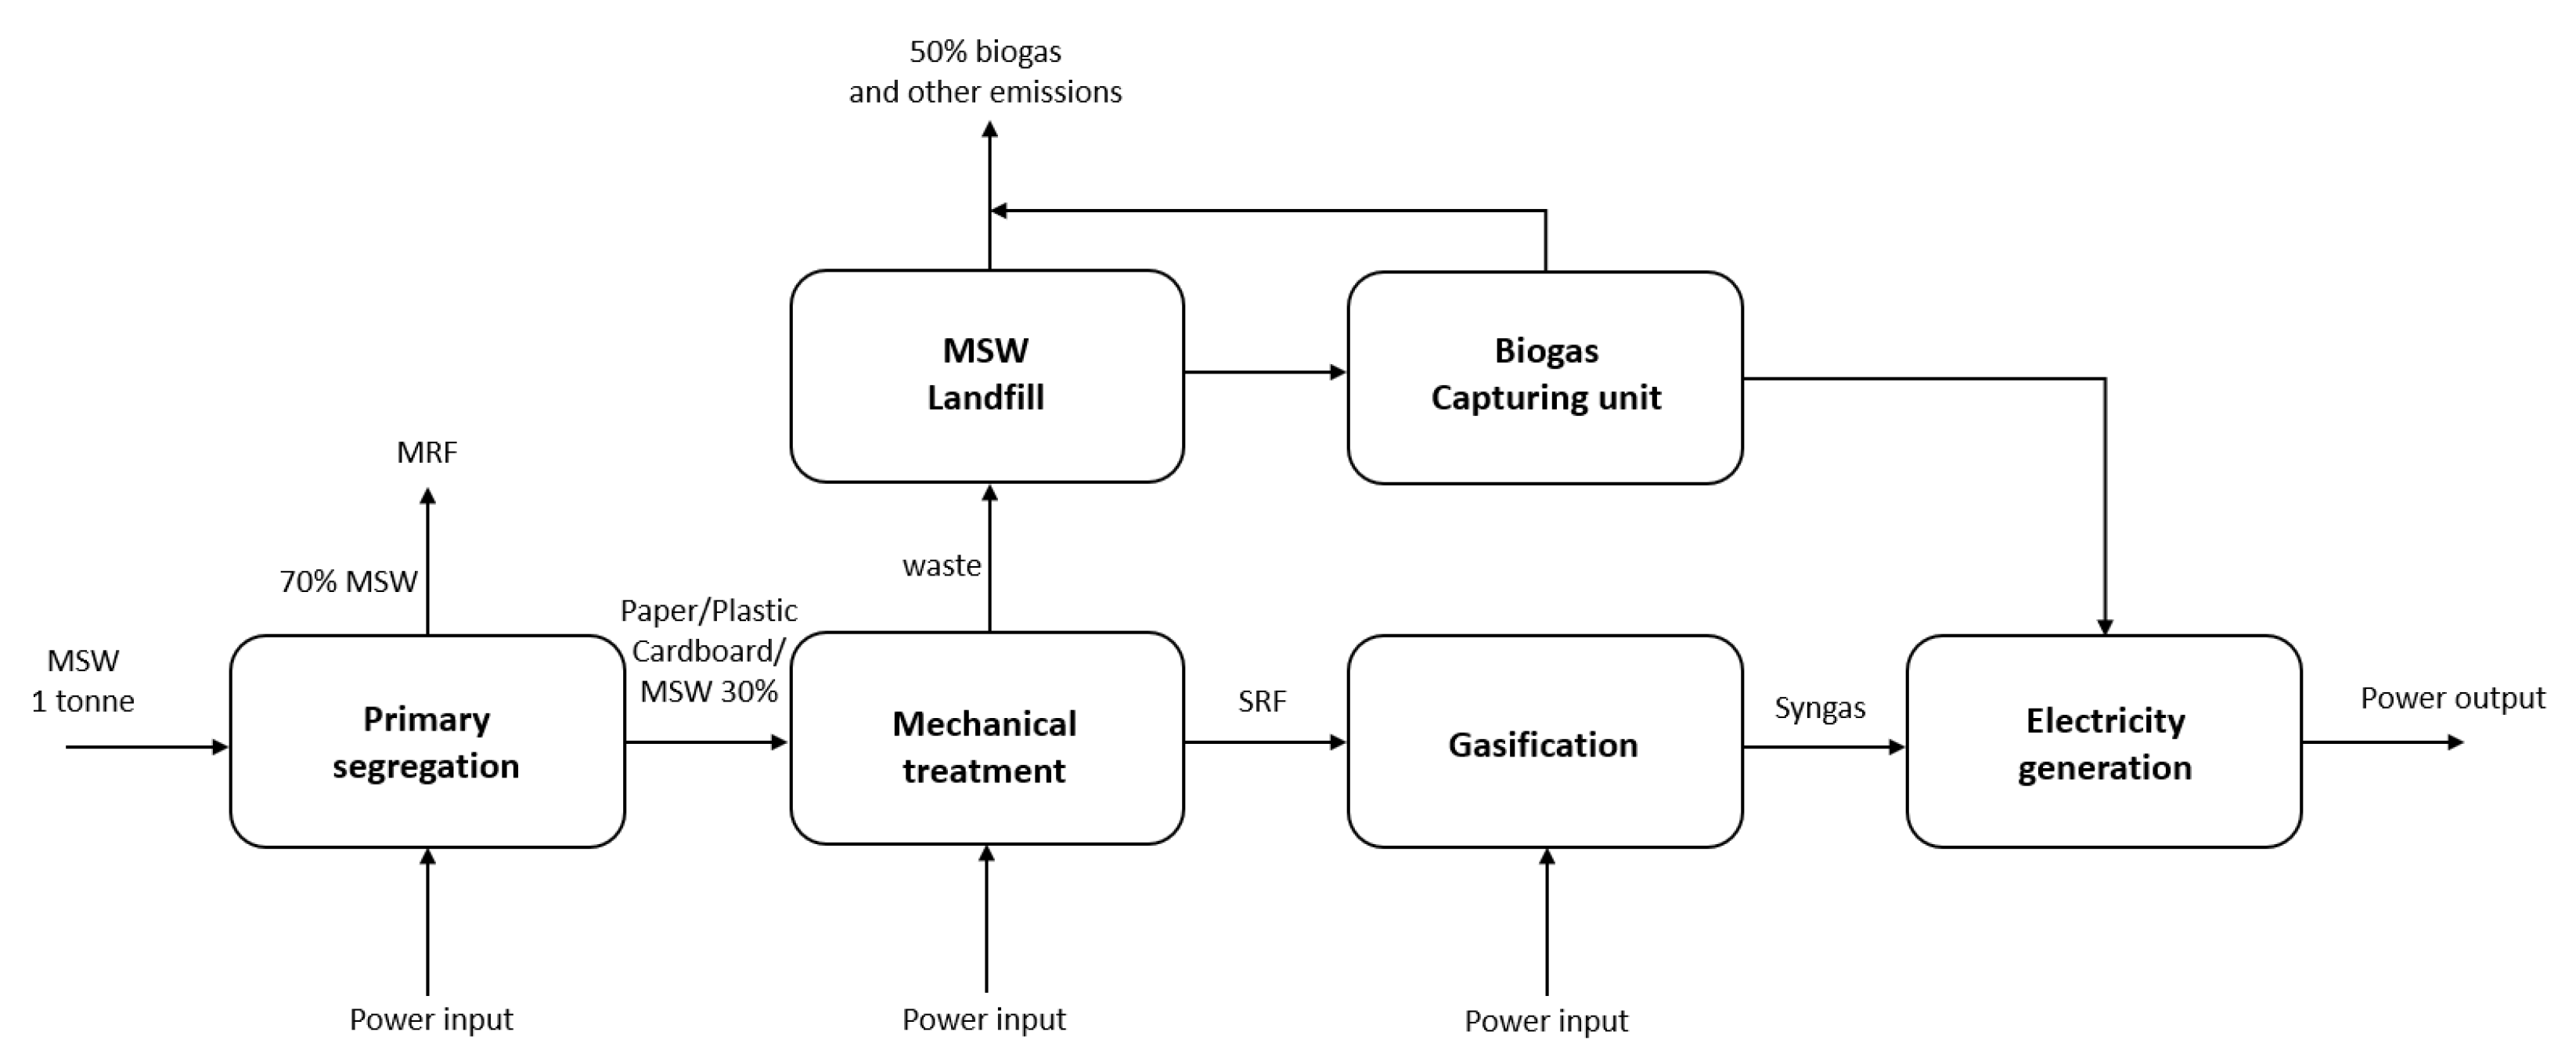
15], the MSW in Qatar has paper and plastics that equate to 25–30% of the total waste. As a result, this MSW can be treated to produce SRF for gasification to generate electricity with lower environmental impact while reducing the need for landfill as shown in
Figure 3. The treatment process starts with the incoming MSW to the primary material recovery facility (MRF), where separation and segregation of MSW into different categories can be performed, for example glass, plastics, paper, metals and cardboard. After that, the mechanical treatment unit shreds of waste to produce SRF pellets, while other trash that is not suitable for gasification at this stage is sent to a landfill. Then, the SRF is used as a solid fuel in air gasification to produce syngas and generate electricity. In addition, supply the power input to MSW treatment stages (primary, mechanical) and SRF air gasification unit. Finally, the organic residue part (70% of the MSW) is handled in the secondary MRF for further processing.
Scenario 3: In addition to Scenario 2, here the electricity used by the MSW treatment processes in
Figure 3 (power input) is supplied by solar PV with air gasification technology instead of using electricity from syngas combustion. It is assumed that electricity generated from the solar PV with gasification produces similar CO
2 emissions from the thermal treatment of the SRF process in Scenario 2. However, the solar plant size and Qatar climate are the significant challenges in this process.
4. Inventory Analysis
MSW continues to grow due to increasingly wealthy lifestyles and continuing industrial and commercial development globe-wise. Biodegradable MSW, such as food waste, undergoes a series of complex biochemical processes which happen inside the landfill, resulting to waste decomposition, which in turn leads to the emission of biogas and the draining of material from the landfill. Though there is a global embrace of MSW, its challenges have encouraged the development of standby strategies to convert waste to energy. Despite the availability of various ways, gasification has been proposed as a superior and efficient technology. The treatment process of MSW in this study has followed the method provided by Abduli et al. [
31], and listed in
Table 3. This LCA process is mainly based on the work done previously by Al-Maaded et al. [
15], Andric et al. [
20], Huijbregts et al. [
30], Cherubini et al. [
29] and Abduli et al. [
31]. The landfill statistics for 2018 were obtained from the Planning and Statistics Authority (2017) [
20]. The MSW is treated, converted into compost, and a significant portion is landfilled. This landfilling is associated with environmental emissions from the mass and energy flows of the process [
31]. These practices and data were taken for the baseline and MSW processing proposed in Scenarios 1–3 [
15,
31].
The impact of depositing plastics in the Qatari context has been quantified by Al-Maaded et al. [
15] as 8 kg CO
2 eq. (GWP 100 years), 7.8 kg DCB eq. (human toxicity potential CML 2001), 0.15 kg Sb eq. (abiotic depletion) and 0.029 kg SO
2 eq. (acidification potential CML 2001). Paper and plastic account for 25% of total MSW in Qatar; the MSW processing proposed in Scenarios 1–3 is based on this number [
15]. Luz et al. [
32] provide the energy and mass flow data of SRF production from MSW. It is important to note that while the baseline scenario is not associated with significant electricity usage, the alternative scenarios generate electricity that offsets grid supply. As the grid electricity is generated using indigenous natural gas with associated environmental impact, alternative scenarios to the baseline reduce these carbon emissions by offsetting this grid electricity. The energy and mass flow based on 1 tonne of MSW per hour have been assigned to
Table 4. For the current case, the caloric value of SRF air gasification is 5.8 MJ/Nm
3 and the combined cycle gas turbine (CCGT), 400 kg CO
2 eq./MWh, are used to generate electricity [
17,
23]. Qatar-specific impact characterization factors are taken from the ReCipe2016 database are presented in
Table 5,
Table 6 and
Table 7.
6. Results
Corresponding to the life cycle inventory, a total of five environmental impact categories were recorded, as described in the methodology. For the baseline case, the environmental impact is presented in
Figure 4. As can be seen in
Figure 4, clearly the environmental impact of climate change as a result of CO
2 emission is magnitudes higher than the other four categories. The results show that marine ecotoxicity can be considered negligible when compared to the other categories.
Figure 4,
Figure 5 and
Figure 6 present results for the environmental impact categories with the three largest magnitudes. Clearly, a significant reduction in all these three categories is observed in Scenarios 2 and 3 for the SRF gasification case. Terrestrial acidification however showed no change in all four scenarios.
Based on the previous work on solid waste processing in Qatar, Al-Maaded et al. [
15] estimated the climate change impact to be 8 kg of CO
2 emissions per 10 kg of plastic waste processed, while the results in this study translate to 5 kg of CO
2 emissions per 10 kg of MSW processed, the baseline of this study uses general dry MSW while Al-Maaded et al. [
15] only considered plastic waste. In addition, in the current study the updated Recipe2016 and MSW landfill data were used. These two reasons may justify the lower climate change impact as compared to Al-Maaded et al. [
15] for the baseline.
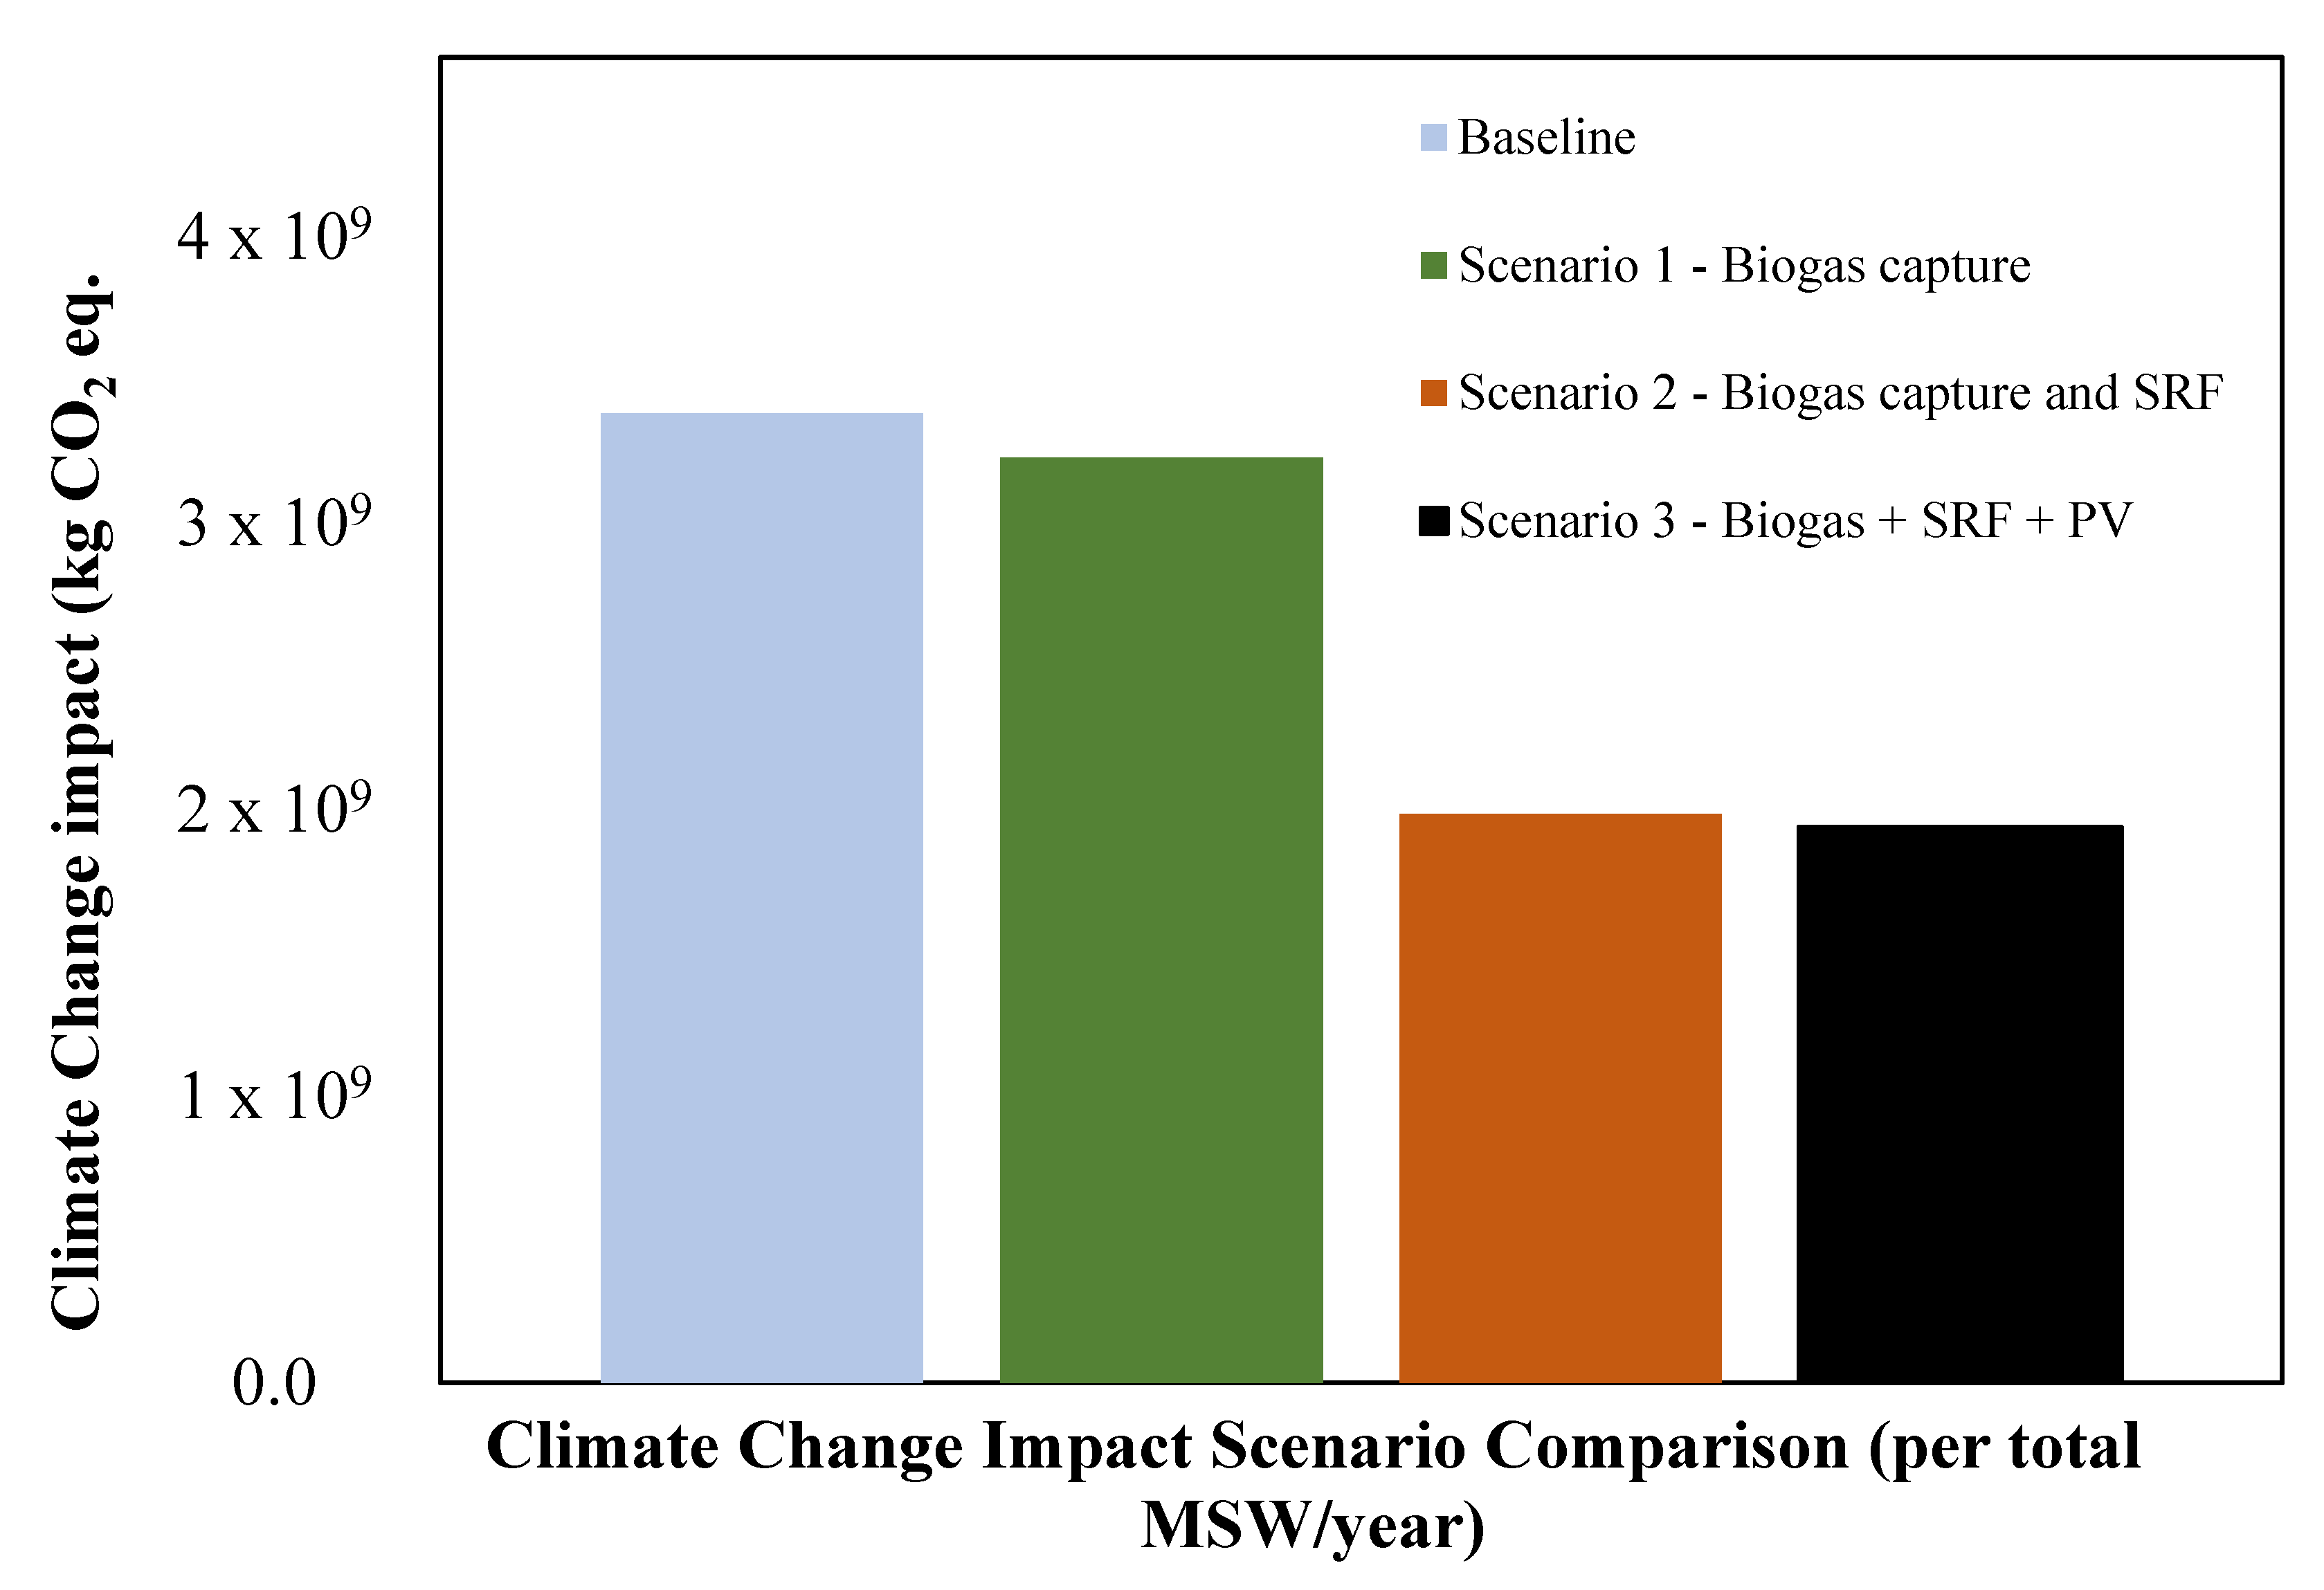
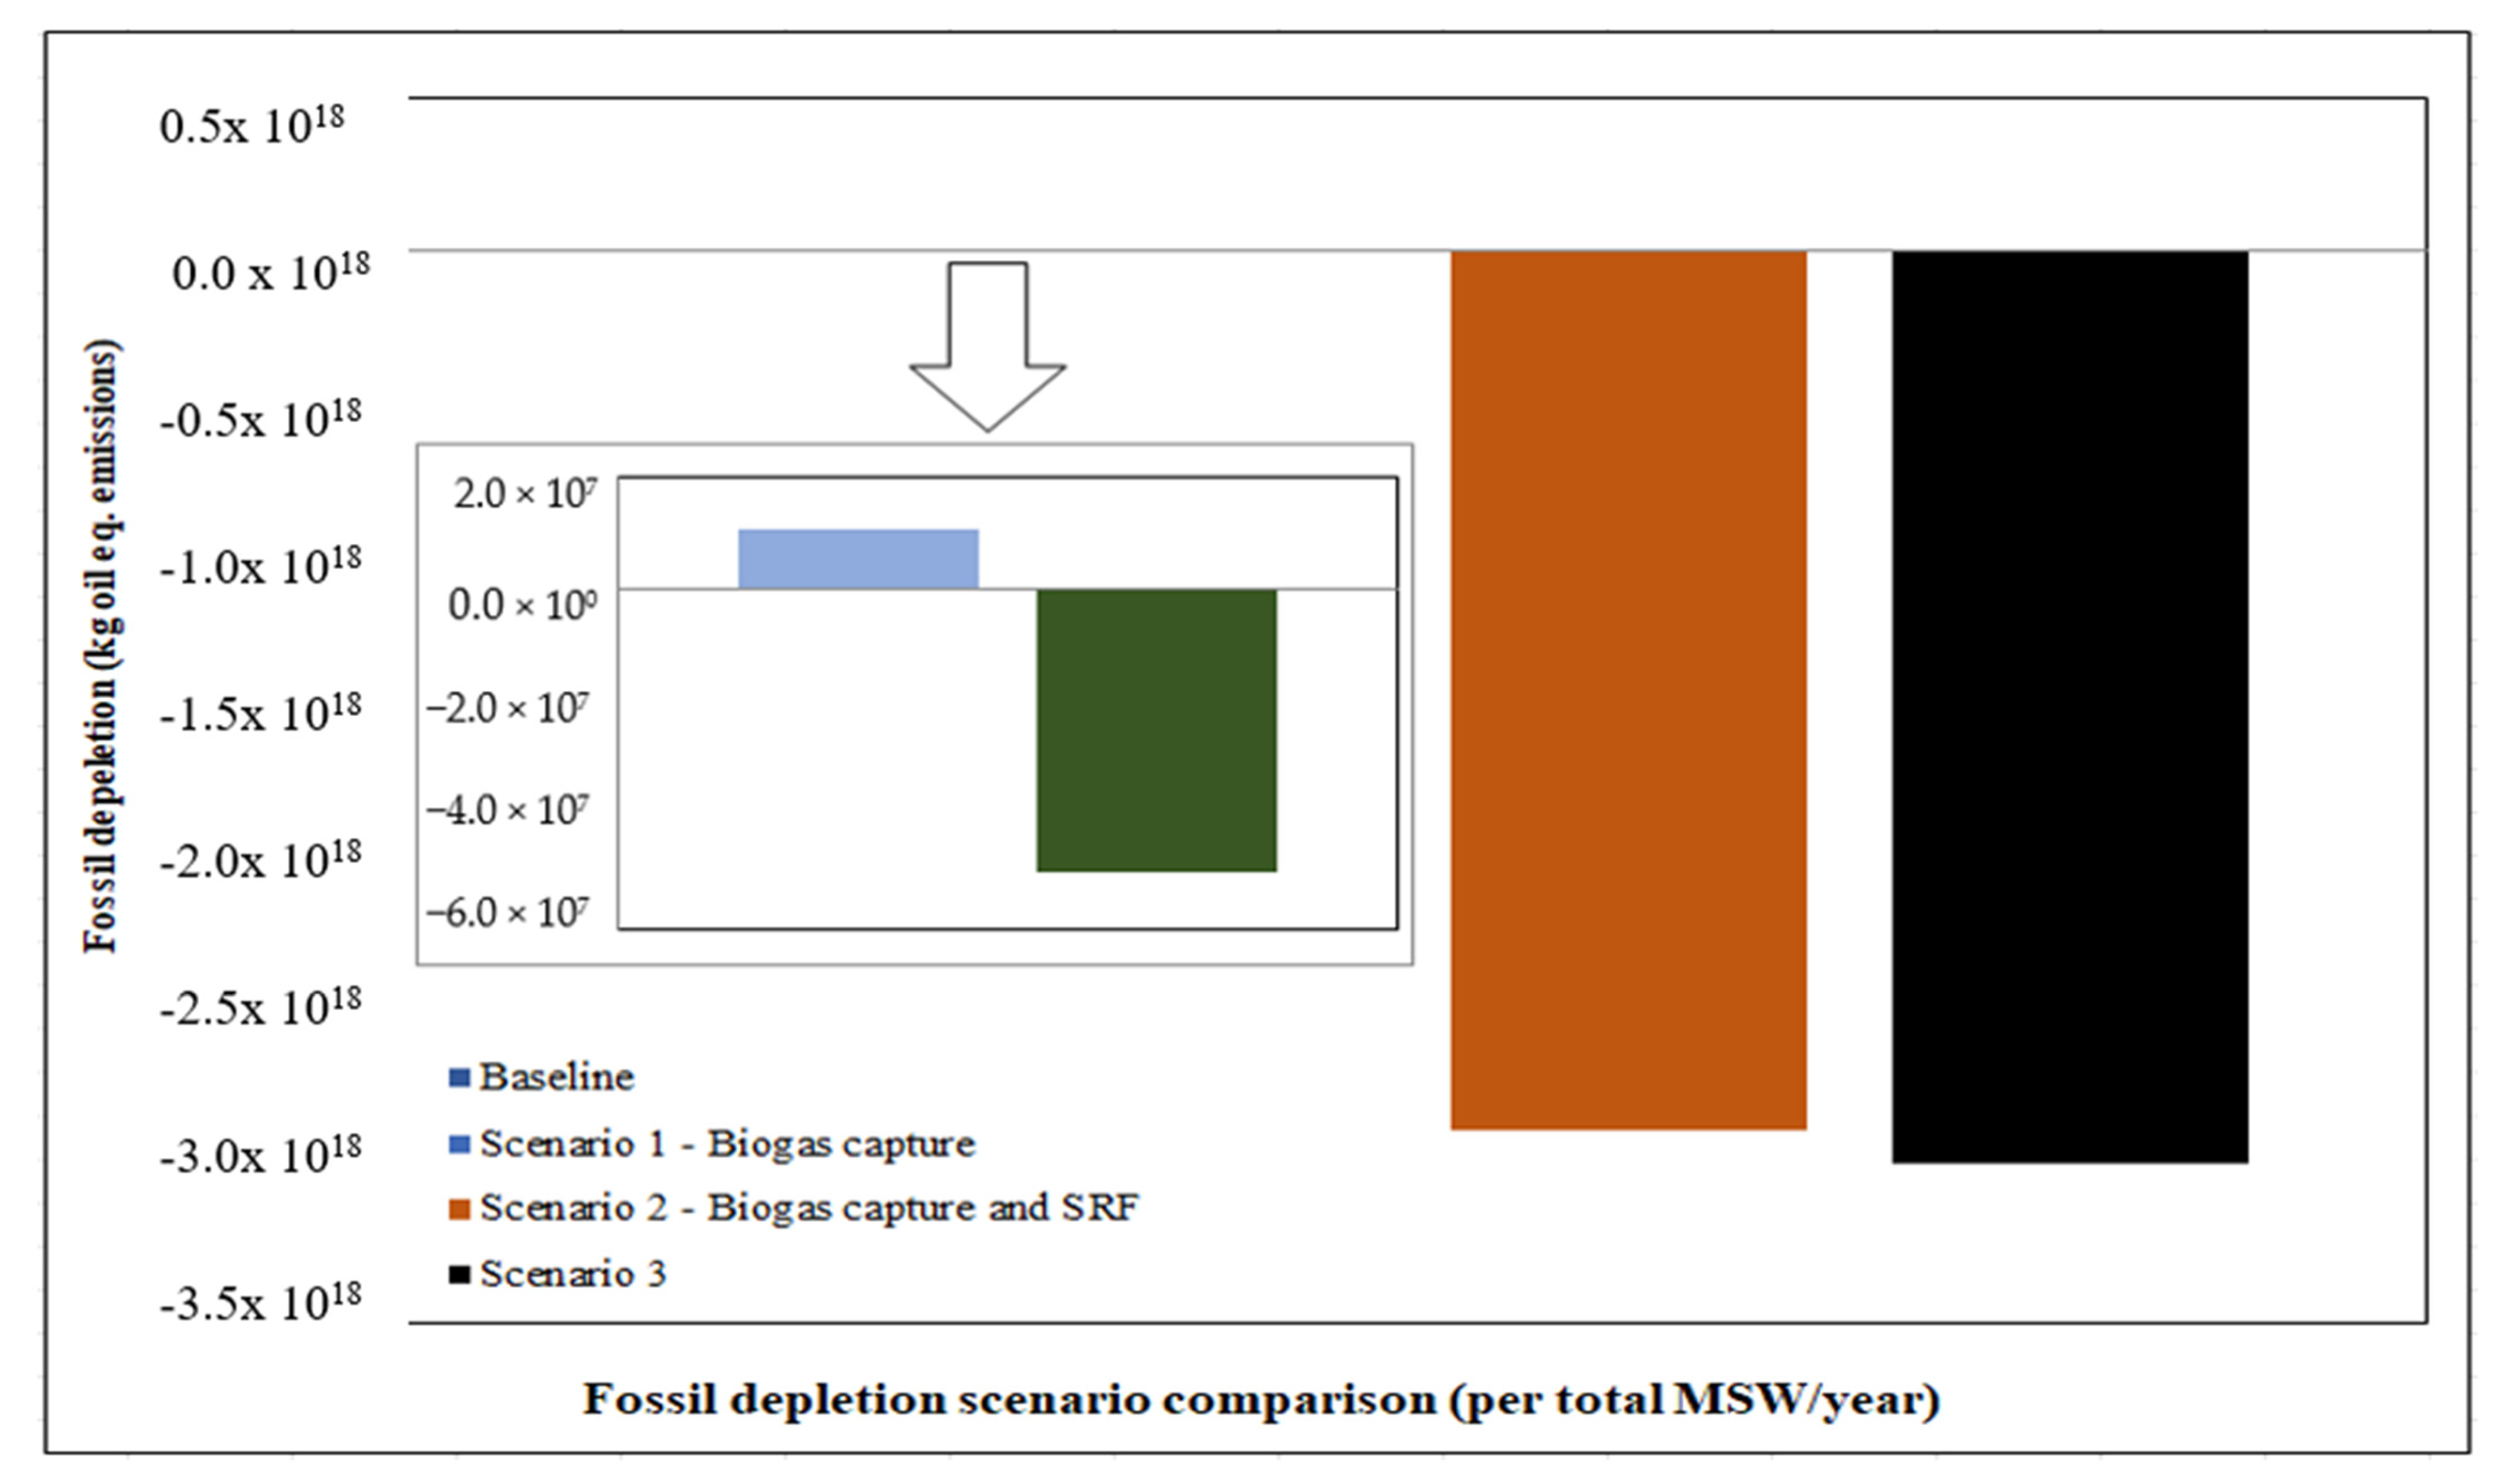
When compared to the baseline, Scenarios 1, 2 and 3 result in 4.8%, 41.3% and 42.7% reductions. It is clearly shown that the greatest impact on reduction is due to the introduction of SRF gasification whereas biogas capture and PV have comparatively minor effects. It can be established that scenarios 2 and 3 have the same magnitude of impact on climate change. That is, the level of CO2 emission is almost equally the same.
Figure 6 has results very similar to 5 because the water depletion is directly linked to the electricity generation. This is because the electricity generated in gas power plants consumes a large amount of water, therefore a reduction in electricity use from fossil fuels results in indirect reduction of water depletion. Similar to the results for fossil depletion, alternatives to the baseline result in large magnitudes of reduction in this category. These are about 50 times, 100 times and 100 times impact reduction with respect to the baseline for Scenarios 1, 2 and 3, respectively.
Comparing the baseline Scenario with Scenarios 1 to 3, the results show about 6 times,
times, and
times reduction in fossil depletion respectively. Again, the main reason for the significant impacts in scenarios 2 and 3 are due to the introduction of SRF gasification to produce electricity. In addition, using solar PV technology with SRF gasification produced clean energy with similar CO
2 emissions to scenario 2. One of the key elements of the arid Qatari climate is the impact of the high temperature and direct irradiation on solar panels, [
34]. However, some major PV challenges in Qatar reported in the literature to be considered include limited land, cost, lack of regulations, dust accumulation, high humidity and temperature [
35,
36]. The use of biomass gasification with solar energy eliminates the need for a lot of capital-intensive equipment in the traditional biomass gasification approach, and the combination of the two will lead to an increase in the syngas products [
37]. The large values of fossil depletion reduction arise in Scenarios 2 and 3 because the fossil fuel (natural gas) was used to generate electricity in the baseline Scenario.
7. Discussion
In this section, the results presented previously are discussed within the background of the literature review and the improvements achieved through the measures incorporated in the defined scenarios. As MSW treatment to produce SRF involves a variety of mass flows together with the use of electricity and generation at different steps along the supply chain, LCA is perhaps the best suited tool to assess the suitability of this process. However, a review of the literature concluded that there had been relatively few studies that have analyzed waste treatment in Qatar using LCA. Al-Maaded et al. [
15] used the life cycle approach to assess solid waste management and plastic recycling compared to landfilling. The authors concluded that recycling plastic reduces the global warming potential and soil toxicity from landfilling. Ayoub et al. [
21] investigated the solid waste management practices and implementation of optimization modules, but no LCA methodology was used. The authors herein conclude that utilizing solid waste as a material to produce energy may reduce landfilling by 53% of total waste disposed via this method. Other LCA literature investigated the Qatari mass and energy flow system, namely transport, energy use in the residential sector and the natural gas supply chain. Therefore, the main contribution of this paper is that this is the first LCA of SRF gasification within the context of Qatar. Additionally, the impact of using solar energy for the MSW treatment and SRF gasification process on the environment has also been quantified, where the results show that it makes a valuable difference to the reduction in environmental impact when compared to the baseline.
A total of five environmental impact categories were assessed in this LCA, namely climate change, terrestrial acidification, fossil depletion, water depletion and marine ecotoxicity. Previous studies on this topic in Qatar only included climate change and terrestrial acidification. Therefore, among the five environmental impacts analyzed, climate change was the largest environmental impact as shown in
Figure 4. This was expected as natural gas is the main energy supply to Qatar. However, fossil depletion, water depletion and terrestrial acidification followed climate change in their magnitude in decreasing order.
Only the main four environmental impact categories were analyzed and compared for the different scenarios. The baseline scenario represents the current MSW practice in Qatar which is simply landfilling only with no further treatment. Scenario 1 improves upon this analysis by including a 50% capture of the biogas released from the organic matter in the landfill. This measure improves climate change impact by 4.8% as presented in
Figure 5. In addition, Scenario 2, which improves upon the 50% biogas capture by including SRF gasification, significantly reduces climate change impact. A reduction of 41.3% for Scenario 2 can be seen in a comparison with the baseline as shown in
Figure 5. Finally, Scenario 3 considers the use of solar energy in MSW treatment and gasification to produce electricity; however, the additional impact on climate change is not deemed significant, calculated to be only a 4% improvement over Scenario 2. In summary, for the climate change category, the most significant reduction possible is for SRF gasification and production of electricity using syngas to offset the local electricity requirements. Essentially this measure of MSW treatment and gasification-based electricity would not only reduce dependence on landfill but also reduce carbon emissions higher up in the supply chain by producing less electricity from natural gas.
Considering the analysis of fossil depletion in
Figure 7, recovering 50% of biogas has a small improvement over the baseline. However, the gasification scenario drastically improves this environmental impact category. In the baseline scenario, fossil depletion accounted for
kg oil equivalent for the total MSW processed per year. This value reduced to
kg oil equivalent emissions, resulting from offsetting the use of natural gas to produce electricity in Qatar. Similar to the analysis for climate change, the introduction of solar energy to the gasification process only resulted in a 3.5% further improvement over the gasification in Scenario 2.
The water depletion results present a similar situation where the baseline is calculated to result in
of water depletion, as shown in
Figure 6. This results in negative values for the improved three scenarios. As with the previous findings, the use of 50% biogas captured results in a small reduction of this environmental impact, while Scenario 2, which is the gasification process without solar energy, results in negative emissions of water depletion as a significant reduction. The use of solar energy in Scenario 3 further adds a 3.3% improvement over Scenario 2.
Terrestrial acidification however remained unchanged for all four scenarios. It must be kept in mind that the data used in this analysis incorporated average data for SRF gasification from literature. Additionally, only those country-specific characterization factors that were available in the ReCipe2016 database were used, while for the remaining, characterization factors for the Gulf region were used, as listed in
Table 6.
It can be concluded that the LCA shows that the environmental improvements found in Scenarios 1–3 represent measurable improvements over the baseline. However, the most significant improvement was observed in Scenario 2 and 3 because this considered the produced electricity from SRF gasification. When the four categories in this LCA were compared, the largest reduction was obtained from climate change, followed by fossil depletion, water depletion and marine ecotoxicity. In view of the Qatar national vision 2030 where environmental impact and water use are key resources that need to be used more judiciously, the use of SRF in gasification technology will be an appropriate pathway.
8. Conclusions
In this paper, the first LCA of SRF air gasification to produce electricity in Qatar has been conducted. Since there is a global increase in the MSW, its challenges have encouraged the development of standby strategies to convert waste to renewable energy. Gasification technology, considered the most sustainable and efficient technology, converts biomass or MSW to syngas consisting mainly of CO, CO2, CH4, H2, O2 and N2. Gasification with air is the most widely used technology due to low cost of O2 production and usage in multiple reactors. Qatar-specific characterization factors were used from the ReCipe2016 database and the life cycle inventory was developed using this resource together with information from literature and Qatari governmental reports on MSW classification. The LCA has been performed considering only four major environmental impact categories in Qatar. Four scenarios of operation have been adopted to perform the LCA, namely, the current practice in Qatar (baseline), capture of 50% biogas (Scenario 1), biogas capture by including SRF gasification (Scenario 2) and using solar energy in the gasification in addition to Scenario 2 settings (Scenario 3). Among the main four environmental impacts analyzed, climate change was the largest environmental impact. This was expected as natural gas is the main supply to energy sector and economy in Qatar, which ultimately contributes to carbon emissions. Thus, climate change in this LCA is followed by fossil depletion, water depletion and terrestrial acidification in their magnitude in decreasing order.
At the baseline stage, the landfill gas is a mix of CO2, CH4 and other gases created by the bio-chemical processes within a landfill as they cause the decompose of organic wastes such as food and paper waste. In scenario 2, adding the production of SRF to generate electricity via air gasification greatly reduces the emission of CO2. In the case of scenario 3, it is assumed that electricity generated from the solar PV with gasification produces similar CO2 emissions from the thermal treatment of the SRF process in scenario 2.
The results indicated that Scenario 2 causes a large reduction in climate change at a lower cost compared to the other scenarios. Scenario 3, on the other hand, has the largest reduction in climate change. The study shows that the electricity can be generated using syngas produced from SRF gasification to offset the local power requirements. Given these outcomes, it can be concluded that the incorporation of SRF gasification can significantly reduce the MSW landfills and contribute to the Qatar national vision 2030. The results obtained in the present study have been compared to the study of Al-Maaded et al. [
15]. The current findings showed that on a 10 kg MSW processing basis, 5 kg CO
2 equivalent emissions were produced for the landfilling scenario.


