Article

Comparison of the Fluidized State Stability from Radioactive Particle Tracking Results

1
Faculty of Science and Engineering, Energy Technology, Åbo Akademi University, 65100 Vaasa, Finland
2
Laboratorio de Reactores y Sistemas para la Industria—LARSI, Departmento de Industrias, FCEyN, Universidad de Buenos Aires, Intendente Güiraldes 2620, Buenos Aires 1428, Argentina
3
Department of Intelligent Systems, Jožef Stefan Institute, 1000 Ljubljana, Slovenia
4
Laboratorio de Diagnóstico por Radiaciones—LaDiR, Departmento de Física Experimental, Comisión Nacional de Energía Atómica (CNEA), Av. Gral. Paz 1499, Villa Maipú, Buenos Aires 1650, Argentina
5
Instituto de Tecnologías Emergentes y Ciencias Aplicadas (ITECA), UNSAM, CONICET, Escuela de Ciencia yTecnología (ECyT), San Martín, Buenos Aires 1650, Argentina
*
Author to whom correspondence should be addressed.
ChemEngineering 2021, 5(4), 65; https://doi.org/10.3390/chemengineering5040065
Submission received: 27 July 2021 / Revised: 7 September 2021 / Accepted: 23 September 2021 / Published: 1 October 2021

Abstract

:
Currently, various industrial processes are carried out in fluidized bed reactors. Knowing its internal dynamics is fundamental for the intensification of these processes. This work assesses the motion of fluidized calcium alginate spheres under the influence of an upward fluid flow within a 1.2 m high and 0.1 m inner diameter acrylic column. The liquid–solid fluidized bed was compared with a gas–liquid–solid fluidized bed operation mode in terms of mixing behavior. The radioactive particle tracking technique is a proper methodology to study the internal dynamics of these kinds of equipment. Data gathered were analyzed with Shannon entropy as a dynamic mixing measure. Mixing times were found to be between 1 and 2.5 seconds for both fluidization modes. The liquid–solid fluidized bed presents a rather smooth mixing time profile along the column. On the other hand, the gas–liquid–solid fluidized bed showed high sensitivity of entropy production with height, reaching a sharp tendency break at the second quartile of the column. The Glansdorff–Prigogine stability measure can accurately capture flow regime transitions of the gas–liquid–solid fluidized bed, allowing it to be used to construct reliable operative windows for fluidization equipment.

1. Introduction

Fluidization has a long history of utility for mineral sorting and has been used for this purpose for several hundreds of years [1,2]. Many catalytic processes and operations in the chemical industry are currently carried out in fluidized beds [3] such as the Fischer–Tropsch reaction for producing cleaner fuels [4]. The use of expanded beds allows for better homogenization of the cell culture media. Methodologies such as adsorption or fluidized bed chromatography are currently being established [5,6], which have had promising results in the extraction of biological products of industrial interest, given the reduction in the operating volume [7,8,9]. Their underlying dynamics are fundamental for properly designing the units and implementing process intensification strategies [10,11]. Such dynamics are governed by body forces (gravity, buoyancy) and external friction forces. From the microscopic contribution of each fluid element and the particles of the system has emerged observables such as bed height, pressure drop, distribution of shear forces, mixing times, and turbulent kinetic energy. The correct prediction of these observables depends upon the precision with which these macroscopic forces are described and remains an open problem to a large extent [12,13].
On the other hand, in the last few decades, experimental methods have been developed to determine the trajectories of particles in free movement within multiphase equipment. The radioactive particle tracking (RPT) technique involves determining the trajectory of a single radioactive tracer representing the solid particles of the system, providing comprehensive information on multiphase flows [14,15,16,17,18]. The information obtained by RPT is highly suitable to evaluate the equipment mixing performance and verify models aiming to describe the transport of matter and energy.
Shannon (or information) entropy is a statistic that estimates the homogeneity of a probability distribution, which can be used as a mixing index [19,20]. In statistical thermodynamics, entropy is the logarithm of the microstate diversity in the system, known as the Boltzmann H-function [21]. The Shannon entropy is adopting the Boltzmann H-function as a property of any probability distribution, { p i } ,   i ( 1 ; ;   N ) , where N is the number of bins into which the valid range of the distribution is divided. If N is finite, the discrete probability density function is often called the probability simplex. In the context of RPT, the valid range of the probability distribution will be enclosed within the space that the tracer trajectory reaches, and the bins will result from the number of voxels with which that space is divided, understood as the granularity of the tracer position probability simplex according to Salierno et al. (2018) [22]. The Shannon entropy is useful to quantify the mixing of solid particles in suspension or liquid elements from RPT data [12].
Alginates form a hydrogel in aqueous calcium solutions, traditionally used to immobilize enzymes and microorganisms [23]. Its potential uses as a contaminant adsorbent [24,25] and support for inorganic catalysts are also currently being explored [26,27]. The literature increasingly presents diverse promising applications of gel particles that eventually scale up to be implemented in fluidized beds. For example, profitable sugars could be continuously produced in LSFB columns at higher flow rates [28]. Emergent technologies for cleaner production such as aerobic cultures for effluent treatment [29] and carbon dioxide capture by immobilized carbonic anhydrase [30] can be implemented at the pilot to industrial-scale GLSFBs. Although most of the processes involving immobilized enzymes are currently carried out in fixed beds, fluidized beds avoid dead zones, and thus the risk of potentially contaminating the product stream [28,31]. Additional industrially relevant advantages of fluidized beds compared to fixed bed reactors are lower pressure drop and superior heat and mass transfer characteristics [31,32].
Designing the agitation device is a fundamental feature for the reproducibility of processes sensitive to concentration gradients [33], avoiding the attrition of catalysts [34] or hydrodynamic stress control in cell cultures [35]. Estimating the time required for mixing is key to successfully control the turbulence levels to achieve a certain homogenization rate. Furthermore, it is mandatory to comprehend the dynamic stability of the equipment during operation for the safe implementation of new technologies in industrial conditions [36]. This work compared the mixing behavior and the stability of fluidized bed columns. The motion of 5 mm calcium alginate gel spheres suspended within liquid–solid and gas–liquid–solid turbulent media were examined with RPT. Information theory was applied to study particle mixing, and information geometry was used to assess the stability of the mixed state.

2. Materials and Methods

2.1. The Radioactive Particle Tracking Technique

The method of tracking a single radioactive particle (radioactive particle tracking, RPT) consists of simultaneously counting the number of gamma rays that arrive from a stable tracer in motion to a set of high-energy radiation detectors strategically located around the equipment under study. The number of photons that interact with each detector is proportional to the solid angle subtended by the detector to the radioactive source used as a tracer, depending on the tracer–detector distance [17]. Therefore, the simultaneous detection of radiation with a set of detectors arranged around the column makes it possible to determine the mean position of the tracer at each sampling period.
The RPT technique is based on considering an isotropic gamma emission pattern. Negative-beta decay provides such gamma emissions. This emission mechanism is characteristic of neutron-rich nuclei. Additionally, following the ALARA safety philosophy, the tracer must be properly active during the experiments. It is also convenient that it has not so long a half-life to quickly reach a stable state after being used. Therefore, 198Au (Eγ = 0.412 MeV; t1/2 = 2.7 d) is a good option choice. The tracer consists of a 1 mm diameter high-density polyethylene (PEAD) hollow sphere that seals a fragment of a few gold micrograms inside [37]. The gamma sources were obtained by neutron bombardment in the RA1 nuclear reactor at the National Atomic Energy Commission (CNEA–Buenos Aires-Argentina). The resulting radioactivity depends upon the exposure time and on the neutron flux. The tracer path is followed for several hours with a sampling period of 30 ms. For the reconstruction, a calibration stage was performed by measuring the counts while locating the tracer at known positions within the system. The signal distribution, the tracer intensity, the media attenuation, and the dead time of the detector system were fitted for each detector to represent their response to radiation. Details of the reconstruction procedure can be found elsewhere [16,17]. Experiments were carried out in an acrylic column (1.2 m height, 0.1 m inner diameter) surrounded by an array of 16 NaI(Tl) 2″ scintillation detectors (Figure 1).
Two modes of fluidization were considered in this work:
  • Liquid–solid fluidized bed (LSFB), where the solid phase motion is driven with the liquid flowing upward [38]. In this case, there is no gas flow.
  • Gas–liquid–solid fluidized bed (GLSFB), where the liquid and the particulate solid phase are contained in the column while the gas flows upward [15].

2.2. Liquid–Solid Fluidized Bed (LSFB) Operational Parameters

In the LSFB, the liquid phase is a solution of CaCl2 0.05 M (ρL = 1008 kg/m3; μL = 1.02 mPa·s) in water, flowing in a closed-loop impelled by a centrifugal pump moderated by a diaphragm valve. The liquid superficial velocity (uL) is set and controlled at different constant values between 0.028 to 0.036 m/s of superficial liquid velocity, 20% above the minimum fluidization velocity and 20% below the circulation velocity. The liquid enters into the column from the bottom through a distributor of 2.2% effective section. Gel bead (ρs = 1030 kg/m3) content was about 8% v/v.

2.3. Gas–Liquid–Solid Fluidized Bed (GLSFB) Operational Parameters

In the case of a GLSFB, the column is operated with compressed air (ρg = 1.22 kg/m3; μg = 18 μPa·s) flowing upward through a distributor located at the base of the column. The air entered the column through 42 holes of 1 mm, resulting in an effective cross-section of 0.42%. The superficial velocity of air (ug) was varied between 0.01 and 0.10 m/s, covering the bubble regime, the heterogeneous regime, and the onset of the churn regime. The condensed phase is an aqueous solution of CaCl2 0.05 M (ρL = 1008 kg/m3; μL = 1.02 mPa·s) with 8% v/v of 5 mm diameter calcium alginate spheres (ρs = 1030 kg/m3). The room temperature was set at 24 °C.

3. Shannon Entropy and Mixing Behavior

Shannon entropy [39], or information entropy, is a statistic related to the homogeneity of a probability distribution. If applied to the probability distribution of discrete particle positions [40] representing suspended solids or liquid elements, it can be used as a mixing index [41]. In this work, we defined the statistic Ω(t) relating the instantaneous entropy of the distribution with the maximum that could be reached for the number of bins or sections considered in the discretization Equation (1).
( t ) = i = 1 N [ p i ( t ) ln ( p i ( t ) ) ] ln ( N )
where N is the number of bins in which the simplex has been discretized and p i ( t ) is the normalized frequency of finding the tracer at the i-th position (with i belonging to the natural numbers between 1 and N). The magnitude ( t ) takes real values between 0 and 1 because the Shannon entropy is normalized by the value corresponding to the maximum possible entropy, uniquely associated with the equiprobable distribution.
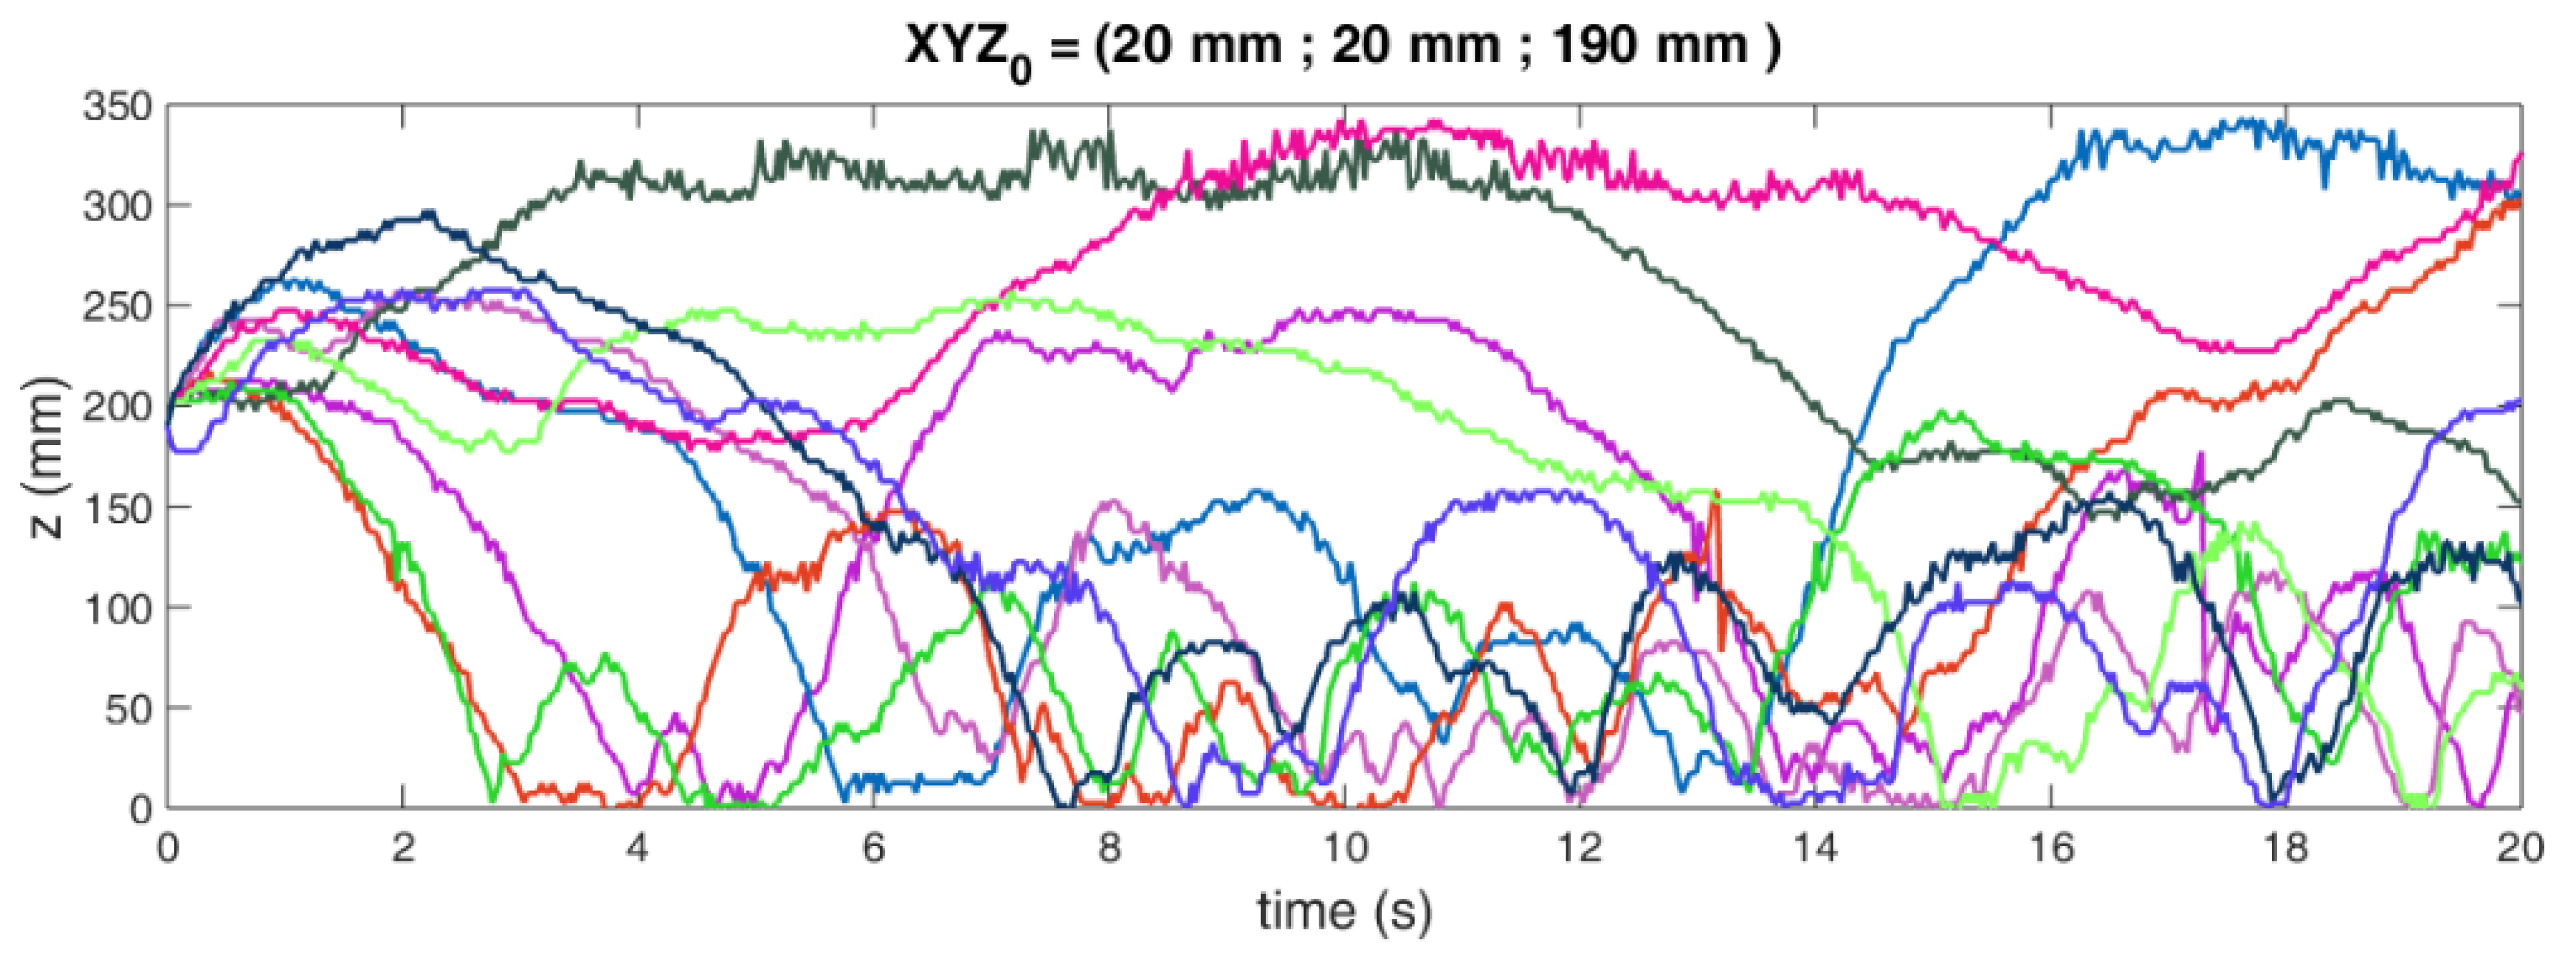
To calculate the Shannon entropy, we first constructed a manifold of trajectories from a properly long single tracer trajectory obtained by RPT. The tracer was carefully built to mimic the dynamics of the rest of the particles. Then, considering ergodicity, we interpreted the manifold as an injection of particles at a given region of the space. Figure 2 shows the axial projection of a trajectories manifold obtained by RPT experiments on the GLSFB.
Figure 3 illustrates how the histogram of positions of particles that begin their trajectory in a portion of the column at a certain height varies over time. The probabilities of visiting different regions of the space and associated statistics can be calculated from the histograms. The granularity of the probability simplex must be chosen considering the size of the manifold; very small bins would generate discontinuous probability distributions that could mislead the determination of associated statistics.
In many cases, the distribution is not homogeneously arranged throughout the bed, especially if the traced phase differs in density with the rest of the phases of the system (e.g., solids whose density is greater than that of the fluid that disperses it). Nevertheless, there is a systematic tendency of the probability distributions to evolve to a fixed form, an absolute convergence, dependent only on the operating conditions. After a while, these distributions do not differ from each other.
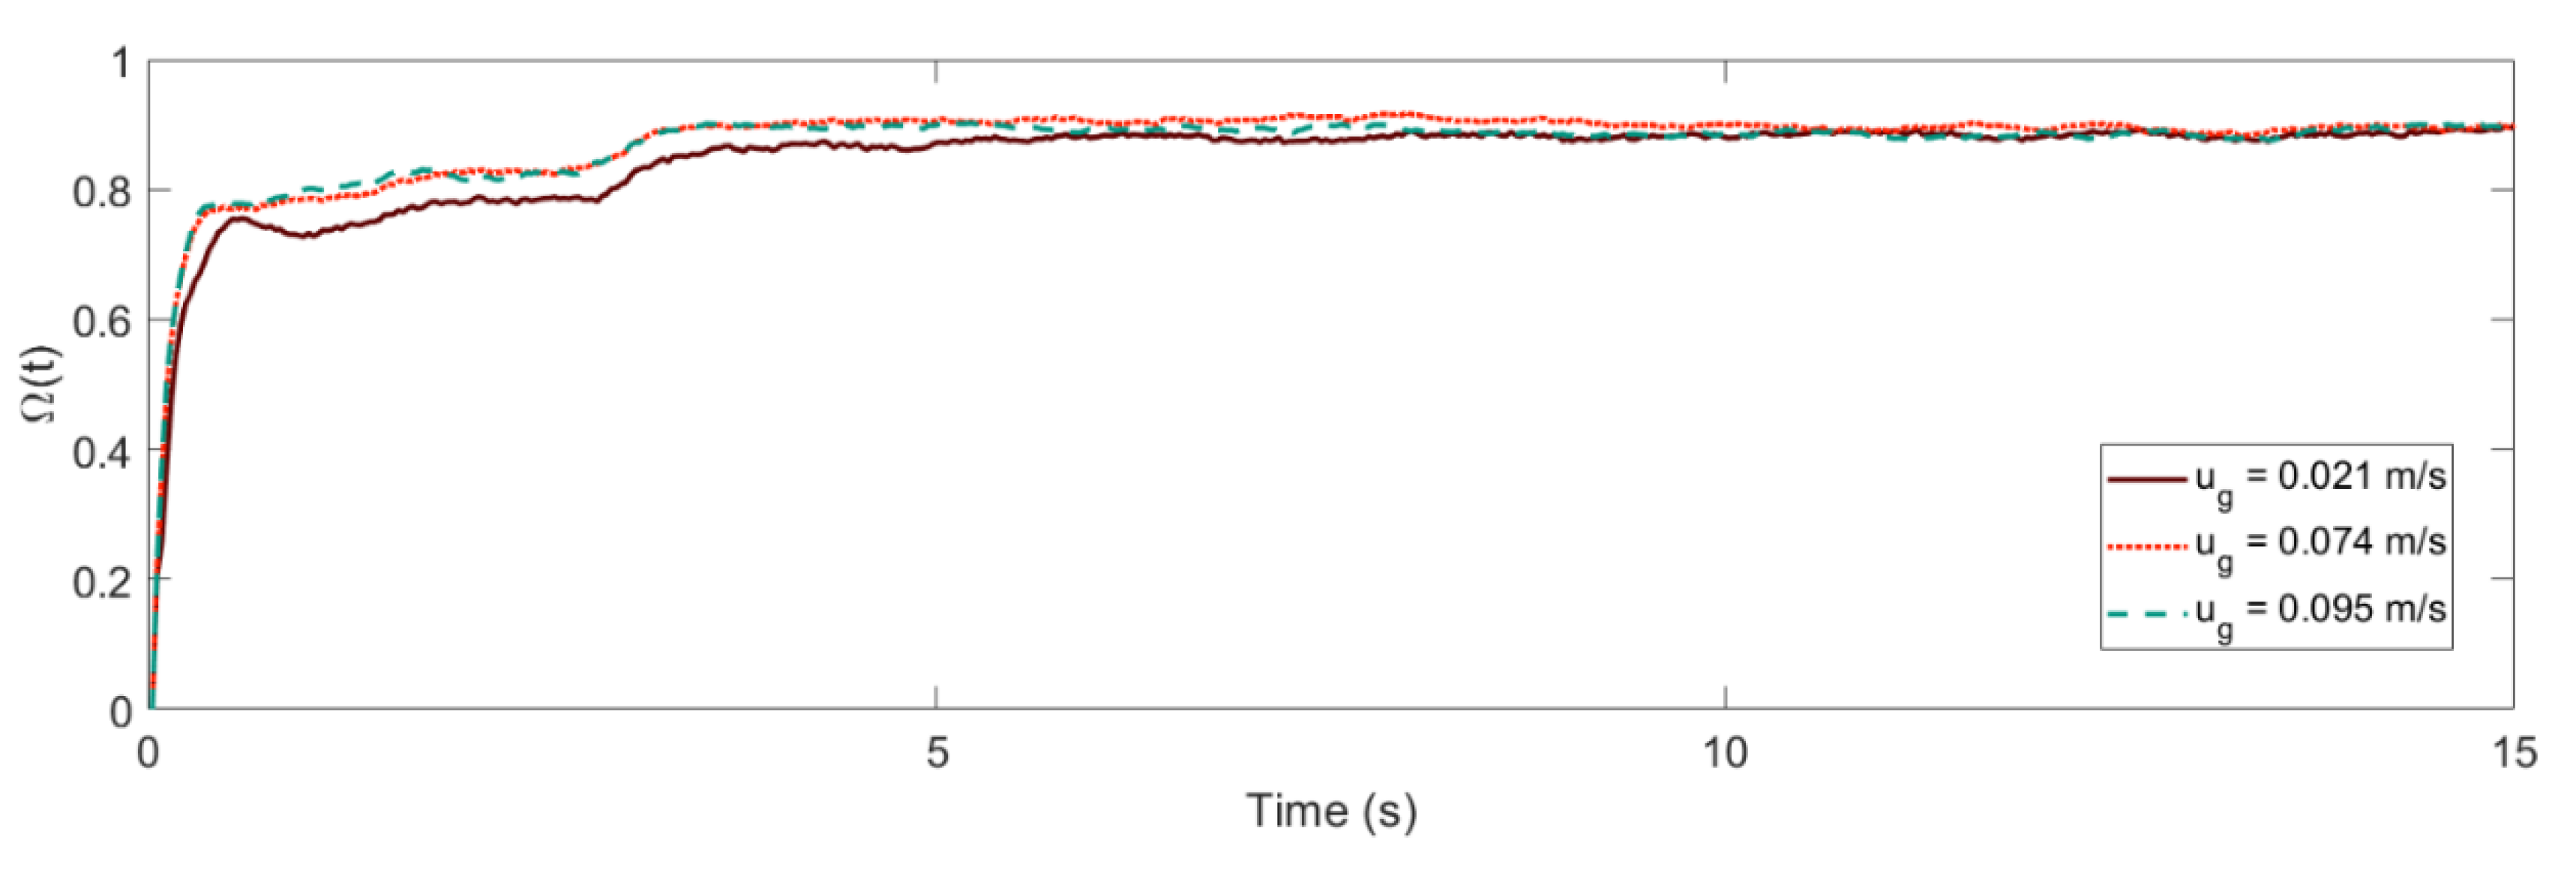
Figure 4 shows the temporal evolution of the normalized Shannon entropy time-series Ω(t) of a trajectory manifold starting from the same region of space. It can be observed that the quantifier Ω(t) reached an asymptotic value less than one because it is related to the distribution of the solid phase that is established once the pseudo-steady state is reached for a given operating condition. This asymptotic value corresponds to the maximum level of mixing of the phase that the tracer represents within the system. It is consistently found that Shannon’s time-related path extracts have a concave curvature and converges at a precise value that depends on tracer density and gas velocity, consistent with the conception of Lyapunov dynamic equilibrium [42]. Parsimonicall chosen granularities of the probability simplex lead to the same values of asymptotic Shannon entropy.

4. Mixing and Stability Assessment Based on Information Geometry

4.1. Mixing Times and Entropy Production

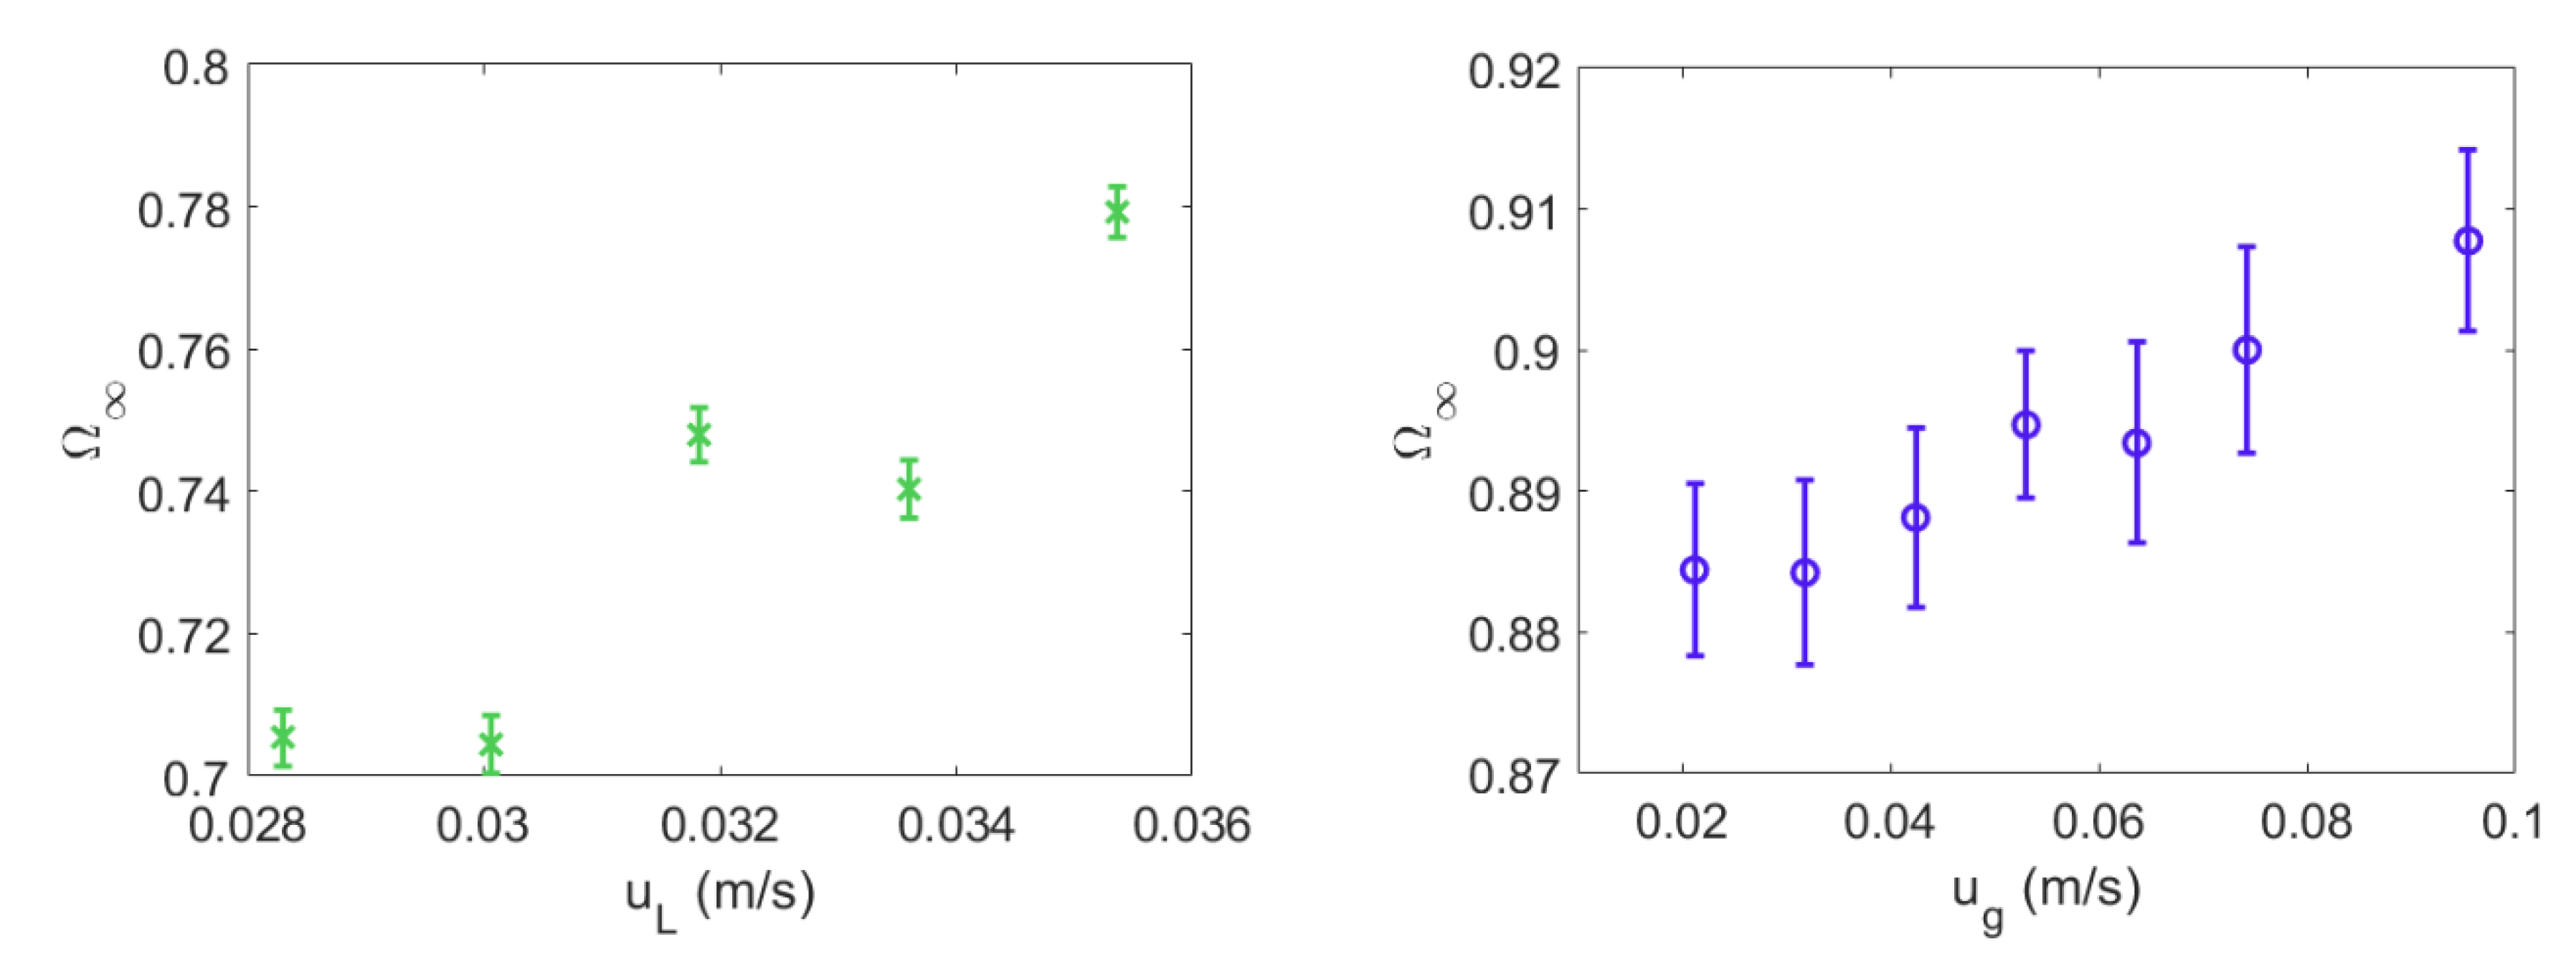
It was observed that, regardless of the starting point, the entropy calculated using sets of trajectory extracts reaches a quasi-invariant value in time, denoting the presence of a pseudo-stationary state. This system of suspended particles against gravity, although a metastable state sustained by a continuous upward fluid flow, is dynamically stable in the Lyapunov sense, since it reaches a constant entropy from a certain moment. Figure 5 shows the asymptotic entropy values Ω for each operative condition, determined from different starting points. Granularity values between 20 and 60 in the axial direction and 1 to 8 in the radial direction provide similar values of Ω [15], dependent only upon the operational. There is an increment of Ω values when fluid velocity increases. However, the LSFB showed a systematically lower level of mixing than those observed in the GLSFB.
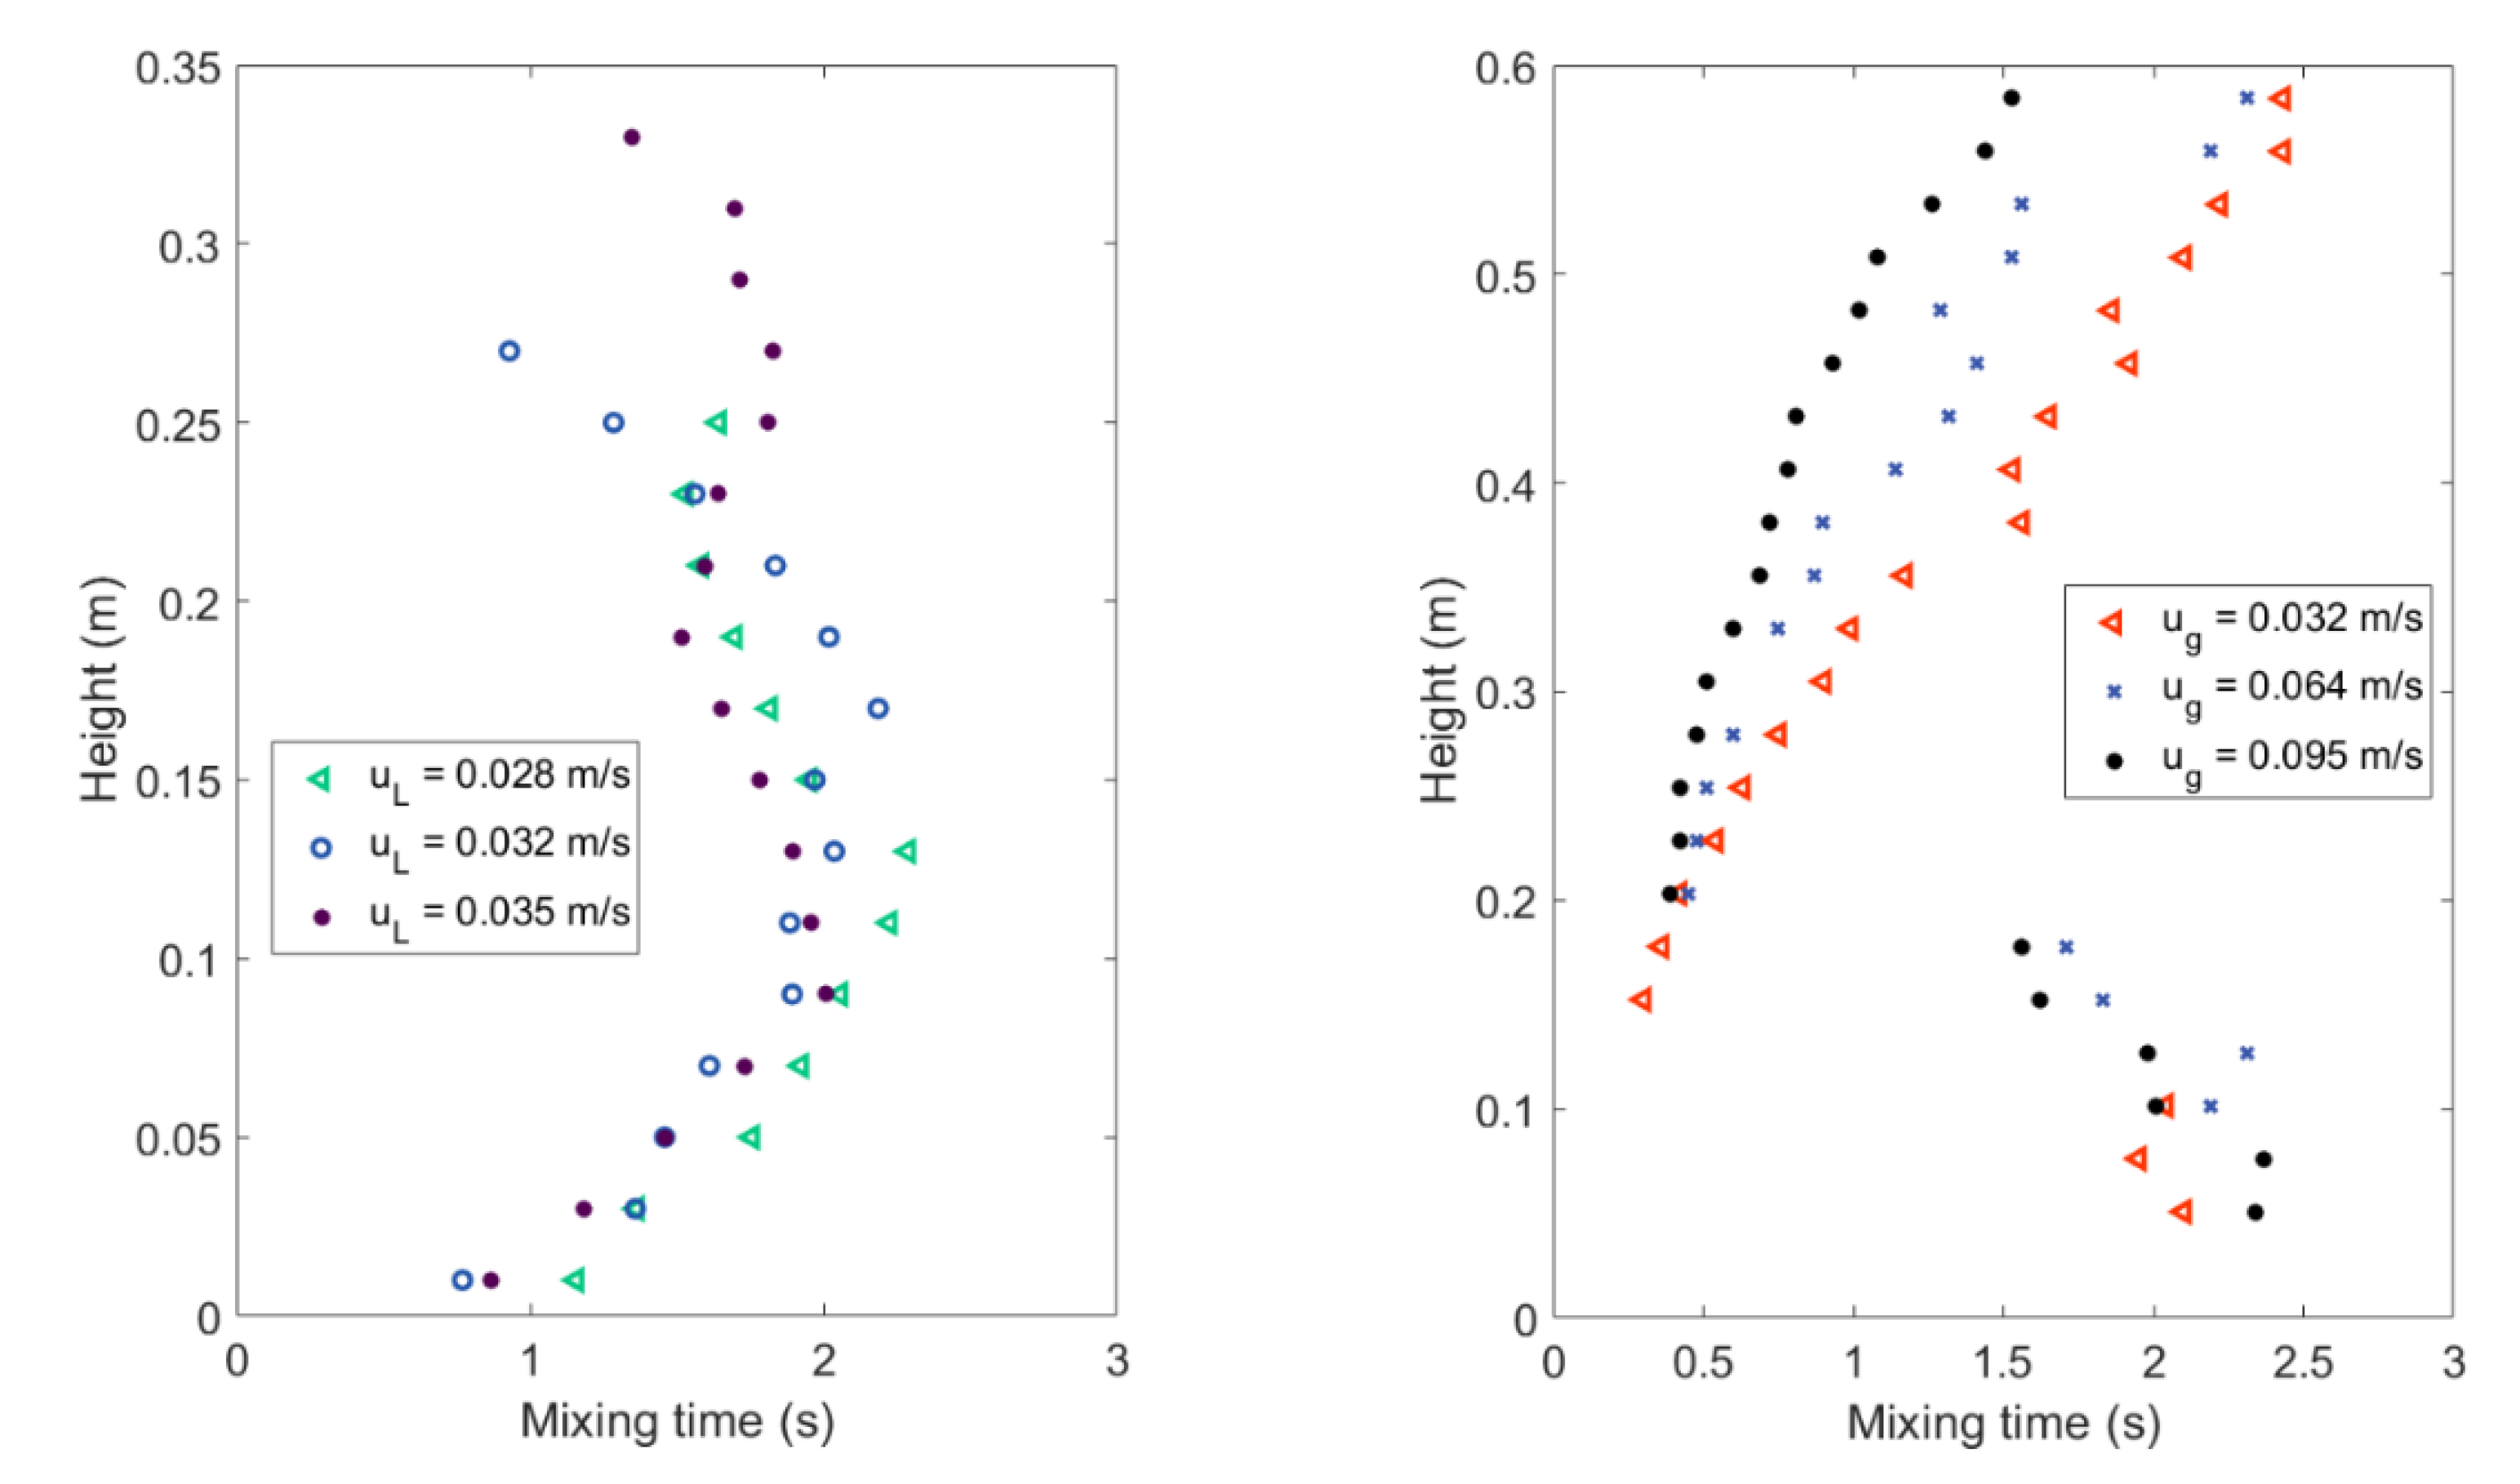
The time required to reach Ω can be considered as an estimation of the mixing time. This concept is widely used to assess the dynamic thermalization of quantum systems [24]. The shape of Ω ( t ) is usually monotonously increasing, reaching a single stationary value regardless of the ‘injection point’. However, in some cases, it can temporarily reach a situation of overmixing (when the instantaneous entropy is greater than that of the steady-state). Therefore, a robust criterion to determine the mixing time is to find the first portion of the curve where the product of the slope and the regression coefficient of five successive points is significantly close to zero, verifying that the Ω value does not differ significantly from the plateau value [11]. Figure 6 shows the axial distribution of mixing time for different fluid velocities.
Results indicate the same order of magnitude but different axial trends for mixing times determined for the LSFB compared to the GLSFB. However, it should be recalled that the LSFB achieved a lower bed expansion and homogeneity than those observed in the GLSFB. The LSFB showed a smooth trend with a maximum of about 0.1 m. On the other hand, the GLSFB showed a sharp break at 0.15 m. Longer times are necessary to attain mixing when the manifold starts closer to the bottom [15], plausibly related to circulation patterns that trap the tracer and delay the relaxation of the probability simplex.
Although the fluid Reynolds number (defined from the fluid properties, the superficial fluid velocity, and the column inner diameter as the characteristic length) was quite high in the case of the LSFB system ( R e L [ 2800 ; 3500 ]   v s .   R e g [ 150 ; 700 ] ) , it was observed that the homogeneity levels were lower at the LSFB than those obtained in the GLSFB.
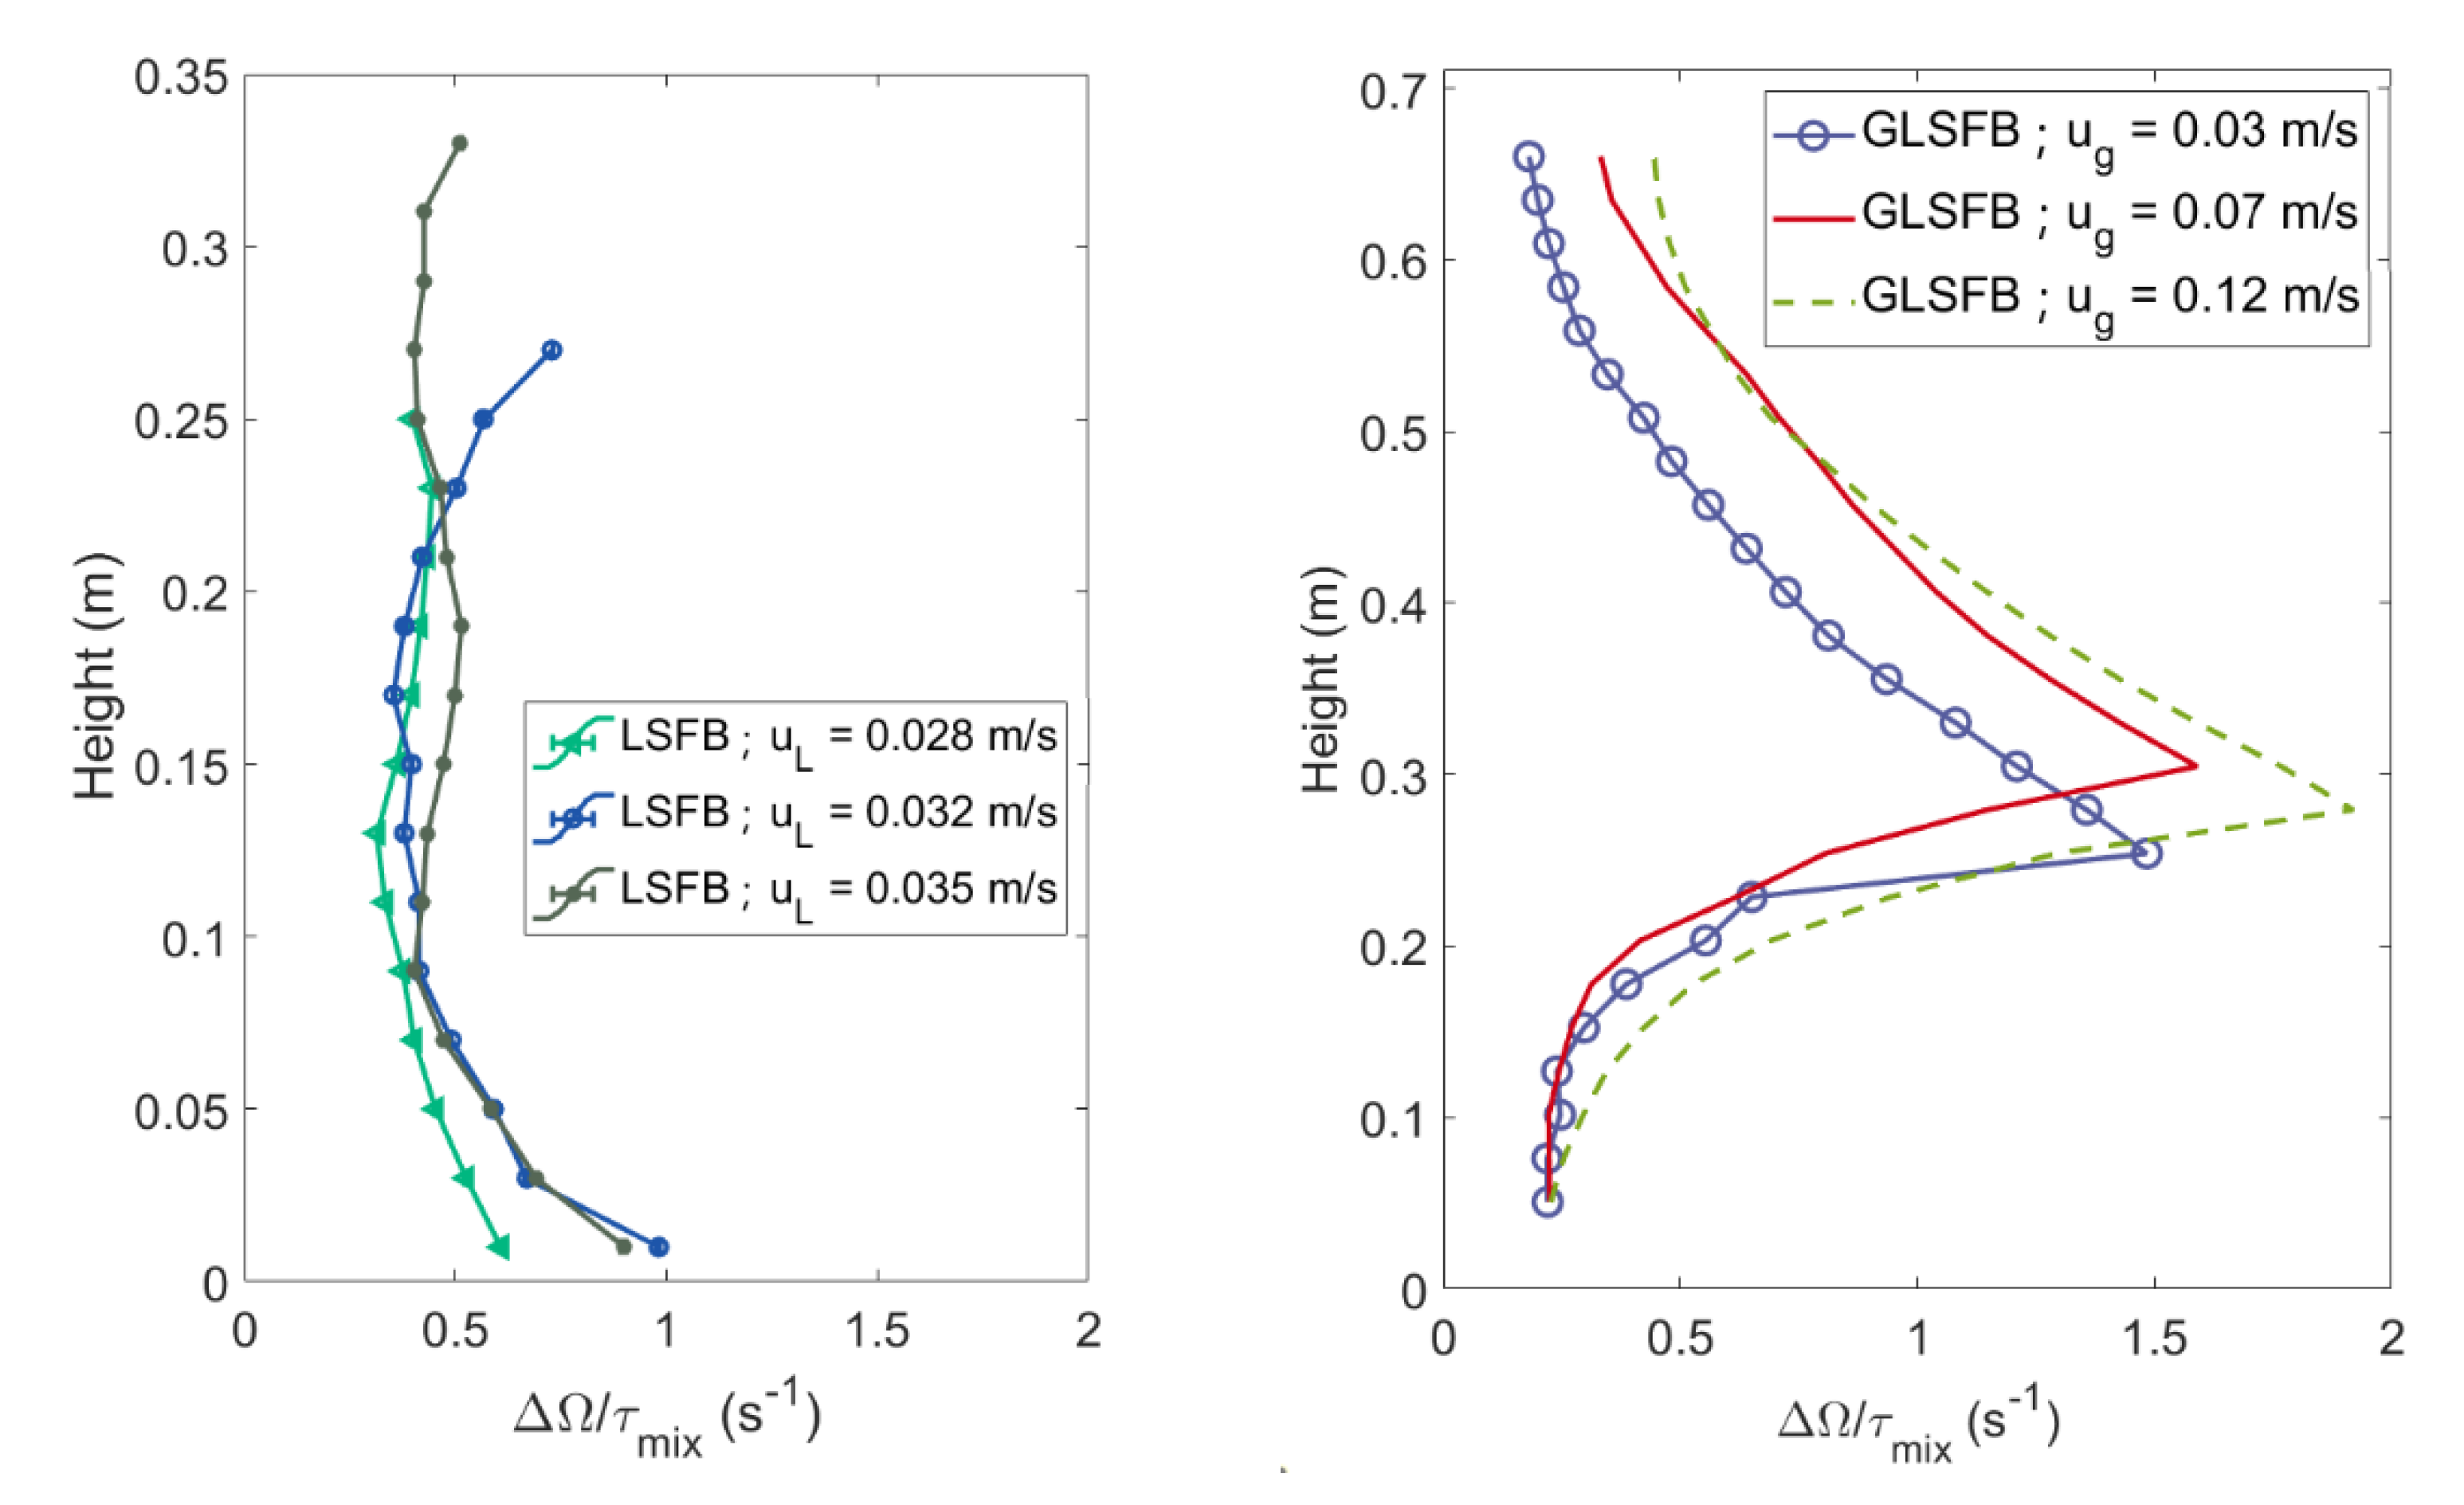
In the GLSFB system, the highest turbulence spot is localized where the lower and upper vortices meet [15]. Two zones can be recognized for their different proportionality, as shown by the mixing time to height within the column. The minimum mixing time naturally coincides with the maximum entropy production rate; moreover, the proportionality with height changes abruptly. Figure 7 shows the normalized entropy change reached at the macroscopic mixing time for both systems.

4.2. Glansdorff–Prigogine Criterion Based on the Fisher Information

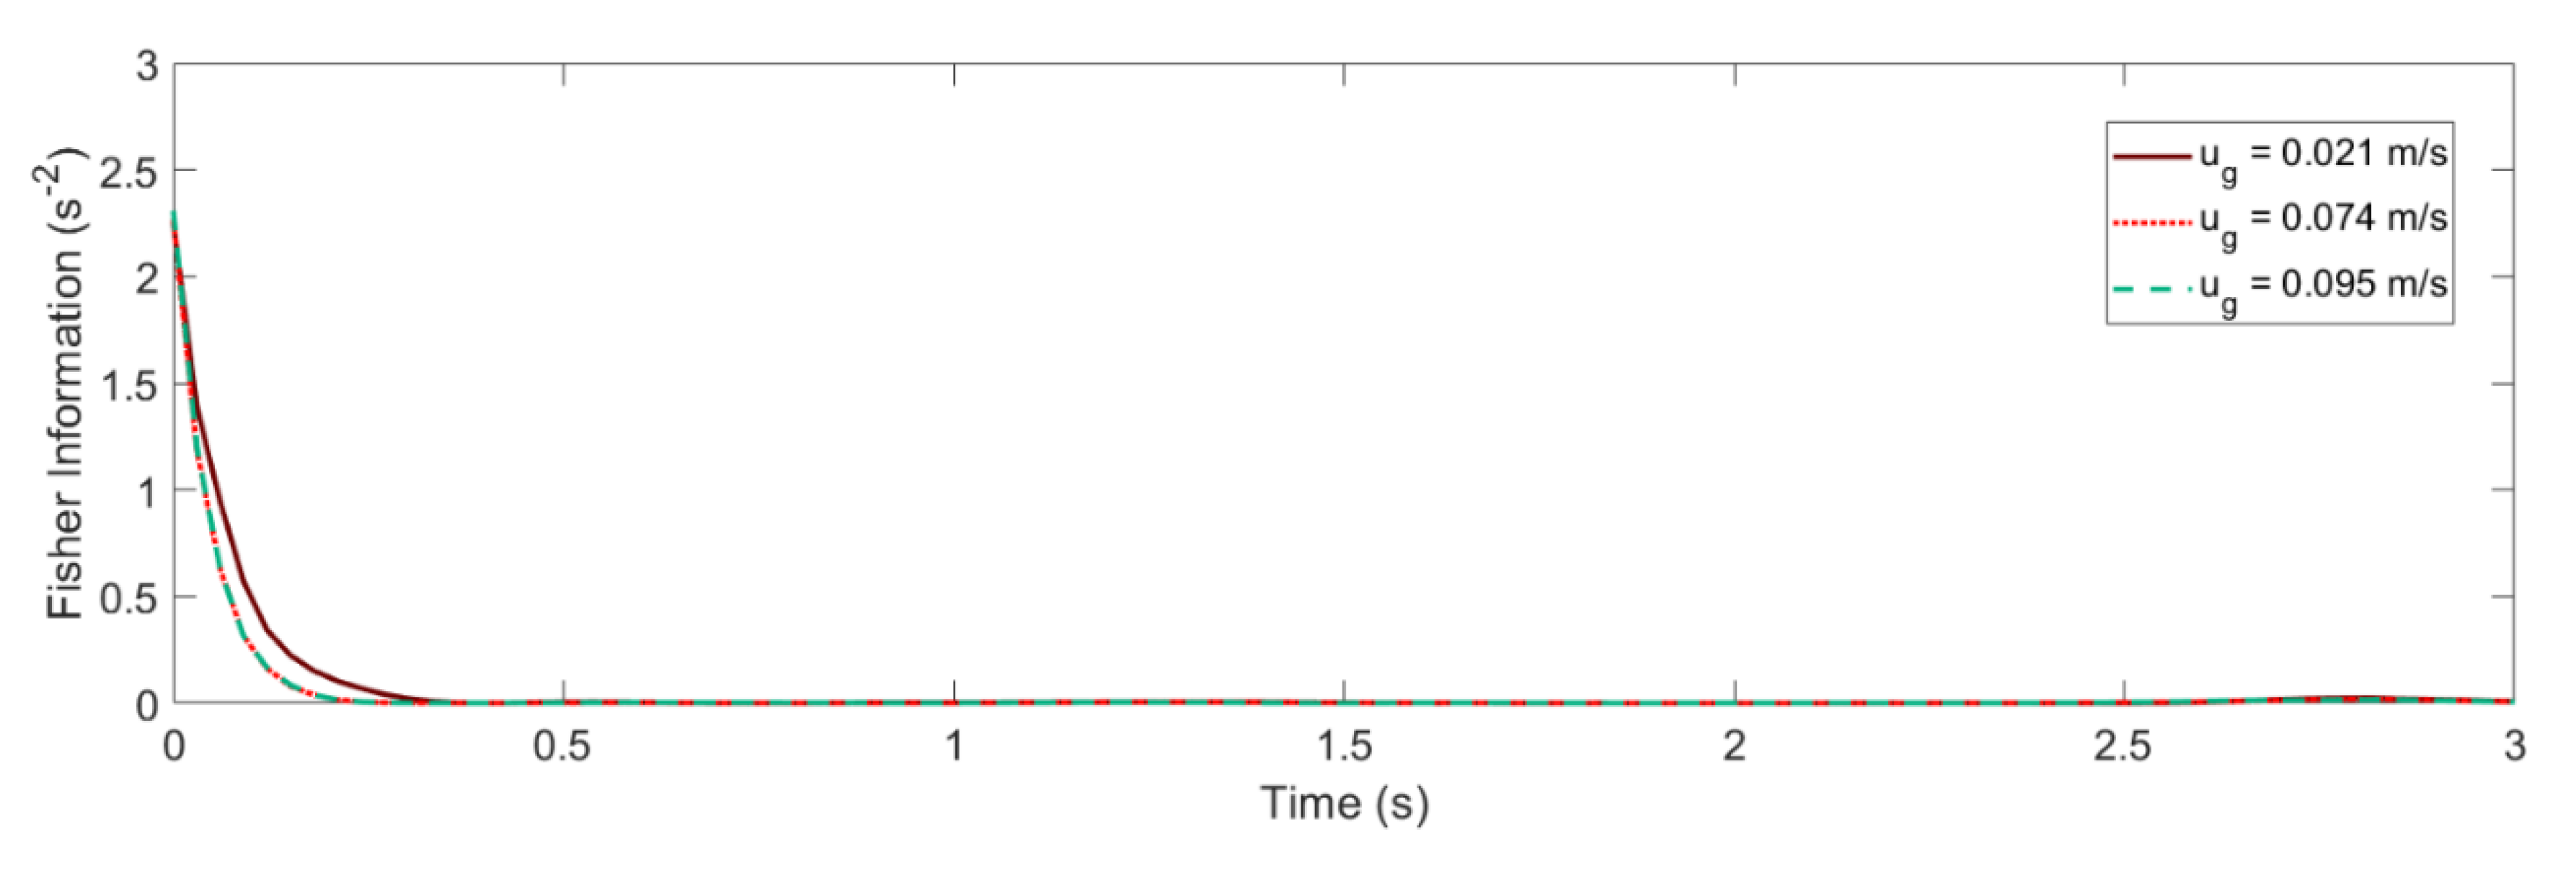
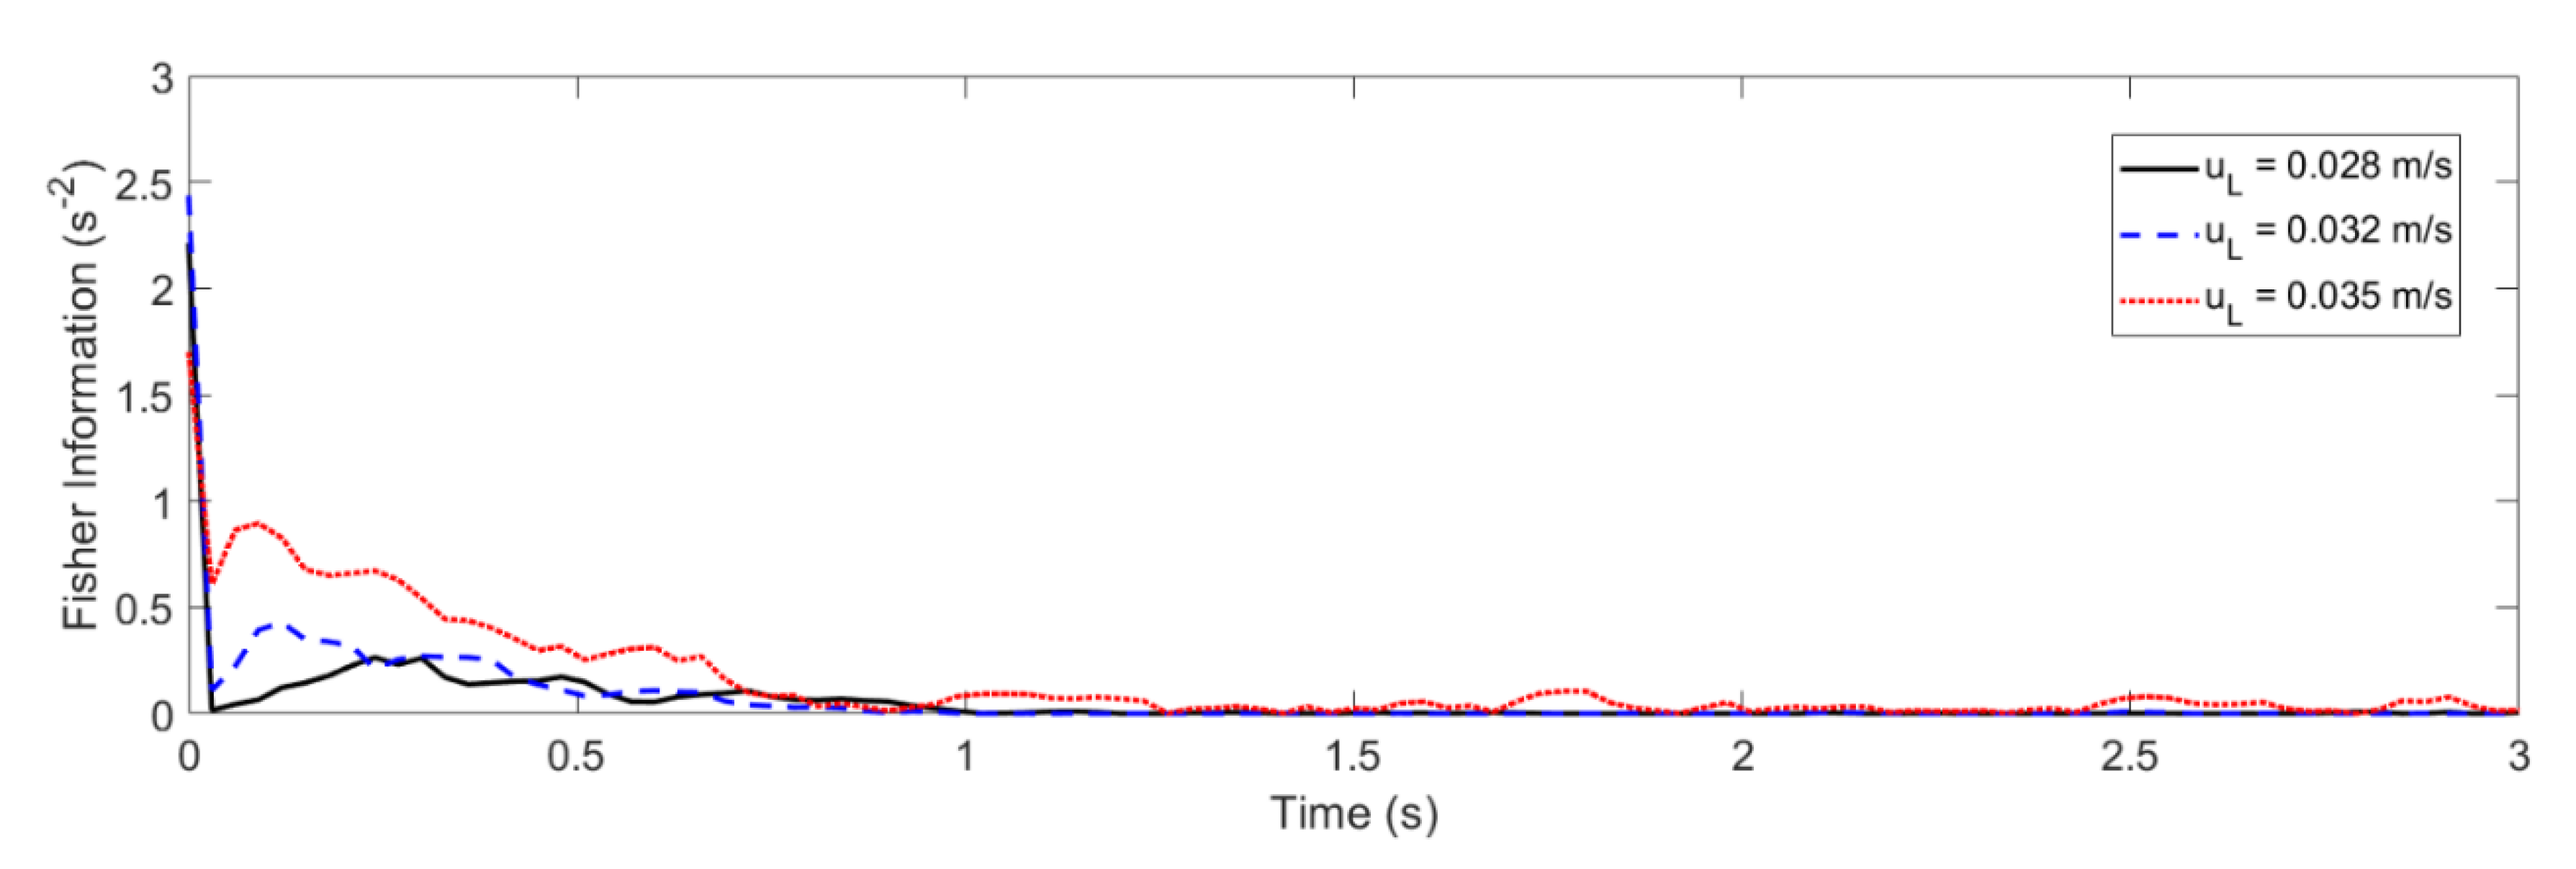
The formal definition of the Fisher information is the squared time derivative of the Shannon entropy ( d / dt ) 2 . In other words, Fisher information can be interpreted as the squared velocity of the Shannon entropy evolution; thus, it is feasible to obtain an approximate value from the slope of ( t ) , as shown in Figure 8.
Recent theoretical investigations regarding applying information geometry to the fluctuation–response ratio of physical observables provided a general and simple criterion for stability [43,44,45]. According to Ito (2019), Fisher information can be interpreted as the speed change in a probability simplex evolution over time [43]. In the context of information geometry, the fluctuation of any observable is constrained by its Fisher information. A decay in the Fisher information is equivalent to convergence to stability. This criterion is the Lyapunov stability criterion with the Fisher information as the Lyapunov function [43].
A definition of the Glandsdorff–Prigogine stability measure is the time derivative of the Fisher information [43]. Since the Fisher information is a positive definite quantity for being the square of a real number, there are three main options:
  • If the Glandsdorff–Prigogine stability measure sign is positive, the Fisher information diverges, so the entropy also diverges rapidly; thus, the system is unstable.
  • If the Glandsdorff–Prigogine stability measure sign is negative, the Fisher information will decay to zero; thus, the Shannon entropy reaches a state where it does not change over time, making the system stable.
  • A Glandsdorff–Prigogine stability measure tending to zero means that the system is either stable (e.g., fixed bed) or metastable, in which cases could be used to set operating window limits.
Unstable systems are difficult to control, so they are not advisable to run on an industrial scale [36,46]. Stability studies are important to determine, for example, the safe operational windows where the fluctuations in the position of the particles are bounded. The sign of the Fisher information speed rate is used as the Glansdorff–Prigogine criterion for the stability of non-stationary dynamics [43], as follows:
t ( d Ω dt ) 2 0 Stability t ( d Ω dt ) 2 > 0 Instability
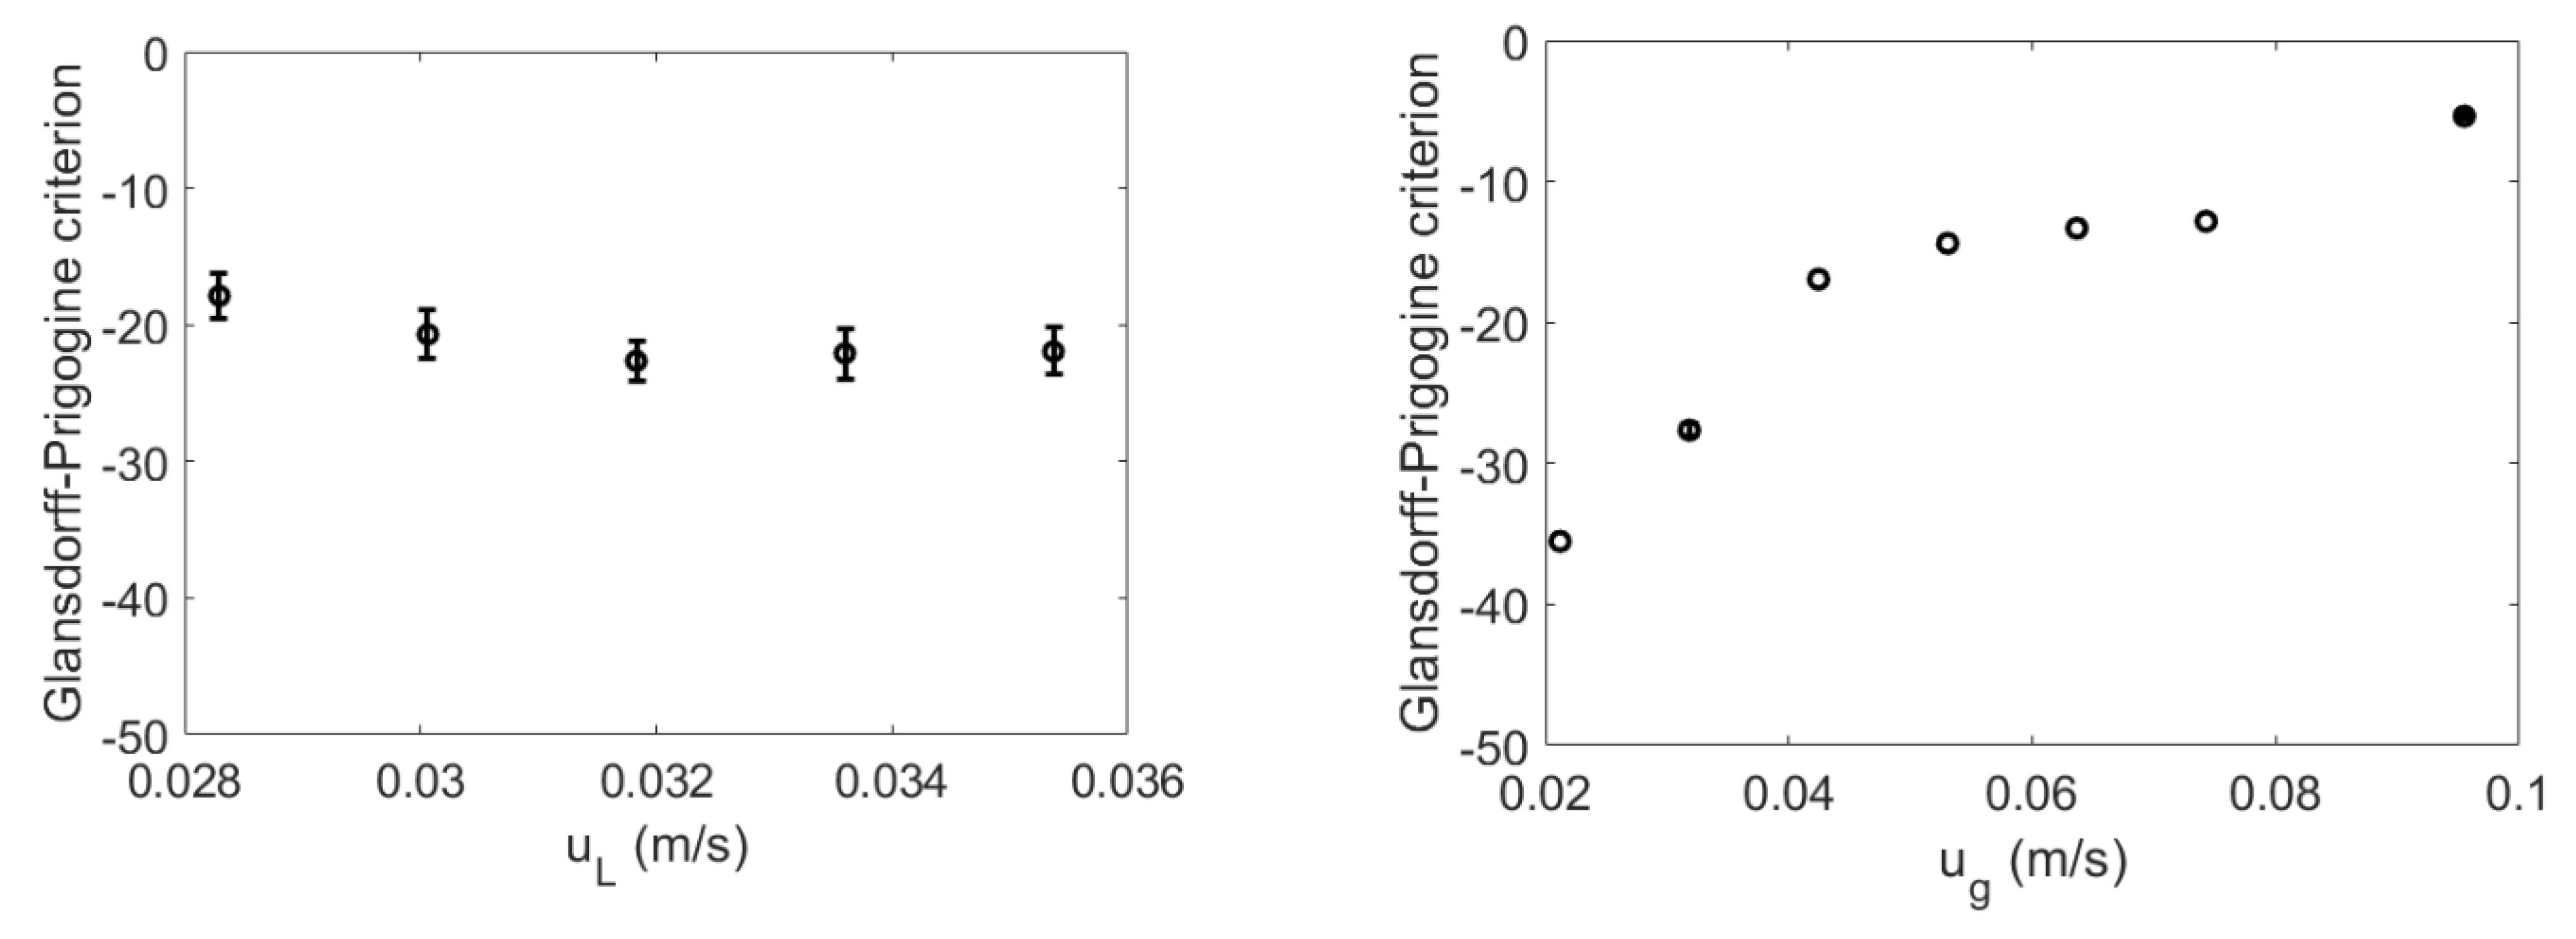
Figure 9 shows the gap values of Fisher information comparing the initial state of the manifold and the moment after mixing time. There was a clear contrast between the LSFB and the GLSFB systems; the Fisher information gap slightly increased on the LSFB operating window while the GLSFB decreased with the gas velocity.
It was systematically checked within their explored operational windows that both fluidized systems are stable from the Glandorsff–Prigogine stability perspective. The LSFB maintained a rather constant stability measure (Figure 9, left), since the flow patterns maintained great similarity within the fluidization regime [47]. On the other hand, the GLSFB stability tended to zero as the gas velocity increased (Figure 9, right). This contrast is reflected in the variability of the flow regimes observed in GLSFB [46]; the tendency break detected at low gas velocities coincides with the flow regime change from bubble flow to a heterogeneous flow regime [48]. The upper tendency change can be assigned to the onset of the churn flow. A further increase in the gas velocity could mean the carryover of the solid particles, turning the fluidized state unstable.

5. Conclusions

An advanced tomographic method that allows recovering the path of a freely moving tracer in three dimensions proved appropriate for extracting thorough information within multiphase systems. Radioactive particle tracking (RPT) data enabled the experimental stability analysis of freely moving particle trajectories within pilot-scale fluidization equipment, operated as an LSFB and a GLSFB, which are difficult to obtain otherwise. From the analysis of RPT trajectory manifolds, a normalized form of Shannon entropy arises as a useful statistic to study the homogeneity, mixing, and stability of the fluidized particles.
Normalized Shannon entropy obtained from the trajectories determined by RPT is an excellent tool for the quantitative determination of mixing times. Axial profiles of mixing times in the GLSFB point to a sharp minimum at 0.15 m, interpreted as a hot spot of turbulence. On the other hand, the LSFB shows a smoother axial profile of mixing times. Mixing times are remarkably similar in order of magnitude, pointing out that convergence to stability is a major driver of mixing.
In all operating conditions, it was observed that, regardless of the starting point, after a certain time, the entropy obtained from trajectory manifolds reached a quasi-invariant value in time, denoting the presence of a pseudo-stationary state, which is a thermodynamically stable system in the Lyapunov sense. New theoretical developments in information geometry confirmed a previous stability criterion based on the Shannon entropy time evolution. The Fisher information can be interpreted as the squared Shannon entropy rate of change. Slowing the Fisher information means the stability of the system and vice-versa; this criterion is equivalent to the Glansdorff–Prigogine criterion for stability. While the LSFB system presents a rather constant stability measure, the GLSFB system stability changes significantly through the explored operational window due to flow regime changes, which the Glansdorff–Prigogine stability criterion could successfully capture. It is worth recalling that this criterion can be applied to any observable measured as a time series.

Author Contributions

Conceptualization, G.S.; Formal analysis, writing original draft, and data visualization, A.G.; Formal analysis, review, and editing, M.M.; Data curation, J.P.; Data visualization, M.C.; Conceptualization, experimental design, supervision, funding acquisition, C.D.B.; Funding acquisition and editing, M.A.C.; Experimental data acquisition and editing, D.H.; Experimental data acquisition and editing, H.S.; Experimental data acquisition and editing. All authors have read and agreed to the published version of the manuscript.

Funding

Financial support from Högskolestiftelsen i Österbotten (2804720/28600122); the Harry Schaumans Foundation (2804720/28002257); Slovenian Research Agency (ARRS); Basic Core Funding Grants P1-0125 and P2-0209; CONICET (PIP1122015-0100902CO); and Universidad de Buenos Aires (UBACyT 20020130100544BA) is gratefully acknowledged.

Data Availability Statement

The data presented in this study are available on request from the corresponding author.

Acknowledgments

We would particularly like to thank the staff of the RA1 reactor of CNEA, Argentina, for activating the sources used in this work.

Conflicts of Interest

The authors declare no conflict of interest.

References

  1. Agricola, G. De Re Metallica; Dover Publications: Mineola, NY, USA, 2013; ISBN 978-1-306-32529-5. [Google Scholar]
  2. Piovano, S.; Salierno, G.L.; Montmany, E.; D’Agostino, M.; Maestri, M.; Cassanello, M. Bed Expansion and Particle Classification in Liquid Fluidized Beds with Structured Internals. Chem. Eng. Technol. 2015, 38, 423–430. [Google Scholar] [CrossRef]
  3. Salucci, E.; Russo, V.; Salmi, T.; Di Serio, M.; Tesser, R. Intraparticle Model for Non-Uniform Active Phase Distribution Catalysts in a Batch Reactor. Chem. Eng. 2021, 5, 38. [Google Scholar] [CrossRef]
  4. Loewert, M.; Pfeifer, P. Dynamically Operated Fischer-Tropsch Synthesis in PtL-Part 1: System Response on Intermittent Feed. Chem. Eng. 2020, 4, 21. [Google Scholar] [CrossRef] [Green Version]
  5. Chen, K.-H.; Wang, S.S.-S.; Show, P.-L.; Lin, G.-T.; Chang, Y.-K. A Rapid and Efficient Technique for Direct Extraction of C-Phycocyanin from Highly Turbid Spirulina Platensis Algae Using Hydrophobic Interaction Chromatography in Stirred Fluidized Bed. Biochem. Eng. J. 2018, 140, 47–56. [Google Scholar] [CrossRef]
  6. Maciel, K.S.; Santos, L.S.; Bonomo, R.C.F.; Verissimo, L.A.A.; Minim, V.P.R.; Minim, L.A. Purification of Lactoferrin from Sweet Whey Using Ultrafiltration Followed by Expanded Bed Chromatography. Sep. Purif. Technol. 2020, 251, 117324. [Google Scholar] [CrossRef]
  7. Pangarkar, V.G. Process Intensification in Multiphase Reactors: From Concept to Reality. Chem. Eng. Process. 2017, 120, 1–8. [Google Scholar] [CrossRef]
  8. Van Gerven, T.; Stankiewicz, A. Structure, Energy, Synergy, Time—The Fundamentals of Process Intensification. Ind. Eng. Chem. Res. 2009, 48, 2465–2474. [Google Scholar] [CrossRef]
  9. Reay, D.; Ramshaw, C.; Harvey, A. Process Intensification. In Process Intensification; Elsevier: Amsterdam, The Netherlands, 2013; pp. 27–55. ISBN 978-0-08-098304-2. [Google Scholar]
  10. Duduković, M.; Mills, P. Scale-up and Multiphase Reaction Engineering. Curr. Opin. Chem. 2015, 9, 49–58. [Google Scholar] [CrossRef]
  11. Ali, N.; Al-Juwaya, T.; Al-Dahhan, M. An Advanced Evaluation of the Mechanistic Scale-up Methodology of Gas–Solid Spouted Beds Using Radioactive Particle Tracking. Particuology 2017, 34, 48–60. [Google Scholar] [CrossRef]
  12. Goniva, C.; Kloss, C.; Deen, N.G.; Kuipers, J.A.M.; Pirker, S. Influence of Rolling Friction on Single Spout Fluidized Bed Simulation. Particuology 2012, 10, 582–591. [Google Scholar] [CrossRef]
  13. Hager, A.; Kloss, C.; Goniva, C. Combining Open Source and Easy Access in the field of DEM and coupled CFD-DEM: LIGGGHTS®, CFDEM®coupling and CFDEM®workbench. In Computer Aided Chemical Engineering; 28 European Symposium on Computer Aided Process Engineering; Friedl, A., Klemeš, J.J., Radl, S., Varbanov, P.S., Wallek, T., Eds.; Elsevier: Amsterdam, The Netherlands, 2018; Volume 43, pp. 1699–1704. [Google Scholar]
  14. Roy, S. Radiotracer and Particle Tracking Methods, Modeling and Scale-Up. AIChE J. 2017, 63, 314–326. [Google Scholar] [CrossRef]
  15. Salierno, G.; Maestri, M.; Piovano, S.; Cassanello, M.; Cardona, M.A.; Hojman, D.; Somacal, H. Solid Motion in a Three-Phase Bubble Column Examined with Radioactive Particle Tracking. Flow Meas. Instrum. 2018, 62, 196–204. [Google Scholar] [CrossRef]
  16. Wang, M. Industrial Tomography: Systems and Applications; Elsevier: Boston, MA, USA, 2015; ISBN 978-1-78242-118-4. [Google Scholar]
  17. Chaouki, J.; Larachi, F.; Dudukovic, M.P. (Eds.) Non-Invasive Monitoring of Multiphase Flows; Elsevier: Amsterdam, The Netherlands; New York, NY, USA, 1997; ISBN 978-0-444-82521-6. [Google Scholar]
  18. Bhusarapu, S.; Cassanello, M.; Al-Dahhan, M.H.; Dudukovic, M.P.; Trujillo, S.; O’Hern, T.J. Dynamical Features of the Solid Motion in Gas–Solid Risers. Int. J. Multiph. Flow 2007, 33, 164–181. [Google Scholar] [CrossRef]
  19. Salierno, G.L.; Maestri, M.; Piovano, S.; Cassanello, M.; Cardona, M.A.; Hojman, D.; Somacal, H. Discrete Axial Motion of a Radioactive Tracer Reconstructed from the Response of Axially Aligned Detectors: Application to the Analysis of a Bubble Column Dynamics. Chem. Eng. Sci. 2013, 100, 402–412. [Google Scholar] [CrossRef]
  20. Shiraishi, N.; Sagawa, T. Fluctuation Theorem for Partially Masked Nonequilibrium Dynamics. Phys. Rev. E 2015, 91, 012130. [Google Scholar] [CrossRef] [Green Version]
  21. Cover, T.M.; Thomas, J.A. Elements of Information Theory; John Wiley & Sons, Inc.: Hoboken, NJ, USA, 2001; ISBN 978-0-471-20061-1. [Google Scholar]
  22. Salierno, G.; Maestri, M.; Piovano, S.; Cassanello, M.; Cardona, M.A.; Hojman, D.; Somacal, H. Features of the Motion of Gel Particles in a Three-Phase Bubble Column under Foaming and Non-Foaming Conditions. Chin. J. Chem. Eng. 2018, 26, 1370–1382. [Google Scholar] [CrossRef]
  23. Liu, M.; Liu, L.; Zhang, H.; Yi, B.; Everaert, N. Alginate Oligosaccharides Preparation, Biological Activities and Their Application in Livestock and Poultry. J. Integr. Agric. 2021, 20, 24–34. [Google Scholar] [CrossRef]
  24. Sutirman, Z.A.; Sanagi, M.M.; Wan Aini, W.I. Alginate-Based Adsorbents for Removal of Metal Ions and Radionuclides from Aqueous Solutions: A Review. Int. J. Biol. Macromol. 2021, 174, 216–228. [Google Scholar] [CrossRef]
  25. Borgiallo, A.; Rojas, R. Reactivity and Heavy Metal Removal Capacity of Calcium Alginate Beads Loaded with Ca–Al Layered Double Hydroxides. Chem. Eng. 2019, 3, 22. [Google Scholar] [CrossRef] [Green Version]
  26. Zhan, T.; Lu, S.; Liu, X.; Teng, H.; Hou, W. Alginate Derived Co3O4/Co Nanoparticles Decorated in N-Doped Porous Carbon as an Efficient Bifunctional Catalyst for Oxygen Evolution and Reduction Reactions. Electrochim. Acta 2018, 265, 681–689. [Google Scholar] [CrossRef]
  27. Ghorbani-Vaghei, R.; Veisi, H.; Aliani, M.H.; Mohammadi, P.; Karmakar, B. Alginate Modified Magnetic Nanoparticles to Immobilization of Gold Nanoparticles as an Efficient Magnetic Nanocatalyst for Reduction of 4-Nitrophenol in Water. J. Mol. Liq. 2021, 327, 114868. [Google Scholar] [CrossRef]
  28. Lorenzoni, A.S.G.; Aydos, L.F.; Klein, M.P.; Ayub, M.A.Z.; Rodrigues, R.C.; Hertz, P.F. Continuous Production of Fructooligosaccharides and Invert Sugar by Chitosan Immobilized Enzymes: Comparison between in Fluidized and Packed Bed Reactors. J. Mol. Catal. B Enzym. 2015, 111, 51–55. [Google Scholar] [CrossRef]
  29. Mehrotra, T.; Dev, S.; Banerjee, A.; Chatterjee, A.; Singh, R.; Aggarwal, S. Use of Immobilized Bacteria for Environmental Bioremediation: A Review. J. Environ. Chem. Eng. 2021, 9, 105920. [Google Scholar] [CrossRef]
  30. Ren, S.; Chen, R.; Wu, Z.; Su, S.; Hou, J.; Yuan, Y. Enzymatic Characteristics of Immobilized Carbonic Anhydrase and Its Applications in CO2 Conversion. Colloids Surf. B Biointerfaces 2021, 204, 111779. [Google Scholar] [CrossRef]
  31. Derksen, J.J. Simulations of Solid–Liquid Mass Transfer in Fixed and Fluidized Beds. Chem. Eng. J. 2014, 255, 233–244. [Google Scholar] [CrossRef]
  32. Cassanello, M.; Larachi, F.; Guy, C.; Chaouki, J. Solids Mixing in Gas-Liquid-Solid Fluidized Beds: Experiments and Modelling. Chem. Eng. Sci. 1996, 51, 2011–2020. [Google Scholar] [CrossRef]
  33. Levenspiel, O. Chemical Reaction Engineering, 3rd ed.; Wiley: New York, NY, USA, 1999; ISBN 978-0-471-25424-9. [Google Scholar]
  34. Wu, D.; Gu, Z.; Li, Y. Attrition of Catalyst Particles in a Laboratory-Scale Fluidized-Bed Reactor. Chem. Eng. Sci. 2015, 135, 431–440. [Google Scholar] [CrossRef]
  35. Martin, C.; Olmos, É.; Collignon, M.-L.; De Isla, N.; Blanchard, F.; Chevalot, I.; Marc, A.; Guedon, E. Revisiting MSC Expansion from Critical Quality Attributes to Critical Culture Process Parameters. Process. Biochem. 2017, 59, 231–243. [Google Scholar] [CrossRef]
  36. Paidoussis, M.P. Fluid-Structure Interactions: Slender Structures and Axial Flow, 2nd ed.; Elsevier: Amsterdam, The Netherlands; Boston, MA, USA, 2014; ISBN 978-0-12-397312-2. [Google Scholar]
  37. Salierno, G.; Maestri, M.; Piovano, S.; Cassanello, M.; Cardona, M.A.; Hojman, D.; Somacal, H. Calcium Alginate Beads Motion in a Foaming Three-Phase Bubble Column. Chem. Eng. J. 2017, 324, 358–369. [Google Scholar] [CrossRef]
  38. Maestri, M.; Salierno, G.; Piovano, S.; Cassanello, M.; Cardona, M.A.; Hojman, D.; Somacal, H. CFD-DEM Modeling of Solid Motion in a Water-Calcium Alginate Fluidized Column and Its Comparison with Results from Radioactive Particle Tracking. Chem. Eng. J. 2019, 377, 120339. [Google Scholar] [CrossRef]
  39. Shannon, C.E. A Mathematical Theory of Communication. Bell Syst. Tech. J. 1948, 27, 379–423. [Google Scholar] [CrossRef] [Green Version]
  40. Abel, M.; Biferale, L.; Cencini, M.; Falcioni, M.; Vergni, D.; Vulpiani, A. Exit-Times and ϵ-Entropy for Dynamical Systems, Stochastic Processes, and Turbulence. Phys. D Nonlinear Phenom. 2000, 147, 12–35. [Google Scholar] [CrossRef] [Green Version]
  41. Guida, A.; Nienow, A.W.; Barigou, M. Shannon Entropy for Local and Global Description of Mixing by Lagrangian Particle Tracking. Chem. Eng. Sci. 2010, 65, 2865–2883. [Google Scholar] [CrossRef]
  42. Prigogine, I.; Nicolis, G. Self-Organisation in Nonequilibrium Systems: Towards A Dynamics of Complexity. In Bifurcation Analysis; Hazewinkel, M., Jurkovich, R., Paelinck, J.H.P., Eds.; Springer: Dordrecht, The Netherlands, 1985; pp. 3–12. ISBN 978-94-009-6241-5. [Google Scholar]
  43. Ito, S. Thermodynamics of Information Geometry as a Generalization of the Glansdorff-Prigogine Criterion for Stability. arXiv 2019, arXiv:1908.09446. [Google Scholar]
  44. Ito, S.; Dechant, A. Stochastic Time-Evolution, Information Geometry and the Cramer-Rao Bound. arXiv 2019, arXiv:1810.06832. [Google Scholar] [CrossRef]
  45. Yoshimura, K.; Ito, S. Information Geometric Inequalities of Chemical Thermodynamics. arXiv 2020, arXiv:2005.08444. [Google Scholar]
  46. Ebrahimi-Mamaghani, A.; Sotudeh-Gharebagh, R.; Zarghami, R.; Mostoufi, N. Dynamics of Two-Phase Flow in Vertical Pipes. J. Fluids Struct. 2019, 87, 150–173. [Google Scholar] [CrossRef]
  47. Zhang, Y.; Ren, P.; Li, W.; Yu, K. Turbulent Mass Transfer Model for the Simulation of Liquid-Solid CFB Risers and Its Verification. Powder Technol. 2021, 377, 847–856. [Google Scholar] [CrossRef]
  48. Salierno, G.; Maestri, M.; Picabea, J.; Cassanello, M.; De Blasio, C.; Cardona, M.A.; Hojman, D.; Somacal, H. Industrially Relevant Radioactive Particle Tracking Study on the Motion of Adsorbent Granules Suspended in a Pilot-Scale Water–Air Three-Phase Fluidized Bed. Chem. Eng. Res. Des. 2021, 173, 305–316. [Google Scholar] [CrossRef]
Figure 1. Experimental setup: RPT detectors array.
Chemengineering 05 00065 g001
Figure 2. Axial projection of a trajectories manifold, obtained from GLSFB, starting from a specific voxel.
Chemengineering 05 00065 g002
Figure 3. Manifold of three-dimensional trajectories within the GLSFB (left) and histograms (right) corresponding to the axial position at different times: 0; 0.1; 1; 2; 10, and 20 s. Number of bins: 30.
Chemengineering 05 00065 g003
Figure 4. Normalized Shannon entropy as a function of the manifold time for the LSFB (above) and the GLSFB (below), shown for different fluid superficial velocities.
Chemengineering 05 00065 g004aChemengineering 05 00065 g004b
Figure 5. Asymptotical Shannon entropy as a function of the superficial fluid velocity: LSFB (left) and GLSFB (right).
Chemengineering 05 00065 g005
Figure 6. Axial mixing time profiles for the LSFB (left) and the GLSFB (right) systems.
Chemengineering 05 00065 g006
Figure 7. Normalized Shannon entropy production depending on the column height for LSFB (left) and the GLSFB (right) systems under different stirring conditions.
Chemengineering 05 00065 g007
Figure 8. Fisher information as a function of time for the LSFB (above) and the GLSFB (below).
Chemengineering 05 00065 g008aChemengineering 05 00065 g008b
Figure 9. Fisher information variation during mixing time for the LSFB (left) and the GLSFB (right) systems.
Chemengineering 05 00065 g009
Publisher’s Note: MDPI stays neutral with regard to jurisdictional claims in published maps and institutional affiliations.