Article

3-D Multi-Tubular Reactor Model Development for the Oxidative Dehydrogenation of Butene to 1,3-Butadiene

Graduate School of Chemical and Chemical Engineering, Inha University, 100 Inha-ro, Michuhol-gu, Incheon 22212, Korea
*
Author to whom correspondence should be addressed.
ChemEngineering 2020, 4(3), 46; https://doi.org/10.3390/chemengineering4030046
Submission received: 29 April 2020 / Revised: 5 June 2020 / Accepted: 16 July 2020 / Published: 21 July 2020
(This article belongs to the Special Issue Computational Fluid Dynamics (CFD) of Chemical Processes)

Abstract

:
The oxidative dehydrogenation (ODH) of butene has been recently developed as a viable alternative for the synthesis of 1,3-butadiene due to its advantages over other conventional methods. Various catalytic reactors for this process have been previously studied, albeit with a focus on lab-scale design. In this study, a multi-tubular reactor model for the butadiene synthesis via ODH of butene was developed using computational fluid dynamics (CFD). For this, the 3D multi-tubular model, which combines complex reaction kinetics with a shell-side coolant fluid over a series of individual reactor tubes, was generated using OpenFOAM®. Then, the developed model was validated and analyzed with the experimental results, which gave a maximum error of 7.5%. Finally, parametric studies were conducted to evaluate the effect of thermodynamic conditions (isothermal, non-isothermal and adiabatic), feed temperature, and gas velocity on reactor performance. The results showed the formation of a hotspot at the reactor exit, which necessitates an efficient temperature control at that section of the reactor. It was also found that as the temperature increased, the conversion and yield increased whilst the selectivity decreased. The converse was found for increasing velocities.

1. Introduction

Hydrocarbons such as butene and 1,3-butadiene (butadiene) are important building block chemicals [1]. For example, butadiene is a major product of the petrochemical industry, largely used in the production of synthetic rubbers such as styrene-butadiene-rubber (SBR) and polybutadiene rubber (PBR), which are intermediates used to produce tires and plastic materials. The majority of butadiene, which accounts for over 95% of global production, has been produced as a byproduct of the steam cracking of hydrocarbons such as naphtha [2,3]. To date, steam crackers are the main process units to produce butadiene. In this process, the mixture of steam and hydrocarbon is used as feedstock and heated to extremely high temperatures [1]. Then naphtha, which is composed of heavier hydrocarbons (C5–C12), breaks into lighter hydrocarbons such as ethylene, propylene, and other light olefins [4]. Subsequently, a separation process is required after steam cracking, and butadiene is extracted by an aprotic polar solvent from crude C4 raffinates [5]. However, this conventional route is not only an energy-consuming process because the reaction is highly endothermic, but also requires additional energy to activate the reactant [6]. The reaction at high temperature also leads to the deposition of coke formed by the pyrolysis of hydrocarbon with reported high CO2 emissions [7]. In recent years, using natural gas and refinery gas as feedstock has increased and the production of naphtha-based ethylene has also decreased due to the shale gas revolution. As a result, only a small amount of butadiene can be obtained to meet the growing global demand, which leads to a shortage of butadiene supply [5,8]. Thus, a more efficient butadiene production process is required in terms of both economic and environmental perspectives. Consequently, alternative processes such as direct dehydrogenation of n-butane and oxidative dehydrogenation of n-butene have been widely studied [6,9]. Catalytic or direct dehydrogenation reactions occur on metal surfaces and acid sites where alkene (or alkane) decomposes into olefin and hydrogen [7,8]. Although there are several commercial catalytic dehydrogenation processes including Catofin and UOP Oleflex [10], a few problems that inhibit the commercialization of the direct dehydrogenation have been found. First of all, the process is highly endothermic, so the reaction occurs at a relatively high temperature (e.g., 500 to 650 °C) [9,11]. Furthermore, such severe reaction conditions cause side reactions such as thermal cracking and rapid coke formation on the catalysts, which leads to catalyst deactivation [12]. To overcome such limitations, oxidative dehydrogenation (ODH) of n-butene has been proposed and has been widely studied in recent years [9,10,11]. ODH is an exothermic reaction at relatively low temperature (e.g., 300 to 400 °C), which takes place in the presence of oxygen on the surface of catalysts, producing C4 olefin. Thus, the exothermic reaction at a lower temperature can reduce a substantial amount of energy compared to the direct dehydrogenation process [7]. Furthermore, the presence of oxygen easily prevents coke deposition on the catalyst surface through promoting coke combustion. However, some challenging issues are still presented as the selectivity of the product is strongly dependent on the reaction condition used [7,13]. Multiple byproducts are produced by the ODH reaction, and the gas phase oxygen in lattice and butene (or butane) can also form combustion products such as carbon dioxide and water. Hence, previous studies have been extensively conducted to improve the selectivity and yield of butadiene at mild reaction conditions to enable the ODH process to compete with steam cracking technology [7].
For this, researchers have developed novel and efficient catalysts for the ODH process. The catalysts that consist of unsupported metal oxides containing two or more transition metal components such as bismuth molybdates (Bi–Mo) or Bi–Mo combined with V, Fe, Zr, and ferrites, have been extensively used for ODH reaction. V/MgO composites and Cr2O3/Al2O3 catalysts are also used [14,15]. Conversely, Park et al. [11] suggested the use of metal-free carbon nanomaterials as potential catalysts due to their environmental benignity and unique surface characteristics. In particular, ferrite and Bi–Mo catalysts have been extensively used due to their high catalytic activity and selectivity [7,16]. Typically, reaction mechanisms and kinetics are identified before modeling the reaction system for reactor design [17]. Several mechanisms have been suggested for this catalytic reaction. Sterrett and Mcllvried [18] derived semi-empirical kinetic equations for the ODH of butenes to butadiene over a zinc–chromium–ferrite catalyst in a fixed bed reactor, which appears to be an attractive and flexible continuous process for producing butadiene. Ding et al. [19] also investigated the ODH kinetics over ferrite catalysts based on the Mars–Van Krevelen mechanism and proposed redox model rate equations. Téllez et al. [20] carried out a kinetic study of the ODH of butane over V/MgO catalysts and statically analyzed several competing kinetic models such as the Langmuir–Hinshelwood or Mars–Van Krevelen type by extensive experimental work. The study showed that the Mars–Van Krevelen mechanism best fits the reaction data. Recently, kinetic models for novel catalysts such as VOx/Al2O3, CrOxVOx/MCM-41, and (Ni, Fe, Co)–Bi–O/γAl2O3 have also been developed [21,22,23,24].
With the development of kinetic models, efforts have been made to design optimal reactors for the ODH reaction [25]. Several types of reactors have been proposed for this reaction and the adiabatic fixed-bed reactor is known for its simplest design and good product yield and selectivity [26]. The adiabatic operation is important in terms of commercialization because of its conventional usage [18]. However, such systems cannot control the temperature inside the reactor, resulting in more side products [25]. On the other hand, in a fluidized reactor, the uniform particle mixing is achieved and can maintain the temperature and product uniformly across the reactor. Therefore, it has been recommended for highly exothermic and temperature-sensitive reactions. However, the complex behavior of the fluid bed and high initial capital cost due to the expansion and circulation of solid materials in the reactor are known as major drawbacks [27]. A multi-tubular reactor, which is commonly used for several industrial processes, has shown good temperature control for highly exothermic reactions by removing heat using a shell side coolant. The coolant either flows co-currently or counter-currently to achieve the isothermal condition in the reactor because it is essential to avoid rapid temperature increase to maintain the product yield and selectivity [25]. Xingan et al. [16] compared the three above-mentioned reactors on a laboratory and pilot-scale for the ODH of butene to butadiene and indicated that the multi-tubular reactor showed the highest efficiency. Even though the regeneration or replacement of catalysts after deactivation presented challenges for this reactor, oxygen in the feed gas promoted the coke combustion in the ODH reaction, resulting in low catalyst deactivation. For this reason, it was found that the multi-tubular reactor with coolant in the shell-side is appropriate for the ODH reaction.
Particularly in the modeling of reaction systems for reactor design, computational fluid dynamics (CFD) is a well-established tool for predicting the accurate fluid patterns and understanding the transport phenomena and its influences on reactions in chemical engineering. It has also shown great advantages in evaluating and validating the performance of reactors before their actual fabrication and scale up to a pilot plant [25,28]. Therefore, many models have been built for the design and optimization of various types and configurations of reactors using CFD. For instance, Huang et al. [29] developed a two-dimensional multi-scale model for the ODH of butene in the fixed-bed reactor. A more realistic description of flow within a fixed bed reactor was investigated by Dixon et al. [30] and a comprehensive 2D model was also suggested to simulate the flow behavior and reaction by Chen et al. [31]. With respect to multi-tubular reactor modeling, CFD modeling coupled with a reaction model was investigated to predict the effect of coolant flow rate and baffle configurations on o-xylene conversion [28]. Additionally, Fattahi et al. [32] examined a variety of parameters affecting the performance of a multi-tubular system for the ODH of ethane. Furthermore, in the previous work of Mendoza et al. [25], an isothermal multi-tubular fixed-bed reactor was developed for ODH reaction; however, it was found that there were a few limitations. Considering that the model was reduced to a single tubular reactor for simplification, the description of the model such as the flow pattern of the shell-side coolant and the actual transfer phenomena in the reactor could not be represented sufficiently. In addition, the reaction kinetics were assumed to be simple pseudo-first-order kinetics derived from the equations by Ding et al. [19], which showed discrepancies toward the experimental data.
Therefore, this study aimed to develop the 3D multi-tubular reactor model to accurately describe the fluid flow and predict the reactor performance by using CFD simulation. Due to the multi-physics capability of CFD models, complex geometric engineering problems can be easily modeled and simulated. Hence, to provide useful insights into the operation of industrial shell and tube type reactors, the CFD simulation was executed. Rigorous mathematical modeling of the actual reaction kinetics over a powder Zn–Cr–Fe catalyst as reported in Sterrett and Mcllvried [18] was considered. The developed model represents the industrial application of butadiene synthesis to provide insight into the behavior of this process by analyzing the influence of key operating conditions such as flow rates and temperature on the reactor performance, which was not considered in any of the review literature. Moreover, due to the high exothermicity of the reaction process, temperature control was implemented using water as the shell side coolant. The mathematical formulation of the model in terms of mass continuity, momentum transport, and reaction kinetics is presented in Section 2. Section 3 comprises the CFD simulation methods such as geometry and mesh development, design and operating parameters, and solution strategy. The validation and analysis of the results is presented in the results and discussion session (Section 4). The study finally concludes with the findings in Section 5.

2. Model Development

The present study represented the gas phase exothermic reaction of butadiene synthesis via ODH reaction over Zn–Fe–Cr catalysts where the shell side coolant counter-currently flows to maintain the isothermal condition of tubes. The catalyst used in this study had an approximately 1:1:1 proportion by mass of zinc, chromium, and iron, therefore, the catalyst bulk density was estimated at 7393.92 kg/m3. With the porosity of 0.35, the catalyst density was calculated to be 4806.05 kg/m3. [18]. The porous zone conditions were specified to reflect the pressure drop due to porous resistance along the catalyst bed.

2.1. Mass Conservation

The equation for conservation of mass, or continuity equation, can be written as follows:
ρ t + · ( ρ u ) = R
Equation (1) is valid for incompressible as well as compressible flows and the source term, R, is defined as the mass source term due to chemical reaction.
In this system, three gas-phase reactions occurred and the overall species transport equation can be written as:
t ( ρ Y i ) + · ( ρ u Y i ) · ( ρ D i Y i ) = m i + R i
where Y i is the mass fraction of species i, and Di is the mass diffusion coefficient of species i in the mixture. Equation (2) is solved for N − 1 species where N is the total number of chemical species present in the system with the total mass fraction of species in the mixture equal to unity (Equation (3)).
i = 1 n Y i = 1

2.2. Momentum Conservation

The momentum equation is described as:
t ( ρ u ) + · ( ρ u u ) = · ( μ ρ u ) p + ρ g + m ˙ u + S
where μ is the viscosity; p is the pressure; g is the gravitational acceleration vector; and m ˙ is the contribution of mass transfer. The porous media is applied to determine the pressure loss in the flow through the catalytic packed beds, and modeled by the addition of a momentum source term S in the flow equation (Equation (4)). The flow resistance defined by Equation (5) is written as:
S = μ α u + C 1 2 ρ | u | u
The source term S , composed of two terms: the viscous and inertial terms in that order, where α is the permeability of the porous media and C is the inertial resistance.

Turbulent Modeling

Due to the diameter of the tubes and density of the gases, the tube side Reynolds number was calculated to be 2428 in the laminar region. As such, the tubes were modeled as a laminar flow.
With respect to the shell side coolant, the flow was assumed to be turbulent due to the density, velocity, and the viscosity of coolant. Hence, the standard k-epsilon turbulent model by Launder and Spalding [33] was adopted for this study. This model has gained in popularity due to its robustness and reasonable accuracy for a wide range of turbulent flows and valid for fully turbulent flows. It is a semi-empirical model consisting of transport model equations for the turbulence kinetic energy (k) and its dissipation rate (ε). The turbulent viscosity is written as:
t ( ρ k ) = · ( ρ μ t σ k k ) + G k + 2 3 ρ ( · u ) k ρ ε + S k
In Equation (6), Gk is the turbulence kinetic energy generated by the mean velocity gradients; σ k is an empirical constant; S k is the source term; and μ t is the turbulent viscosity defined by Equation (7) as follows:
μ t = C μ k 2 ε
where C μ is the Eddy-viscosity coefficient and the dissipation rate of k is obtained from Equation (8).
t ( ρ ε ) = · ( ρ μ t σ ε ε ) + C 1 G k ε k 2 3 C 1 ρ ( · u ) ε C 2 ρ ε 2 k + S ε
C1, C2, and σ ε are empirical constants and values for constants used in this study were determined as follows [33]: C μ = 0.09, σ k = 1.0, σ ε = 1.3, C1 = 1.44, C2 = 1.92.

2.3. Reaction Kinetics

The oxidative dehydrogenation of butene to butadiene reactions occur in the gas phase with butadiene, carbon dioxide, and water as the only reactor products; according to the experimental study of [18] using a zinc–chromium–ferrite catalyst. The reaction equations (Equations (9)–(11)) are as follows:
C 4 H 8 + 1 2 O 2 C 4 H 6 + H 2 O
C 4 H 8 + 6 O 2 4 CO 2 + 4 H 2 O
C 4 H 6 + 11 2 O 2 4 CO 2 + 3 H 2 O
Sterrett et al. [18] developed the rate of formation of butadiene and carbon dioxide over the range of conditions explored in the kinetic runs. The carbon dioxide production data fitted well with zero-order kinetics, although the rate model that gave the best fit was found to be the semi-empirical and two-site model. Equation (12) indicates the butadiene formation from butene and the butadiene consumption by combustion is represented in Equation (13). Equation (14) is the rate of carbon dioxide formation resulting from the combustion of both butene and butadiene. From Equations (12)–(14), the rate of reactions of all species can be expressed by considering the stoichiometric coefficients of each reaction equations (Equations (15)–(18)). The kinetic parameters used here are presented in Table 1 below.
r B D 1 = A 1 e E 1 / R T p B n p O 2 ( 1 + K O 2 p O 2 ) ( 1 + K B p B + K B D p B D )
r B D 2 = A 2 e E 2 / R T p O 2 p B D ( 1 + K O 2 p O 2 ) ( p B D + p B )
r CO 2 = A 2 e E 2 / R T p O 2 1 + K O 2 p O 2
r B D = r B D 1 r B D 2
r B = r B D 1 1 4 ( r CO 2 4 r B D 2 )
r O 2 = 0.5 r B D 1 6 4 ( r CO 2 4 r B D 2 ) 11 2 r B D 2
r H 2 O = r B D 1 + ( r CO 2 4 r B D 2 ) + 3 r B D 2

2.4. Energy Equations

The energy conservation equation is described as:
t ( ρ ( H + K ) ) + ( ρ u ( H + K ) ) · ( α eff H ) = p ¯ t + ρ g · u + Q ˙ R
where H is the enthalpy of species; K is the kinetic energy; α eff is the effective thermal diffusivity; and Q ˙ R is the rate of heat change due to reactions.

3. Computational Fluid Dynamics (CFD) Simulation Methods

3.1. Geometry and Mesh Generation

3.1.1. Geometric Description of the Multi-Tubular Reactor

In this study, a 3D shell and tube type multi-tubular reactor was designed by SALOME®, an open-source CAD software, as shown in Figure 1. In the previous work by Mendoza et al. [25], a multi-tubular reactor model was reduced to a single tubular reactor and the effect of reactor diameter and types of coolants were analyzed. However, this study presents a shell and tube type reactor close to the actual industrial application to accurately investigate the reactor performance. The reactor has both shell and tube side, and the reaction takes place at tube sides while the coolant flows along the shell side counter-currently.
The model is a single pass shell and tube reactor on both the tube and shell side. The Tubular Exchanger Manufacturers Association (TEMA) [34] standards were used as the design approach for a 14 tubular reactor with a triangular pitch. A triangular pattern was adopted because it is possible to arrange more tubes and enhance heat transfer efficiency. The tube has a length of 81.28 cm (32 in) and an inside diameter of 2.54 cm (1 in) filled with the solid Zn–Fe–Cr powder catalyst [18], with a pitch of 3.18 cm, a shell side diameter and length of 21.33 cm and 81.28 cm, respectively. Baffles were introduced to increase the heat transfer rate for efficient temperature control. These are conventional segmental baffles with a baffle cut of 42% and baffle spacing of 20.32 cm. These and other geometric dimensions of the multi-tubular reactor are shown in Table 2.

3.1.2. Mesh Generation

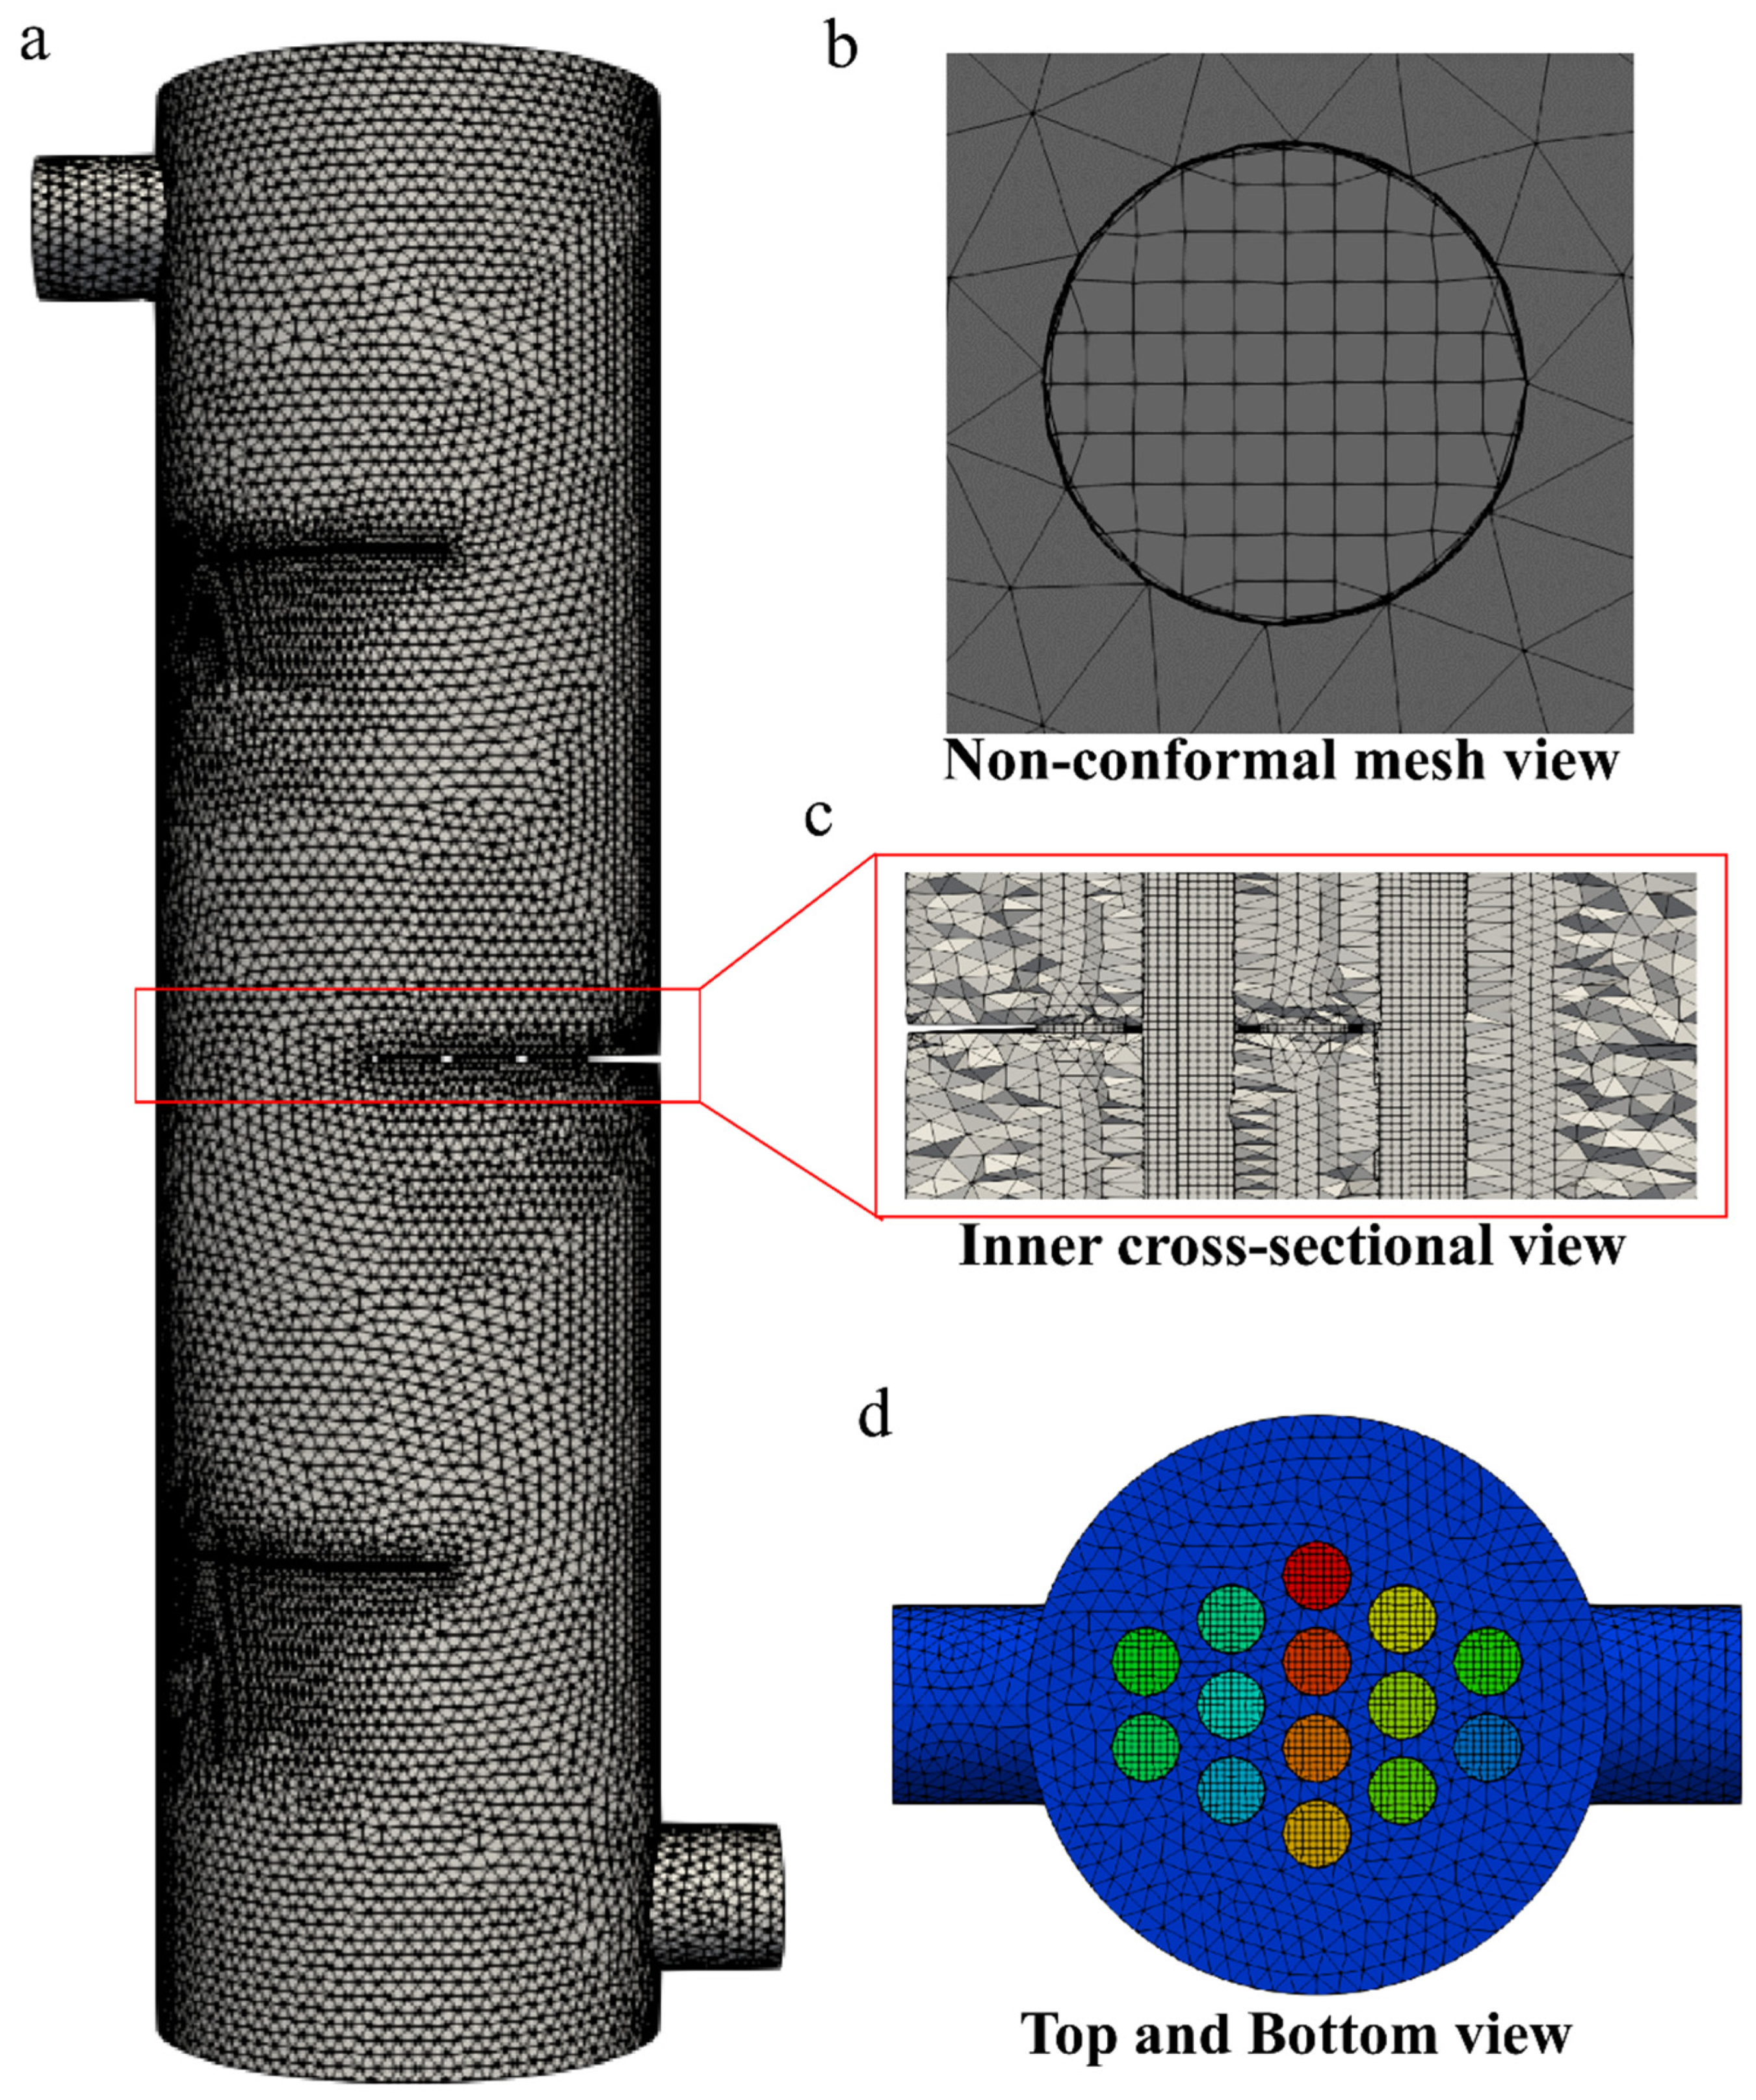
Non-conformal hexahedral dominant meshes were generated for the CFD simulation. The tube side consisted of only hexahedral meshes to enhance the stability of the numerical simulation while the shell side comprised tetrahedral meshes, as shown in Figure 2.
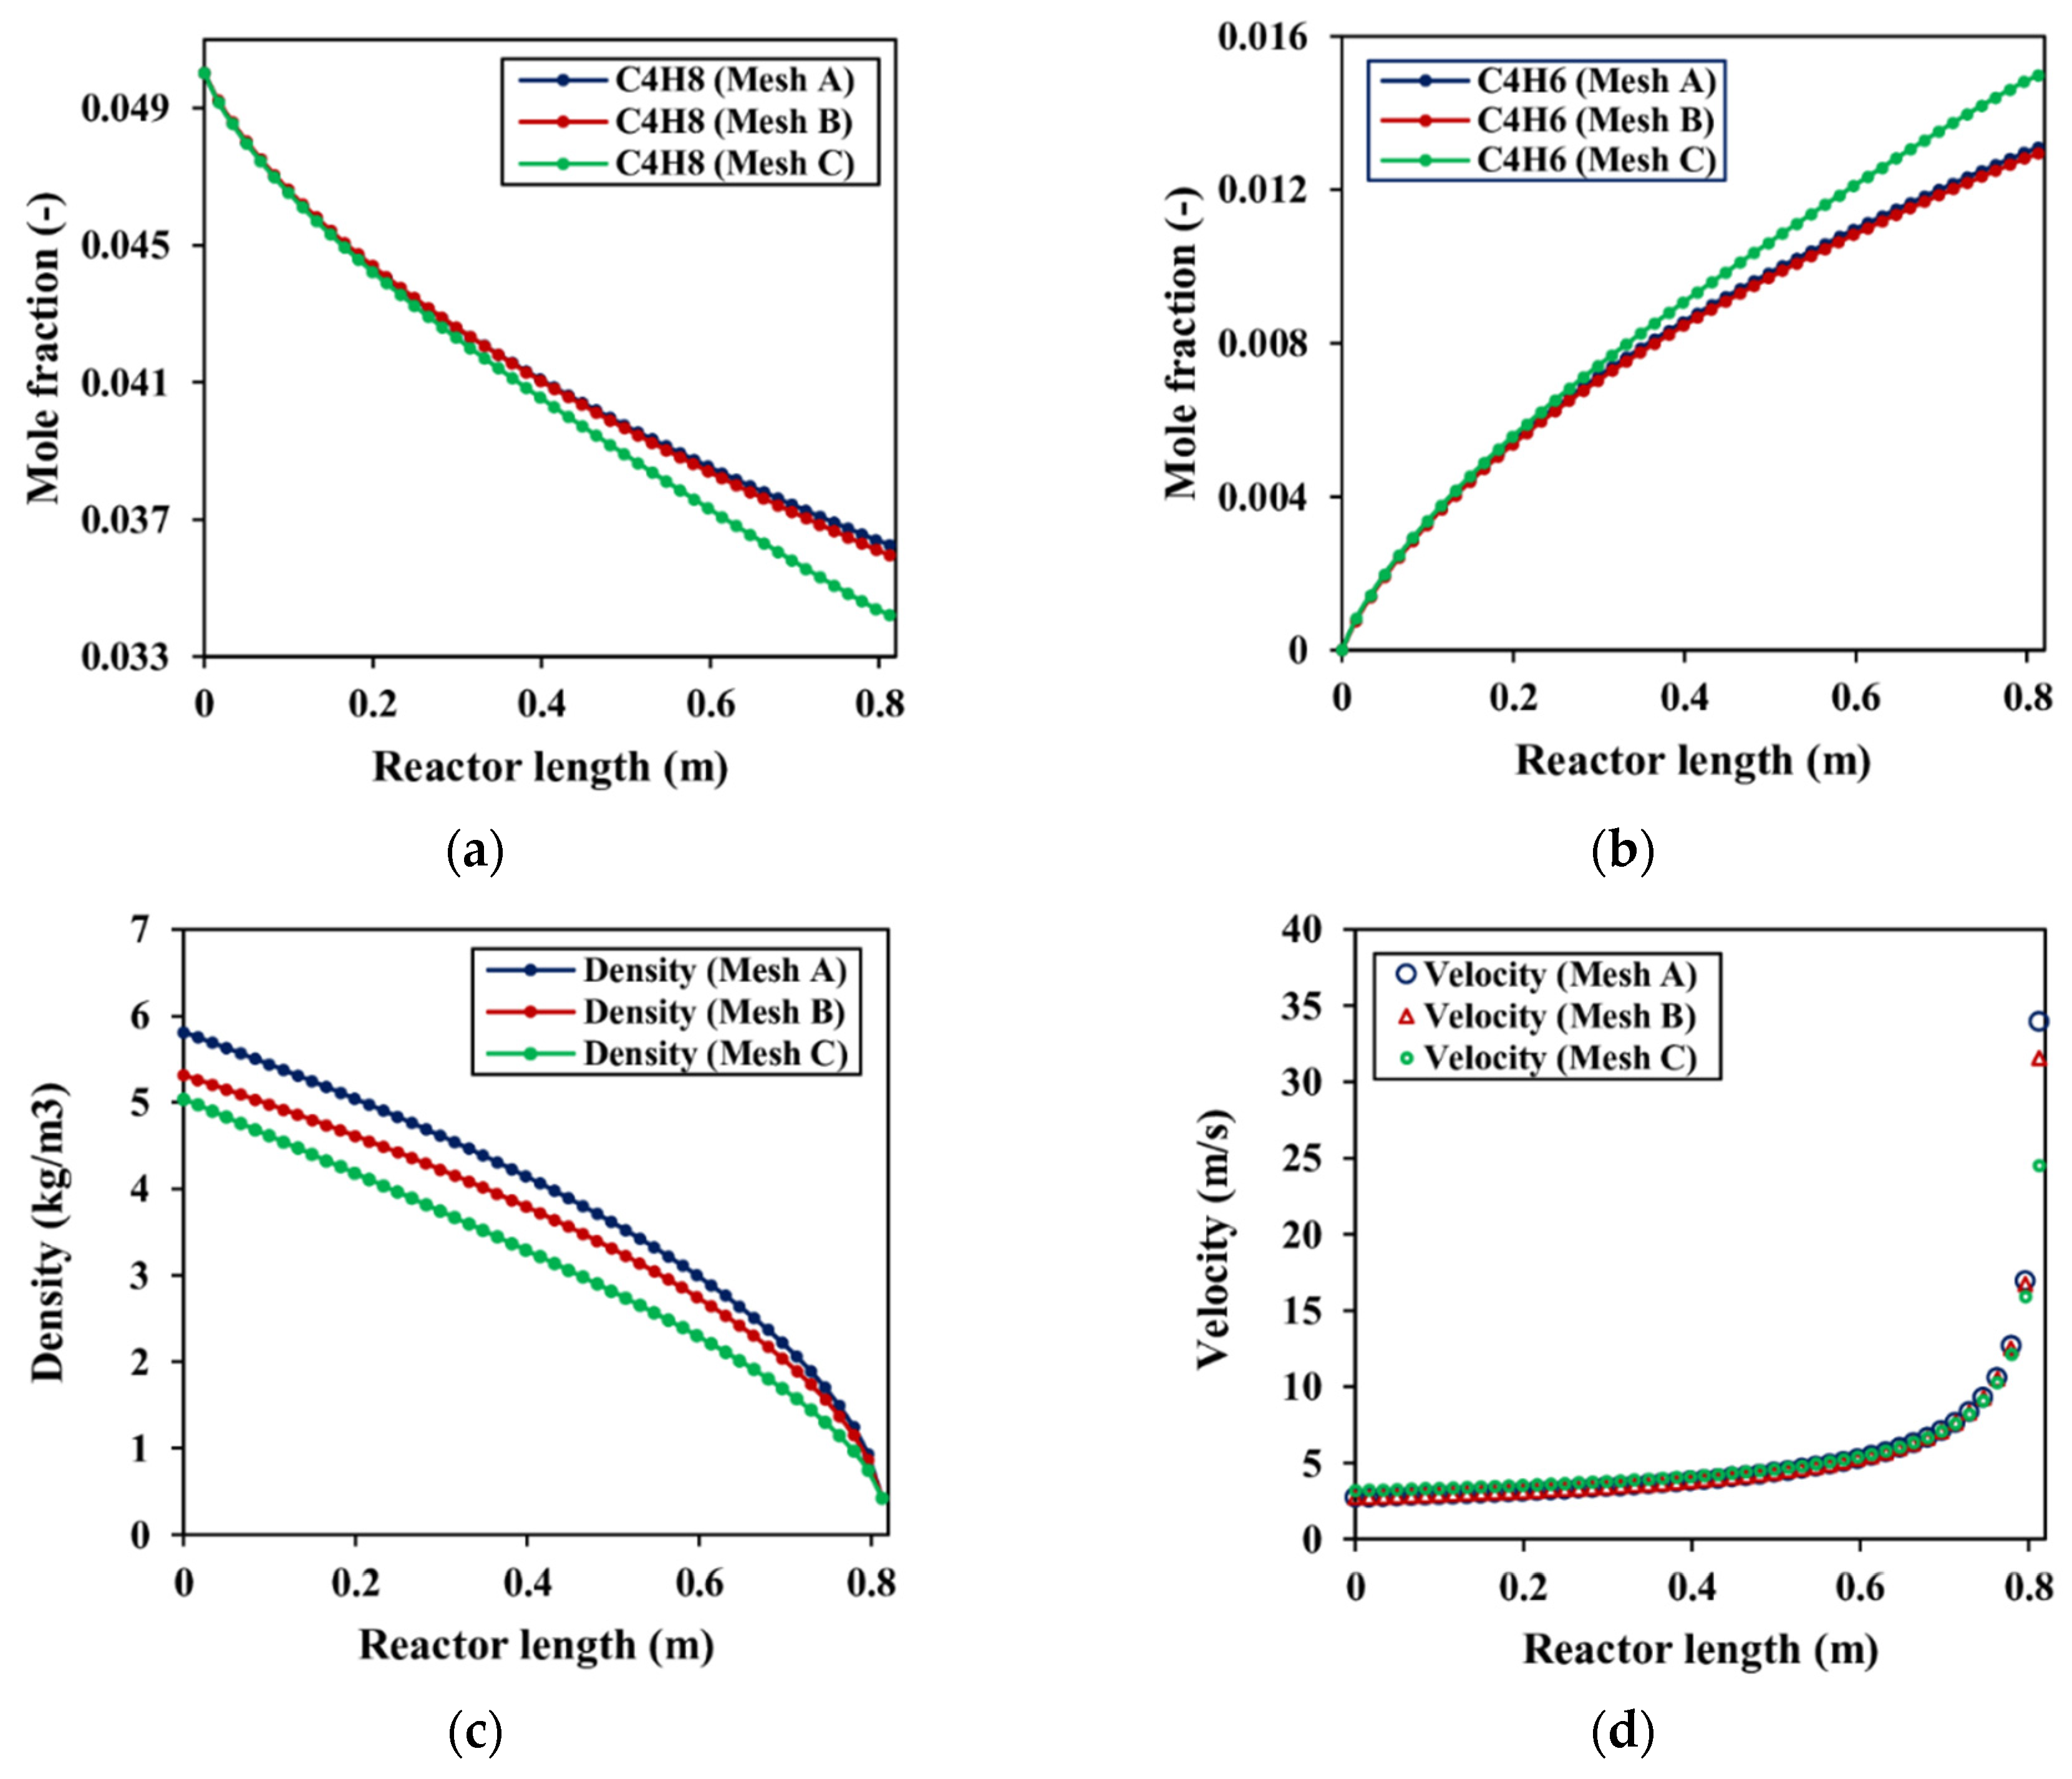
Complex geometries come with high computational cost and resources and as such, a good compromise between mesh size and accuracy needs to be made. A preliminary study using three different mesh sizes was conducted to find the optimal mesh size for the CFD model. Mesh numbers of 1,387,210 (Mesh A), 757,921 (Mesh B), and 532,192 (Mesh C) were generated and investigated using the mole fractions, density, and velocity profile (Section 4.1).
The tube side mesh was generated with OpenFOAM’s in-built SnappyHexMesh utility tool with the maximum orthogonal quality of 27.99 and skewness of 0.64 and an aspect ratio of 3.38. The shell side mesh, on the other hand, was generated with SALOME® CADsd software. The two meshes were then merged together using OpenFOAM® mergeMesh utility. This technique of generating two independent meshes before merging them together allows for a reduction in the computational domain (number of meshes) without compromising the accuracy and convergence of the numerical methods.

3.2. Model Parameters Used in the Computational Fluid Dynamics (CFD) Model

Design and model parameters such as operating conditions, catalyst properties, and boundary conditions are provided in Table 3. The operating conditions and design parameters were obtained from the experimental work of Sterrett et al. [18]. To validate the developed CFD model, a set of experimental data was chosen for comparison. In the experimental study, the inlet gas consisting of butene mixed with nitrogen, water, and oxygen was fed into the fixed bed reactor at 633 K where the outlet partial pressure values were measured for five different weight hourly space velocities (WHSV). As the reactions are exothermic, steam and nitrogen were fed in the reactor as heat sinks for the purpose of maintaining the isothermal conditions. The gas velocity used in the CFD simulation was calculated based on the WHSV. Water was selected as a shell side coolant due to its high specific heat capacity and injected at room temperature (300 K) to enhance temperature control and ensure isothermality of the reactor tubes.

3.3. Solution Strategy

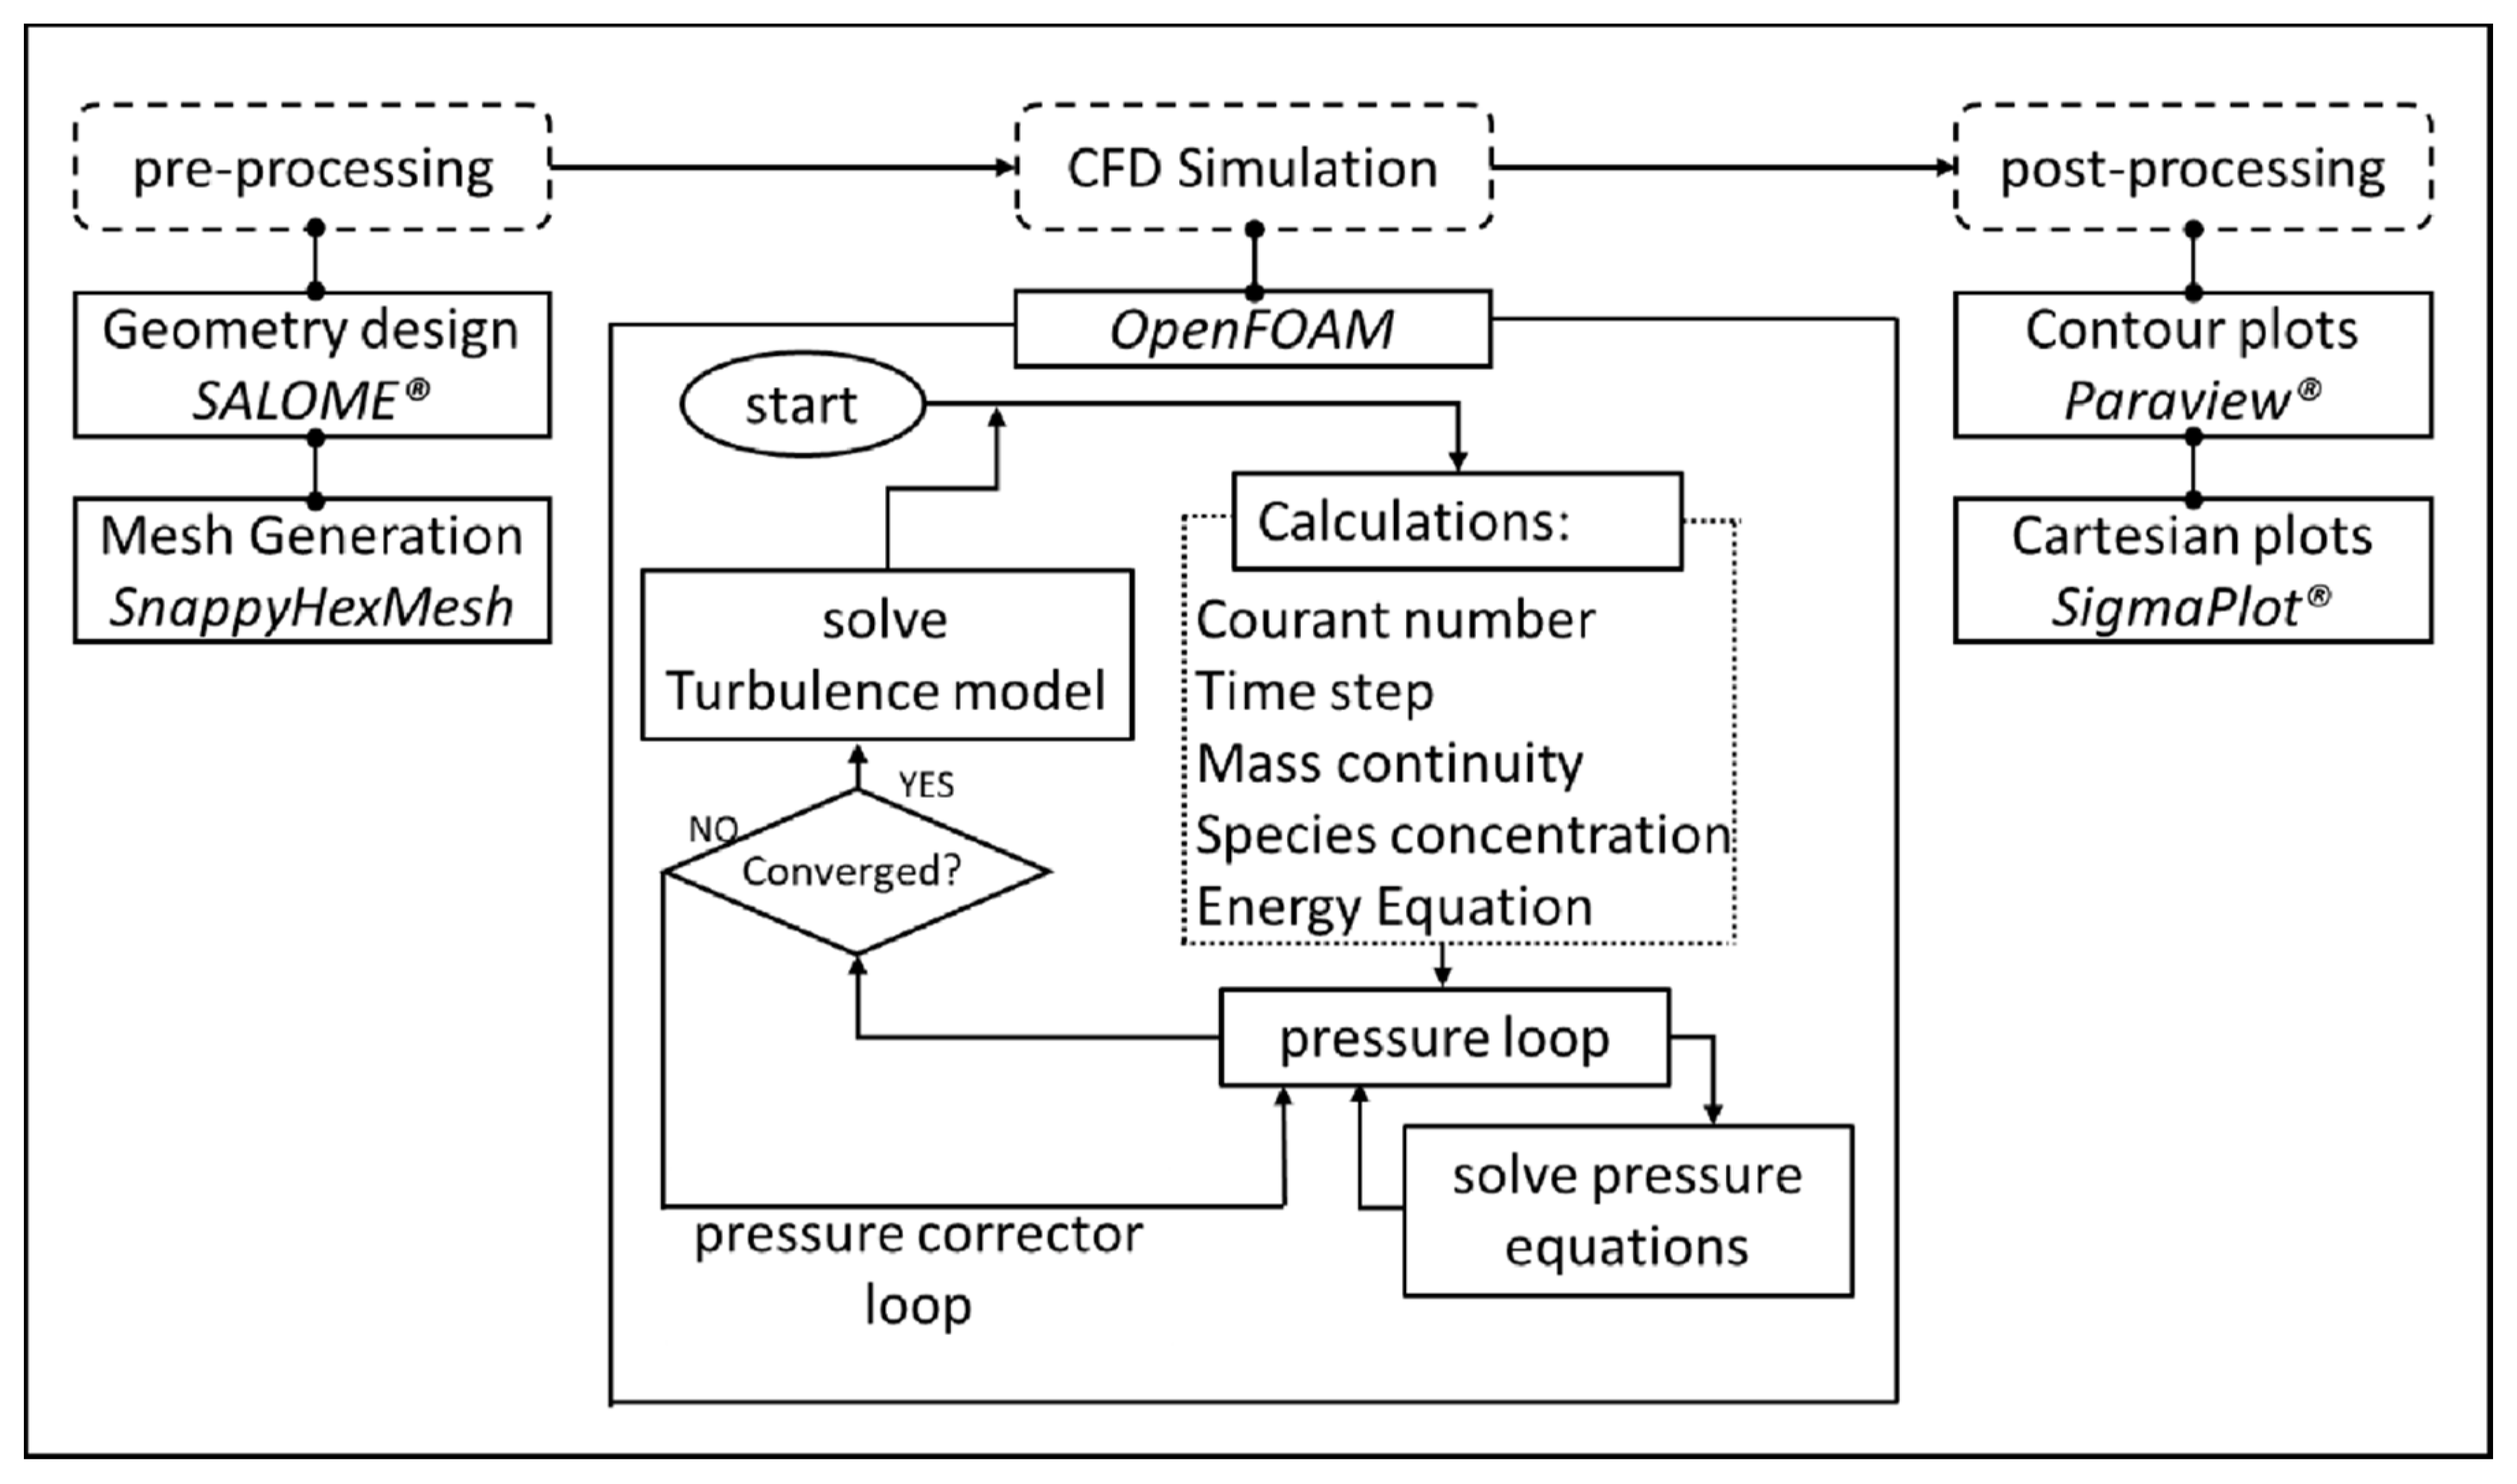
The CFD simulation was executed with OpenFOAM®, an opensource tool for computational fluid dynamics. To include the effect of mass and momentum sources, the equation of continuity and momentum in the adopted OpenFOAM® solver (chtMultiRegionFoam) were modified. The PIMPLE algorithm, a dynamic solver, was applied to solve for pressure-velocity coupling. This allows for the simulation of flows with large time steps in complex geometries such as multi-tubular reactors. For the stability, convergence, and accuracy of the numerical solution, the time step was adjusted after every complete iteration loop by fixing the Courant number to 1. The Courant number measures the traversal of information across the cells in the mesh domain and is recommended to be less than 1. The overall solution strategy performed in the present study is shown in Figure 3. The developed model was simulated by a computer with an Intel Xeon® processor (2.10 GHz, 16 cores) and 64 GB of RAM. For each simulation, the computational time was 23 h, which was a total of 230 h for the ten cases.
A gas-phase catalytic reaction simulation through a particle-filled fixed bed reactor was executed. The detailed description of numerical discretization techniques and boundary conditions in this work adopted from our previous study [35] are given in Table 4 and Table 5. The packed bed was assumed as a continuous porous media to include the effect of pressure drop and heat transfer. Therefore, the porous medium flows can be incorporated by adding viscous and inertial resistance terms in the momentum equations. Consequently, the results obtained by simulation were post-processed with Paraview®, an open-source graphical Virtualization Tool Kit (VTK).

4. Results and Discussion

This chapter comprises two sections. In the first section, the developed 3D multi-tubular reactor model was validated with the experimental results of Sterrett et al. [18] and evaluated under both adiabatic and isothermal conditions. In the second section, a parametric study on the reactor performance was carried out under different thermodynamic conditions and by varying gas velocity and temperature. In each study, gas velocity was varied from 3.25 m/s to 35.31 m/s and the temperature from 610 K to 690 K.

4.1. Mesh Independence Test

Figure 4 shows the mesh independence test results for three different mesh sizes in terms of mole fractions, density, and gas velocity. Meshes A and B predicted the variables to the same extent with only a little deviation in the density predictions. However, mesh C overpredicted all the variables and underpredicted the velocity due to the lack of sufficient mesh resolution. The computational time for the three meshes were 42.5 h (Mesh A), 23 h (Mesh B), and 17 h (Mesh C). Hence, the results indicate that the mesh size of 757,921 (Mesh B) provided a good compromise between computational cost and accuracy and was used for all subsequent simulations.

4.2. 3D Model Validation and Analysis

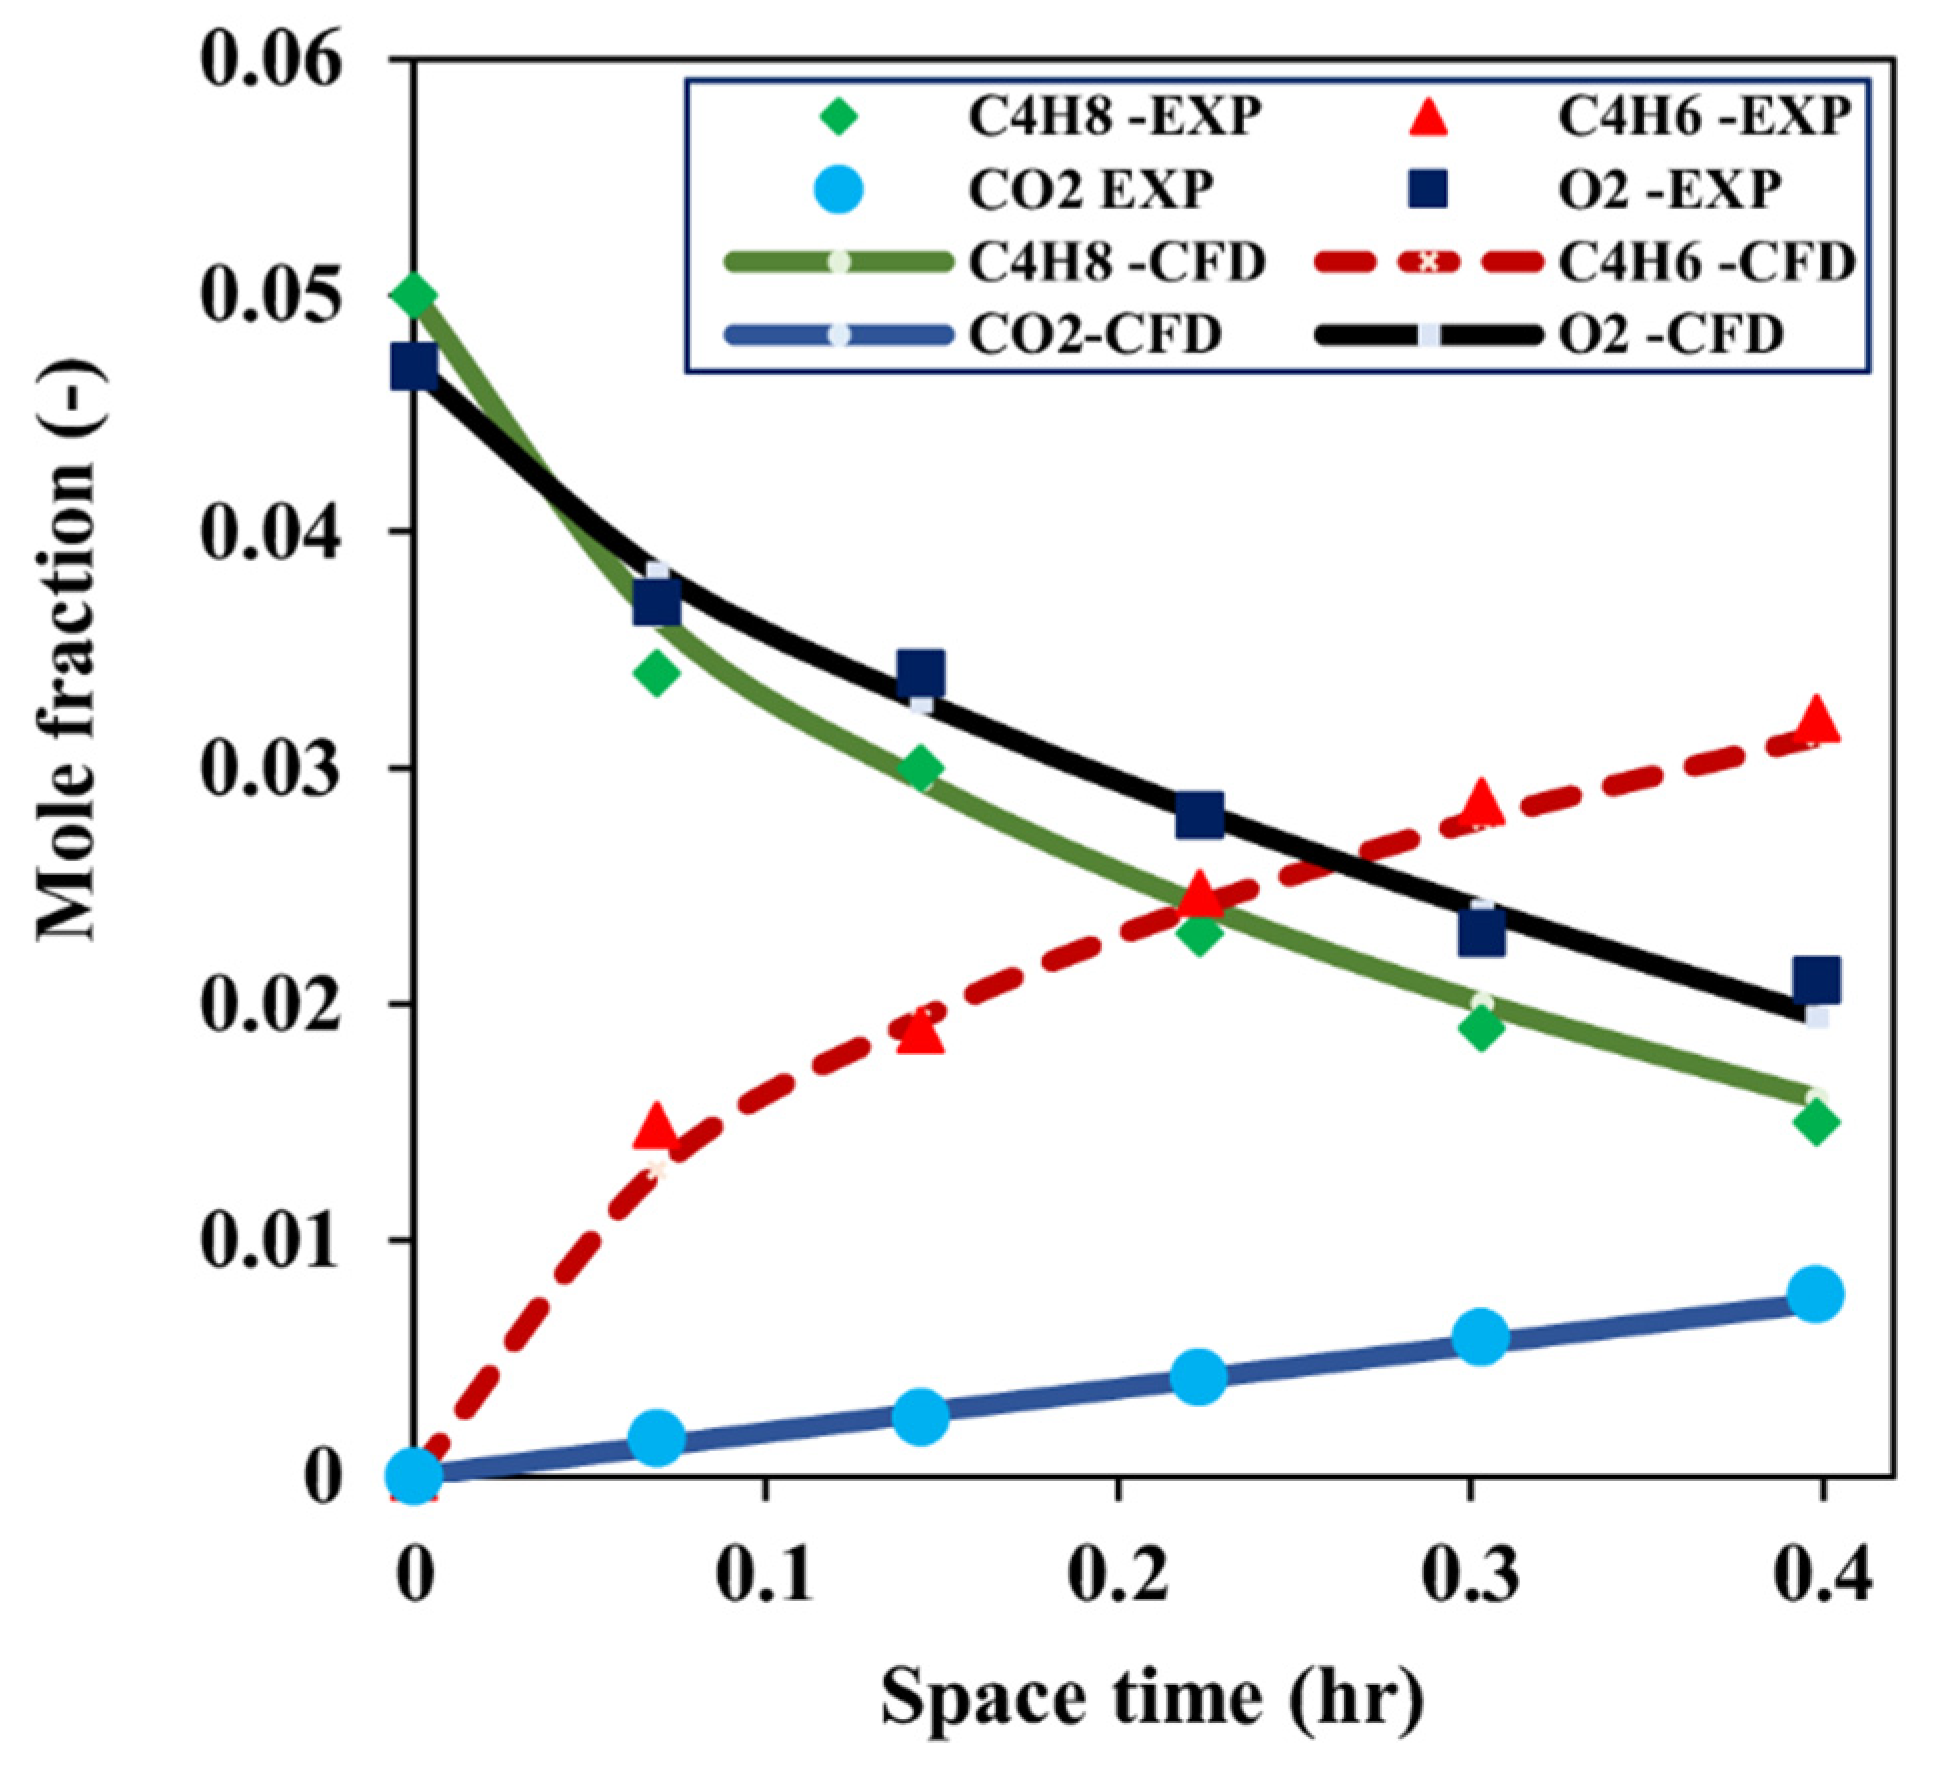
Figure 5 indicates the comparison between the CFD simulation results and experimental data in terms of mole fractions. Both the CFD simulation and experiment studies were carried out at 633 K under isothermal conditions achieved by suitable temperature control. Five different runs were made by varying the space time (residence time) from 0.069 h to 0.398 h. During the reactions, the butene and oxygen were consumed while producing butadiene, carbon dioxide, and water. To accurately validate the adequacy of the CFD model, the fundamental conservation equations and reaction kinetic equations derived based on the experimental results were employed. In addition, process conditions and model parameters used in the experiment (Table 3) were also used. It was assumed that the gravitational effect was negligible and the isothermal conditions were maintained within each tube as used in the experiment. In addition, the catalyst bed was modeled as a porous zone. As a result, it was observed that the data from the CFD simulation fitted well with the experimental results, giving a maximum error of 7.5%.
In industrial processes, cylindrical fixed-bed reactors with relatively large diameter filled with solid catalysts are typically used for mild exothermic or endothermic reactions due to their simple design and straightforward construction. Meanwhile, if the reactions require extensive heat removal, tube-type reactors are appropriate for temperature control [36]. It is known that the ODH of butene to butadiene is a highly exothermic reaction where a substantial amount of heat should be removed during the reactions.
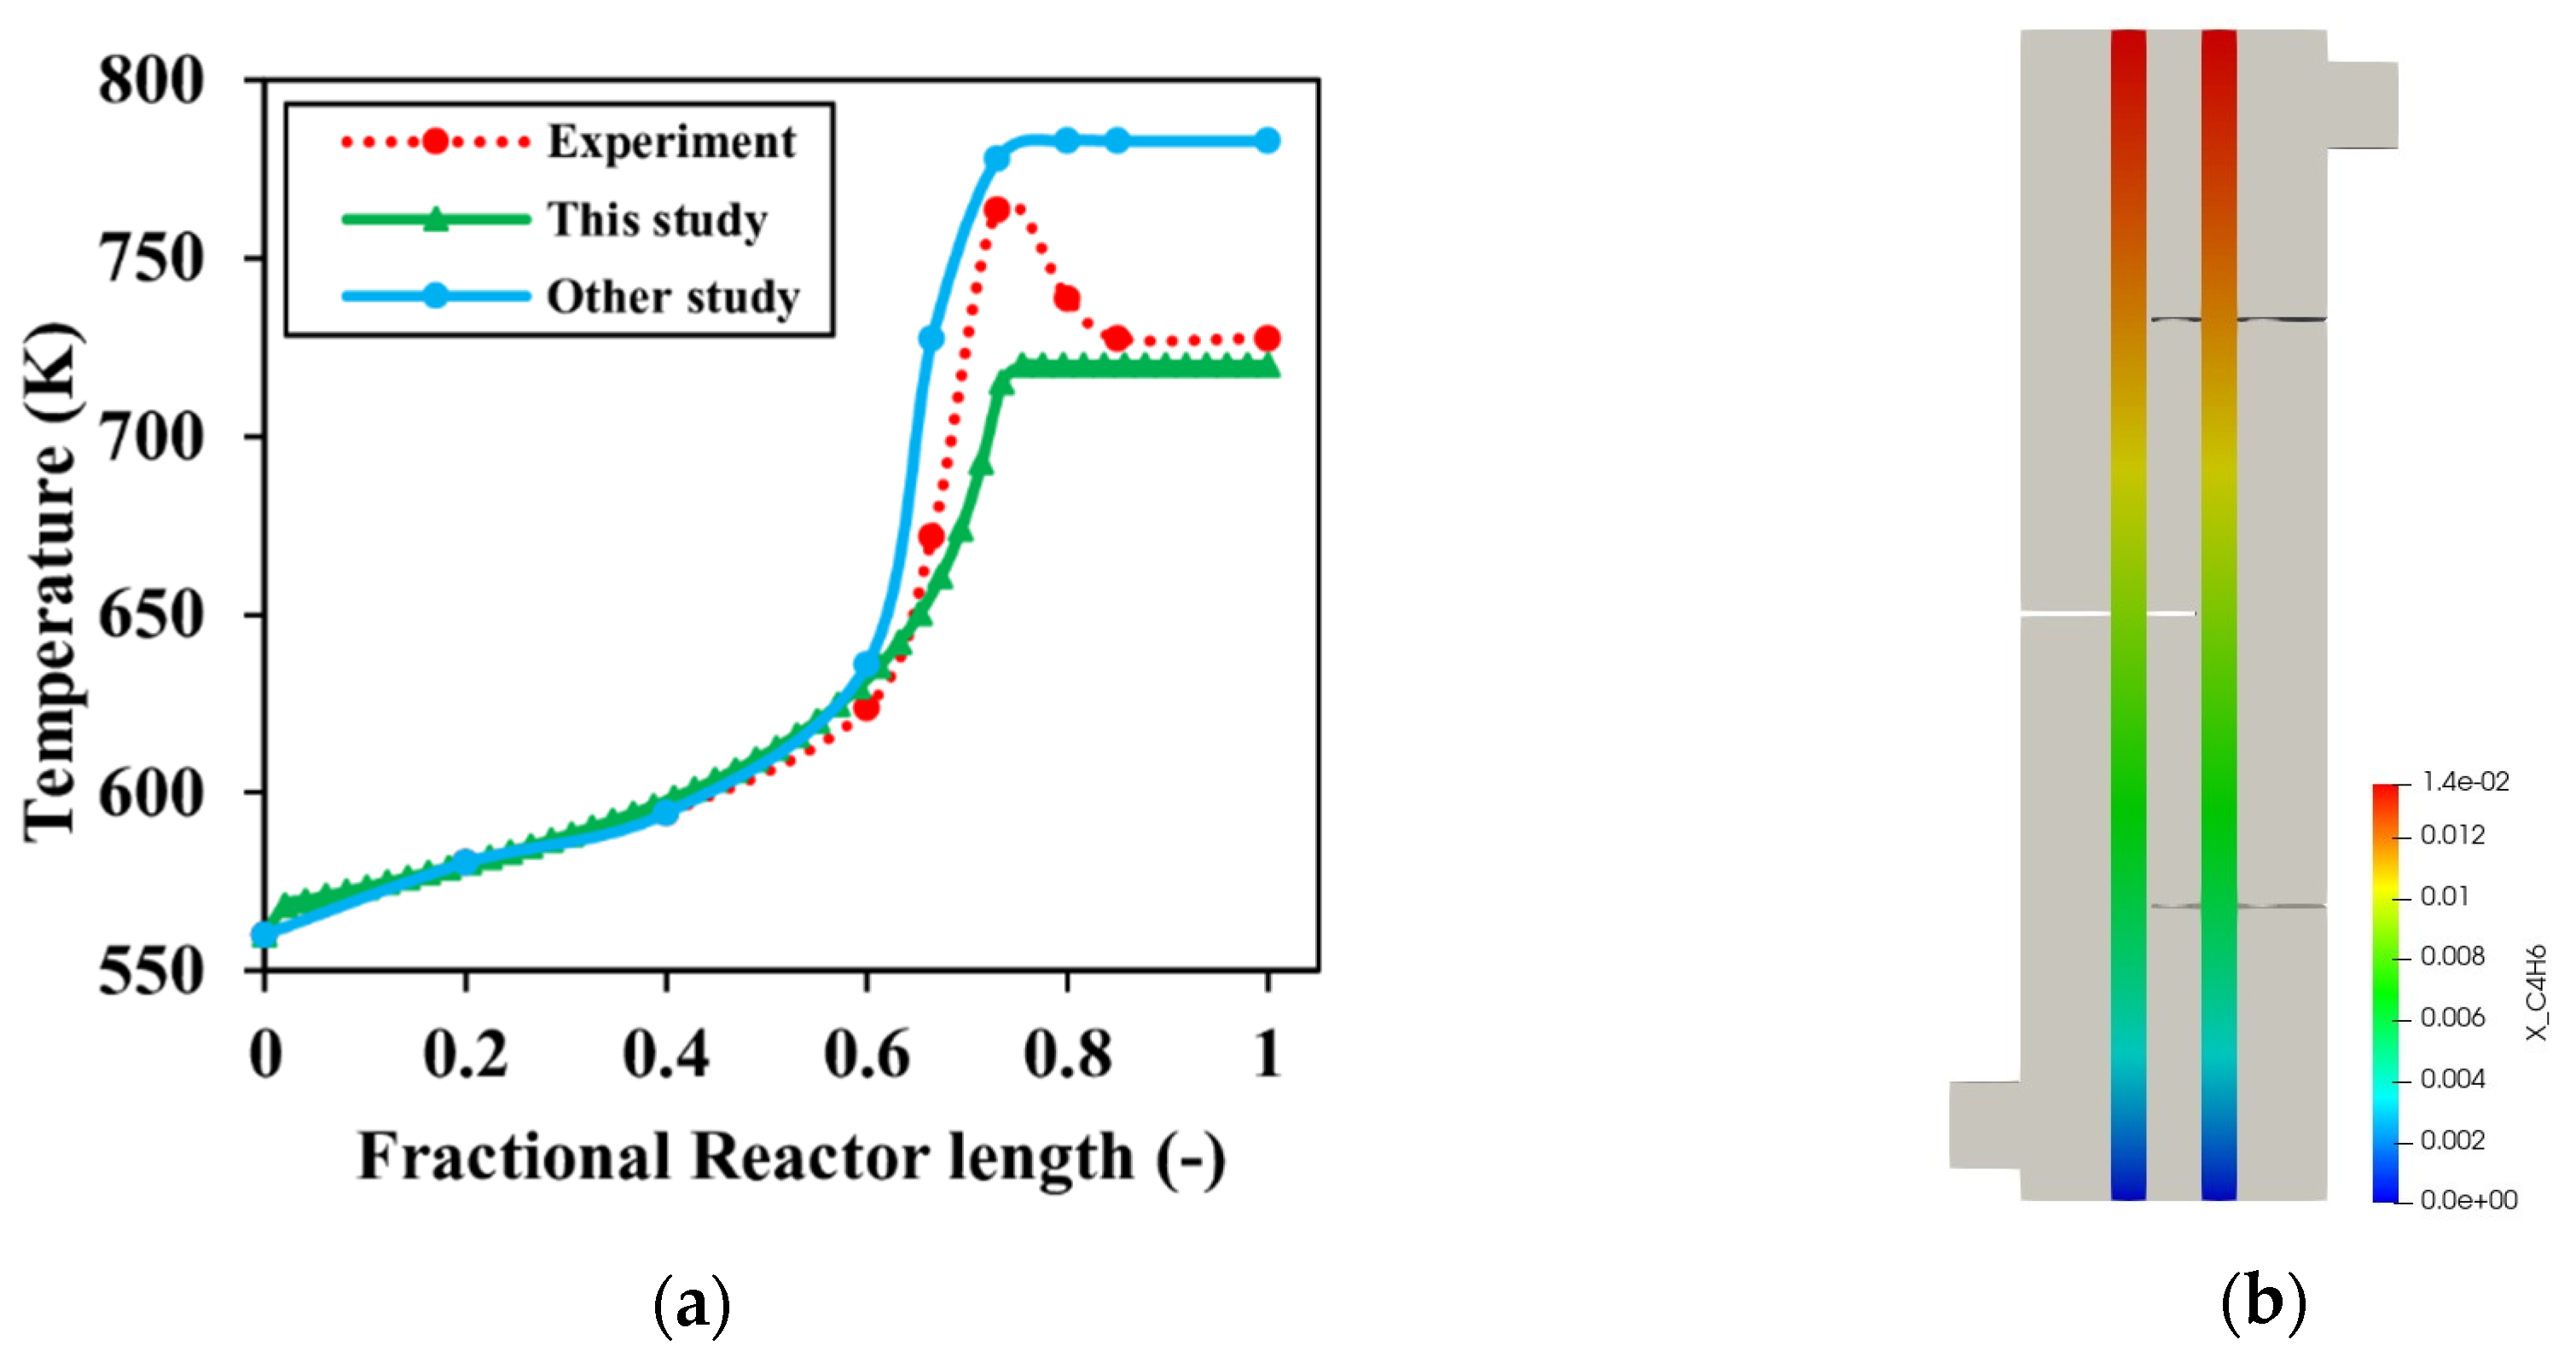
Therefore, Sterrett et al. [18] performed an adiabatic reactor operation with complete oxygen consumption to investigate the extent of exothermicity and the temperature rise in the reactor tube. Here, no temperature control of the reactor tubes was implemented. Figure 6 shows a comparative plot between the experimental adiabatic run and the CFD simulation. From the figure, the inlet temperature specified at 560 K gradually increased across the tube length until it reached a peak value of 763 K (experiment), and then gradually decreased to 727 K as a result of inevitable heat losses in the experimental setup. Consequently, a computer simulation was carried out by the same research group under the same adiabatic conditions from which an error of 2.53% was obtained. In comparison with the CFD adiabatic simulation, a higher error of 5.72% was realized. This is partly due to the lack of adequate information on the adiabatic experimental conditions such as flow rate and differences in thermophysical properties such as specific heat capacity of the catalyst and gases.
The results of this study also showed a similar upward trend with the experimental data, resulting in a final temperature of 720.06 K. The selectivity, as obtained from the experimental study, was 92%, whereas the computer simulation by Sterrett et al. [18] predicted the value as 96%. In this study, the selectivity was calculated to be 92.21% according to Equation (20), showing a strong agreement between the experimental results and CFD simulation.
Selectivity = 100 × moles of butadiene produced moles of butene reacted

4.3. Parametric Study

This section discusses the parametric study that involves the variation of operational parameters. Upon satisfactory validation of the CFD model, simulations under different thermal conditions such as isothermal, non-isothermal, and adiabatic were examined. Consequently, by varying the inlet temperature and velocity of the feed gas, the effects of these parameters on the reactor performance such as conversion (Equation (21)), selectivity (Equation (20)), and yield (Equation (22)) were evaluated.
Conversion = 100 × moles of butene reacted moles of butene fed
Yield = 100 × moles of butadiene produced moles of butadiene could be formed

4.3.1. Effect of Thermal Conditions

Based on the previous validation of the reactor model with the experimental results, concentration profiles of the reactants and products under different thermal conditions were predicted by the CFD model.
Figure 7 shows the results obtained by CFD simulation under isothermal conditions where the temperature of the reactor was maintained at 633 K. It can be seen that the mole fractions of reactants and products gradually decreased and increased along the reactor length. This is because the isothermal conditions inhibit the formation of hot spots in the reactor, thereby reducing the rate of reaction and consequent formation of side products. The butene conversion, yield, and selectivity of butadiene were estimated at values of 25.68%, 24.35% and 94.82%, respectively, of the two tubes that lay on the sectional plane of the longitudinal cross-sectional.
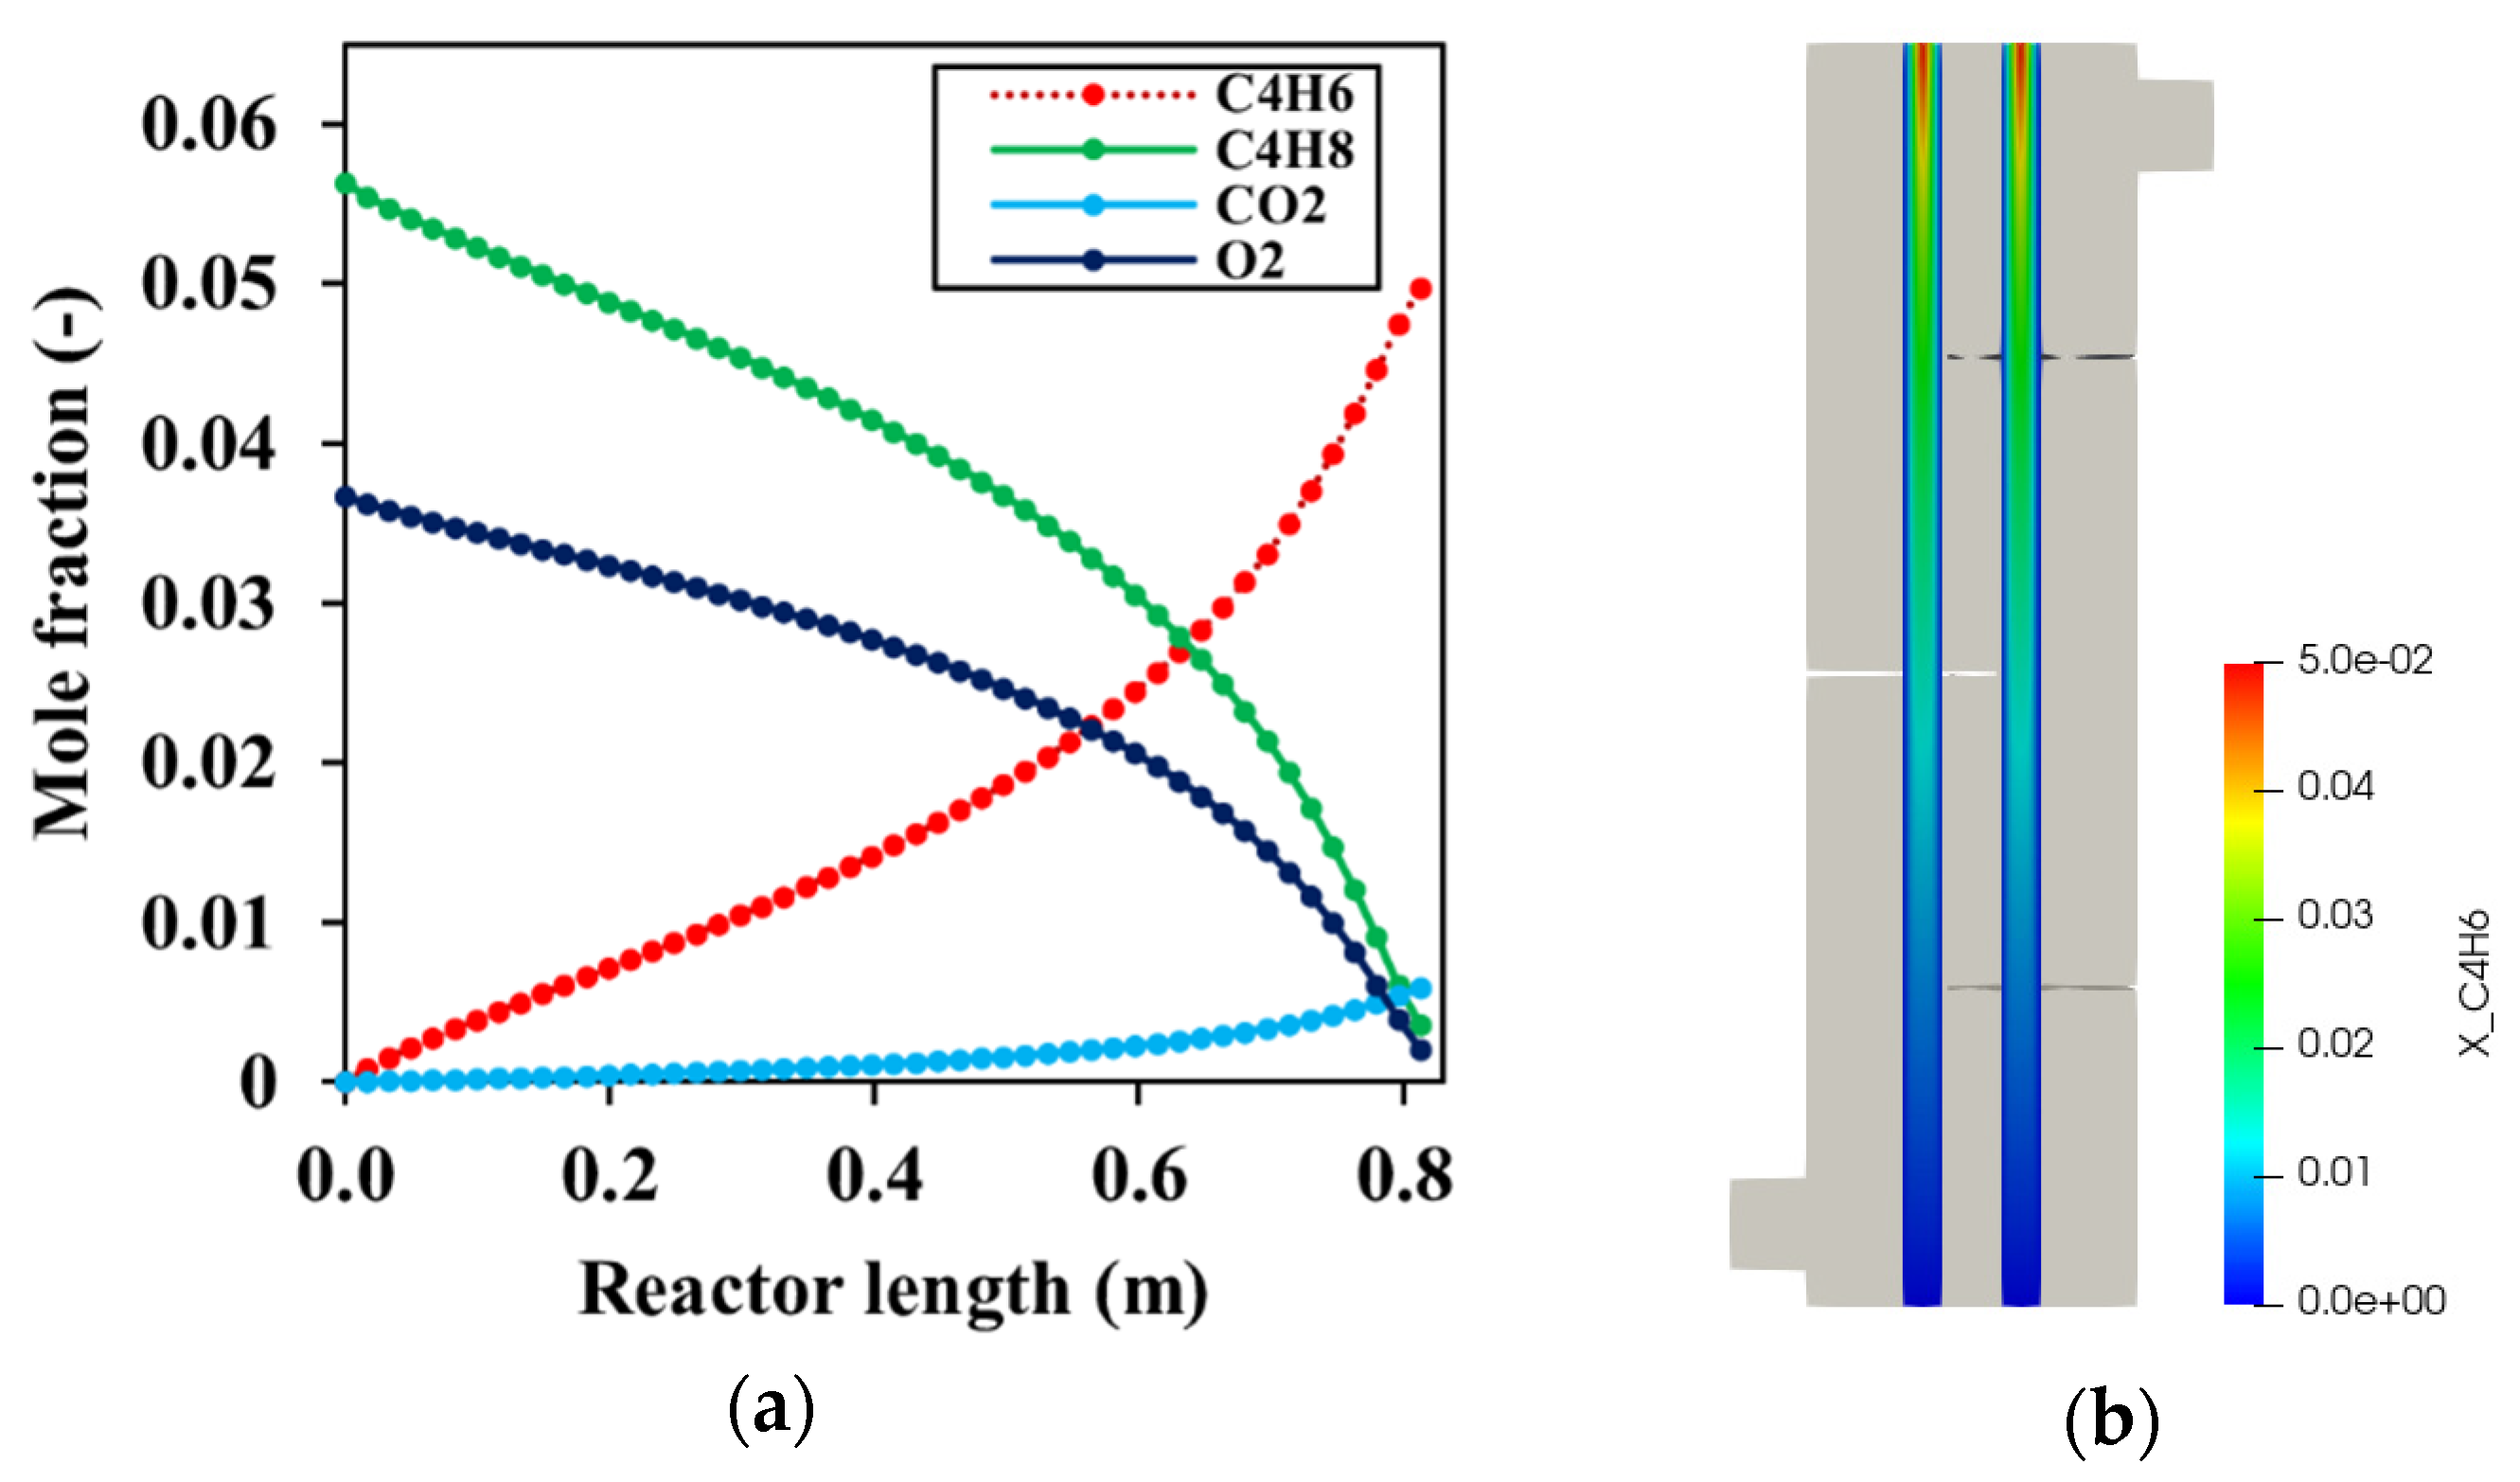
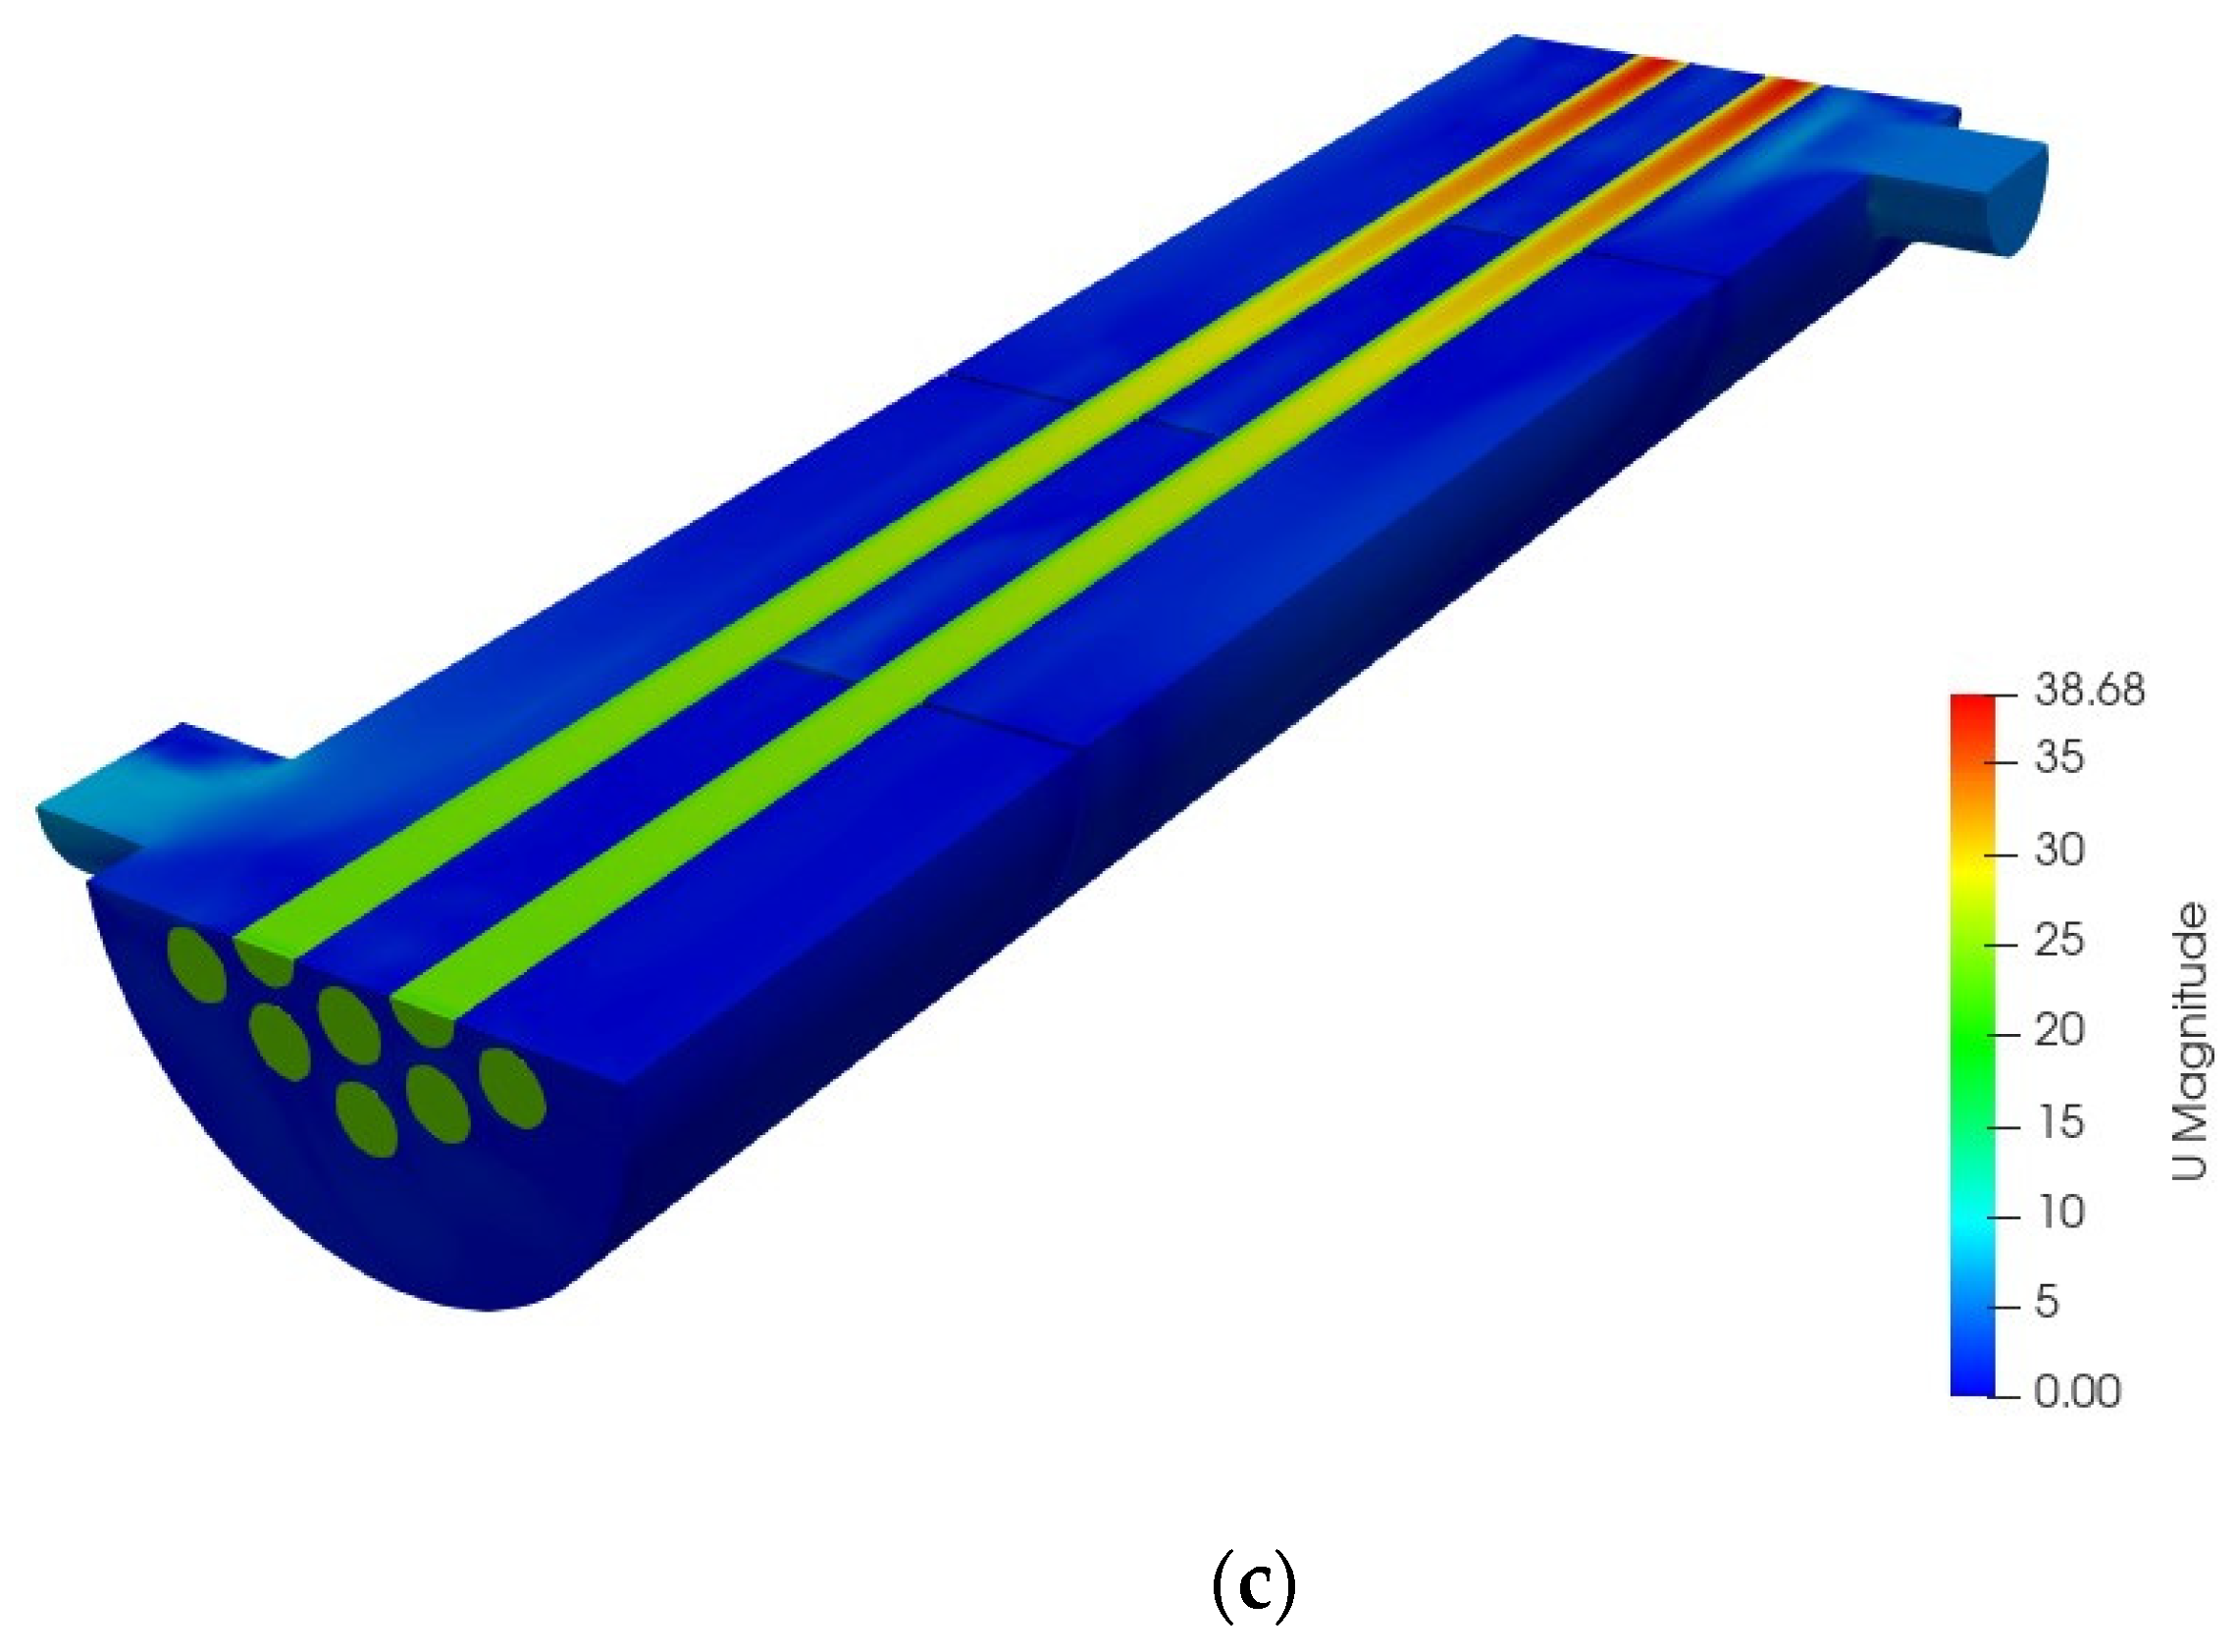
Conversely, another simulation was carried out under non-isothermal conditions where the shell-side coolant flowed around the tubes to remove the heat generated by the reactions. Water at 300 K was used as the shell-side coolant. Compared to the isothermal operation where a constant temperature was maintained inside the reactor tubes, the temperature in this case varied along the axial and radial directions of the tubes, resulting in a different concentration profile (Figure 8b). From Figure 8a, steeper concentration gradients were obtained in the non-isothermal simulation. Values of butene conversion and yield of butadiene were calculated to be 93.63% and 88.38%, respectively. Despite higher values of conversion and yield in this case, the selectivity of butadiene was estimated to be 94.40%, which was lower than that obtained in the isothermal simulation. This presupposes that higher temperatures would result in higher generation of side products; hence, the need for efficient temperature control within the reactor tubes. To reaffirm this assertion, an adiabatic simulation as well as further investigation of the reactor performance at various temperatures was executed.
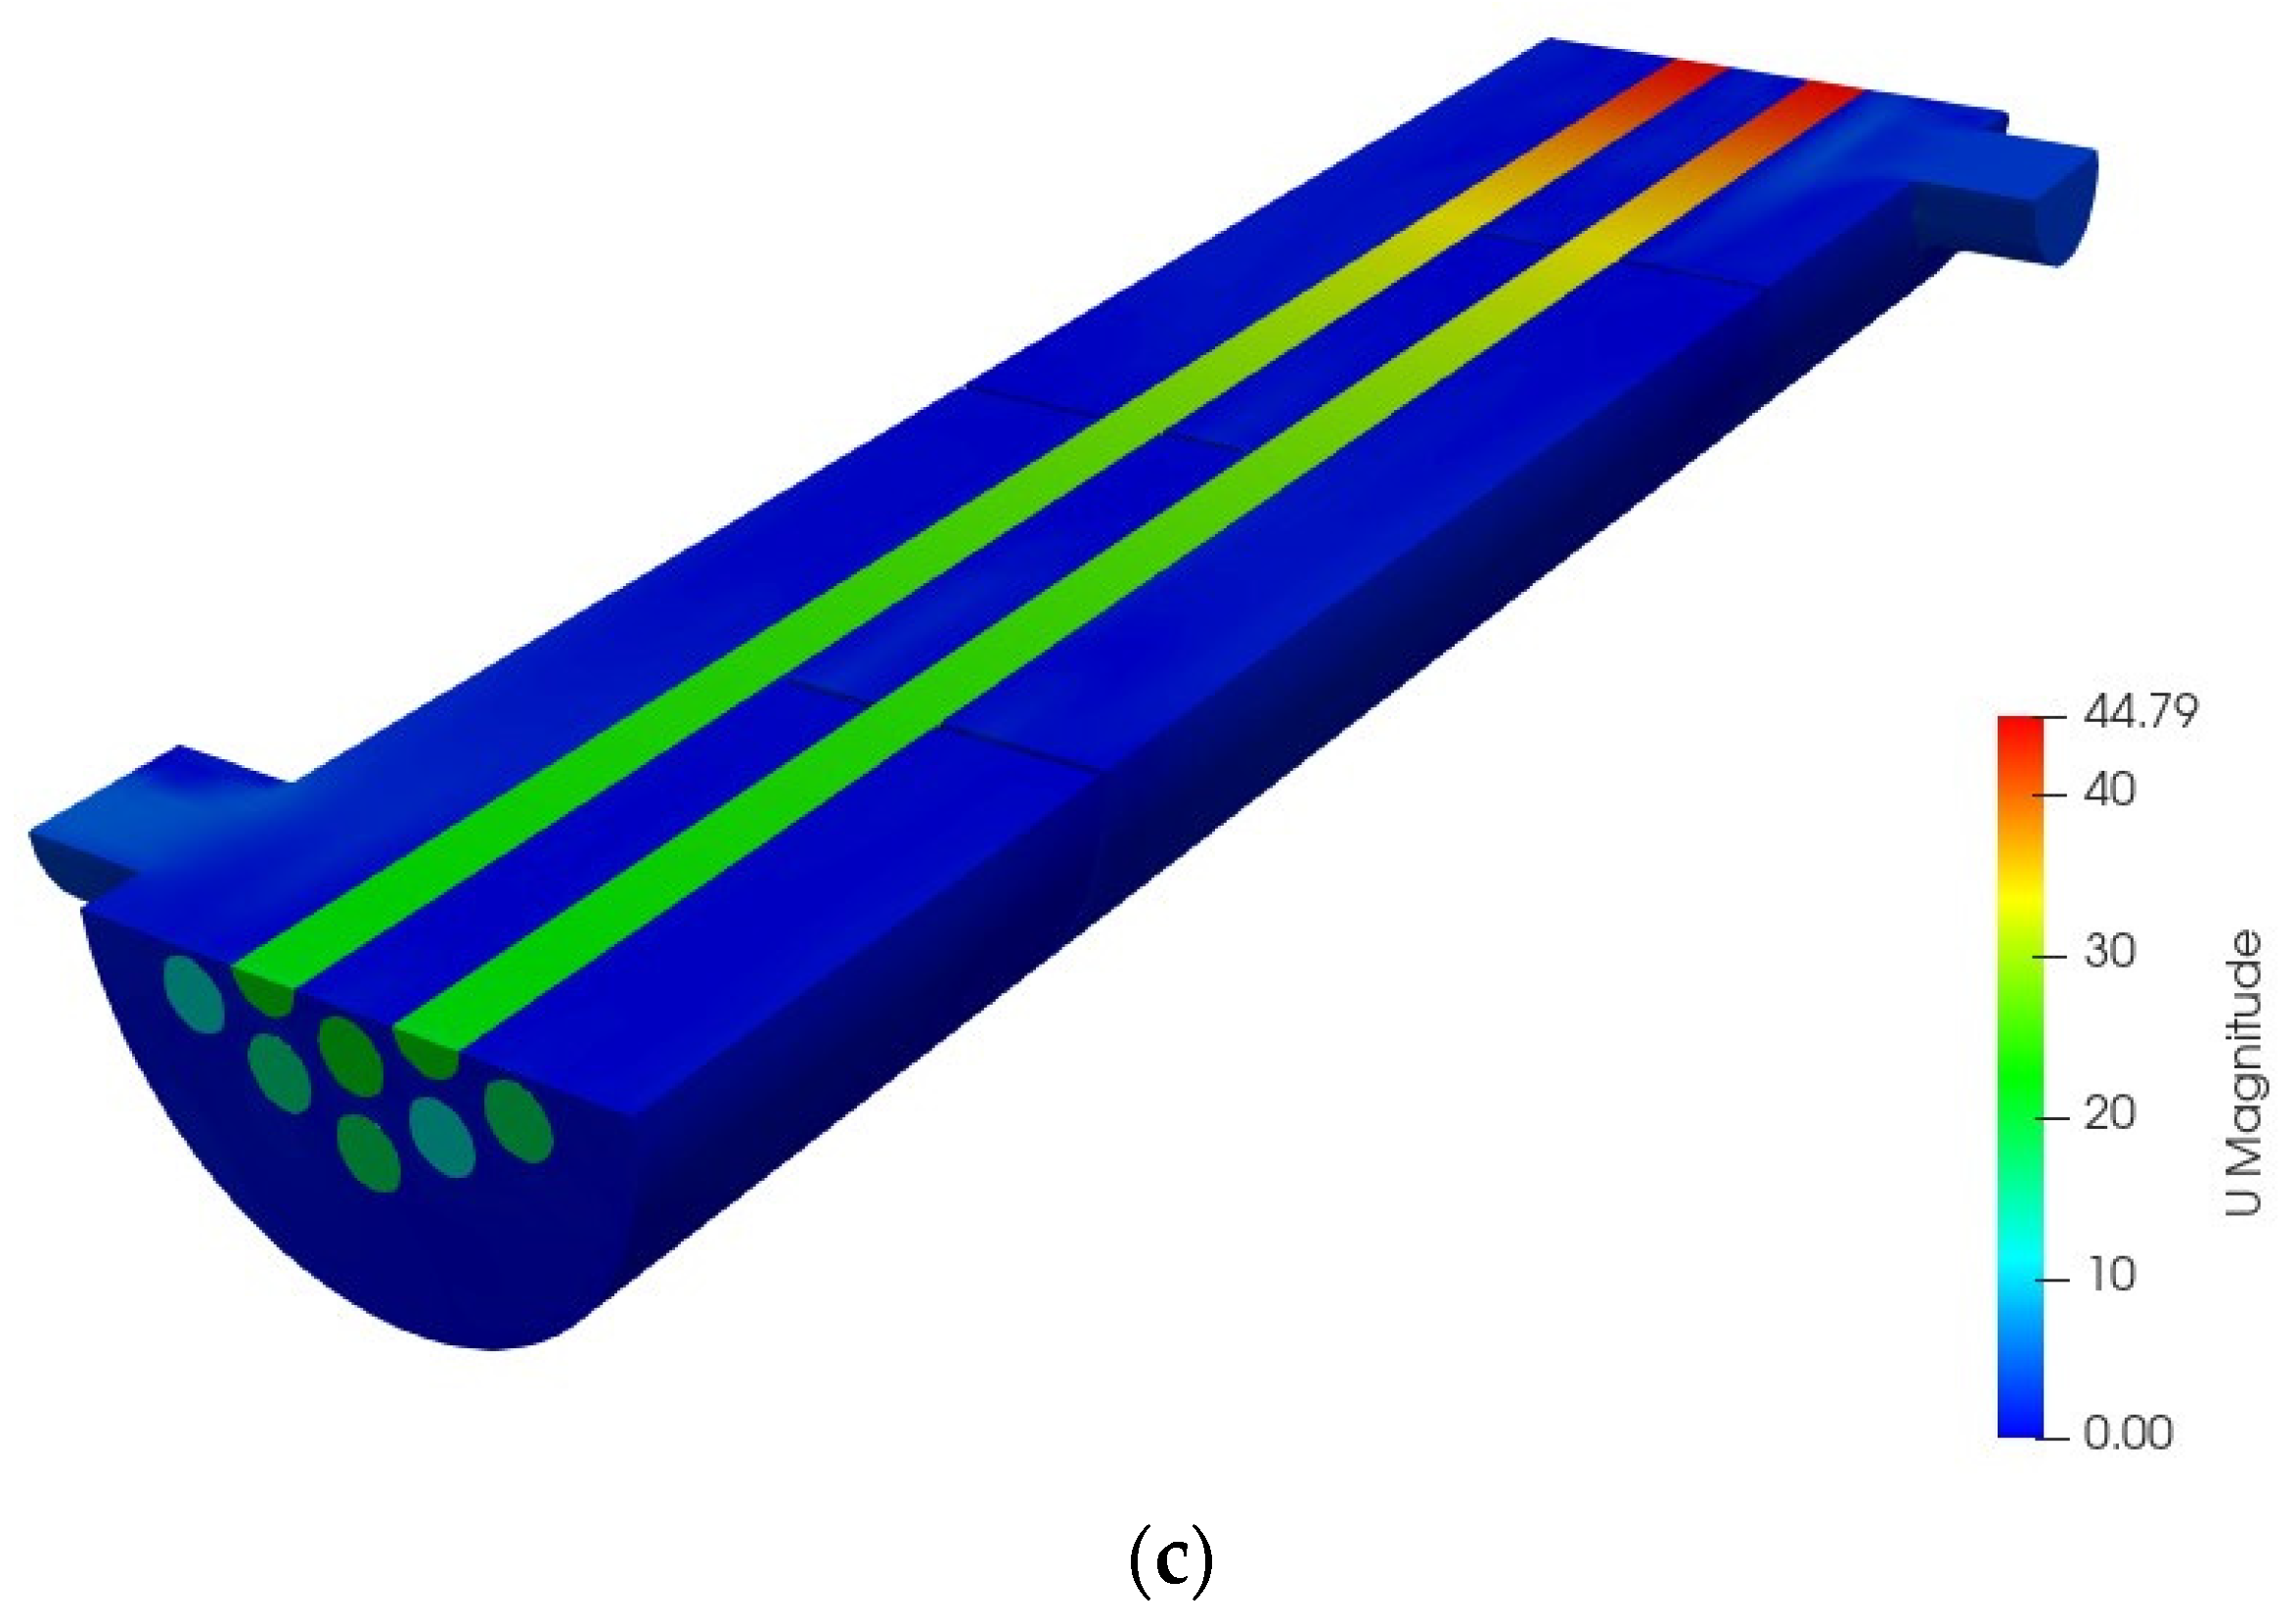
Figure 9 shows the results of the adiabatic operation in terms of species mole fractions. The simulation employed the operating conditions used in both the isothermal and non-isothermal studies above, in which the inlet temperature was fixed at 633 K and the inlet mole fractions of butene, oxygen, and water were 0.0563, 0.0367, and 0.717, respectively. During the reactions, the mole fractions of the reactants decreased considerably until the butene and oxygen were completely consumed, producing very high amounts of butadiene and carbon dioxide. After oxygen is depleted, the mole fractions of species remain constant as the oxygen acts as a limiting reactant. The conversion of butene and yield of butadiene in this case were calculated to be 98.41% and 92.81%, respectively. The selectivity of butadiene was also computed as 94.31%.
Figure 10a,b shows the temperature contour of the reactor tubes under adiabatic and non-isothermal conditions with their accompanying Cartesian plot shown in Figure 10c. It was observed that under the adiabatic conditions (no cooling), the reaction temperature increased to 862 K until all the limiting reactant was completely depleted. This confirms the extent of exothermicity of the ODH reaction and calls for effective and efficacious temperature control. As shown in Figure 10a,b, a temperature hotspot was formed close to the reactor outlet and hence provides a new insight into selecting the best methods (counter or co-current heat transfer) for controlling the reaction temperature. Similarly, Figure 10c shows a gradual rise in temperature across the reactor tube length (0 to 0.6 m) and rises sharply afterward (0.6 to 0.8128 m), reiterating the need to investigate the best methods for controlling the reaction temperature (not shown in this study).

4.3.2. Effect of Temperature

Despite the different studies on reactor performance under the various thermal conditions (isothermal, non-isothermal, and adiabatic), it is important to investigate the effect of varying temperatures on the generation and consumption of the species to provide sufficient insight into modeling, optimization, and scale-up of multi-tubular reactors. Although the assumption of isothermal conditions as used in this parametric study deviated slightly from industrial application, it provides to a large extent, adequate information on the reactor performance for possible adoption and implementation.
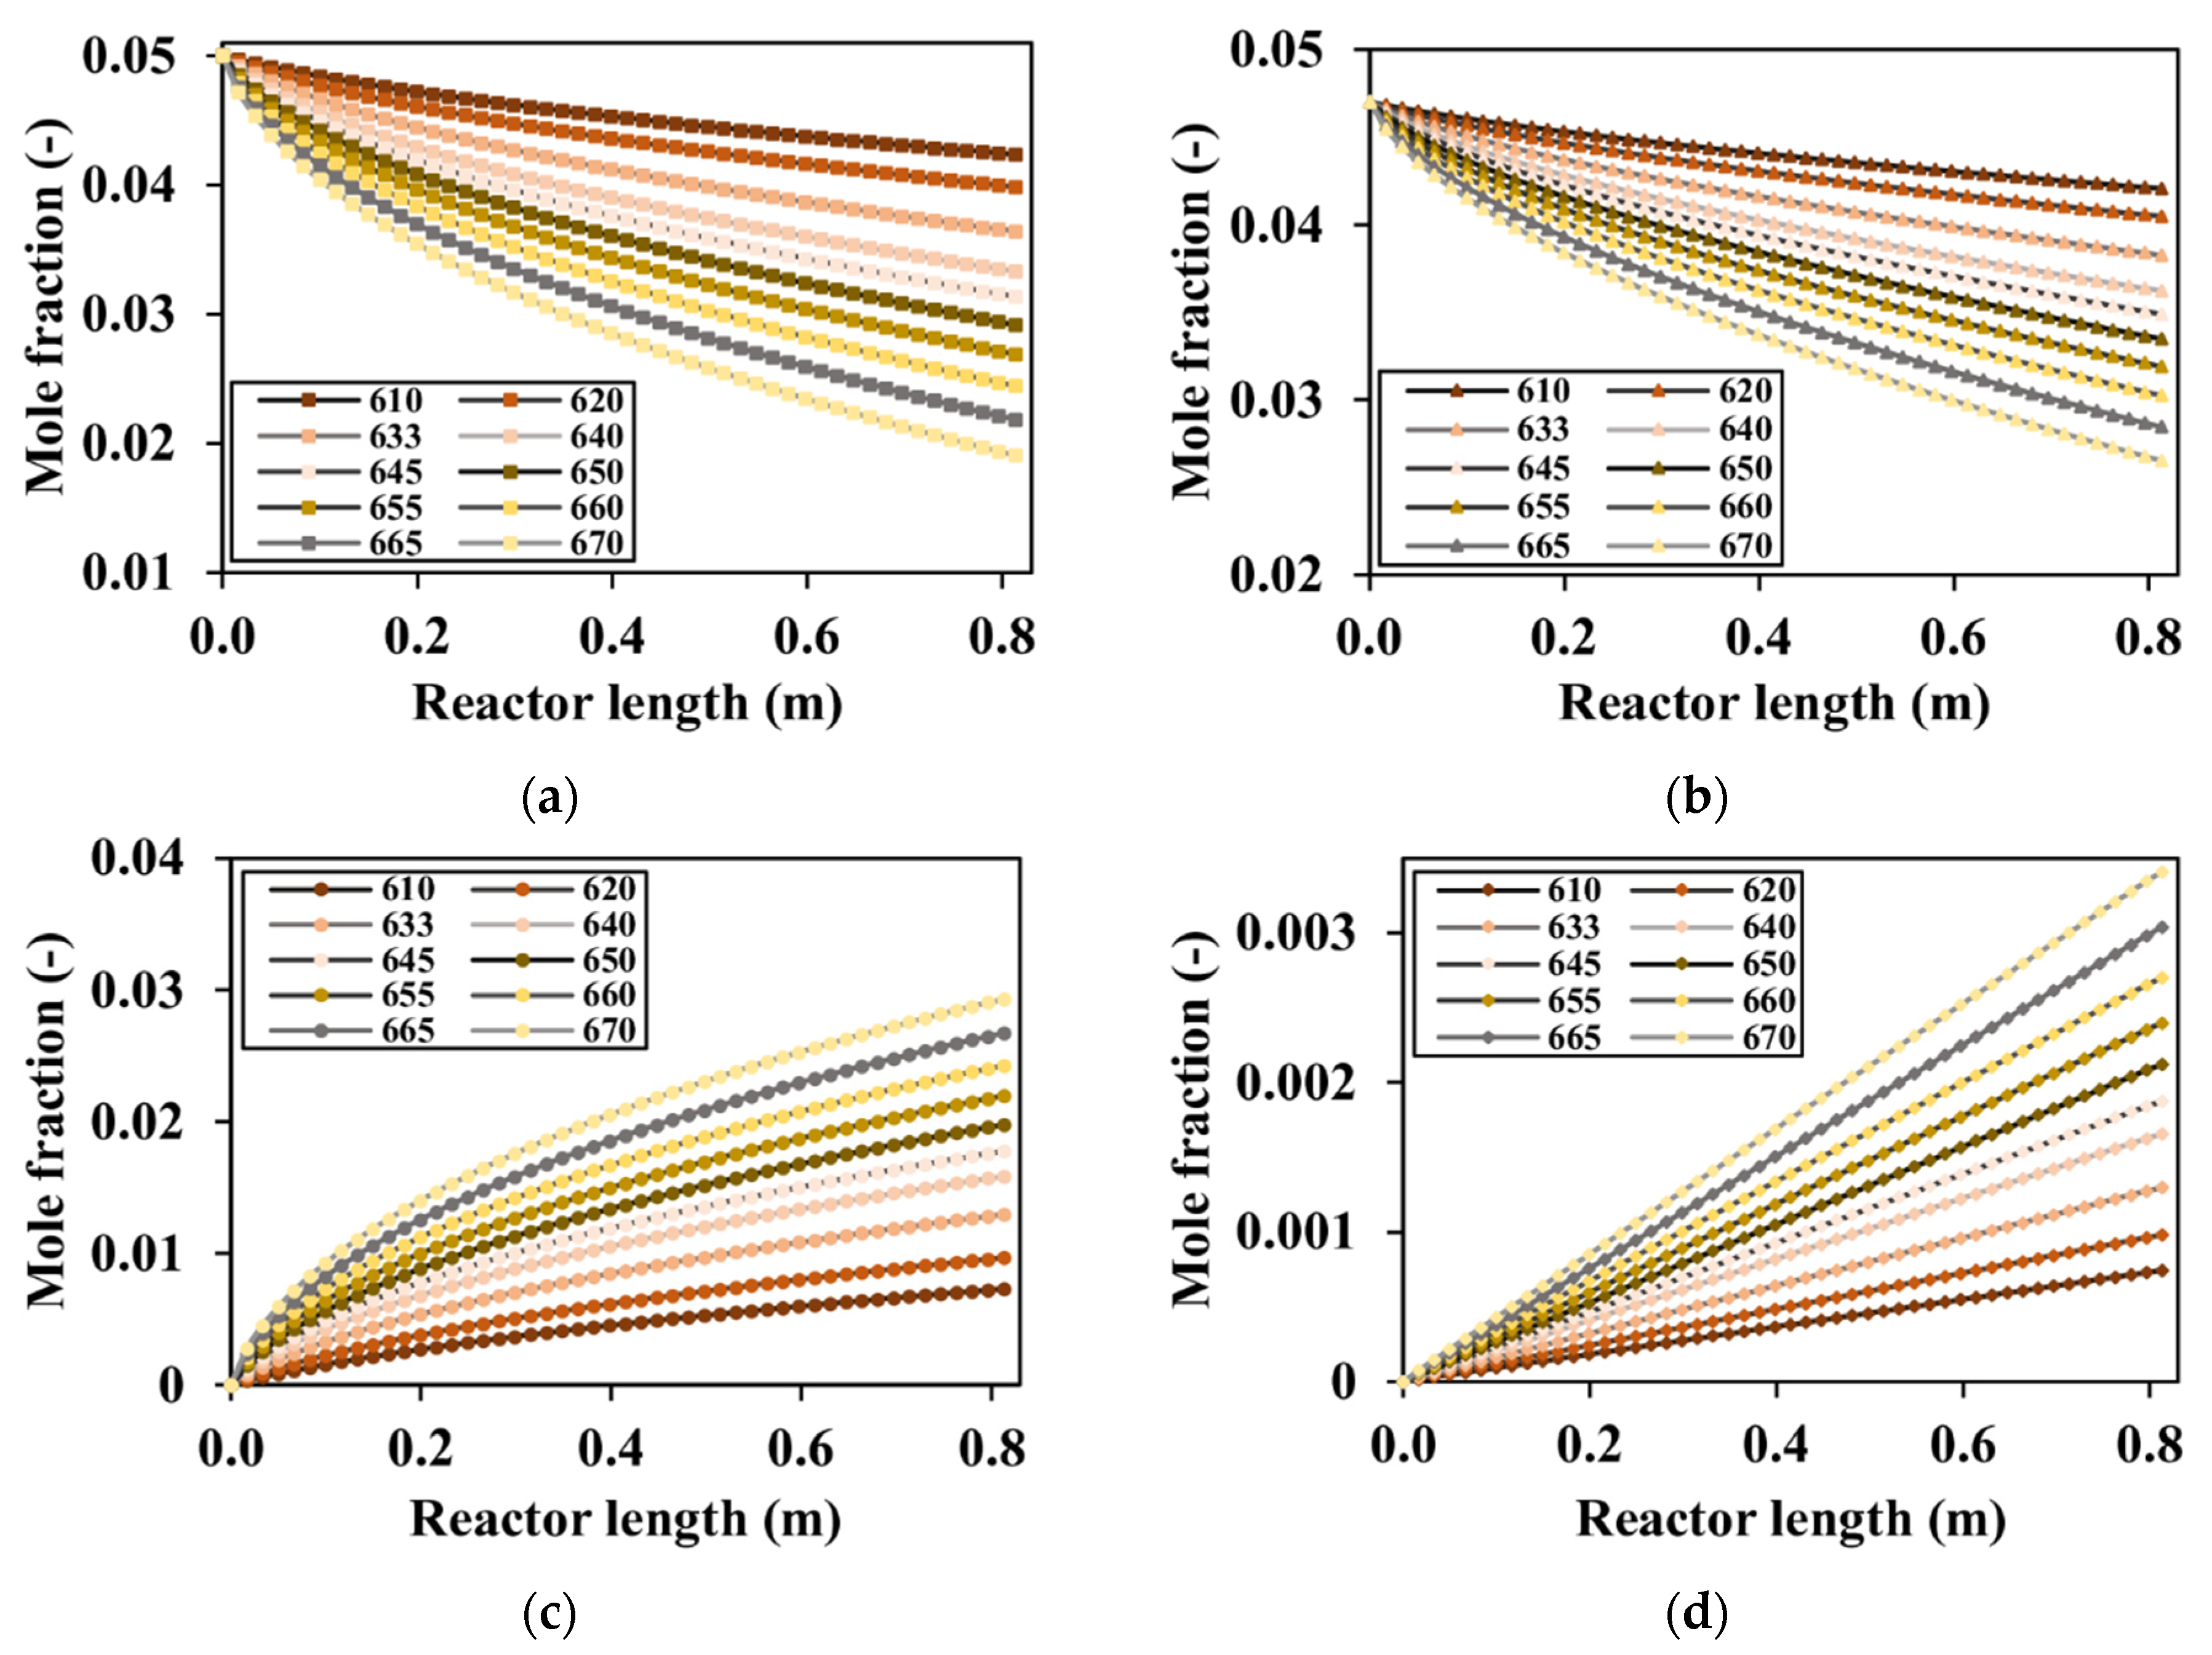
To this end, the effect of gas temperature on the reactor performance was carried out by varying the reactor temperature from 610 to 690 K at a constant gas velocity of 35.31 m/s. Figure 11 shows the distribution of mole fractions for the various species along the reactor length. From the figure, butene and oxygen were gradually consumed with decreasing slopes. At the product side, butadiene and carbon dioxide were also generated with increasing slopes. It can be noted that carbon dioxide production increases linearly with temperature. This means that the relative amount of carbon dioxide produced compared to butadiene increases as the temperature increases. As expected, it can be seen that the extent of the reaction increases as the temperature rises. This can be explained partly by the kinetic theory of gases where higher temperatures give rise to more rapid collisions between molecules for faster reactions to take place and partly by the temperature dependence of the Arrhenius equation.
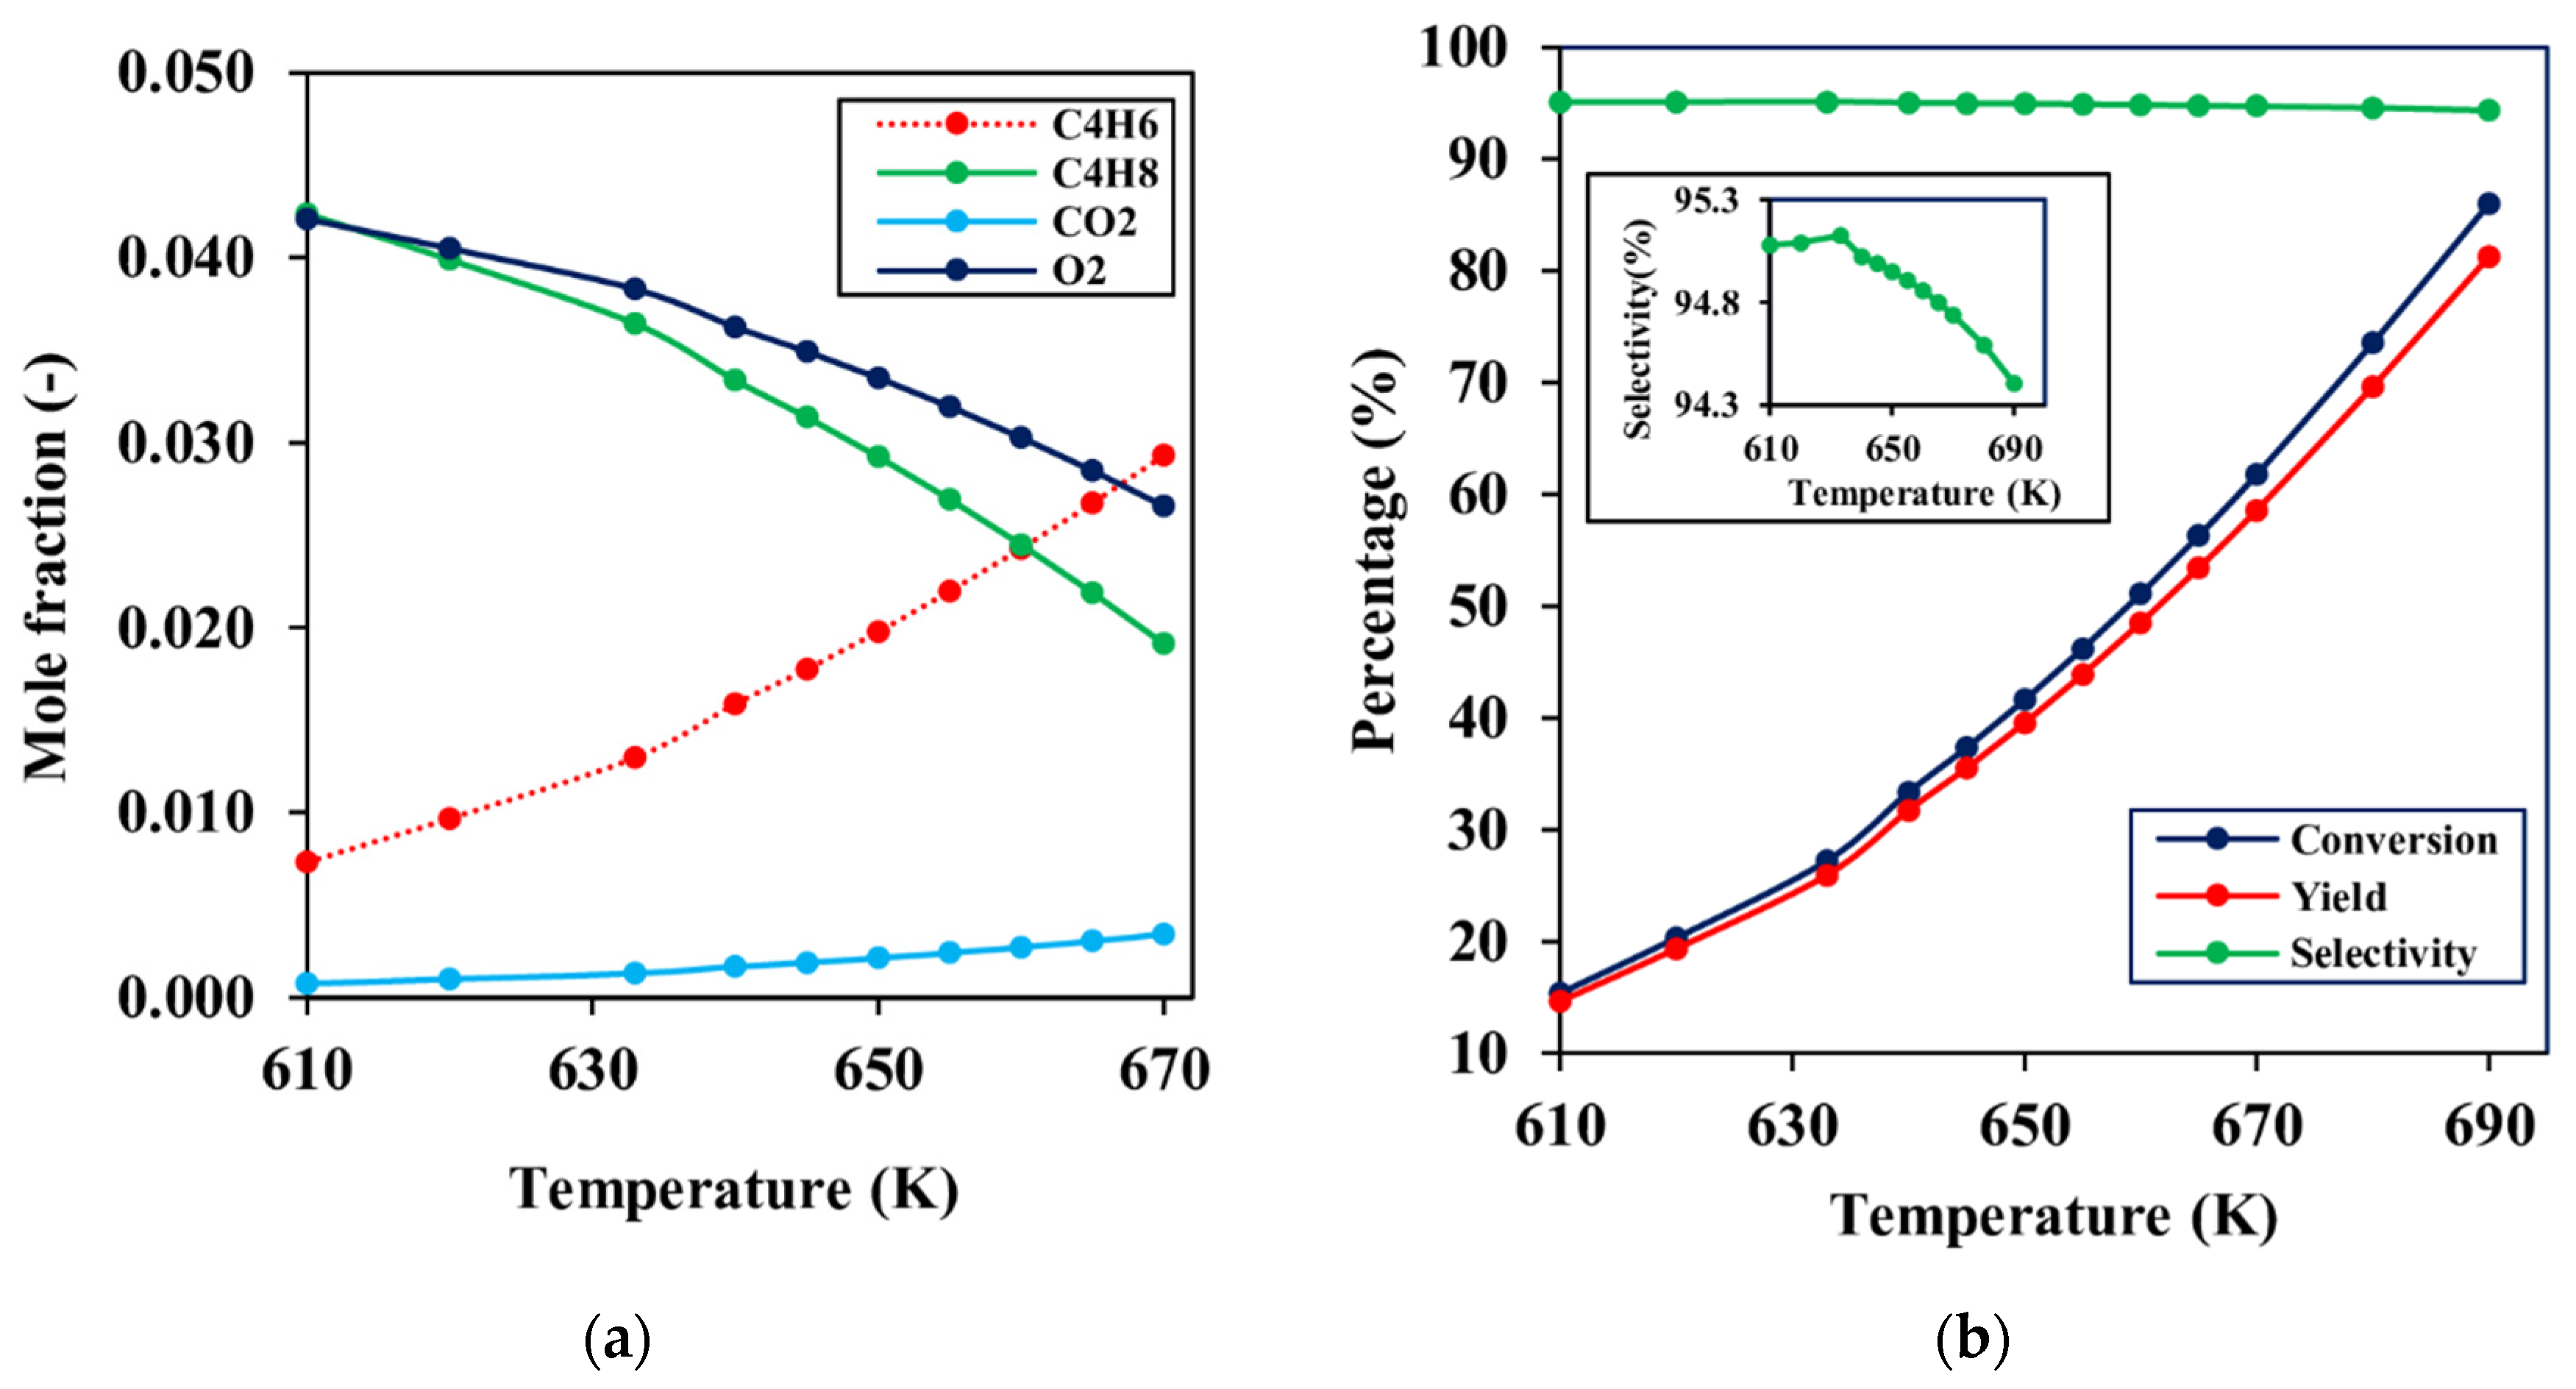
However, it is worth knowing that side reactions that result in lower selectivity are likely to occur when the temperature increases. Figure 12 shows the reactor outlet concentrations and reactor performance indices (conversion, yield and selectivity) as functions of varying temperatures. The conversion of butene and yield of butadiene show an upward increase in value (positive gradients) with maximum values of 86.02% and 81.26% at 690 K. From Figure 12b, it can be seen that the yield and conversion gradients increased gradually from 610 to 633 K, slightly sharply from 640 K to 670 K, and very sharply from 670 K to 690 K. However, in a separate analysis (results not shown), it was observed that the gradient started to decrease at 700 K, although the conversion and yield face values increased. This revelation provides an insight into the possible optimization of the reactor at these temperatures (670 K to 690 K). The selectivity of butadiene, however, slightly increased from 610 K to 633 K and then steeply decreased afterward. This can be explained by the sudden change in carbon dioxide concentration gradient in Figure 12a, where the gradient remained fairly constant from 610 K to 633 K and increased sharply thereafter. This shows that the selectivity is inversely proportional to the yield and conversion. As such, a compromise needs to be made in selecting the appropriate values of these performance indices.

4.3.3. Effect of Gas Velocity

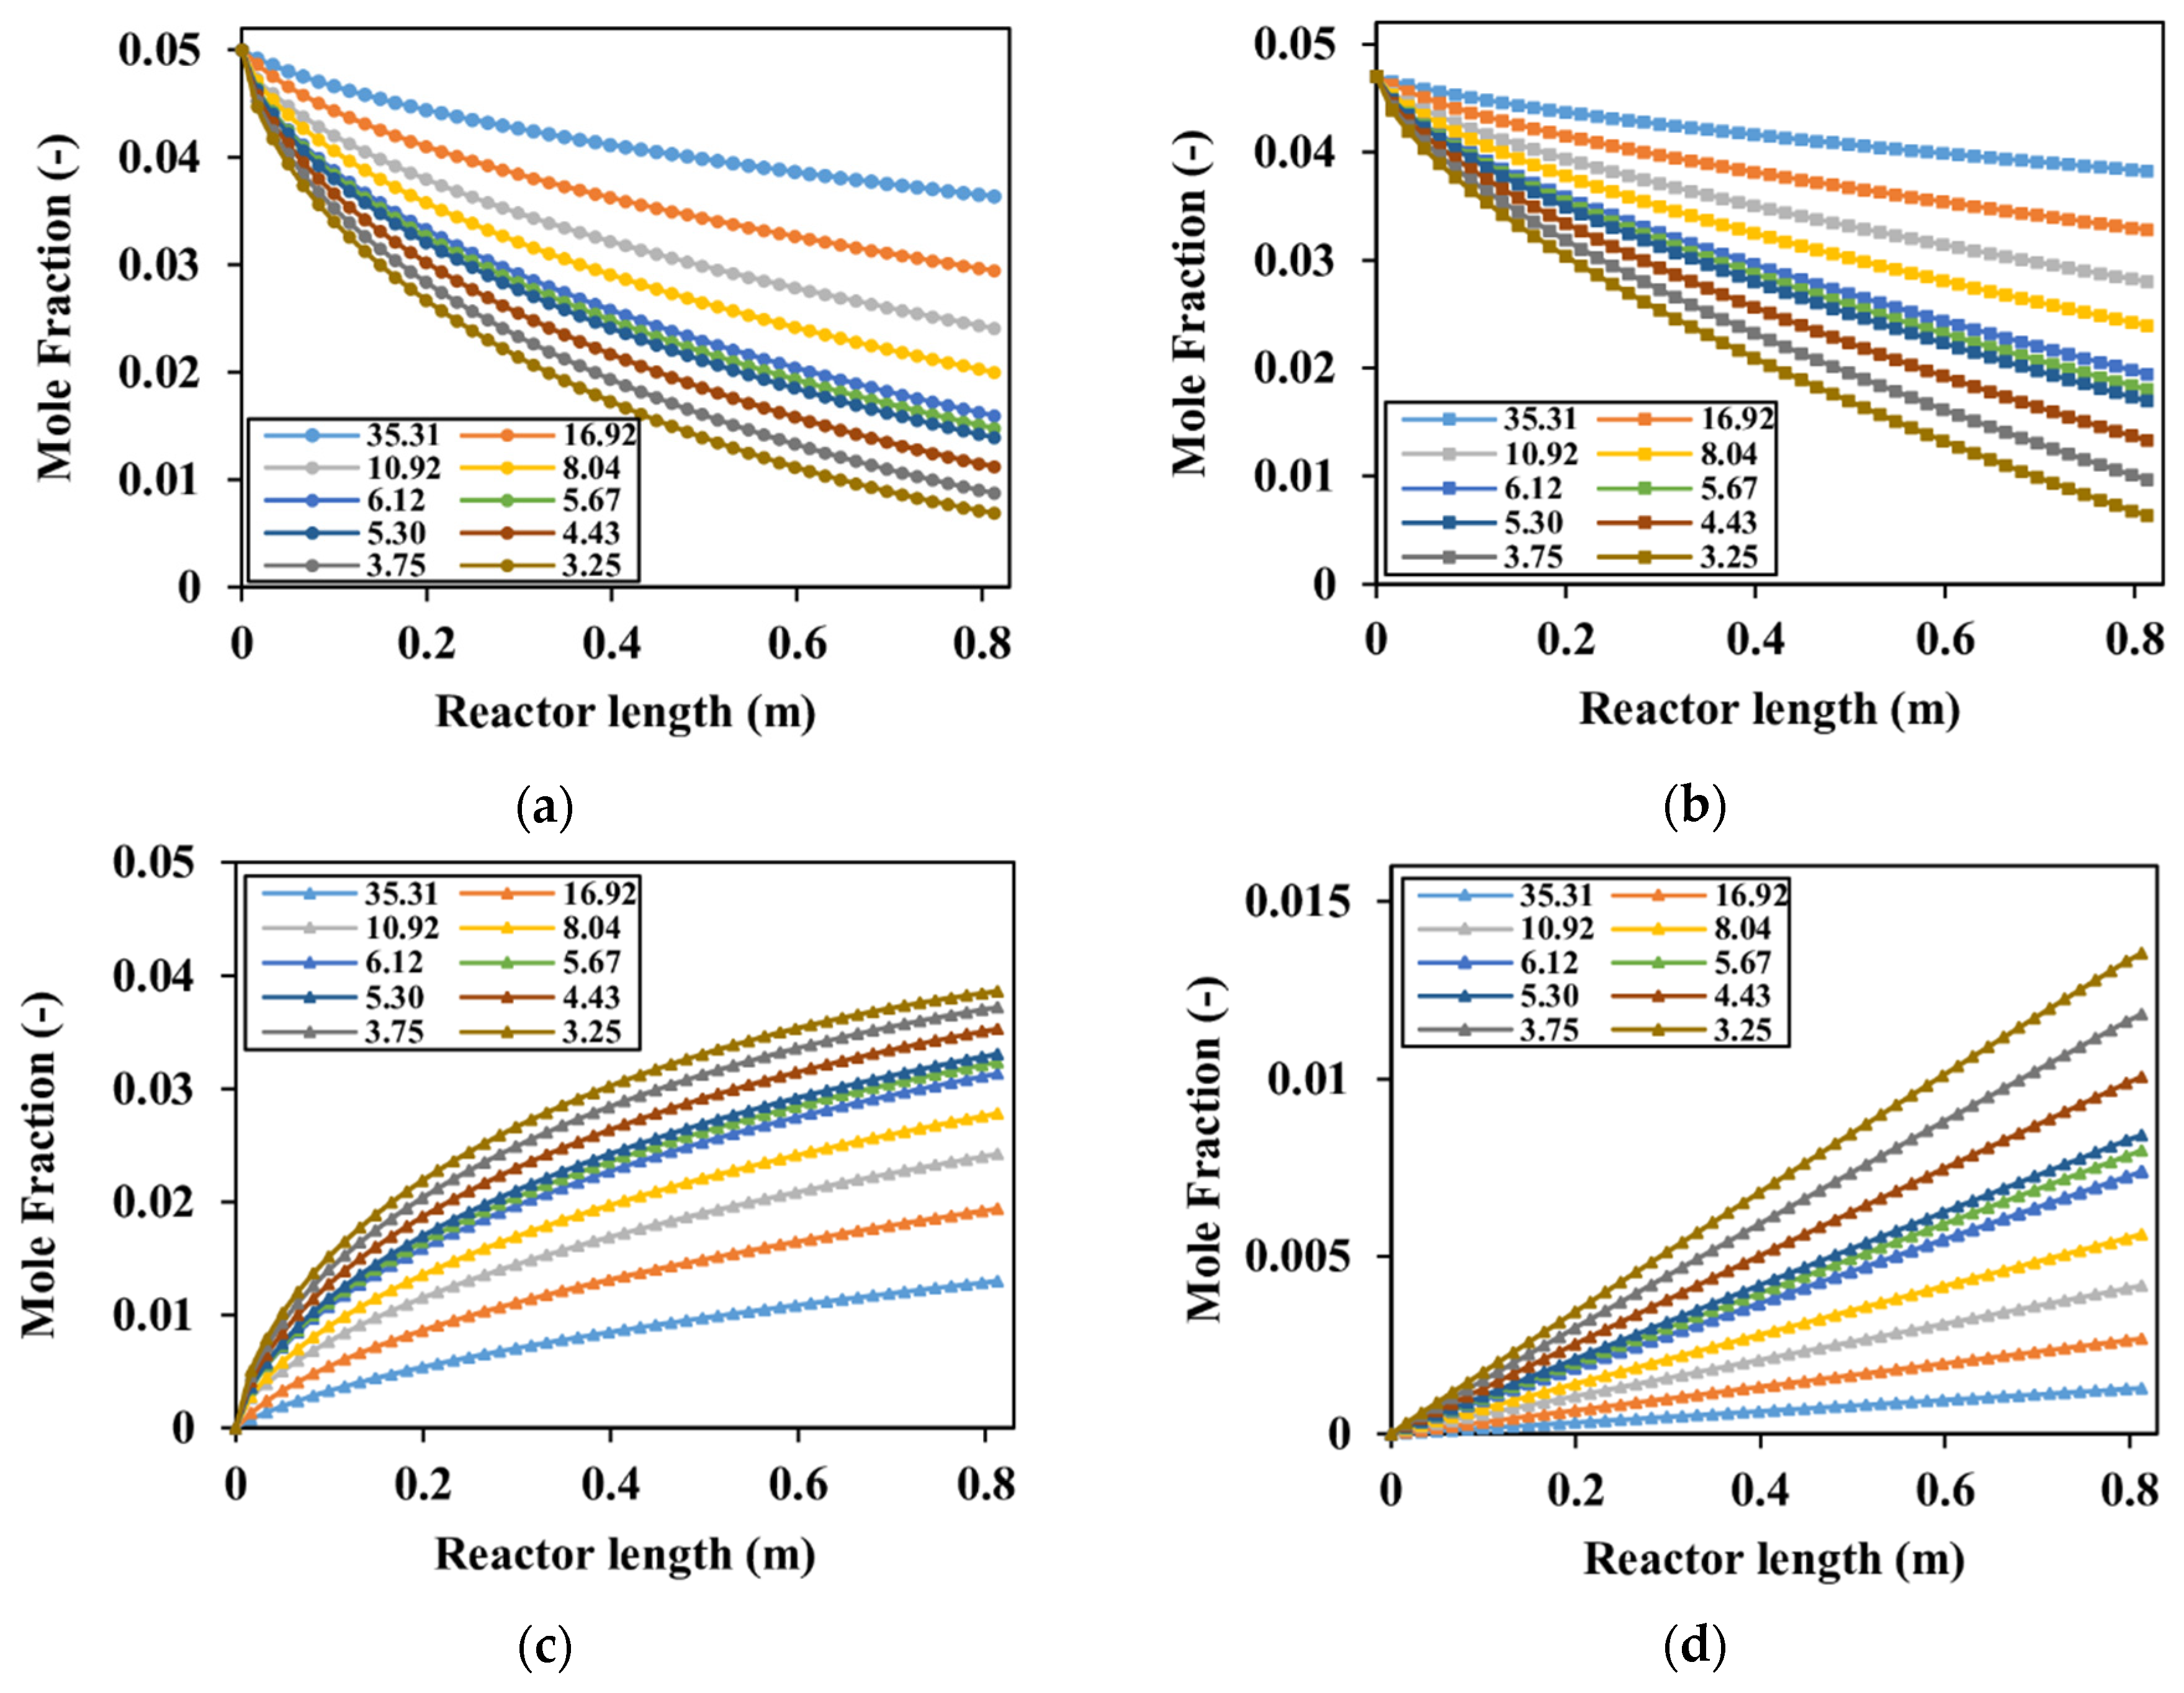
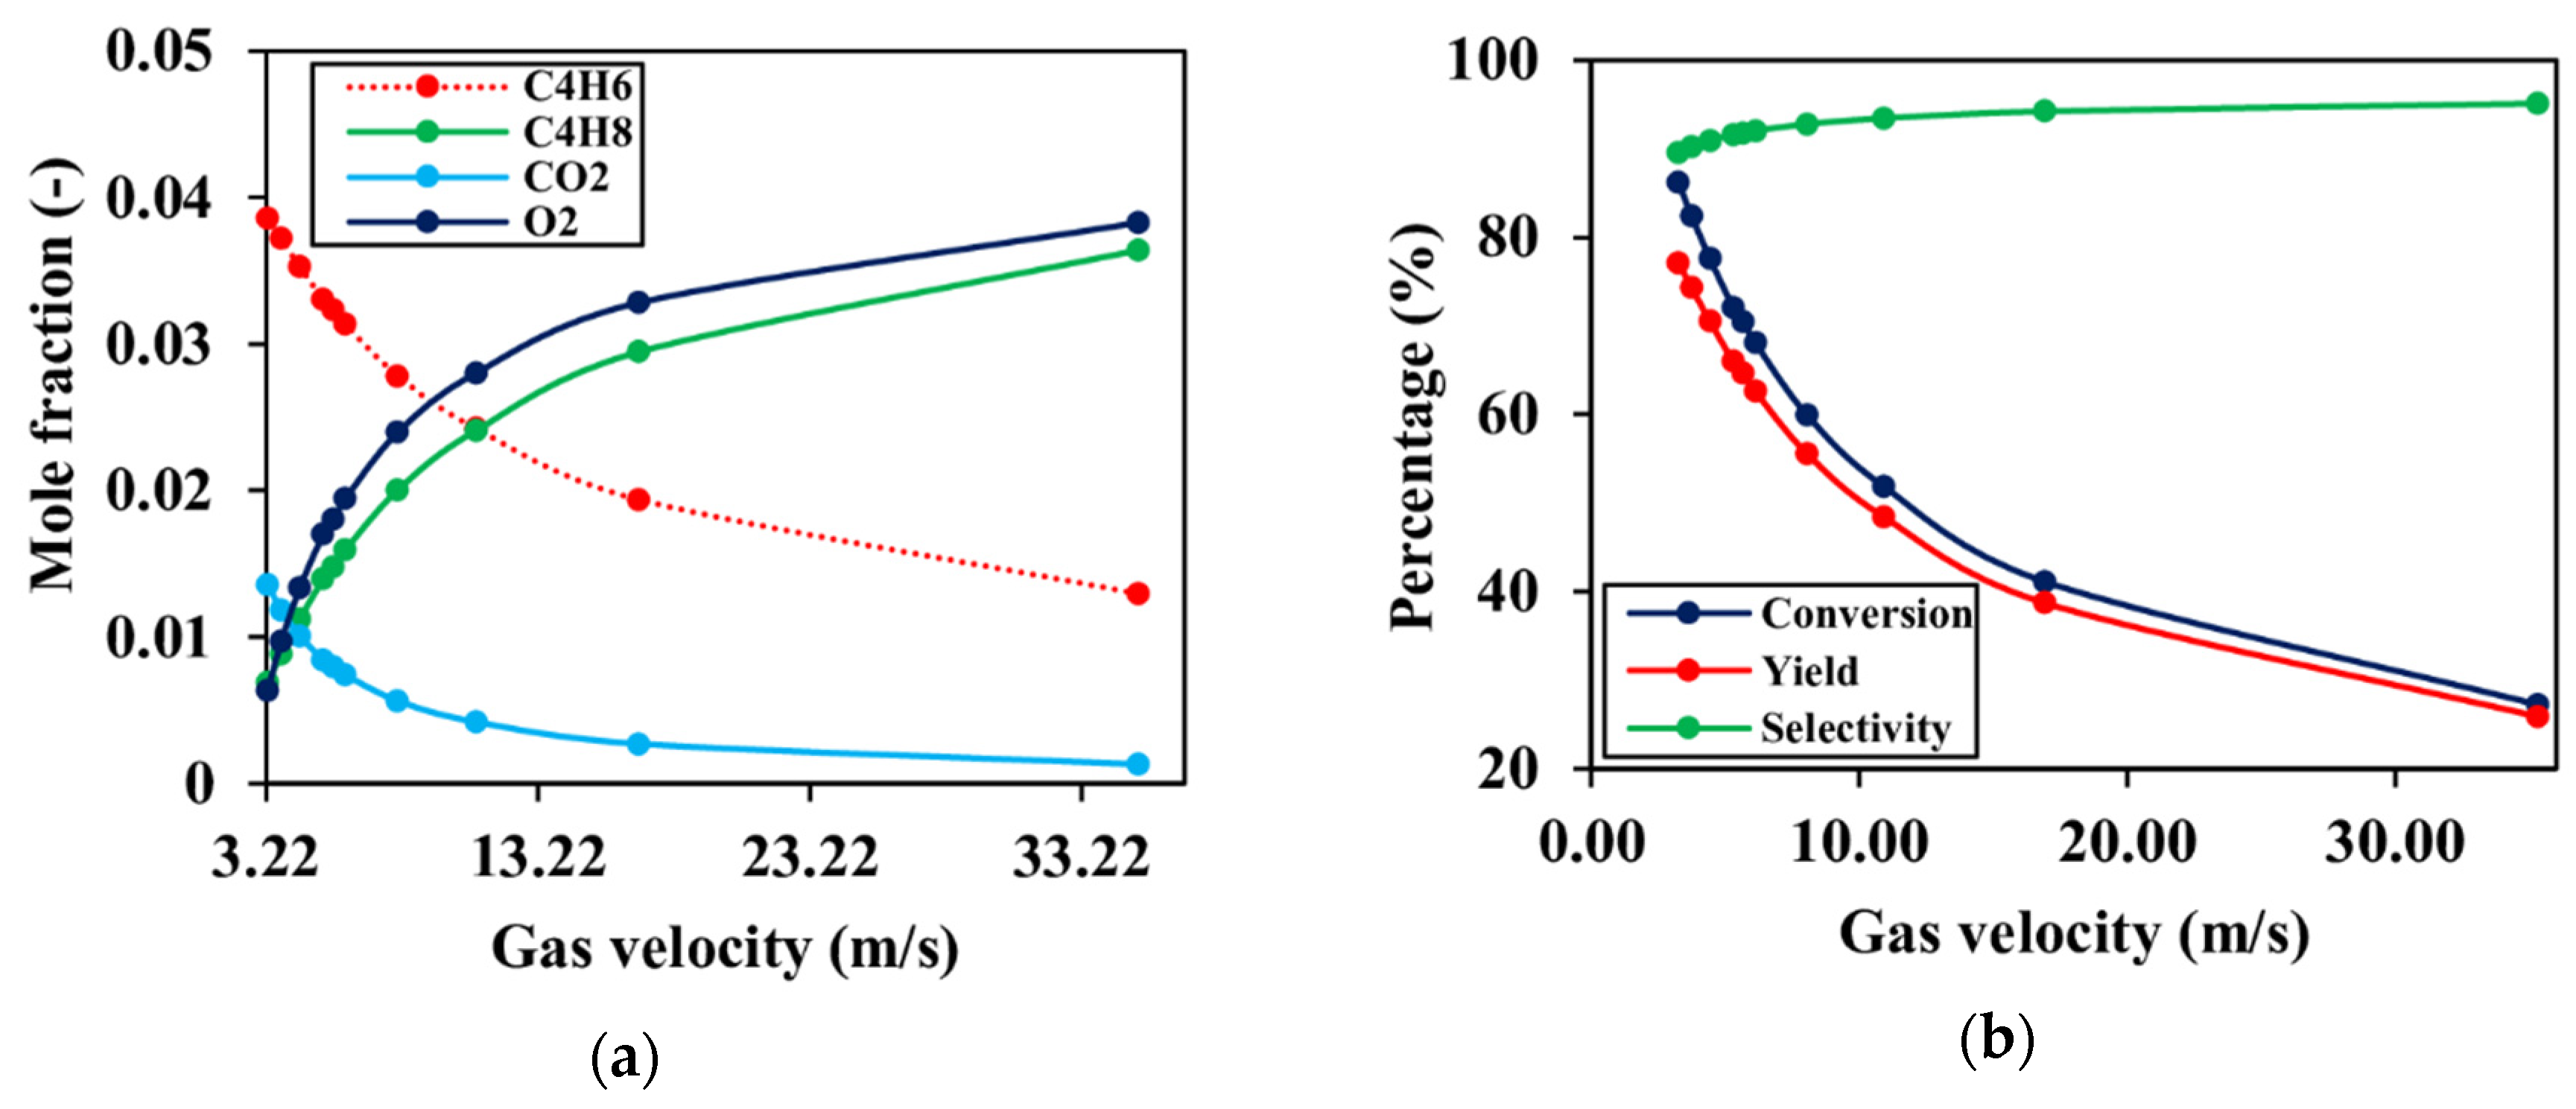
Figure 13 illustrates the relationship between the mole fractions and gas velocities from 3.25 to 35.31 m/s. High reaction rates were obtained at low velocities and low reaction rates at high velocities. This phenomenon can best be elucidated with the concept of residence time, where, as the gas velocity increases, the residence time (space time) decreases, thereby reducing the time available for the interaction between the catalyst particles and reactant species. Additionally, as shown in Figure 10c, the rate of reaction increased gradually across the reactor and therefore requires a longer residence time for efficient conversion of reactants to products. This is further demonstrated in Figure 14a where the concentration gradients remained nearly linear from 35.31 to 10.92 m/s and changed exponentially from 8.04 to 3.25 m/s. In the same Figure 14b, the reactor performance indices (conversion, yield, and selectivity) were plotted against the gas velocities. It can be clearly seen that as the gas velocity increases, selectivity also increases whilst the converse was observed for the yield and conversion. This observation is due to the fact that an increase in residence time (low velocity) increases the reaction rate and consequently, the conversion and yield. From Figure 13d, the production of carbon dioxide (a side product) was observed to increase linearly with decreasing gas velocities. Hence, as the velocity of the gas increases (reduction in residence time), the carbon dioxide production decreases, resulting in an increase in selectivity (relatively high production of butadiene). Therefore, a good optimization of these reactor performance indices is required to adequately choose the best performing process conditions.

5. Conclusions

In this study, the oxidative dehydrogenation of butene to 1,3-butadiene over a Zn–Cr–Fe catalyst in a 3-dimensional multi-tubular shell and tube type reactor was investigated. Rigorous mathematical modeling of reaction kinetics from the experimental work of Sterrett et al. [17] was implemented. The catalyst was modeled as a porous zone to include the effects of pressure drop, mass, and heat transfer. The shell-side flow was modeled with the standard k–ε turbulent model whilst the tube side was assumed to be laminar. To ensure effective cooling of the reactor tubes, water at 300 K was injected as the shell-side coolant in a counter-current fashion.
Results from the developed CFD model agreed well with the experimental data, giving a maximum error of 7.5%. Three parametric studies were carried out to investigate the effect of thermodynamic conditions, temperature, and flow rate on key reactor performance indices such as conversion, yield, and selectivity. In the first parametric study, a CFD simulation was executed for three thermodynamic reactor conditions (isothermal, non-isothermal, and adiabatic). The isothermal condition gave the least conversion and yield (25.68% and 24.35%), but also the highest selectivity of 94.82%. Under the non-isothermal condition, a hot spot was formed at the top most part of the reactor tubes (0.7 to 0.8128 m) with considerable increase in yield and conversion (93.63% and 88.38%), but a decrease in selectivity of 94.40%. Similar to the non-isothermal state, the adiabatic temperature was found to rise from 633 K to 860 K until all the limiting reactant (O2) was completely consumed. The selectivity further decreased in this case while both yield and conversion increased to a maximum (98.41% and 92.81%).
It was observed and can be concluded from this study that the temperature rises slowly across the reactor (0 to 0.6 m), but increases sharply, thereafter forming a hot spot. Hence, to efficiently control the reactor temperature, careful design of the shell-side for maximum heat removal close to the outlet should be considered. It is recommended that, in lieu of the cooling water, a more efficient coolant should be used for effective temperature control.
In the second and third parametric studies, the effect of varying flow rates and temperature under isothermal conditions were investigated. From the results, it was clearly seen that temperature significantly affects the rate of reactions as well as the reactor performance. As the temperature increased, the conversion and yield also increased (from 15.35% to 86.02% and 14.61% to 81.26%), but with a consequential reduction in selectivity (from 95.08% to 94.13%). Additionally, an increase in velocity favored the relative production of butadiene with a maximum selectivity of 95.12% obtained at 35.31 m/s. The generation of side product (CO2) was, however, favored at low velocities due to the increase in residence time since the CO2 kinetics is zero-order with respect to butene and butadiene. Hence, as the velocity decreased, the rate of CO2 production increased, thereby decreasing the selectivity of butadiene production.

Author Contributions

Conceptualization, J.M., D.Q.G. and S.H.; Methodology, J.M. and D.Q.G. Software, J.M. and D.Q.G.; Validation, J.M., D.Q.G., and S.H.; Formal analysis, J.M., D.Q.G. and S.H.; Investigation, J.M. and D.Q.G.; Resources, J.M., D.Q.G., and S.H.; Data curation, J.M. and D.Q.G.; Writing—original draft preparation, J.M. and D.Q.G.; Writing—review and editing, J.M., D.Q.G., and S.H.; visualization, J.M. and D.Q.G.; Supervision, S.H.; Project administration, S.H.; Funding acquisition, S.H. All authors have read and agreed to the published version of the manuscript.

Funding

This research was funded by a National Research Foundation of Korea (NRF) grant funded by the Korea government (MSIT) (No. 62163-01). This research was also supported by the Korea Institute for Advancement of Technology (KIAT) grant funded by the Korea Government (MOTIE, P0008475, Development Program for Smart Digital Engineering Specialist).

Conflicts of Interest

The authors declare no conflict of interest. The funders had no role in the design of the study; in the collection, analyses, or interpretation of data; in the writing of the manuscript, or in the decision to publish the results.

References

  1. Rischard, J.; Antinori, C.; Maier, L.; Deutschmann, O. Oxidative dehydrogenation of n-butane to butadiene with Mo-V-MgO catalysts in a two-zone fluidized bed reactor. Appl. Catal. A Gen. 2016, 511, 23–30. [Google Scholar] [CrossRef]
  2. White, W.C. Butadiene production process overview. Chem. Biol. Interact. 2007, 166, 10–14. [Google Scholar] [CrossRef] [PubMed]
  3. Qi, Y.; Liu, Z.; Liu, S.; Cui, L.; Dai, Q.; He, J.; Dong, W.; Bai, C. Synthesis of 1,3-butadiene and its 2-substituted monomers for synthetic rubbers. Catalysts 2019, 9, 97. [Google Scholar] [CrossRef] [Green Version]
  4. Yoshimura, Y.; Kijima, N.; Hayakawa, T.; Murata, K.; Suzuki, K.; Mizukami, F.; Matano, K.; Konishi, T.; Oikawa, T.; Saito, M.; et al. Catalytic cracking of naphtha to light olefins. Catal. Surv. Japan 2001, 4, 157–167. [Google Scholar] [CrossRef]
  5. Yan, W.; Kouk, Q.Y.; Luo, J.; Liu, Y.; Borgna, A. Catalytic oxidative dehydrogenation of 1-butene to 1,3-butadiene using CO2. Catal. Commun. 2014, 46, 208–212. [Google Scholar] [CrossRef]
  6. Ren, T.; Patel, M.; Blok, K. Olefins from conventional and heavy feedstocks: Energy use in steam cracking and alternative processes. Energy 2006, 31, 425–451. [Google Scholar] [CrossRef] [Green Version]
  7. Hong, E.; Park, J.H.; Shin, C.H. Oxidative Dehydrogenation of n-Butenes to 1,3-Butadiene over Bismuth Molybdate and Ferrite Catalysts: A Review. Catal. Surv. Asia 2016, 20, 23–33. [Google Scholar] [CrossRef]
  8. Bhasin, M.M.; McCain, J.H.; Vora, B.V.; Imai, T.; Pujadó, P.R. Dehydrogenation and oxydehydrogenation of paraffins to olefins. Appl. Catal. A Gen. 2001, 221, 397–419. [Google Scholar] [CrossRef]
  9. Herguido, J.; Menendez, M.; Santamarıa, J. Oxidative Dehydrogenation of n -Butane in a Two-Zone Fluidized-Bed Reactor. Ind. Eng. Chem. Res. 1999, 38, 90–97. [Google Scholar] [CrossRef]
  10. Schäfer, R.; Noack, M.; Kölsch, P.; Stöhr, M.; Caro, J. Comparison of different catalysts in the membrane-supported dehydrogenation of propane. Catal. Today 2003, 82, 15–23. [Google Scholar] [CrossRef]
  11. Park, S.; Lee, Y.; Kim, G.; Hwang, S. Production of butene and butadiene by oxidative dehydrogenation of butane over carbon nanomaterial catalysts. Korean J. Chem. Eng. 2016, 33, 3417–3424. [Google Scholar] [CrossRef]
  12. Callejas, C.; Soler, J.; Herguido, J.; Menéndez, M.; Santamaría, J. Catalytic dehydrogenation of n-butane in a fluidized bed reactor with separate coking and regeneration zones. Stud. Surf. Sci. Catal. 2000, 130, 2717–2722. [Google Scholar] [CrossRef]
  13. Vajda, S.; Pellin, M.J.; Greeley, J.P.; Marshall, C.L.; Curtiss, L.A.; Ballentine, G.A.; Elam, J.W.; Catillon-Mucherie, S.; Redfern, P.C.; Mehmood, F.; et al. Subnanometre platinum clusters as highly active and selective catalysts for the oxidative dehydrogenation of propane. Nat. Mater. 2009, 8, 213–216. [Google Scholar] [CrossRef]
  14. Rischard, J.; Franz, R.; Antinori, C.; Deutschmann, O. Oxidative dehydrogenation of butenes over Bi-Mo and Mo-V based catalysts in a two-zone fluidized bed reactor. AIChE J. 2017, 63, 43–50. [Google Scholar] [CrossRef]
  15. Elkhalifa, E.A.; Friedrich, H.B. Magnesium oxide as a catalyst for the dehydrogenation of n-octane. Arab. J. Chem. 2018, 11, 1154–1159. [Google Scholar] [CrossRef] [Green Version]
  16. Xingan, W.; Huiqin, L. Comparison of the technology of oxidative dehydrogenation in a fluidized-bed reactor with those of other reactors for butadiene. Ind. Eng. Chem. Res. 1996, 35, 2570–2575. [Google Scholar] [CrossRef]
  17. Hiwale, R.; Smith, R.; Hwang, S. A novel methodology for the modeling of CO2 absorption in monoethanolamine (MEA) using discrimination of rival kinetics. J. Ind. Eng. Chem. 2015, 25, 78–88. [Google Scholar] [CrossRef]
  18. Sterrett, J.S.; Mcllvried, H.G. Kinetics of the Oxidative Dehydrogenation of Butene to Butadiene over a Ferrite Catalyst. Ind. Eng. Chem. Process. Des. Dev. 1974, 13, 54–59. [Google Scholar] [CrossRef]
  19. Ding, X.J.; Xiao, D.L.; Wang, X.L.; Liu, S.L. The redox model of the kinetics for the oxidative dehydrogenation over the ferrite catalyst. J. Mol. Catal. 1988, 2, 25–30. [Google Scholar]
  20. Téllez, C.; Menéndez, M.; Santamaría, J. Kinetic study of the oxidative dehydrogenation of butane on V/MgO catalysts. J. Catal. 1999, 183, 210–221. [Google Scholar] [CrossRef]
  21. Ajayi, B.P.; Abussaud, B.; Jermy, R.; Al Khattaf, S. Kinetic modelling of n-butane dehydrogenation over CrOxVOx/MCM-41 catalyst in a fixed bed reactor. Prog. React. Kinet. Mech. 2014, 39, 341–353. [Google Scholar] [CrossRef]
  22. Madaan, N.; Haufe, R.; Shiju, N.R.; Rothenberg, G. Oxidative Dehydrogenation of n-Butane: Activity and Kinetics over VOx/Al2O3 Catalysts. Top. Catal. 2014, 57, 1400–1406. [Google Scholar] [CrossRef]
  23. Tanimu, A.; Jaenicke, S.; Alhooshani, K. Heterogeneous catalysis in continuous flow microreactors: A review of methods and applications. Chem. Eng. J. 2017, 327, 792–821. [Google Scholar] [CrossRef]
  24. Tanimu, G.; Abussaud, B.A.; Asaoka, S.; Alasiri, H. Kinetic Study on n-Butane Oxidative Dehydrogenation over the (Ni, Fe, Co)-Bi-O/Î-Al2O3 Catalyst. Ind. Eng. Chem. Res. 2020, 59, 2773–2780. [Google Scholar] [CrossRef]
  25. Mendoza, J.A.; Hwang, S. Tubular reactor design for the oxidative dehydrogenation of butene using computational fluid dynamics (CFD) modeling. Korean J. Chem. Eng. 2018, 35, 2157–2163. [Google Scholar] [CrossRef]
  26. De Smet, C.R.H.; De Croon, M.H.J.M.; Berger, R.J.; Marin, G.B.; Schouten, J.C. Design of adiabatic fixed-bed reactors for the partial oxidation of methane to synthesis gas. Application to production of methanol and hydrogen-for-fuel-cells. Chem. Eng. Sci. 2001, 56, 4849–4861. [Google Scholar] [CrossRef]
  27. Soler, J.; Téllez, C.; Herguido, J.; Menéndez, M.; Santamaría, J. Modelling of a two-zone fluidised bed reactor for the oxidative dehydrogenation of n-butane. Powder Technol. 2001, 120, 88–96. [Google Scholar] [CrossRef]
  28. Hukkanen, E.J.; Rangitsch, M.J.; Witt, P.M. Non-adiabatic multitubular fixed-bed catalytic reactor model coupled with shell-side coolant CFD model. Ind. Eng. Chem. Res. 2013, 52, 15437–15446. [Google Scholar] [CrossRef]
  29. Huang, K.; Lin, S.; Wang, J.; Luo, Z. Numerical evaluation on the intraparticle transfer in butylene oxidative dehydrogenation fixed-bed reactor over ferrite catalysts. J. Ind. Eng. Chem. 2015, 29, 172–184. [Google Scholar] [CrossRef]
  30. Dixon, A.G.; Nijemeisland, M. CFD as a design tool for fixed-bed reactors. Ind. Eng. Chem. Res. 2001, 40, 5246–5254. [Google Scholar] [CrossRef]
  31. Chen, X.; Dai, J.; Luo, Z. CFD modeling using heterogeneous reaction kinetics for catalytic dehydrogenation syngas reactions in a fixed-bed reactor. Particuology 2013, 11, 703–714. [Google Scholar] [CrossRef]
  32. Fattahi, M.; Kazemeini, M.; Khorasheh, F.; Darvishi, A.; Rashidi, A.M. Fixed-bed multi-tubular reactors for oxidative dehydrogenation in ethylene process. Chem. Eng. Technol. 2013, 36, 1691–1700. [Google Scholar] [CrossRef]
  33. Launder, B.E.; Spalding, D.B. The numerical computation of turbulent flows. Comput. Methods Appl. Mech. Eng. 1974, 3, 269–289. [Google Scholar] [CrossRef]
  34. Byrne, R.C. TEMA Standards of the Tubular Exchanger, 9th ed.; Tubular Exchanger Manufacturers Association, INC.: New York, NY, USA, 2007; pp. 298–300. [Google Scholar]
  35. Gbadago, D.Q.; Oh, H.T.; Oh, D.H.; Lee, C.H.; Oh, M. CFD simulation of a packed bed industrial absorber with interbed liquid distributors. Int. J. Greenh. Gas. Control. 2020. [Google Scholar] [CrossRef]
  36. Worstell, J. Adiabatic Fixed-Bed Reactors: Practical Guides in Chemical Engineering; Butterworth-Heinemann: Texas, TX, USA, 2014. [Google Scholar]
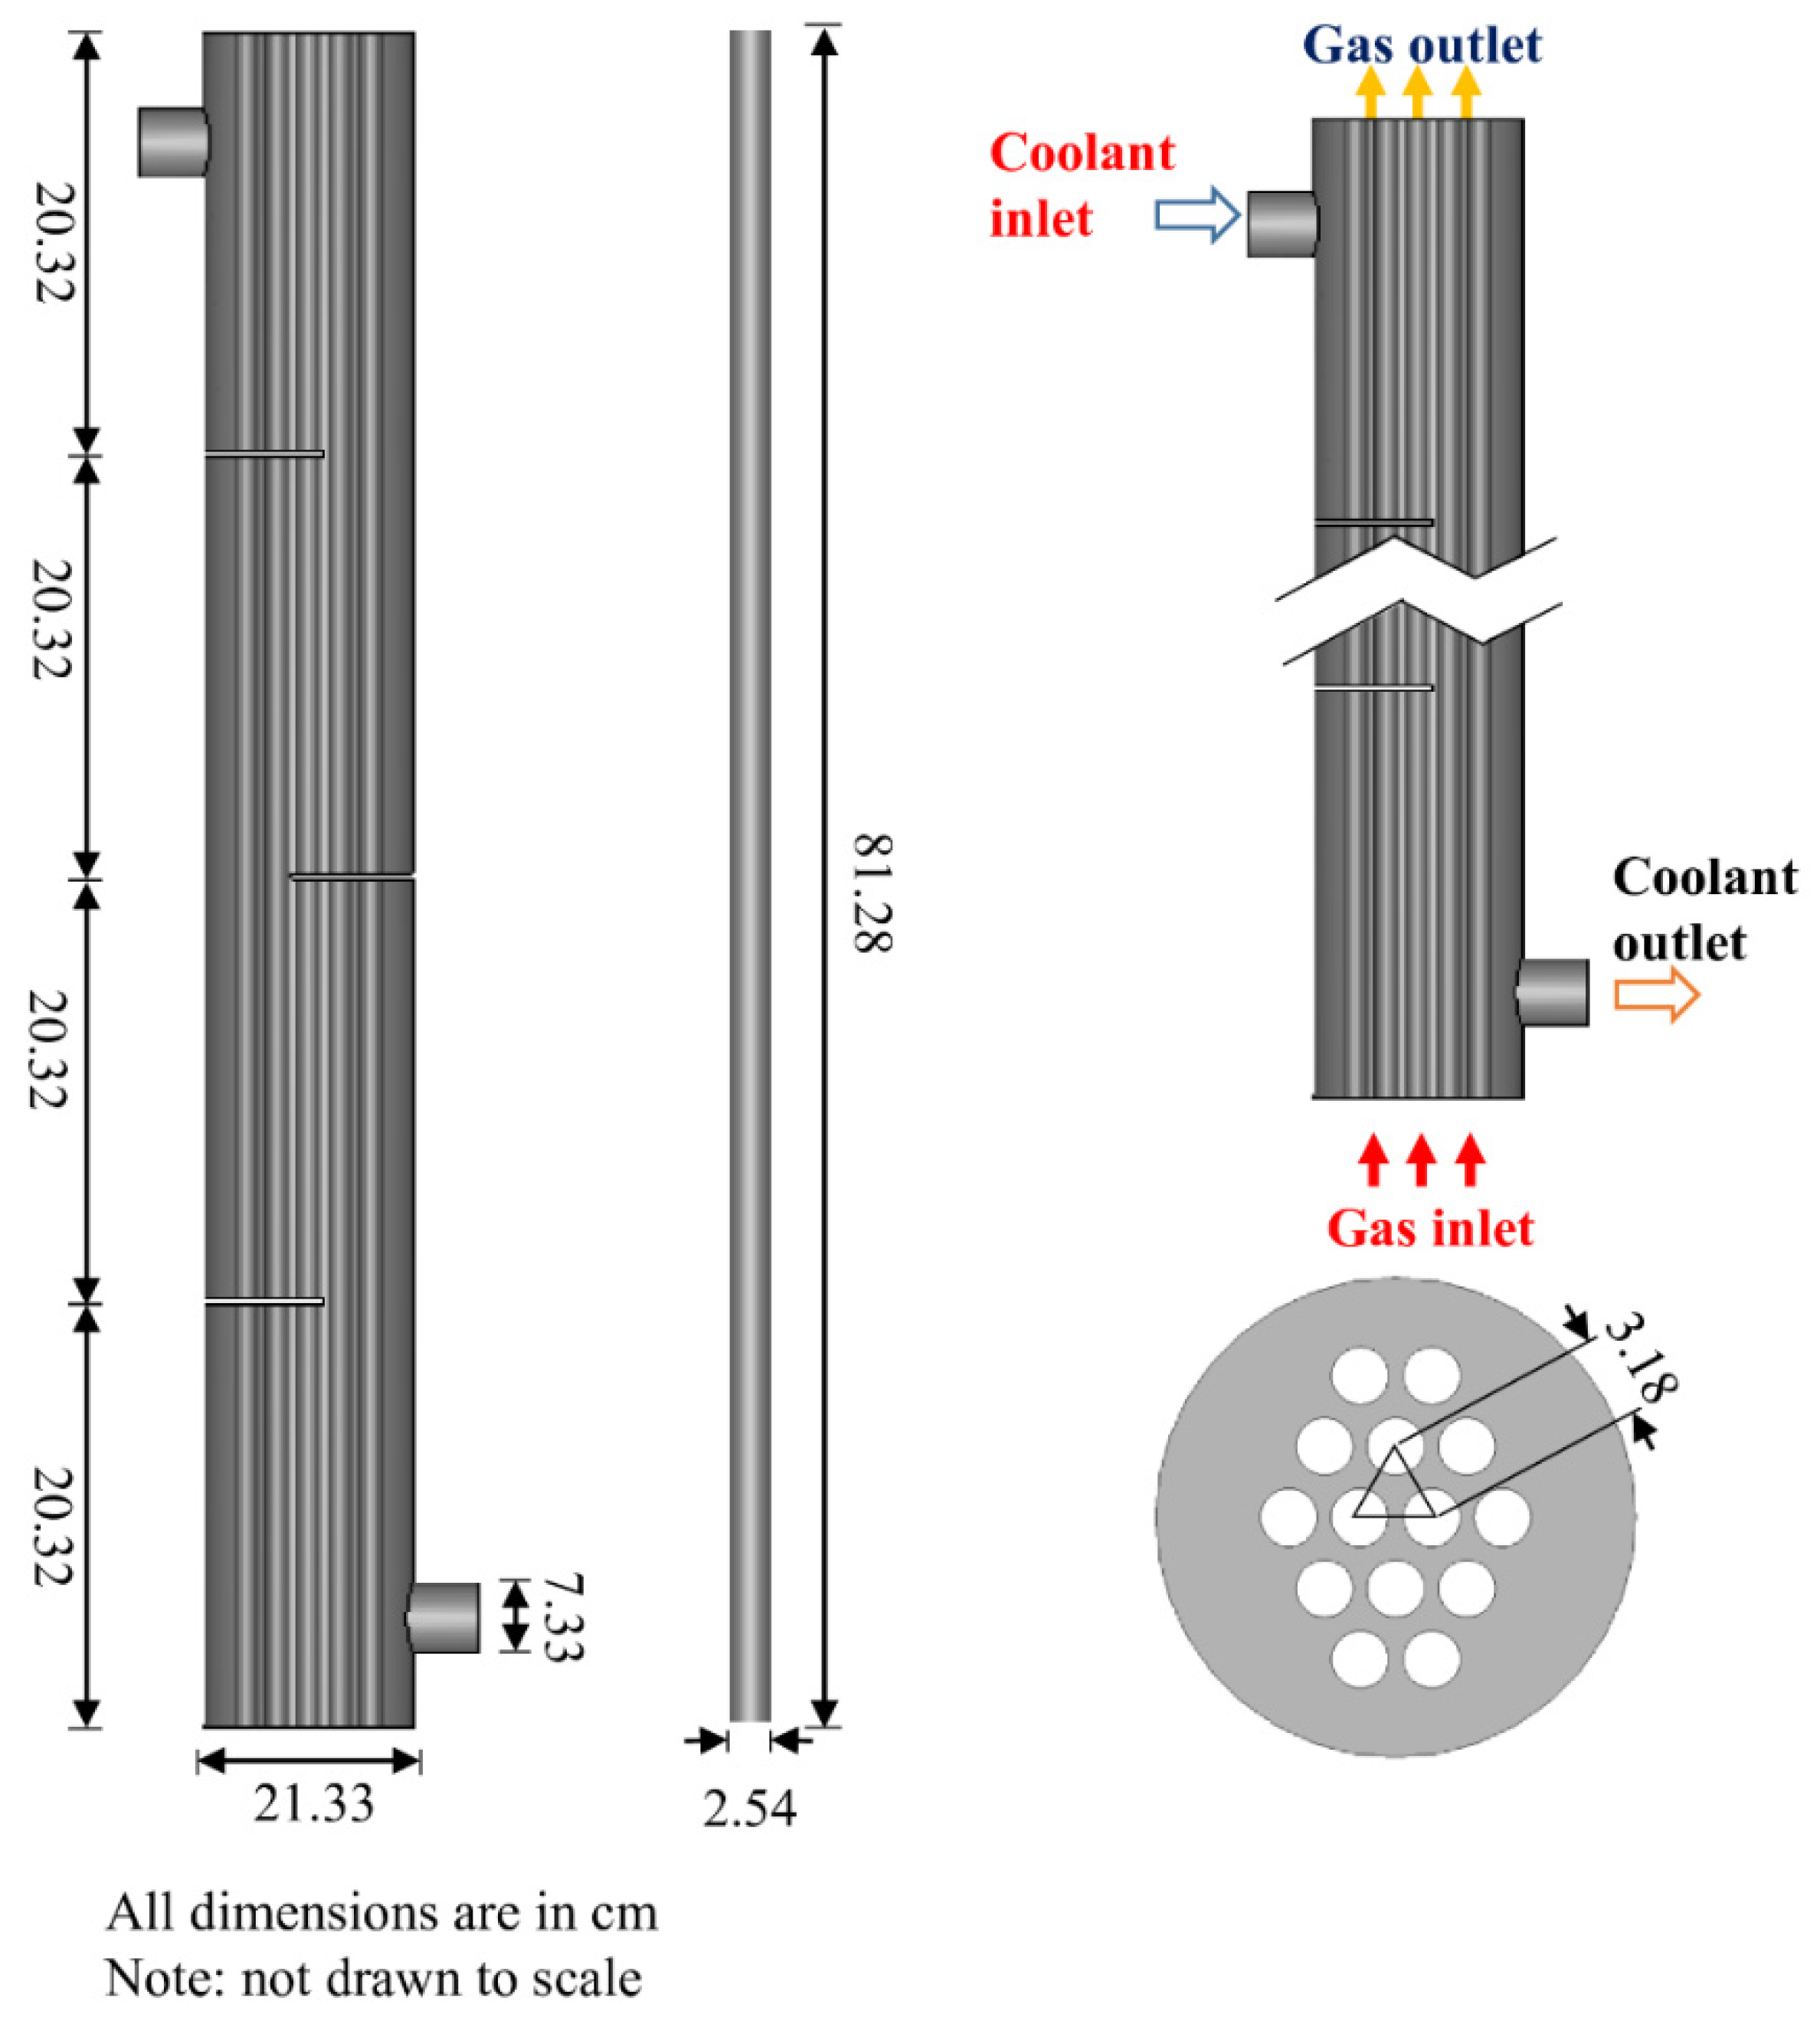
Figure 1. 3D multi-tubular reactor model.
Chemengineering 04 00046 g001
Figure 2. Generated multi-tubular reactor mesh for the CFD simulation. (a) External view of the reactor; (b) Non-conformal mesh view; (c) Detailed cross-sectional view; (d) Bottom and top view showing the 14 tubes.
Chemengineering 04 00046 g002
Figure 3. Summary of the computational fluid dynamics (CFD) solution strategy.
Chemengineering 04 00046 g003
Figure 4. Mesh independency test results: (a) mole fraction of butene; (b) mole fraction of butadiene; (c) gas density; (d) gas velocity.
Chemengineering 04 00046 g004
Figure 5. Comparison of the CFD simulation results with experimental data in terms of mole fractions (EXP: experiment).
Chemengineering 04 00046 g005
Figure 6. Validation of the CFD model under adiabatic conditions: (a) temperature comparison between CFD simulation, experimental data, and simulation reported by Sterrett et al. [18]; (b) concentration profiles of the CFD simulation.
Chemengineering 04 00046 g006
Figure 7. Mole fraction distribution and mole fraction contour plot under isothermal conditions: (a) mole fraction distributions of each species; (b) contour plot of butadiene mole fraction.
Chemengineering 04 00046 g007
Figure 8. Mole fraction distribution and mole fraction contour plot under non-isothermal conditions: (a) mole fraction distributions of each species; (b) contour plot of butadiene mole fraction; (c) 3D velocity profile.
Chemengineering 04 00046 g008aChemengineering 04 00046 g008b
Figure 9. Mole fractions distribution and mole fraction contour plot under adiabatic conditions: (a) mole fraction distributions of each species; (b) contour plot of butadiene mole fraction; (c) 3D velocity profile.
Chemengineering 04 00046 g009aChemengineering 04 00046 g009b
Figure 10. Temperature contour and profiles of a multi-tubular reactor under different thermal conditions: (a) temperature contour under adiabatic conditions; (b) temperature contour non-isothermal conditions (c) temperature profiles under isothermal, non-isothermal, and adiabatic conditions.
Chemengineering 04 00046 g010
Figure 11. Mole fraction distribution along the reactor length at the temperature range between 610 K and 670 K: (a) butene; (b) oxygen; (c) butadiene; (d) carbon dioxide.
Chemengineering 04 00046 g011
Figure 12. Mole fractions and reactor performance profiles as a function of temperature: (a) mole fractions; (b) conversion, yield, and selectivity.
Chemengineering 04 00046 g012
Figure 13. Mole fraction distribution along the reactor length at the temperature range between 3.25 m/s and 35.31 m/s: (a) butene; (b) oxygen; (c) butadiene; (d) carbon dioxide.
Chemengineering 04 00046 g013
Figure 14. Mole fractions and reactor performance profiles as a function of gas velocity: (a) mole fractions; (b) conversion, yield, and selectivity.
Chemengineering 04 00046 g014
Table 1. Kinetic parameters of reaction rates for butadiene and carbon dioxide production.
ParameterUnitValue
A1kmol/kgcat-s1.66 × 109
A2kmol/kgcat-s6.69 × 103
E1J/mol139745.6
E2J/mol87027.2
KBatm−10
KBDatm−1285
K O 2 atm−1415
K O 2 atm−11800
n-0.142
Table 2. Geometric dimensions of the multi-tubular reactor.
ParametersUnitValue
Shell diametercm21.33
Shell lengthcm81.28
Tube diametercm2.54
Tube lengthcm81.28
Tube pitchcm3.18
Tube pattern-30°-triangular
Number of tubes-14
Nozzle diametercm7.33
Nozzle lengthcm5.6
Baffle spacingcm20.32
Baffle thicknesscm0.37
Number of baffles-3
Table 3. Process conditions and model parameters.
ParametersUnitValue
Operating pressureatm1
Gas inlet temperatureK633
Gas velocitym/svariant
Coolant inlet temperatureK300
Coolant velocitym/s1
Inlet mole compositions
Butene (C4H8)-0.05
Oxygen (O2)-0.047
Steam (H2O)-0.717
Nitrogen (N2)-0.186
Butadiene (C4H6)-0
Carbon dioxide (CO2)-0
Bulk density of catalystkg/m37393.92
Porosity-0.35
Actual catalyst densitykg/m34806.05
km2/s20.00375
εm2/s30.012
Table 4. Computational boundary conditions.
Boundary fieldGas inletCoolant inletGas outletCoolant outletWall
Gas velocityfixedValuefixedValuezeroGradientzeroGradientnoSlip
Coolant velocityfixedValuefixedValuezeroGradientzeroGradientnoSlip
PressurefixedFlux
Pressure
fixedFlux
Pressure
totalPressuretotalPressurefixedFlux
Pressure
TemperaturefixedValuefixedValueinletOutletinletOutletzeroGradient
Species concentrationfixedValuefixedValueinletOutletinletOutletzeroGradient
EpsilonfixedValuefixedValuezeroGradientzeroGradientepsilonWall
Function
KfixedValuefixedValuezeroGradientzeroGradientkqRWall
Function
The italicized words indicate default or standard boundary condition names in OpenFOAM.
Table 5. Numerical discretization schemes.
TermKeywordDescriptionScheme
ConvectiondivSchemesDiscretizing the divergence, Gauss limitedLinear V 1
GradientgradSchemesDiscretizing the gradient, Gauss linear 1
DiffusionlaplacianSchemesDiscretizing the Laplacian, 2 Gauss linear orthogonal
Time derivativeddtSchemesDiscretizing first and second-order term derivatives, t ,   2 t 2 Euler
OthersinterpolationSchemes
snGradSchemes
Cell to face interpolations
Component of gradient normal to a cell face
linear
orthogonal
The italicized words indicate default or standard numerical scheme names in OpenFOAM.