Article

Solid Polymer Electrolytes Derived from Crosslinked Polystyrene Nanoparticles Covalently Functionalized with a Low Lattice Energy Lithium Salt Moiety

1
Department of Chemistry, Illinois Institute of Technology, Chicago, IL 60616, USA
2
Department of Mechanical, Materials and Aerospace Engineering, Illinois Institute of Technology, Chicago, IL 60616, USA
3
Department of Physical Sciences, Dominican University, River Forest, IL 60305, USA
*
Author to whom correspondence should be addressed.
ChemEngineering 2020, 4(3), 44; https://doi.org/10.3390/chemengineering4030044
Submission received: 3 May 2020 / Revised: 14 June 2020 / Accepted: 6 July 2020 / Published: 16 July 2020

Abstract

:
Three new crosslinked polystyrene nanoparticles covalently attached with low lattice energy lithium salt moieties were synthesized: poly(styrene lithium trifluoromethane sulphonyl imide) (PSTFSILi), poly(styrene lithium benzene sulphonyl imide) (PSPhSILi), and poly(styrene lithium sulfonyl-1,3-dithiane-1,1,3,3-tetraoxide) (PSDTTOLi). A series of solid polymer electrolytes (SPEs) were formulated by mixing these lithium salts with high molecular weight poly(ethylene oxide), poly(ethylene glycol dimethyl ether), and lithium bis(fluorosulfonyl)imide. The crosslinked nano-sized polymer salts improved film strength and decreased the glass transition temperature (Tg) of the polymer electrolyte membranes. An enhancement in both ionic conductivity and thermal stability was observed. For example, the SPE film containing PSTFSILi displayed ionic conductivity of 7.52 × 10⁻⁵ S cm−1 at room temperature and 3.0 × 10⁻³ S cm−1 at 70 °C, while the SPE film containing PSDTTOLi showed an even better performance of 1.54 × 10⁻⁴ S cm−1 at room temperature and 3.23 × 10⁻³ S cm−1 at 70 °C.

1. Introduction

Over the past two decades, rechargeable lithium-ion batteries (LIBs) have been strongly considered worldwide as the most reliable sustainable energy storage systems [1,2]. LIBs display good specific energy density (150–350 Wh kg−1), long cycle life, high open-circuit voltage, low self-discharge rate, and high efficiency [3]. These properties make them attractive for portable electronics, electric vehicles, and renewable energy storage systems. Currently, most commercial LIBs use organic liquid electrolytes composed of ~1 M LiPF6 in a mixture of organic solvents such as ethylene carbonate (EC), propylene carbonate (PC), diethyl carbonate (DEC), and dimethyl carbonate (DMC) because liquid electrolytes provide very high ionic conductivity. However, the liquid electrolytes pose a serious safety issue due to their high flammability and potential for leakage. This makes solid polymer electrolytes (SPEs) a promising alternative to enhance the safety performance of LIBs.
Gel polymer electrolytes (GPEs) with characteristics of both solid and liquid electrolytes have also been investigated to address the safety issue of LIBs. GPEs formed by incorporating a significant amount of organic liquid electrolytes into a polymer framework display very high ambient temperature ionic conductivities. However, they suffer from several disadvantages such as poor mechanical properties and increased reactivity toward the metal electrode, leading to significant decrease in battery lifetime and safety. In contrast, SPEs have the potential to solve the safety issue in LIBs [3]. SPEs possess many advantageous features, among which are lightweight, shape versatility, ease of processability, superior interfacial stability [4], and mechanical properties.
SPEs were first developed by P.V. Wright in the early 1970s by preparing an ionic complex of PEO with alkali metal salts [5,6]. Since then, numerous studies involving PEO-LiTFSI-based SPEs have been conducted to prepare thinner, lighter, and safer LIBs [7]. The most widely studied low lattice energy lithium salt for SPEs is LiTFSI, which is attributed to several intrinsic features of the large anion TFSI including (1) the high flexibility of –SO2–N–SO2– of TFSI, which is favorable for reducing the crystallinity of the PEO matrix; (2) the highly delocalized charge distribution of TFSI is pivotal for effectively reducing the interactions between Li+ and TFSI, thus increasing the dissociation and solubility of LiTFSI in the PEO matrix [8]; and (3) excellent thermal, chemical, and electrochemical stability, which is required for stable electrolytes. The Tg of electrolytes with LiTFSI is ordinarily lower than that of electrolytes with other salts such as LiClO4 and LiCF3SO3. These significant properties of TFSI are helpful in developing reliable conductive SPEs for LIBs and other electrochemical devices [9]. However, PEO–LiTFSI-based SPEs show acceptable ionic conductivity only at a temperature higher than the melting point (Tm) of PEO. It is well established that the segmental mobility of a polymer matrix is frozen in the crystallinity phase, and the lithium ion transportation occurs only in the amorphous region of the polymer hosts [9,10]. Although the excellent chain flexibility of PEO causes lithium salts to be easily dissolved and promotes the smooth movement of dissociated ions, PEO-based electrolytes still exhibit relatively low ionic conductivity (10−7~10−5 S cm−1) due to the high degree of crystallinity present in PEO at room temperature [11]. Consequently, finding an ideal SPE with good ion transport properties is still a challenging task.
Several research groups have improved the performance of the polymer electrolytes by reducing the crystallinity of the polymer, increasing the concentration of ions, and increasing the proportion of the amorphous regions [12]. Some of the notable strategies include decreasing glass transition temperature (Tg) of the polymer electrolyte system and improving the magnitude of lithium ion dissociation [13] through the methods of grafting, crosslinking, mixing with ionic liquids, and blending various polymers materials [14,15,16,17]. Recent studies involving polymer nanoparticles containing composite polymer electrolytes (CPEs) have received great attention because of their superior electrolytic properties such as high amorphous content, low Tg, and high thermal and mechanical properties [18,19]. In light of this development, in this research study, we designed and synthesized three types of crosslinked polystyrene nanoparticles containing covalently functionalized lithium salt moieties (PSLSs) for the purpose of destroying the crystallinity of PEO-based electrolytes, leading to higher ionic conductivity. In order to achieve superior SPE properties (viz., compatibility, electrolytic and mechanical properties), we blended these polymer-bound lithium salts with a traditional polymer electrolyte system made of high molecular weight PEO and LiTFSI [15]. Polymer composites containing nanoparticles reinforce the polymer matrix, leading to enhancement of the mechanical properties. The high surface area of the nanoparticles is responsible for more physical interaction with the polymer matrix. We also included a low molecular weight polyethylene glycol dimethyl ether (PEGDM) plasticizer in the SPE formulations. The addition of a plasticizer has been extensively used to improve the ionic conductivity of PEO-based SPEs [16].

2. Experimental

2.1. Materials and Characterization

Styrene (St), divinyl benzene (DVB), ammonium persulfate (APS), Triton X-100 (emulsifier), sodium dodecyl sulfonate (SDS), chlorosulfonic acid, trifluoromethane sulfonamide, PEGDM (Mw = 1000 g mol−1), PEO (Mw = 4,000,000 g mol−1), and lithium hydroxide mono were all purchased from Sigma-Aldrich Chemical Co. Ltd (St. Louis, MO, USA). Acetone, acetonitrile, dichloromethane, and methanol were supplied by Fisher Scientific Co. Ltd., (Waltham, MA, USA).
Fourier transform infrared (FTIR) of all SPEs were recorded in a high resolution Perkin-Elmer (Frontier Optica) instrument. The morphology of the PS-bound lithium salt nanoparticles was analyzed using scanning electron microscopy (SEM) (Cambridge, Leica) with an accelerating voltage value equal to 15 kV. Thermogravimetric measurements were carried out with a TGA/SDTA851e thermal analyzer (Mettler Toledo, Columbus, OH, USA). Differential scanning calorimetry (DSC) analysis was carried out with a Mettler Toledo Differential Scanning Calorimeter instrument under an argon atmosphere with a flow rate at 70.0 mL min−1 between −100 °C and 150 °C. The ionic conductivities of the formulated electrolytes were measured by the complex impedance method using an impedance analyzer (Solartron model SI-1287, Ametek, Inc., Berwyn, PA, USA) coupled to a Solartron model-1260 (Ametek, Inc., Berwyn, PA, USA) frequency response analyzer. The electrochemical stability of the SPE membranes was determined by cyclic voltammetry (CV) using a potentiostat/galvanostat (Solartron impedance analyzer).

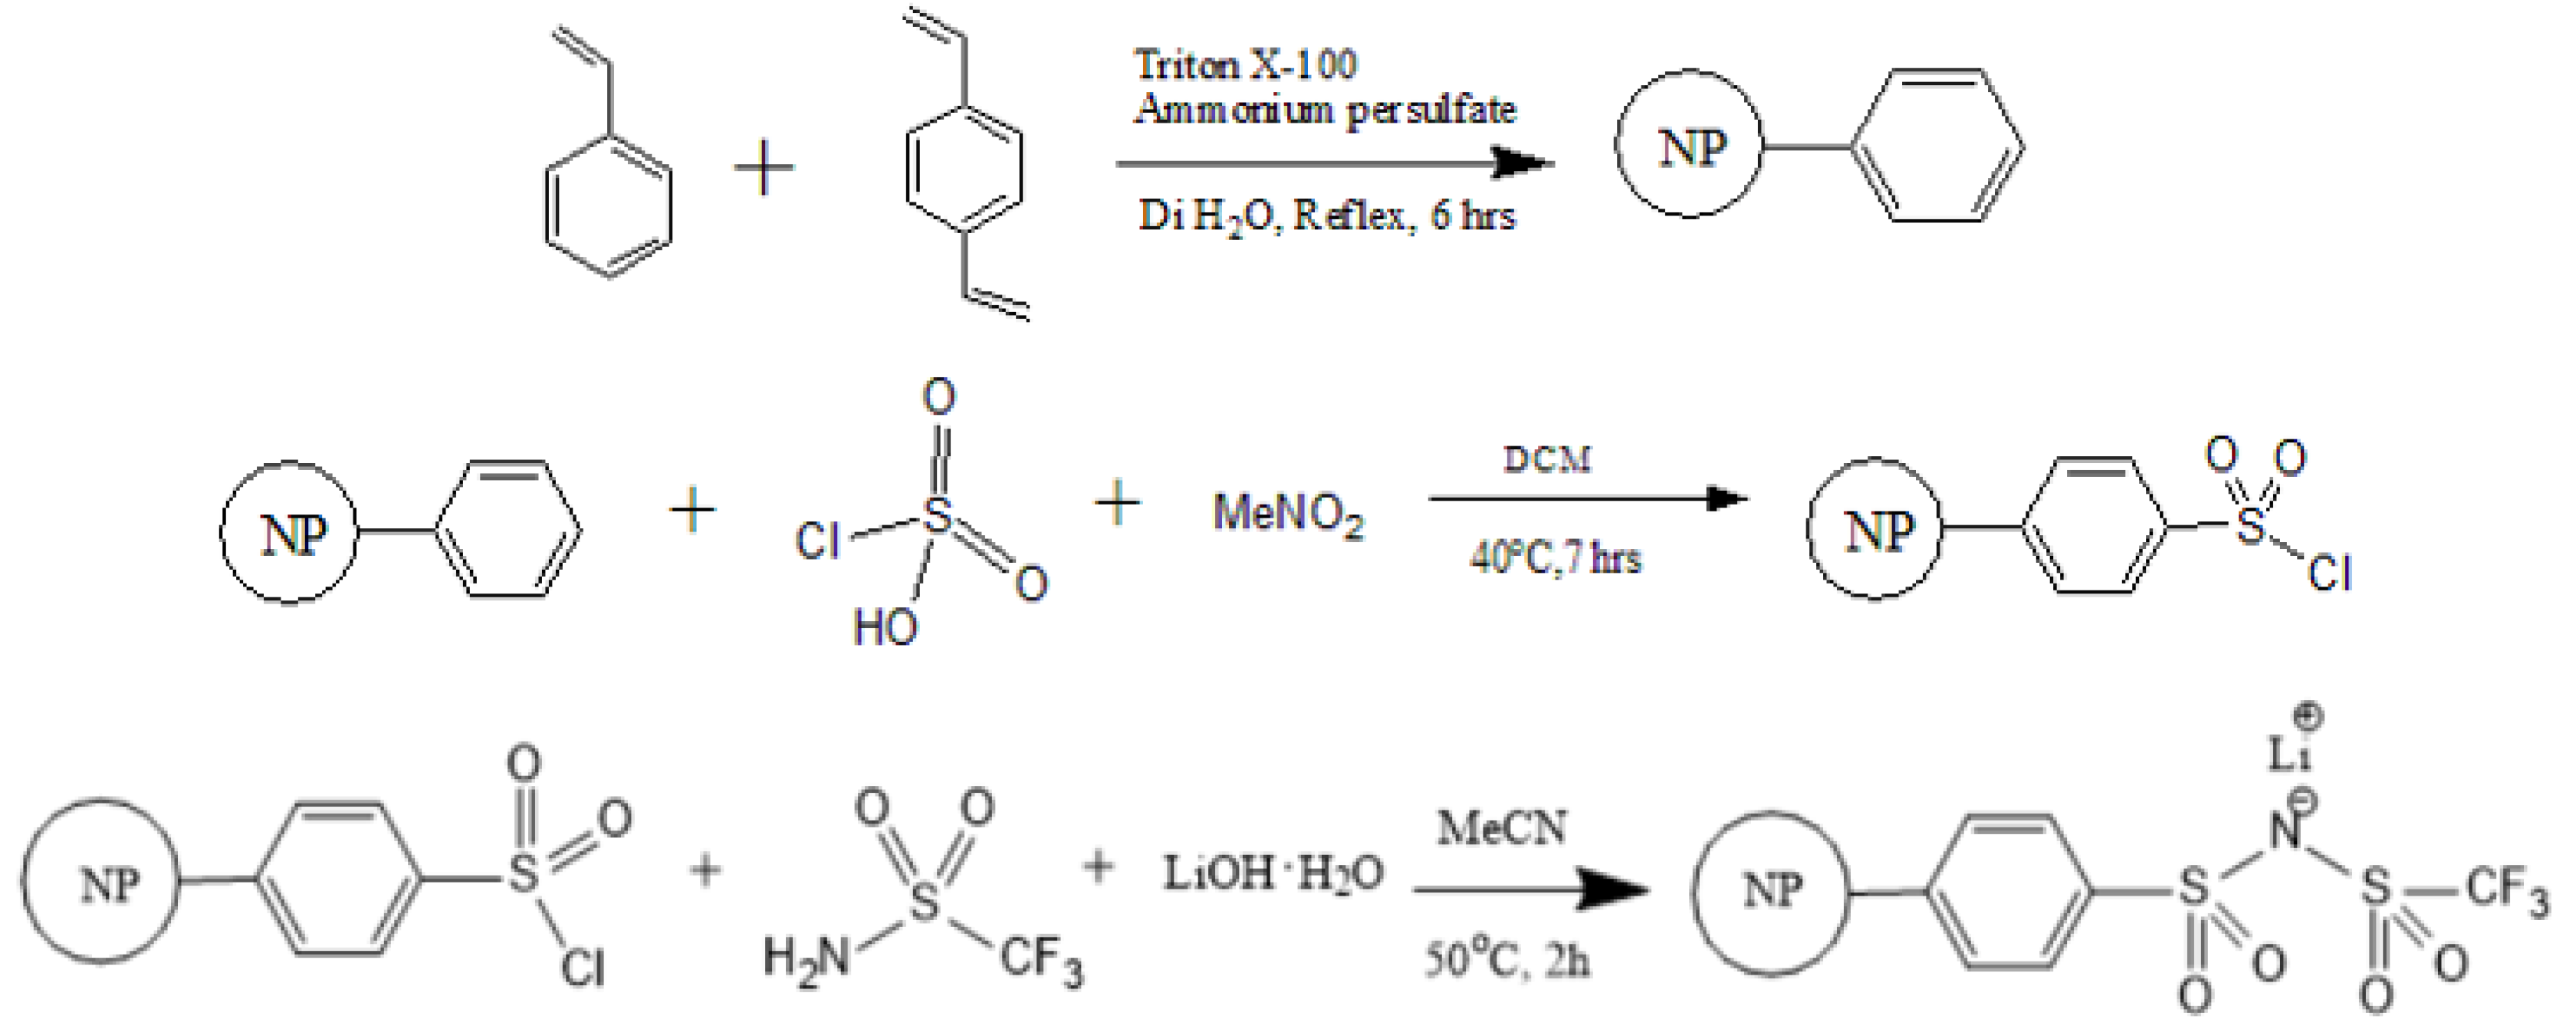
2.2. Synthesis of PS–SO2Cl

A total of 4.30 g of PS and 40 mL of dichloromethane was placed in a flask and stirred overnight for solvent absorption. A mixture of 12.5 mL of nitromethane and 13 mL of chlorosulfonic acid was added drop by drop. The reaction mixture was heated for 7 h at 40 °C. After isolating the crude product, 10 mL of dichloromethane was added. The solution was filtered on a sintered funnel, washed twice with 10 mL of acetonitrile, and then washed twice with 10 mL of acetone. The entrapped solvent was removed under vacuum at 70 °C overnight (Yield: 7.99 g) [20]. FTIR: 2928.05 cm−1, 1365 ± 5 (as) and 1180 ± 10 (s) cm−1, 1160–1140 (s) and 1350–1300 (s) cm−1, 1450–1500 cm−1, 772.50 cm−1, 672.09 cm−1.

2.3. Synthesis of PSTFSILi

PS–SO2Cl (2.50 g, 12.2 mmol), trifluoromethanesulfonamide (1.97 g, 13.2 mmol), and lithium hydroxide monohydrate (1.11 g, 26.5 mmol) were placed into a 50 mL flask containing 30 mL of anhydrous acetonitrile. The mixture was stirred at room temperature overnight and then heated to 50 °C for 2 h and cooled down. The mixture was sonicated in 15 mL methanol and centrifuged. The washing process was repeated with water and acetone. The product was dried in a high vacuum oven at 70 °C overnight (Yield: 2.55 g). FTIR: 2900–2950 cm−1 (m), 1350–1300 (s) cm−1 and 1180–1140 (s), 1000–1400 cm−1, 1639.23 cm−1 (sh), 795.44 cm−1 (m), 677.52 cm−1 (m).

2.4. Synthesis of PSPhSILi

PS–SO2Cl (2.50 g, 12.3 mmol), benzenesulfonamide (1.94 g, 12.3 mmol), and lithium hydroxide monohydrate (1.04 g, 24.7 mmol) were placed in a 50 mL flask containing 30 mL of anhydrous acetonitrile. The mixture was stirred at room temperature overnight and then heated to 50 °C for 2 h and cooled. The mixture was sonicated in 15 mL methanol and centrifuged. The washing process was repeated with water and acetone. The product was dried in a high vacuum oven at 70 °C overnight (Yield: 2.55 g). FTIR: 3063.53 cm−1 (s), 2850–2950 cm−1 (sh), 1400–15,000cm−1 (s), 1000–1200 cm−1 (s), 1638.34 cm−1 (sh), 1600.48 cm−1 (m), 832.79 cm−1 (m), 678.43 cm−1 (m), 580.10 cm−1 (m).

2.5. Synthesis of PSDTTOLi

Synthesis of polystyrenesulfonyl-1,3-dithiane. The 1,3-dithiane (0.32 g) was placed in a 5 mL 3-neck flask, then 1.8 mL of 2.5 M n-butyllithium solution was added to the flask under argon. The mixture was stirred at 0 °C for 1 hour before PS–SO2Cl (0.50 g) was added, which was soaked with THF for 3 h. The reaction was continued overnight. The mixture was sonicated in 15 mL methanol and centrifuged. The washing process was repeated with water and acetone. The product was dried in a high vacuum oven at 70 °C overnight (Yield: 0.51 g). FTIR: 2900–2950 cm−1, 1638.61 cm−1, 1595.89 cm−1, 1350–1495 (s) cm−1, 1000–1180 cm−1, 831.89 cm−1, 775.60 cm−1, 673.52 cm−1, 578.62 cm−1.
Synthesis of polystyrenesulfonyl-1,3-dithiane-1,1,3,3-tetraoxide (PSDTTO). Polystyrenesulfonyl-1, 3-dithiane (0.50 g) was placed in a 50 mL flask containing 15 mL of acetic acid. Hydrogen peroxide (10 mL) was added to the flask. The mixture was heated and stirred at 60 °C. The reaction was conducted for three days with further additions of 1 mL of hydrogen peroxide/day. The product was filtered and washed with 15 mL water. The product was dried in a high vacuum at 70 °C overnight (Yield: 0.34 g). FT-IR: 2900–2950 cm−1, 1717.43 cm−1, 1639.34 cm−1, 1600.46 cm−1, 1350–1495(s) cm−1, 1000–1225 cm−1, 831.89 cm−1, 775.61 cm−1, 673.52 cm−1, 578.62 cm−1.
Synthesis of PSDTTOLi. Polystyrenesulfonyl-1,3-dithiane-1,1,3,3-tetraoxide (0.34 g) and lithium methoxide (0.08 g) were placed into a 50 mL flask containing 20 mL of methanol. The mixture was stirred at room temperature for two days. The product was washed with methanol twice, followed by acetone. The product was dried in a high vacuum at 70 °C overnight (Yield: 0.35 g). FTIR: 2900–2950 cm−1, 1705.73 cm−1, 1637.34 cm−1, 1600.75 cm−1, 1410–1495 (s) cm−1, 1000–1190 cm−1, 832.79 cm−1, 776.25 cm−1, 678.43 cm−1, 582.81 cm−1.

2.6. Thin Film Processing and Cell Fabrication

PEGDM, PEO, and PSLS were mixed in a mortar and pestle. The mixture was then placed in between two Teflon coated sheets, then hot pressed in a Carver press at 100 °C under 10 psi pressure for 5 min [21]. The resulting SPE film was then folded, refolded, and subjected to further hot pressing to achieve a well-dispersed electrolyte film. Two thin stainless-steel plates were used as a spacer to control the thickness of the film. The polymer films were cut circularly in a 2.04 cm2 area and sandwiched between two steel electrodes and subjected to impedance analysis.

3. Results and Discussion

3.1. Synthesis of PS-Bound Lithium Salts

As outlined in Figure 1, the synthesis began with the preparation of crosslinked polystyrene nanoparticles following the method of Brijmohan et al. [22]. Chlorosulfonation of the PS nanoparticles was successfully carried out with a minor modification of a reported procedure [22]. The new TFSI-like PS-bound lithium salt, PSTFSILi, was synthesized in a single-step by reacting the chlorosulfonated PS nanoparticles with CF3SO2NH2 in the presence of LiOH. The incorporation of a similar lithium salt moiety (–SO2NLiSO2CF3) on a benzene ring has been previously reported, but involved three steps starting from the benzene sulfonyl chloride analog [23].
The aforementioned one-step synthesis of the lithium sulfonimide derivative was successfully employed to prepare the other new PS-bound lithium salt, PSPhSILi (Figure 2). The special feature of this solid–liquid phase synthesis included a very simple work-up (filtration and washing).
The final new PS-bound lithium salt, PSDTTOLi, was prepared in three steps: (1) coupling of 1,3-dithiane with PS–SO2Cl using the standard BuLi activation protocol; (2) oxidation of thioether groups to sulfones using hydrogen peroxide; and (3) lithiation using LiOH (Figure 3).

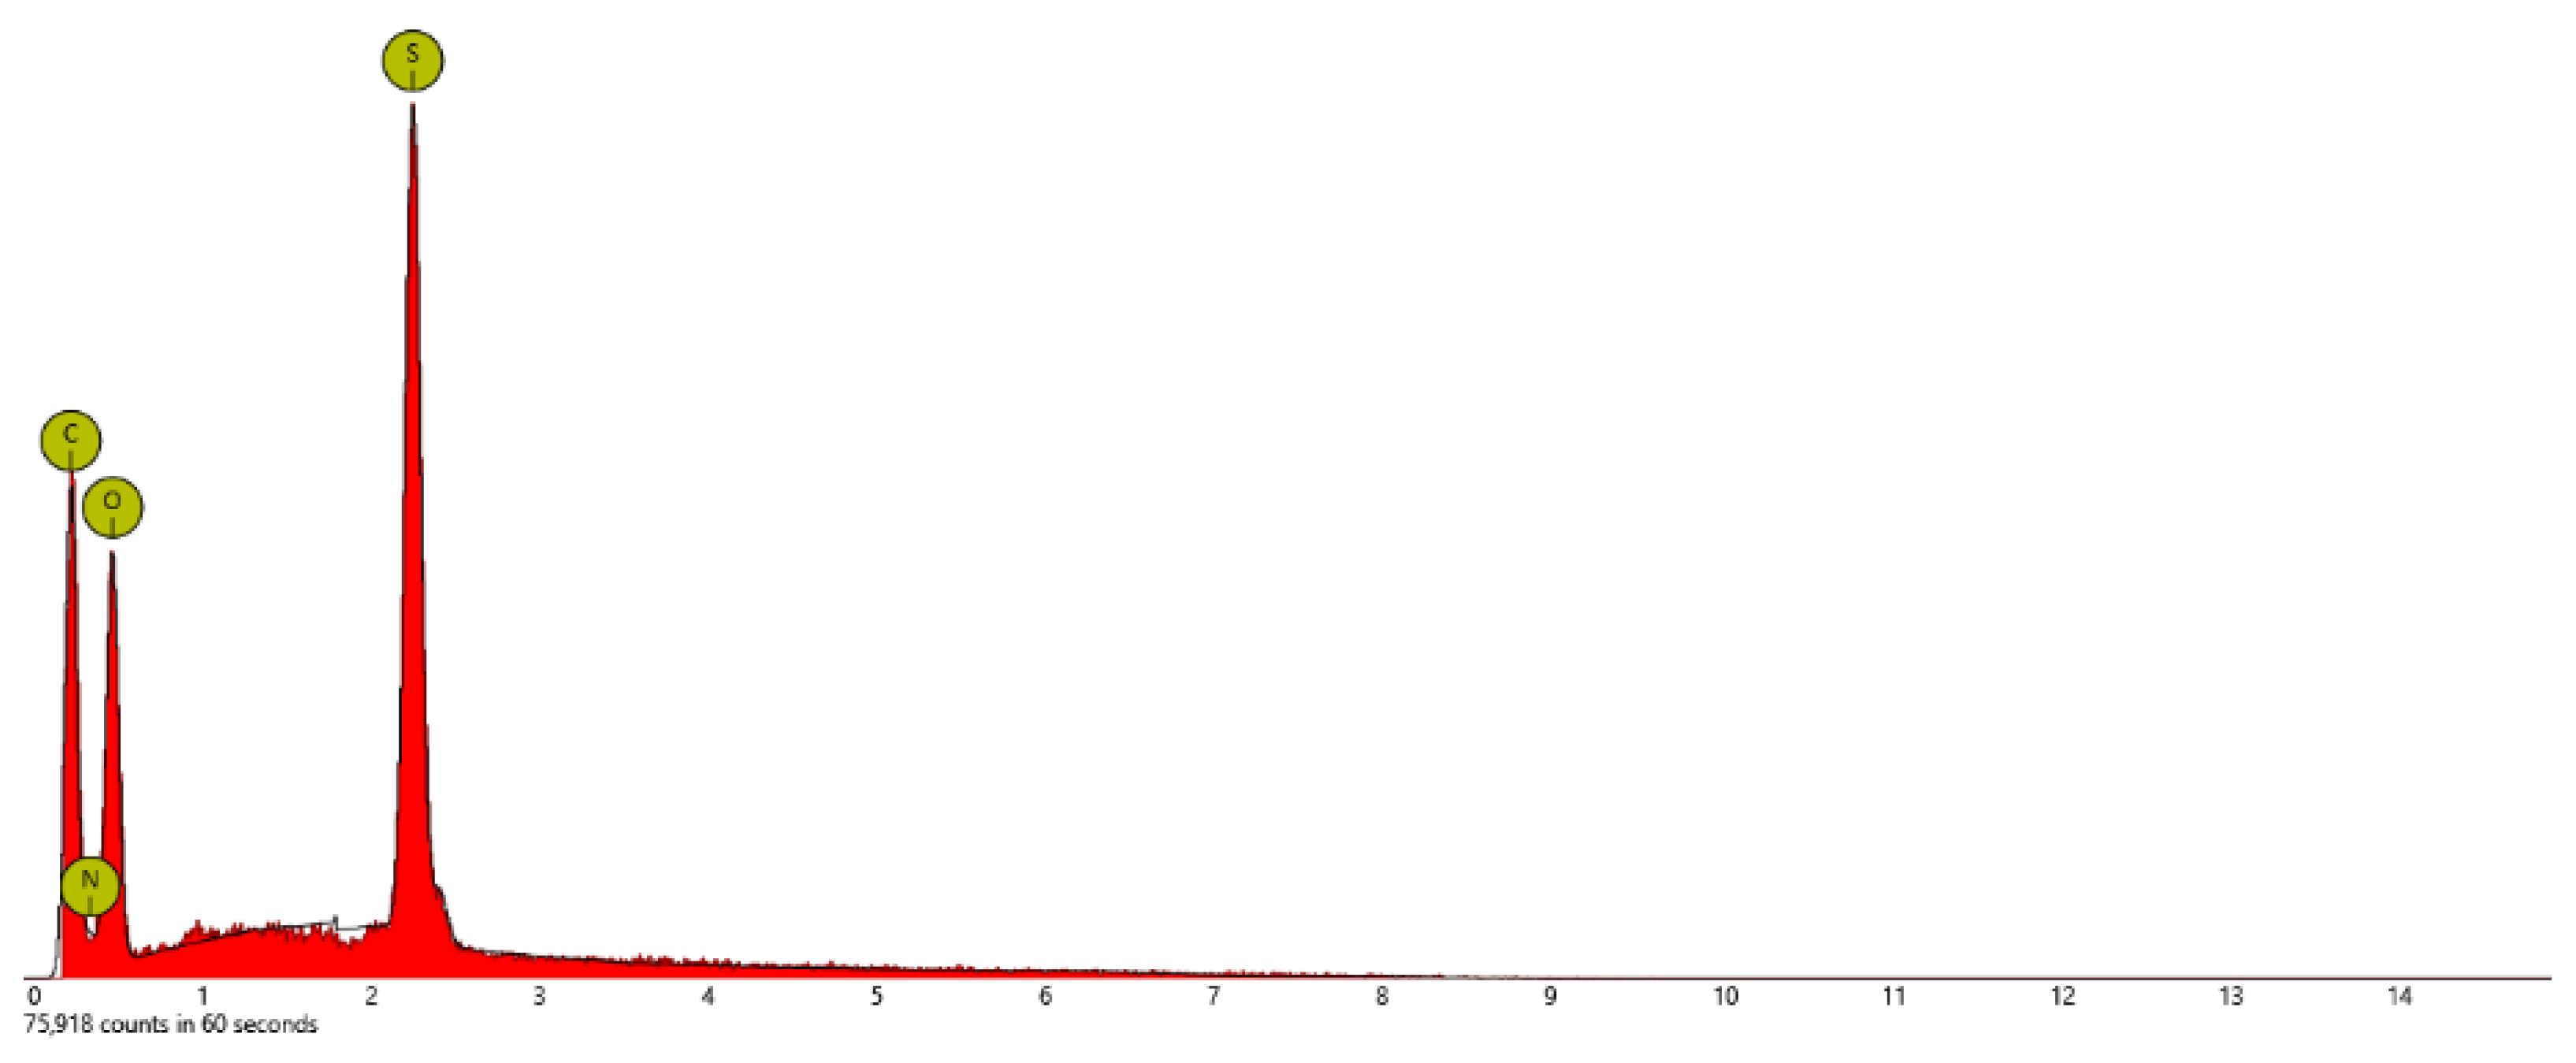
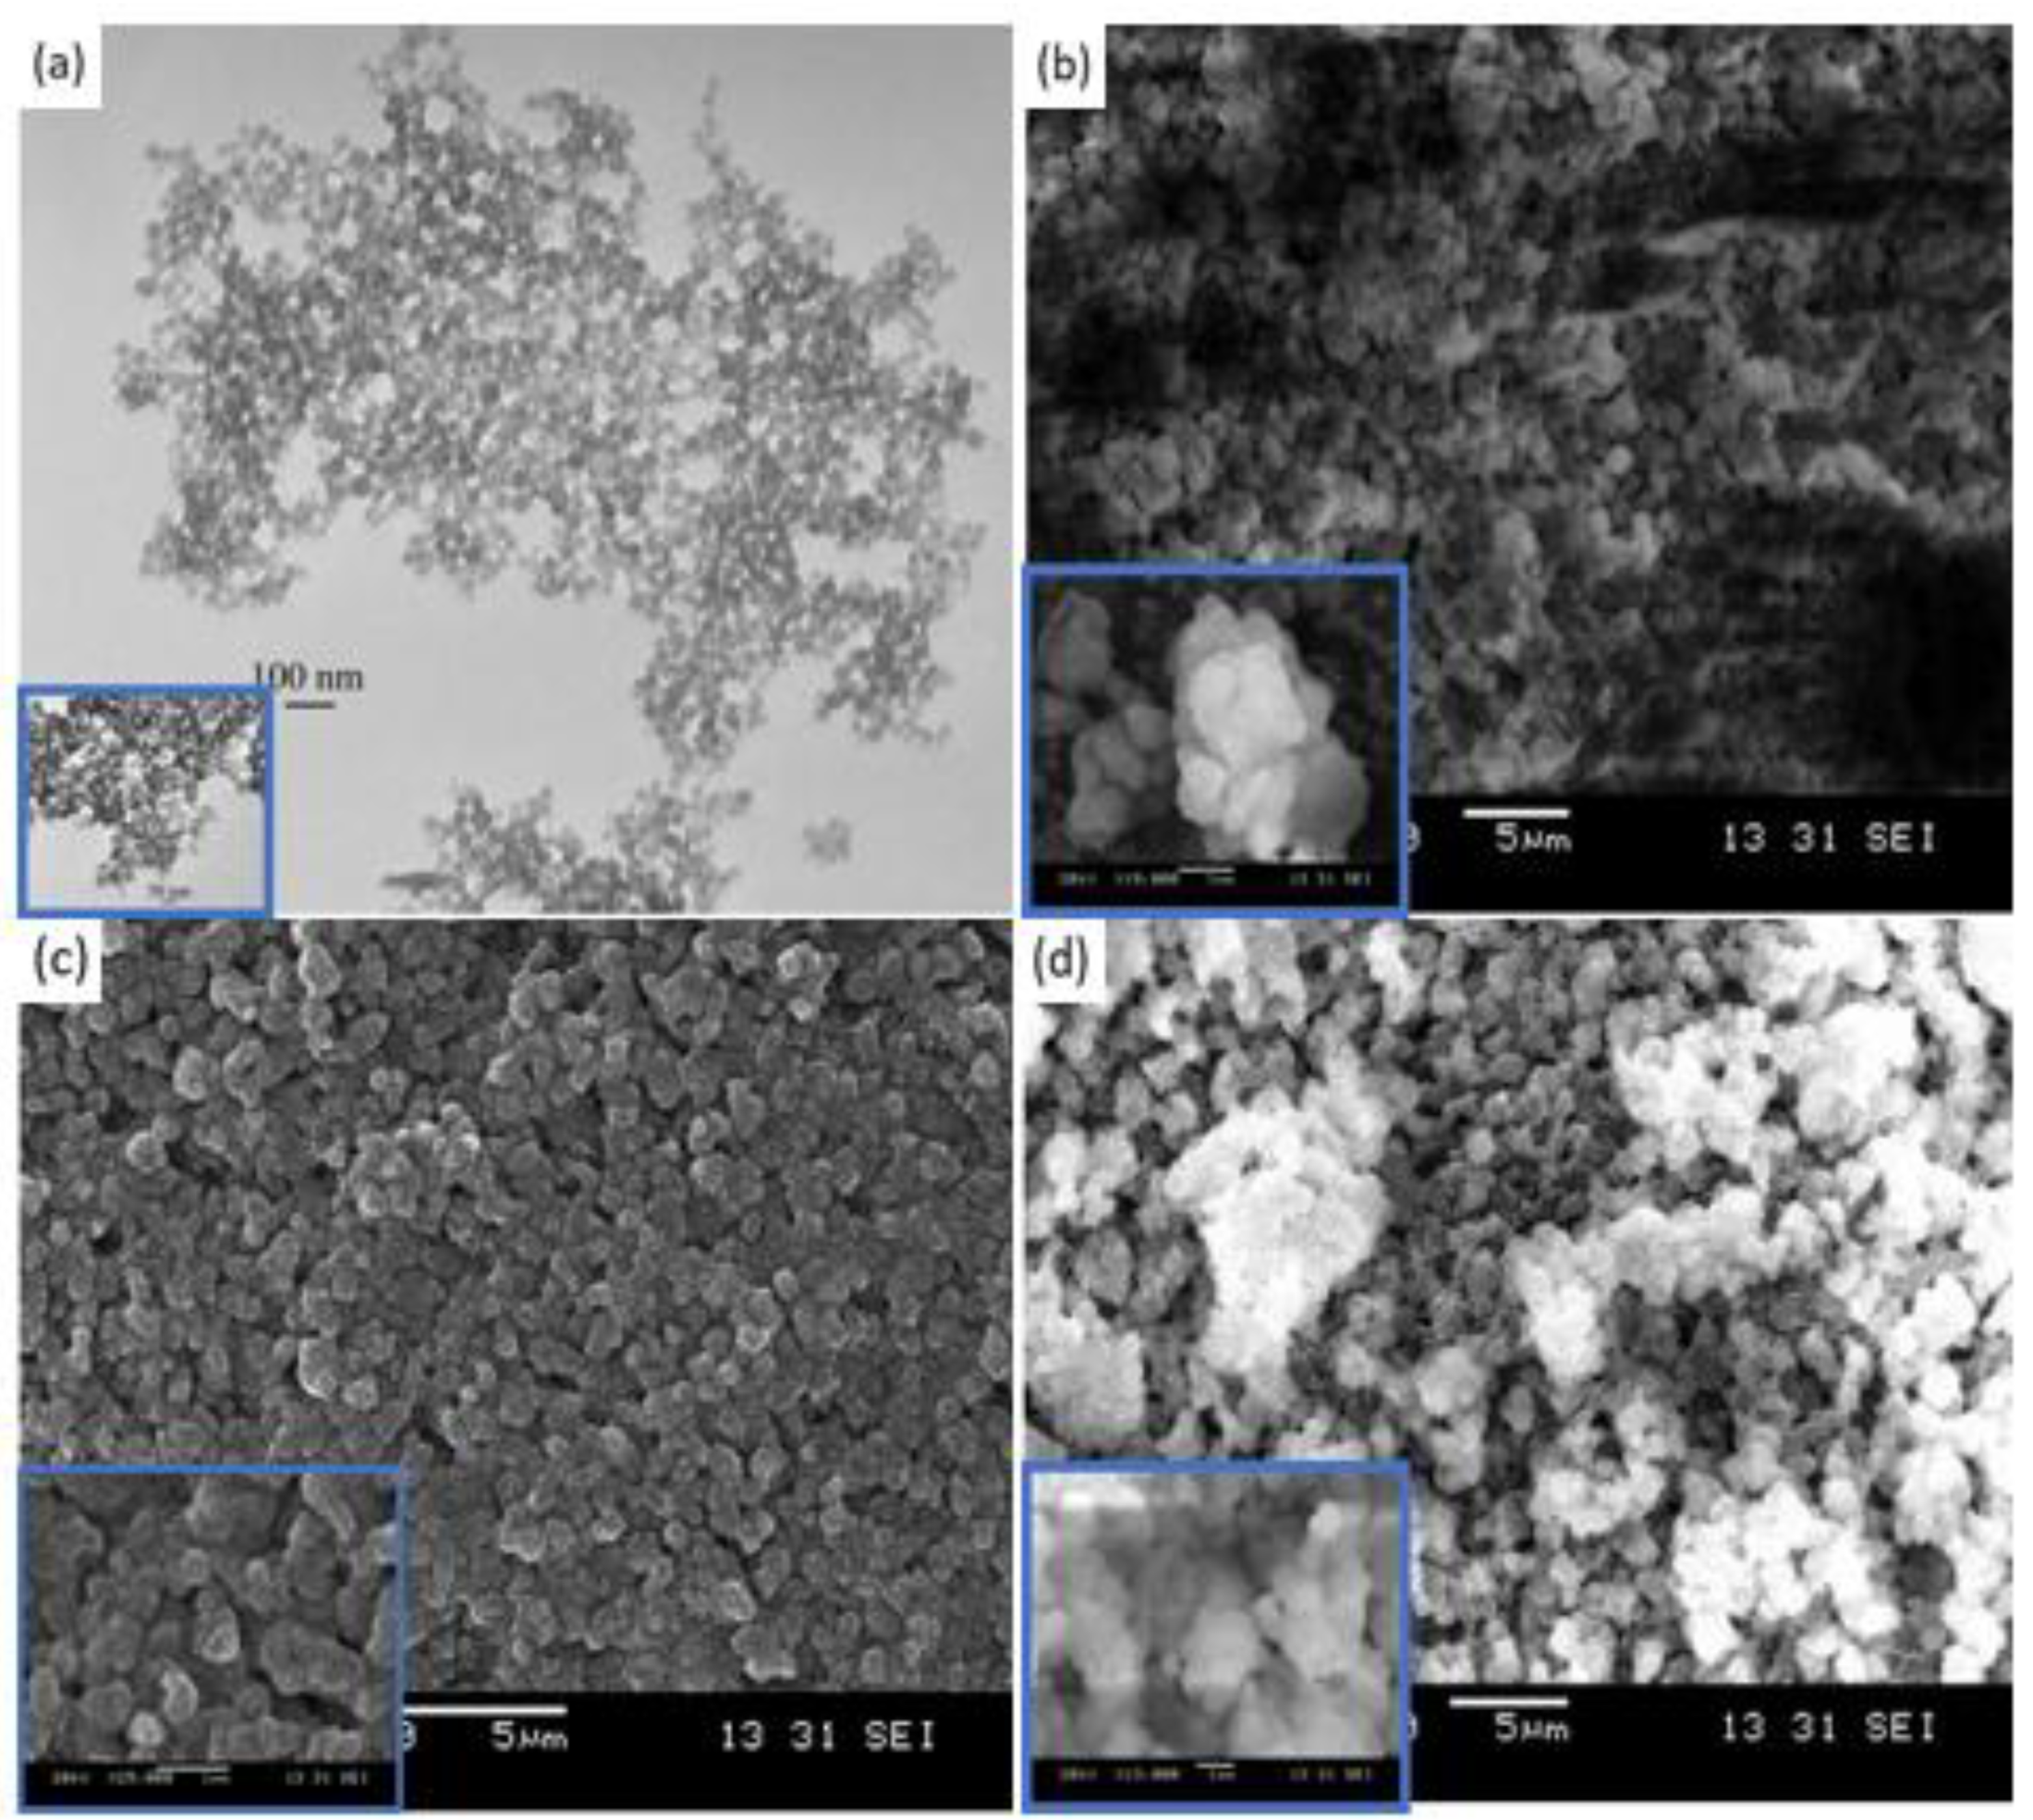
3.2. Structural Characterization

FTIR Spectroscopy: FTIR spectra of the nanoparticles were obtained by dispersing the sample in anhydrous potassium bromide. For PSTFSILi, the peak at 1000–1400 cm−1 corresponded to the stretching of the C–F bond. The broad peaks in the range of 1350–1300 cm−1 (s) and 1180–1140 cm−1 (s) were due to the O2S–N-bond. For PSPhSILi, strong peaks around 3063.53 cm−1 corresponded to aromatic C–H stretching and 1500–1400 cm−1 related to aromatic C=C stretching. The peak around 1630 cm−1 represents the S–N–S combination bond, which indicates that the reaction was complete. For PSDTTOLi, after lithiation of PSDTTO, the peak at 1717.43 cm−1 shifted to 1705.73 cm−1, and 1639.34 cm−1 shifted to 1637.34 cm−1, which can be assigned to the stretching vibration band of carbon with the existence of three sulfone electron withdrawing groups. These data partially support the proposed structures of the lithium bound polymer salts.
Energy Dispersive X-ray Spectroscopy (EDS): This technique for elemental analysis was performed with a scanning electron microscope (SEM, Phenom Pro-X, Nanoscience Instruments) by selecting three different mapping areas in the secondary electron mode with an acceleration voltage of 15 kV. All samples were deposited on a silicon wafer for SEM/EDS measurement after they were dispersed in pure ethyl alcohol and sonicated for 1 h. EDS measurement of each mapping area took about seven minutes, so the total collecting time was 21 min for the three different mapping areas to obtain better statistics or consistency. Figure 4, Figure 5 and Figure 6 show the EDS elemental composition of each sample, while the obtained elemental concentrations from the EDS studies are presented in Table 1. The analysis of the data indicates that all of these salts had a different ratio of carbon, nitrogen, oxygen, and sulfur, while only PSTFSILi exhibited 8.2% F. Lithium ions were too small to be detected by the instrument.
Scanning Electron Microscopy: The morphology of the PS-bound lithium salt nanoparticles was analyzed using scanning electron microscopy (SEM) (Leica, Cambridge, UK) with an accelerating voltage value equal to 15 kV. The samples were coated with a thin gold layer using a sputter coater (Polaron, model SC502, Williston, VT, USA) [13]. TFSI and PhSI modified nanoparticles displayed similar particle sizes at around 500 nm, whereas the DTTO modified nanoparticles measured at around 350 nm (Figure 7). In either case, the particle size was much larger that the starting PS nanoparticles (50 nm). This indicates that PS particles agglomerated during the incorporation of functional groups [24].

3.3. SPE Formulations

The various weight ratios of the PEO-based SPE films along with the PSLSs are listed in Table 2, Table 3 and Table 4. A SPE film containing PEO:PEGDM:LiTFSI (PPL) at the weight ratio of 3:4:2 max limit was prepared and served as the standard SPE sample. The SPE films maintained good ductility and mechanical strength and did not snap upon manual bending or stretching. The PPL complex at the weight ratio of 3:4:3 presented challenges to making a nice film, but all PSLS-based SPEs displayed excellent film quality.

3.4. Thermogravimetric Analysis (TGA)

The thermal stability of the PSLS nanoparticles was determined by thermogravimetric analysis (TGA). This analysis was carried out with a TGA/SDTA851e thermal analyzer (Mettler Toledo). A sample (5–7 mg) was placed in an aluminum pan, and then heated from 25 °C to 100 °C for 10 min and cooled rapidly to 25 °C for another 10 min. The samples were then heated from 25 °C to 500 °C at the rate of 10 °C/min [12]. All measurements were done under air flow through the system.
The TGA curves of the PSLS nanoparticles displayed two mass loss steps (Figure 8). The initial mass loss below 400 °C was due to the gradual evaporation of absorbed moisture. The second mass loss in the range of 450 to 480 °C was a result of the decomposition of the polystyrene matrix. Our results show that the thermal stability of in the order PSTFPhLi > PSDTTOLi > PSTFSILi. PSTFSILi displayed more moisture sensitivity (11% weight loss before 400 °C) due to its structural similarity with LiTFSI, which was found to be hygroscopic (Table 5). In contrast, PSTFPhLi and PSDTTOLi were less hygroscopic and did not exhibit significant mass loss below 400 °C. Polystyrene backbone degradation occurred very rapidly in the temperature range of 450–500 °C. The TGA of PEO-based electrolytes is well documented in the literature and they begin to decompose around 250 °C. TGA is not recommended for PEGDM plasticized SPEs as PEGDM begins to escape (evaporate) from the sample at around 150 °C. This is why we conducted a TGA of the salt nanoparticles to make sure that they did not decompose prior to PEO.

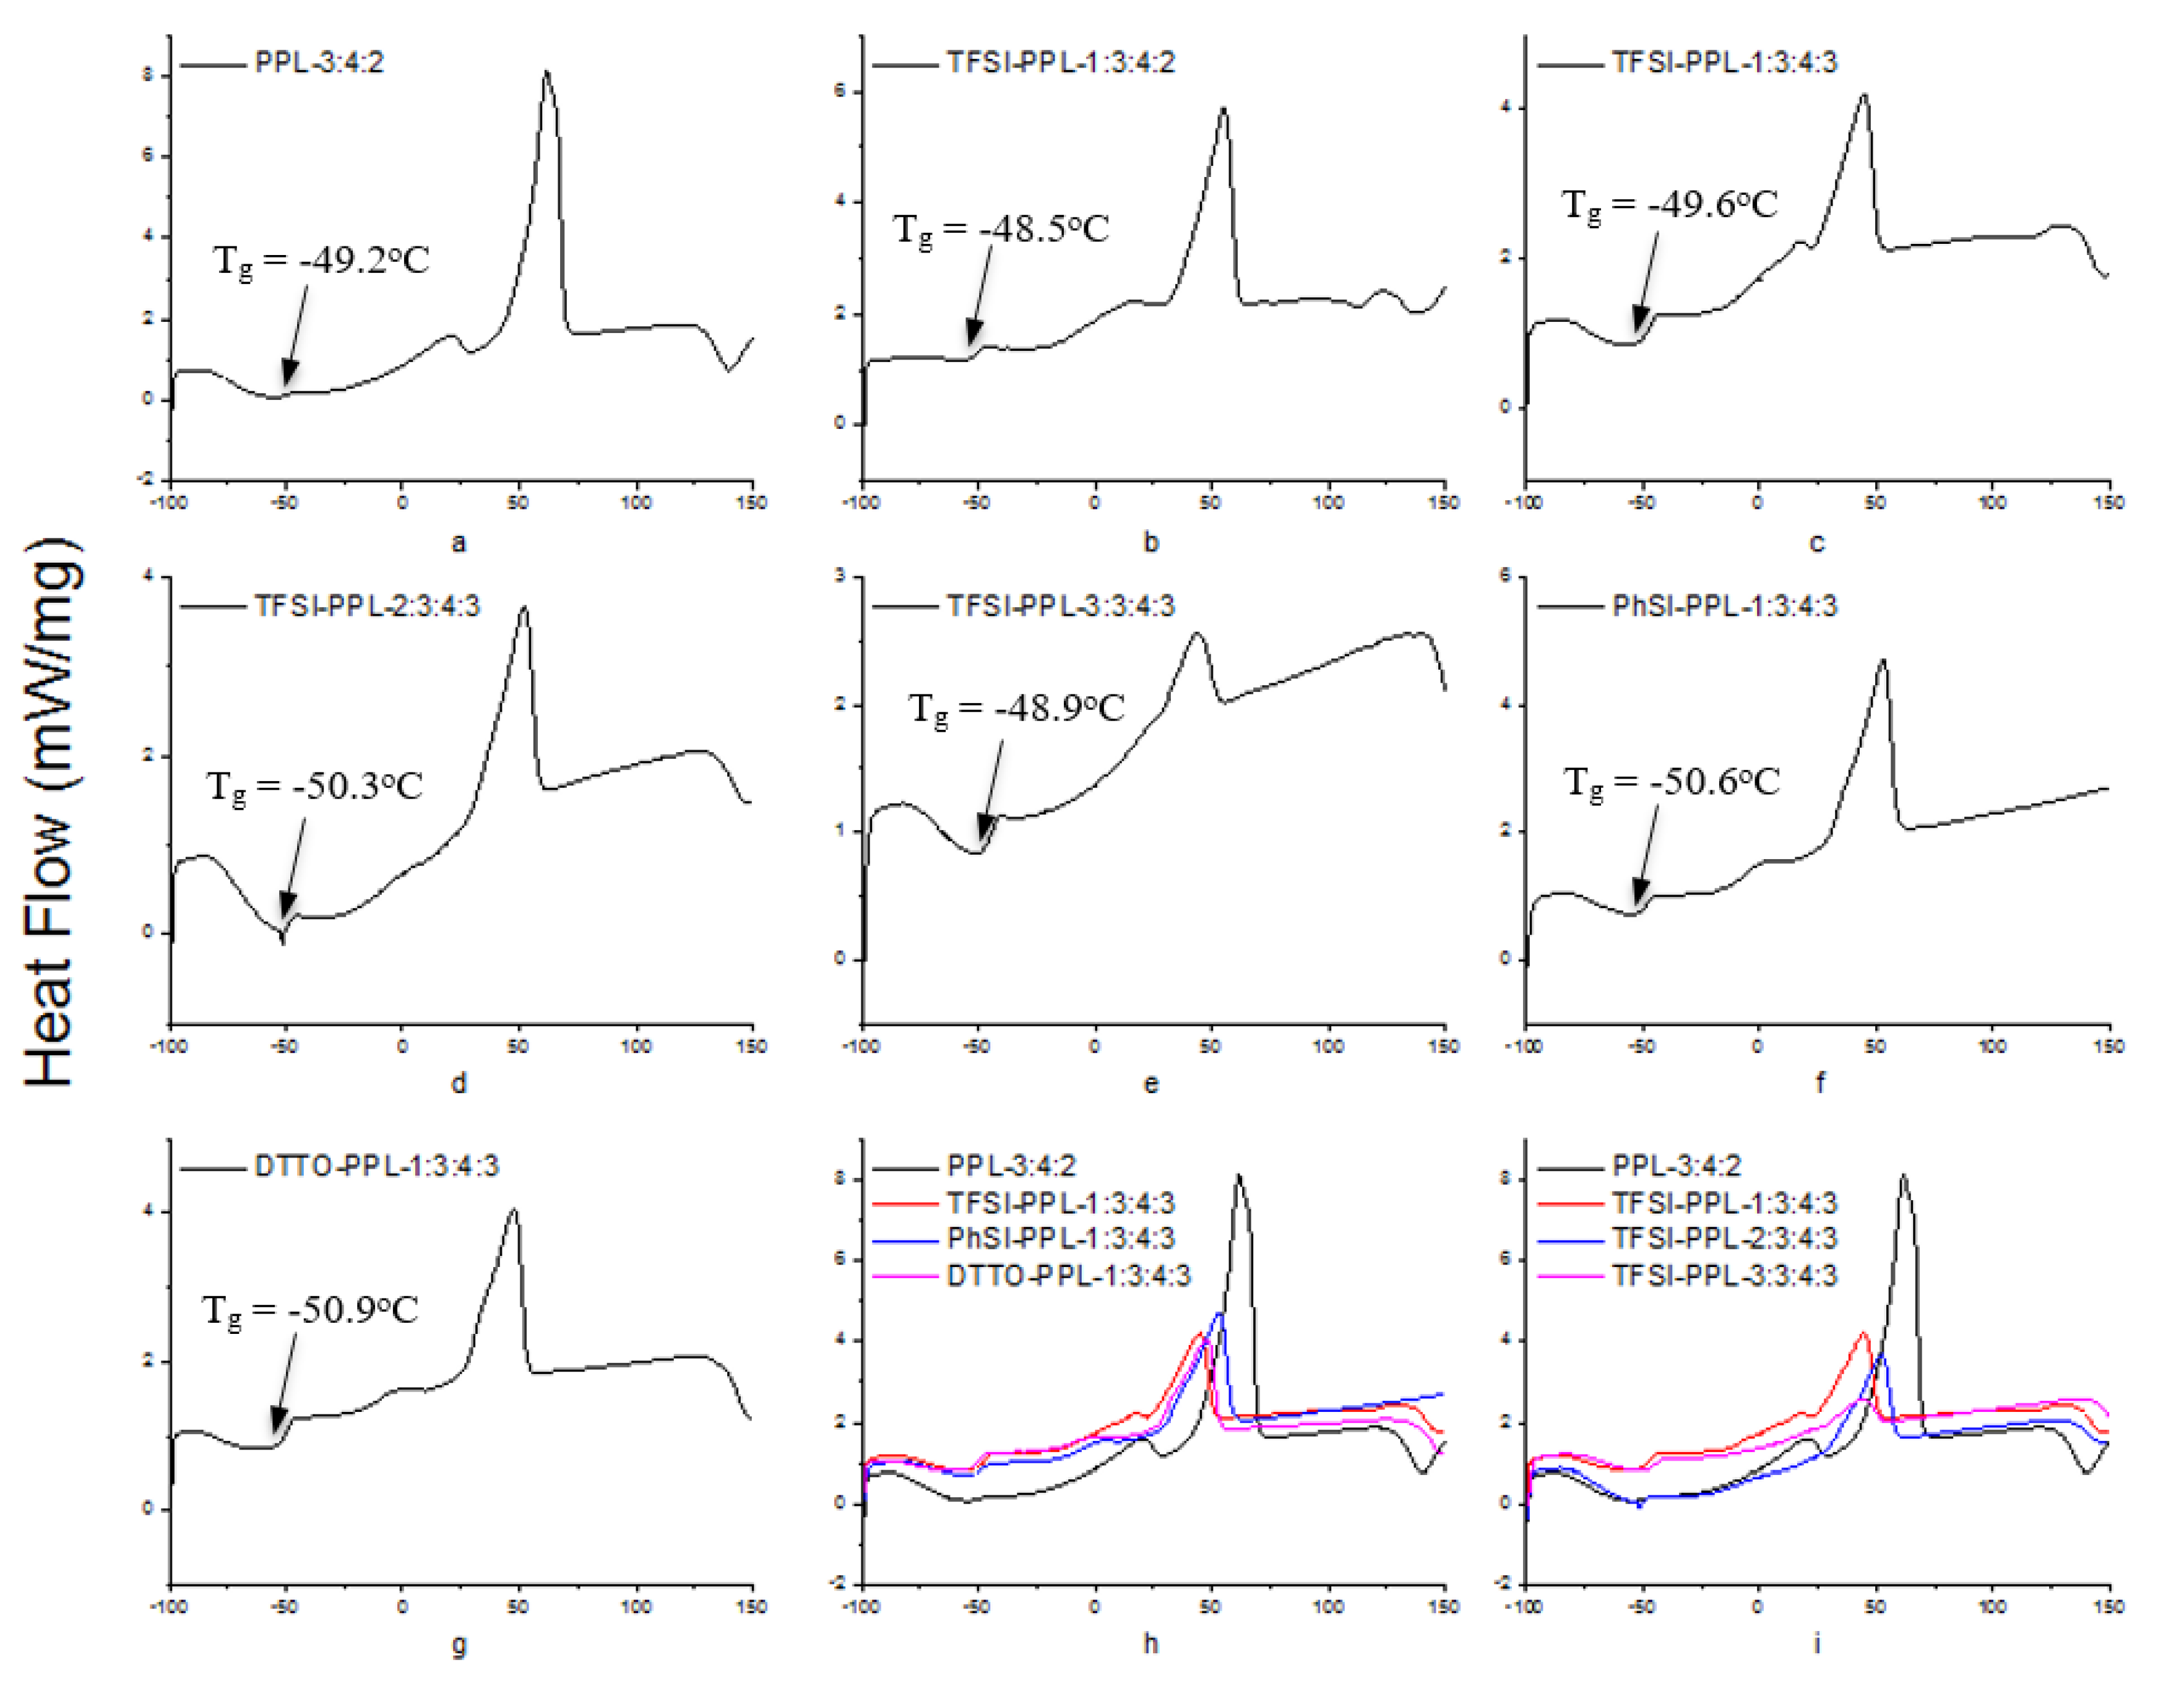
3.5. Differential Scanning Calorimetry

Differential scanning calorimetry (DSC) is one of the most convenient approaches to shed light on the degree of crystallinity along with the thermal behavior of polymeric samples, and was used to characterize our electrolyte samples [26]. The Tg of a polymer indicates the transition from a rubbery to a glassy state and vice versa. Therefore, the polymer is flexible above the Tg, and hard and brittle below the Tg [13]. This is an endothermic transition while the crystalline melting point (Tm) is an exothermic transition. In our study, DSC analysis was carried out with a Mettler Toledo differential scanning calorimeter instrument under an argon atmosphere with a flow rate at 70.0 mL min−1 [4] between −100 °C and 150 °C [27]. Samples of around 5–7 mg were sealed in a 40 µL aluminum pan with a perforated lid to allow the release and removal of the decomposition products [28]. Two stages of DSC scanning were set: (1) −100 °C isothermal for 10.0 min, and (2) heating rate of 10 °C min−1 and temperature range from −100 to 150 °C. An empty aluminum pan served as the reference. The DSC results are presented in Figure 9 and the essential glass transition and melting points for various electrolyte samples are listed in Table 6.
The Tg of all electrolytes was found to be concentrated around −50 °C. In contrast, Tm showed some separations. We presume that this was due to the addition of PSLSs, which caused a change in the shape of the endothermic peak, and the peaks were slightly shifted toward lower temperatures compared to the control (Figure 9h,i). These observations clearly suggest that a significant contribution to conductivity enhancement comes from structural modifications associated with the polymer host caused by the salts. The reorganization of the polymer chain may be hindered by the crosslinking centers formed by the interaction of the functional groups.

3.6. Ionic Conductivity

The ionic conductivities of the formulated electrolytes were measured by the complex impedance method using an impedance analyzer (Solartron model SI-1287) coupled to a Solartron model-1260 frequency response analyzer [29]. The solid electrolyte membranes were sandwiched between two stainless steel electrodes for conductivity measurements [10,30]. All measurements were performed in an environmental chamber in the temperature range of 25–70 °C [31].
To compare the performance of our electrolytes, we compared the data with that of similar work published in the literature. For example, Armand et al. reported a single-ion BAB triblock copolymer, P(STFSILi)–PEO–P(STFSILi) that displayed very good ionic conductivity of 1.3 × 10−05 S cm−1 [32]. In another study, Feng et al. developed a similar single lithium-ion conducting polymer electrolyte based on the poly[(4-styrenesulfonyl)(trifluoromethane sulfonyl)imide] anion. However, the ionic conductivities could only reach 7.6 × 10−06 S cm−1 at 25 °C and 10−04 S cm−1 at 60 °C [23]. In this study, the ionic conductivity of TFSI–PPL (Figure 9) at the weight ratio of 1:3:4:3 displayed 3.0 × 10−03 S cm−1 at 70 °C, which is superior to that of the PhSI-PPL at 1.27 × 10−03 S cm−1. The best ionic conductivity of 3.23 × 10−03 S cm−1 at 70 °C was achieved with DTTO–PPL at the weight ratio of 1:3:4:3.
Among the three PSLSs, the compounds containing PSTFSI and PSPhSI showed structural similarity as both contained a nitrogen anionic site. The higher ionic conductivity of the TFSI–PPL electrolyte was due to the presence of the CF3 group, which induced a strong electron-withdrawing effect when compared to an aromatic ring. In contrast, the existence of three strong electron withdrawing sulfone (SO2) groups provided the PSDTTO anion with the best dissociating ability to enable faster lithium ion transport. As the temperatures were elevated, the movement of the polymer chain segments rapidly increased, and all of the salts followed the well-established trend of increasing conductivity with the increase in temperatures (Figure 10, Figure 11, Figure 12 and Figure 13). Nevertheless, with the increasing weight ratio of PSLSs, the conductivity decreased. This trend can likely be attributed to the high salt concentration with the additional influence of the ion pairs, ion triplets, and the higher ion aggregations, which reduced the overall mobility and the number of effective charge carriers [1]. It is important to note that our assessment was based on the formulation that provided the highest ionic conductivity. PPL displayed its highest ionic conductivity with the formulation described in Table 2 (i.e., PEO:PEGDM:LiTFSI::3:4:2). The TFSI–PPL and DTTO–PPL based electrolytes displayed the best ionic conductivity with this formulation (1:3:4:3, see Table 2 and Table 4).

3.7. Cyclic Voltammetry

Electrolytes in lithium-ion batteries need to retain sufficiently wide reversible electrochemical stability against Li/Li+. The electrochemical stability of the SPE membranes was determined by cyclic voltammetry (CV) using a Solartron potentiostat/galvanostat impedance/gain-phase analyzer (SI 1260) coupled with a Solartron electrochemical interface (SI 1287). A testing cell was assembled to determine the oxidation potential of stainless steel as the working electrode and lithium foil serving as the counter and reference electrode. All scans were conducted at 25 °C at a scan rate of 10 mV s−1 with the voltage range of 0 V to 5.0 V versus Li/Li+ [33].
For practical applications, an electrolyte system should exhibit excellent electrochemical stability in excess of 4.5 V since secondary lithium-ion batteries typically operate in the voltage range of 2.8–4.35 V [34]. The characteristic CV properties for each of the three best electrolyte membranes are depicted in Figure 14. According to the CV curves, both PhSI–PPL and DTTO–PPL films at the weight ratio of 1:3:4:3 displayed electrochemical stability up to 4.2 V. The PhSI–PPL membrane showed an anodic peak at 1.26 V, while the DTTO–PPL membrane exhibited another anodic peak at 1.31 V [35]. The TFSI–PPL electrolyte at the weight ratio of 1:3:4:3 displayed the best electrochemical stability as no significant electrochemical activity appeared below 4.8 V versus Li/Li+.
The rationale for designing PSTFSILi is the striking similarity with LiTFSI (as illustrated in Figure 15) with regard to the negative charge on the nitrogen atom being delocalized by two sulfone groups and one trifluoromethane group. This creates less interionic attractions between the cation and anion, commonly described as a low lattice energy salt [36]. Therefore, this TFSI–PPL solid polymer electrolyte also shows potential use with high-voltage cathode materials, which cannot be safely tested with liquid electrolytes due to their lower electrochemical stability.

4. Conclusions

In this paper, the synthesis of three new PS-bound lithium salt-based SPEs was discussed for applications in lithium-ion batteries. The polymer salts were made from relatively cheap starting materials. The resulting PSLSs-based SPEs showed very good ionic conductivity at ambient temperature with excellent thermal stability. The highest ionic conductivity was able to reach 1.54 × 10−04 S cm−1 at room temperature and 3.23 × 10−03 S cm−1 at 70 °C for the DTTO–PPL membrane at the weight ratio of 1:3:4:3. These PSLS-based electrolytes also displayed very good electrochemical stability, which ensures their potential for further use in high-voltage lithium-ion cells.

Author Contributions

X.M. (Conceptualization, Methodology, Investigation, Writing original draft); W.Z. (Data curation, Investigation); Q.M. (Writing, Data curation, Visualization); Z.Y. (Writing, review & editing, Software, Methodology, Data curation); H.D. (Software, Methodology, Data curation); Q.H. (Software, Methodology, Data curation); A.C. (Data curation, Visualization, Investigation); C.M. (Data curation, Writing, review & editing); B.K.M. (Conceptualization, Methodology, Supervision, Writing, review & editing). All authors have read and agreed to the published version of the manuscript.

Funding

This research received no external funding.

Conflicts of Interest

The authors declare no conflict of interest.

References

  1. Polu, A.R.; Rhee, H.-W. Nanocomposite solid polymer electrolytes based on poly(ethylene oxide)/POSS-PEG (n = 13.3) hybrid nanoparticles for lithium ion batteries. J. Ind. Eng. Chem. 2015, 31, 323–329. [Google Scholar] [CrossRef]
  2. Wang, Z.; Fu, Y.; Zhang, Z.; Yuan, S.; Amine, K.; Battaglia, V.; Liu, G. Application of Stabilized Lithium Metal Powder (SLMP®) in graphite anode—A high efficient prelithiation method for lithium-ion batteries. J. Power Sources 2014, 260, 57–61. [Google Scholar] [CrossRef] [Green Version]
  3. Zhou, J. Ionic conductivity of composite electrolytes based on oligo(ethylene oxide) and fumed oxides. Solid State Ion. 2004, 166, 275–293. [Google Scholar] [CrossRef]
  4. Cheng, Q.; Cui, Z.; Li, J.; Qin, S.; Yan, F.; Li, J. Preparation and performance of polymer electrolyte based on poly(vinylidene fluoride)/polysulfone blend membrane via thermally induced phase separation process for lithium ion battery. J. Power Sources 2014, 266, 401–413. [Google Scholar] [CrossRef]
  5. Wright, P.V. Electrical conductivity in ionic complexes of poly(ethylene oxide). Br. Polym. J. 1975, 7, 319–327. [Google Scholar] [CrossRef]
  6. Fenton, D.E.; Parker, J.M.; Wright, P.V. Complexes of alkali metal ions with poly(ethylene oxide). Polymer 1973, 14, 589. [Google Scholar] [CrossRef]
  7. Wang, X.; Gong, C.; He, D.; Xue, Z.; Chen, C.; Liao, Y.; Xie, X. Gelled microporous polymer electrolyte with low liquid leakage for lithium-ion batteries. J. Membr. Sci. 2014, 454, 298–304. [Google Scholar] [CrossRef]
  8. Marzantowicz, M.; Dygas, J.R.; Krok, F.; Łasińska, A.; Florjańczyk, Z.; Zygadło-Monikowska, E.; Affek, A. Crystallization and melting of PEO:LiTFSI polymer electrolytes investigated simultaneously by impedance spectroscopy and polarizing microscopy. Electrochim. Acta 2005, 50, 3969–3977. [Google Scholar] [CrossRef]
  9. Marzantowicz, M.; Dygas, J.R.; Krok, F.; Tomaszewska, A.; Florjańczyk, Z.; Zygadło-Monikowska, E.; Lapienis, G. Star-branched poly(ethylene oxide) LiN(CF3SO2)2: A promising polymer electrolyte. J. Power Sources 2009, 194, 51–57. [Google Scholar] [CrossRef]
  10. Zhang, H.; Liu, C.; Zheng, L.; Xu, F.; Feng, W.; Li, H.; Huang, X.; Armand, M.; Nie, J.; Zhou, Z. Lithium bis(fluorosulfonyl)imide/poly(ethylene oxide) polymer electrolyte. Electrochim. Acta 2014, 133, 529–538. [Google Scholar] [CrossRef]
  11. Aricò, A.S.; Bruce, P.; Scrosati, B.; Tarascon, J.-M.; van Schalkwijk, W. Nanostructured materials for advanced energy conversion and storage devices. Nat. Mater. 2005, 4, 366–377. [Google Scholar] [CrossRef] [PubMed]
  12. Wang, Q.; Fan, H.; Fan, L.-Z.; Shi, Q. Preparation and performance of a non-ionic plastic crystal electrolyte with the addition of polymer for lithium ion batteries. Electrochim. Acta 2013, 114, 720–725. [Google Scholar] [CrossRef]
  13. Tillmann, S.D.; Isken, P.; Lex-Balducci, A. Gel polymer electrolyte for lithium-ion batteries comprising cyclic carbonate moieties. J. Power Sources 2014, 271, 239–244. [Google Scholar] [CrossRef]
  14. Xing, Y.; Wu, Y.; Wang, H.; Yang, G.; Li, W.; Xu, L.; Jiang, X. Preparation of hybrid polymer based on polyurethane lithium salt and polyvinylidene fluoride as electrolyte for lithium-ion batteries. Electrochim. Acta 2014, 136, 513–520. [Google Scholar] [CrossRef]
  15. MacFarlane, D.R.; Tachikawa, N.; Forsyth, M.; Pringle, J.M.; Howlett, P.C.; Elliott, G.D.; Davis, J.H.; Watanabe, M.; Simon, P.; Angell, C.A. Energy applications of ionic liquids. Energy Environ. Sci. 2014, 7, 232–250. [Google Scholar] [CrossRef] [Green Version]
  16. Lu, Y.; Moganty, S.S.; Schaefer, J.L.; Archer, L.A. Ionic liquid-nanoparticle hybrid electrolytes. J. Mater. Chem. 2012, 22, 4066. [Google Scholar] [CrossRef]
  17. Caimi, S.; Klaue, A.; Wu, H.; Morbidelli, M. Effect of SiO2 Nanoparticles on the Performance of PVdF-HFP/Ionic Liquid Separator for Lithium-Ion Batteries. Nanomaterials 2018, 8, 926. [Google Scholar] [CrossRef] [Green Version]
  18. Wang, W.; Alexandridis, P. Composite polymer electrolytes: Nanoparticles affect structure and properties. Polymers (Basel) 2016, 8, 387. [Google Scholar] [CrossRef] [Green Version]
  19. Liu, W.; Liu, N.; Sun, J.; Hsu, P.-C.; Li, Y.; Lee, H.-W.; Cui, Y. Ionic conductivity enhancement of polymer electrolytes with ceramic nanowire fillers. Nano Lett. 2015, 15, 2740–2745. [Google Scholar] [CrossRef]
  20. Mandal, B.K.; Sooksimuang, T.; Griffin, B.; Padhi, A.; Filler, R. New lithium salts for rechargeable battery electrolytes. Solid State Ion. 2004, 175, 267–272. [Google Scholar] [CrossRef]
  21. Kim, M.S.; Kim, S.K.; Lee, J.Y.; Cho, S.H.; Lee, K.-H.; Kim, J.; Lee, S.-S. Synthesis of polystyrene nanoparticles with monodisperse size distribution and positive surface charge using metal stearates. Macromol. Res. 2008, 16, 178–181. [Google Scholar] [CrossRef]
  22. Brijmohan, S.B.; Swier, S.; Weiss, R.A.; Shaw, M.T. Synthesis and characterization of cross-linked sulfonated polystyrene nanoparticles. Ind. Eng. Chem. Res. 2005, 44, 8039–8045. [Google Scholar] [CrossRef]
  23. Feng, S.; Shi, D.; Liu, F.; Zheng, L.; Nie, J.; Feng, W.; Huang, X.; Armand, M.; Zhou, Z. Single lithium-ion conducting polymer electrolytes based on poly[(4-styrenesulfonyl)(trifluoromethanesulfonyl)imide] anions. Electrochim. Acta 2013, 93, 254–263. [Google Scholar] [CrossRef]
  24. Ulaganathan, M.; Nithya, R.; Rajendr, S. Surface analysis studies on polymer electrolyte membranes using scanning electron microscope and atomic force microscope. In Scanning Electron Microscopy; Kazmiruk, V., Ed.; InTech: London, UK, 2012; ISBN 978-953-51-0092-8. [Google Scholar]
  25. Paillard, E.; Iojoiu, C.; Alloin, F.; Guindet, J.; Sanchez, J.-Y. Poly(oxyethylene) electrolytes based on lithium pentafluorobenzene sulfonate. Electrochim. Acta 2007, 52, 3758–3765. [Google Scholar] [CrossRef]
  26. Joge, P.; Kanchan, D.K.; Sharma, P.; Jayswal, M.; Avasthi, D.K. Effect of swift heavy O7+ ion radiations on conductivity of lithium based polymer blend electrolyte. Radiat. Phys. Chem. 2014, 100, 74–79. [Google Scholar] [CrossRef]
  27. Costa, C.M.; Gomez Ribelles, J.L.; Lanceros-Méndez, S.; Appetecchi, G.B.; Scrosati, B. Poly(vinylidene fluoride)-based, co-polymer separator electrolyte membranes for lithium-ion battery systems. J. Power Sources 2014, 245, 779–786. [Google Scholar] [CrossRef]
  28. Chen, R.; Zhu, L.; Wu, F.; Li, L.; Zhang, R.; Chen, S. Investigation of a novel ternary electrolyte based on dimethyl sulfite and lithium difluoromono(oxalato)borate for lithium ion batteries. J. Power Sources 2014, 245, 730–738. [Google Scholar] [CrossRef]
  29. Sun, X.-G.; Reeder, C.L.; Kerr, J.B. Synthesis and characterization of network type single ion conductors. Macromolecules 2004, 37, 2219–2227. [Google Scholar] [CrossRef]
  30. Xiao, S.Y.; Yang, Y.Q.; Li, M.X.; Wang, F.X.; Chang, Z.; Wu, Y.P.; Liu, X. A composite membrane based on a biocompatible cellulose as a host of gel polymer electrolyte for lithium ion batteries. J. Power Sources 2014, 270, 53–58. [Google Scholar] [CrossRef]
  31. Yoshizawa, M.; Ohno, H. Synthesis of molten salt-type polymer brush and effect of brush structure on the ionic conductivity. Electrochim. Acta 2001, 46, 1723–1728. [Google Scholar] [CrossRef]
  32. Bouchet, R.; Maria, S.; Meziane, R.; Aboulaich, A.; Lienafa, L.; Bonnet, J.-P.; Phan, T.N.T.; Bertin, D.; Gigmes, D.; Devaux, D.; et al. Single-ion BAB triblock copolymers as highly efficient electrolytes for lithium-metal batteries. Nat. Mater. 2013, 12, 452–457. [Google Scholar] [CrossRef] [PubMed]
  33. Zhu, Y.; Casselman, M.D.; Li, Y.; Wei, A.; Abraham, D.P. Perfluoroalkyl-substituted ethylene carbonates: Novel electrolyte additives for high-voltage lithium-ion batteries. J. Power Sources 2014, 246, 184–191. [Google Scholar] [CrossRef]
  34. Chakrabarti, A.; Filler, R.; Mandal, B.K. Synthesis and properties of a new class of fluorine-containing dilithium salts for lithium-ion batteries. Solid State Ion. 2010, 180, 1640–1645. [Google Scholar] [CrossRef]
  35. Olgun, U.; Gülfen, M. Synthesis of fluorescence poly(phenylenethiazolo[5,4-d]thiazole) copolymer dye: Spectroscopy, cyclic voltammetry and thermal analysis. Dye. Pigment. 2014, 102, 189–195. [Google Scholar] [CrossRef]
  36. Sharma, P.K.; Gupta, G.; Singh, V.V.; Tripathi, B.K.; Pandey, P.; Boopathi, M.; Singh, B.; Vijayaraghavan, R. Synthesis and characterization of polypyrrole by cyclic voltammetry at different scan rate and its use in electrochemical reduction of the simulant of nerve agents. Synth. Met. 2010, 160, 2631–2637. [Google Scholar] [CrossRef]
Figure 1. Synthesis of PSTFSILi.
Chemengineering 04 00044 g001
Figure 2. Synthesis of PSPhSILi.
Chemengineering 04 00044 g002
Figure 3. Synthesis of PSDTTOLi.
Chemengineering 04 00044 g003
Figure 4. Energy dispersive X-ray spectroscopy (EDS) of the PSTFSILi nanoparticles.
Chemengineering 04 00044 g004
Figure 5. Energy dispersive X-ray spectroscopy (EDS) of the PSPhSILi nanoparticles.
Chemengineering 04 00044 g005
Figure 6. Energy dispersive X-ray spectroscopy (EDS) of the PSDTTOLi nanoparticles.
Chemengineering 04 00044 g006
Figure 7. (a) Scanning electron microscopy (SEM) of the PS nanoparticles, where the diameter of the particles was around 50 nm; (b) SEM of the PSTFSILi nanoparticles, where the diameter of the particles was around 500 nm; (c) SEM of the PSPhSILi nanoparticles, where the diameter of the particles was around 500 nm; (d) SEM of the PSDTTOLi nanoparticles, where the diameter of the particles was around 350 nm [21,25].
Chemengineering 04 00044 g007
Figure 8. Thermogravimetric analysis (TGA) curves under air flow for PSTFSILi, PSPhSILi, and PSDTTOLi.
Chemengineering 04 00044 g008
Figure 9. Heat flow versus temperature of the differential scanning calorimetry DSC curves: (a) weight ratio of PEO:PEGDM:LiTFSI (PPL) = 3:4:2, (b) weight ratio of PSTFSILi:PEO:PEGDM:LiTFSI (TFSI–PPL) = 1:3:4:2, (c) weight ratio of TFSI–PPL = 1:3:4:3, (d) weight ratio of TFSI–PPL = 2:3:4:3, (e) weight ratio of TFSI–PPL = 3:3:4:3, (f) weight ratio of PSPhSILi:PEO:PEGDM:LiTFSI (PhSI–PPL) = 1:3:4:3, (g) weight ratio of PSDTTOLi:PEO:PEGDM:LiTFSI (DTTO–PPL) = 1:3:4:3, (h) four best performing membranes, (i) various weight ratios of PSTFSILi.
Chemengineering 04 00044 g009
Figure 10. Ionic conductivity versus temperature for the four best performing electrolytes.
Chemengineering 04 00044 g010
Figure 11. Ionic conductivity versus temperature of various weight ratios of PSTFSILi–PEO–PEGDM–LiTFSI (TFSI–PPL) electrolytes.
Chemengineering 04 00044 g011
Figure 12. Ionic conductivity versus temperature of various weight ratios of PSPhSILi–PEO–PEGDM–LiTFSI (PhSI–PPL) electrolytes.
Chemengineering 04 00044 g012
Figure 13. Ionic conductivity versus temperature of various weight ratios of PSPhSILi–PEO–PEGDM–LiTFSI (DTTO–PPL) electrolytes.
Chemengineering 04 00044 g013
Figure 14. Cyclic voltammetry (CV) curves of the selected electrolyte membranes: (a) TFSI–PPL = 1:3:4:3; (b) PhSI–PPL = 1:3:4:3; (c) DTTO–PPL = 1:3:4:3.
Chemengineering 04 00044 g014
Figure 15. Structural comparisons of PSTFSILi with LiTFSI.
Chemengineering 04 00044 g015
Table 1. Elemental concentrations determined using the energy dispersive X-ray spectroscopy (EDS).
SampleAt. % CAt % NAt. % OAt. % SAt. % F
PSTFSILi48.913.526.43.18.2
PSPhSILi58.45.726.29.7-
PSDTTOLi40.4-26.926.9-
Table 2. Formulations of the SPE films with various weight ratios of PSTFSILi and LiTFSI.
Components Weight [mg]Abbreviation of the Formulation
PSTFSILiPEOPEGDMLiTFSI
07510050PPL = 3:4:2
257510025TFSI–PPL = 1:3:4:1
257510050TFSI–PPL = 1:3:4:2
257510075TFSI–PPL = 1:3:4:3
2537.55012.5TFSI–PPL = 2:3:4:1
2537.55025TFSI–PPL = 2:3:4:2
2537.55037.5TFSI–PPL = 2:3:4:3
252537.58.3TFSI–PPL = 3:3:4:1
252537.516.7TFSI–PPL = 3:3:4:2
252537.525TFSI–PPL = 3:3:4:3
Table 3. Formulations of the SPE films with various weight ratios of PSPhSILi and LiTFSI.
Components Weight [mg]Abbreviation of the Formulation
PSTFSILiPEOPEGDMLiTFSI
257510025PhSI–PPL = 1:3:4:1
257510050PhSI–PPL = 1:3:4:2
257510075PhSI–PPL = 1:3:4:3
2537.55012.5PhSI–PPL = 2:3:4:1
2537.55025PhSI–PPL = 2:3:4:2
2537.55037.5PhSI–PPL = 2:3:4:3
252537.58.3PhSI–PPL = 3:3:4:1
252537.516.7PhSI–PPL = 3:3:4:2
252537.525PhSI–PPL = 3:3:4:3
Table 4. Formulations of the SPE films with various weight ratios of PSDTTOLi and LiTFSI.
Components Weight [mg]Abbreviation of the Formulation
PSTFSILiPEOPEGDMLiTFSI
257510025DTTO–PPL = 1:3:4:1
257510050DTTO–PPL = 1:3:4:2
257510075DTTO–PPL = 1:3:4:3
2537.55012.5DTTO–PPL = 2:3:4:1
2537.55025DTTO–PPL = 2:3:4:2
2537.55037.5DTTO–PPL = 2:3:4:3
252537.58.3DTTO–PPL = 3:3:4:1
252537.516.7DTTO–PPL = 3:3:4:2
252537.525DTTO–PPL = 3:3:4:3
Table 5. Thermal degradation of the PSLSs at different temperatures.
SampleDecomposition Temperature, Td [°C]Percentage Weight Loss [%] at Various Temperature
200 °C300 °C400 °C500 °C
PSTFSILi3764.56.611.129.9
PSPhSILi4500.72.12.722.5
PSDTTOLi4490.51.54.823.6
Table 6. Thermal properties of the PSLS-based electrolytes membranes.
Sampleabcdefg
Tg [°C]−49.2−48.5−49.6−50.3−48.9−50.6−50.9
Tm [°C]61.755.244.852.243.752.847.7

