Review

Mechanical Behavior of Toughened Epoxy Structural Adhesives for Impact Applications

Department of Polymer Engineering, The University of Akron, Akron, OH 44325–0301, USA
*
Author to whom correspondence should be addressed.
ChemEngineering 2020, 4(2), 38; https://doi.org/10.3390/chemengineering4020038
Submission received: 20 March 2020 / Revised: 19 May 2020 / Accepted: 1 June 2020 / Published: 8 June 2020

Abstract

:
The focus of our study is to identify physical properties of different impact-resistant/toughened structural adhesives and identify/develop an elastic-viscoelastic-plastic model as a function of loading rate by using Ludwik-type equations to be able to predict adhesive behavior at higher loading rates and to make cars more crashworthy. For this purpose, we first characterized eight different commercial toughened epoxy structural adhesives to provide detailed information about their constituents using X-ray diffraction (XRD), differential thermal analysis (DTA), thermogravimetric analysis (TGA), scanning electron microscope (SEM) and energy dispersive x-ray spectrometer (EDS). Most (but not all) of the model adhesives contained organic tougheners in the form of carboxyl terminated butadiene acrylonitrile (CTBN) copolymer, as well as polyurethane adducts. The main crystalline inorganic phases were found as calcite (CaCO3), wollastonite (CaSiO3) or calcium silicate (CaSiO3), talc (Mg3Si4O10 (OH)2), zeolite which is an alumina silicate based mineral and has many different elements in its composition (M2/nO·Al2O3·xSiO2·yH2O, M can be Mg, Na, Ca, K, Li). The total amount of inorganic fillers was found to be different in each adhesive. Material behavior of the model adhesives were determined via tensile tests and Single Lap Joint (SLJ) tests in shear. Split Hopkinson pressure bar (SHPB) was also used to measure the strain and stress values at higher strain rates in the order of 102 s−1, which is generally encountered in impact related loading situations. Toughness values in the range ~0.5 to ~1.35 MJ/m3 were observed with the model adhesives tested in tensile mode within the ~3 × 10⁻³ to 0.18 m/m/s strain rate range. The softening behavior of the elastic moduli at higher strain rates observed during tensile testing was also observed with SHPB testing. It is remarkable that, overall, the modulus magnitudes seem to be similar between the tensile test and SHPB specimens within this softening range of the initial bilinear elastic behavior observed. When the results from bulk (tensile) and bonded (shear) specimens were compared, it was clearly seen that the toughness responses of the adhesives to (tensile/shear) strain rates in the bulk and bonded forms, respectively, were different, with the bonded shear toughness values in the ~25 to ~120 MJ/m3 range within ~1.25 to ~25 mm/mm/s shear strain range. The model adhesive which included just inorganic fillers had the lowest tensile toughness at the lowest tensile strain rate, but the highest slope in its tensile toughness regression line, exhibited the second highest bonded shear toughness. When tested at the extension rates of 25 mm/min and 100 mm/min in bonded lap shear, the same adhesive exhibited limited interfacial failure areas, however the dominant failure mode was cohesive failure. When the extension rate increased further, transition to interfacial (adhesive) failure was observed revealing that interfacial failures do not necessarily diminish adhesive bond toughness. Our observations point to the fact that cohesive deformation/failure processes indicating interfacial separations, inter-particle interactions as well as polymer matrix deformation in high deformation loading scenario as in bonded shear loadings may provide the highest toughness. Apparently, a large inorganic filler weight fraction is not necessary to obtain high shear toughness in bonded form since the highest bonded shear toughness was obtained with the adhesive which had the least amount of inorganic fillers among the model adhesives with 14.72 wt %.

1. Introduction

Structural adhesives have been widely used in many industrial sectors such as aerospace, marine, aeronautics and automotive industry due to their energy absorption capability, high fatigue strength, flexibility, toughness and lightness of weight.
The importance of weight reduction in vehicles is increasing day-by-day in automobile industry due to the requirement of lower CO2 emission and fuel consumption requirements. Much research is being done to reach US corporate average fuel efficiency (CAFE) requirements which target to increase mileage to 54.5 miles per gallon by the year 2025 for passenger cars and light trucks [1]. Structural adhesives serve these targets by enabling the bonding to not only similar, but also dissimilar substrates including aluminum, advanced high strength steels, magnesium, carbon fiber, plastics, wood and composites. Thus, lighter weight structures can be constructed while reducing the need for fasteners such as welds, rivets and bolts use of which present many limitations. Attaching different parts is more difficult and cost more with spot welds and rivets. For example; compared to steel, triple the force and twice the cost are needed for welding aluminum [2]. An important disadvantage of using bolted or riveted connections is creation of high stress concentration around connection holes which leads to weaker structures. To solve this problem many researchers worked on using hybrid joining techniques such as weld-bonding which is a combination of welding and adhesive bonding [3,4,5].
Weight reduction is not the only important contribution of structural adhesives. Impact resistance is another significant contribution, helping safety issues for the drivers and passengers. According to the records, 417,928 people were killed worldwide in car accidents in 2016 and 40,000 having occurred in USA [6,7]. By using load bearing structural adhesives, high-strength and tough structures can be incorporated into automotive bodies to create impact resistant automobiles with improved crashworthiness to lower the number of deaths in traffic accidents. For this purpose, there are mainly two different classes of structural adhesives that have been used in automotive industry; one part and two-part epoxies and two-part polyurethanes. Epoxy-type of structural adhesives generally are more brittle and rigid than polyurethane-type adhesives. On the other hand, polyurethane adhesives are more flexible with higher modulus, strength and elongation [8,9]. Properties of these adhesives can be modified with different fillers such as clays, rubber, graphite and carbon black to produce desired properties including enhanced mechanical properties [8,9,10]. Thus, epoxy and polyurethane based toughened adhesives are being developed by chemical companies to achieve improved impact resistance and such adhesives attract great attention by researchers due to their complexity in their mechanical behaviors. Therefore, researchers have been trying to get a better understanding of mechanical response of these toughened adhesives in order to develop predictive modeling, especially, for vehicle crashworthiness analysis and to provide safer conditions for the driver and passengers against the crash effects in automobile accidents.

2. Literature Review

2.1. Types of Structural Adhesives

Adhesives are the materials that can be found at a wide variety of strength levels depending on the necessity of their applications. One of the appealing areas that makes the use of structural adhesives in the automobile industry is making automobiles crashworthy to secure passengers’ life by using lightweight structures which also provide impact resistance. During crash scenario, there are two main factors. First, an adhesively bonded joint is expected to maintain some level of strength to keep the parts together. Second, energy absorption is also important to absorb the impact forces to protect drivers and passengers by progressive yielding and crumpling of the structure [11]. Although the overall stiffness is important to keep the parts of vehicle attached, toughness is also required to avoid body panels separation during crash [12].
Due to the increase of demand, chemical companies have been concentrating on production of new generation of structural adhesives. Structural adhesives can be classified as anaerobics, epoxies, acrylics, phenolic resins, polyurethanes and cyanoacrylates [8,10,11,12,13,14]. Different sections of automobiles need different types of structural adhesives for joining purpose based on the manufacturer requirements [12]. Epoxy-type adhesives and polyurethane based structural adhesives have become prominent in the automobile industry. For applications, which require higher stiffness, such as underbody parts, structural epoxy adhesives are preferable and for applications involving lower modulus adhesives, such as body panels, automotive windshields, bumpers, polyurethane based structural adhesives can be utilized.

2.2. Epoxy Adhesives

Epoxy-type adhesives have been widely used as structural adhesives since the 1950’s in one component or two-component forms. Two component epoxy adhesives have hardener (crosslinking agent) separated from the resin. Epoxy adhesives typically contain fillers, toughening agents, plasticizer, reactive diluent and accelerators to produce the desired properties making the epoxy based structural adhesives predominant in various industries. Unmodified epoxy adhesives are brittle and prone to crack initiation and propagation; however, after the proper modifications by means of additives, they can serve as structural adhesives with higher strength and better toughness. Epoxy resins also have the advantage of good thermal and solvent resistance, low shrinkage and the ability to fill large gaps [8,13].
The reacting components of epoxy resins contain two of the following chemicals; Bisphenol A, Bis A, bisphenol F, Bis F, novolak and epichlorohydrin. A widely used epoxy resin consists of diglycidyl ether bisphenol-A, namely DGEBA and epichlorohydrin based resin [15,16,17].
Aliphatic, amido and cycloaliphatic amines, amides and polyamides, dicyandiamine are widely used curing agents. At the end of the curing (crosslinking) reaction, the final properties of the cured epoxy resins are affected by curing agents, and thus, selection of curing agent is important in achieving the desired properties and types of applications. For example, polyamines, polyamides may be added separately into a two-component resin at room temperature, on the other hand aromatic hardeners and dicyandiamide (1-cyanogunide) can be used at elevated temperatures in a one-component resin in which latent hardeners (curing agents which activate at elevated temperatures) have been added in production [10,17].

2.3. Polyurethane Adhesives

Polyurethane based structural adhesives are commonly used in the automotive industry. Polyurethanes form by reaction of isocyanate groups with hydroxyl group of polyols with catalysts and additives. Due to the variety of isocyanates, polyols, catalysts and additives, polyurethanes can be produced according to the application requirements as from flexible to rigid plastics with different curing times. Thus, polyurethane based structural adhesives can have tailor-made utility in the lightweight designs. Polyurethane based structural adhesives can be found in one component or two components forms as in the case of epoxy based adhesives. A one component polyurethane adhesive can be cured both at room temperature with excess isocyanates reacting with urethane groups in the presence of moisture—and also at high temperatures with the pre-polymers and the curing agents activating at elevated temperatures. The latter method is generally preferred in automotive industry, especially with windshield applications. Two component polyurethane adhesives need to be mixed before usage to let the components react with each other to cure [8,9,10]. Variety of catalysts and components lead to obtain polyurethane adhesives with different properties such as curing time and service life. Overall, Polyurethane based structural adhesives provide the advantage of modifiable curing time with acceptable cost. The choice of one part or two part adhesives allow different curing temperatures according to the application needs [8,14].

2.4. Fillers, Reinforcements and Their Effects on Structural Adhesives

The performance of structural adhesives depends on many factors and can be modified by using different fillers such as organic and inorganic fillers. Many researchers gave attention to enhancing adhesive properties, such as tensile and flexural strength, toughness, impact resistance, wear resistance and rheological properties, by adding fillers to the polymer matrix [18,19,20,21]. Fillers provide the advantage of decreasing the cost by lowering the resin content and adhesive flow can be controlled with the addition of fillers. After reinforcement, the resulting properties of adhesives depend not only on the matrix properties, but also on the filler type, size, shape, amount and the compatibility between the fillers and the matrix [22,23]. The common example of fillers that have been used to improve adhesive properties are metal powders such as aluminum, glass fibers, alumina, silica, calcium carbonates, talc, clays and carbon fibers [9,10,13].
One of the most widely used fillers is calcium carbonate which is generally used for reducing cost, dimensional stability, pigmentation, modifying mechanical properties and controlling viscosity [9,10,13,24]. Calcium carbonate can be added to an adhesive matrix at various particle size and loads [9,10,25]. Calcium carbonate treated with fatty acid and has particles size less than 50 nm can be utilized to enhance tensile strength, and particles size more than 500 nm can be used to reduce product cost. Typical loading percentage is given for the ground one as 15–45% and for the treated one as 25–45% [9].
Wollastonite and aluminum oxide are used as flame retardants [13,26]. Wollastonite is also used to enhance mechanical properties. Xian et al. [26] studied both fine and coarse particles of wollastonite to modify epoxy properties and their results showed that, generally, fine wollastonite improved mechanical properties such as strength, modulus and toughness, whereas coarse particles only resulted in slight increase in modulus, but not the other mechanical properties. Talc can also be added to an adhesive to lower the price, especially to the solvent-borne polyurethane adhesives [13]. Control of flow can be achieved with talc reinforcement and more stable thixotropic properties can be obtained. General particle size for talc as a filler is between 1 to 20 μm [10]. Mica or clay are used for electrical resistance, silica and silicon carbide give abrasion resistance to adhesives [13]. Synthetic scrim cloth reinforcement has also been used with epoxy structural adhesives to induce drapability, ease of manufacture and strength [27].

2.5. Mechanical Properties and Modeling of Structural Adhesives

Strain Rate Dependency of Structural Adhesives’ Tensile, Compressive and Shear Properties

Structural adhesives play an important role in the design of lightweight structures with energy absorption capability. For the automotive industry, endurance of the vehicle’s framework provides safer conditions for the driver and passengers against any crash effects in case of automobile accidents [11]. Recently, epoxy based toughened modern adhesives that have improved impact resistance have been developed by chemical companies and attracted attention of researchers due to the complexity of their mechanical behaviors.
Most structural adhesives are polymers exhibiting viscoelastic and, thus, rate dependent material behavior [18]. Obviously, rate dependency of structural adhesives affects their impact strength. Typically, the Young’s modulus and the intrinsic yield point increase with increasing deformation rate applied during a tensile test [28].
As mentioned earlier, structural adhesives are generally modified by inorganic particles and polymers such as rubber, polyurethane and silicon particles which alter the mechanical behavior such as plasticity, visco-elasticity—plasticity, and fracture behavior such as crack initiation, crack propagation, fracture toughness and fracture energy. Response of epoxy to the modification can be investigated by comparing behaviors of unmodified and modified epoxy materials. Unmodified epoxies are relatively brittle polymers; however, their toughness and ductility can be increased with both hard and soft reinforcement particles [28,29,30,31]. Adhesives with different reinforcements are expected to exhibit different rate dependency characteristic during a crash scenario. Such distinct rate dependent behaviors can be modeled for prediction of mechanical response of structural adhesives at different rates. Predictive modeling will allow high impact limits and complete characterization such as elastic limit stress and strain, and yield (failure) stress of structural adhesives as a function of the strain rate.
There are several attempts that have been utilized in the literature to find stress/strain limits mentioned above as well as other mechanical properties of adhesive materials evaluated by tensile test, bonded joint tests, impact tests and fracture tests to determine the mechanical response of structural adhesives as a function of strain rate. Generally, there are two common ways that have been preferred to characterize adhesives, either by using bulk specimens or by using bonded joint specimens.
Sancaktar and Brinson [32] utilized bulk shear tests via symmetric real shear and bonded symmetric lap shear specimens of two different types of epoxy adhesives in their study in order to determine the bulk stress–strain curve, strain rate effect, creep, relaxation and delayed failure properties. First, they attempted to predict viscoelastic shear–stress behavior by using the results from the bulk tests which were obtained by Brinson and Renieri in a previous work [33,34]. Then, they compared the results of their theoretical predictions and experiments. Similar deformation regions were found in bulk tensile and shear, and bonded shear specimens as linear elastic region followed by viscoelastic region and properties of adhesives showed strain rate dependence. Elastic region of the shear stress–strain curve was predictable from the results of bulk tensile specimens. On the other hand, they observed different viscoelastic behaviors associated with higher yield strength and larger strain detected in bulk shear in comparison to bulk tensile values [32]. Sancaktar et al. [35,36,37] compared different aspects from different mechanical models for more accurate results; two different epoxy based adhesives, LARC-3 (a high temperature adhesive produced by NASA) and a thermoplastic polyimide sulfone adhesive were characterized in the bonded single lap shear mode and modeled by using semi-empirical models. Their experimental characterization showed results similar to their previous study [32,33,34] indicating the presence of viscoelastic region after linear elastic region for epoxy based adhesives and LARC-3. Increment in ultimate shear stresses and decrement in maximum shear strains were observed with an increasing strain rate. For the thermoplastic polyimides sulfone adhesive, however, ultimate shear stresses and maximum shear strain values fluctuated and exhibited weak dependency on time and strain rate with no considerable change in maximum shear strain with increasing strain rates.
Morin and co-workers [38] proposed a new failure criterion for toughened epoxy adhesives based on an equivalent failure strain. They mentioned that on previous researches failure strain criteria were based either on triaxiality stress ratio or the strain rate effect. They showed that equivalent failure strain is dependent on strain rate by using tensile test. In their later study [39], they performed tensile, compressive and shear tests with the same toughened epoxy adhesive in order to get more accurate data which could also be implemented using finite element analyses (FEA) under different strain rates. They found that void growth and nucleation was affected by the strain rate and considerable visco-plasticity was seen in both tensile and compression results [39]. Morin et al. [40] also modified Split Hopkinson pressure bar test equipment with special connectors to characterize and model a structural adhesive in bonded adhesive with three different loading angles and at three different loading rates. They performed their experiments in pure tension (0°), pure shear (90°) and mixed-mode (45°). Experimental results indicated that both pure tension and mixed-mode showed similar responses which consisted almost entirely of elastic-brittle nature and small plastic zone at high loading rates, however, in pure shear mode higher strength and plastic zone were identified.
Yu et al. [41] used unmodified two-part epoxy adhesives in their studies to develop a reliable visco-plastic model. They first performed a complete characterization in both tensile (dog bone-shaped specimens) and compression modes via four-point bending-type specimen with different constant strain rates, creep and recovery for use in their model. In their experimental study, rate dependency of strain was examined in both tension and compression. Ultimate stress values obtained from compression tests were found to be 1.2% higher than the values obtained from tensile tests [42].

3. Objectives of the Current Study

The main objectives of this study can be summarized as follows.
1—
Detailed information about the constituents of eight different commercial toughened epoxy structural adhesives, used as model materials, will be obtained in order to be able to correlate them to their mechanical and failure behavior in bulk and bonded forms. These model adhesives will be divided in two groups as category 1 and category 2. Adhesives used in first category, adhesives 1, 2, 3 and 4, are labeled as P1AD1, P1AD2, P1AD3 and P1AD4, respectively, and they will be used to perform bulk tensile tests at different crosshead rates using a universal testing machine. Adhesives used in second category, adhesives 1, 2, 3, 4 and 5, are labeled as P2AD1, P2AD2, P2AD3, P2AD4 and P2AD5, respectively and will be used to perform impact tests using a split Hopkinson pressure bar (SHPB) apparatus at high strain rates (P1AD3 and P2AD1 are the same adhesives). Adhesives will be characterized by X-ray diffraction (XRD), differential thermal analysis (DTA), thermogravimetric analysis (TGA), scanning electron microscope (SEM) and energy dispersive x-ray spectrometer (EDS). The main crystalline inorganic ingredients will be identified as calcite (limestone), calcium oxide and wollastonite for all types of adhesives using combination of XRD, EDS analyses results and material safety data sheets (MSDS).
2—
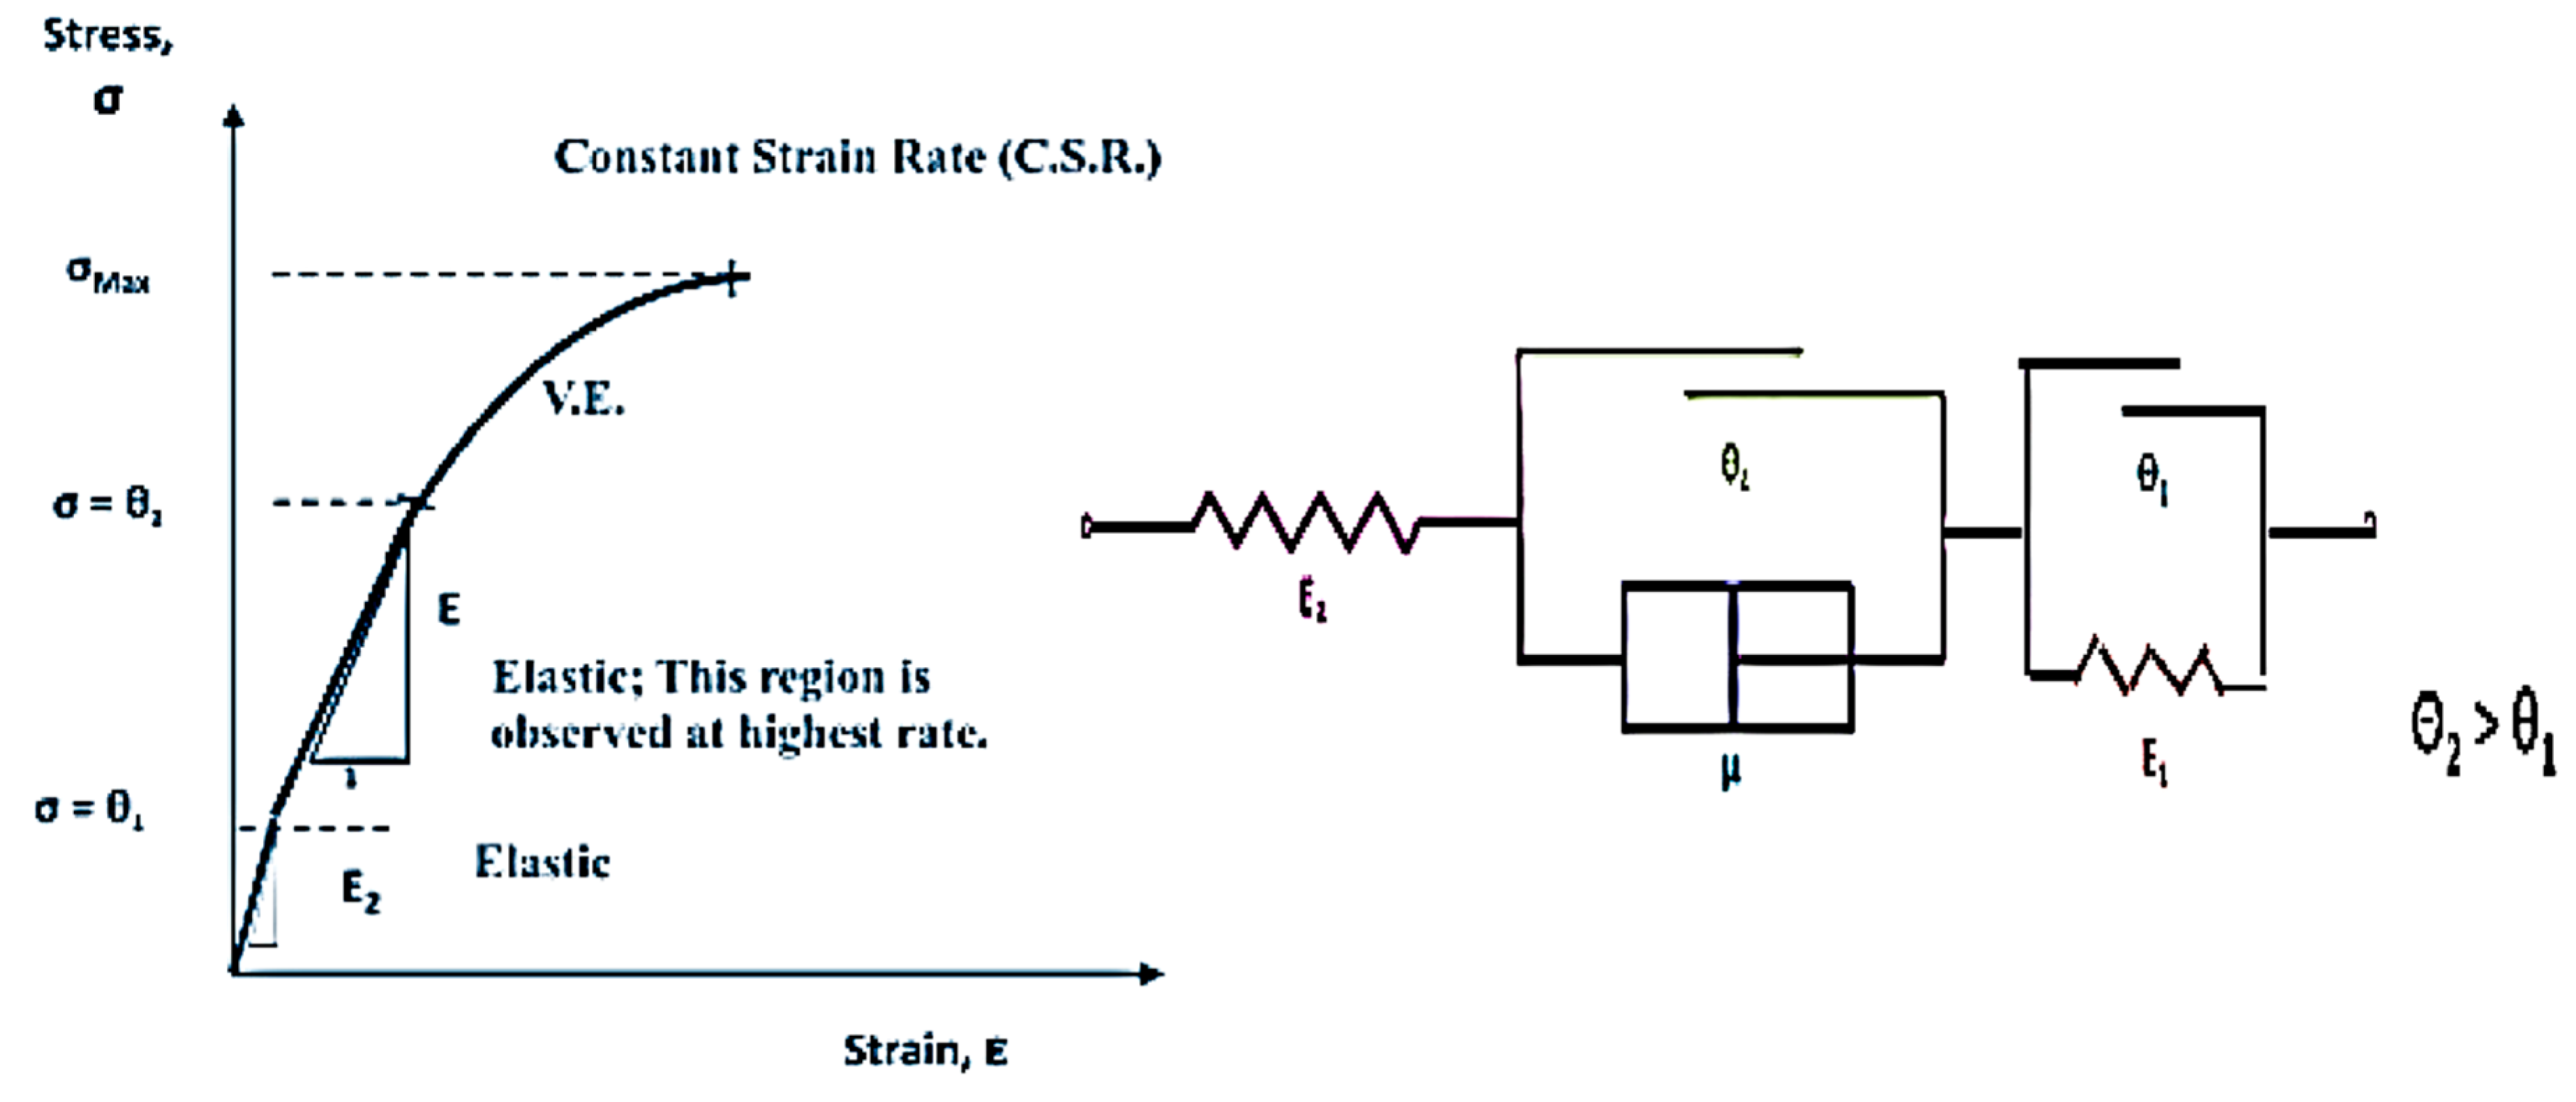
Tensile tests will be performed with strain gages attached to the specimens in order to identify the effect of strain rate on the material parameters of 4 different toughened epoxy structural adhesives involved in first category; adhesive 1, 2, 3 and 4. Stress–strain behavior of adhesives will be modeled using elastic-viscoelastic-plastic behavior representation using one-dimensional (1-D) phenomenological mechanical modeling approach which involves spring, dashpot and sliding element analogies.
3—
The strain rate sensitivity will be described by incorporating Ludwik-type equations into our modeling process. For this purpose, the modified Bingham elastic-viscoelastic-plastic model will be altered to a novel configuration to accommodate possible multilinear-elastic regions predicted with pronounced elasticity usually observed at high strain rates and impact situations. The stress–strain behavior of adhesives will be captured with high statistical accuracy in tensile mode at different extension rates from 25 mm/min to 500 mm/min.
4—
Toughness values will be calculated using this tensile stress–strain data in order to obtain insight into the effects of adhesive constituents (fillers and tougheners) and strain rate on the energy absorption behavior of the model adhesives in bulk form.
5—
Split Hopkinson pressure bar (SHPB) test will also be employed at high strain rates under compression to unveil the high rate (impact) behavior of adhesives involved in second category: adhesive 1, 2, 3, 4 and 5. These tests will be performed to assess whether the modeling performed in tensile mode using extension rates from 25 mm/min to 500 mm/min adequately represent higher rate impact behavior if we assume that such an impact event is dominated by elastic behavior, interfacial separations of the adhesive components and fast cohesive failures within the adhesive. For this purpose, the elastic moduli obtained via SHPB test will be compared with the elastic moduli obtained from the tensile specimens to validate the model developed as well as confirming the strain rate dependency of the model adhesives.
6—
The bonded (adhesive) behavior of the model materials will be evaluated for accurate assessment on the high-rate (impact) behavior of these novel crash resistant adhesives when bonding automotive steel substrates in typical lap joint configuration. The toughness values of the model adhesives will be compared when tested in bulk tensile and single lap bonded forms to assess the effects of main factor(s) in adhesive make up and loading rate (impact) on energy absorption capacity of the model adhesives.

4. Materials and Their Characterization

In this study, eight different commercial toughened epoxy structural adhesives supplied by Honda R&D Americas, Inc., Raymond, OH, were used. In this section, the data obtained from the manufacturers’ material safety data sheets (MSDS) are provided for the adhesives used. Materials were also characterized by X-ray diffraction (XRD), differential thermal analysis (DTA), thermogravimetric analysis (TGA), scanning electron microscope (SEM) and energy dispersive x-ray spectrometer (EDS) to get more information about the materials to correlate their behavior with their compositional changes.

4.1. Materials

Composition of Materials obtained from Supplier

The structural adhesives involved in this study can be divided in two groups as category 1 and category 2 and each category consists of two parts based on the testing methods as will be explained in subsequent sections. In the first phase of this study, 4 different toughened epoxy structural adhesives manufactured by Dow Automotive, MI and supplied from Honda R&D Americas, Inc, OH, were used, making up category 1. The chemical components and their amount ranges for these 4 adhesives are given in Table 1.
According to the manufacturer, these epoxy-type structural adhesives can be classified as a “hem flange adhesive” of high modulus, brittle in nature; another “semi-crash durable adhesive” of lower modulus with some amount of elastomeric toughener (containing urethane and/or urea groups) addition providing some level of energy absorption in a crash; and two additional “crash durable” adhesives with lower moduli than the semi-crash durable adhesives, containing between 10 and 45 weight percentage toughener, which is more than that added to the semi-crash durable adhesive.
In the 2nd phase of this study, five different types of structural adhesives were used, making up category 2. Three of them were supplied from Dow Chemicals and named as adhesive 1 (same adhesive as adhesive 3 used in the 1st phase of this study), adhesive 2 and adhesive 3, respectively. Additional adhesives obtained from Sika Corporation, Lyndhurst, NJ and L&L Products, Bruce Township, MI were named adhesive 4 and adhesive 5, respectively. The components and classification of adhesive 1, adhesive 3, adhesive 4 and adhesive 5 are given in Table 2 as obtained from manufacturer MSDS. No information could be obtained on adhesive 2 from the manufacturer.
Table 2 reveals that only adhesives 1 and 3 used in second phase contain elastomeric fillers besides inorganic fillers. There is no information about elastomeric filler usage for adhesive 2.
All adhesives used in Phases 1 and 2 were based on epoxy resin.
Among the Phase 1 adhesives, only adhesive 1 did not contain any organic tougheners. The other three adhesives contained organic tougheners in the form of carboxyl terminated butadiene acrylonitrile (CTBN) copolymer, as well as polyurethane adducts (Table 1).
Among the Phase 2 adhesives, only adhesives 1 and 3 contained organic tougheners in the form of carboxyl terminated butadiene acrylonitrile (CTBN) copolymer. Adhesive 3 also contained a polyurethane adduct (Table 2).

4.2. In-House Characterization of Materials

As it can be seen in previous section, information on the adhesive compositions are restricted. Weight percentage of the constitutes are given in broad ranges such as between 20 wt % and 61 wt % for adhesive 1 in 1st phase and between 10 wt % and 85 wt % for adhesive 3 in 2nd phase; furthermore, no inorganic filler information is provided for adhesive 4 in 1st phase. Thus, we analyzed the model materials in-house to identify the inorganic fillers used and their approximate amount.

4.2.1. X-ray Diffraction (XRD) Analysis of Toughened Structural Adhesives

The presence and identification of inorganic fillers in the toughened structural adhesives were investigated using powdered forms of the cured adhesives by XRD and scanning electron microscopy (SEM) techniques. All toughened structural adhesives were heated up to 600 °C with soaking times of 2 h at the rate of 3 °C/min in a chamber furnace, heated with MoSiO2 elements (Nabertherm) and at completion of the soaking period power to furnace was automatically shut off and cooling rate was set. The remaining powders were removed after cooling stage for further analysis.
In this section, results obtained from XRD analyses are discussed. Powdered specimens were scanned from 2θ = 5–90°, at a scanning rate of 1°/min, using a Rigaku DMax 2200 (Tokyo, Japan) diffractometer (with Cu–radiation, λ = 0.154 nm) at 40 kV and 40 mA.
Figure 1 shows the X-ray diffraction patterns of toughened structural adhesives that were used in the first phase of this study which involves tensile tests. adhesives used in first phase adhesive 1, adhesive 2, adhesive 3 and adhesive 4 were labeled as P1AD1, P1AD2, P1AD3 and P1AD4, respectively. Main crystalline inorganic phases were found as calcite (CaCO3), wollastonite (CaSiO3) or calcium silicate (CaSiO3), talc (Mg3Si4O10 (OH)2), zeolite which is an alumina silicate based mineral and has many different elements in its composition (M2/nO·Al2O3·xSiO2·yH2O., M can be Mg, Na, Ca, K, Li) and labeled as c, w, s, t and z, respectively.
As it can be seen from Figure 1, all adhesives used in phase one contained calcite, consistent with MSDS in which Limestone exists as a different form of calcite [43]. Presence of talc was confirmed for adhesive 2 and wollastonite confirmed for both adhesive 1 and adhesive 2 in XRD spectra and as given in the MSDS. Another phase that was found in the adhesive 1 was zeolite which is a form of alumina silicate, nevertheless this inorganic crystalline phase did not exist in the MSDS which was provided by the manufacturer. Both adhesive 3 and adhesive 4 contained talc and zeolite, as well. However, neither talc was given for adhesive 3 nor zeolite for adhesive 3 and adhesive 4 in their MSDS. Calcium silicate (which can also be wollastonite which is a form of calcium silicate) was also found in adhesive 4—contrary to its MSDS.
Figure 2 shows the X-ray diffraction patterns of toughened structural adhesives that were used in the second phase of this study which involved high rate impact tests via SHPB. Adhesives used in second phase: adhesive 1, adhesive 2, adhesive 3, adhesive 4 and adhesive 5 were labeled as P2AD1, P2AD2, P2AD3, P2AD4 and P2AD5, respectively.
Main crystalline inorganic phases for adhesives used in the second phase of this study were found as calcite (CaCO3), wollastonite (CaSiO3), talc (Mg3Si4O10 (OH)2) and labeled as c, w and t, respectively. As it can be seen from Figure 2, all adhesives used in phase 2 also contained calcite consistent with MSDS in which both calcium carbonate and limestone were included as different forms of calcite [43]. Calcite is the only inorganic phase for adhesive 5. There is no compositional information found in the MSDS of adhesive 2, but the existence of both calcite and wollastonite was verified from the XRD patterns. Presence of talc and wollastonite were also confirmed for adhesive 3 in XRD spectra as given in its MSDS. According to the MSDS of adhesive 4, it contains no inorganic fillers, nevertheless, diffraction pattern of adhesive 4 shows that it contains both calcite and wollastonite crystals.

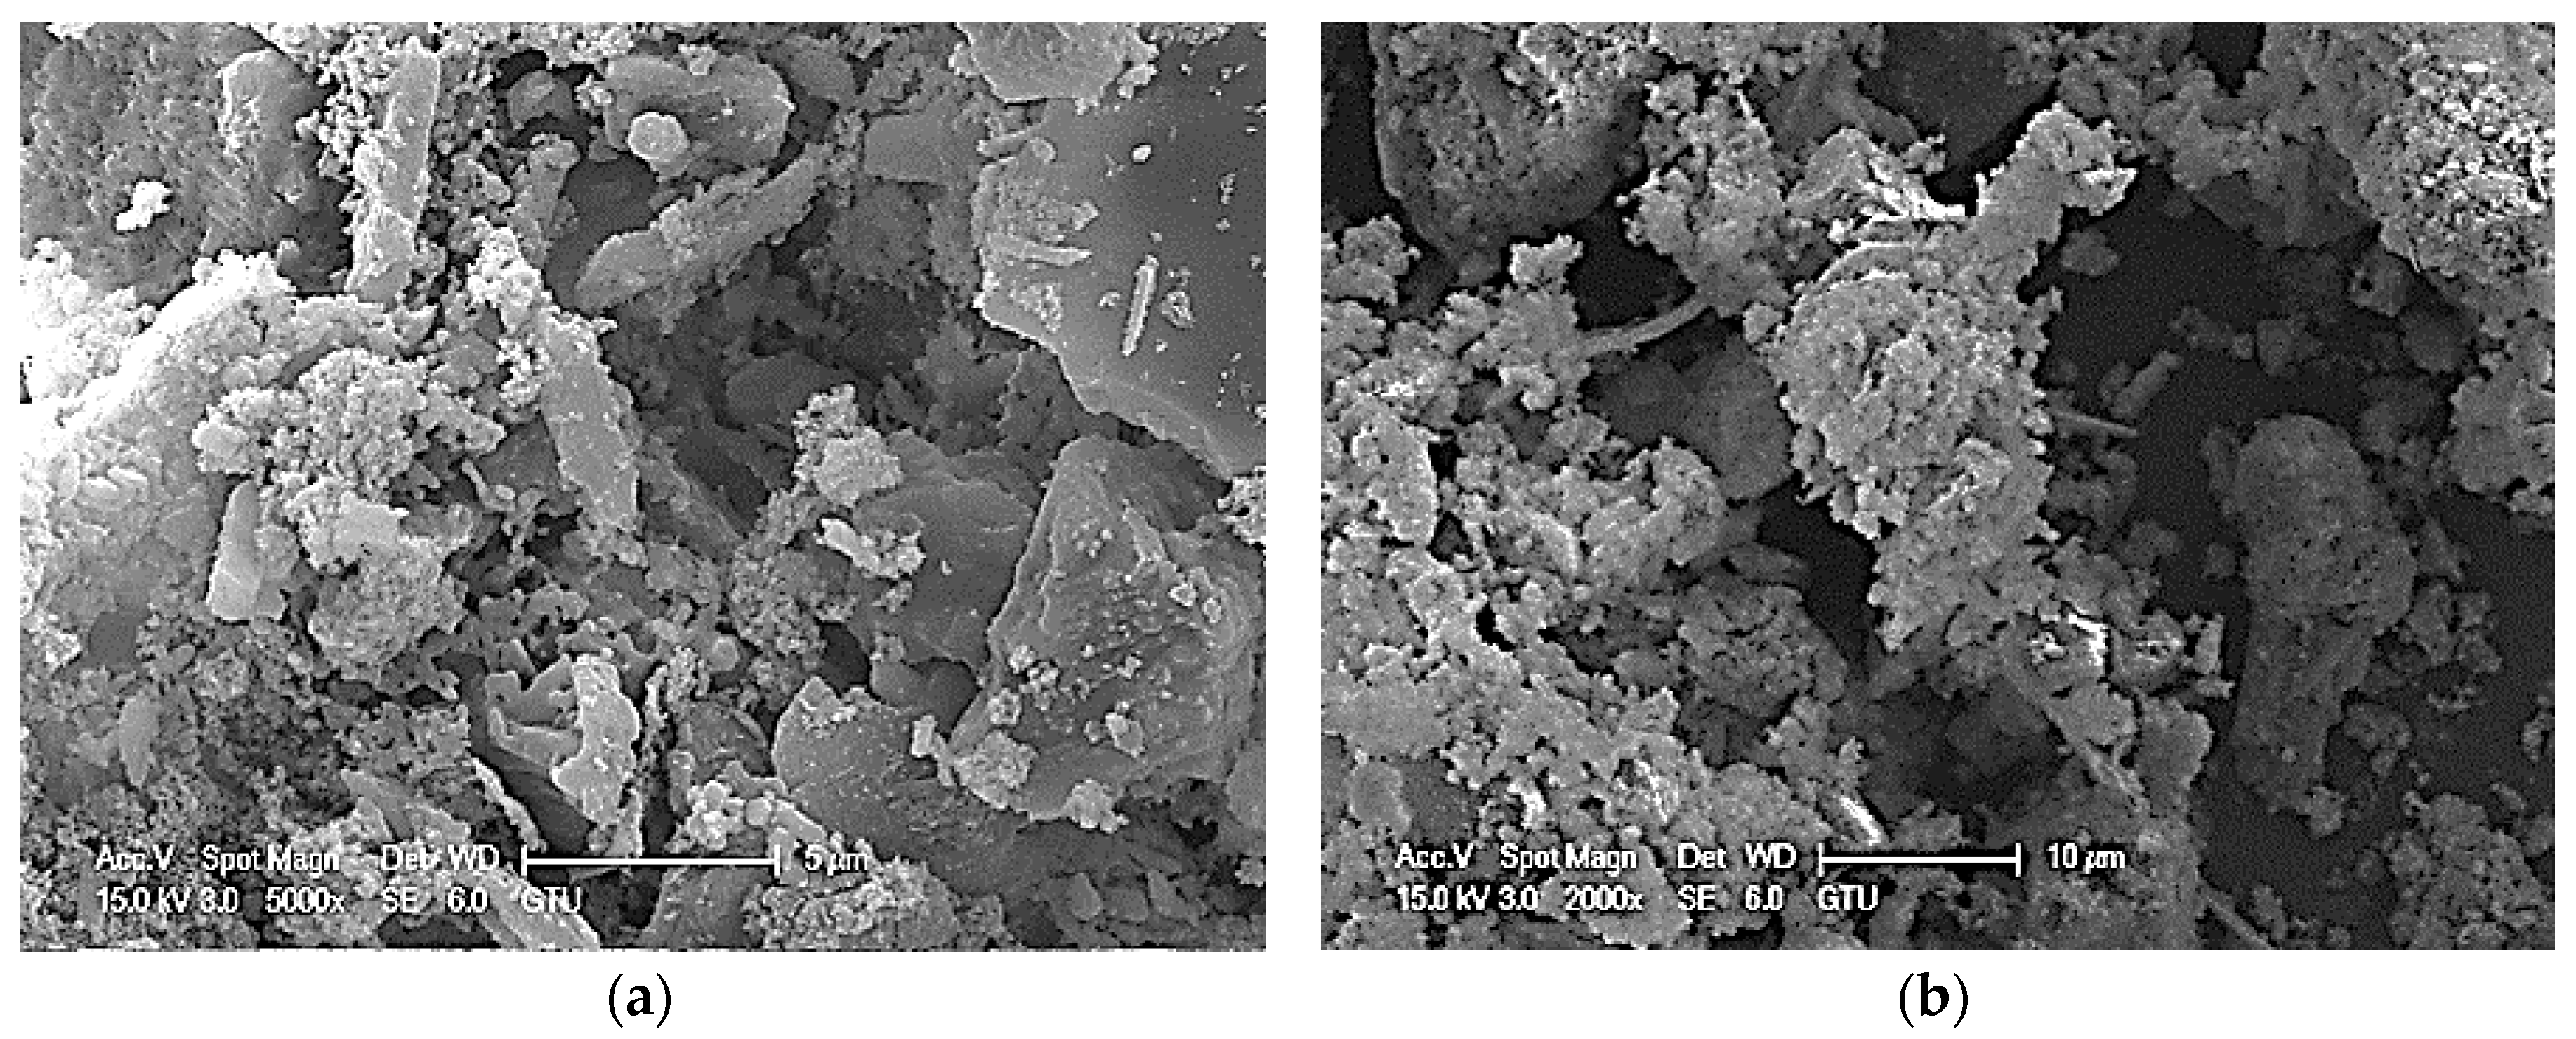
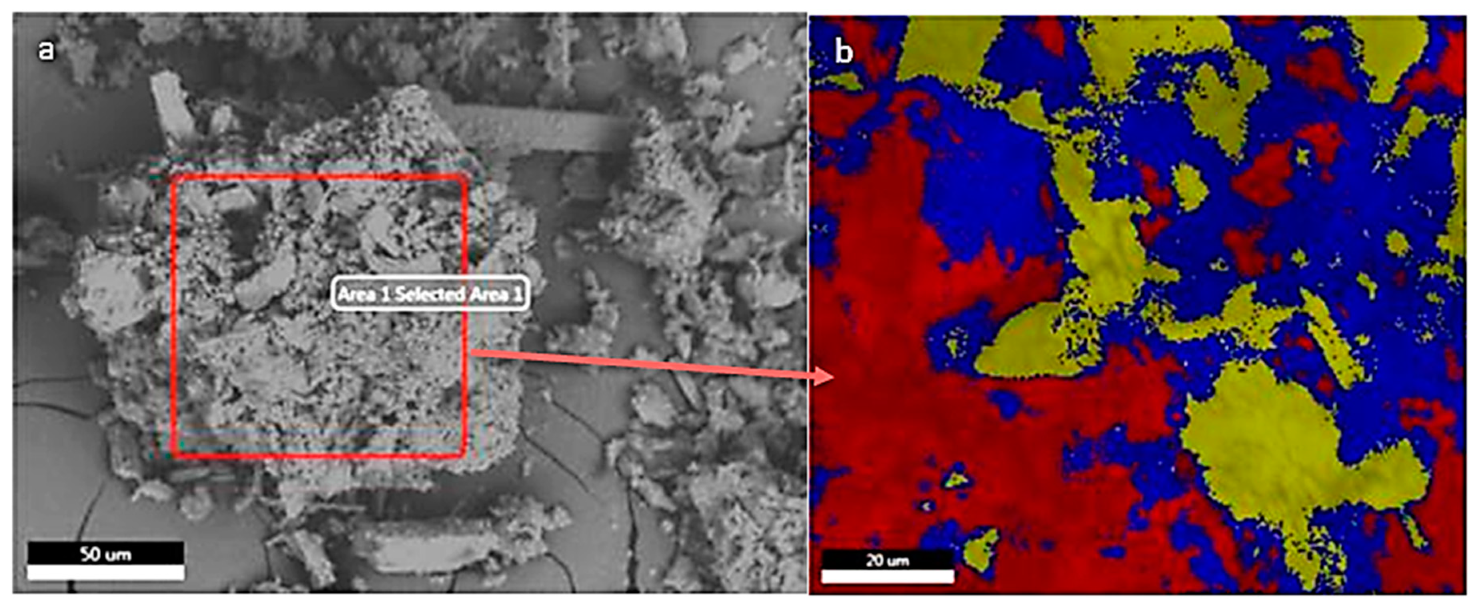
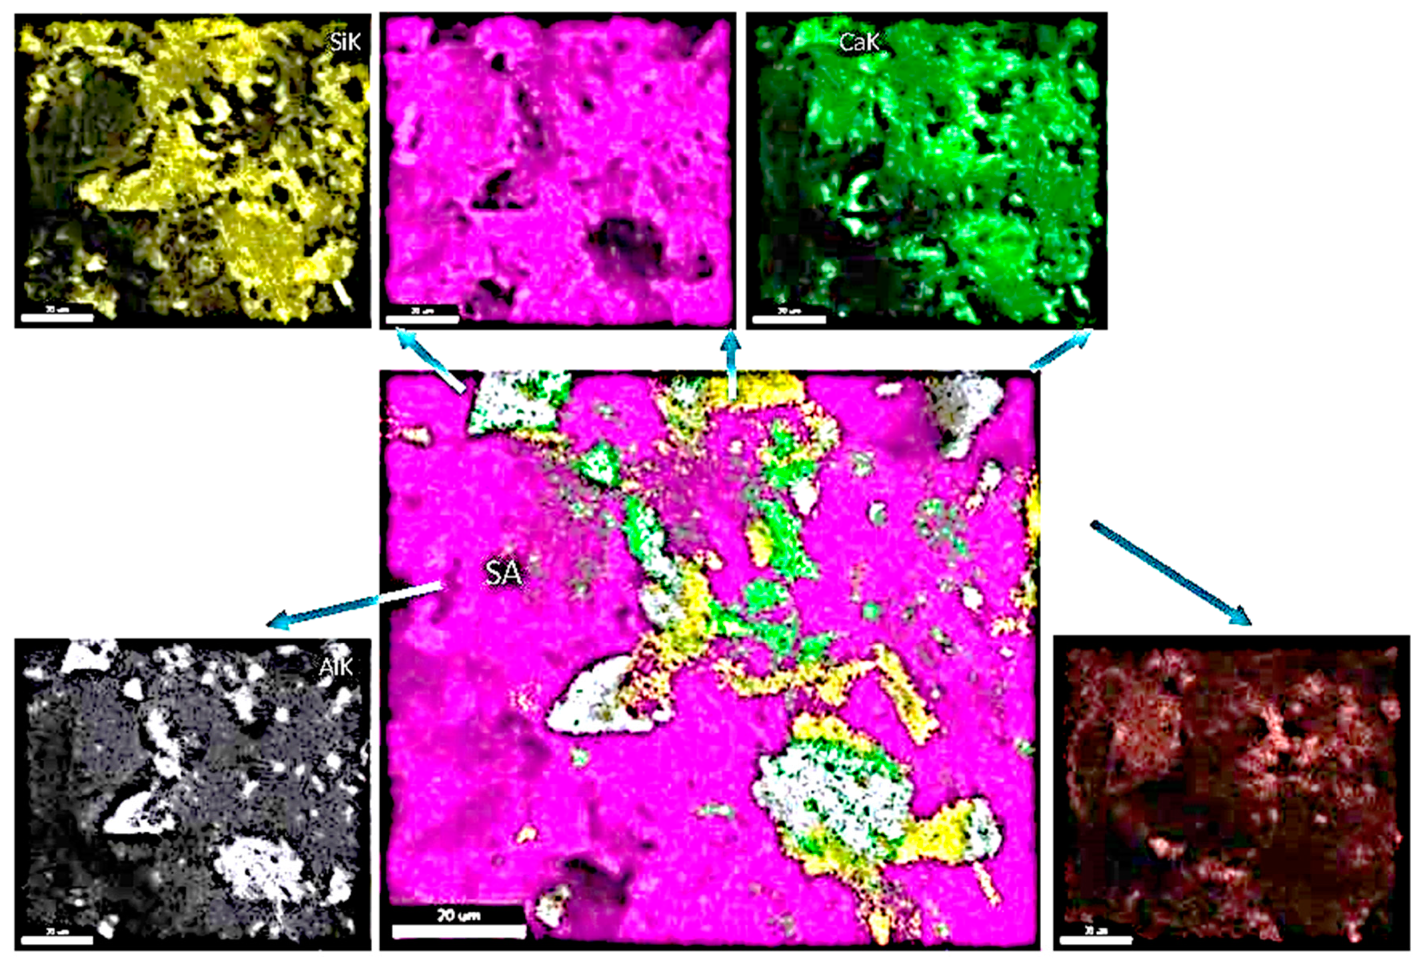
4.2.2. SEM/EDS ANALYSIS

In this section, results obtained from SEM and energy dispersive spectroscopy (EDS) analysis of powdered structural adhesives are summarized and discussed for adhesives from both the first and the second phases of this study.
A Phillips XL30 SFEG (North Billerica, MA, USA) scanning electron microscope equipped with tungsten electron source (operating at 15 kV) was used for microstructural examination of samples with Secondary Electron Images, SEI, used predominantly and distribution of minerals and elements identified with mapping via EDAX Team energy dispersive X-ray spectrometer, EDS.
Representative SEM images were evaluated at different magnifications such as 500×, 2000× and 5000×. SEM images and mineral and element mappings will be presented in this section.

Model Adhesives used in Tensile Testing (Phase 1)

SEM photomicrographs of adhesives 1 (P1AD1), 2 (P1AD2), 3 (P1AD3) and 4 (P1AD4) evaluated at 2000× and 5000× magnifications presented in Figure 3 indicate presence of different types of fillers in agreement with the adhesives’ MSDS and their XRD. Irregular shape particles such as needle shape fillers and laminated particles in conjunction with small and agglomerated particles are observed.
The red square in the image given in Figure 4a shows the selected EDS inspection field (Selected Area, SA) for adhesive 1. An example of resulting colored mapping images can be seen in Figure 4b. Spectrum of overall area (Figure 4c) reveal that Ca (46.22 wt %), Si (8.13 wt %) and O (34.94 wt %) are the main elements and Ca is the most abundant one among others in the selected area. Besides those elements, Mg (2.68 wt %), Al (1.55 wt %), C (4.03 wt %), Cl (2.46 wt %) were also observed. The existence of Ca, C and O elements; Ca and O elements; Mg, Si and O elements; Ca, Si, O elements in the EDS spectrum confirmed the presence of limestone, calcium oxide, talc and wollastonite, respectively as consistent with both MSDS and XRD results. Zeolite found in the XRD patterns was also verified with the presence of Al, Si and O elements and chloride group minerals. Zeolite was mentioned in the MSDS and also seen in the EDS spectrum with the presence of Cl element. Figure 3 and Figure 4d through Figure 3 and Figure 4f show relative proportion of previously defined elements over the scanned area. Each color presents proportion of different elements such as red, yellow and blue, which indicates Ca/Si (36%), Si/Ca/O/Al (23%) and Ca/Si (42%) elements, respectively. Comparison of the peak intensities and weight percentages of elements in colored EDS spectra revealed that blue areas contain relatively higher amount of limestone while yellow areas comprise more talc and alumina silicate based minerals. We can also predict presence of wollastonite in all colored areas with the presence of Ca, Si and O elements in colored EDS spectra.
Phase distributions of selected area, SA and separate phases obtained from that area can be seen in Figure 3, Figure 4 and Figure 5 for adhesive 1. Each color represents a separate phase (red = C, yellow = Si, purple = Ca, gray = Al, green = O) and five different phases were observed clearly in the inspected field. The percentages of the phases were found as 2%, 13%, 6%, 19% and 60% for C, O, Al, Si and Ca elements, respectively.
This analysis reveals that different fillers can form different shape phases (geometric regions indicated by different colors in SEM images) within the adhesive and such phases may contain more than one inorganic material in different percentages discerned within the geometric scales used here.
Using similar analysis for adhesive 2 (P1AD2) the existence of Ca, C and O elements; Ca and O elements; Ca, Si, O elements in the EDS Spectra confirmed the presence of limestone, calcium oxide and wollastonite, respectively as consistent with both MSDS and XRD results. Very small amount of Aluminum mineral was also observed in the EDS spectrum. Spectra of overall area revealed that Ca (59.86 wt %), Si (7.9 wt %) and O (28.6 wt %) are the main elements and Ca is the most abundant one among others in the selected area. Besides those elements, Al (0.3 wt %) and C (3.35 wt %) were also observed. Observations on relative proportion of previously defined elements over the scanned area indicated Ca/Si (44%, marked red), Si/Ca/O (6%, marked yellow) (this region contains relatively higher amount of limestone based on peak intensities and weight percentages), Ca/Si/O (30%, marked blue) and Ca/Si/O (20%, marked green) elements, respectively. Comparison of the peak intensities and weight percentages of elements in EDS spectra revealed that yellow areas contained relatively higher amount of limestone followed by green, blue and red areas, respectively. The existence of wollastonite can be predicted in all areas containing Ca, Si and O elements. Phase distributions of SA and separate phases obtained from that revealed the percentages of the phases as 1%, 6%, 2%, 18% and 74% for C, O, Al, Si and Ca elements, respectively.
For adhesive 3 (P1AD3), the spectrum of overall area revealed that Ca (47.41 wt %), Si (8.48 wt %), O (34.44 wt %) and Al (5.21 wt %) are the main elements and Ca is the most abundant one among others in the selected area. Besides those elements, C (4.46 wt %) was also observed. The existence of Ca, C and O elements; Ca and O elements in the EDS spectrum confirmed the presence of limestone and calcium oxide as consistent with both MSDS and XRD results. Zeolite found in the XRD patterns was also verified with the presence of Al, Si and O elements and the presence of aluminum hydroxide was also inferred as mentioned in the MSDS and seen in the EDS spectrum with the presence of Al element. Observations on relative proportion of previously defined elements over the scanned area indicated Ca/Si/O/Al (37%, marked red), Al/Ca/O/Si (8%, marked yellow) and Ca/Si/O/Al (56%, marked blue) elements, respectively. Comparison of the peak intensities and weight percentages of elements in EDS spectra revealed that yellow and blue areas contained slightly higher amount of limestone than red areas and yellow areas comprised more alumina silicate-based minerals as suggested by XRD results and/or aluminum hydroxide as suggested in MSDS. This is due to much higher amount of Al element compared to other areas such as blue and red. The presence of wollastonite can also be predicted in all colored areas with the presence of Ca, Si and O elements in EDS spectra. Phase distributions of SA and separate phases obtained from that revealed the percentages of the phases as 1%, 12%, 14%, 22% and 51% for C, O, Al, Si and Ca elements, respectively.
Similarly for adhesive 4 (P1AD4), spectrum of overall area revealed that Ca (42.65 wt %), Si (12.75 wt %) and O (39.71 wt %) are the main elements with Ca element being the most abundant one among others in the selected area followed by Si element. Besides those elements, Al (0.86 wt %) and C (4.02 wt %) were also observed. The existence of Ca, C and O elements; Ca and O elements; Ca, Si, O elements in the EDS spectrum confirmed the presence of limestone, calcium oxide and calcium silicate, respectively as consistent with both MSDS and XRD results. Comparison of the peak intensities and weight percentages of elements in EDS spectra revealed that green and yellow areas comprised relatively higher amount of limestone and red areas include less limestone compared to other areas. Zeolite was also found in all areas in slight amount with higher amount in yellow field. The presence of wollastonite was indicated in all colored areas due to the presence of Ca, Si and O elements in EDS spectra. Observations on relative proportion of previously defined elements over the scanned area indicated Ca/Si (23%, marked red), Ca/Si/O (33%, marked green), Si/Ca/O/Al (21%, marked yellow) and Ca/Si/O (23%, marked blue) elements, respectively. Phase distributions of SA and separate phases obtained from that revealed the percentages of the phases were found as 1%, 11%, 3%, 30% and 55% for C, O, Al, Si and Ca elements, respectively.

Model Adhesives Used in Split Hopkinson Pressure Bar (SHPB) Testing (Phase 2)

SEM photomicrographs of adhesives 2 (P2AD2), 3 (P2AD3), 4 (P2AD4) and 5 (P2AD5) evaluated at 2000× and 5000× magnifications presented in Figure 6 indicate presence of different types of fillers in agreement with the adhesive MSDS and its XRD. Irregular shape particles such as needle shape fillers and laminated particles in conjunction with small and agglomerated particles are observed.
For adhesive 2 (P2AD2), spectrum of overall area reveal that Ca (26.73 wt %), Si (22.86 wt %) and O (44.88 wt %) are the main elements and O is the most abundant one in terms of weight percentage Si having the highest intensity among others in the selected area. Besides those elements, Al (0.24 wt %) and C (5.29 wt %) were also observed. The existence of Ca, C and O elements; Ca and O elements; Ca, Si, O elements in the EDS spectrum suggested the presence of limestone, calcium oxide and wollastonite and/or calcium silicate, respectively as consistent with XRD results. Existence of alumina silicate based minerals is also suggested due to the presence of Al, Si and O elements seen in the EDS spectrum. Observations on relative proportion of previously defined elements over the scanned area indicated Si/Ca/O (38%, marked red) and Si/Ca/O (62%, marked blue) elements, respectively. When the peak intensities and weight percentages of elements were compared in EDS spectra, blue areas had higher amount of Si than red areas according to peak intensity and weight percentage. On the other hand, intensity of Ca in red areas was higher than the blue areas. As a result of existence of Ca, C and O elements, Ca, Si and O elements in the EDS spectrum as consistent with XRD results, it can be inferred that both areas contain limestone and wollastonite minerals. Moreover, since there was higher amount of Si in blue areas and Ca in red areas, it can be said that blue areas contain more wollastonite whereas red areas contain more limestone mineral. Phase distributions of SA and separate phases obtained from that revealed the percentages of the phases were found as 1%, 16%, 3%, 52% and 28% for C, O, Al, Si and Ca elements, respectively.
Results from adhesive 3 (P2AD3) reveal that Ca (42.87 wt %), Si (14.68 wt %) and O (37.81 wt %) are the main elements and the Ca and Si elements are the most abundant ones among others in the selected area. Besides those elements, Al (0.25 wt %) and C (4.4 wt %) were also observed. The existence of Ca, C and O elements; Ca and O elements; Ca, Si, O elements in the EDS spectrum confirmed the presence of calcium carbonate, calcium oxide and wollastonite, respectively as consistent with both MSDS and XRD results. Observations on relative proportion of previously defined elements over the scanned area indicated Ca/Si (21%, marked red), Si/Ca/O (43%, marked yellow) and Ca/Si/O (36%, marked blue) elements, respectively. When the peak intensities and weight percentages of elements in EDS spectrums were compared, red areas contained relatively higher amount of limestone; yellow areas comprised more wollastonite mineral and yellow/blue areas contained both wollastonite and limestone. Phase distributions of SA and separate phases obtained from that revealed the percentages of the phases were found as 1%, 6%, 2%, 18% and 74% for C, O, Al, Si and Ca elements, respectively.
Results from adhesive 4 (P2AD4) reveal that Ca (24.36 wt %), Si (26.74 wt %) and O (42.12 wt %) are the main elements and the O is the most abundant one in terms of weight percentage and Si has the highest intensity among others in the selected area. Besides those elements, Al (1.45 wt %), C (5.32 wt %) were also observed. The existence of Ca, C and O elements; Ca and O elements; Ca, Si, O elements in the EDS spectrum confirmed the presence of limestone, calcium oxide and wollastonite, respectively as consistent with XRD results. The presence of alumina silicate mineral was also verified with the existence of Si and O elements in EDS spectra. Observations on relative proportion of previously defined elements over the scanned area indicated Ca/O/Si (5%), Si/Ca/O (15%, marked red), Si/O/Ca (23%, marked green), Si/Ca/O (13%, marked blue), C/Si/O/Ca (2%, marked purple), Si/Ca/O (19%, marked orange), Si/C/O/Ca (4%, marked yellow), Si/O/Ca (18%, marked brown) and Si/O/Al/Ca (1%, marked pink) elements, respectively. When the peak intensities and weight percentages of elements in EDS spectra were compared, wollastonite was the dominant mineral in the analyzed field, especially in red, green, blue, orange, brown and pink areas. Existence of limestone also can be seen due to the presence of Ca, O and C elements in all colors, but existence of limestone is attributed to much higher intensity of C element in purple and yellow areas. High intensity of Al element is also obtained in pink areas indicating presence of alumina silicate mineral with the existence of Si and O elements in EDS spectra. Phase distributions of SA and separate phases obtained from that revealed the percentages of the phases were found as 3%, 17%, 4%, 53% and 22% for C, O, Al, Si and Ca elements, respectively.
Results from adhesive 5 (P2AD5) reveal that Ca (38.28 wt %), Si (14.68 wt %) and O (38.3 wt %) are the main elements and the Ca and O are the most abundant ones in terms of weight percentage with Si having the highest intensity among others in the selected area. Besides those elements, Al (1.81 wt %), C (6.92 wt %) were also observed. The existence of Ca, C and O elements in the EDS spectrum confirmed the presence of limestone and/or calcium carbonate as consistent with both MSDS and XRD results. Presence of Si also indicates the presence of silicates probably in the form of calcium silicate which was not found neither in MSDS nor in XRD. Observations on relative proportion of previously defined elements over the scanned area indicated Si/Ca/O (24%, marked red), C/Ca/Si/Al/O (1%, marked yellow), Ca/O/Si/Al (7%, marked purple), Si/Ca/O (25%, marked orange), Si/Ca/O/Al (9%, marked brown), Ca/Si/O (19%, marked blue) and Ca/Si/O (15%, marked green) elements, respectively. When the peak intensities and weight percentages of elements in EDS spectra were compared, Si was the dominant element in the analyzed field, especially in red, orange and brown areas. The presence of limestone could also be inferred due to the presence of Ca, O and C elements in all colors and attributed to much higher intensity of C element in yellow areas. High intensity of Al element was also obtained in yellow and pink areas indicating presence of alumina silicate mineral with the existence of Si and O elements in EDS spectra. Phase distributions of selected area (SA) and separate phases obtained from that revealed the percentages of the phases were found as 2%, 11%, 6%, 35% and 46% for C, O, Al, Si and Ca elements, respectively.

4.2.3. Differential Thermal Analyses and Thermogravimetric Analyses

Differential thermal analysis (DTA) and thermogravimetric analysis (TGA) were carried out simultaneously to identify the thermal behavior of cured toughened structural adhesives via NETZSCH STA 449F3 (Istanbul, Turkey) equipment at temperatures from 30 °C to 1200 °C with 10 K/min temperature ramp under air atmosphere.

DTA and TGA for Adhesives Used in First Phase of the Study

DTA and TGA curves obtained for adhesives used in first phase of this study are shown in Figure 7.
Figure 7a shows the DTA and TGA curves for adhesive 1. TGA curve reveals an initial decrease in mass until 300 °C due to the release of water and dehydration. This decrement increased after 300 °C until around 500 °C due to the decomposition of organic materials. Beyond 500 °C, significant, but slower loss of mass continued up to 850 °C as a result of decarbonation during decomposition of carbonates. After 850 °C, no considerable change in mass could be seen and the total loss of mass was determined as 74.52 wt % for adhesive 1. DTA curves also indicate weak endothermic peaks at lower temperature attributed to loss of water under 200 °C and low temperature decarbonation between 220 °C to 600°C [44]. The peak obtained at 484.3 °C can be linked to reaction of talc [45] and peaks observed between 500 °C to 800 °C are associated with decomposition of weakly crystalline calcite. Reactions occurring after 800 °C are generally attributed to decomposition of well crystallized calcite [44]. The total mass loss for adhesive 1 was 74.52 wt %.
Figure 7b shows the DTA and TGA curves for adhesive 2. Similar thermal behavior is seen between adhesive 1 and adhesive 2. First slight decrease in mass is observed in TGA analysis with some small endothermic peaks in DTA curves due to the loss of water and dehydration at lower temperatures. After 290 °C, fast decrease in weight occurred due to the combustion of organic materials [44]. Endothermic peak obtained at 553.7 °C could be linked to reaction of talc mineral [45]. Low temperature decarbonation occurred due to the decomposition of carbonates and loss of carbon dioxide from calcite at temperatures between 220 °C to 600 °C. After 600 °C, up to 1000 °C, high temperature decarbonation occurred, as well [44]. There is no considerable change after 850 °C as in adhesive 1 and total mass loss was 73.71 wt % for adhesive 2.
DTA and TGA curves for adhesive 3 are shown in Figure 7c. Thermal behavior similar to those for adhesives 1 and 2 is obtained for adhesive 3, as well. The different stages of weight loss involve slow and small decrease in weight due to the water removal from the specimen and then, a sudden increase in weight loss, attributed to combustion of organic parts and low temperature decarbonation, is observed. These events are followed by slower weight loss which is still more than first step occurring after 600 °C and different than other adhesives mentioned above. Weight loss continues between 850 °C and 1000 °C as attributed to decomposition of well crystallized calcite [44] and finally flat plateau is seen with no change in weight after 1000 °C. Total weight loss was determined to be 81.01 wt % for adhesive 3.
Figure 7d illustrates the DTA and TGA curves for adhesive 4. First, a slight decrease took place in weight similar with the other adhesives, and this decrease can be linked to removal of water and dehydration. Then, rapid decrease occurred after 290 °C until 460 °C and several small endothermic peaks were observed in DTA curve due to the decomposition of inorganic part and lower rate decomposition of carbonates, continuing until 600 °C. After 460 °C, change in mass continued with slower rate up to 940 °C and several peaks were observed in DTA curves. No considerable change was observed after 940 °C as with the other adhesives and total change in the mass was found to be 85.28 wt % for adhesive 4.
When the change in the mass of adhesives are compared for the first phase of this study it is seen that adhesive 2 has the highest amount of inorganic fillers with a 26.29 wt % residual amount of weight, whereas adhesive 4 has the least amount of inorganic fillers with 14.72 wt % residual amount of weight.
The important common observation from all DTA curves of adhesives 1–4 is the fact that a large amount of energy is absorbed beyond mid six-hundred degrees centigrade through processes involving decomposition of weakly crystalline calcite followed by the decomposition of well crystallized calcite. Prior to and during these processes, energy is also absorbed by decarbonation occurring due to the decomposition of carbonates and loss of carbon dioxide from calcite (Figure 7).

DTA and TGA for Adhesives Used in Second Phase of the Study

The DTA and TGA behaviors observed for the Phase 2 adhesives are similar to those observed with the Phase 1 adhesives.
The TGA curve for adhesive 2 showed an initial decrease in mass up to 290 °C as water is removed from the specimen. Then, the mass decreased at a faster rate and this major decrease was linked to degradation of organic materials as observed on all other adhesives and lower temperature degradation of carbonates. After organic materials degraded loss of mass continued, but the rate of change decreased, and degradation of carbonates continued. After 600 °C, higher temperature decarbonation occurred. Reactions occurring after 800 °C were generally attributed to the degradation of calcite with higher crystallinity. After 1050 °C, change in the mass almost stopped and the only reaction obtained was attributed to mullitization after 1000°C [46].
The DTA and TGA curves for adhesive 3 are very similar to those with other adhesives. First, there was a slow and small decrease up to 290 °C attributed to water loss. Then, mass loss started to increase at higher rate with combustion of organic materials up to 480 °C. Later, mass loss rate decreased, and degradation of carbonates continued. After 600 °C, high temperature decarbonation continued and calcites with different crystallinity also degraded. After 970 °C, mass change was almost complete and total mass loss was found to be 72.41 wt %.
Adhesive 4 also showed very little decrease in mass until 280 °C and only small endothermic peaks were observed related to loss of water. After 280 °C, decrease in mass increased considerably associated with degradation of organic materials and decarbonation. After 480 °C, loss of mass continued with a slower rate and only 6 wt % of materials degraded up to 785 °C due to the degradation of carbonates. Decrease in mass continued until 1050 °C with removal of carbon dioxide from calcite and degradation of carbonates and crystalline calcite. After 1050 °C, there was no considerable change in mass and the total mass loss was calculated as 73.50 wt %.
There was no considerable change in mass observed for adhesive 5 until 300 °C as with the other adhesives used in this study. Almost 54 wt % of the mass was lost between 300 °C and 480 °C associated with the degradation of organic materials and lower temperature decarbonation. After 480 °C, loss of mass continued with a slower rate and only 8 wt % of the materials degraded up to 800 °C due to the high temperature degradation of carbonates. Exothermic peak obtained after 1000 °C could be due to mullitization [46]. After 1030 °C, there is no considerable change in mass and total mass loss was determined as 82.52 wt %.
When the change in the mass of adhesives are compared for the second phase of this study it is seen that adhesive 3 has the highest amount of inorganic fillers with 27.59 wt % residual amount of weight whereas adhesive 5 has the least amount of inorganic fillers with a 17.48 wt % residual amount of weight.
As in the case of Phase 1 adhesives, the important common observation from all DTA curves of Phase 2 adhesives is the fact that a large amount of energy is absorbed at higher temperatures (≥700 °C) through processes involving decomposition of weakly crystalline calcite followed by the decomposition of well crystallized calcite. Prior to and during these processes, energy is also absorbed by decarbonation occurring due to the decomposition of carbonates and loss of carbon dioxide from calcite.

4.2.4. Tensile Testing

In order to perform tensile tests at lower strain rate ranges (compared with the SHPB testing) an Instron 5567 electro-mechanical test machine (Norwood, MA, USA) was used at different speeds from 25 mm/min to 500 mm/min. The most accurate way to measure strain is to use electrical resistant strain gages for determining material properties [28]. In our study, we used high elongation strain gages bonded to the dog-bone shape adhesive tensile specimens. To be able to install strain gages we chose the ASTM 412-C specimen standard which provides a test geometry of adequate width for adhesive to flow during mold filling, thus helping to prevent bubble formation. Specimens were prepared by compression molding at 180 °C for 30 min curing time according to the manufacturers, specifications. Compression mold suitable with ASTM standard was designed using an Autodesk educational product to accommodate three specimens to be molded at a time. The molding process resulted in specimen shown in Figure 8 with strain gage attached.
Figure 9 illustrates the schematic presentation of our testing setup. While we were loading the dog-bone shape specimens, strain data were collected as a function of time by strain gages utilizing data acquisition system. Stress–strain data also obtained through Instron 5567 tensile machine, as well. Stress data collected from Intron 5567 tensile machine were recorded for the further calculations. Tensile tests were carried out using 4 to 5 specimens for each extension rate and each structural adhesive.

4.2.5. Bonded Single Lap Shear Testing

The lap joint test is a standard and simple method to calculate shear strength of adhesives. This testing mode can be used for bonding dissimilar substrates. Furthermore, if the substrates are metal, the adequate method to obtain the shear strength of adhesive joint [47] is the single lap joint test associated with ASTM D1002 standard geometry.
For this study, metal single lap substrates used in automobile manufacture were supplied by Honda R&D Americas, Inc., and the single lap joint tests were performed on four model adhesives used in the first phase of this study and named as adhesive 1, adhesive 2, adhesive 3 and adhesive 4. The following procedure was utilized for bonding:
  • Substrates were cleaned with acetone.
  • Substrates were marked away from the overlap area to calculate substrate deformation used in obtaining accurate adhesive strain;
  • Adhesive was applied to the substrate on 25.4 mm x 12.7 mm overlap area according to the ASTM standard;
  • Shims were used to define adhesive thickness;
  • Substrate was joined and pressurized using binder clips;
  • A convection oven was used to cure the specimens at 180 °C for 30 min which were then allowed to cool;
  • The overlap area and the thickness were recorded for further calculations;
  • Single lap specimens were tested in tensile-shear mode (ASTM D1002) using an Instron 5567 electro-mechanical test machine at different extension rates between 25 mm/min and 500 mm/min. Extension versus load curves were obtained from the Instron data processor.
After the results were obtained from the tensile-shear tests, shear stress and shear strain were calculated from the load and extension values as follows:
s h e a r   s t r e s s =   l o a d   s h e a r   a r e a   ( o v e r l a p   l e n g t h X s p e c i m e n   w i d t h )
s h e a r   s t r a i n =   ( c o r r e c t e d ) e x t e n s i o n   a d h e s i v e   t h i c k n e s s
The initial elastic shear strain, elastic shear moduli and shear toughness (area under the shear stress–strain curve) values were then calculated and their dependence on the initial shear strain rate was determined. Adhesive lap shear fracture surface images were also obtained by optical microscopy to determine homogeneity of fracture and changes with different strain rates.

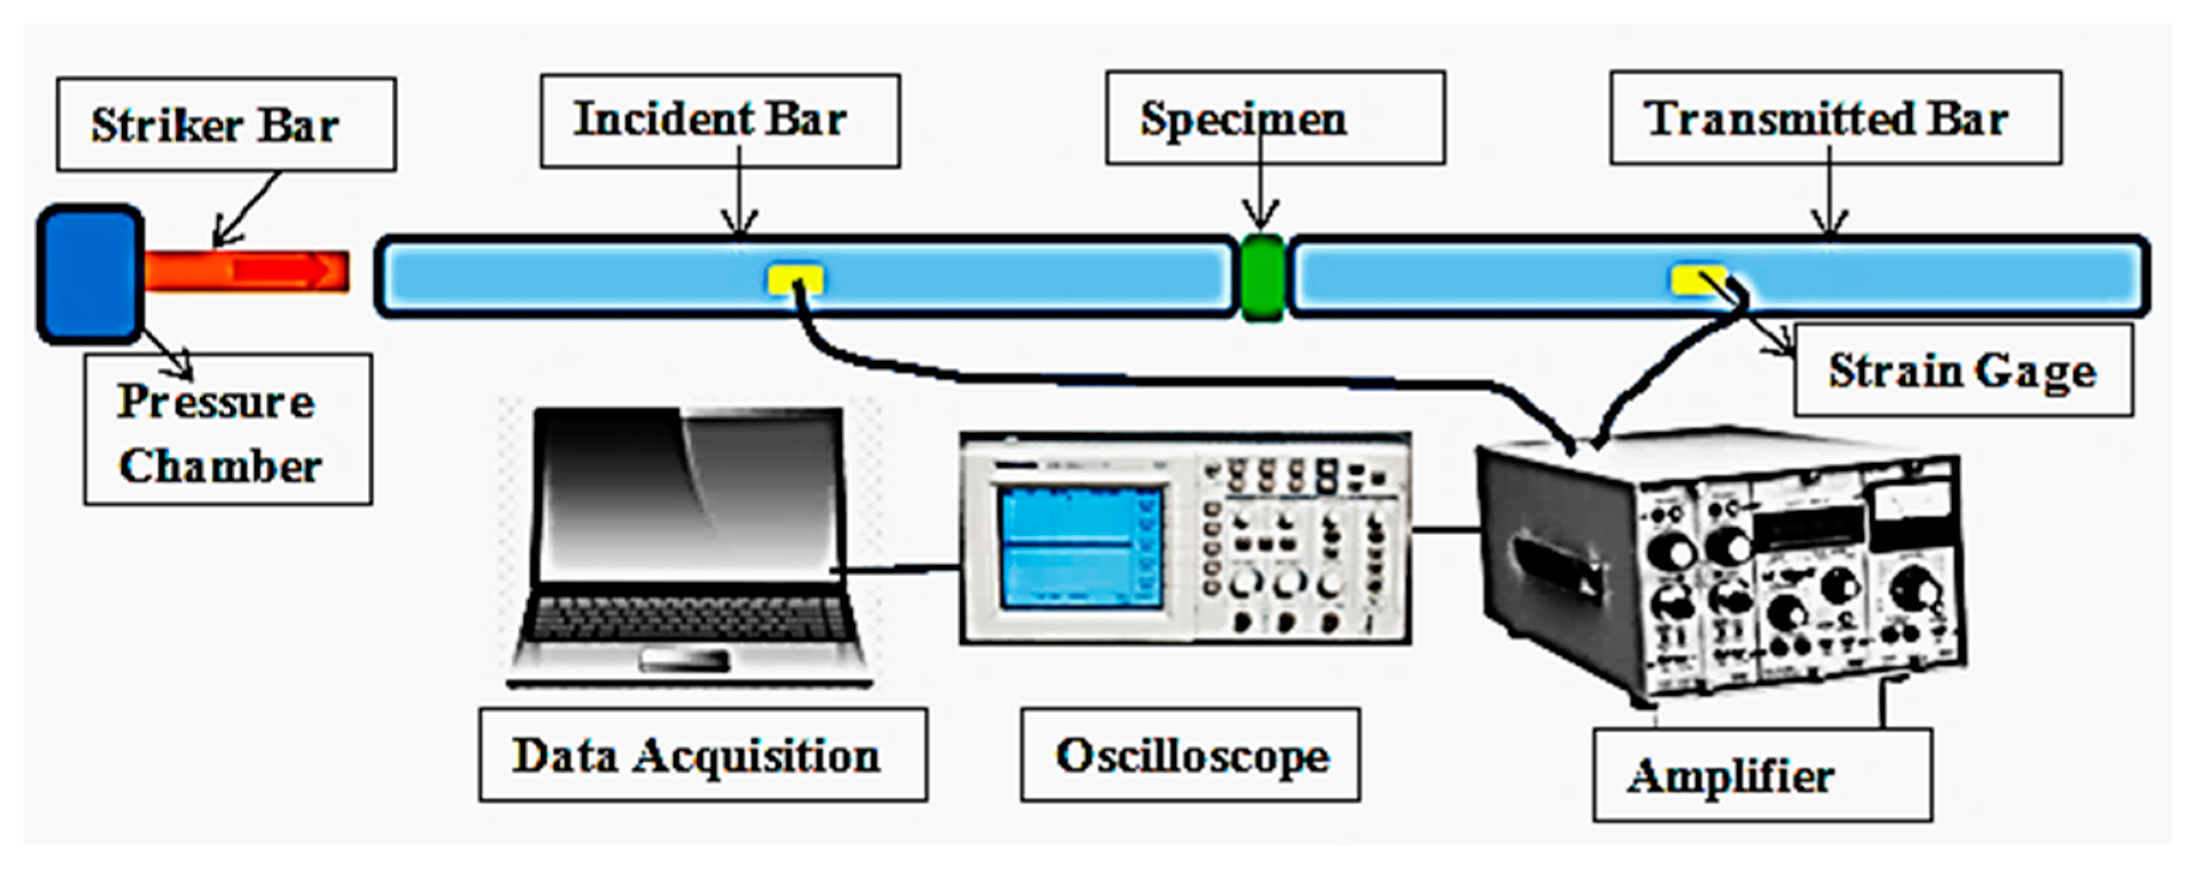
4.2.6. Split Hopkinson Pressure Bar (SHPB) Testing

Material properties such as failure strain, elastic limit stress and tensile strength are commonly obtained using quasi-static loading conditions. However, material properties at loading rates higher than obtainable with universal testing machines are needed to confirm the reliability of materials under high impact conditions. The SHPB test device can be used to measure the strain and stress values at higher strain rates in the order of 102 s−1 which is generally encountered in impact related loading situations. In this study, a SHPB test machine illustrated in Figure 10 was used for higher loading rate conditions.
As it can be seen from Figure 10, a specimen is placed between two bars in the SHPB machine. One of these bars is the incident bar and the other is the transmitted bar. The external impact is applied by a gas gun which actuates a striker bar to impact the incident bar. A compression wave is thus generated in the incident bar and delivered to the specimen by it. Part of the wave is transmitted-to-transmitted bar and the rest of it is reflected back to the incident bar [48,49]. Stress waves in the incident bar and transmitted bar can be recorded as incident wave, transmitted wave and reflected wave through semi-conductor strain gages (Kulite UFP-750-90, Centerville, OH, USA) attached to the bars in the form of Wheatstone bridge and monitored by an amplifier and an oscilloscope. Both amplifier and oscilloscope should have high frequency response to capture the signal due to the low-amplitude voltage of Wheatstone bridge and frequency response of Hopkinson bar components should be at least 100 kHz. Generally, distorted signals are recorded [49] at lower frequencies.
Particle velocities at the both ends of the specimen can be calculated by using one-dimensional stress wave theory. v1 and v2 are the velocities of specimen at both ends, ε is the strain and I, R and T indicate incident, reflected, transmitted pulses, respectively, CB is elastic bar wave speed of the bar material, Ls is the specimen initial length [49].
v 1 = C B ( ε I ε R )
v 2 = C B ε T
The average engineering strain rate and strain in the specimen are,
ε ˙ = v 1 v 2 L s = C B L s ( ε I ε R ε T )
ε = 0 t ε ˙ d t
Equation (5) reveals that the strain rate, ε ˙ , is a function of the specimen length, Ls.
Stress calculation using one dimensional wave theory can be performed with the following equation where EB is Young’s modulus of the bar material, AB and AS are the cross-sectional areas of the bar and the specimen, respectively [49]:
σ = E B A B ε T A S
To enable use of one-dimensional wave propagation, the incident and transmission bars should be long enough and need to compensate large deformations of the specimens. While using one-dimensional wave theory, wave dispersion also should be taken in consideration. The effects of dispersion accumulate as the waves propagate over a distance and become more significant when bar diameter increases. Such dispersions were discussed by researchers [50,51] and they suggested that decrement in the wavelength leads to decrease in propagation velocity of a stress wave which means high frequency stress wave travels slower than a wave which has a lower frequency. As mentioned before use of lower frequency components also leads to distorted wave-by-wave dispersion.
In this study, cylindrical bulk adhesive specimens were produced by using cylindrical shape Teflon molds at 180 °C via compression molding. Specimens’ stress, strain and strain rate were calculated from the results of SHPB tests. In order to reveal the reliability of the model proposed using lower range strain rate results, material parameters obtained previously were compared with results from SHPB tests.

Sample Calculation for SHPB Testing

Stress waves in the incident bar and transmitted bar can be recorded through semi-conductor strain gages (Kulite UFP-750-90) attached to the bars as incident wave, transmitted wave and reflected wave using amplifier and oscilloscope. Figure 11 shows the waves captured with an oscilloscope; blue line gives the incident and reflected waves and the orange line gives the transmitted wave. It can be seen that only a small part of the incident wave is transmitted while a large part of the wave is reflected back to the input bar. Similar waves were also captured by Li and Wang [52] for Sikaflex adhesives via SHPB test equipment. Incident wave starting time, incident wave end time, reflected wave starting time, transmitted wave start time were recorded for further calculations for each SHPB specimens.
To define the material parameters of adhesives, time–strain, stress–strain and strain rate values were calculated via software HBAnalysis 61-LabView National Instrument, Austin, which uses the formulations from the literature we mentioned in previous section. Necessary parameters for calculations can be seen in Table 3 and Table 4. Same values were also calculated without using software and by using the oscilloscope output and formulations to confirm the reliability of software and the same results were obtained.

5. Results and Discussion

5.1. Identification of Rate Dependent Material Parameters of Toughened Structural Adhesives

Results of our tensile tests revealed multiple elastic limit (yield) points for all adhesives when tested at the highest extension rate (500 mm/min). Changes in the elastic modulus and stress with increasing strain during tensile test at 25 mm/min and 500 mm/min extension rates are shown in Figure 12 which also reveals variation of elastic moduli with loading rate. In constructing Figure 12, elastic modulus for each strain point was determined to establish the overall curve. It can be seen from the figure that slopes of the moduli are almost the same at the lower loading rate. However, slopes of the elastic moduli at 500 mm/min change after some strain level indicating the presence of second elastic limit stress where the slope of the elastic modulus variation curve has changed. Thus, the initial elastic behavior at 500 mm/min extension rate is bilinear. Furthermore, reductions in elastic moduli (especially for those describing the first elastic region) are observed with increasing extension rate (Figure 12).
Stress–strain behavior of adhesives shown in Figure 12 presented typical viscoelastic behavior in which first a linear–elastic behavior was observed followed by viscoelastic behavior all of which were found to vary with extension rate.

5.2. Modeling of Rate-Dependent Material Parameters for Toughened Structural Adhesives

In order to model our toughened adhesives, a complete characterization including strain rate dependence of stress–strain parameters such as limit stresses and strains and elastic moduli are needed. Such properties can be predicted using the semi-empirical equation proposed for metals by Ludwik in the form:
σ u l t = σ + σ log ( ε ˙ ε ˙ )
where σult is the ultimate tensile stress,   ε ˙ (/dt) is the initial elastic strain rate and σ′, σ″ and ε ˙   ( ′/dt) are material constants.
For viscoelastic modeling, we first consider the modified Bingham model shown in Figure 13.
The modified Bingham model predicts three different material behaviors; first linear elastic behavior below elastic limit (θ), then viscoelastic behavior and finally perfectly plastic behavior after maximum stress (Y) and the corresponding constitutive equations for those regions are given as follows, respectively [35,36,53]:
σ ( t ) = E ε   σ θ
σ ( t ) = σ + μ R · [ 1 e ( t t 0 ) / t R ]   θ < σ Y
σ ( t ) = Y   σ   Y
where tR = µ/E is the relaxation time and t0 is the time to reach elastic limit. The modified Bingham model has been used by Sancaktar et al. for characterizing the viscoelastic shear behavior of a structural adhesive in the bulk and bonded forms [35,36].
The modified Bingham model described above utilizes a single elastic modulus to represent the initial elastic region. However, our stress–strain data shown in Figure 12 revealed that the initial elastic behavior at 500 mm/min extension rate is bilinear. In order to represent this initial bilinear elastic behavior, we propose the modification of the modified Bingham model to a new bilinear-viscoelastic model shown in Figure 14.
We note that the plastic zone, σY, of the modified Bingham model is omitted in the bilinear-viscoelastic model as it is to be used to describe impact situations. We also note that, in the bilinear-viscoelastic model, when θ1σθ1, the equivalent elastic modulus, E (Figure 14) becomes:
E = E 1 E 2 E 1 + E 2
In Equation (12), E < E1 and E < E2.
It is also important to note that E1 and E2 individually represent equivalent elastic moduli which correspond to the elastic behavior of the toughened adhesive materials in composite morphologic form, shown in Figure 3, Figure 4, Figure 5 and Figure 6. Therefore, we expect both E1 and E2 to be lower at higher loading rates since the organic components (i.e., epoxy, polyurethane, rubber) exhibit higher strength at such rates, thus transferring the applied load to the organic/inorganic or inorganic/inorganic interfaces which more readily fail to result in lower modulus values. This behavior can be clearly seen in Figure 15. We note that, this process leads to lower values for the equivalent elastic modulus, E of Equation (12).
The process is similar for the strain dependent reduction in modulus observed in Figure 12. As the organic components stretch, they strain harden due to preferential orientation of the polymer molecules. This process also leads to transfer of the applied load to the organic/inorganic or inorganic/inorganic interfaces which more readily fail to result in lower modulus values.
The linear regression lines for the fitted Young’s moduli (similar to Equation (8)) shown in Figure 15 as a function of the strain rate reveal that Young’s modulus, E2 (see Figure 14) for all adhesives decreased with increasing strain rate contrary to expectations [28,32,33,34,54,55]. Based on the slopes of the linear regression lines, Young’s modulus, E2, for adhesive 1 had the highest sensitivity to strain rate followed by adhesive 4 and adhesive 2, respectively. Young’s modulus for adhesive 3 was found less sensitive to the strain rate.

5.3. Comparison with SHPB Tests

Time versus strain values obtained with SHPB tests were used to calculate elastic limit (yield) strains and strain rates. As it can be seen in Figure 16, the data shows multiple yield points and the elastic limit strains at these points were obtained. Time at slope changes were recorded for each adhesive specimen. R1 and R2 indicate the strain rates at 1st and 2nd slopes, respectively (Table 5). These values can be obtained both from the slope of time–strain line and the software used. Max strain rates were also recorded to compare specimens at different max strain rates.
Contrary to the softening behavior seen in modulus after the first elastic limit during the tensile tests (θ1, Figure 14), compressive loading in SHPB tests results in an increase in elastic modulus after θ1 (ε1) is reached (Figure 16). This is because, subsequent to the strain hardening process of organic components in the 0 ≤ tt1 range (Figure 16), the applied load is mostly transferred to the inorganic components which have high elastic moduli. In fact, this process continues throughout the SHPB impact tests with increasing slope for the whole stress–strain diagram, as shown for adhesive 3 in Figure 17. An important aspect to note in Figure 17 is the high magnitude of stresses in comparison to those observed during the tensile tests (Figure 12). This observation reveals that adhesive layers subjected to impact loads during an automobile crash event will be transferring the impact loads to other parts of the structure (such as the chassis) which are likely to be more efficient in absorbing high energy.
As for the softening behavior of the elastic moduli at higher strain rates observed during tensile testing (E2, Figure 15), similar behavior is also observed with SHPB testing as shown in Figure 18 for the 0 ≤ tt1 range (E2, Figure 16). It is remarkable that, overall, the modulus magnitudes seem to be similar between the tensile test and SHPB specimens.

5.4. Determination of Rate Dependent Parameters of the Bilinear-Viscoelastic Model for Tensile Loading

As shown in Figure 19, the solid viscosity, μ, decreased with increasing strain rate for all structural adhesives studied. Equation (10) was used to calculate the μ values. The fitted elastic limit strains (using equation similar to Equation (8)), ε2 shown in Figure 20 for the second elastic region (corresponding to θ2, Figure 14) were used for this purpose.
As shown in Figure 21, the average values of maximum stress, σMax (Figure 14), increased with increasing strain rate for all structural adhesives. Adhesive 1 was judged to have the highest maximum stress value followed by adhesive 2 (based on the slope of its regression line, Equation (8)). Adhesive 4 exhibited nearly constant σMax value which should be exceeded by both adhesive 2 and adhesive 3 if the strain rate is further increased.
Figure 22 shows the average failure strain values for the adhesives as a function of strain rate along with linear regression lines (similar to Equation (8)) in order to predict adhesives’ failure strain behavior at higher strain rates. The results reveal that only the failure strain of adhesive 4 decreased with increasing strain rate. The rest of the adhesives showed positive increments with strain rate.

5.5. Rate Dependence of Adhesive Toughness

Toughness, ΣUn, of the structural adhesives is calculated as the area under stress (σ)–strain (ε) curve, and Un is determined with the formula:
Un = (σn+ σn+1) (Δε/2)
We first note that the toughness range of ~0.5 to ~1.35 MJ/m3 we observed in Figure 23 for the 1st Phase model adhesives of this study, tested within the ~3 × 10⁻³ to 0.18 m/m/s strain rate range, compares favorably with the toughness range of ~0.05 to ~0.3 MJ/m3 we observed for Narmco Whittaker’s 100-percent solids modified, rubber toughened epoxy film adhesive with a synthetic carrier cloth (Metlbond 1113) tested within the ~5 × 10⁻⁶ to 8 × 10⁻³ m/m/s strain rate range [56].
An empirical relationship between the logarithm of strain rate, dε/dt, and toughness is also calculated with the following linear regression function in which A and B indicate the slope and intercept, respectively (similar to Equation (8)):
ΣUn = A*Log(dε/dt) + B
Strain rate of the experiments were calculated from the elastic part of the strain–time curve obtained through strain gages. First, strain rate for each time point was calculated, and average value of the calculated strain rates were recorded as experiment’s strain rate.
Average toughness–strain rate behaviors of the model adhesives shown in Figure 23 reveal that adhesive 1 has the lowest toughness at the lowest strain rate, but it also has the highest slope in its regression line, indicating it to be the most desirable adhesive for impact applications. It is interesting to note that, all adhesives used in first phase contained elastomeric tougheners in the form of carboxyl terminated butadiene acrylonitrile (CTBN) copolymer, as well as polyurethane adducts besides inorganic fillers except for adhesive 1. Only adhesive 1 used in first phase included just inorganic fillers.
Adhesive 2 should be considered the next best impact resistant adhesive with its second highest regression line-slope. We note that adhesives 1 and 2 had high inorganic filler contents with 25.48 wt % and 26.29 wt %, respectively. In addition to calcite, which was present in all adhesives, the presence of wollastonite was confirmed for both adhesive 1 and adhesive 2 in XRD spectra and as given in the MSDS. Another phase that was found in the adhesive 1 was zeolite which is a form of alumina silicate. The presence of talc was also confirmed for adhesive 2.
Adhesive 3 has low toughness values, but positive slope, which makes it an acceptable impact adhesive. It had 18.99 wt % inorganic filler content, which is lower than those for adhesives 1 and 2. Adhesive 3 contained talc and zeolite in addition to calcite.
Adhesive 4 has the highest toughness for the strain rate range shown;, but its toughness seems to be fairly constant (i.e., rate independent), which is an undesirable feature for an impact resistant adhesive. It contained the least amount of inorganic fillers with 14.72 wt %, which was made up of calcite, talc zeolite and calcium silicate.
We note that the above discussions are made based on the bulk material (cohesive) behavior of the adhesives and the bonded (adhesive) behavior of these materials need to be considered next to make accurate assessment on the high-rate (impact) behavior of these novel crash resistant adhesives when bonding automotive steel substrates in typical lap joint configuration. It is known that cohesive failures typically transition to interfacial (adhesive) failure mode at higher loading rates since the bulk adhesive material continues to preserve at least some of its viscoelastic behavior even in the presence of substantial volume fraction of inorganic fillers [57], for example, up to 27.59 wt % for Phase 2 adhesive 3 of this work. Consequently, rate dependence of adhesive toughness will be discussed for the bonded single lap configuration next.

5.6. Bonded Single Lap Shear Testing of 1st Phase Adhesives

Figure 24 compares the average bonded shear toughness as a function of shear strain rate for 1st Phase adhesives: adhesive 1, adhesive 2, adhesive 3 and adhesive 4, along with their linear regression lines (similar to Equation (8)).
When the results from bulk (tensile) and bonded (shear) specimens are compared, it is clearly seen that the toughness responses of the adhesives to (tensile/shear) strain rates in the bulk and bonded forms, respectively, are different. Comparison of Figure 24 (bonded shear) and Figure 23 (bulk tensile) reveals that the shear toughness values in the bonded form are remarkably higher than those for the bulk tensile specimens with the bonded shear toughness values in the ~25 to ~120 MJ/m3 range within ~1.25 to ~25 mm/mm/s shear strain range in comparison to ~0.5 to ~1.35 MJ/m3 within the ~3 × 10⁻³ to 0.18 m/m/s strain rate range for the 1st Phase adhesives tested in bulk tensile mode. This difference is due to the remarkable increase in the failure strain values for the model adhesives when tested in the bonded single lap shear configuration as comparison of Figure 25 (bonded shear) and Figure 22 (bulk tensile) reveals. We note that Sancaktar and Brinson also observed larger strains during bulk shear testing of structural epoxy adhesives, in comparison to those observed during bulk tensile testing of the same adhesives [32]. It should also be noted that comparison of maximum stress values obtained from the bulk tensile and bonded single lap shear testing of Phase 1 model adhesives of the current study does not reveal large differences to affect the calculation of the corresponding toughness values, whereas the failure strain values do.
Average shear toughness values observed in Figure 24 revealed that adhesive 4 has the highest toughness in all shear strain rates followed by adhesive 1. Adhesive 2 had the lowest shear toughness at the lowest shear strain rate, while the lowest shear toughness was obtained with adhesive 3 at the highest shear strain rate. When the slopes of linear regression lines are compared, all adhesives toughness variations have a positive tendency with shear strain rate. Adhesive 4 has the highest slope. Thus, it can be predicted that adhesive 4 will have the best toughness value if the shear strain rate is increased further. We note that results from the bulk (tensile) specimens revealed that adhesive 4 had the highest toughness for the tensile strain rate range used; but its toughness seemed to be nearly constant (i.e., rate independent). Adhesive 1 had the lowest toughness at the lowest tensile strain rate, but it also had the highest slope in its regression line, indicating it to be the most desirable adhesive for impact applications based on tensile results. We also note that this adhesive (adhesive 1) included just inorganic fillers.
Figure 26 shows the lap shear failure surfaces of adhesive 4 at 25 mm/min, 100 mm/min and 500 mm/min extension rates, as obtained by optical microscopy. At the slower extension rate of 25 mm/min, both cohesive and adhesives failures were observed. At higher extension rates, 100 mm/min and 500 mm/min, both cohesive and adhesive failures were observed, nevertheless at the highest rate, 500 mm/min, the failure surfaces were more homogenous compared to the failure surfaces observed at lower extension rates.
More detailed views of the lap shear failure surfaces of adhesive 4 were obtained using SEM as shown in Figure 27. Transition in failure morphology is clearly seen as the extension rate is increased from 25 mm/min to 500 mm/min. A reduction in morphologic pattern size is observed along with separation and better definition of the morphologic pattern in the form of directionally stretched nodules when the extension rate is increased from 25 mm/min to 500 mm/min. The cohesive deformation/failure processes indicate interfacial separations, inter-particle interactions as well as polymer matrix deformation as the extension rate increases.
Figure 28 shows the lap shear failure surfaces of adhesive 1 at 25 mm/min, 100 mm/min and 500 mm/min extension rates, as obtained by optical microscopy. At the extension rates of 25 mm/min and 100 mm/min there were limited interfacial failure areas, however the dominant failure mode was cohesive failure. When the extension rate increased further, transition to interfacial (adhesive) failure was observed. This cohesive to adhesive failure transition can be attributed to polymer adhesive molecules not being able to disentangle and flow but remaining intertwined like a coherent elastic solid at higher strain rates [58]. It is interesting to note the angular (shear)-type of failure planes throughout the adhesive layer indicating brittle slip action in between planes defined by oriented inorganic particles as well as between the adhesive and the adherend. Perhaps the most remarkable observation from the lap shear failure surfaces of adhesive 1 in consideration of the corresponding toughness values (Figure 24) is the fact that interfacial failures do not necessarily diminish adhesive bond toughness.
More detailed views of the lap shear failure surfaces of adhesive 1 were obtained using SEM as shown in Figure 29. Rather deep fissures are observed at both 25 mm/min and 500 mm/min extension rates revealing the effect of locally oriented stresses on the agglomerates of inorganic particles. This failure pattern does not seem to change significantly as the extension rate is increased from 25 mm/min to 500 mm/min.
Figure 30 shows the lap shear failure surfaces of adhesive 2 at 25 mm/min, 100 mm/min and 500 mm/min extension rates, as obtained by optical microscopy. From the optical microscope images, it can be seen that homogenous failure occurred at all extension rates used. The presence of adhesives on both substrates confirmed that cohesive failure was the failure type for adhesive 2 at all extension rates.
More detailed views of the lap shear failure surfaces of adhesive 2 were obtained using SEM as shown in Figure 31. Failure surfaces resulting from 25 mm/min and 500 mm/min extension rates reveal homogeneous and similar failure mechanism without distinct features. Lack of extensive failure processes within the adhesive composite may be the reason for adhesive 2 to provide toughness values lower than those for adhesives 4 and 1 (Figure 24).
In summary, failure surface observations revealed that the model adhesive which included just inorganic fillers (adhesive 1) and had the lowest tensile toughness at the lowest tensile strain rate, but the highest slope in its tensile toughness regression line, exhibited the second highest bonded shear toughness. When tested at the extension rates of 25 mm/min and 100 mm/min in bonded lap shear, the same adhesive exhibited limited interfacial failure areas, however the dominant failure mode was cohesive failure. When the extension rate increased further, transition to interfacial (adhesive) failure was observed revealing that interfacial failures do not necessarily diminish adhesive bond toughness. The amount of inorganic fillers in this adhesive was 25.48 wt %, which may be the reason for the presence of interfacial (adhesive) failures. The adhesive with the highest shear toughness values when tested in bonded form and had 14.72 wt % inorganic fillers (adhesive 4) exhibited cohesive deformation/failure processes indicating interfacial separations, inter-particle interactions as well as polymer matrix deformation as the extension rate increased. Both cohesive and adhesive failure areas were observed with this adhesive, nevertheless at the highest rate of 500 mm/min the failure surfaces were more homogenous compared to the failure surfaces observed at lower extension rates, as well as in comparison to adhesive 1. This observation points to the fact that cohesive deformation/failure processes indicating interfacial separations, inter-particle interactions as well as polymer matrix deformation in high deformation loading scenario as in bonded shear loadings may provide the highest toughness. Apparently, a large filler weight fraction is not necessary to obtain high shear toughness in bonded form since adhesive 4 had the least amount of inorganic fillers among the model adhesives with 14.72 wt %.

6. Summary and Conclusions

Physical properties of eight different toughened structural adhesives were determined to develop a phenomenological viscoelastic model using classical spring, dashpot and irreversible slider as well as Ludwik-type equations to describe the observed mechanical behavior—and to be able to predict performance of impact-resistant tough epoxy structural adhesives. Adhesive materials were characterized by X-ray diffraction (XRD), differential thermal analysis (DTA), thermogravimetric analysis (TGA), scanning electron microscope (SEM) and energy dispersive x-ray spectrometer (EDS). Our experimental and analytical results led us to make the following conclusions.
  • When the change in the mass (during TGA tests) of the impact-resistant adhesives were compared for the first phase of this study (involving bulk tensile tests at different crosshead rates using a universal testing machine), it was seen that adhesive 2 had the highest amount of inorganic fillers with a 26.29 wt % residual amount of weight, whereas adhesive 4 had the least amount of inorganic fillers with 14.72 wt % residual amount of weight. The important common observation from all DTA curves of adhesives 1–4 is the fact that a large amount of energy was absorbed beyond mid six-hundred degrees centigrade through processes involving decomposition of weakly crystalline calcite followed by the decomposition of well crystallized calcite. Prior to and during these processes, energy was also absorbed by decarbonation occurring due to the decomposition of carbonates and loss of carbon dioxide from calcite.
  • When the change in the mass of adhesives were compared for the second phase of this study (involving impact tests using a split Hopkinson pressure bar (SHPB) apparatus at high strain rates), it was seen that adhesive 3 had the highest amount of inorganic fillers with 27.59 wt % residual amount of weight whereas adhesive 5 had the least amount of inorganic fillers with a 17.48 wt % residual amount of weight. As in the case of Phase 1 adhesives, the important common observation from all DTA curves of Phase 2 adhesives is the fact that a large amount of energy was absorbed at higher temperatures (>700 °C) through processes involving decomposition of weakly crystalline calcite followed by the decomposition of well crystallized calcite. Prior to and during these processes, energy was also absorbed by decarbonation occurring due to the decomposition of carbonates and loss of carbon dioxide from calcite.
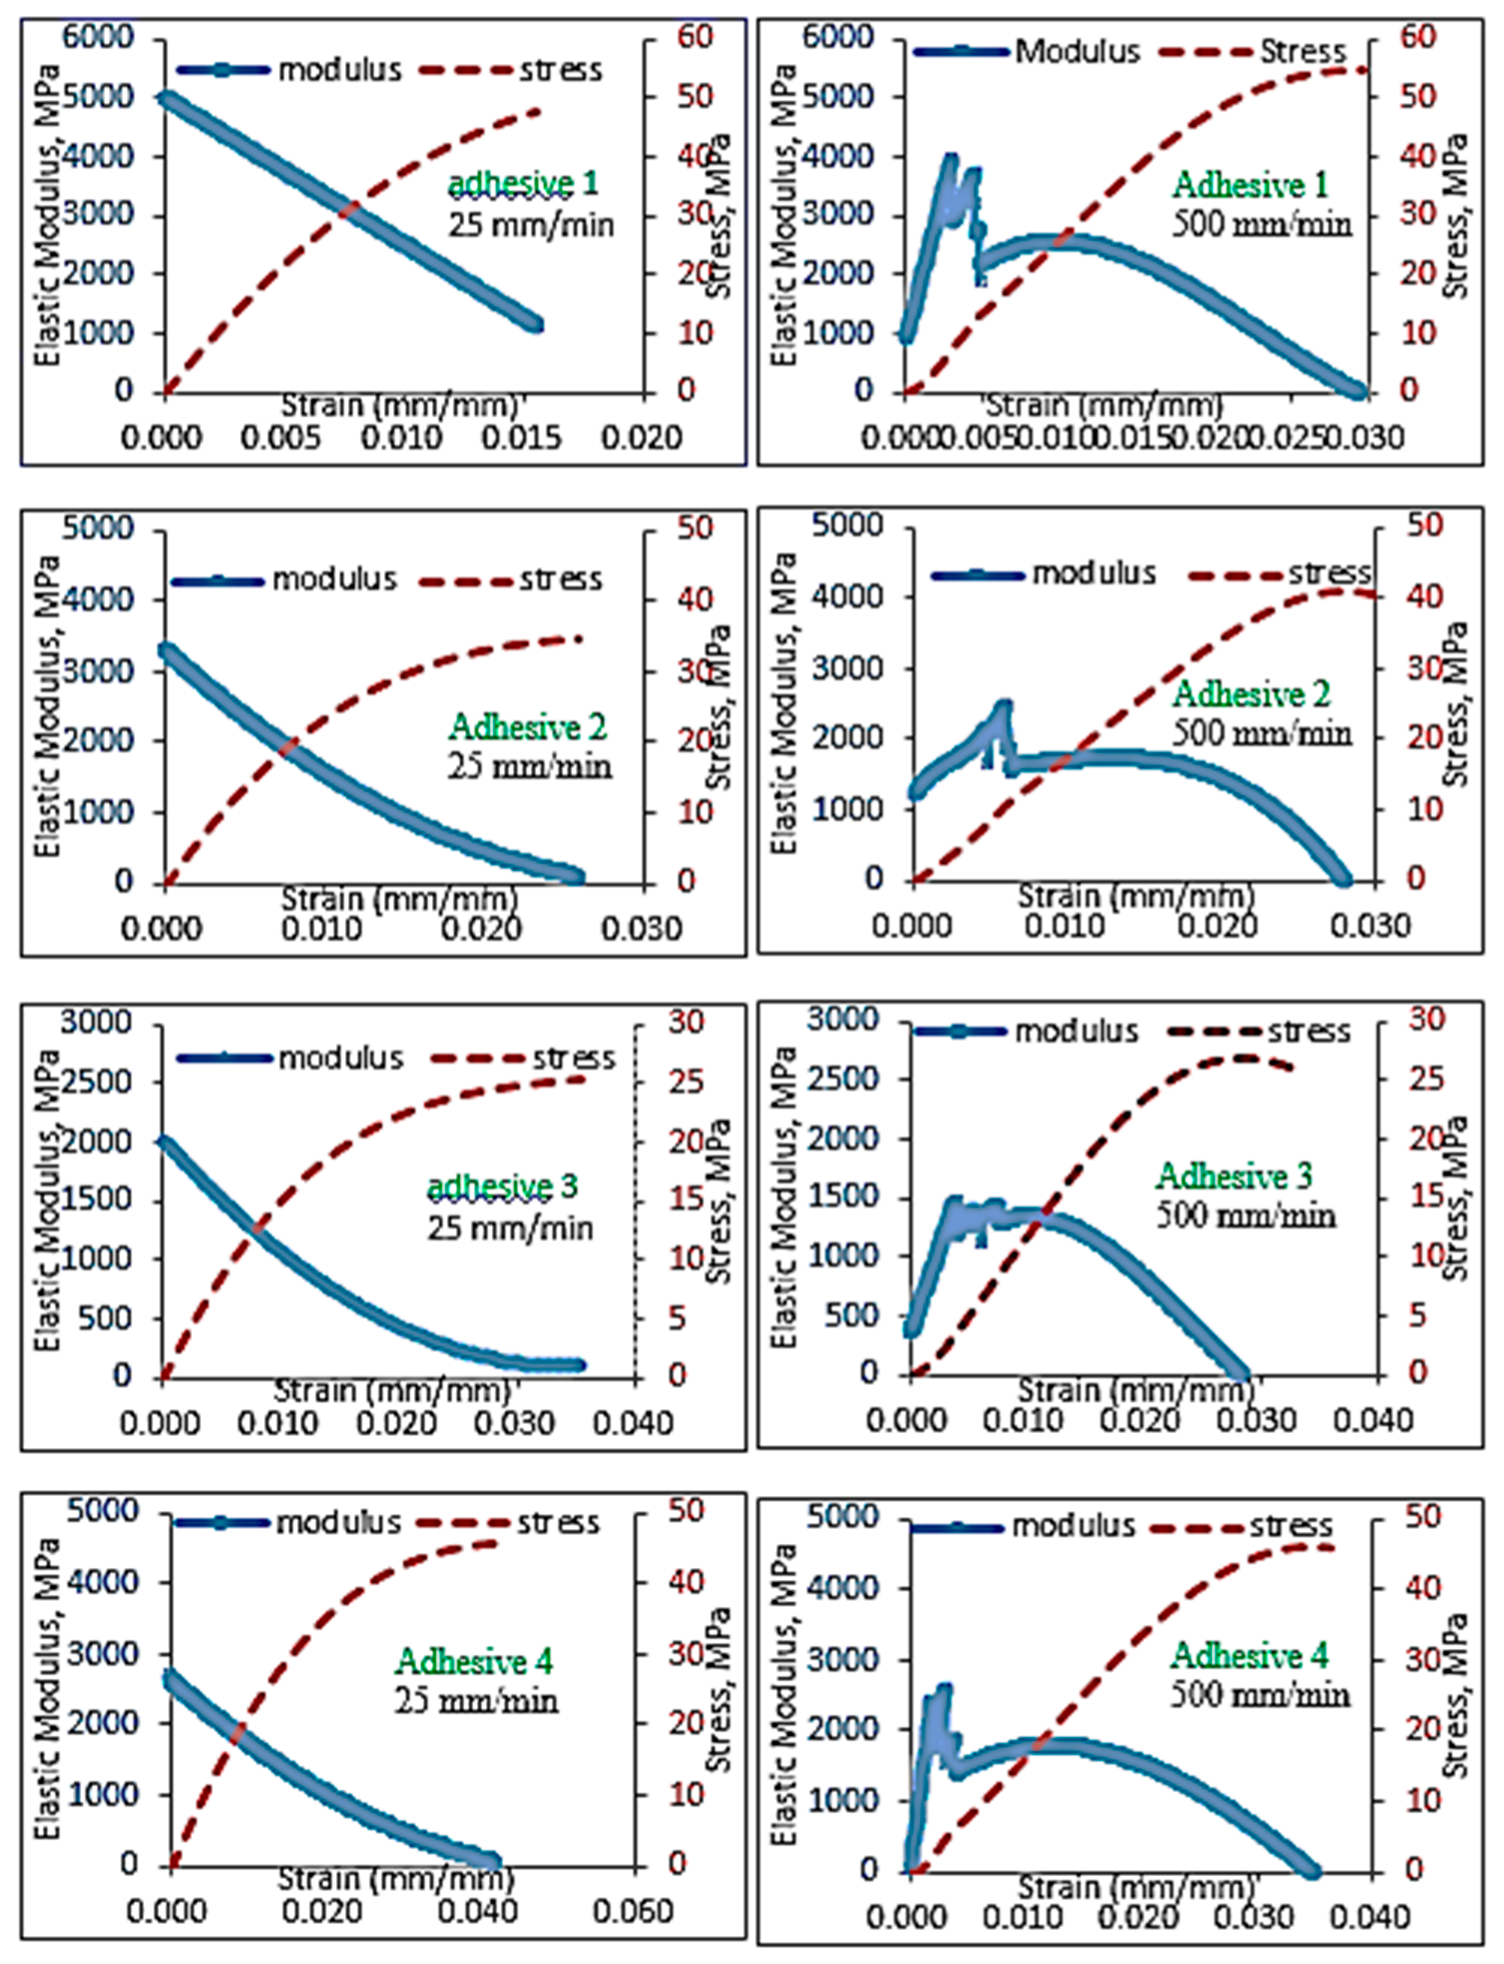
  • The bulk tensile stress–strain data for the impact-resistant adhesives revealed that the initial elastic behavior at 500 mm/min extension rate was bilinear. In order to represent this initial bilinear elastic behavior, modification of the modified Bingham model to a new bilinear-viscoelastic model was proposed. Thus, equivalent elastic moduli, E1 and E2 were introduced which individually represented the elastic behavior of the toughened adhesive materials in composite morphologic form. The tensile data revealed that Young’s modulus, E2 for all adhesives decreased with increasing strain rate and similar behavior was also observed with split Hopkinson pressure bar (SHPB) testing. Remarkably, the modulus magnitudes seem to be similar between the tensile test and SHPB specimens.
  • Based on the slopes of the Ludwik-type linear regression lines for the tensile stress–strain data, Young’s modulus, E2, for adhesive 1 had the highest sensitivity to strain rate followed by adhesive 4 and adhesive 2, respectively. Young’s modulus for adhesive 3 was found less sensitive to the strain rate.
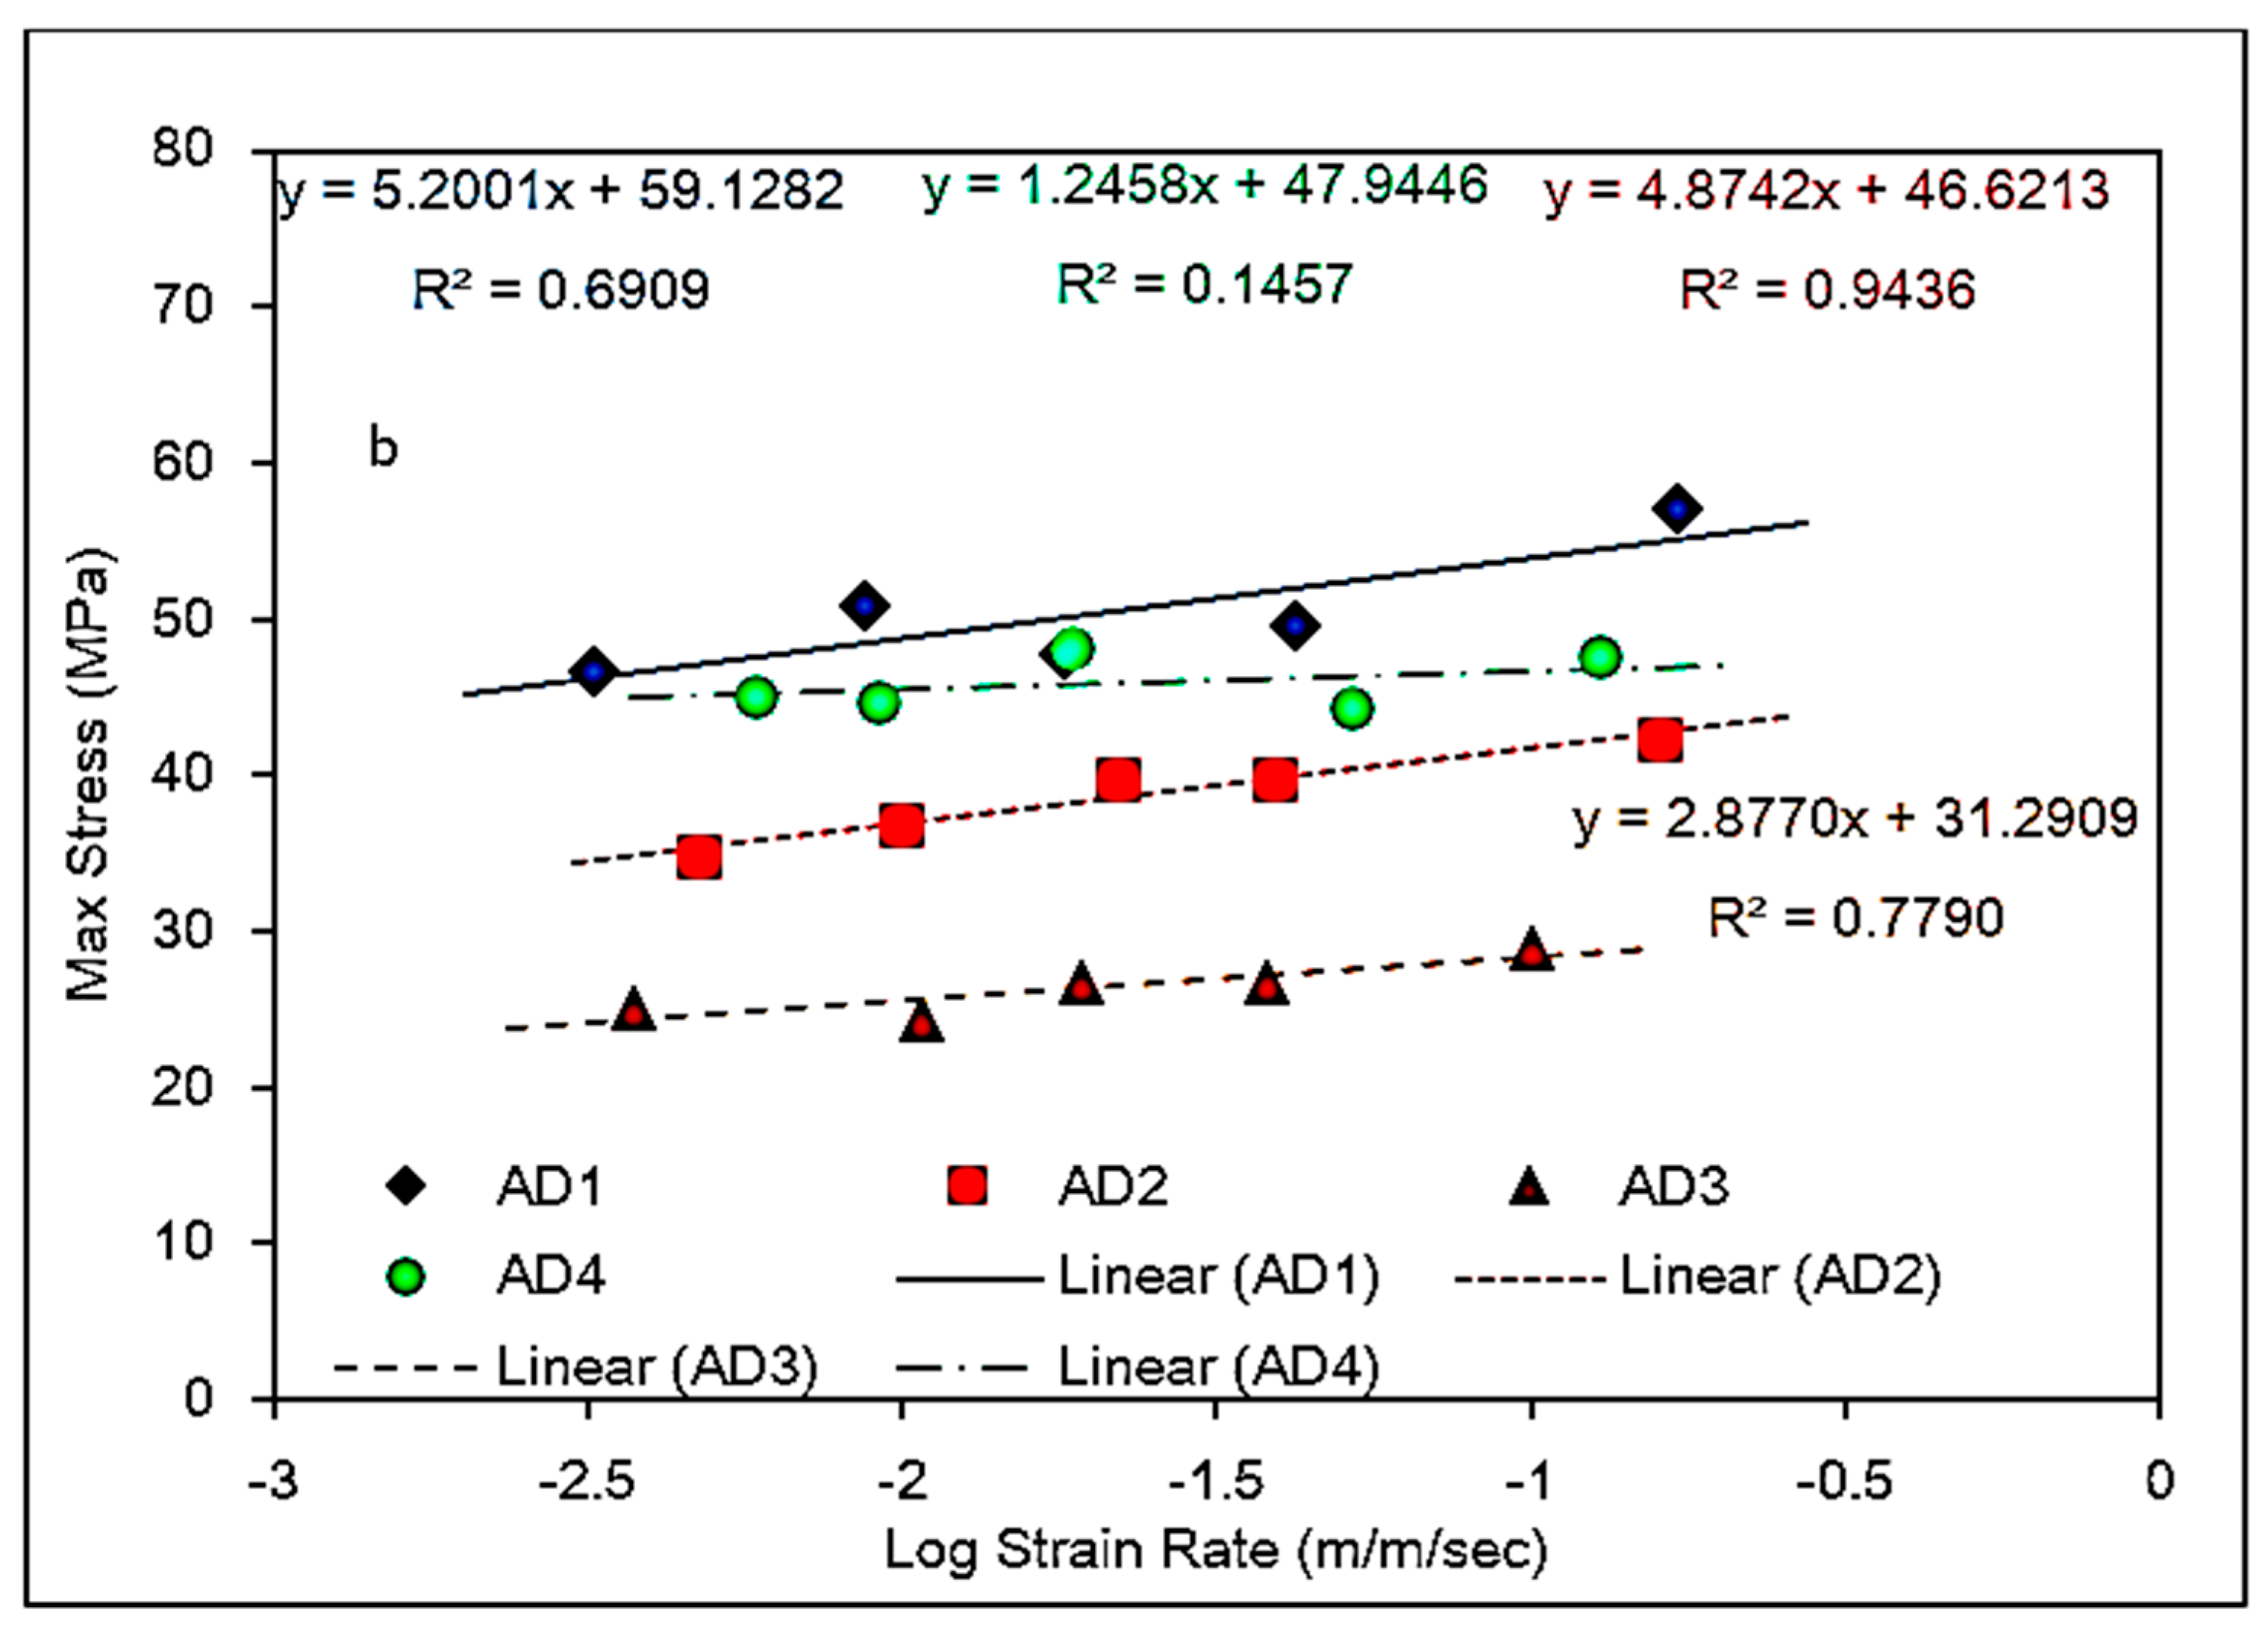
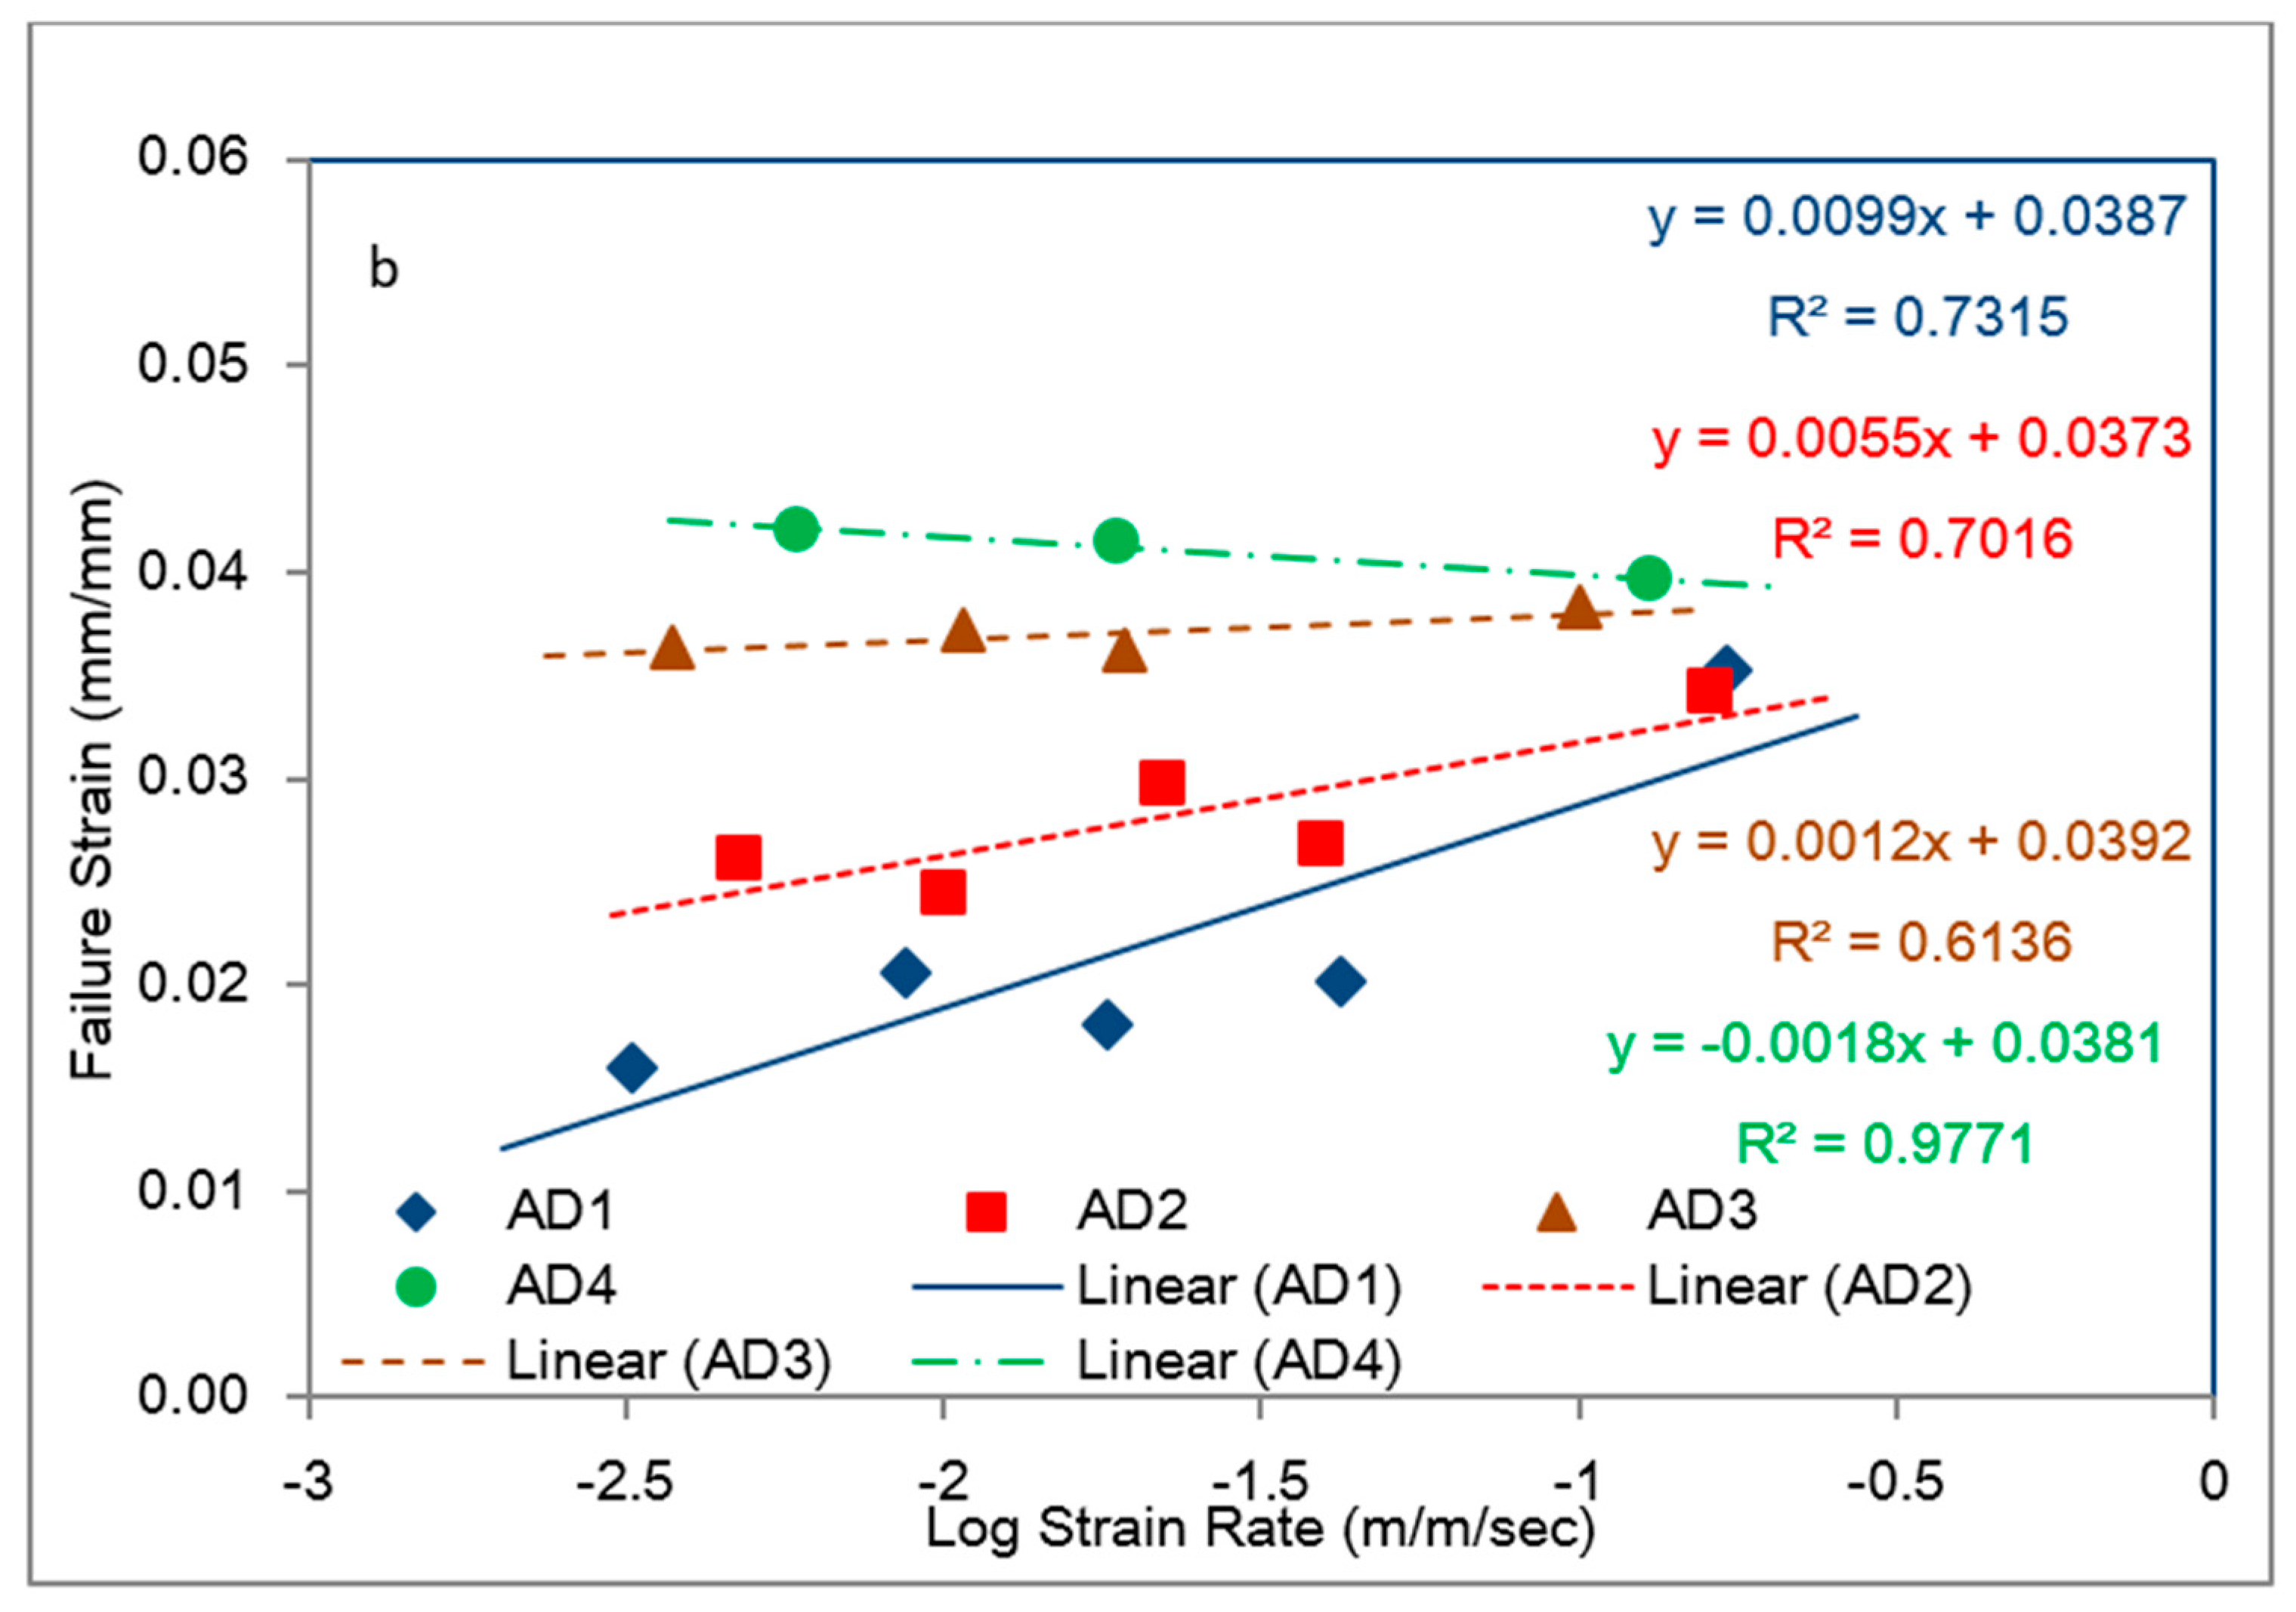
  • The average toughness–strain rate behaviors of the model adhesives revealed that adhesive 1 had the lowest toughness at the lowest strain rate, but it also had the highest slope in its regression line, indicating it to be the most desirable adhesive for impact applications. It is interesting to note that, all adhesives used in first phase contained elastomeric tougheners in the form of carboxyl terminated butadiene acrylonitrile (CTBN) copolymer, as well as polyurethane adducts besides inorganic fillers except for adhesive 1. Only adhesive 1 used in first phase included just inorganic fillers. Adhesive 4 had the highest toughness for the strain rate range shown, but its toughness seems to be fairly constant (i.e., rate independent), which is an undesirable feature for an impact resistant adhesive. It contained the least amount of inorganic fillers with 14.72 wt %, which was made up of calcite, talc zeolite and calcium silicate.
  • When the results from bulk (tensile) and bonded (shear) specimens were compared, it was clearly seen that the toughness responses of the adhesives to (tensile/shear) strain rates in the bulk and bonded forms, respectively, were different. The shear toughness values in the bonded form were remarkably higher than those for the bulk tensile specimens with the bonded shear toughness values in the ~25 to ~120 MJ/m3 range within ~1.25 to ~25 mm/mm/s shear strain range in comparison to ~0.5 to ~1.35 MJ/m3 within the ~3 × 10⁻³ to 0.18 m/m/s strain rate range for the 1st Phase adhesives tested in bulk tensile mode. This difference was due to the remarkable increase in the failure strain values for the model adhesives when tested in the bonded single lap shear configuration.
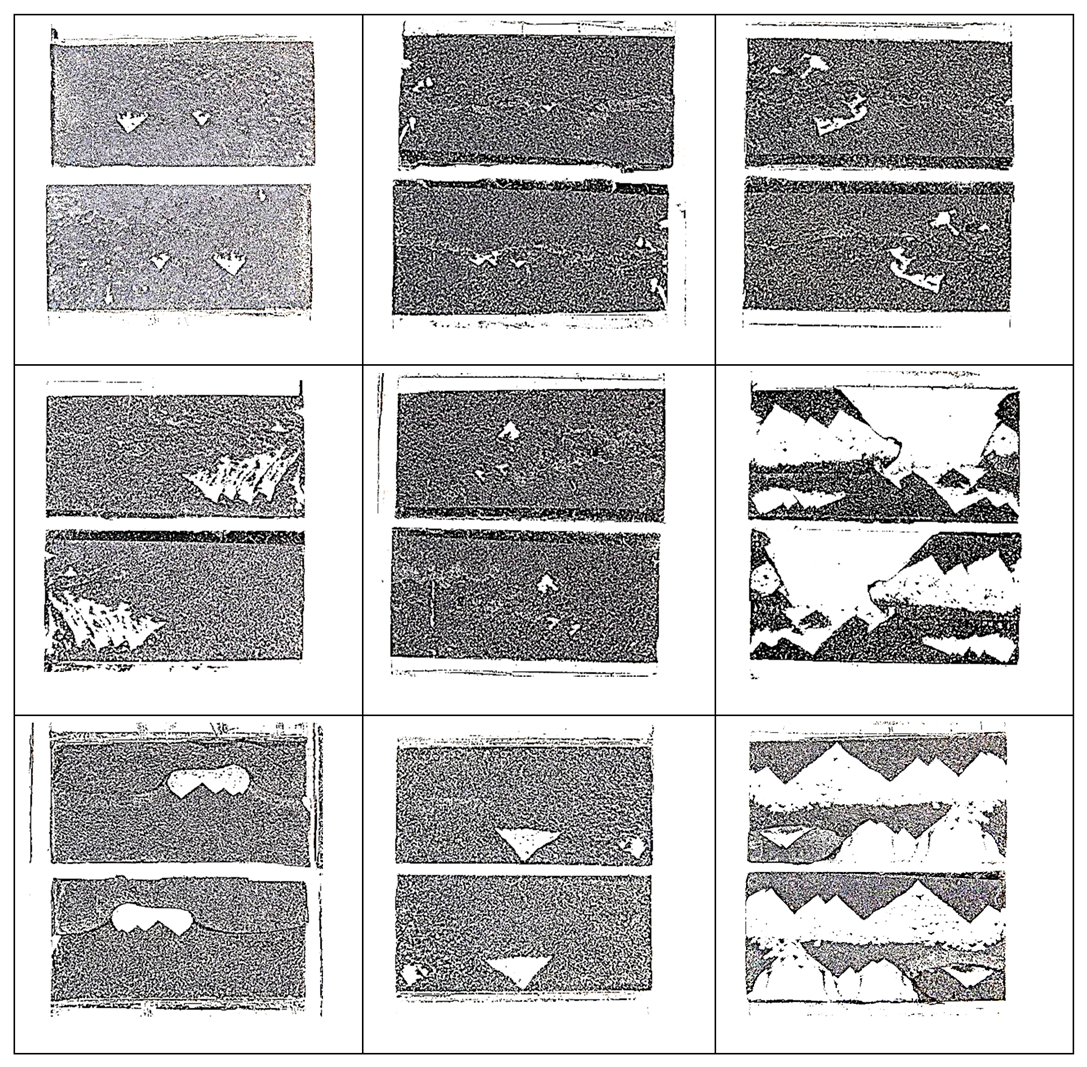
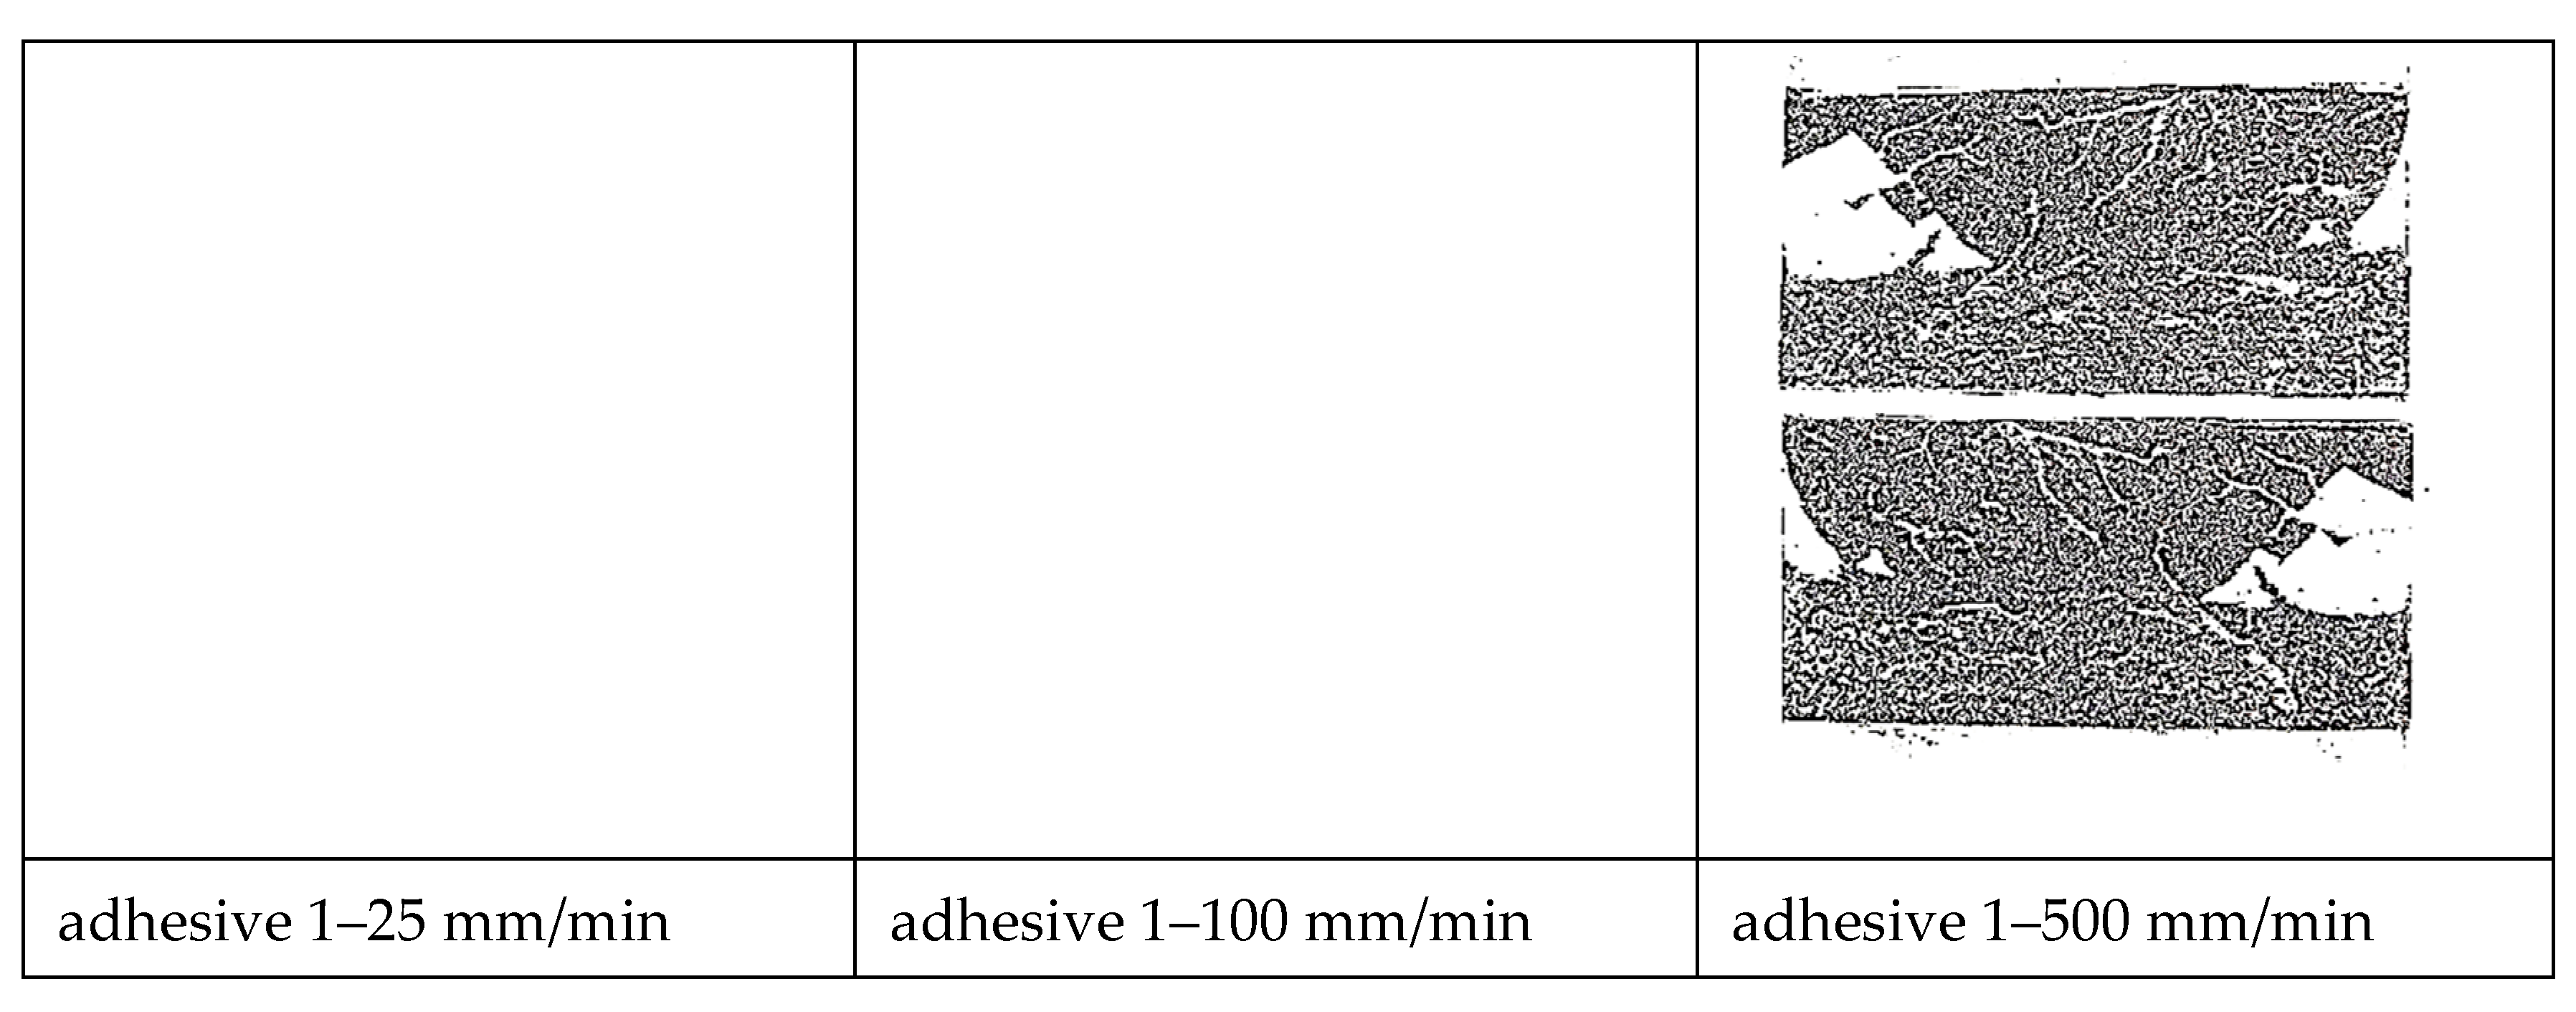
  • Based on bonded lap shear data, adhesive 4 had the highest toughness in all shear strain rates followed by adhesive 1. Failure surface observations revealed that the model adhesive which included just inorganic fillers (adhesive 1) and had the lowest tensile toughness at the lowest tensile strain rate, but the highest slope in its tensile toughness regression line, exhibited the second highest bonded shear toughness. When tested at the extension rates of 25 mm/min and 100 mm/min in bonded lap shear, the same adhesive exhibited limited interfacial failure areas, however the dominant failure mode was cohesive failure. When the extension rate increased further, transition to interfacial (adhesive) failure was observed revealing that interfacial failures do not necessarily diminish adhesive bond toughness.
  • Thus, our observations point to the fact that cohesive deformation/failure processes indicating interfacial separations, inter-particle interactions as well as polymer matrix deformation in high deformation loading scenario as in bonded shear loadings may provide the highest toughness. Apparently, a large filler weight fraction was not necessary to obtain high shear toughness in bonded form since adhesive 4 had the least amount of inorganic fillers among the model adhesives with 14.72 wt %.

Author Contributions

E.S. conceived the idea, constructed the methodology, obtained funding, wrote and finalized the current version of the manuscript; G.S.B. established the details of the methodology, performed the experiments, analyzed and documented the results and wrote the initial version of the manuscript. All authors have read and agreed to the published version of the manuscript.

Funding

This research was funded by Honda R&D Americas, Inc., grant number [540742].

Conflicts of Interest

The authors declare no conflict of interest.

References

  1. Available online: https://www.epa.gov/regulations-emissions-vehicles-and-engines/final-rule-model-year-2017-and-later-light-duty-vehicle (accessed on 1 May 2020).
  2. Thryft, A.R. Automotive Structural Adhesives Drive Material Changes. Des. News 2014. Available online: https://www.designnews.com/materials-assembly/automotive-structural-adhesives-drive-material-changes/60752819443699 (accessed on 1 May 2020).
  3. Chang, B.; Shi, Y.; Dong, S. Comparative studies on stresses in weld-bonded, spot-welded and adhesive-bonded joints. J. Mater. Process. Technol. 1999, 87, 230–236. [Google Scholar] [CrossRef]
  4. Tao, W.; Ma, Y.; Chen, Y.; Li, L.; Wang, M. The influence of adhesive viscosity and elastic modulus on laser spot weld bonding process. Int. J. Adhes. Adhes. 2014, 51, 111–116. [Google Scholar] [CrossRef]
  5. Chang, B.; Shi, Y.; Lu, L. Studies on the stress distribution and fatigue behavior of weld-bonded lap shear joints. J. Mater. Process. Technol. 2001, 108, 307–313. [Google Scholar] [CrossRef]
  6. Real Time Traffic Accident Statistics. Available online: http://www.icebike.org/real-time-traffic-accident-statistics/ (accessed on 1 May 2020).
  7. Korosec, K. 2016 Was the Deadliest Year on American Roads in Nearly a Decade. Fortune February 15 2017. Available online: https://fortune.com/2017/02/15/traffic-deadliest-year/ (accessed on 1 May 2020).
  8. Dunn, D.J. Engineering and Structural Adhesives; iSmithers Rapra Publishing: Akron, OH, USA, 2004; Volume 15. [Google Scholar]
  9. Dillard, D.A. Advances in Structural Adhesive Bonding; Elsevier BV: Amsterdam, The Netherlands, 2010. [Google Scholar]
  10. Hartshorn, S.R. Structural Adhesives: Chemistry and Technology; Springer Science & Business Media: New York, NY, USA, 2012. [Google Scholar]
  11. Adams, R.D.; Wake, W.C. Structural Adhesive Joints in Engineering; Springer Science and Business Media LLC: New York, NY, USA, 1984. [Google Scholar]
  12. Moreira, P.M.; da Silva, L.F.M.; Castro, P.M.S.T. Structural Connections for Lightweight Metallic Structures; Springer: New York, NY, USA, 2012. [Google Scholar]
  13. da Silva, L.F.; Öchsner, A.; Adams, R.D. Handbook of Adhesion Technology; Springer Science & Business Media: New York, NY, USA, 2011. [Google Scholar]
  14. Skeist, I. Handbook of Adhesives; Springer Science & Business Media: New York, NY, USA, 2012. [Google Scholar]
  15. Durig, J.D. Comparisons of epoxy technology for protective coatings and linings in wastewater facilities. J. Prot. Coat. Linings 2000, 17, 49–54. [Google Scholar]
  16. Epoxy Resins Product Overview Dow Chemical Company. Available online: https://www.dow.com/en-us/search.html?q=epoxy%20resins&t_s=1591158736417&tab=products (accessed on 1 May 2020).
  17. Kinloch, A. Toughening epoxy adhesives to meet today’s challenges. MRS Bull. 2003, 28, 445–448. [Google Scholar] [CrossRef] [Green Version]
  18. Zhai, L.; Ling, G.; Li, J.; Wang, Y. The effect of nanoparticles on the adhesion of epoxy adhesive. Mater. Lett. 2006, 60, 3031–3033. [Google Scholar] [CrossRef]
  19. Gerson, A.L.; Bruck, H.; Hopkins, A.R.; Segal, K.N. Curing effects of single-wall carbon nanotube reinforcement on mechanical properties of filled epoxy adhesives. Compos. Part A Appl. Sci. Manuf. 2010, 41, 729–736. [Google Scholar] [CrossRef]
  20. May, M.; Wang, H.; Akid, R. Effects of the addition of inorganic nanoparticles on the adhesive strength of a hybrid sol–gel epoxy system. Int. J. Adhes. Adhes. 2010, 30, 505–512. [Google Scholar] [CrossRef]
  21. Jojibabu, P.; Ram, G.J.; Deshpande, A.P.; Bakshi, S.R. Effect of carbon nano-filler addition on the degradation of epoxy adhesive joints subjected to hygrothermal aging. Polym. Degrad. Stab. 2017, 140, 84–94. [Google Scholar] [CrossRef]
  22. Jacobs, O.; Xu, W.; Schadel, B.; Wu, W. Wear behaviour of carbon nanotube reinforced epoxy resin composites. Tribol. Lett. 2006, 23, 65–75. [Google Scholar] [CrossRef]
  23. Dudkin, B.N.; Zainullin, G.G.; Krivoshapkin, P.V.; Krivoshapkina, E.F.; Ryazanov, M.A. Influence of nanoparticles and nanofibers of aluminum oxide on the properties of epoxy composites. Glas. Phys. Chem. 2008, 34, 187–191. [Google Scholar] [CrossRef]
  24. Ellis, B. Chemistry and Technology of Epoxy Resins; Springer: New York, NY, USA, 1993. [Google Scholar]
  25. Katz, H.S.; Mileski, J. Handbook of Fillers for Plastics; Springer Science & Business Media: New York, NY, USA, 1987. [Google Scholar]
  26. Xian, G.; Walter, R.; Haupert, F. Comparative study of the mechanical and wear performance of short carbon fibers and mineral particles (Wollastonite, CaSiO3) filled epoxy composites. J. Polym. Sci. Part B Polym. Phys. 2006, 44, 854–863. [Google Scholar] [CrossRef]
  27. Sancaktar, E. Mechanical Behavior of Solid Film Adhesives with Scrim Carrier Cloths. In Modulated Structure Materials; Springer Science and Business Media LLC: New York, NY, USA, 1984; pp. 567–581. [Google Scholar]
  28. Brinson, H.F.; Brinson, L.C. Polymer Engineering Science and Viscoelasticity; Springer Science and Business Media LLC: New York, NY, USA, 2008. [Google Scholar]
  29. Duncan, B.; Dean, G. Measurements and models for design with modern adhesives. Int. J. Adhes. Adhes. 2003, 23, 141–149. [Google Scholar] [CrossRef]
  30. White, B.W. Microstructure and Strain Rate Effects on the Mechanical Behavior of Particle Reinforced Epoxy-Based Reactive Materials. Master’s Thesis, Georgia Inst. of Tech, School of Materials Science and Engineering, Atlanta, GA, USA, 2011. [Google Scholar]
  31. Brinson, H.F.; Dasgupta, A. The strain-rate behavior of ductile polymers. Exp. Mech. 1975, 15, 458–463. [Google Scholar] [CrossRef]
  32. Sancaktar, E.; Brinson, H.F. The Viscoelastic Shear Behavior of a Structural Adhesive. In Adhesion and Adsorption of Polymers; Springer Science and Business Media LLC: New York, NY, USA, 1980; pp. 279–299. [Google Scholar]
  33. Brinson, H.; Renieri, M.; Herakovich, C. Rate and Time Dependent Failure of Structural Adhesives. In Fracture Mechanics of Composites; ASTM International: New York, NY, USA, 2009; p. 177. [Google Scholar]
  34. Renieri, M.P.; Herakovich, C.T.; Brinson, H.F. Rate and Time Dependent Behavior of Structural Adhesives. Ph.D. Thesis, Virginia Polytechnic Institute and State University, Blacksburg, VA, USA, 1976. [Google Scholar]
  35. Schenck, S.; Sancaktar, E. Material Characterization of Structural Adhesives in the Lap Shear Mode. Master’s Thesis, Clarkson University, Potsdam, NY, USA, 1983. [Google Scholar]
  36. Sancaktar, E.; Schenck, S.C.; Padgilwar, S. Material characterization of structural adhesives in the lap shear mode. 1. The effects of rate. Ind. Eng. Chem. Prod. Res. Dev. 1984, 23, 426–434. [Google Scholar] [CrossRef]
  37. Sancaktar, E. Material characterization of structural adhesives in the lap shear mode. Int. J. Adhes. Adhes. 1985, 5, 66–68. [Google Scholar] [CrossRef] [Green Version]
  38. Morin, D.; Haugou, G.; Bennani, B.; Lauro, F. Identification of a new failure criterion for toughened epoxy adhesive. Eng. Fract. Mech. 2010, 77, 3481–3500. [Google Scholar] [CrossRef]
  39. Morin, D.; Haugou, G.; Bennani, B.; Lauro, F. Experimental Characterization of a Toughened Epoxy Adhesive under a Large Range of Strain Rates. J. Adhes. Sci. Technol. 2011, 25, 1581–1602. [Google Scholar] [CrossRef]
  40. Haugou, G.; Bourel, B.; Lauro, F.; Bennani, B.; Lesueur, D.; Morin, D. Characterisation and Modelling of Structural Bonding at High Strain Rate, EPJ Web of Conferences; EDP Sciences: Les Ulis, France, 2012; p. 04012. [Google Scholar]
  41. Yu, X.; Crocombe, A.; Richardson, G. Material modelling for rate-dependent adhesives. Int. J. Adhes. Adhes. 2001, 21, 197–210. [Google Scholar] [CrossRef]
  42. Richardson, G.; Crocombe, A.; Smith, P. A comparison of two- and three- dimensional finite element analyses of adhesive joints. Int. J. Adhes. Adhes. 1993, 13, 193–200. [Google Scholar] [CrossRef]
  43. Boynton, R.S. Chemistry and Technology of Lime and Limestone; John Wiley: Hoboken, NJ, USA, 1980. [Google Scholar]
  44. Kusiorowski, R.; Zaremba, T.; Piotrowski, J.; Gerle, A. Thermal decomposition of asbestos-containing materials. J. Therm. Anal. Calorim. 2013, 113, 179–188. [Google Scholar] [CrossRef] [Green Version]
  45. Balek, V.; Subrt, J.; Pérez-Maqueda, L.A.; Benes, M.; Bountseva, I.; Beckman, I.; Pérez-Rodríguez, J. Thermal behavior of ground talc mineral. J. Min. Met. Sect. B Met. 2008, 44, 7–17. [Google Scholar] [CrossRef]
  46. Conconi, M.S.; Gauna, M.R.; Serra, M.F.; Suarez, G.; Aglietti, E.F.; Rendtorff, N.M. Quantitative firing transformations of a triaxial ceramic by X-ray diffraction methods. Cerâmica 2014, 60, 524–531. [Google Scholar] [CrossRef]
  47. da Silva, L.F.; Dillard, D.A.; Blackman, B.; Adams, R.D. Testing Adhesive Joints: Best Practices; John Wiley & Sons: Hoboken, NJ, USA, 2012. [Google Scholar]
  48. Gama, B.A.; Lopatnikov, S.L.; Gillespie, J. Hopkinson bar experimental technique: A critical review. Appl. Mech. Rev. 2004, 57, 223–250. [Google Scholar] [CrossRef]
  49. Chen, W.W.; Song, B. Split Hopkinson (Kolsky) Bar: Design, Testing and Applications; Springer Science & Business Media: New York, NY, USA, 2010. [Google Scholar]
  50. Chree, C. The equations of an isotropic elastic solid in polar and cylindrical co-ordinates their solution and application. Trans. Camb. Philos. Soc. 1889, 14, 250. [Google Scholar]
  51. Pochhammer, L. On the propagation velocities of small oscillations in an unlimited isotropic circular cylinder. J. Reine Angew. Math 1876, 81, 324. [Google Scholar]
  52. Li, P.; Wang, Z. Experimental Characterization and Modified Constitutive Modeling of the Strain Rate Dependent Compressive Behavior of Adhesives. Macromol. Mater. Eng. 2016, 301, 577–585. [Google Scholar] [CrossRef]
  53. Sancaktar, E. Constitutive Adhesive and Sealant Models. In Handbook of Adhesion Technology; Springer Science and Business Media LLC: New York, NY, USA, 2011; pp. 551–595. [Google Scholar]
  54. Trimiño, L.; Cronin, D.S. Evaluation of Numerical Methods to Model Structural Adhesive Response and Failure in Tension and Shear Loading. J. Dyn. Behav. Mater. 2016, 2, 122–137. [Google Scholar] [CrossRef] [Green Version]
  55. Adachi, T.; Kataoka, T.; Higuchi, M. Predicting impact shear strength of phenolic resin adhesive blended with nitrile rubber. Int. J. Adhes. Adhes. 2015, 56, 53–60. [Google Scholar] [CrossRef]
  56. Sancaktar, E. Fracture Behavior of Epoxy Resins in Fabric-Supported Form. Macromol. Symp. 2017, 373, 1600112. [Google Scholar] [CrossRef]
  57. Sancaktar, E. Complex Constitutive Adhesive Models, Modeling of Adhesively Bonded Joints; da Silva, M., Filipe, L., Öchsner, A., Eds.; Springer: New York, NY, USA, 2008; pp. 95–130. [Google Scholar]
  58. Patrick, R.L. Treatise on Adhesion and Adhesives; CRC Press: Boca Raton, FL, USA, 1981; Volume 5. [Google Scholar]
Figure 1. X-ray diffraction patterns of structural adhesives used in first phase.
Chemengineering 04 00038 g001
Figure 2. X-ray diffraction patterns of structural adhesives used in second phase.
Chemengineering 04 00038 g002
Figure 3. Scanning electron microscope (SEM) images of model adhesives used in Phase 1 study. (a) P1AD1 (5000×); (b) P1AD2 (2000×); (c) P1AD3 (2000×); (d) P1AD4 (5000×).
Chemengineering 04 00038 g003aChemengineering 04 00038 g003b
Figure 4. (a) scanning electron microscopy (SEM) image; (b) phase map of selected area; (c) spectrum of selected area (SA); (df) spectra of each phase represented with different colors for adhesive 1 (P1AD1).
Chemengineering 04 00038 g004aChemengineering 04 00038 g004b
Figure 5. Element distribution from energy dispersive spectroscopy (EDS) mapping for P1AD1.
Chemengineering 04 00038 g005
Figure 6. SEM images of model adhesives used in Phase 2 of the study. (a) P2AD2 (2000×); (b) P2AD3 (5000×); (c) P2AD4 (2000×); (d) P2AD5 (2000×).
Chemengineering 04 00038 g006
Figure 7. Differential thermal analysis (DTA)/thermogravimetric analysis (TGA) of adhesives (a) 1, (b) 2, (c) 3 and (d) 4 from phase 1.
Chemengineering 04 00038 g007
Figure 8. Tensile specimen with strain gage attached.
Chemengineering 04 00038 g008
Figure 9. Tensile test–strain gage setup.
Chemengineering 04 00038 g009
Figure 10. Split Hopkinson pressure bar (SHPB) setup.
Chemengineering 04 00038 g010
Figure 11. Typical waves obtained from Split Hopkinson pressure bar (SHPB) test for toughened epoxy structural adhesives.
Chemengineering 04 00038 g011
Figure 12. Stress and elastic modulus curves versus strain of adhesives at 25 mm/min and 500 mm/min extension rates.
Chemengineering 04 00038 g012
Figure 13. Representation of modified Bingham model with spring, dashpot and slider elements.
Chemengineering 04 00038 g013
Figure 14. Illustration of (left) the proposed bilinear-viscoelastic model and (right) its representation with springs, dashpot and sliders.
Chemengineering 04 00038 g014
Figure 15. Variation of the elastic modulus E2 (see Figure 14) as a function of strain rate during tensile tests.
Chemengineering 04 00038 g015
Figure 16. Time–strain curve obtained from SHPB test of adhesive 1 (Phase 2).
Chemengineering 04 00038 g016
Figure 17. Compressive (SHPB) stress–strain diagrams of adhesive 3 from Phase 2 at different strain rates.
Chemengineering 04 00038 g017
Figure 18. Variation of the elastic modulus E2 as a function of strain rate during SHPB tests.
Chemengineering 04 00038 g018
Figure 19. Variation of the solid viscosity, μ, fitted based on the bilinear-viscoelastic model as a function of strain rate during tensile tests.
Chemengineering 04 00038 g019
Figure 20. Variation of the elastic limit strain, ε2, fitted based on the bilinear-viscoelastic model as a function of strain rate during tensile tests.
Chemengineering 04 00038 g020
Figure 21. Variation of the maximum stress, σMax as a function of strain rate during tensile tests.
Chemengineering 04 00038 g021
Figure 22. Variation of the failure strain as a function of strain rate during tensile tests.
Chemengineering 04 00038 g022
Figure 23. Average tensile toughness–strain rate behavior of Phase 1 model adhesives.
Chemengineering 04 00038 g023
Figure 24. Average bonded single lap shear toughness–shear strain rate behavior of Phase 1 model adhesives.
Chemengineering 04 00038 g024
Figure 25. Variation of the failure shear strain as a function of shear strain rate during bonded single lap shear tests.
Chemengineering 04 00038 g025
Figure 26. Failure surfaces of single lap joints bonded with adhesive 4 shown in pairs (both sides of the joint), tested at different extension rates.
Chemengineering 04 00038 g026aChemengineering 04 00038 g026b
Figure 27. Adhesive 4 lap shear failure surfaces at different extension rates. (a,b) 4× magnification at 25 mm/min; (c,d) 10× magnification at 25 mm/min; (e) 4× magnification at 500 mm/min; (f) 10× magnification at 500 mm/min.
Chemengineering 04 00038 g027
Figure 28. Failure surfaces of single lap joints bonded with adhesive 1 shown in pairs (both sides of the joint), tested at different extension rates.
Chemengineering 04 00038 g028aChemengineering 04 00038 g028b
Figure 29. Adhesive 1 lap shear failure surfaces at different extension rates (a,b) 4× magnification at 25 mm/min; (c,d) 10× magnification at 25 mm/min; (e) 4× magnification at 500 mm/min; (f) 10× magnification at 500 mm/min.
Chemengineering 04 00038 g029
Figure 30. Failure surfaces of single lap joints bonded with adhesive 2 shown in pairs (both sides of the joint), tested at different extension rates.
Chemengineering 04 00038 g030
Figure 31. Adhesive 2 lap shear failure surfaces at different extension rates (a) 4× magnification at 25 mm/min; (b) 10× magnification at 25 mm/min; (c,d) 4× magnification at 500 mm/min; (e,f) 10× magnification at 500 mm/min.
Chemengineering 04 00038 g031
Table 1. Components of structural adhesives obtained from manufacturers’ material safety data sheets (MSDS) as provided by manufacturers and used during the first phase of the study.
CompositionAD1AD2AD3AD4
allfiller-mineralsCalcium oxide<5.0%<10.0%<10.0%<10.0%
allfiller-mineralsLimestone, CaCO315.0%–25.0%10.0%–20.0%10.0%–20.0%5.0%–15.0%
all 1 -Cyanoguanidine<1.0%<10.0%<10.0%<10.0%
1,2,4filler-mineralsTalc<1.0%<10.0% <1.0%
2,3,4 Dimethyl siloxane, reaction product with silica <5.0%<10.0%<10.0%
2,3,4 2-Propenenitrile, polymer with 1,3-butadiene,carboxy-terminated,polymers with bisphenol A and epichlorohydrin 5.0%–15.0%<10.0%<10.0%
1,2 filler-otherCarbon Black<5.0%<1.0%
1,2 filler-mineralsWollastonite (8Cl), Calcium silicate, CaSiO35.0%–15.0%<10.0%
1,2 Propane, 2,2-bis[p-(2,3- epoxypropoxy)phenyl]-, polymers30.0%–40.0%30.0%–40.0%
1,2 Polypropylene glycol diepoxide resin<10.0%<10.0%
1,4 Bisphenol A diglycidyl ether<10.0% <10.0%
3,4 Reaction product: Bisphenol A- (epichlorohydrin); epoxy resin (num. Avg. Mw > 1100, Ad3) (<700, ad4) 35.0%–45.0%35.0%–45.0%
2filler-elastomerPolyurethane Adduct P99-0151 5.0%–15.0%
filler- elastomerAliphatic based urethane polymer P92-500 10.0%–20.0%
4filler- elastomerPolyurethane Adduct EUP27
(P10-0078)
<10.0%
2 Bisphenol A <5.0%
Diallyl Bisphenol A <5.0%
4 Bisphcnol A-epichlorohydrin polyoxyproplenc diamine
copolymer
5.0%–15.0%
filler-mineralsChlorite-group minerals<10.0%
Epoxy resin5.0%–15.0%
filler-mineralsAluminum hydroxide <10.0%
3 Glycidyl neodecanoate <1.0%
min fillers wt% 20%15%20%5%
max fillers wt% 61%66%70%36%
Table 2. Components of structural adhesives obtained from MSDS as provided by manufacturer and used during the second phase of the study.
CompositionAD1AD3AD4AD5
1,3,5 1 -Cyanoguanidine<10.0%0.0%–10.0% 2.5%–10.0%
3,5 Phenol, 4,4′-( l-methylethylidene)bis-, polymer with 2,2′-( l- methylethylidene)
Bis[(4, 1-p henyleneoxymethylene)]bis[oxiran)e] (DGEBPA-based polymer)
0.0%–15.0% 2.5%–10.0%
1,3filler-mineralsCalcium oxide<10.0%<10.0%
1,3 Dimethylsiloxane, reaction product with silica<10%0.0%–10.0%
1,3 2-Propenenitrile, polymer with 1,3-butadiene, carboxy-tenninated, polymers <10.0%0.0%–10.0%
1,5 Reaction product: Bisphenol A-(epichlorohydrin); epoxy resin Avg. Mw > I 100, Ad3) (<700, ad4)35%–45.0% 2.5%–10.0%
4,5 P-tert-Butylphenyl glycidyl ether 1.0%–5.0%1.0%–5.0%
4 Bisphenol A diglycidyl ether 30.0%–60.0%
Diallyl Bisphenol A<5.0%
Propane, 2,2-bis[p-(2,3-cpoxypropoxy) phcnyl]-, polymers 25.0%–40.0%
filler -mineralsAluminum hydroxide<10.0%
Glycidyl neodecanoate<1.0%
filler-mineralsLimestone, CaCO310.0%–20.0%
filler-mineralsTalc 0.0%–10.0%
filler -mineralsWollastonite (SCI), Calcium silicate, CaSiO3 0.0%–15.0%
filler-mineralsCalcium Carbonate 5.0%–25.0%
1,3filler-elastomerPolyurethane Adduct EUP30 5.0%–25.0%
filler -elastomerAliphatic based urethane polymer P92-50010.0%–20.0%
Epoxy resin 0.0%–10.0%
4 Mequinol 1.0%–5.0%
4 Neopentyl glycol diglycidly ether 1.0%–5.0%
5filler -mineralsNatural Calcium Carbonate 10.0%–25.0%
Bisphenol F-Epoxy Resin 25.0%–50.0%
min fillers wt% 20%10%0%10%
maxfillers wt% 70%85%0%25%
Table 3. Parameters of the split Hopkinson pressure bar test equipment.
Bars’ Diameter12.7mm
Bars’ Young’s Moduli1.97E+11GPa
Striker Bar Length127mm
Bars’ Density7810kg/m3
Striker Bar Velocity17.27m/s
Incident C1−2633.98mm/s
Incident C2335.28E+3mm/s
Transmission C1−2715.26mm/s
Transmission C2350.52 E+3mm/s
Distance between gages78.74cm
Distance between gage-sample45.72cm
Table 4. Parameters used in Amplifier.
Incident excitation (Volts)5.85
Transmission excitation (Volts)5.85
Incident amplification20
Transmission amplification20
Table 5. Data obtained from time–strain curve of adhesive 1 (Phase 2).
t1 (μs)0.0001074
t2 (μs)0.0001594
ε1 (mm/mm)0.06271
ε2 (mm/mm)0.14692
R1 (1/s)1055.81956
R2 (1/s)1675.09431
Max. Strain Rate (1/s)1875

