Article

Integration of Microalgae Cultivation in a Biogas Production Process from Organic Municipal Solid Waste: From Laboratory to Pilot Scale

by
Santiago Barreiro-Vescovo
1,2,
Elena Barbera
1,2,*,
Alberto Bertucco
1 and
Eleonora Sforza
1
1
Department of Industrial Engineering DII, University of Padova, Via Marzolo 9, 35131 Padova, Italy
2
Interdepartmental Centre Giorgio Levi Cases, Via Marzolo 9, 35131 Padova, Italy
*
Author to whom correspondence should be addressed.
ChemEngineering 2020, 4(2), 25; https://doi.org/10.3390/chemengineering4020025
Submission received: 17 March 2020 / Revised: 6 April 2020 / Accepted: 8 April 2020 / Published: 10 April 2020
(This article belongs to the Special Issue Bio-Processing and Biochemical Engineering)

Abstract

:
In this study, the feasibility of integrating microalgae cultivation in a biogas production process that treats the organic fraction of municipal solid waste (OFMSW) was investigated. In particular, the biomass growth performances in the liquid fraction of the digestate, characterized by high ammonia concentrations and turbidity, were assessed together with the nutrient removal efficiency. Preliminary laboratory-scale experiments were first carried out in photobioreactors operating in a continuous mode (Continuous-flow Stirred-Tank Reactor, CSTR), to gain preliminary data aimed at aiding the subsequent scaling up to a pilot scale facility. An outdoor experimental campaign, operated from July to October 2019, was then performed in a pilot scale raceway pond (4.5 m2), located in Arzignano (VI), Italy, to assess the performances under real environmental conditions. The results show that microalgae could grow well in this complex substrate, although dilution was necessary to enhance light penetration in the culture. In outdoor conditions, nitrification by autotrophic bacteria appeared to be significant, while the photosynthetic nitrogen removal was around 12% with respect to the inlet. On the other hand, phosphorus was almost completely removed from the medium under all the conditions tested, and a biomass production between 2–7 g m−2 d−1 was obtained.

1. Introduction

In relation to the increasing world population, the generation of municipal solid waste (MSW) is also expected to increase, with a foreseen production of 2.2 billion tons at a global level by 2025 [1]. A large portion (40–70% [2,3]) of MSW is represented by the organic fraction (organic fraction of municipal solid waste, OFMSW). If not properly managed, the OFMSW can cause severe harm to the environment, through the emission of greenhouse gases (GHG) and/or contamination of soils and water due to uncontrolled decomposition [4]. Therefore, it is clear that a correct waste management is crucial to prevent such damage.
In this context, anaerobic digestion (AD) has emerged as a very attractive treatment. AD allows for the valorization of the OFMSW through the production of biogas, which could be exploited for the production of power and thermal energy in a combined heat and power (CHP) engine [5], or upgraded to biomethane to be used as a vehicle fuel or injected into the natural gas grid [6,7]. Hence, following this approach, waste is converted into a renewable energy resource.
However, one of the bottlenecks that limits the deployment of AD plants treating OFMSW is related to digestate management. Roughly 700–950 kg of digestate are produced as a by-product for every ton of organic waste fed to the digester [8,9,10]. Current practices involve the use of digestate for land applications, as fertilizer or for soil amendment. However, this possibility strictly depends on specific national regulations and, especially concerning digestate obtained from OFMSW, is not always allowed without proper pre-treatment and stabilization. Usually, the digestate undergoes solid–liquid separation to be divided into the two main fractions: the liquid typically accounts for 80–90 wt %, while the solid fraction is about 10–20% by mass [1,11]. The solid fraction can be either composted or dried, and used directly as organic fertilizer. On the other hand, liquid digestate management poses more issues, as it cannot be directly discharged into the water body due to the high nutrient load. Among the technologies employed to treat the liquid fraction, there are membrane technologies [12], stripping [13], chemical [14] and biological (e.g., ANAMMOX) [15] treatments. However, they are associated with high operation costs.
One recently emerging possibility is to couple microalgae cultivation to the anaerobic digestion process [16]. Microalgae are being widely investigated in wastewater treatment applications, owing to their remarkable capability to grow in complex media and to efficiently uptake nutrients such as nitrogen and phosphorus from these streams [17]. Thus, growing microalgae in the liquid fraction of digestate appears as a promising strategy to recover nutrients from this waste stream while producing valuable biomass, in agreement with a circular economy perspective. The produced biomass could be exploited in different ways, e.g., in agriculture as a slow-release fertilizer, or recycled to the digester to enhance the biogas production [18].
Several works can be found in literature that cultivate microalgae, either as pure species or in consortia, in the liquid digestate obtained from different organic feedstocks, ranging from municipal wastewater sludge [19,20], to dairy manure [21] and piggery effluent [22,23], among others. Moreover, these studies span from small-scale cultivation experiments carried out in flasks [24] to lab-scale bioreactors [25], to reach pilot-scale raceway ponds [22]. On the other hand, the possibility of growing microalgae in the liquid digestate obtained from OFMSW is still poorly investigated. The physio-chemical properties of this digestate, which is characterized by generally higher turbidity and ammonia nitrogen (up to 6000 mg L−1) compared to other digestate sources [9], as well as by the possible presence of heavy metals and other toxic compounds [1], necessitate a proper investigation to evaluate the possibility of using it to grow microalgae. Bona et al. [26] conducted a study on microalgae cultivation in the digestate produced from a dry AD pilot plant treating OFMSW, adopting a dilution of 1:70 to lower the ammonia concentration and turbidity of the medium. The experiments carried out by the authors in batch conditions at lab-scale highlight a potential growth and nutrient removal by microalgae even in this type of medium.
This work aims at further investigating the growth and nutrient removal performances of microalgae cultivated in the liquid digestate from OFMSW, with an industrial-scale application perspective. First, lab-scale experiments were performed in photobioreactors operated in continuous mode, in order to retrieve some preliminary data on the performances of the system, especially concerning the effect of the hydraulic residence time (HRT) as operating variable. Subsequently, a pilot-scale raceway system, operated in a semi-continuous mode, was used to carry out an outdoor experimental campaign, aimed at assessing the performances under real environmental conditions.

2. Materials and Methods

2.1. Microalgae Species

To allow a higher versatility of the system, a consortium comprising different microalgal and cyanobacterial species was used to inoculate both the laboratory and pilot-scale cultivation systems. The species selected for the consortium include Chlorella protothecoides, Chlorella vulgaris, Scenedesmus obliquus, Synechococcus sp. and Synechocystis sp., which are among those commonly reported in wastewater treatment applications, thanks to their resilience and capability of growing well in complex media [27,28,29,30]. Prior to inoculation, the consortium was maintained in liquid digestate diluted 1:10, so to acclimate to this type of substrate.

2.2. Laboratory-Scale Experimental Setup

An initial set of experiments was carried out in controlled laboratory conditions to assess the feasibility of the cultivation of microalgae in such a liquid. The laboratory-scale cultivation experiments were carried out in a flat-plate photobioreactor (PBR) operated in continuous mode. The PBR had a 2 L working volume, V R (30 cm height × 17 cm length × 4 cm depth). The culture was mixed by means of a magnetic stirrer so that the system can be considered a CSTR. After a batch start-up phase, the reactor was operated in continuous mode. The inlet digestate was fed by means of a peristaltic pump (Watson-Marlow 120 U) that regulated the volumetric flow rate Q (mL d−1). The reactor volume was kept constant by means of an overflow tube, from which the outlet was withdrawn at the same flow rate. The hydraulic retention time (HRT) was set by regulating the inlet volumetric flow rate, according to:
H R T = V R Q
A mixture of air-CO2 (5% v/v) was bubbled at a flow rate of 1 L h−1 by means of a sieved silicon tube placed at the reactor bottom. Light was provided by means of a LED lamp (Photon System Instruments, SN-SL 3500-22), connected to a digital controller. In order to replicate real conditions as much as possible, the lamp was set to reproduce the average light intensity profile of a typical summer day in Arzignano, Italy, close to the area where the subsequent pilot scale facility was located. Irradiance data were retrieved from the PVGIS database [31], taking the month of July as representative for the summer season. Accordingly, the light profile was characterized by 15 h of light followed by 9 h of dark. The peak irradiance achieved at 12:00 was equal to 1400 µmol m−2 s−1 (772 W m−2) of Photosynthetically Active Radiation (PAR, 400–700 nm), while the average daily intensity was equal to about 559 µmol m−2 s−1 (288 W m−2).
Finally, the temperature and pH of the culture was monitored daily, but not controlled. Their values were in the range of 25–28 °C and 7–8, respectively.
The liquid digestate used for lab experiments was provided by Berica Impianti s.r.l., and was sampled from an anaerobic digestion plant treating OFMSW, located in Asigliano Veneto (VI), Italy. In particular, two types of digestate samples were collected: a centrifuged one (CD), i.e., the liquid obtained after a gross solid–liquid separation of the digestate, followed by a centrifugation step; and a filtered one (FD), which, after the first solid–liquid separation, underwent a gross filtration by means of a bag filter. The latter was considered as, despite a lower solid removal efficiency, it requires lower energy duties. The composition of the two digestates is reported in Table 1. As can be observed, the samples have a similar nutrient composition, while the solids content is higher in the filtered sample, owing to the lower separation efficiency.
Due to the high ammonium N concentration (about 3 g L−1 of N at pH = 8.3) and turbidity (Figure 1), the digestate was diluted at different ratios (see following sections) to enhance the light penetration. Clearly, although in this study dilutions were made using tap water, it is envisioned that in real facilities other waste streams would be used for this purpose, such as urban wastewaters.

2.3. Pilot-Scale Experimental Setup

Outdoor experimentation was carried out in a 4.5 m2 raceway reactor with a usable volume of 0.9 m3 (Aqualgae, Spain). The reactor was located at the site of Agno Chiampo Ambiente S.r.l., Arzignano (VI) Veneto, Italy (45°31′01.0″ N 11°22′32.2″ E). The operation was developed during Italy summer and early autumn seasons, namely in the period July–October of 2019. The research aimed to investigate the microalgae growth on OFMSW anaerobic digestate. The hydraulic retention time used in the experimentation was of 10 days. The raceway reactor was composed by two rectangular channels connected with semi-circular end-walls made of PVC. A motor coupled with a PVC six-blade paddle wheel provided the water mixing, with a water integral velocity of 0.2 m s−1. In order to avoid dead zones, one flow rectifier was fixed in each loop. One single sump (0.95 m of depth and 0.3 m diameter) was located before the paddle wheel to increase the gas diffusion. Continuous mixing ensured uniform microalgae concentration in the reactor, and a proper contact with sunlight and nutrients. By means of a tracing experiment, it was verified that the system behaved as a CSTR reactor.
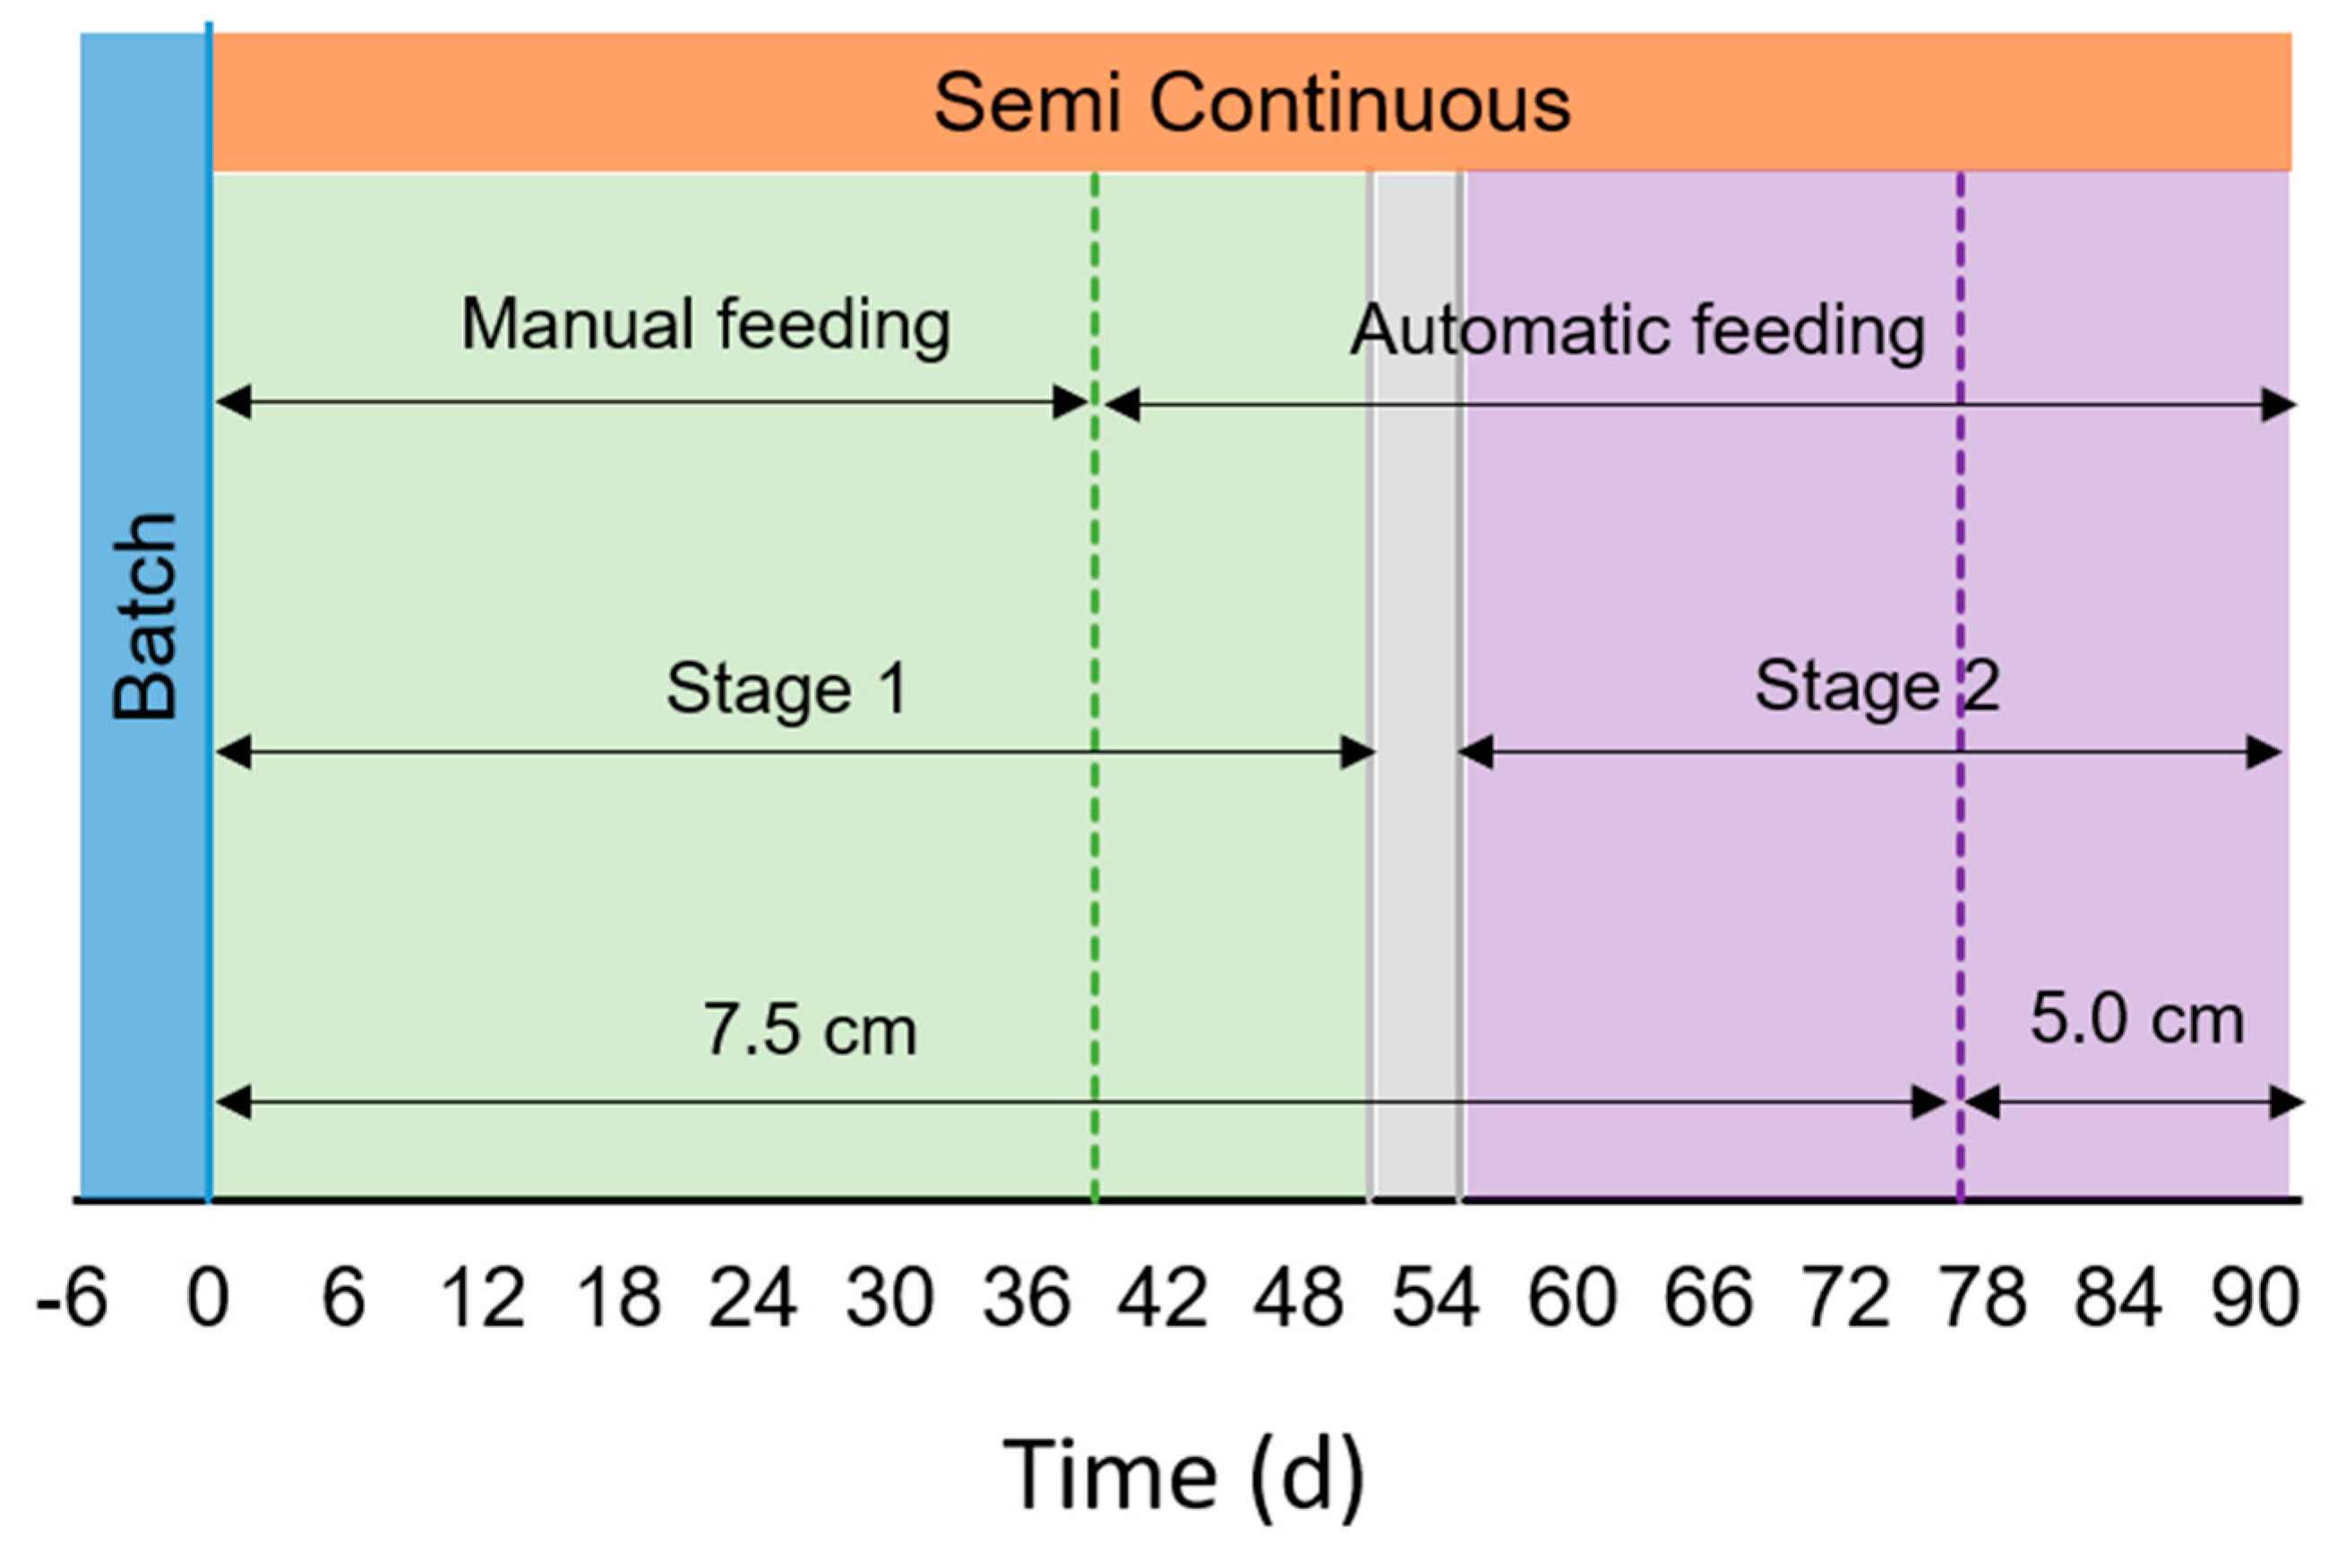
The raceway was firstly operated in batch condition for six days to allow an acclimation phase (from July 16th to 23rd, Figure 2). After this period, the reactor was operated in semi-continuous mode during 91 days, with an HRT of 10 days (from July 24th to October 22nd). The culture depth was set to 7.5 cm (from day 0 to 76, July 16th–October 7th), and was then lowered to 5 cm to facilitate light penetration when external solar radiation decreased in early autumn conditions (from days 77–91, October 8th–October 25th). The corresponding working volume was 430 L and 308 L, respectively. Water evaporation from the pond was compensated daily with tap water, keeping the desired water depth, i.e., 7.5 or 5.0 cm depending on the operational period.
The substrate used was OFMSW anaerobic digestate provided by Berica Impianti S.r.l. As the high content of suspended solids (SS) in the digestate may hamper the light diffusion, two different filtration methods were used in the operation. During the first phase of semi-continuous operation (Stage 1) it was filtered using an ultrafiltration unit (UFD) with tubular polymeric (PVDF) membranes, provided by Sepra S.r.l. In the second stage (Stage 2), the digestate was filtered with bag filter only (FD), as carried out for lab experiments (see Section 2.2) to evaluate the capability of microalgae consortia to grow in a culture with higher concentration of SS (Table 1). Centrifugation was not carried out, in contrast to the lab experiments, due to technical and economic unfeasibility of employing this type of separation unit at large scale. From day 52 to 55, the influent was composed by mixing of UFD and FD in ratio 1:1 (transition stage, September 13th–September 16th, Figure 2). Digestates were diluted with tap water in a ratio 1:20 during the acclimation phase (batch operation) and 1:10 during the semi-continuous operation. These different feed dilutions resulted in different inlet nutrients concentration, as reported in the corresponding figures of results section.
The influent feeding was performed manually in a first period, and automatically afterwards. Manual feeding mode was performed from day 0 to 38 (July 16th–August 30th, Figure 2). In that period, harvest and sampling took place once a day between 11:15–11:45, and the fresh influent was added all at once at 11:45–12:15. From day 39 (August 31st–October 22nd, Figure 2), the influent was introduced automatically ten times a day, once per hour between 07:00 and 16:13 with pulses of the duration of 13 min each (Figure S1). Sampling was carried out between 11:45 and 11:55 as before. The effluent was withdrawn by means of an overflow syphon, fixing the water column to 7.5 or 5 cm, respectively.

2.3.1. Inoculum

The consortium used as inoculum (see Section 2.1) was grown at room temperature in two 5 L glass columns (0.1 m diameter) with constant illumination of 150 µmol m−2 s−1. Magnetic stirring provided continuous mixing and air bubbling was supplied at a continuous flow of 1 L min−1 to avoid dissolved oxygen (DO) accumulation. Once a week, 0.5 L of each bottle were harvested and collected in a 25 L plastic bottle, kept under light irradiation. The cultures were fed with 1 L of OFMSW anaerobic digestate diluted 1:10 with BG11 culture media.

2.3.2. CO2 Injection

The pH was controlled based on on-demand injection of pure CO2, with a set point of 8.5. This allowed a reduction of ammonia stripping and phosphorous precipitation that may occur at alkaline pH around 9. The pH control system consisted in a CO2 gas cylinder, a gas regulator, a gas flow meter (0–5 L min−1) and a diaphragm solenoid valve. CO2 was supplied by means of a gas diffusor placed at the bottom of the sump. Water pH was measured every five seconds. When the pH overcame the 8.5 set point value, the controller (Hatch sc200, Germany) opened the valve to allow CO2 bubbling (1 L min−1). Additionally, air bubbling was provided continuously from the bottom of the sump with an air blower, to avoid microalgae settling.

2.4. Monitoring and Analytical Techniques

Physical–chemical parameters of the raceway systems, such as Dissolved Oxygen (DO), temperature and pH were measured continuously with probes (Hatch Lange). Data were recorded every 15 min with a data logger (Hatch sc200, Germany). In lab-scale experiments, temperature and pH were measured manually once a day.
Samples of 15 mL (lab-scale) and 50 mL (pilot-scale) were periodically taken from the corresponding effluents, and then analyzed in order to characterize the microalgae growth and nutrients removal. Biomass evolution was followed in terms of Total Suspended Solids (TSS, g L−1) and Chlorophyll A concentration. TSS were measured according to Standard Methods (APHA 2000). Pigment extraction was carried out by N,N-dimethylformamide (DMF): samples were centrifuged at 13,000 rpm for 10 min. After the supernatant was removed, 1 mL of solvent was added in dark conditions. Samples were then stored at −20 °C for at least 48 h to ensure complete pigments extraction. After further centrifugation, the absorption spectrum of the extract was measured by a double-beam spectrophotometer (UV-1900, Schimadzu Corporation, USA) using DMF as reference. The final concentration of Chlorophyll A was determined according to specific extinction coefficients [32].
Nutrients removal was assessed measuring their concentration in the inlet and outlet streams, and calculated according to:
Δ i = c i , i n c i , o u t c i , i n %
where i is the specific nutrient, and c i , i n and c i , o u t indicate the inlet and outlet concentration, respectively. Soluble ammonia, nitrite and nitrate were measured by spectrophotometric analytical kits (Hydrocheck Spectratest). Phosphates concentration was measured by means of a colorimetric reaction based on the formation of a blue phosphomolybdic complex of the molybdenum blue group, whose concentration is measured by spectrophotometer. Organic matter removal was analyzed as soluble chemical oxygen demand (sCOD), and total COD fraction was also measured to characterize the influents composition.
For the pilot-scale experimental activity, nitrogen mass balance was evaluated, assuming the inorganic nitrogen in the inlet (mostly in the form of ammonium N) could leave the raceway in four ways: soluble N-NH3, transformed into N-NO2 or N-NO3, in form of microalgae biomass and stripped. Nitrogen content in the biomass was estimated in 5% of the total TSS, based on literature [33]. Total inorganic nitrogen was calculated as the sum of N-NH3, N-NO2 and N-NO3. The balance was obtained according to the following equations:
N i n = ( Q i n · [ N - NH 3 ] ) + ( Q i n · [ N - NO 2 ] ) + ( Q i n · [ N - NO 3 ] )  
N b i o m a s s = Q o u t · T S S · % N  
N N O = ( Q o u t · [ N - NO 2 ] ) + ( Q o u t · [ N - NO 3 ] )  
N N H 3 = Q o u t · [ N - NH 3 ]  
N s t r i p p e d = N i n ( N N H 3 + N N O + N b i o m a s s )
N l o s t = N s t r i p p e d + N b i o m a s s
In Equations (3)–(8), Q i n and Q o u t are the volumetric flowrate of the influent and effluent, respectively, of the reactor (L d−1). TSS is the concentration of biomass in the effluents (g L−1). N-NH3, N-NO2 and N-NO3 are the average concentrations of the compounds in the effluents (g L−1).

3. Results and Discussion

First, the results related to the biomass growth and nutrients removal performances obtained at the laboratory scale are presented. These were used as a first indication to plan and perform the scale-up to the outdoor pilot plant, whose performances are presented hereafter.

3.1. Laboratory-Scale Experiments

In these preliminary experiments, the effect of the HRT on the process performances was investigated, together with the extent of dilution and the type of digestate used as substrate for growth.
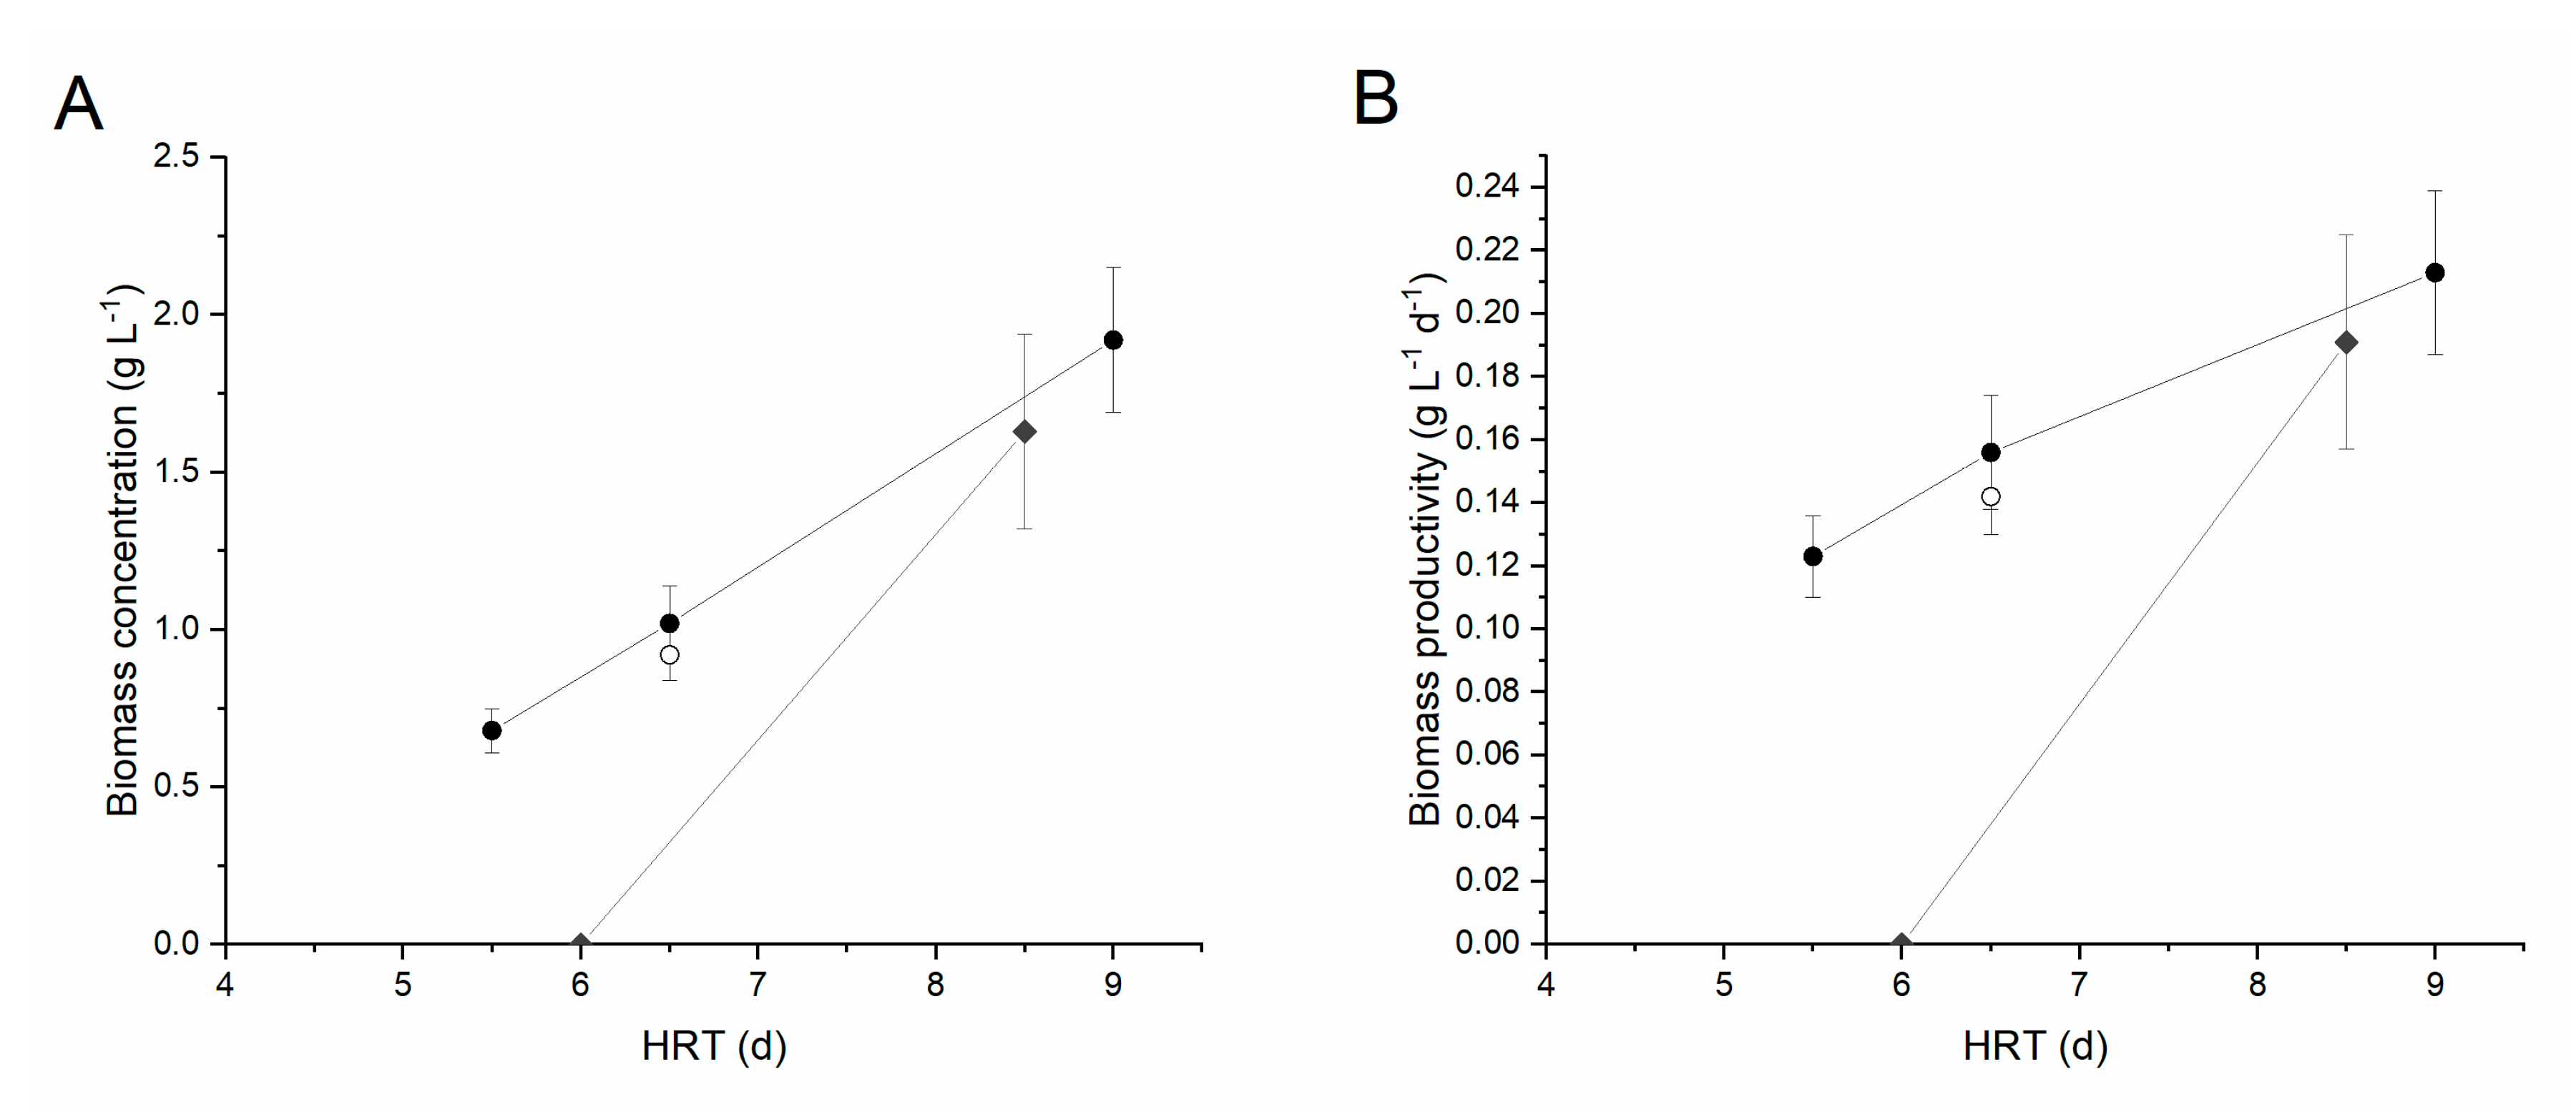
The first type of digestate used was the centrifuged digestate (CD). Initially, to reduce both turbidity and ammonia concentration in the medium, a 1:5 dilution factor was applied to the inlet stream. It is, in fact, widely acknowledged that high levels of ammonia can be toxic for algal cells, even though the tolerance is species-dependent [34]. The values of HRT investigated were equal to 9, 6.5 and 5.5 days, respectively. Each time the HRT was changed, a transient phase of 8–10 days was observed, after which the performances achieved steady-state. The corresponding performances are summarized in Table 2. As also shown in Figure 3A, the steady-state biomass concentration increased with the residence time, from 0.68 g L−1 at 5.5 d to 1.92 g L−1 at day nine. Interestingly, the volumetric productivity ( P x = c x / H R T ) also increased along with the residence time, from 0.123 g L−1 d−1 to 0.213 g L−1 d−1. This indicates that the optimal operating residence time under these environmental conditions would be higher than those investigated, according to the typical behavior of a chemostat photobioreactor [35,36]. However, reaching a steady state in such wastewater suggests that industrial application at large scale may be feasible, as microalgae were found able to continuously grow in the digestate.
In terms of nutrient removal, phosphorus was almost completely consumed at the higher residence times (ΔP ≥ 95% at HRT = nine days and 6.5 days) reaching concentrations lower than 1 mg L−1 in the effluent. The nitrogen removal was instead around 12% in the same conditions, highlighting an unbalanced ratio of the two nutrients in the medium (about 35:1 N:P w/w) with respect to the average elemental composition of microalgal biomass (about 8:1 N:P w/w), according to the Redfield ratio [37], with P being the limiting nutrient. When decreasing the HRT to 5.5 d, the N and P removals decreased to 3% and 52% respectively, suggesting that this value of HRT may be close to the wash-out condition.
To verify whether a lower dilution, i.e., lower water consumption, could be applied, a second set of experiments was carried out with a 1:2 digestate dilution. The HRT was initially set to six days. Despite starting from a high biomass concentration (about 1.5 g L−1), under these conditions the culture was entirely washed out of the system, indicating that the higher turbidity of the medium, possibly combined with an ammonia inhibition effect, strongly reduced the microalgal growth rate so that higher residence times are required under these conditions. The HRT was, hence, increased to 8.5 days. Following inoculation, after about 12 days of transient phase a steady-state was reached, characterized by a constant biomass concentration of 1.63 ± 0.31 g L−1 (i.e., a productivity of 0.191 ± 0.034 g L−1 d−1) (Table 2). Under these conditions, the N and P removal was equal to 60% and 12%, respectively, which are slightly lower compared to the performances achieved under a 1:5 dilution.
Finally, the possibility of growing microalgae using a filtered digestate (FD) was investigated. This would, in fact, allow lower energy consumption in the overall process, but results in a higher solids content and turbidity of the substrate. Considering the previous results, a 1:5 dilution was applied, with an HRT of 6.5 days. As shown in Figure 3, with respect to the corresponding experimental condition carried out with centrifuged digestate, the biomass productivity was reduced by about 10% (0.142 g L−1 d−1 compared to 0.156 g L−1 d−1), although this reduction was not statistically significant. The N and P removal were also significantly reduced compared to those obtained with the centrifuged sample, highlighting the negative effect of turbidity on the biomass performances.
Overall, lab-scale experiments allowed us to verify that microalgae cultivation in the liquid fraction of anaerobic digestate from OFMSW appears promising, although aspects related to the medium turbidity require operation at high values of HRT compared to cultivation in synthetic media or urban wastewaters [38], with the need of dilution. Moreover, due to the unbalanced nutrient concentration in the medium, it would be preferable to perform the dilution with other types of wastewater with a richer P content.

3.2. Pilot-Scale Experiments

3.2.1. TSS Concentration and Chlorophyll Content

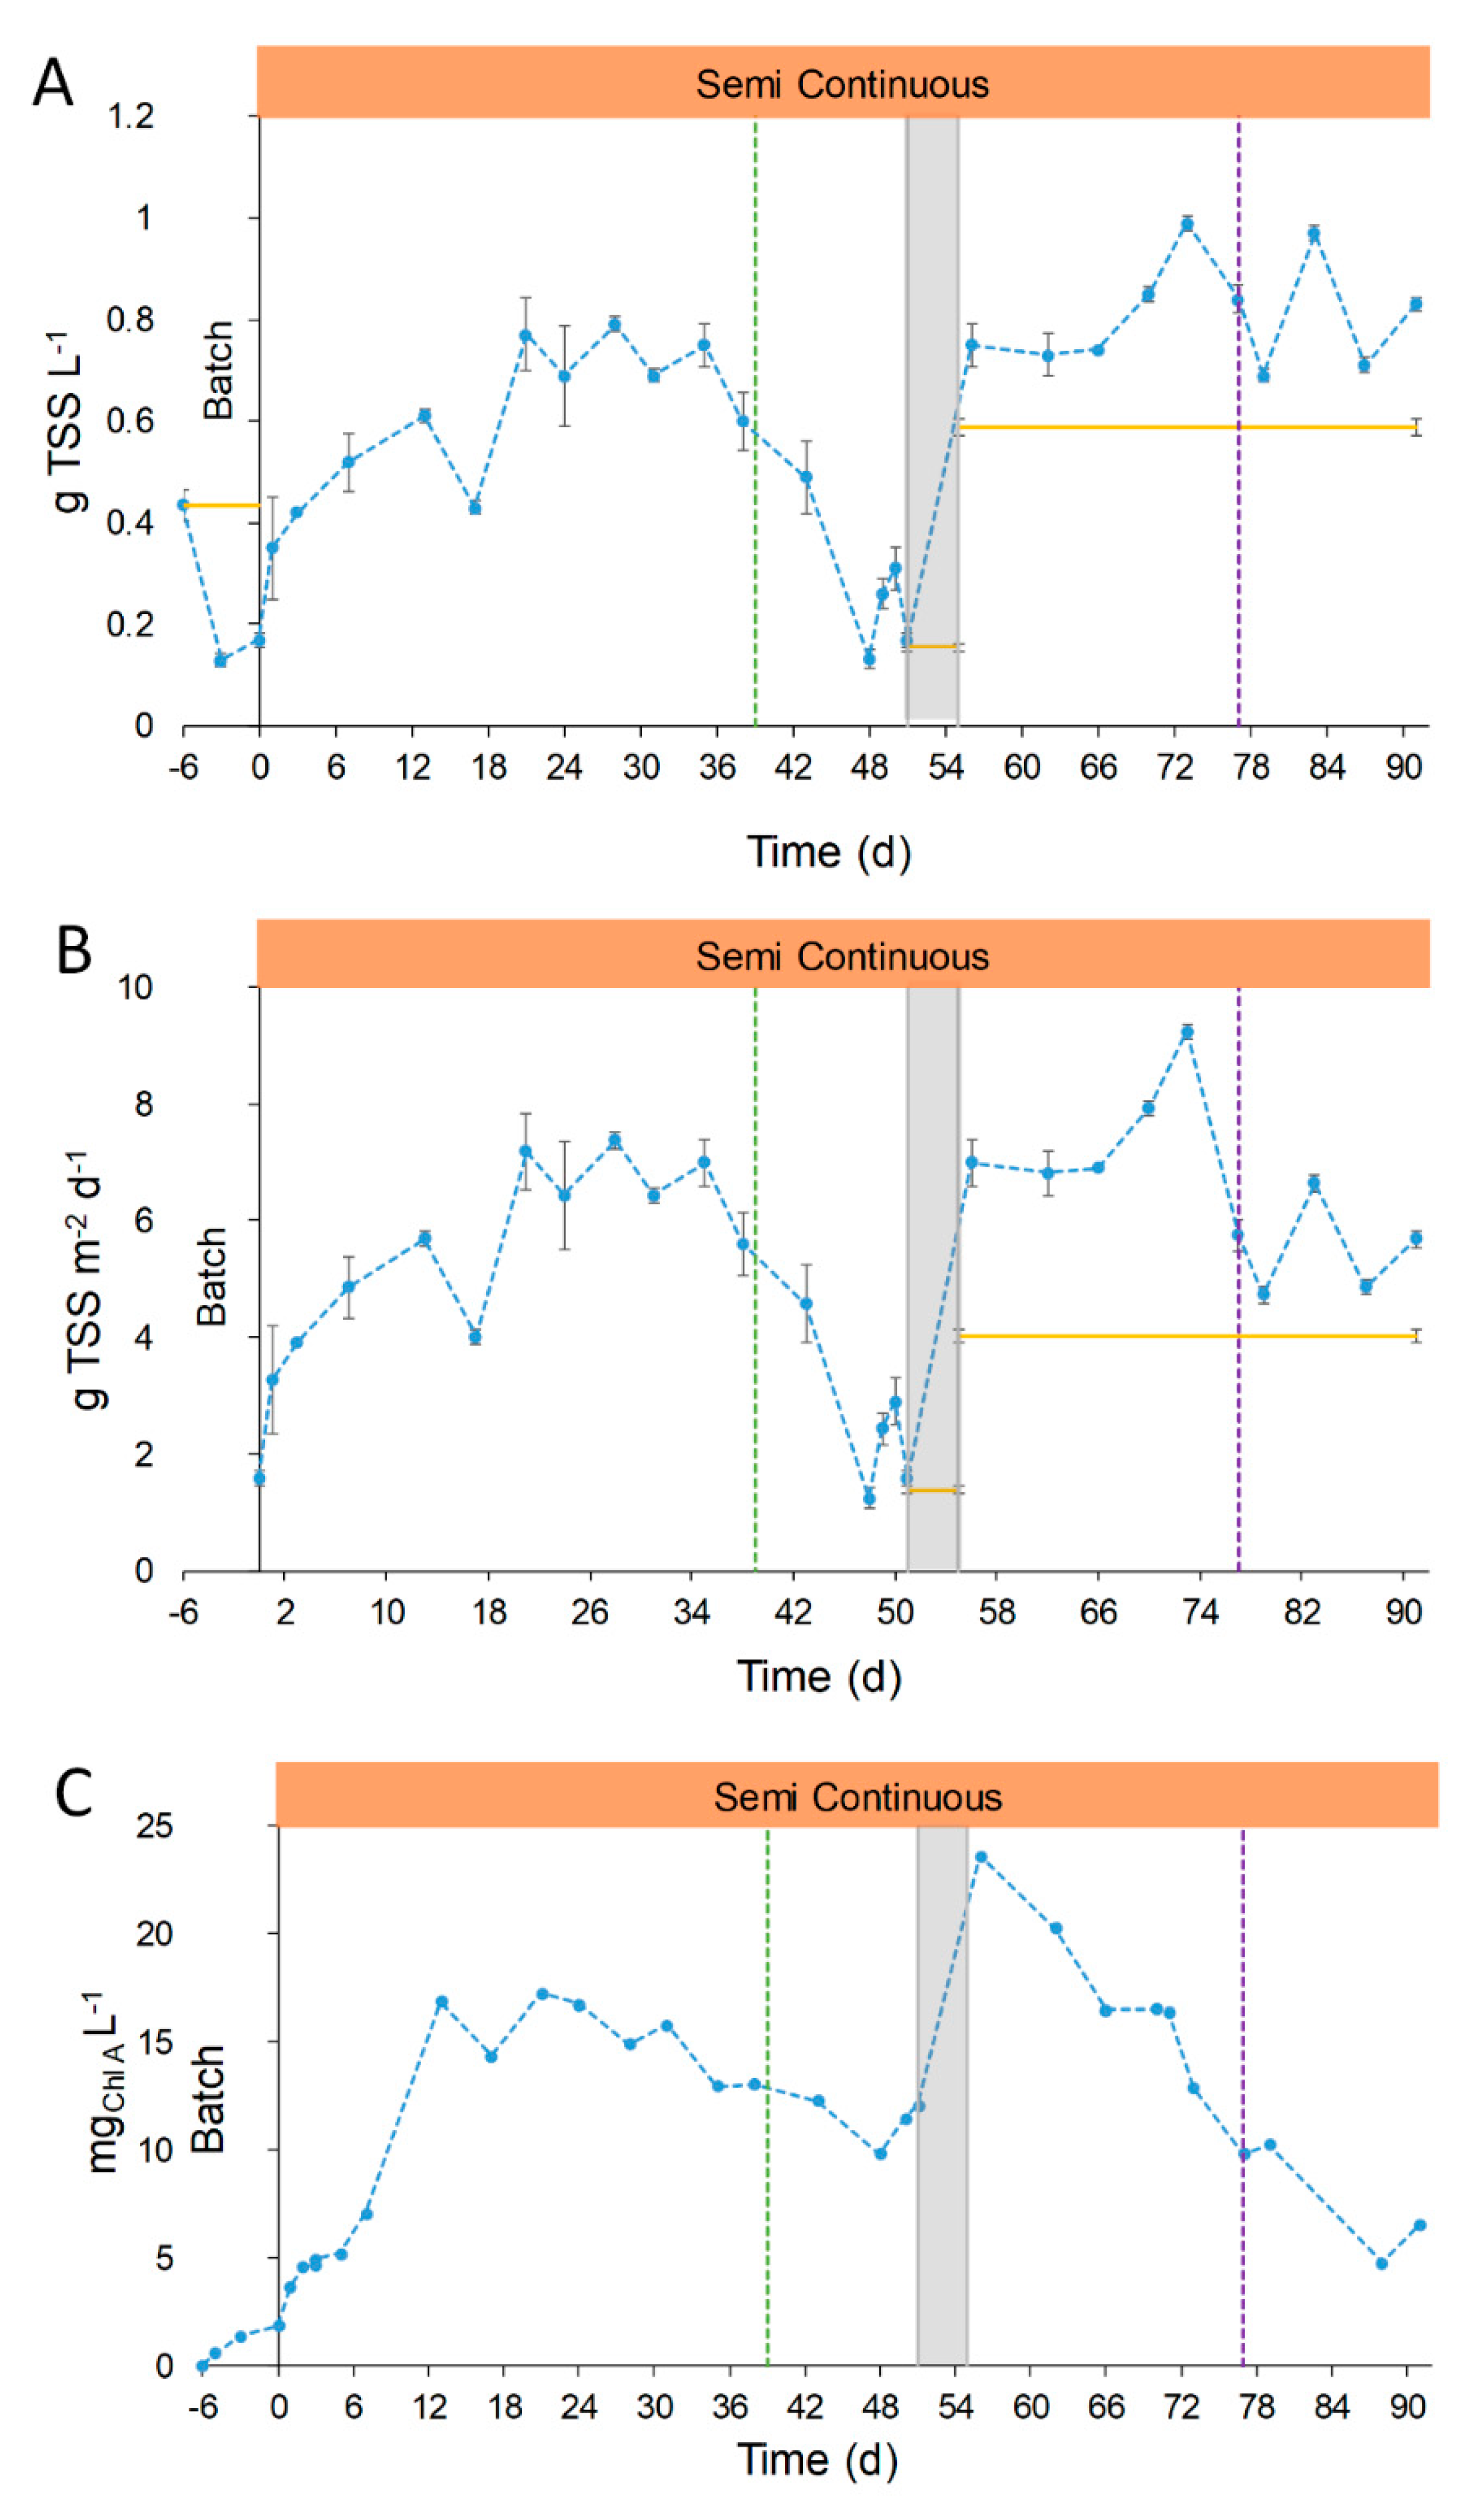
Based on the results obtained in the lab, the pilot plant was operated with a digestate dilution of 1:10 and at a precautionary hydraulic residence time of 10 days. Details of the operation mode are reported in Figure 2. The TSS were measured during all the stages of operation, and results are reported in Figure 4. The biomass concentration, measured in terms of TSS, and corresponding areal productivity (g TSS m−2 d−1) suffered changes related to the operational conditions and the seasonal variations. From day 0 to 35 (Stage 1) the concentration and productivity increased until a maximum value of 0.74 ± 0.04 g TSS L−1 and 6.9 ± 0.4 g TSS m−2 d−1 (days 21–35, Figure 4). The comparison of the biomass productivity obtained in our study with other pilot plants is difficult due to the different types of feed used for cultivation and geographical area. Other papers reported concentrations of 0.98 g TSS L−1 and productivities of 10–30 g TSS m−2 d−1 with other types of digestates [39,40,41], or 2.1–2.2 g TSS m−2 d−1 for indoor cultivation in high rate algal ponds (HRAP) [20,42]. Besides the value of productivity, it was here demonstrated that the cultivation in a real outdoor operating pilot plant fed with OFMSW digestate is feasible. The difference in concentration and productivities with other plants is easily justifiable by the type of inlet medium, which represents the novelty of this work.
After day 35, the concentration of TSS started to decrease until minimum values close to 0.13–0.31 g TSS L−1 corresponding to productivity values of 1.2–2.9 g TSS m−2 d−1 (Figure 4). This point will be specifically discussed in Section 3.2.4. During Stage 2, the TSS concentration reached a mean value of 0.81 ± 0.11 g L−1. This concentration was similar to that obtained in the period from days 21–35 (Stage 1, 0.74 ± 0.05 g L−1).
On the other hand, TSS measures do not fully represent the trend of algal concentration, due to the presence of suspended solids in the medium and other bacterial populations. To better understand the photosynthetic microorganism evolution, the Chlorophyll A concentration was analyzed and reported in Figure 4C. During Stage 1, the Chlorophyll A concentration had the same trend of the TSS, while a different behavior was observed in Stage 2: Chlorophyll A decreased progressively until reaching minimum values of 4.8–6.5 mg L−1 in days 88–91. This drop in chlorophyll concentration was attributed to the low temperatures and solar irradiances of autumn season. In addition, the higher concentration of suspended solids of the FD compared to the UFD hampered the light penetration. Those facts hindered the growth of photosynthetic microorganisms, eventually leading to the collapse of the microalgal culture, reduced DO concentration (maximum values below 12 mg O2 L−1, see Section 3.2.4) and low pH values (below the pH set point control, pH 8.5, Figure S2).

3.2.2. COD and P Removal

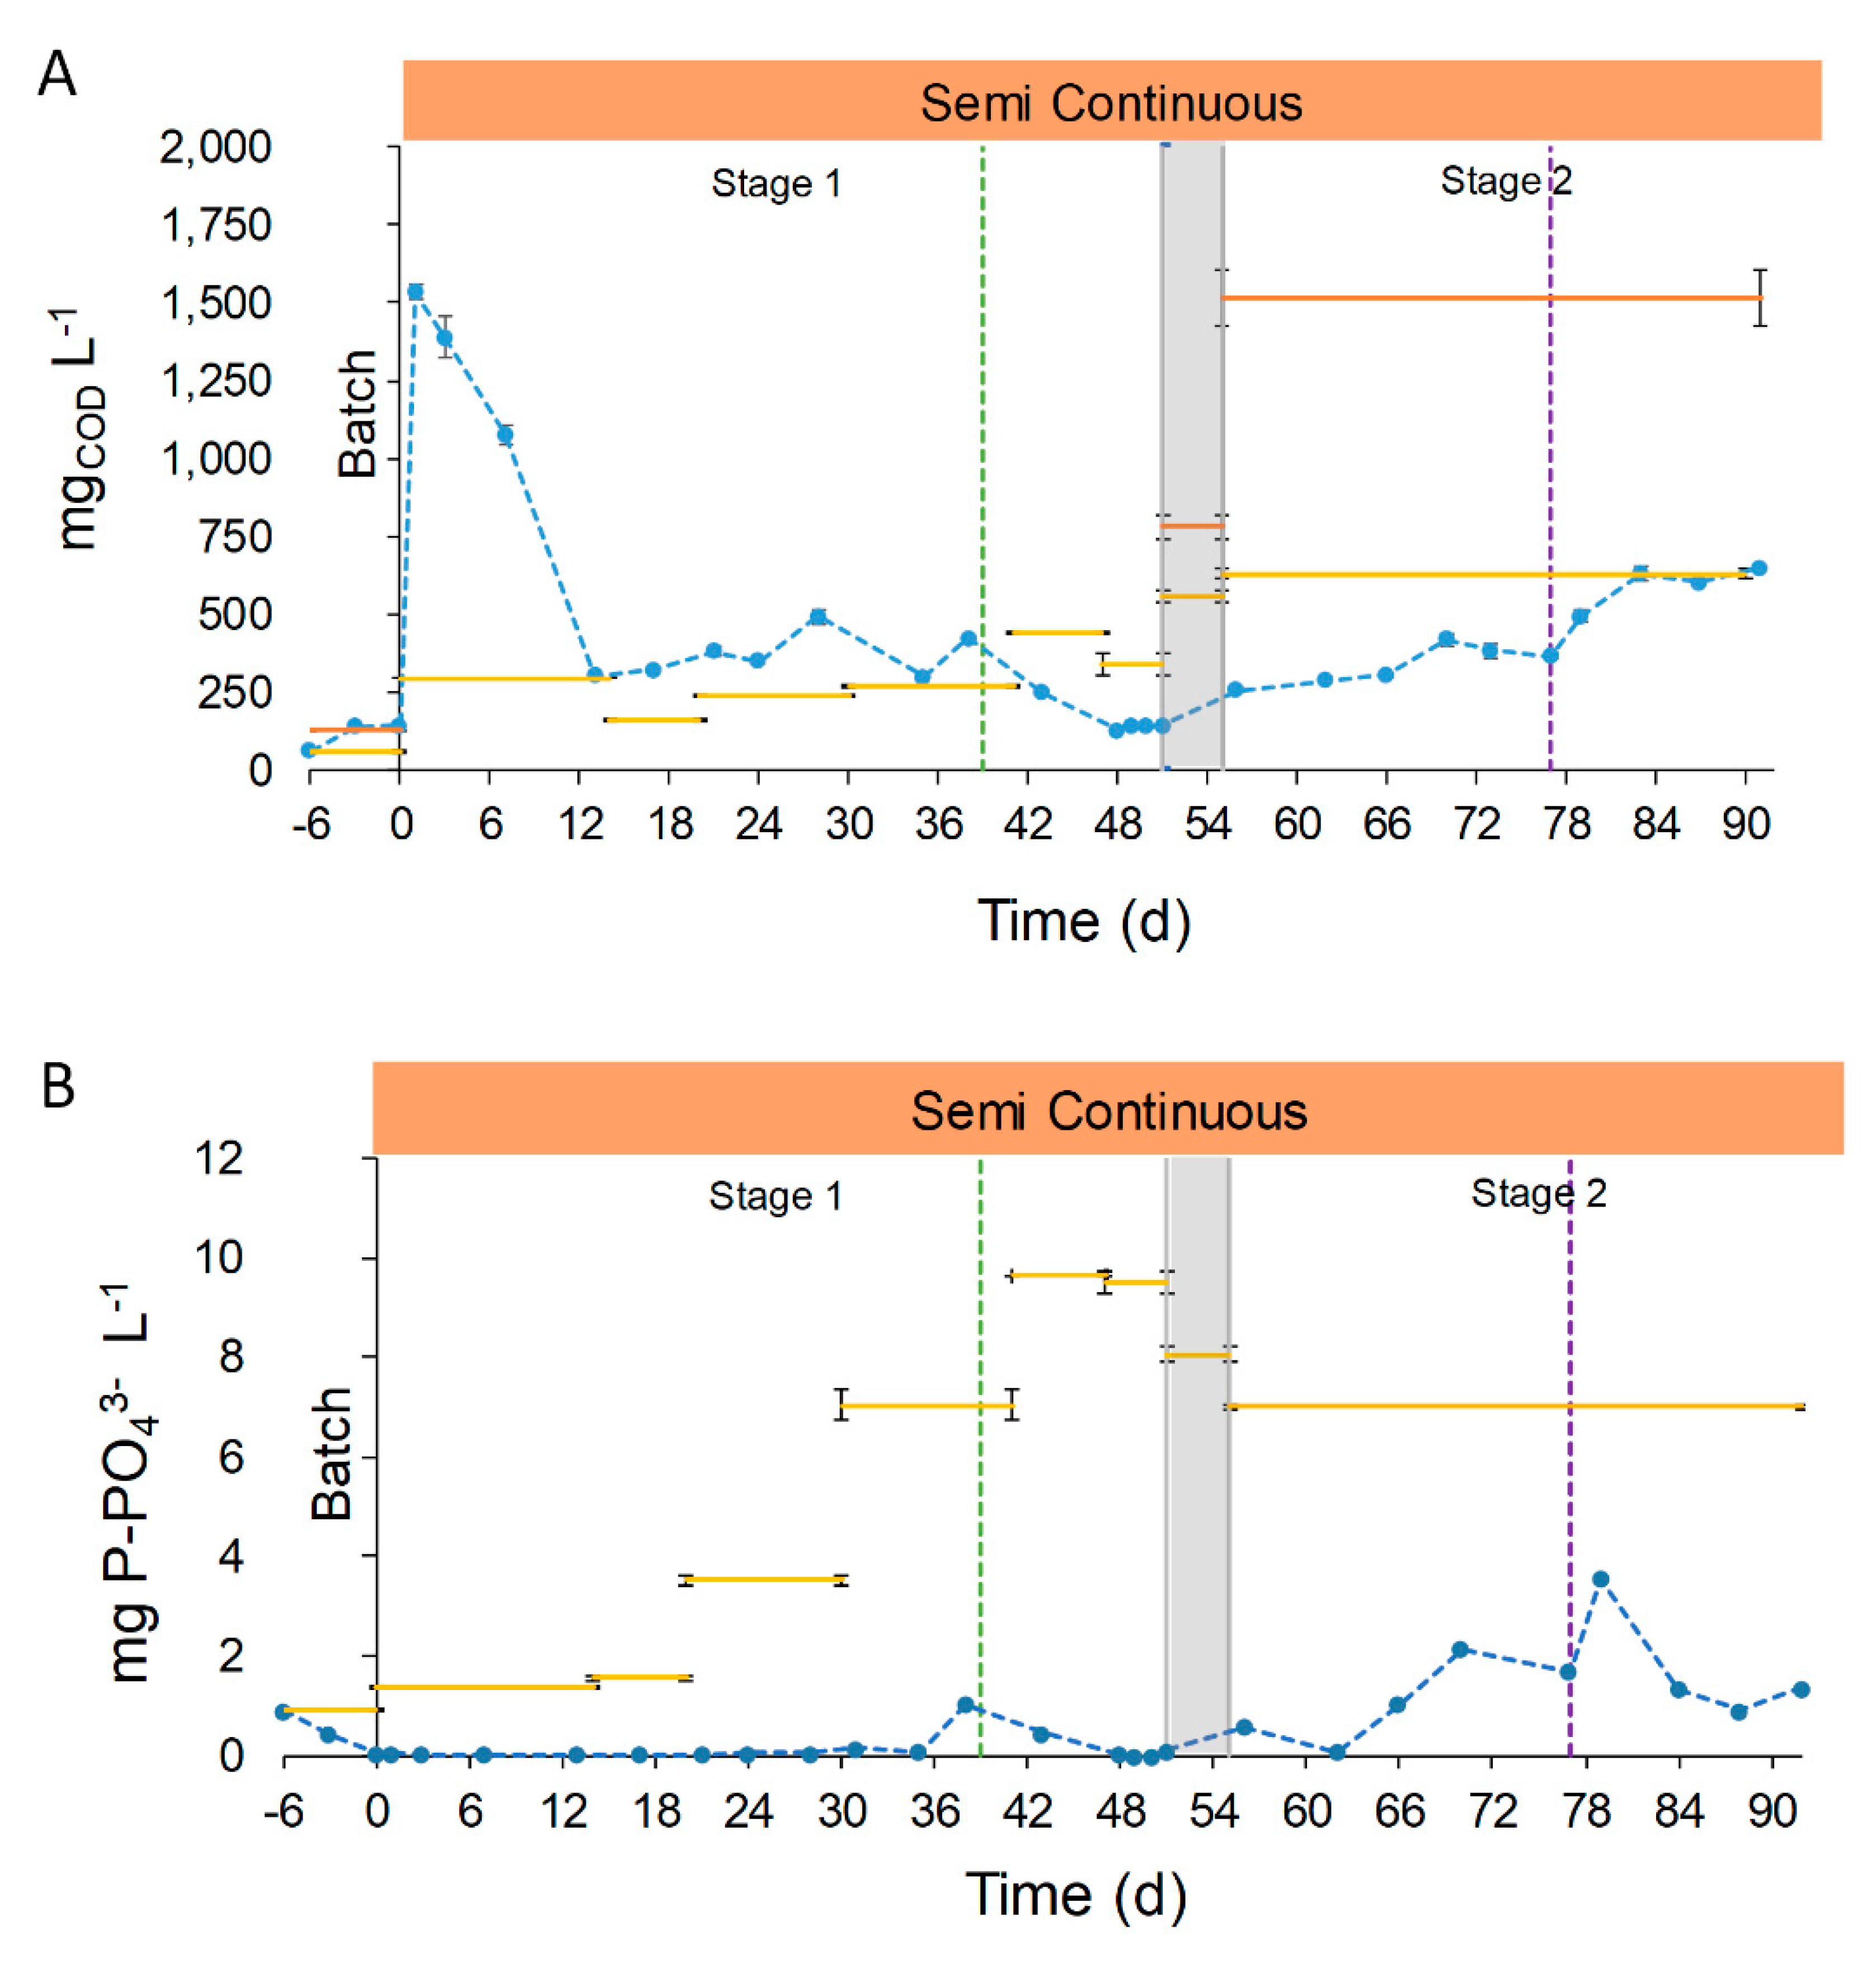
The COD (soluble Chemical Oxygen Demand, sCOD) concentration in the effluent in the period 13–77 days had an average value of 299.1 ± 108.2 mg sCOD L−1. From day 0 to 12 the sCOD concentration raised, probably due to the acclimation to semi-continuous operation (Stage 1, manual feeding, Figure 5A). Between days 13 and 38, (Stage 1, manual feeding) the concentration in the outlet was higher than that in the inlet (367.5 ± 71.5 vs. 239.5 ± 59.0 mg sCOD L−1, respectively). This can be explained considering the low concentration of organic components of the UFD and the microorganism activity. Firstly, the ultrafiltration removed most of the organic compounds of the digestate, and worked as a pretreatment for COD removal. In addition, anaerobic digestion consumes most of the organic biodegradable fraction of the OFMSW, resulting in anaerobic digestates with low biodegradable COD concentration [43]. Furthermore, microalgae-bacteria consortia could contribute to the increase in effluent organic load by secretion of organic compounds (extracellular polymeric substances) [41,44,45]. From days 39 to 51 (Stage 1, automatic feeding), the concentration in the effluent was 159.5 ± 50.5 mg sCOD L−1, lower than the previous period (367.5 ± 71.5 mg sCOD L−1). The lower concentration in the effluent and the higher one in the influent resulted in an overall removal percentage of 35.7 ± 1.3%. The decrease in the sCOD concentration could be attributed to a decrease in the secretion of organic compounds by the microalgae-bacteria consortia, and will be discussed more in details in Section 3.2.4.
The sCOD concentration in the effluent during the first period of Stage 2 (days 56–77) was higher than the last days of Stage 1 (days 56–77, 335.7 ± 8.0 vs. 159.5 ± 50.5 mg sCOD L−1, respectively) because of the higher sCOD concentration of the FD. At the end of Stage 2 (days 83 to 91 the), sCOD concentration in the effluent was similar to the influent, as a result of the reduced photosynthetic growth caused by the low solar irradiances (October 14th to October 22nd, 8.0 ± 2.5 MJ m−2). The effect of reducing the culture depth from 7.5 to 5.0 cm was not enough to sustain the photosynthetic growth to remove the sCOD. It should be mentioned that the overall concentration of effluents in Stage 1 (days 13–51) was statistically similar to that of days 56–77 of Stage 2 (335.7± 62.7 vs. 280 ± 123.3 mg sCOD L−1, respectively). As previously discussed, the comparison of the results with other authors is difficult because of the novelty of the use OFMSW digestate as the influent, the filtration method and the intrinsic conditions of the raceway operation. However, Morales-Amaral et al. [41] found a similar trend in COD removal in their work. When the authors used Arnon culture media as the influent, with a low sCOD concentration, the effluent had a higher concentration than the influent due to the organic secretions of microalgae. Nevertheless, when they employed an anaerobic digestate with a higher sCOD concentration (dilution 3:10), the effluent remained with a similar concentration than the previous period.
The results showed that the use of raw digestate as the influent does not compromise COD removal during end summer conditions (days 56–77, September 17th to October 8th, 11.7 ± 4.0 MJ m−2). It is important to highlight that, even in end summer conditions and employing FD, the sCOD concentration in the effluent remained similar in comparison with the middle summer conditions (Stage 1).
The phosphorous concentration in the effluent during the first 51 days of semi-continuous operation was always below 1.0 mg P-PO43−, with a mean value of 0.1 ± 0.2 mg P-PO43− (Stage 1, Figure 5B). During this period, the phosphorous removal achieved a mean value of 97.4 ± 3.5%. The low concentration of phosphorous was due to biological consumption and chemical precipitation at alkaline pH (8.5). Increasing the P concentration in the influent did not have effects on the removal efficiency, highlighting that it is the limiting nutrient in this kind of digestate. Phosphorous concentration after day 56 began to increase until the end of the operation, reaching a mean value of 1.4 ± 1.0 mg P-PO43− (Stage 2), with a removal percentage decreasing to 79.9 ± 14.5%. The differences between the previous operation phase are justified by the reduction of solar radiances (10.6 ± 3.8 vs. 19.4 ± 4.7 MJ m−2, respectively) and the higher composition in suspended solids of FD in comparison with UFD (587.5 ± 17.7 vs. 20.7 ± 9.9 mg TSS L−1, respectively). These factors had a high impact on photosynthetic activity, involving the reduction on biological uptake and chemical precipitation due to pH (Figure 5B).

3.2.3. Nitrogen Removal

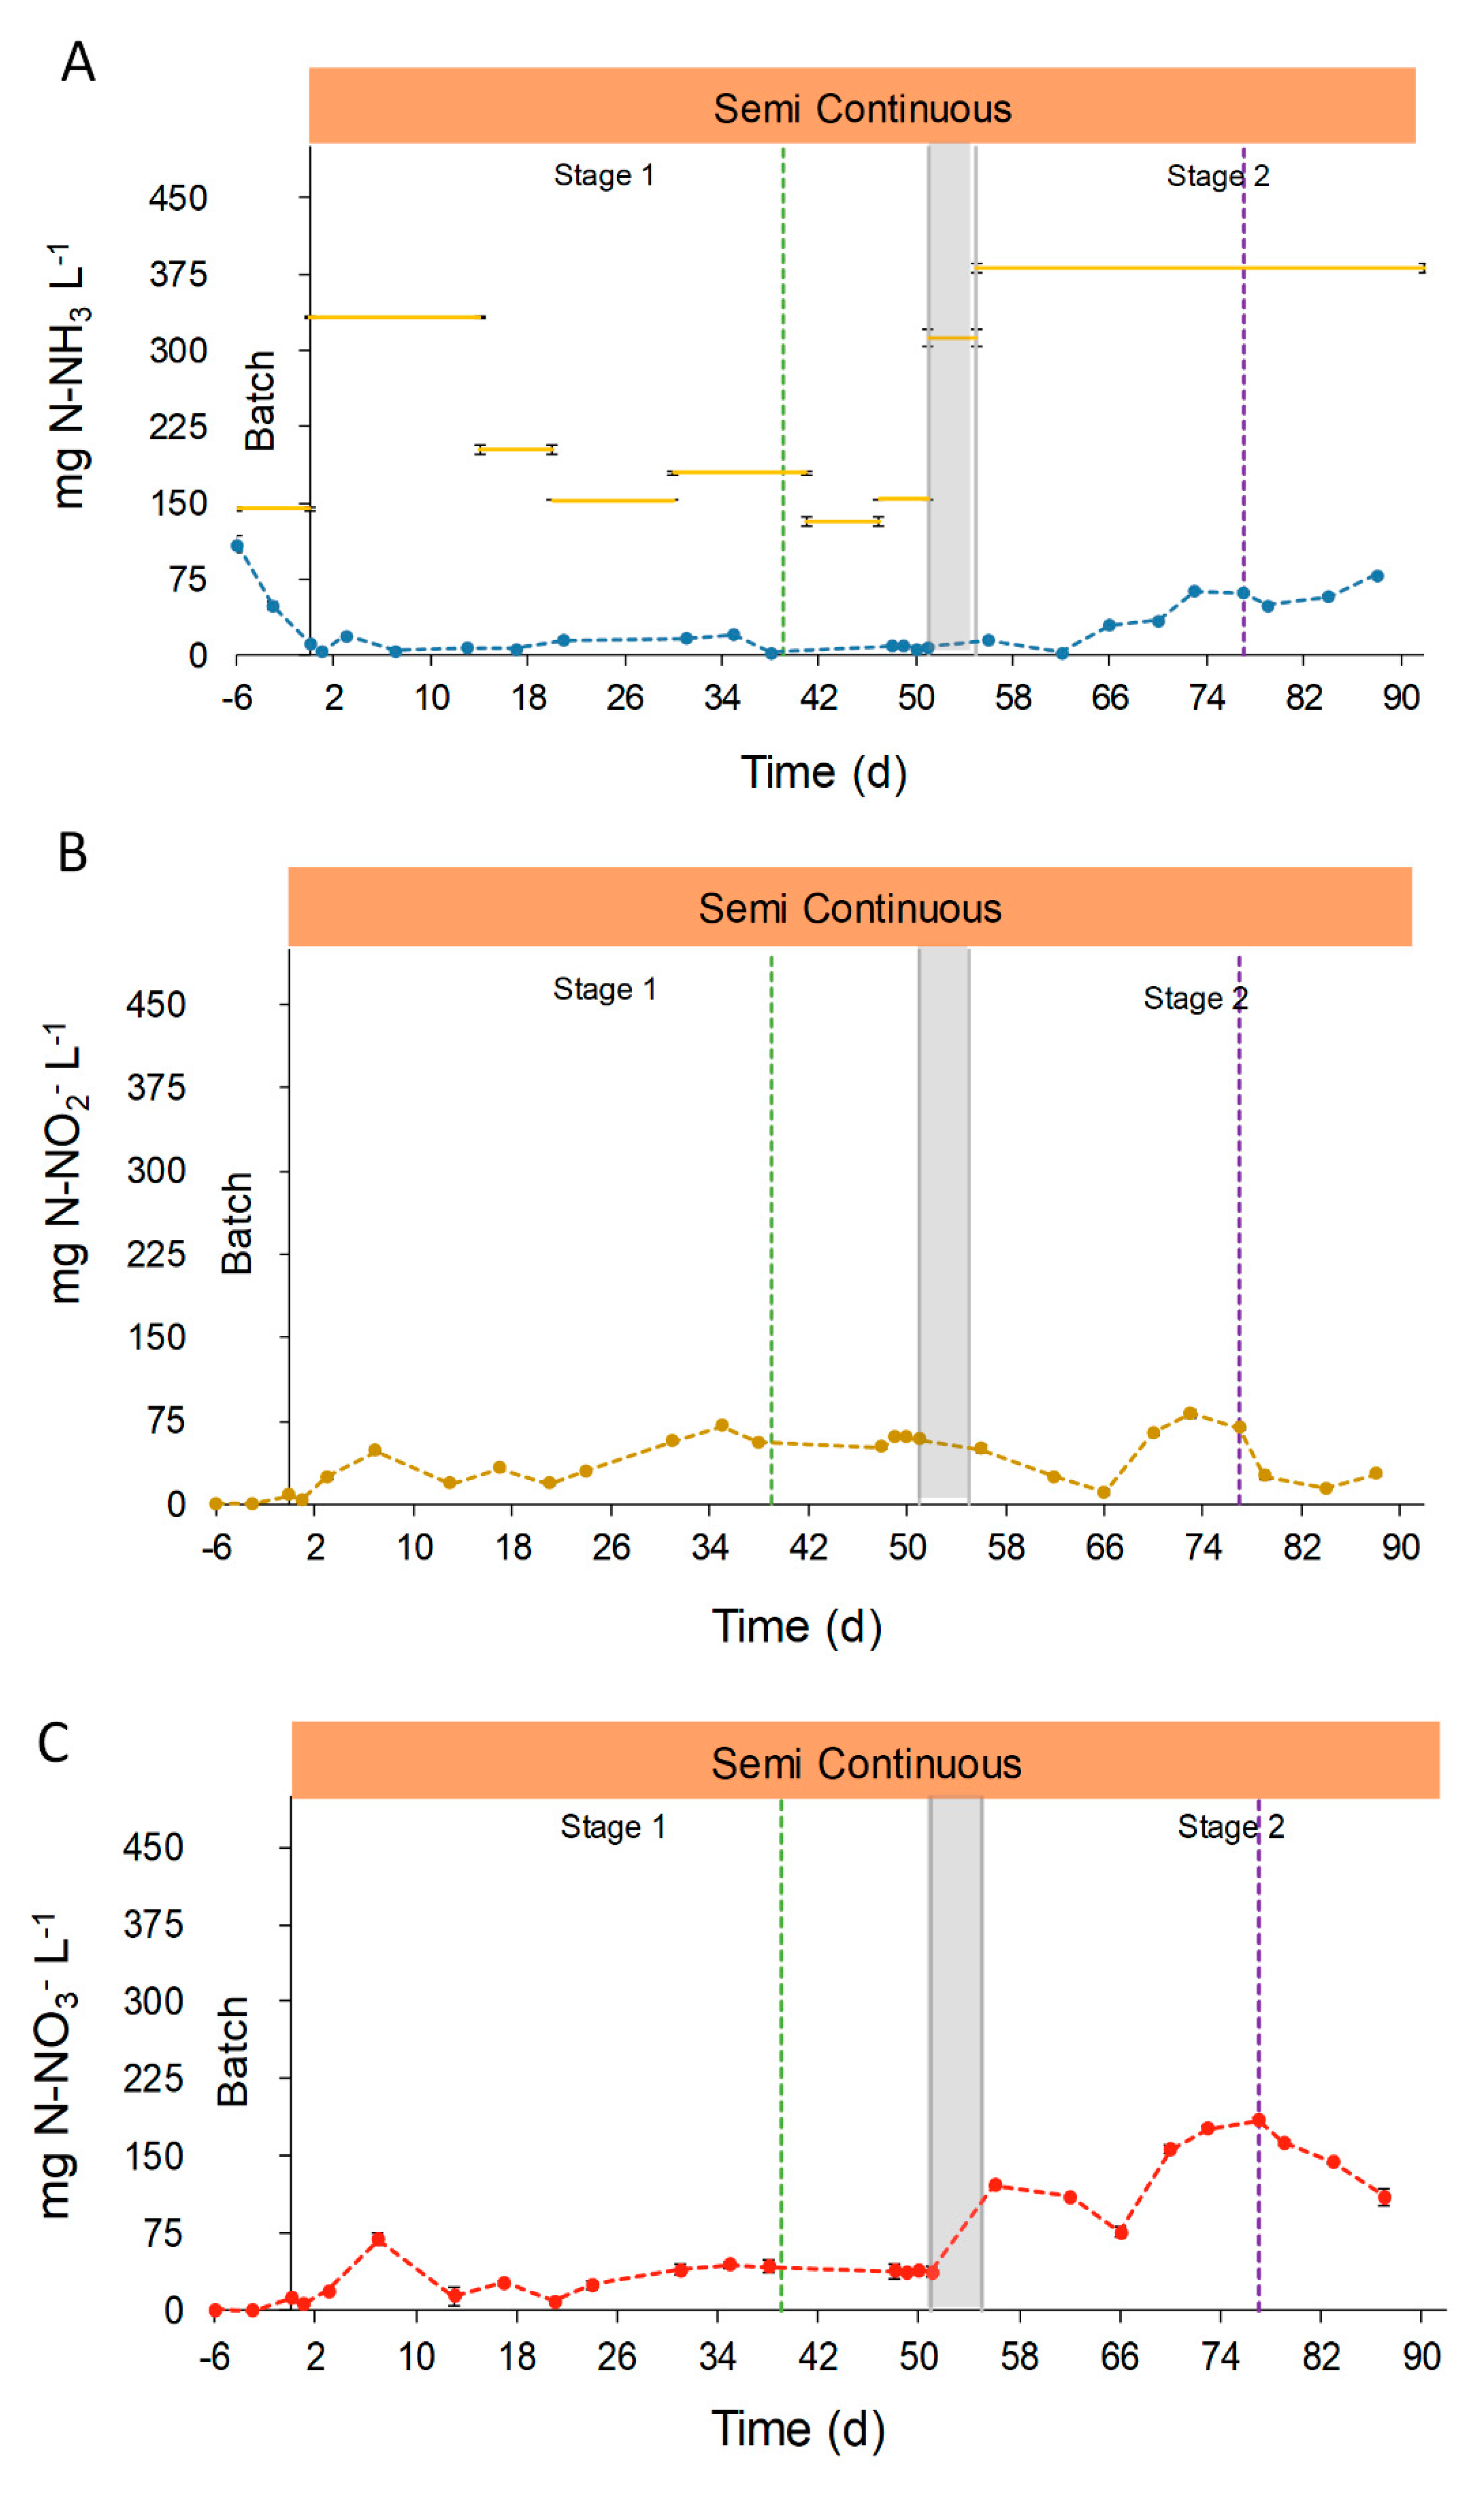
The main nitrogen compounds in effluents were ammonia (NH3), nitrites (NO2) and nitrates (NO3). The concentration of these compounds changed during the pond operation due to the environmental conditions, the influent composition and the biologic activity of photosynthetic and nitrifying microorganisms (Figure 6). In the beginning, the N-NH3 concentration in the effluent decreased during the batch phase until 4.1 ± 0.1 mg N-NH3 L−1. After this acclimation period, the concentration in effluents reached a mean value of 10.3 ± 5.9 mg NH3 L−1 during Stage 1. In contrast, the N-NH3 concentration in the effluent during Stage 2 increased, reaching 43.9 ± 24.8 mg NH3 L−1. This increase was due to a higher inlet concentration (Figure 6A), owing to the fact that the ultrafiltration step caused a significant ammonia evaporation from the UFD, together with the decrease in solar radiances and temperatures that led to a reduction of photosynthetic uptake and ammonia volatilization. The nitrogen oxides, NO2 and NO3, were not present in the reactor during the batch phase. On the other hand, during semi-continuous operation, N-NO2 increased its concentration, which, however, showed no significant differences between Stage 1 and 2 (42.0 ± 20.3 and 40.7 ± 26.0 mg N-NO2 L−1, respectively). In contrast, the concentration of N-NO3 had significant changes between the two stages. During Stage 1, the average concentration in the effluent reached 31.8 ± 16.8 mg N-NO3 L−1 in opposition with 138.0 ± 35.8 mg N-NO3 L−1 measured during Stage 2. These N-NOx concentrations, found during the pond operation, are in accordance with the even higher values reported by Posadas et al. of 148–293 N-NO3 L−1 in the treatment of anaerobic digestate centrate [46]. The N-NOx concentration achieved in this study, and in the mentioned work herein, demonstrate the ability of the photosynthetic system to promote nitrification during the growth of microalgae in anaerobic digestates [46]. Ultimately, the activity of nitrifying bacteria as Nitrosomonas and Nitrobacter explains this increase of NOx concentration [47,48,49].
To gain a better understanding of the total nitrogen removal process, the nitrogen mass balance was analyzed. For this calculation, it was assumed that the nitrogen in the inlet (composed mainly as N-NH3, while N-NOx concentration was negligible) could leave the reactor in the form of microalgae-bacteria biomass, converted into N-NOx, kept as soluble N-NH3, or lost to the atmosphere due to stripping. The raceway operation demonstrated to be highly efficient on N-NH3 removal from the OFMSW digestate, with an average reduction of 92.1%. However, total nitrogen removal during the semi-continuous operation was characterized by significant changes, ranging from 97.5% at the beginning of Stage 1, down to 15.4% on day 73, Stage 2 (Figure S3). Consequently, nitrogen was not completely removed from the effluent, achieving an overall removal capacity of 1.3 ± 0.8 g m−2 d−1, corresponding to an average removal efficiency of 49.4%, (Table S1 of Supplementary Material). These differences between NH3 and total N removal were due to the conversion of ammonia into NOx by the nitrifying microorganisms. In fact, 42.7% of the inlet N-NH3 was converted into N-NOx in the reactor effluent. Partial nitrogen removal due to nitrification is often found in photosynthetic wastewater treatments, and can achieve values between 11–47% [20,41].
However, the main nitrogen removal mechanisms in open systems are the biomass uptake and the ammonia volatilization. These mechanisms together entailed the average removal of 49.4%, with ammonia stripping being the main removal mechanism, accounting for the 37.6% with respect to the nitrogen inlet. The pH set point control (pH = 8.5) contributed to minimize the ammonia release to the air. However, despite the operational design, open raceways entail a considerable ammonia stripping that cannot be avoided.
The stripping removal values found in our work are in accordance with others, with reported values between 21–73% [40,41]. The last nitrogen removal mechanism, i.e., biomass uptake, accounted for 11.8% of the inlet nitrogen, which is similar to the value of 14% found by Alcántara et al. [20]. This low value in comparison with ammonia stripping was justified by the relatively low microalgae productivity achieved during the pond operation. The low availability of ammonium and the high nitrifying competition could have hampered the microalgae growth, since NOx uptake requires more metabolic energy than NH4+ [50]. It should be mentioned that, although oxidized N species do not account for actual nitrogen removal from the digestate, the proposed system allows a partial ammonia removal and promotes nitrification without the need of external oxygenation, i.e., exploiting the photosynthetic oxygen production.

3.2.4. Dissolved Oxygen

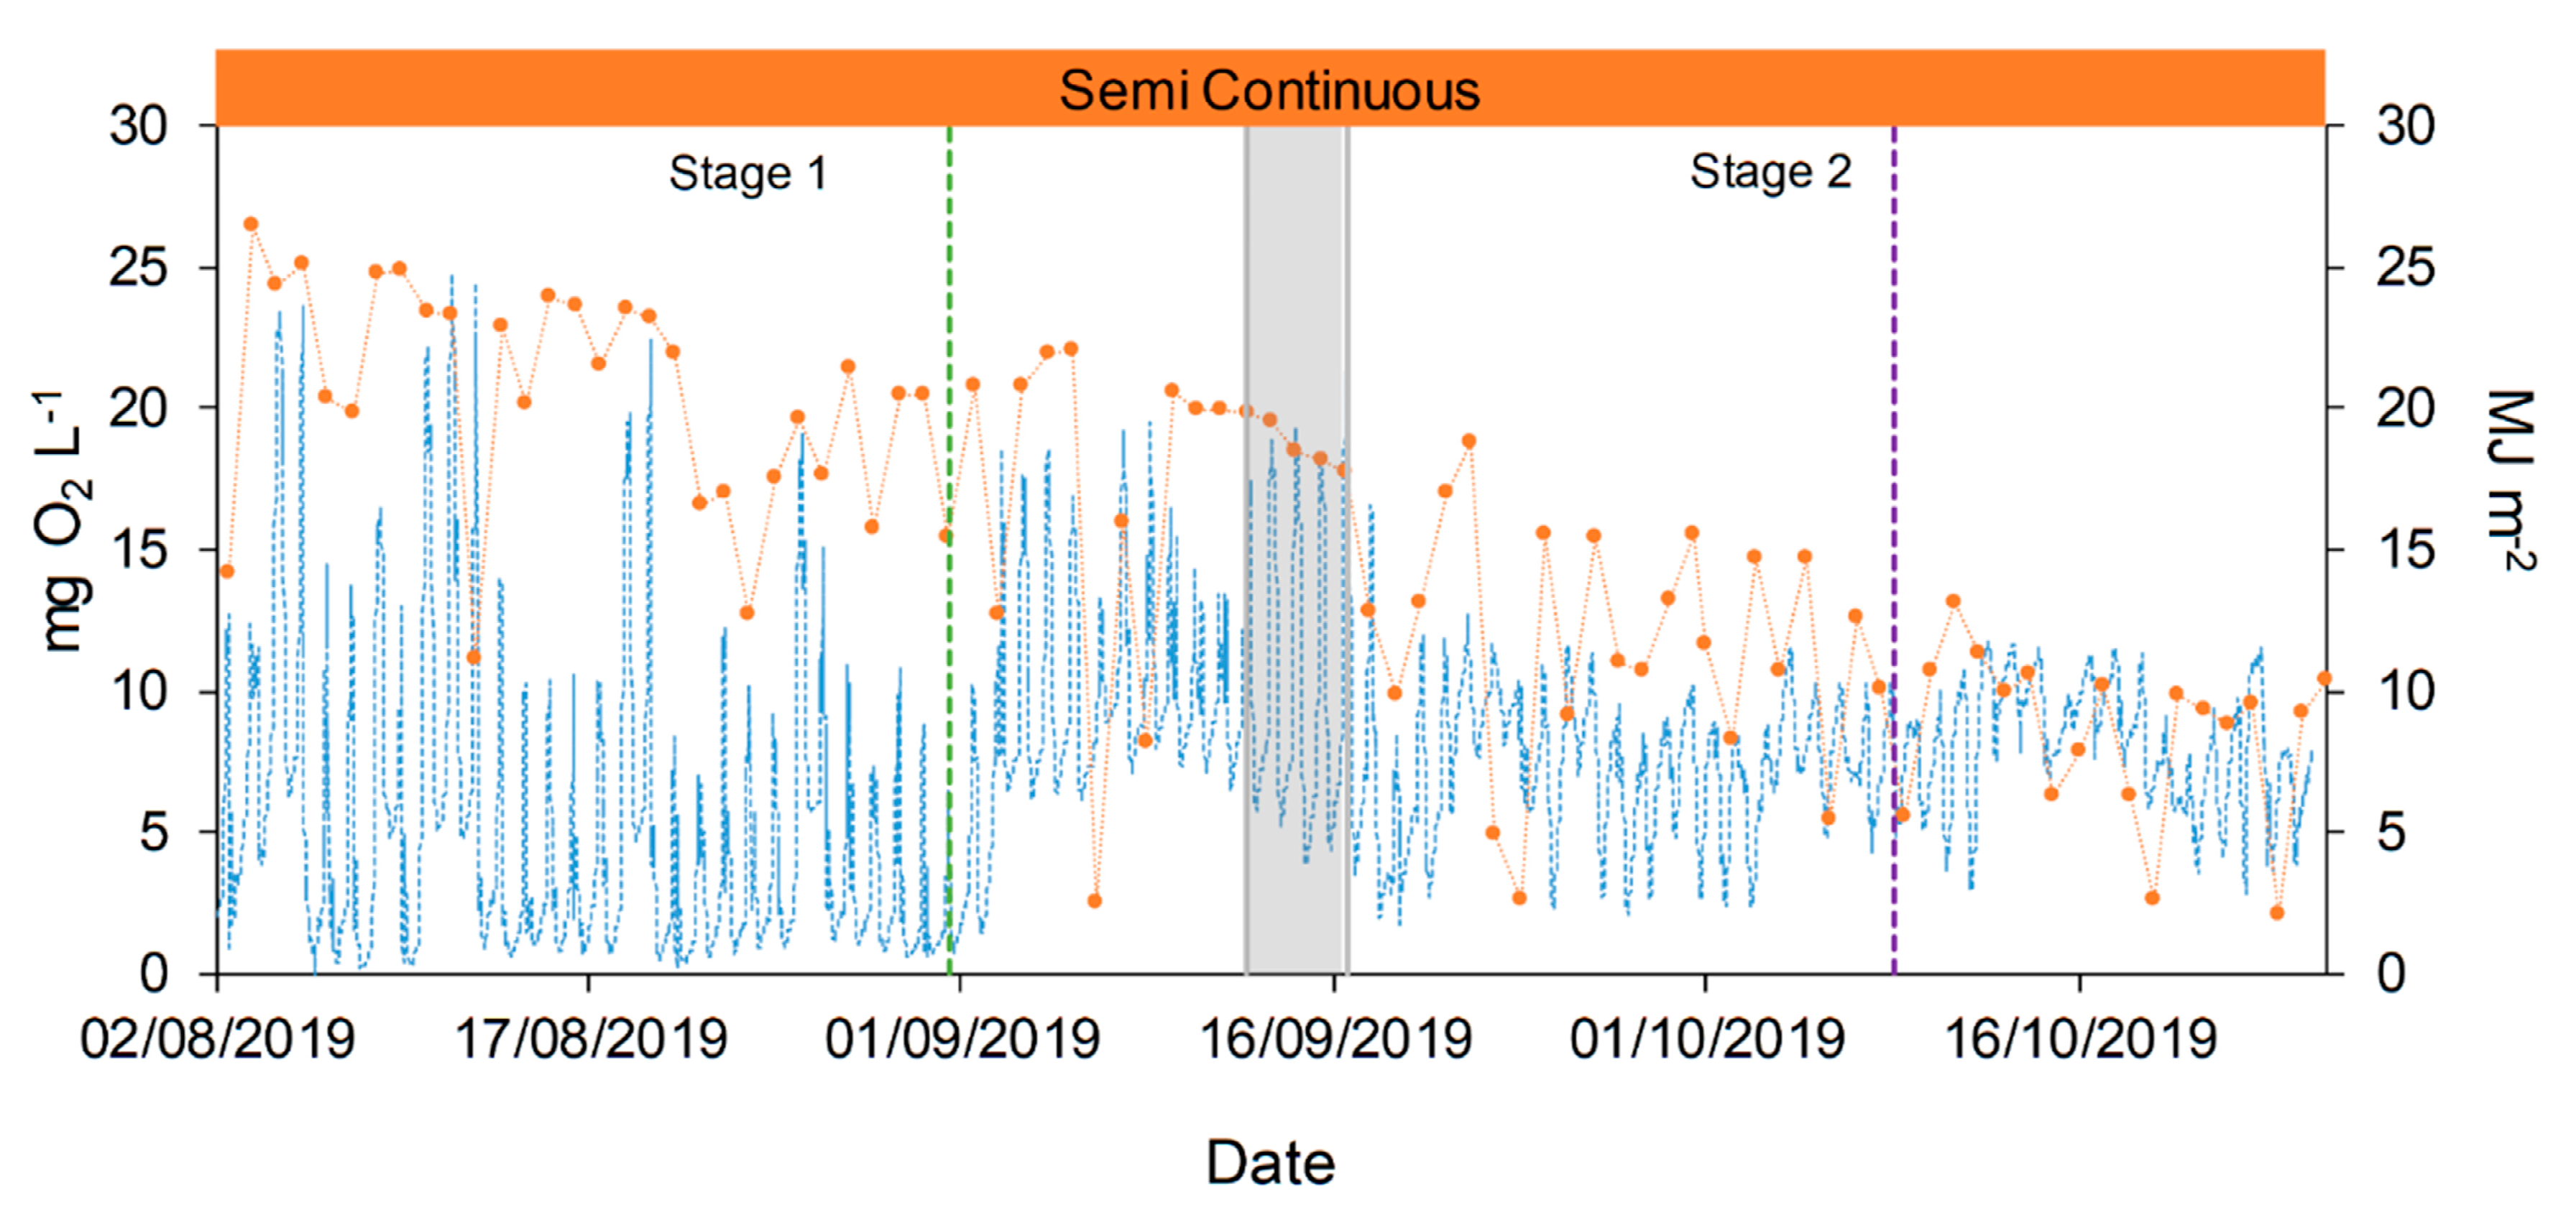
Dissolved Oxygen (DO) was measured over all the duration of the experimental campaign, and it allowed for a deeper comprehension of the growth performances of microalgae and consortia. The growth of microalgae lead to high variation in daily and seasonal DO concentration (from almost 0 until 25 mg O2 L−1, Figure 7), in agreement with literature values [39,51]. DO showed a clear dependence on solar radiances and weather conditions, affected by rainy days (maximum values 13–16 mg O2 L−1), with consequences also on the TSS and Chlorophyll A concentrations (day 17, Figure 4). At the end of the operation period (October) the lower irradiances caused a general decrease of DO, as expected.
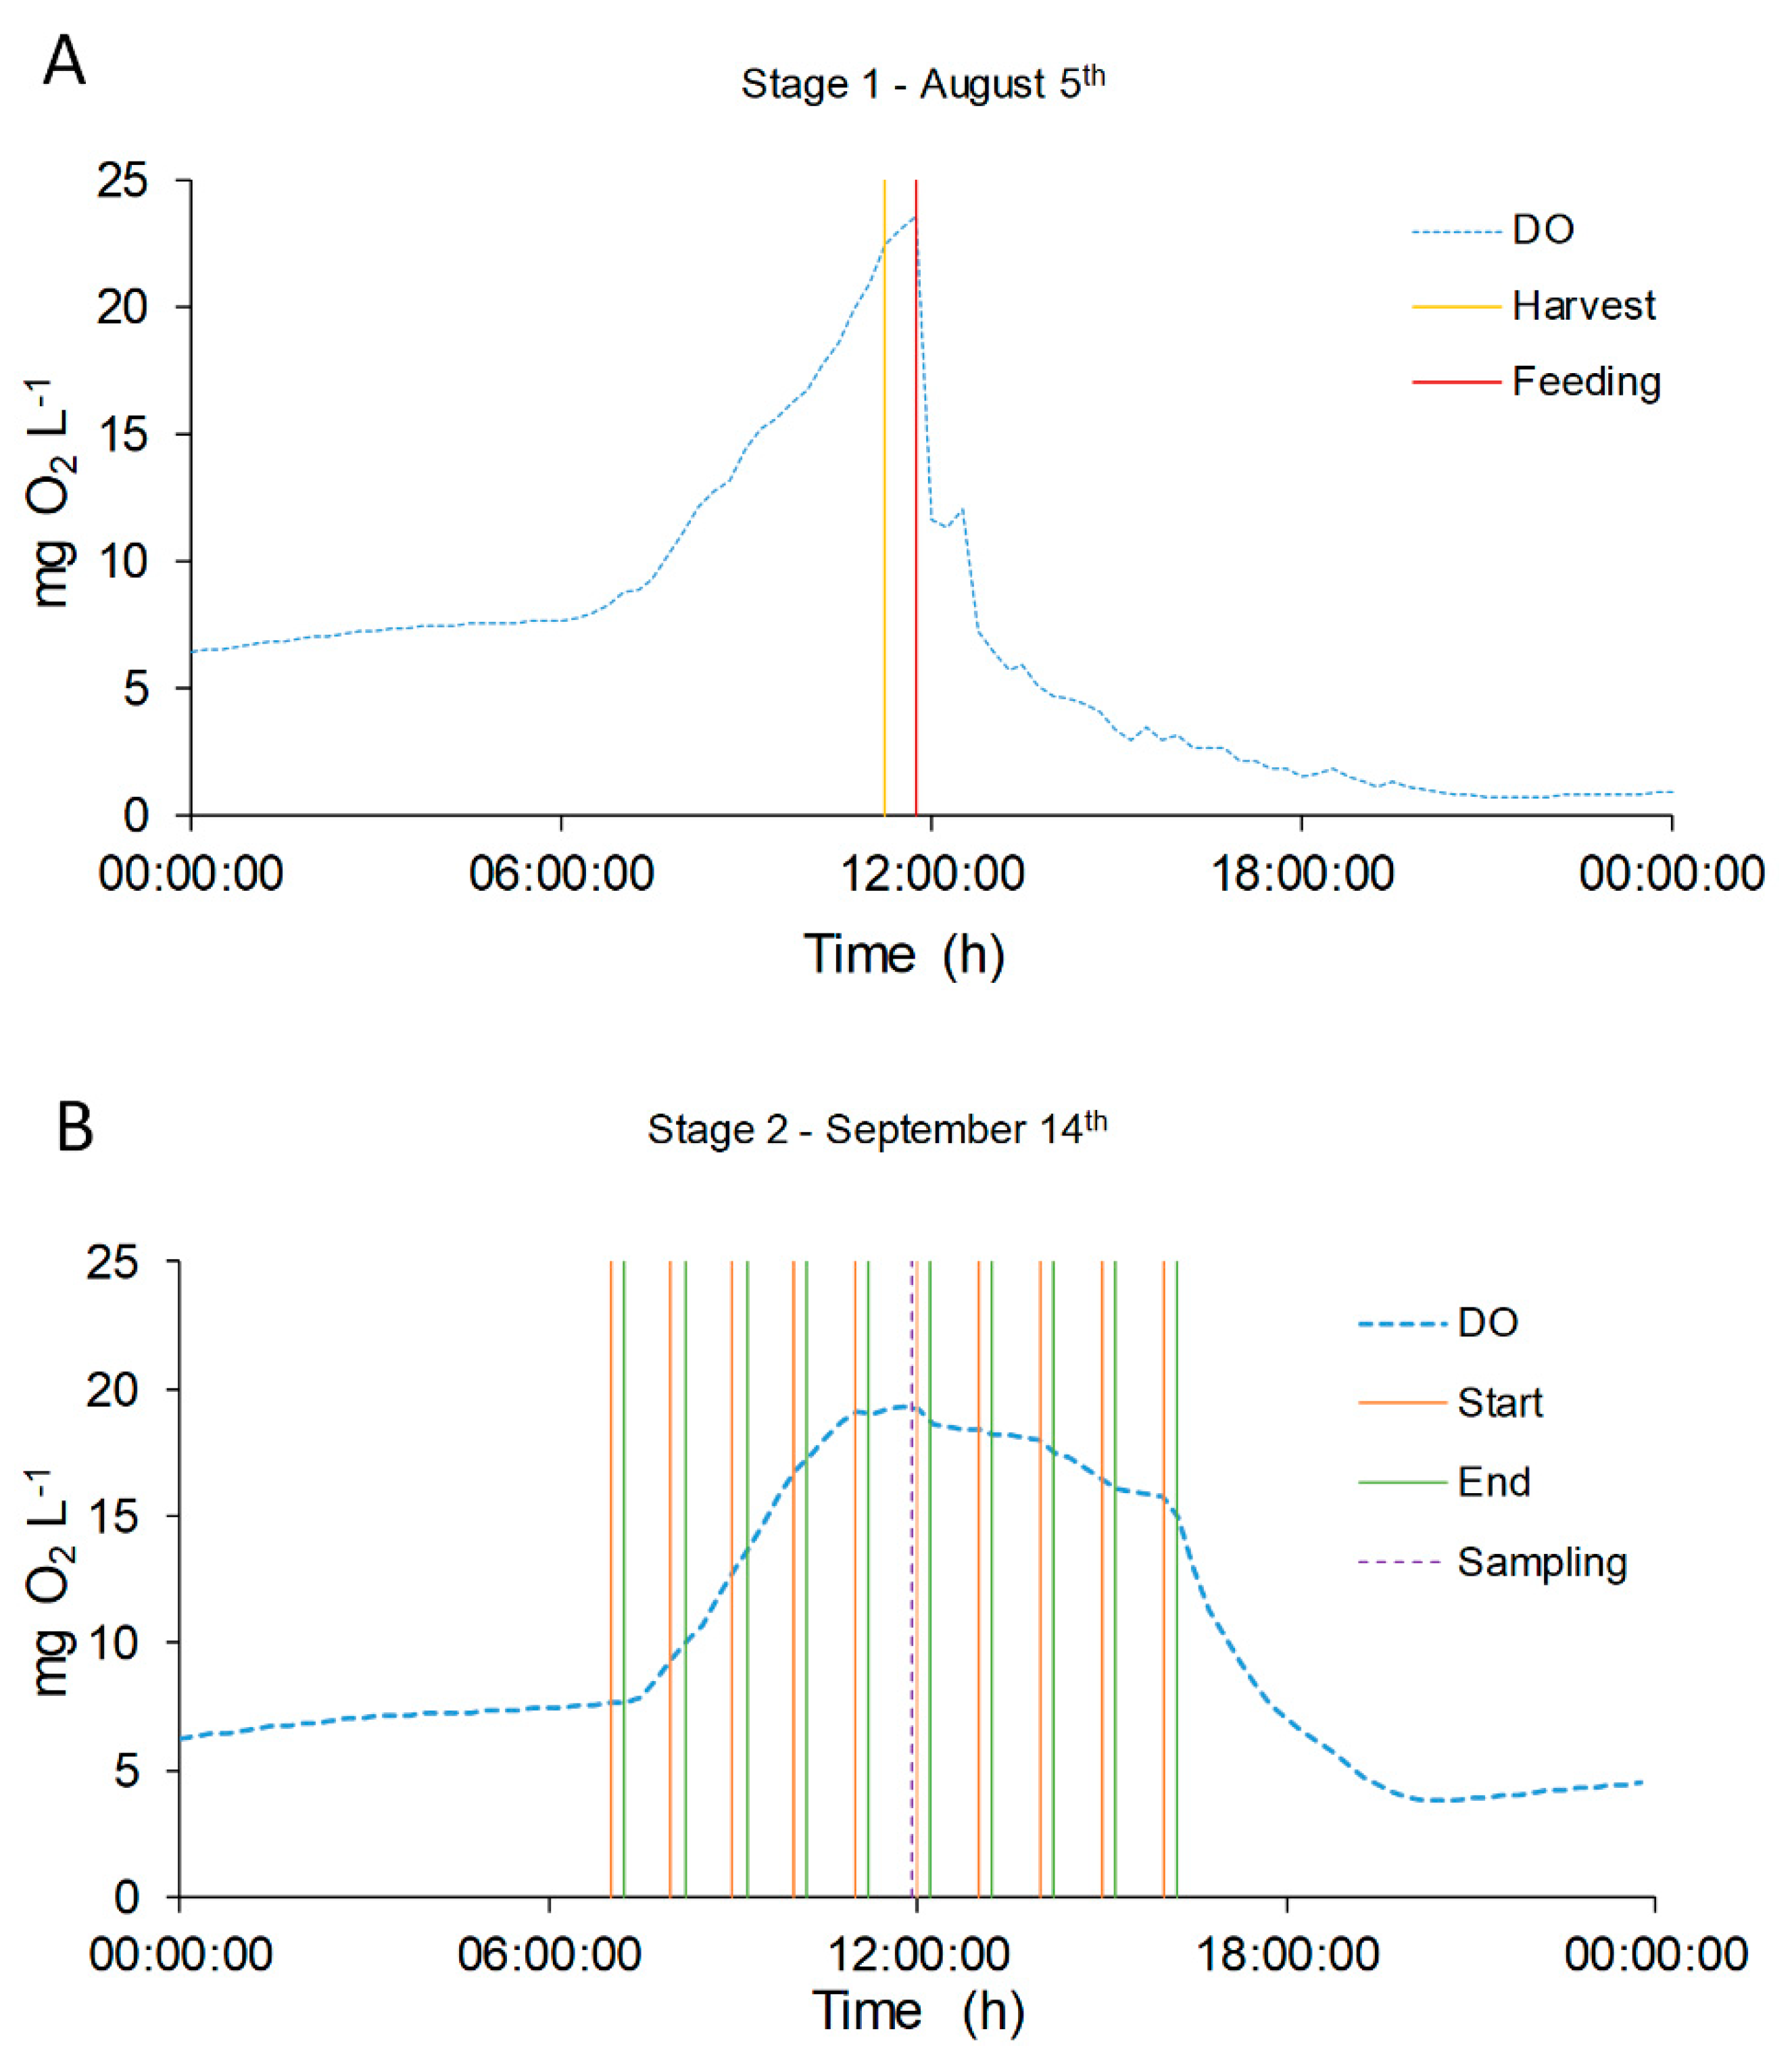
More interestingly, it was found that the operative conditions strongly influenced the DO profiles. During manual feeding, just after the addition of fresh medium, the DO profile showed a sharp fall, reaching minimum values near 0–1 mg O2 L−1, and the DO values did not recover the previous concentration until the following day (Figure 8A). There are two possible explanations of such a phenomenon: one can be related to the addition of fresh organic matter and ammonium at one single time (midday), which caused the oxygen consumption by an increased heterotrophic metabolism of bacteria. On the other hand, it is well known that DO values close to 20–25 mg O2 L−1 can induce photorespiration pathways in microalgae and inhibition phenomena [51,52,53]. Thus, the photosynthesis may be affected by these high values reached before the feeding event. Interestingly, when the feeding mode was changed, with more frequent additions of fresh digestate, the DO profile showed a more stable trend, without sharp reductions. This is confirmed also by looking at the results of other variables. In Figure 4A, the different feeding mode caused a decrease of the TSS, while it affected less the chlorophyll content, thus suggesting that heterotrophic bacteria growth is less favorable in this operative condition. A lower COD content may also be explained by a lower stress of microalgae due to oxygen inhibition, leading to a lower secretion of exopolysaccharides (EPS). In summary, the feeding mode had an overall effect of stabilizing the reactor performances, as can be also observed in the case of nitrogen removal and speciation.

4. Conclusions

In this work, the liquid fraction of OFMSW digestate was used to cultivate microalgae, both in preliminary lab-scale experiments and in an outdoor pilot plant. The cultivation of a microalagae consortium was found to be feasible, with biomass productivity comparable to literature values. On the other hand, the dark color of the digestate, as well as the high content of suspended solids, required pre-treatment of the liquid, and dilution on the field. The pretreatment method played a key role on the reactor performances, affecting the light penetrability and the nutrient availability. The control of operating conditions also strongly affected the reactor performances. Based on a semi-continuous operation of the plant, the frequency of the feed had a strong impact on microalgal growth and oxygen concentration, leading to a more stable operation of the plant. Finally, due to the high turbidity of the medium, the reactor was found to be very susceptible to the seasonal changes of light, reducing the potential applicability of such a system at middle latitudes. Concerning nutrient removal, strong competition with nitrifiers affected the efficiency of nitrogen removal. This point should be specifically addressed in further work, aiming at reducing the nitrification process and boosting the microalgal exploitation of nitrogen.

Supplementary Materials

The following are available online at https://www.mdpi.com/2305-7084/4/2/25/s1, Figure S1: Scheme of automatic raceway feeding, Figure S2: pH evolution during the raceway operation period, Figure S3: Main nitrogen conversion and removal mechanisms from raceway reactor, Table S1: Nitrogen transformations during raceway operation, Table S2: Characterization of anaerobic digestates.

Author Contributions

Conceptualization, E.B. and E.S.; investigation, S.B.-V.; data curation, S.B.-V. and E.B.; writing—original draft preparation, S.B.-V. and E.B.; writing—review and editing, E.S. and A.B.; supervision, E.S. and A.B.; project administration, A.B.; funding acquisition, A.B. All authors have read and agreed to the published version of the manuscript.

Funding

This research was funded by POR FESR 2014–2020, Action 1.1.4 “Support for collaborative R&D activities for the development of new sustainable technologies, new products and services”. DGR n. 1139, 19 July 2017.

Acknowledgments

The authors would like to acknowledge Berica Impianti s.r.l. for providing the liquid digestate used in the study, and support in the installation of the pilot raceway pond. The authors also thank Alice Renesto and Giulia Trentin for assistance with the lab-scale experiments.

Conflicts of Interest

The authors declare no conflict of interest. The funders had no role in the design of the study; in the collection, analyses, or interpretation of data; in the writing of the manuscript, or in the decision to publish the results.

References

  1. Logan, M.; Visvanathan, C. Management strategies for anaerobic digestate of organic fraction of municipal solid waste: Current status and future prospects. Waste Manag. Res. 2019, 37, 27–39. [Google Scholar] [CrossRef] [PubMed] [Green Version]
  2. Campuzano, R.; González-Martínez, S. Characteristics of the organic fraction of municipal solid waste and methane production: A review. Waste Manag. 2016, 54, 3–12. [Google Scholar] [CrossRef] [PubMed]
  3. Albanna, M. Anaerobic Digestion of the Organic Fraction of Municipal Solid Waste. In Management of Microbial Resources in the Environment; Malik, A., Grohmann, E., Alves, M., Eds.; Springer: Dordrecht, The Netherlands, 2013; pp. 313–340. ISBN 978-94-007-5931-2. [Google Scholar]
  4. Sisto, R.; Sica, E.; Lombardi, M.; Prosperi, M. Organic fraction of municipal solid waste valorisation in southern Italy: The stakeholders’ contribution to a long-term strategy definition. J. Clean. Prod. 2017, 168, 302–310. [Google Scholar] [CrossRef]
  5. Scarlat, N.; Dallemand, J.-F.; Fahl, F. Biogas: Developments and perspectives in Europe. Renew. Energy 2018, 129, 457–472. [Google Scholar] [CrossRef]
  6. Barbera, E.; Menegon, S.; Banzato, D.; D’alpaos, C.; Bertucco, A. From biogas to biomethane: A process simulation-based techno-economic comparison of different upgrading technologies in the Italian context. Renew. Energy 2019, 135, 663–673. [Google Scholar] [CrossRef]
  7. Angelidaki, I.; Treu, L.; Tsapekos, P.; Luo, G.; Campanaro, S.; Wenzel, H.; Kougias, P.G. Biogas upgrading and utilization: Current status and perspectives. Biotechnol. Adv. 2018, 36, 452–466. [Google Scholar] [CrossRef] [Green Version]
  8. Banks, C.J.; Chesshire, M.; Heaven, S.; Arnold, R. Anaerobic digestion of source-segregated domestic food waste: Performance assessment by mass and energy balance. Bioresour. Technol. 2011, 102, 612–620. [Google Scholar] [CrossRef] [Green Version]
  9. Chuka-ogwude, D.; Ogbonna, J.; Moheimani, N.R. A review on microalgal culture to treat anaerobic digestate food waste effluent. Algal Res. 2020, 47, 101841. [Google Scholar] [CrossRef]
  10. Jain, S.; Newman, D.; Cepeda-Márquez, R.; Zeller, K. Global Food Waste Management: An Implementation Guide for Cities; World Biogas Association: London, UK, 2018; pp. 1–145. [Google Scholar]
  11. Xia, A.; Murphy, J.D. Microalgal Cultivation in Treating Liquid Digestate from Biogas Systems. Trends Biotechnol. 2016, 34, 264–275. [Google Scholar] [CrossRef]
  12. Masse, L.; Massé, D.I.; Pellerin, Y. The effect of pH on the separation of manure nutrients with reverse osmosis membranes. J. Memb. Sci. 2008, 325, 914–919. [Google Scholar] [CrossRef]
  13. Serna-Maza, A.; Heaven, S.; Banks, C.J. Ammonia removal in food waste anaerobic digestion using a side-stream stripping process. Bioresour. Technol. 2014, 152, 307–315. [Google Scholar] [CrossRef] [PubMed] [Green Version]
  14. Zhang, T.; Bowers, K.E.; Harrison, J.H.; Chen, S. Releasing Phosphorus from Calcium for Struvite Fertilizer Production from Anaerobically Digested Dairy Effluent. Water Environ. Res. 2010, 82, 34–42. [Google Scholar] [CrossRef] [PubMed] [Green Version]
  15. Magrí, A.; Béline, F.; Dabert, P. Feasibility and interest of the anammox process as treatment alternative for anaerobic digester supernatants in manure processing—An overview. J. Environ. Manag. 2013, 131, 170–184. [Google Scholar] [CrossRef] [PubMed]
  16. Bjornsson, W.J.; Nicol, R.W.; Dickinson, K.E.; McGinn, P.J. Anaerobic digestates are useful nutrient sources for microalgae cultivation: Functional coupling of energy and biomass production. J. Appl. Phycol. 2013, 25, 1523–1528. [Google Scholar] [CrossRef]
  17. Li, K.; Liu, Q.; Fang, F.; Luo, R.; Lu, Q.; Zhou, W.; Huo, S.; Cheng, P.; Liu, J.; Addy, M.; et al. Microalgae-based wastewater treatment for nutrients recovery: A review. Bioresour. Technol. 2019, 291, 121934. [Google Scholar] [CrossRef]
  18. Gonzalez-Fernandez, C.; Sialve, B.; Molinuevo-Salces, B. Anaerobic digestion of microalgal biomass: Challenges, opportunities and research needs. Bioresour. Technol. 2015, 198, 896–906. [Google Scholar] [CrossRef]
  19. Cai, T.; Ge, X.; Park, S.Y.; Li, Y. Comparison of Synechocystis sp. PCC6803 and Nannochloropsis salina for lipid production using artificial seawater and nutrients from anaerobic digestion effluent. Bioresour. Technol. 2013, 144, 255–260. [Google Scholar] [CrossRef]
  20. Alcántara, C.; García-Encina, P.A.; Muñoz, R. Evaluation of the simultaneous biogas upgrading and treatment of centrates in a high-rate algal pond through C, N and P mass balances. Water Sci. Technol. 2015, 72, 150–157. [Google Scholar] [CrossRef]
  21. Wang, L.; Li, Y.; Chen, P.; Min, M.; Chen, Y.; Zhu, J.; Ruan, R.R. Anaerobic digested dairy manure as a nutrient supplement for cultivation of oil-rich green microalgae Chlorella sp. Bioresour. Technol. 2010, 101, 2623–2628. [Google Scholar] [CrossRef]
  22. Raeisossadati, M.; Vadiveloo, A.; Bahri, P.A.; Parlevliet, D.; Moheimani, N.R. Treating anaerobically digested piggery effluent (ADPE) using microalgae in thin layer reactor and raceway pond. J. Appl. Phycol. 2019, 31, 2311–2319. [Google Scholar] [CrossRef]
  23. Ayre, J.M.; Moheimani, N.R.; Borowitzka, M.A. Growth of microalgae on undiluted anaerobic digestate of piggery effluent with high ammonium concentrations. Algal Res. 2017, 24, 218–226. [Google Scholar] [CrossRef] [Green Version]
  24. Singh, M.; Reynolds, D.L.; Das, K.C. Microalgal system for treatment of effluent from poultry litter anaerobic digestion. Bioresour. Technol. 2011, 102, 10841–10848. [Google Scholar] [CrossRef] [PubMed]
  25. Thi Nguyen, M.L.; Lin, C.Y.; Lay, C.H. Microalgae cultivation using biogas and digestate carbon sources. Biomass Bioenergy 2019, 122, 426–432. [Google Scholar] [CrossRef]
  26. Bona, D.; Papurello, D.; Flaim, G.; Cerasino, L.; Biasioli, F.; Silvestri, S. Management of Digestate and Exhausts from Solid Oxide Fuel Cells Produced in the Dry Anaerobic Digestion Pilot Plant: Microalgae Cultivation Approach. Waste Biomass Valorization 2020, 1–6. [Google Scholar] [CrossRef]
  27. Ramanna, L.; Guldhe, A.; Rawat, I.; Bux, F. The optimization of biomass and lipid yields of Chlorella sorokiniana when using wastewater supplemented with different nitrogen sources. Bioresour. Technol. 2014, 168, 127–135. [Google Scholar] [CrossRef]
  28. Das, C.; Naseera, K.; Ram, A.; Meena, R.M.; Ramaiah, N. Bioremediation of tannery wastewater by a salt-tolerant strain of Chlorella vulgaris. J. Appl. Phycol. 2017, 29, 235–243. [Google Scholar] [CrossRef]
  29. Trentin, G.; Bertucco, A.; Sforza, E. Mixotrophy in Synechocystis sp. for the treatment of wastewater with high nutrient content: Effect of CO2 and light. Bioprocess Biosyst. Eng. 2019, 42, 1661–1669. [Google Scholar] [CrossRef]
  30. Eze, V.C.; Velasquez-Orta, S.B.; Hernández-García, A.; Monje-Ramírez, I.; Orta-Ledesma, M.T. Kinetic modelling of microalgae cultivation for wastewater treatment and carbon dioxide sequestration. Algal Res. 2018, 32, 131–141. [Google Scholar] [CrossRef]
  31. Photovoltaic Geographical Information System (PVGIS). Available online: http://re.jrc.ec.europa.eu/pvgis/ (accessed on 25 September 2018).
  32. Bryant, D.A. The Molecular Biology of Cyanobacteria; Springer: Dordrecht, The Netherlands, 1994; ISBN 978-0-7923-3273-2. [Google Scholar]
  33. de Godos, I.; Arbib, Z.; Lara, E.; Rogalla, F. Evaluation of High Rate Algae Ponds for treatment of anaerobically digested wastewater: Effect of CO2 addition and modification of dilution rate. Bioresour. Technol. 2016, 220, 253–261. [Google Scholar] [CrossRef]
  34. Collos, Y.; Harrison, P.J. Acclimation and toxicity of high ammonium concentrations to unicellular algae. Mar. Pollut. Bull. 2014, 80, 8–23. [Google Scholar] [CrossRef] [PubMed]
  35. Barbera, E.; Sforza, E.; Bertucco, A. Maximizing the production of Scenedesmus obliquus in photobioreactors under different irradiation regimes: Experiments and modeling. Bioprocess Biosyst. Eng. 2015, 38, 2177–2188. [Google Scholar] [CrossRef] [PubMed]
  36. Takache, H.; Pruvost, J.; Cornet, J.F. Kinetic modeling of the photosynthetic growth of Chlamydomonas reinhardtii in a photobioreactor. Biotechnol. Prog. 2012, 28, 681–692. [Google Scholar] [CrossRef]
  37. Redfield, A.C. On the Proportions of Organic Derivatives in Sea Water and Their Relation to the Composition of Plankton. James Johnstone Meml. Vol. 1934, 176–192. [Google Scholar]
  38. Ramos Tercero, E.A.; Sforza, E.; Morandini, M.; Bertucco, A. Cultivation of Chlorella protothecoides with Urban Wastewater in Continuous Photobioreactor: Biomass Productivity and Nutrient Removal. Appl. Biochem. Biotechnol. 2014, 172, 1470–1485. [Google Scholar] [CrossRef] [PubMed]
  39. Jebali, A.; Acién, F.G.; Rodriguez Barradas, E.; Olguín, E.J.; Sayadi, S.; Molina Grima, E. Pilot-scale outdoor production of Scenedesmus sp. in raceways using flue gases and centrate from anaerobic digestion as the sole culture medium. Bioresour. Technol. 2018, 262, 1–8. [Google Scholar] [CrossRef]
  40. Romero-Villegas, G.I.; Fiamengo, M.; Acién-Fernández, F.G.; Molina-Grima, E. Utilization of centrate for the outdoor production of marine microalgae at the pilot-scale in raceway photobioreactors. J. Environ. Manag. 2018, 228, 506–516. [Google Scholar] [CrossRef]
  41. Morales-amaral, M.; Gómez-serrano, C.; Acién, F.G.; Fernández-sevilla, J.M.; Molina-grima, E. Outdoor production of Scenedesmus sp. in thin-layer and raceway reactors using centrate from anaerobic digestion as the sole nutrient source. ALGAL 2015, 12, 99–108. [Google Scholar] [CrossRef]
  42. Posadas, E.; Muñoz, A.; García-González, M.C.; Muñoz, R.; García-Encina, P.A. A case study of a pilot high rate algal pond for the treatment of fish farm and domestic wastewaters. J. Chem. Technol. Biotechnol. 2015, 90, 1094–1101. [Google Scholar] [CrossRef]
  43. Nasir, I.M.; Ghazi, T.I.M.; Omar, R. Production of biogas from solid organic wastes through anaerobic digestion: A review. Appl. Microbiol. Biotechnol. 2012, 95, 321–329. [Google Scholar] [CrossRef]
  44. Wang, L.; Min, M.; Li, Y.; Chen, P.; Chen, Y.; Liu, Y.; Wang, Y.; Ruan, R. Cultivation of green algae Chlorella sp. in different wastewaters from municipal wastewater treatment plant. Appl. Biochem. Biotechnol. 2010, 162, 1174–1186. [Google Scholar] [CrossRef] [PubMed]
  45. Cuellar-Bermudez, S.P.; Aleman-Nava, G.S.; Chandra, R.; Garcia-Perez, J.S.; Contreras-Angulo, J.R.; Markou, G.; Muylaert, K.; Rittmann, B.E.; Parra-Saldivar, R. Nutrients utilization and contaminants removal. A review of two approaches of algae and cyanobacteria in wastewater. Algal Res. 2017, 24, 438–449. [Google Scholar] [CrossRef]
  46. Posadas, E.; Marín, D.; Blanco, S.; Lebrero, R.; Muñoz, R. Simultaneous biogas upgrading and centrate treatment in an outdoors pilot scale high rate algal pond. Bioresour. Technol. 2017, 232, 133–141. [Google Scholar] [CrossRef] [PubMed] [Green Version]
  47. González-fernández, C.; Molinuevo-salces, B.; García-gonzález, M.C. Nitrogen transformations under different conditions in open ponds by means of microalgae–bacteria consortium treating pig slurry. Bioresour. Technol. 2011, 102, 960–966. [Google Scholar]
  48. Molinuevo-salces, B.; García-gonzález, M.C.; González-fernández, C. Performance comparison of two photobioreactors configurations (open and closed to the atmosphere ) treating anaerobically degraded swine slurry. Bioresour. Technol. 2010, 101, 5144–5149. [Google Scholar] [CrossRef]
  49. Ruiz-Martinez, A.; Martin Garcia, N.; Romero, I.; Seco, A.; Ferrer, J. Microalgae cultivation in wastewater: Nutrient removal from anaerobic membrane bioreactor effluent. Bioresour. Technol. 2012, 126, 247–253. [Google Scholar] [CrossRef]
  50. Markou, G.; Vandamme, D.; Muylaert, K. Microalgal and cyanobacterial cultivation: The supply of nutrients. Water Res. 2014, 65, 186–202. [Google Scholar] [CrossRef] [Green Version]
  51. Mendoza, J.L.; Granados, M.R.; de Godos, I.; Acién, F.G.; Molina, E.; Heaven, S.; Banks, C.J. Oxygen transfer and evolution in microalgal culture in open raceways. Bioresour. Technol. 2013, 137, 188–195. [Google Scholar] [CrossRef]
  52. Kliphuis, A.M.J.; Janssen, M.; van den End, E.J.; Martens, D.E.; Wijffels, R.H. Light respiration in Chlorella sorokiniana. J. Appl. Phycol. 2011, 23, 935–947. [Google Scholar] [CrossRef] [Green Version]
  53. Jiménez, C.; Cossío, B.R.; Niell, F.X. Relationship between physicochemical variables and productivity in open ponds for the production of Spirulina: A predictive model of algal yield. Aquaculture 2003, 221, 331–345. [Google Scholar] [CrossRef]
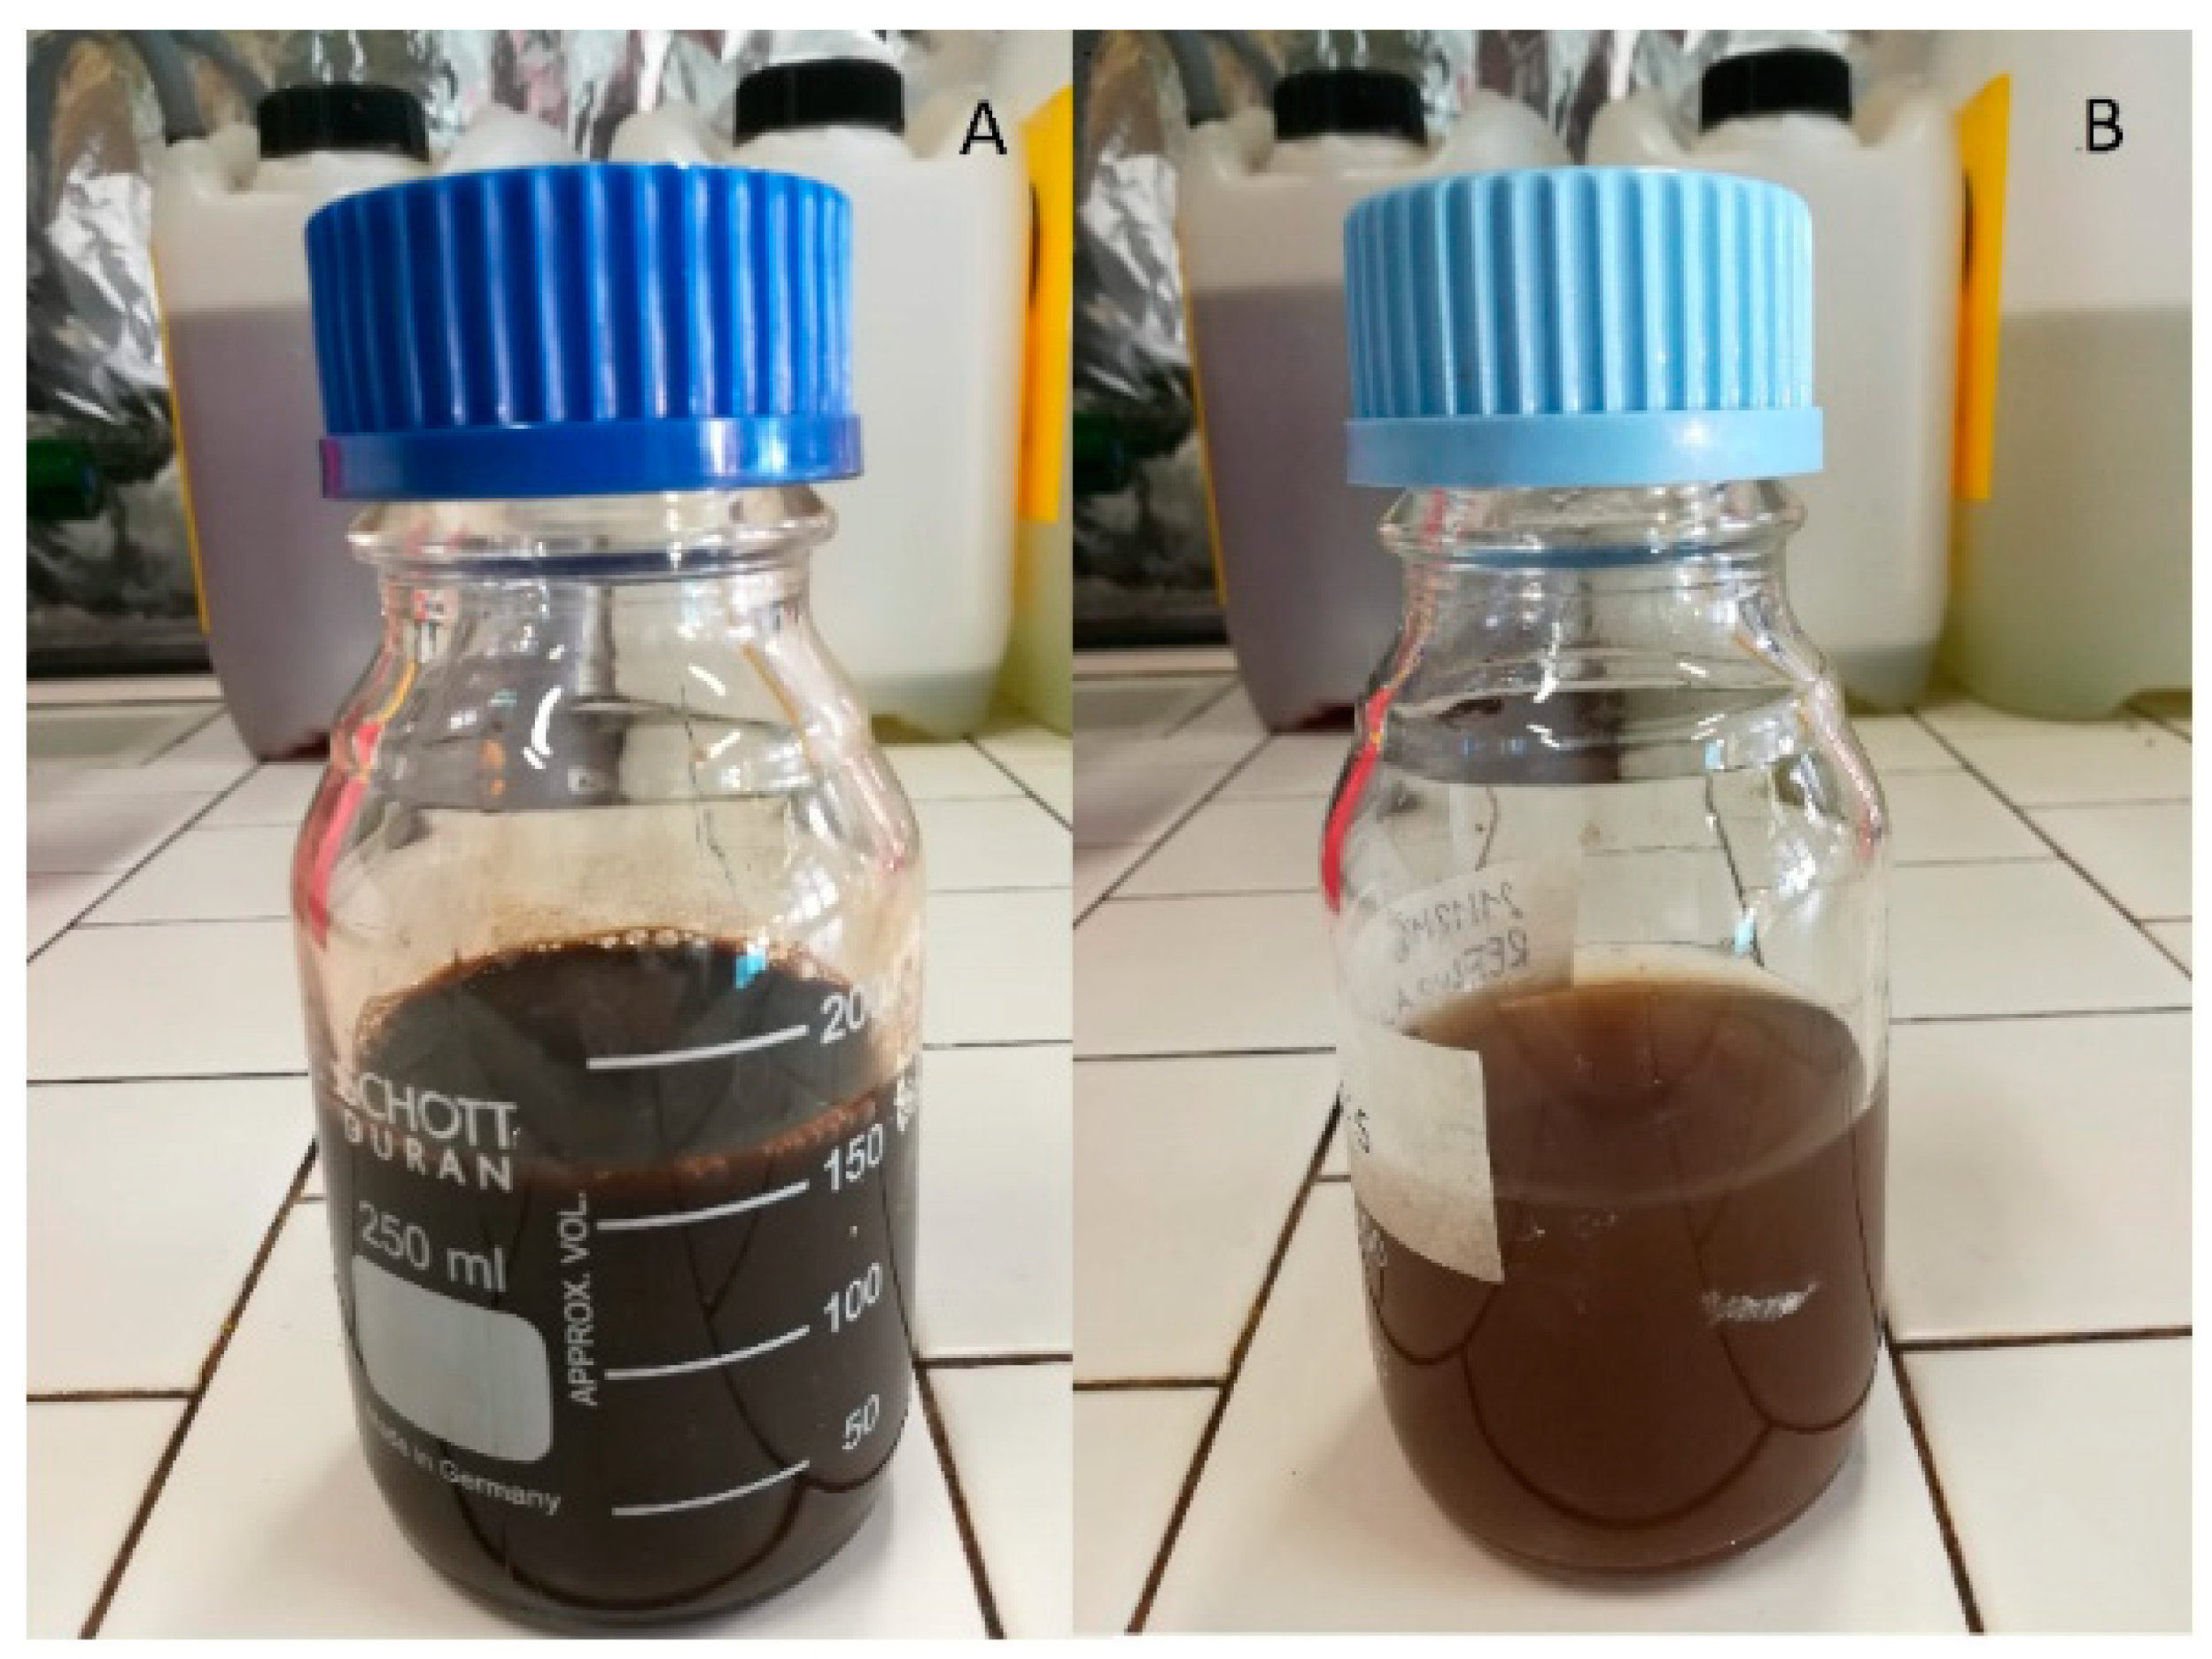
Figure 1. Liquid fraction of digestate from anaerobic digestion of the organic fraction of municipal solid waste (OFMSW): (A) as such; (B) diluted 1:5.
Chemengineering 04 00025 g001
Figure 2. Scheme of operational design. Batch operation is represented in blue, Chemengineering 04 00025 i001, Semi-continuous operation in orange, Chemengineering 04 00025 i002, and the transition stage in grey, Chemengineering 04 00025 i003. Green Chemengineering 04 00025 i004 represents the period of feeding with membrane filtered digestate (MFD), while violet Chemengineering 04 00025 i005 with filtered digestate (FD). Green dotted line (....) represents the change in the feeding mode (from manual to automatic). Violet dotted line (....) represents the shift in the water depth.
Chemengineering 04 00025 g002
Figure 3. Biomass concentration (A) and productivity (B) at steady state as a function of the hydraulic retention time. Black circles indicate centrifuged digestate diluted 1:5, grey diamonds centrifuged digestate (CD) diluted 1:2, while open circle corresponds to FD diluted 1:5. Error bars represent standard deviation.
Chemengineering 04 00025 g003
Figure 4. Evolution of biomass during raceway operation. Total suspended solids (TSS) concentration (A), areal productivity (B) and chlorophyll concentration (C). Blue dotted line represents the concentration in the effluent (●●●) and the continuous yellow line represents the concentration in the influent ( ̶ ). Semi-continuous operation is represented in orange, Chemengineering 04 00025 i006, and the transition stage in grey, Chemengineering 04 00025 i007. Green dotted line (●●●) represents the change in the feeding mode. Violet dotted line (●●●) represents the shift in the column depth.
Chemengineering 04 00025 g004
Figure 5. Chemical oxygen demand (COD) (A) and phosphorus (B) concentration during raceway operation. Blue dotted line represents the concentration of nutrient in the effluent (●●●). Continuous lines represent the concentration of nutrient in the influent. In Figure 5A, the orange line represents the tCOD ( ̶ ) and the yellow line is the soluble chemical oxygen demand (sCOD) ( ̶ ). Semi-continuous operation is represented in orange, Chemengineering 04 00025 i006, and the transition stage in grey, Chemengineering 04 00025 i007. Green dotted line (●●●) represents the change in the feeding mode. Violet dotted line (●●●) represents the shift in the column depth.
Chemengineering 04 00025 g005
Figure 6. Evolution of the concentrations of the different forms of nitrogen. Graphic (A) represents the evolution of N-NH3 in effluent (●●●) and influent ( ̶ ). Graphic (B) represents the evolution of N-NO2 in effluent, (●●●), and Graphic (C) represents the evolution of NO3 in effluent (●●●). Semi-continuous operation is represented in orange, Chemengineering 04 00025 i006, and the transitional stage in grey, Chemengineering 04 00025 i007. Green dotted line (....) represents the change in the feeding mode. Violet dotted line (....) represents the shift in the column depth.
Chemengineering 04 00025 g006
Figure 7. Dissolved oxygen (DO) concentration and solar irradiances evolution during the raceway operation. DO concentration is represented with blue dotted line (●●●) and solar radiation with orange dotted line (●●●). Semi-continuous operation is represented in orange, Chemengineering 04 00025 i006, and the transitional stage in grey, Chemengineering 04 00025 i007. Green dotted line (●●●) represents the change in the feeding mode. Violet dotted line (●●●) represents the shift in the column depth.
Chemengineering 04 00025 g007
Figure 8. DO concentration evolution in two single days, representative of the two feeding modes: August 5th (A) and September 14th (B). DO concentration is represented with green dotted line (●●●). In Graphic (A) the yellow line ( ̶ ) represents the harvest time and red line ( ̶ ) the feeding time. In Graphic (B) the orange line ( ̶ ) represents the start feeding time and the green one ( ̶ ) the end feeding. The violet dotted line (●●●) represents the sampling time.
Chemengineering 04 00025 g008
Table 1. Composition of the digestate samples used in this study.
AnalysisCentrifuged Digestate (CF)Filtered Digestate (FD)
Ammonium, N-NH3 (mg L−1)2933 ± 1413195 ± 140
Nitrates, N-NO3 (mg L−1)200 ± 815 ± 2
Nitrites, N-NO2 (mg L−1)2.5 ± 0.24n.d.
Phosphates, P-PO4 (mg L−1)51 ± 285 ± 1.5
COD (mg L−1)11,947 ± 131212,383 ± 1528
Total suspended solids (g L−1)4.2 ± 2.39.05
n.d. = not detected.
Table 2. Steady-state results of continuous lab-scale experiments.
Experimental ConditionsHRT (d)pHT (°C)cx (g L−1)Px (g L−1 d−1)ΔN (%)ΔP (%)
Centrifuged digestate 1:55.57.9 ± 0.225.0 ± 1.00.68 ± 0.070.123 ± 0.0132.8%52.6%
6.57.5 ± 0.225.6 ± 1.21.02 ± 0.120.156 ± 0.01812.4%94.7%
97.7 ± 0.124.3 ± 0.61.92 ± 0.230.213 ± 0.02612.6%96.7%
Centrifuged digestate 1:267.9 ± 0.127.2 ± 1.5----
8.57.6 ± 0.126.2 ± 1.01.63 ± 0.310.191 ± 0.03412.3%59.6%
Filtered digestate 1:26.57.7 ± 0.125.0 ± 1.60.92 ± 0.080.142 ± 0.0123.96%84.1%