Article

Synthesis and Characterization of Reduced Graphene Oxide and Their Application in Dye-Sensitized Solar Cells

by
William E. Ghann
1,
Hyeonggon Kang
1,
Jamal Uddin
1,*,
Farzana Aktar Chowdhury
2,
Saiful I. Khondaker
2,
Mohammed Moniruzzaman
3,
Md Humayun Kabir
4 and
Mohammed M. Rahman
5
1
Center for Nanotechnology, Department of Natural Sciences, Coppin State University, 2500 W. North Ave., Baltimore, MD 21216, USA
2
Nanoscience Technology Center, Department of Physics, & Department of Electrical and Computer Engineering, University of Central Florida, 12424 Research Parkway, Orlando, FL 32826, USA
3
Centre for Defense Chemistry, Cranfield University, Shrivenham SN6 8LA, UK
4
Department of Chemistry, Oglethorpe University, Atlanta, GA 30319, USA
5
Department of Chemistry, King Abdulaziz University, Jeddah 21589, Saudi Arabia
*
Author to whom correspondence should be addressed.
ChemEngineering 2019, 3(1), 7; https://doi.org/10.3390/chemengineering3010007
Submission received: 5 October 2018 / Revised: 29 December 2018 / Accepted: 8 January 2019 / Published: 15 January 2019
(This article belongs to the Special Issue TiO2 Nanoparticles: Synthesis and Applications)

Abstract

:
Reduced graphene oxide has certain unique qualities that make them versatile for a myriad of applications. Unlike graphene oxide, reduced graphene oxide is a conductive material and well suited for use in electrically conductive materials, such as solar cell devices. In this study, we report on the synthesis of graphene oxide as well as the fabrication and characterization of dye-sensitized solar cells with a photoanode which is an amalgam of reduced graphene oxide and titanium dioxide. The synthesized reduced graphene oxide and the corresponding photoanode were fully characterized using Ultraviolet-visible, Fourier transform infrared (FTIR), and Raman Spectrometry. The morphology of the sample was assessed using Atomic Force Microscopy, Field Emission Scanning Electron Microscopy, Transmission Electron Microscopy, and Energy Dispersive X-ray Spectroscopy. The photovoltaic characteristics were determined by photocurrent and photo-voltage measurements of the fabricated solar cells. The electrical impedances of both sets of devices were also evaluated. Overall, the solar to electric power efficiency of the device with reduced graphene oxide was observed to be higher (2.02%) than the device without the reduced graphene oxide (1.61%).

1. Introduction

The ever-increasing demand for energy has spurred the exploration of different sources of energy over the last few decades. Growing concern about global warming and climate change, however, has led to an increased focus on renewable energy sources, such as solar, wind, hydro, and geothermal energy. Among all these sources, solar energy is considered as the ultimate source of energy and most abundant in supply. Solar cells absorb energy from sunlight and convert it into electricity. In the case of photosynthesis where green plants absorb energy from the sun for the production of molecules needed for growth and development, light absorbing pigment, chlorophyll, is responsible for the capture of the photons from the sun that allow the process to occur. Dye-sensitized solar cells (DSSCs)—a third generation solar cell—work similarly to photosynthesis. Sensitizing dyes absorb radiant energy which is subsequently converted into electricity. The DSSCs are low cost, environmentally friendly and easy to produce. They were invented by Michael Gratzel in 1991 [1]. They are made of a photoanode, a cathode, and an electrolyte. When dye imbedded in nanocrystalline semiconductors, such as TiO2, electrodes absorb photons from the sunlight, the dye molecules become excited and inject electron in the TiO2 semiconductor. The oxidized dye molecule accepts an electron from the redox couple electrolyte, and the ground state of the dye molecule is restored. The injected electron is transported through the TiO2 semiconductor and through an external circuit before reaching the cathode. The redox couple electrolyte is regenerated by acceptance of the electron at the cathode. Most studies on DSSCs are focused on improving the efficiency of the solar cells through the optimization of the various components of the solar cell [2,3,4,5,6].
Recently, graphene, graphene oxide, and reduced graphene oxide have been used for the optimization of DSSC [7,8,9,10]. Graphene along with graphene oxide and reduced graphene oxide belongs to the family of 2D nanomaterials. 2D nanomaterial is crystalline single layer of atoms characterized by confinement in one direction [11]. In fact, graphene was the first material reported as an example of 2D carbon nanomaterial [11]. And like all 2D nanomaterials, they possess unique characteristics that make them versatile for application in photovoltaic, semiconductors, electrodes, among others [11,12,13,14,15,16,17,18,19,20]. Graphene materials, for example, have been used as either a counter electrode or a component of the photoanode [21,22,23]. Graphene oxide is a chemically modified graphene composed of a single layer of carbon atom network and oxygen functional groups, such as epoxides, carboxylic acids, and alcohols. Reduced graphene oxide are single-layered sheets derived from the chemical reduction of graphene oxide. Various synthetic routes have been reported for the synthesis of reduced graphene oxide [24,25,26,27,28]. Reduced graphene oxide possess electrical and mechanical properties similar to that of graphene and, thus, makes them versatile for a number of applications including dye-sensitized solar cells [29,30,31,32,33].
Most of the studies on the use of graphene material in dye-sensitized solar cells involve the fusion of titanium dioxide with the graphene material to form the photoanode [34,35,36]. Reasons that have been attributed to the increase in the efficiency of the solar cell include the increase in the dye absorption resulting in the increase in the absorption of photons [36]. Other reasons for enhanced performance include improved porosity of the photoanode and improved charge collection facilitated by intimate contact between the highly conductive graphene material and the TiO2 [37,38].
In this work, dye-sensitized solar cells were fabricated using reduced graphene oxide as part of the photoanode. The synthesis of reduced graphene oxide and its characterization together with the performance of the solar cells fabricated with the reduced graphene are reported herein. A commonly used dye sensitizer, N719, was deployed in the fabrication of all the dye-sensitized solar cells.

2. Experimental Details

2.1. Preparation of Reduced Graphene Oxide

The synthesis of reduced graphene oxide (rGO) suspension used in the study was done via the chemical reduction of individual graphene oxide (GO) sheets as described in our previous publications [39,40,41,42]. The individual GO sheets in powdered form were obtained from Cheap Tubes Inc., Cambridgeport, VT. Thirty milligrams of GO powder was added to a 30 mL of deionized (DI) water in a vial. The GO solution was then stirred with a Teflon-coated magnetic stirring bar in a water bath for 24 h to obtain well dispersion. Ammonia aqueous solution (200 μL of 5%) and 30 μL of hydrazine hydrate (Sigma-Aldrich, St. Louis, MO, USA, 35% DMF) were added to the GO solution, and the mixture was heated at 90 °C for 60 min under stirring to obtain rGO. To measure the surface topography and Raman spectrum, a drop of rGO suspension was spun onto a clean Si/SiO2 substrate and dried in air. Before that, substrates were cleaned in an ultrasonic bath with acetone and isopropyl alcohol for 10 min in each case, followed by rinsing with DI water and drying with nitrogen blow. A substrate treatment with Ar plasma was carried out afterwards.

2.2. AFM Measurements

The thickness and surface root mean square (rms) roughness of the rGO film was measured directly by atomic force microscopy (AFM). In this case AFM, measurements were taken on a dimension 3100 scanning probe microscope (Veeco Instruments Inc., Plainview, NY, USA) using tapping mode operation. A silicon, n-type cantilever with L: 125 µm, W: 35 µm, T: 4.5 µm. Tip radius: <10 nm, H: 14–16 µm, f: 200–400 kHz, was used for scanning the sample. A voltage of 0.6 V was applied to drive the vibration of the molecules. Resolution for topography measurements was 512 × 512 points at 1 Hz frequency.

2.3. Raman Measurements

Raman spectra were recorded with alpha300 RA confocal Raman system from WITec Instruments Corp. (Knoxville, TN, USA) The samples were illuminated with 532.0 nm laser light in ambient conditions. A line lens was used to collect Raman spectra (Stream Line mode) within a short time frame and with minimal thermal stress to the sample. In that case, the laser power was set at 1.3 mW for an integration time of 1 s of data acquisition for the projected pixel of width 0.063 µm and height 0.063 µm. The spectrometer was calibrated at 520.6 cm−1 silicon (Si) band.

2.4. Other Characterization Techniques

The morphology of each film was analyzed using field emission scanning electron microscopy (Model FESEM: JSM-7100FA JEOL USA, Inc.). Absorption spectroscopy was carried out with UV-3600 Plus from Shimadzu, MD, USA. Emission spectroscopy was measured with RF-5301PC from Shimadzu, MD, USA. Attenuated total reflectance spectra were obtained with a Thermo Nicolet iS50 FTIR. Transmission Electron Microscopy (TEM) images were captured on JEM-1400 PLUS (JEOL USA, Peabody, MA, USA). The images were viewed using Digital Micrograph software from GATAN (GATAN Inc., Pleasanton, CA, USA). TiO2 paste was printed on fluorine doped tin oxide (FTO) glass using WS-650 Series Spin Processor from Laurell Technologies Corporation, PA, USA. Carbon paint used in making cathode slides was purchased from TED PELLA, Inc. (Redding, CA, USA). The cell performance was measured using 150 W fully reflective solar simulator with a standard illumination of air-mass 1.5 global (AM 1.5 G) having an irradiance of 100 mW/cm2 (Sciencetech Inc.), London, Ontario, Canada. Reference 600 Potentiostat/Galvanostat/ZRA from GAMRY Instruments (Warminster, PA, USA).

2.5. Solar Cell Fabrication

The photoanode was prepared by depositing a thin film of the blend of reduced graphene oxide and titanium dioxide on the conductive side of fluorine doped tin oxide (FTO) glass using a spin coater. The reduced graphene oxide and titanium dioxide amalgam were prepared using titanium dioxide powder, acetic acid, soapy water, and reduced graphene oxide. Ten milliliters of 1 mg/mL of reduced graphene oxide was mixed with 4.8 g of TiO2, and 1 mL soapy water and 10 mL acetic acid were added and ground in a mortar with a pestle to form a smooth paste. Upon deposition of the paste on the glass slide, the film was sintered at 380 °C for 2 h. The TiO2/rGO covered FTO glass was then immersed in 5 mM N719 solution overnight. The counter electrode (cathode) was prepared by painting FTO glass with colloidal graphite. The TiO2/N719 electrode and the carbon electrode were assembled to form a solar cell sandwiched with a redox (I/I3−) electrolyte solution. The active area of the cell was 5 cm2. The solar energy to electricity conversion efficiency (η) was calculated based on the equation, η = FF × Isc × Voc, where FF is the fill factor, Isc is the short-circuit photocurrent density (mA cm–2), and Voc is the open-circuit voltage (V) as listed in Table 1.

3. Results and Discussion

3.1. Synthesis of Reduced Graphene Oxide
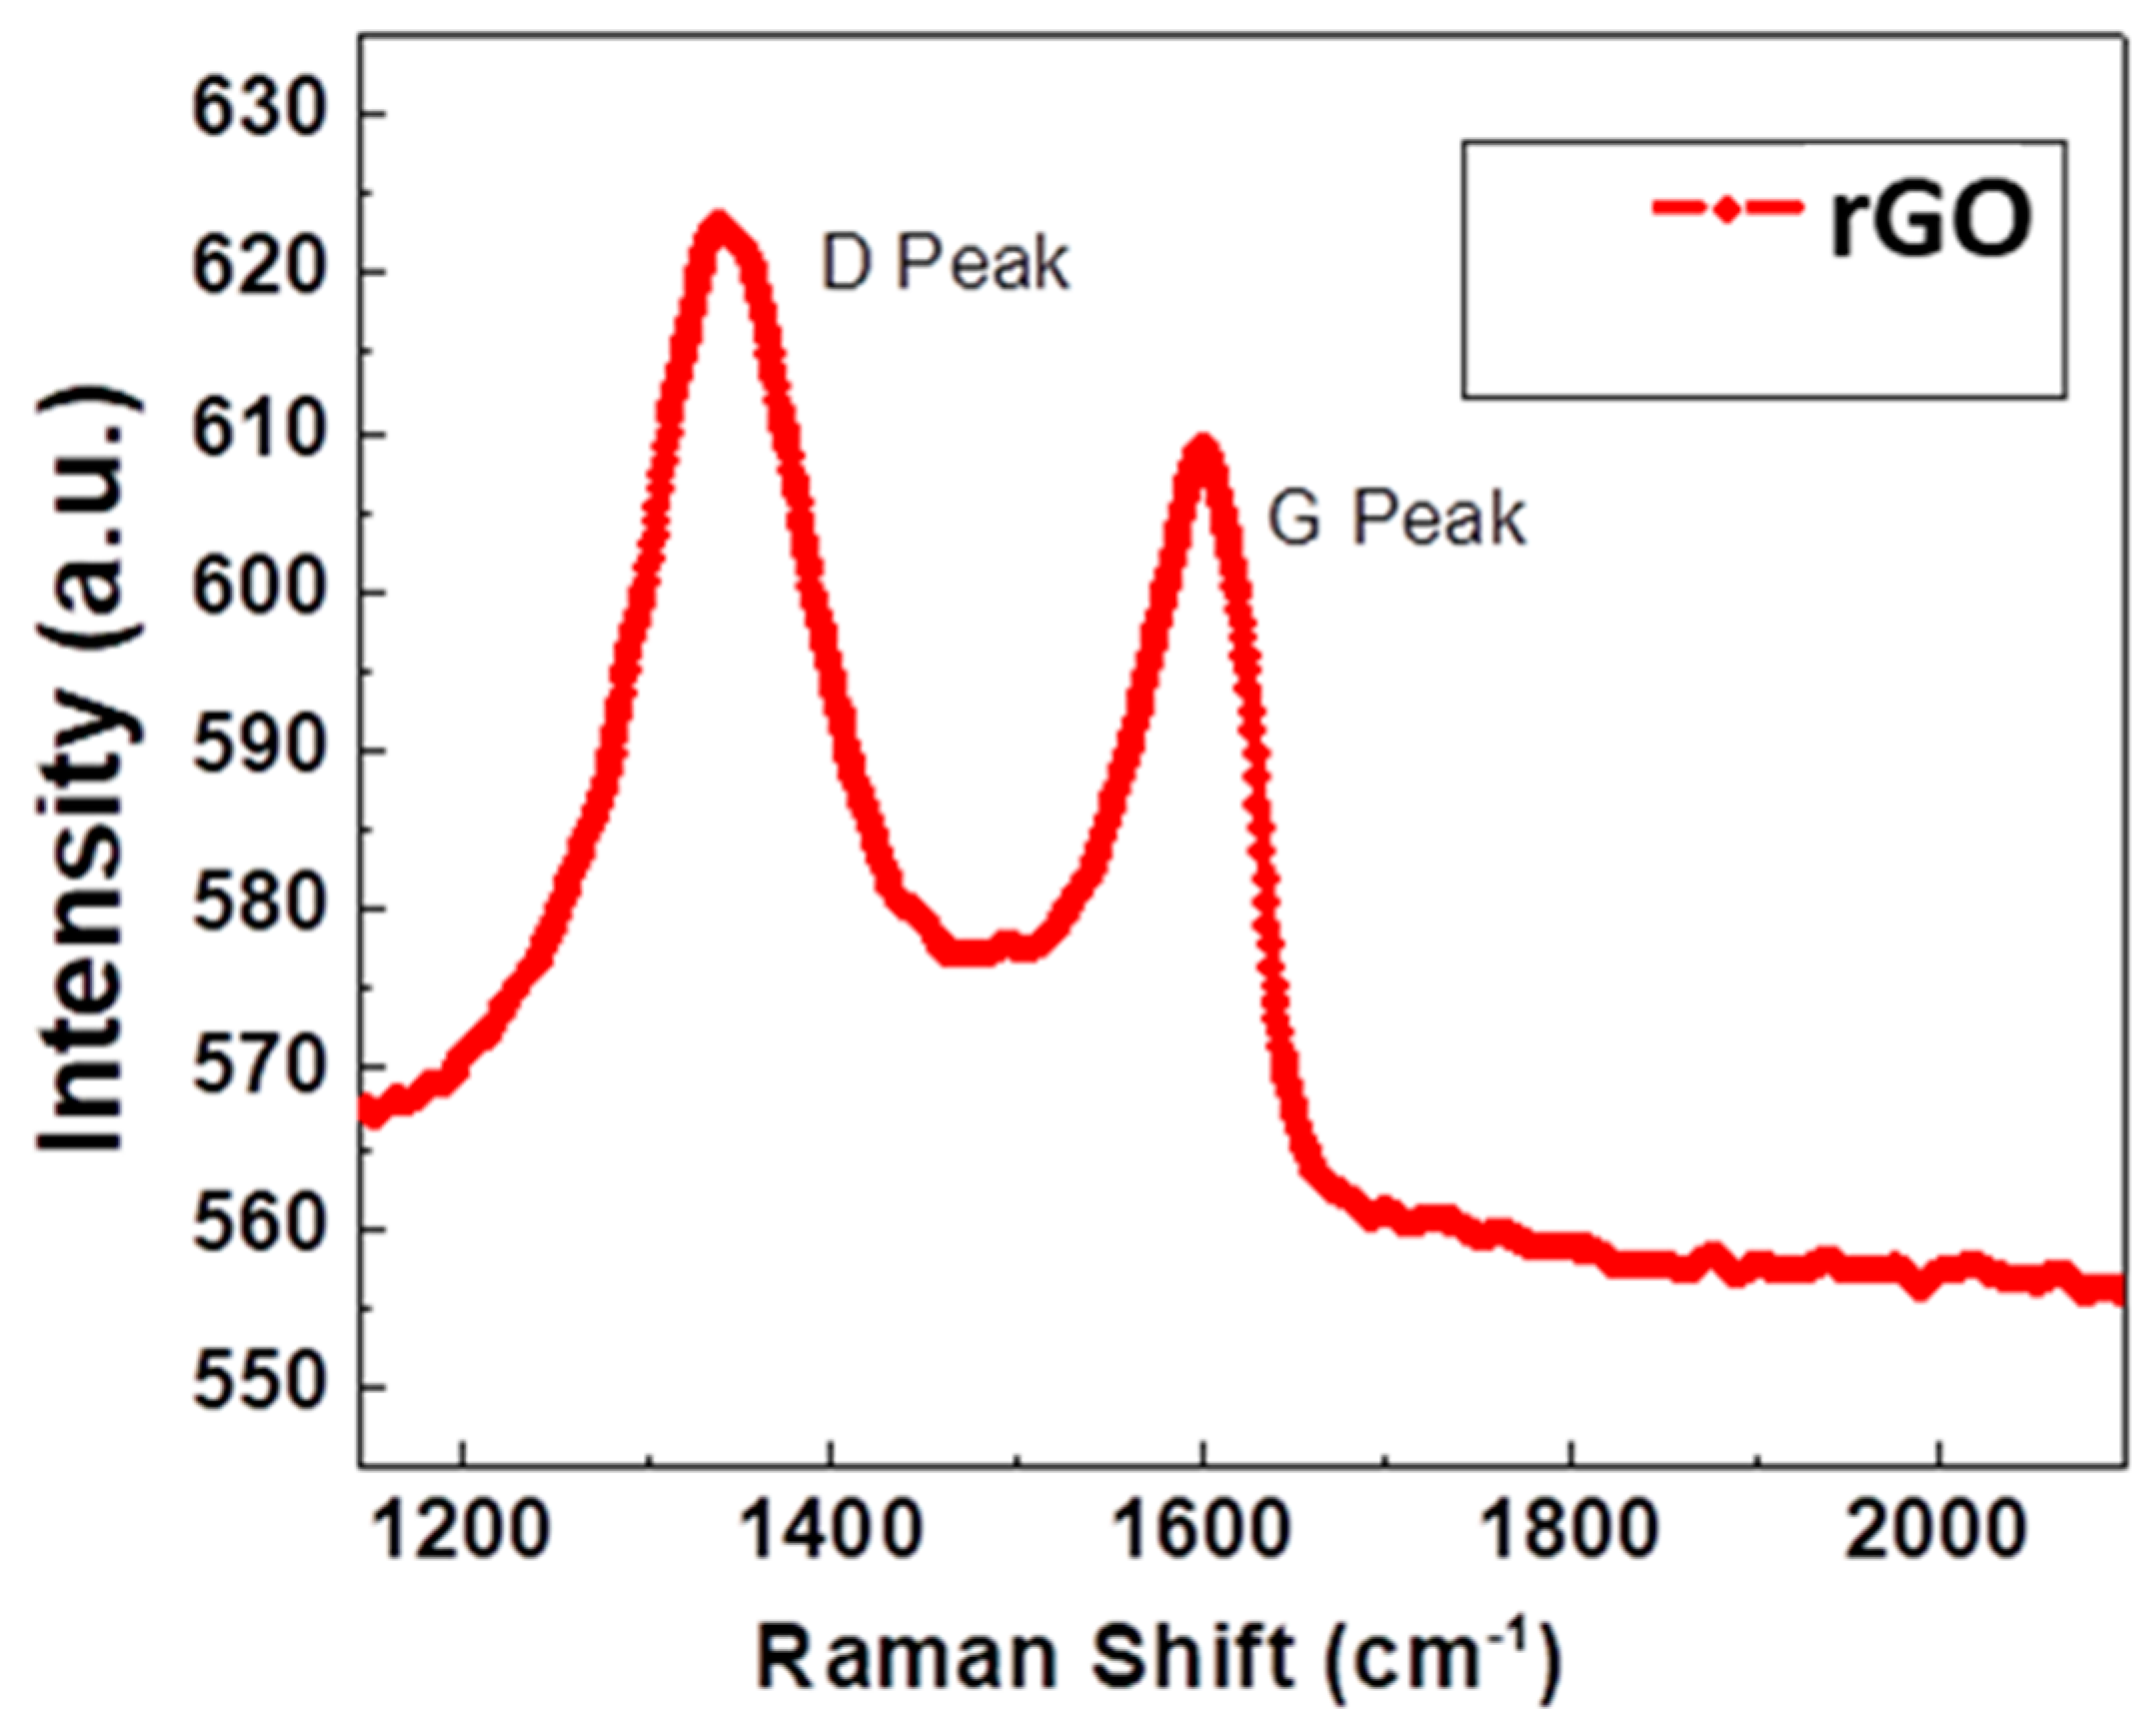
The reduced graphene oxide (rGO) used in this work was synthesized using a modified version of a previously reported protocol [25]. Graphene sheets in powdered form were reduced with hydrazine hydrate to form the reduced graphene oxide at a concentration of 1 mg·mL−1. Upon reduction, graphene oxide changed color from brown to black reduced graphene oxide dispersion. The change in color could be due to changes in the hydrophobicity which is a direct consequence of the removal of oxygen-containing functional groups.

3.2. Raman Studies

Presence of rGO flake was further confirmed by performing Raman studies on the sample. Figure 1 shows the Raman spectrum for the rGO sample. The rGO sample shows the usual ‘D’ peak at ~1347 cm−1 and ‘G’ peak at ~1599 cm−1 in the Raman spectrum. The GO peak intensity increased upon reduction with a simultaneous reduction to the ID/IG ratio. In our case ID/IG ratio was found as 1.19, whereas for GO this ratio was a bit higher than that earlier reported (1.88) [43,44]. ID/IG ratio should lie between 1.12 and 1.42 [43], which confirms a better quality of the prepared rGO; and confirming the expected greater graphitization following reduction.

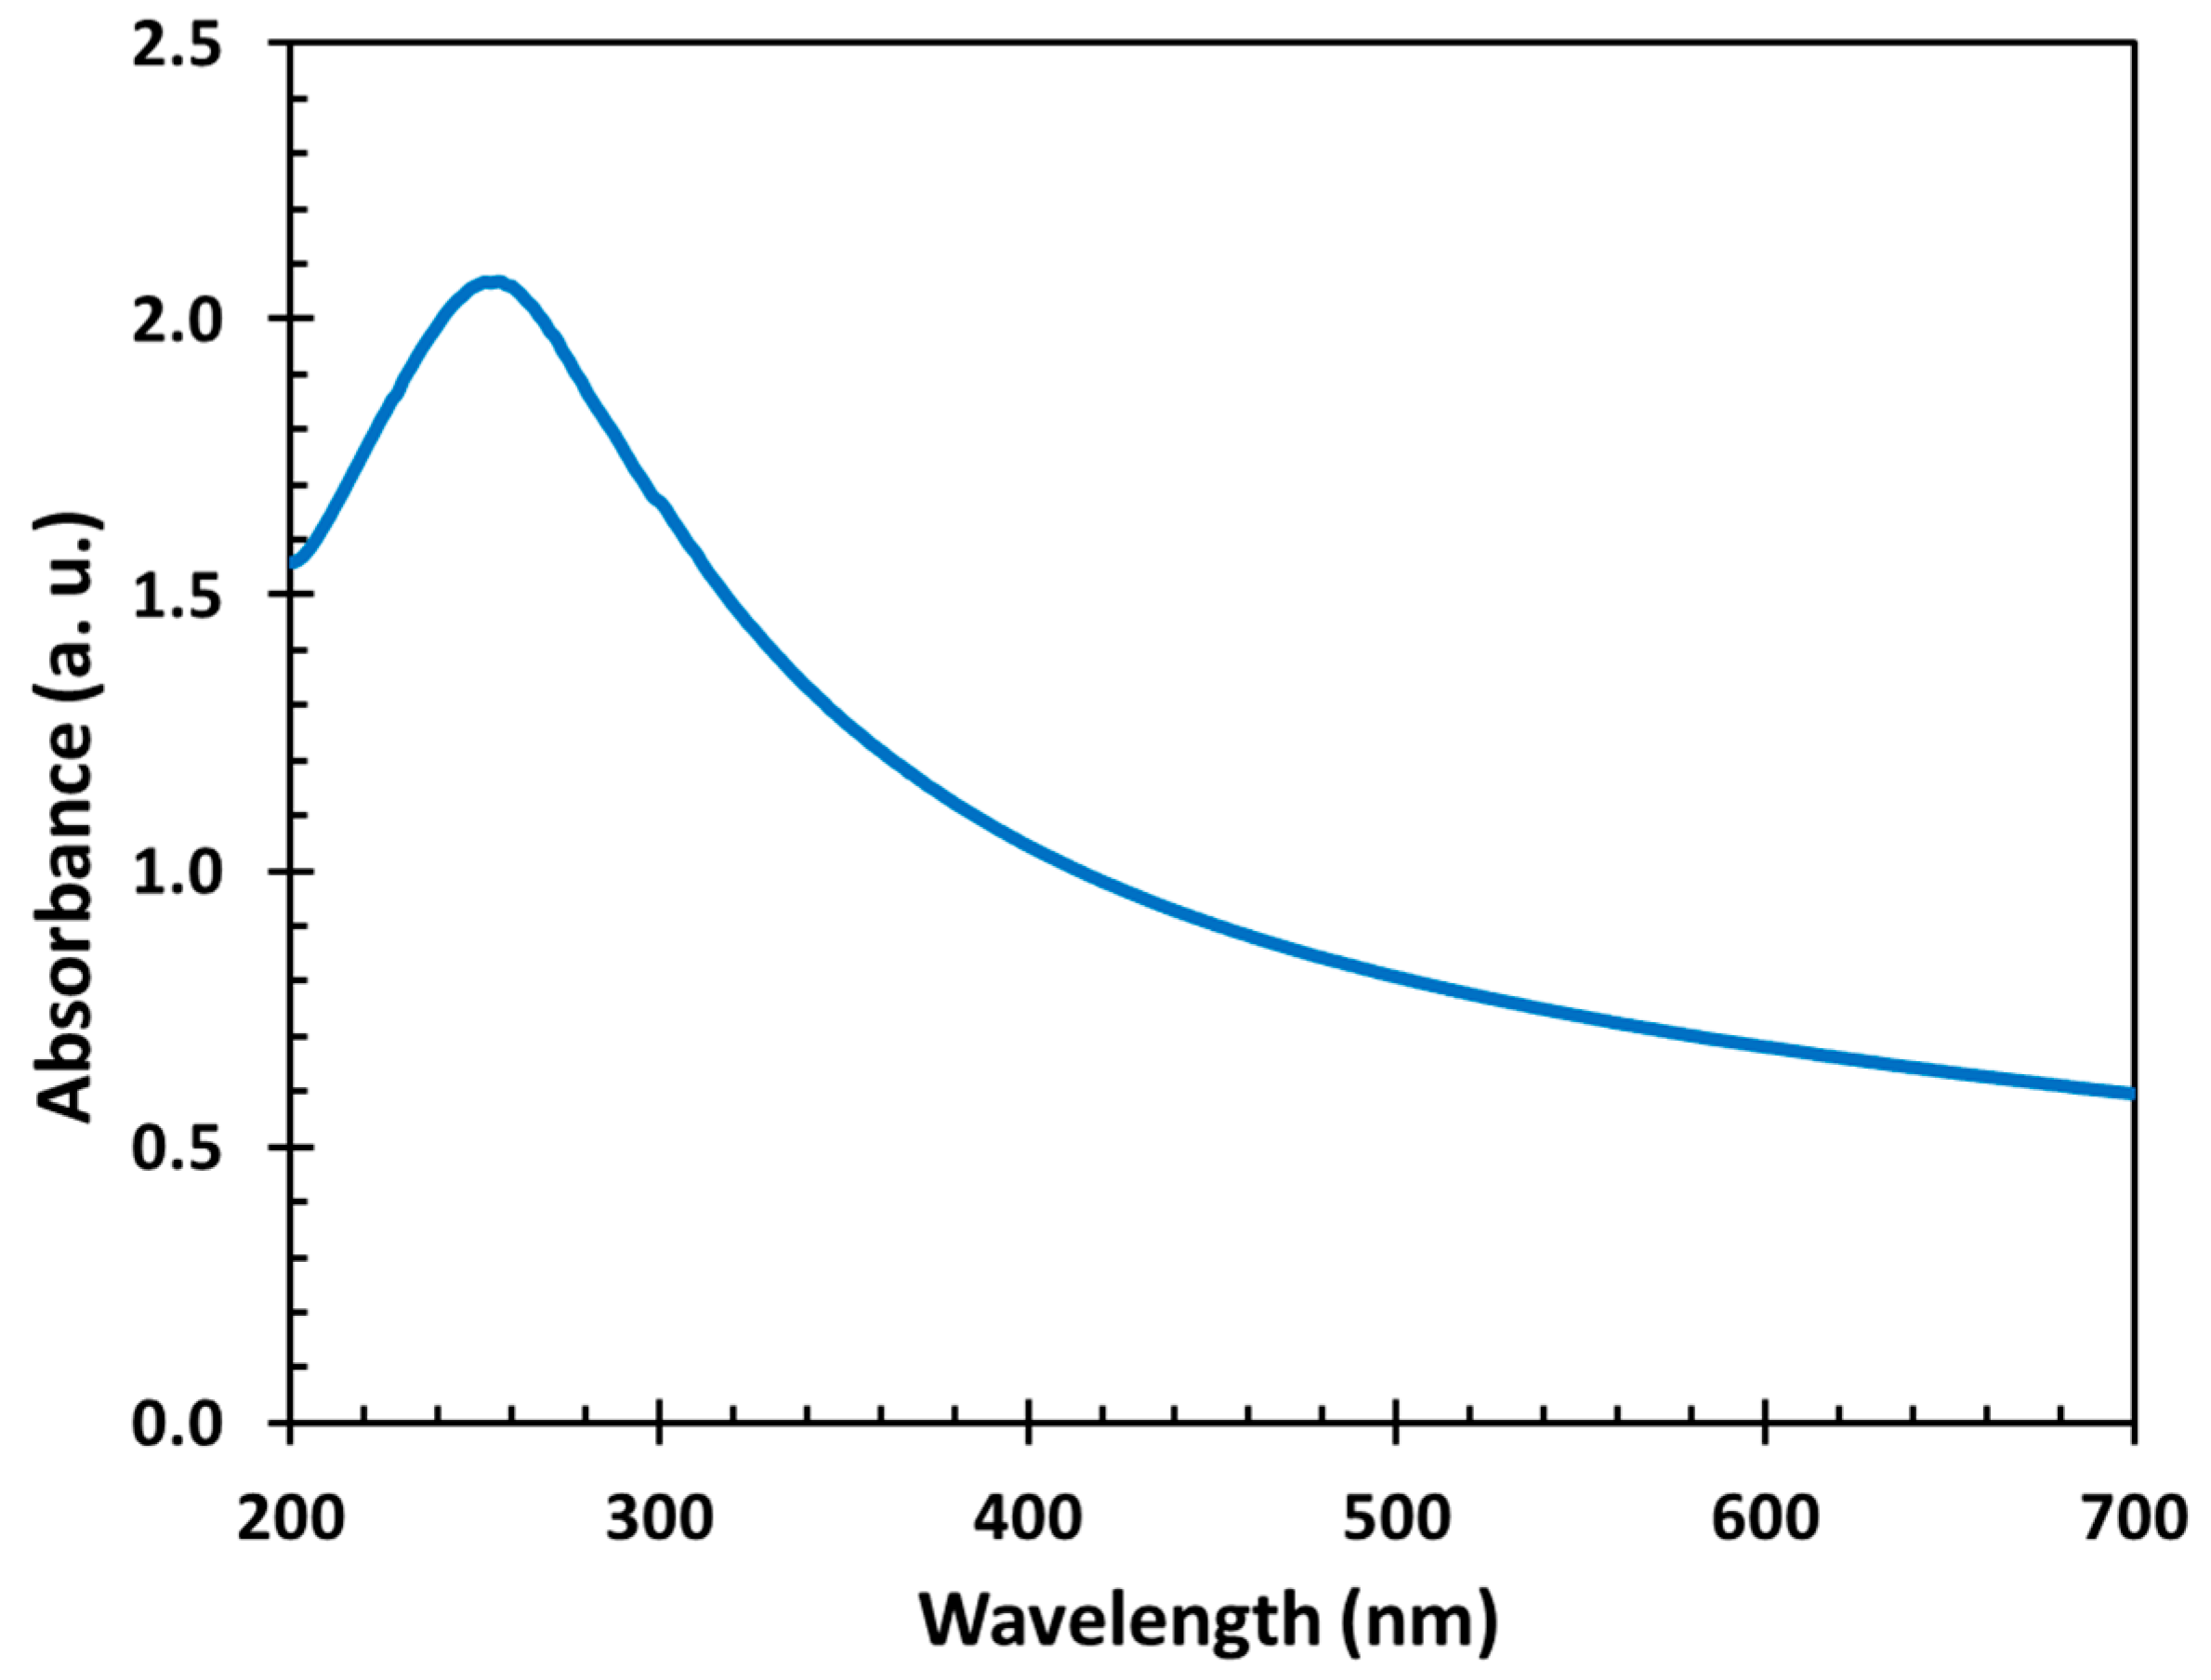
3.3. UV–vis Measurement

The UV–vis spectrum of the reduced graphene oxide shows a single broad absorption band at 257 nm as displayed in Figure 2. This shows a red shift in comparison with UV–vis spectra of graphene oxide (not displayed) which occurs at 230 nm and has been attributed to π → π* transition of the aromatic C–C bonds [45]. This shift in wavelength has been used to monitor the reduction reaction of graphene oxide (GO) to reduced graphene oxide (rGO).

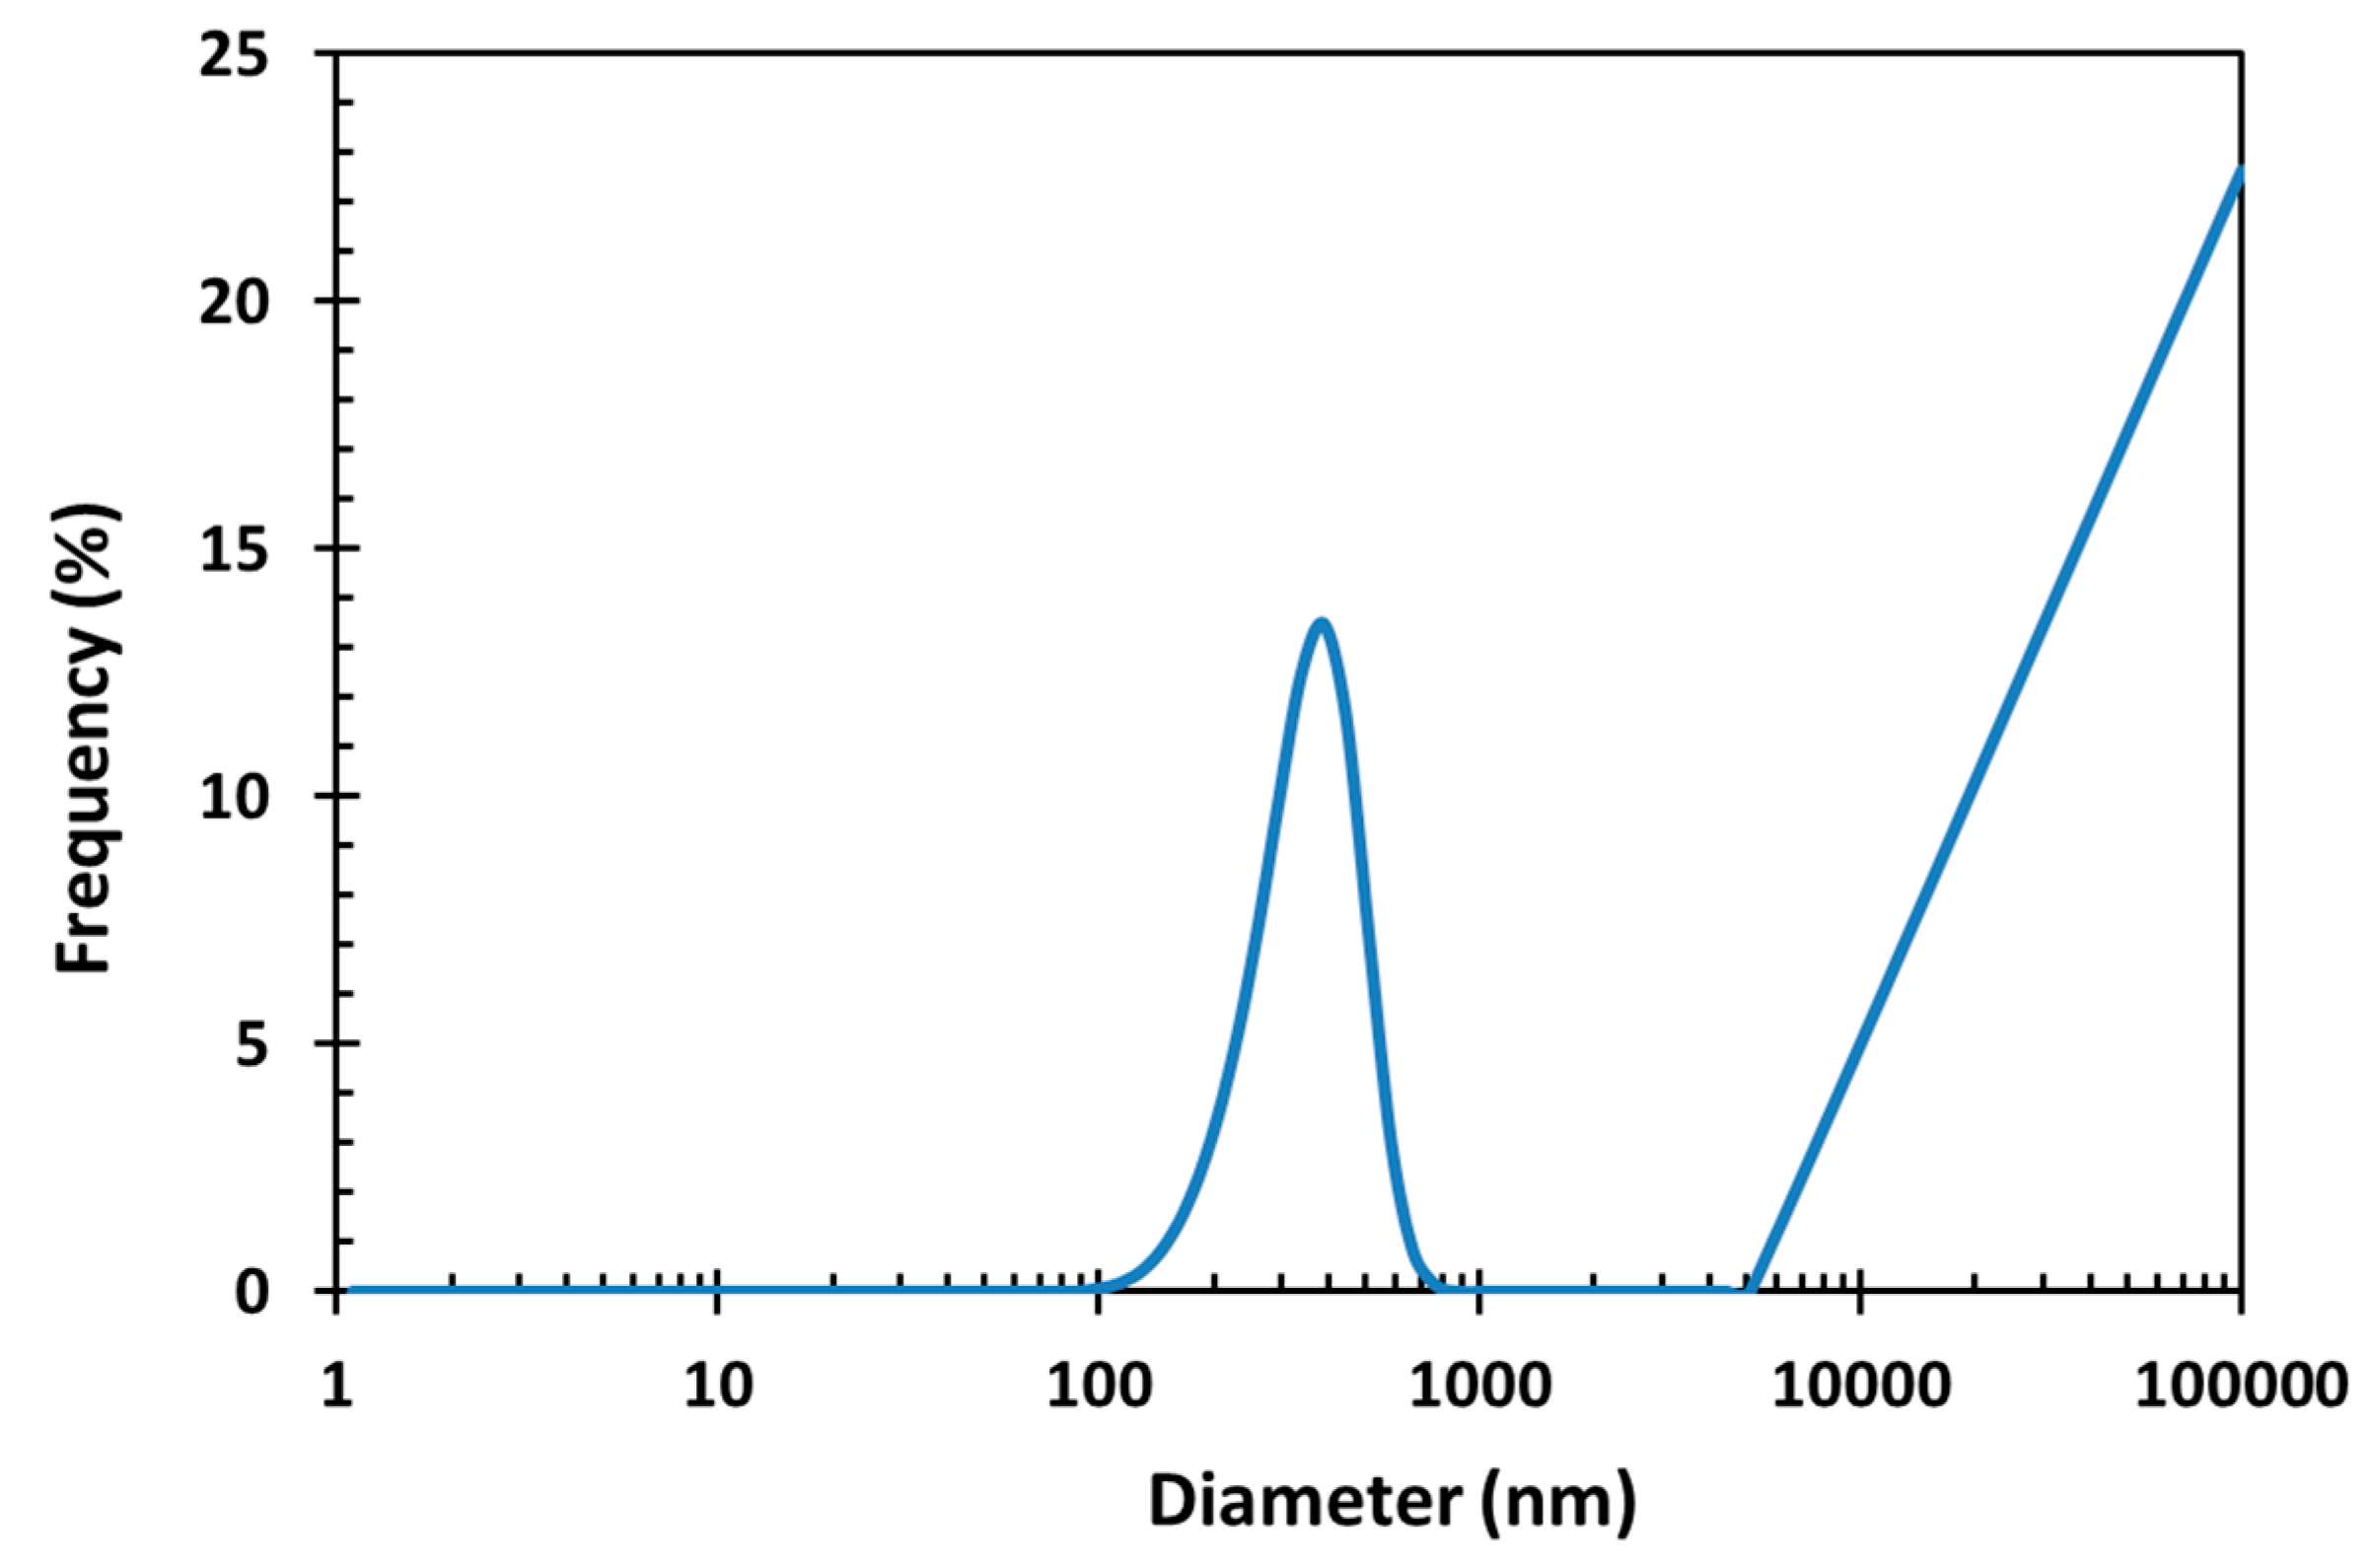
3.4. Dynamic Light Scattering

The particles size distribution of the reduced graphene oxide dispersion was characterized using dynamic light scattering. Dynamic light scattering is usually employed to characterize spherical particles but is also seldom used to evaluate the uniformity of reduced graphene oxide dispersion. The spectra as displayed in Figure 3 reveal a sizeable portion of the reduced graphene oxide dispersion to be 400 nm. There is a peak that is also formed after 1000 nm and extends beyond 100,000 nm, which could be due to dispersion of reduced graphene oxide in the aqueous media. Side products from the reduction of graphene oxide to the reduced graphene oxide could also account for part of those with sizes beyond the micron range.

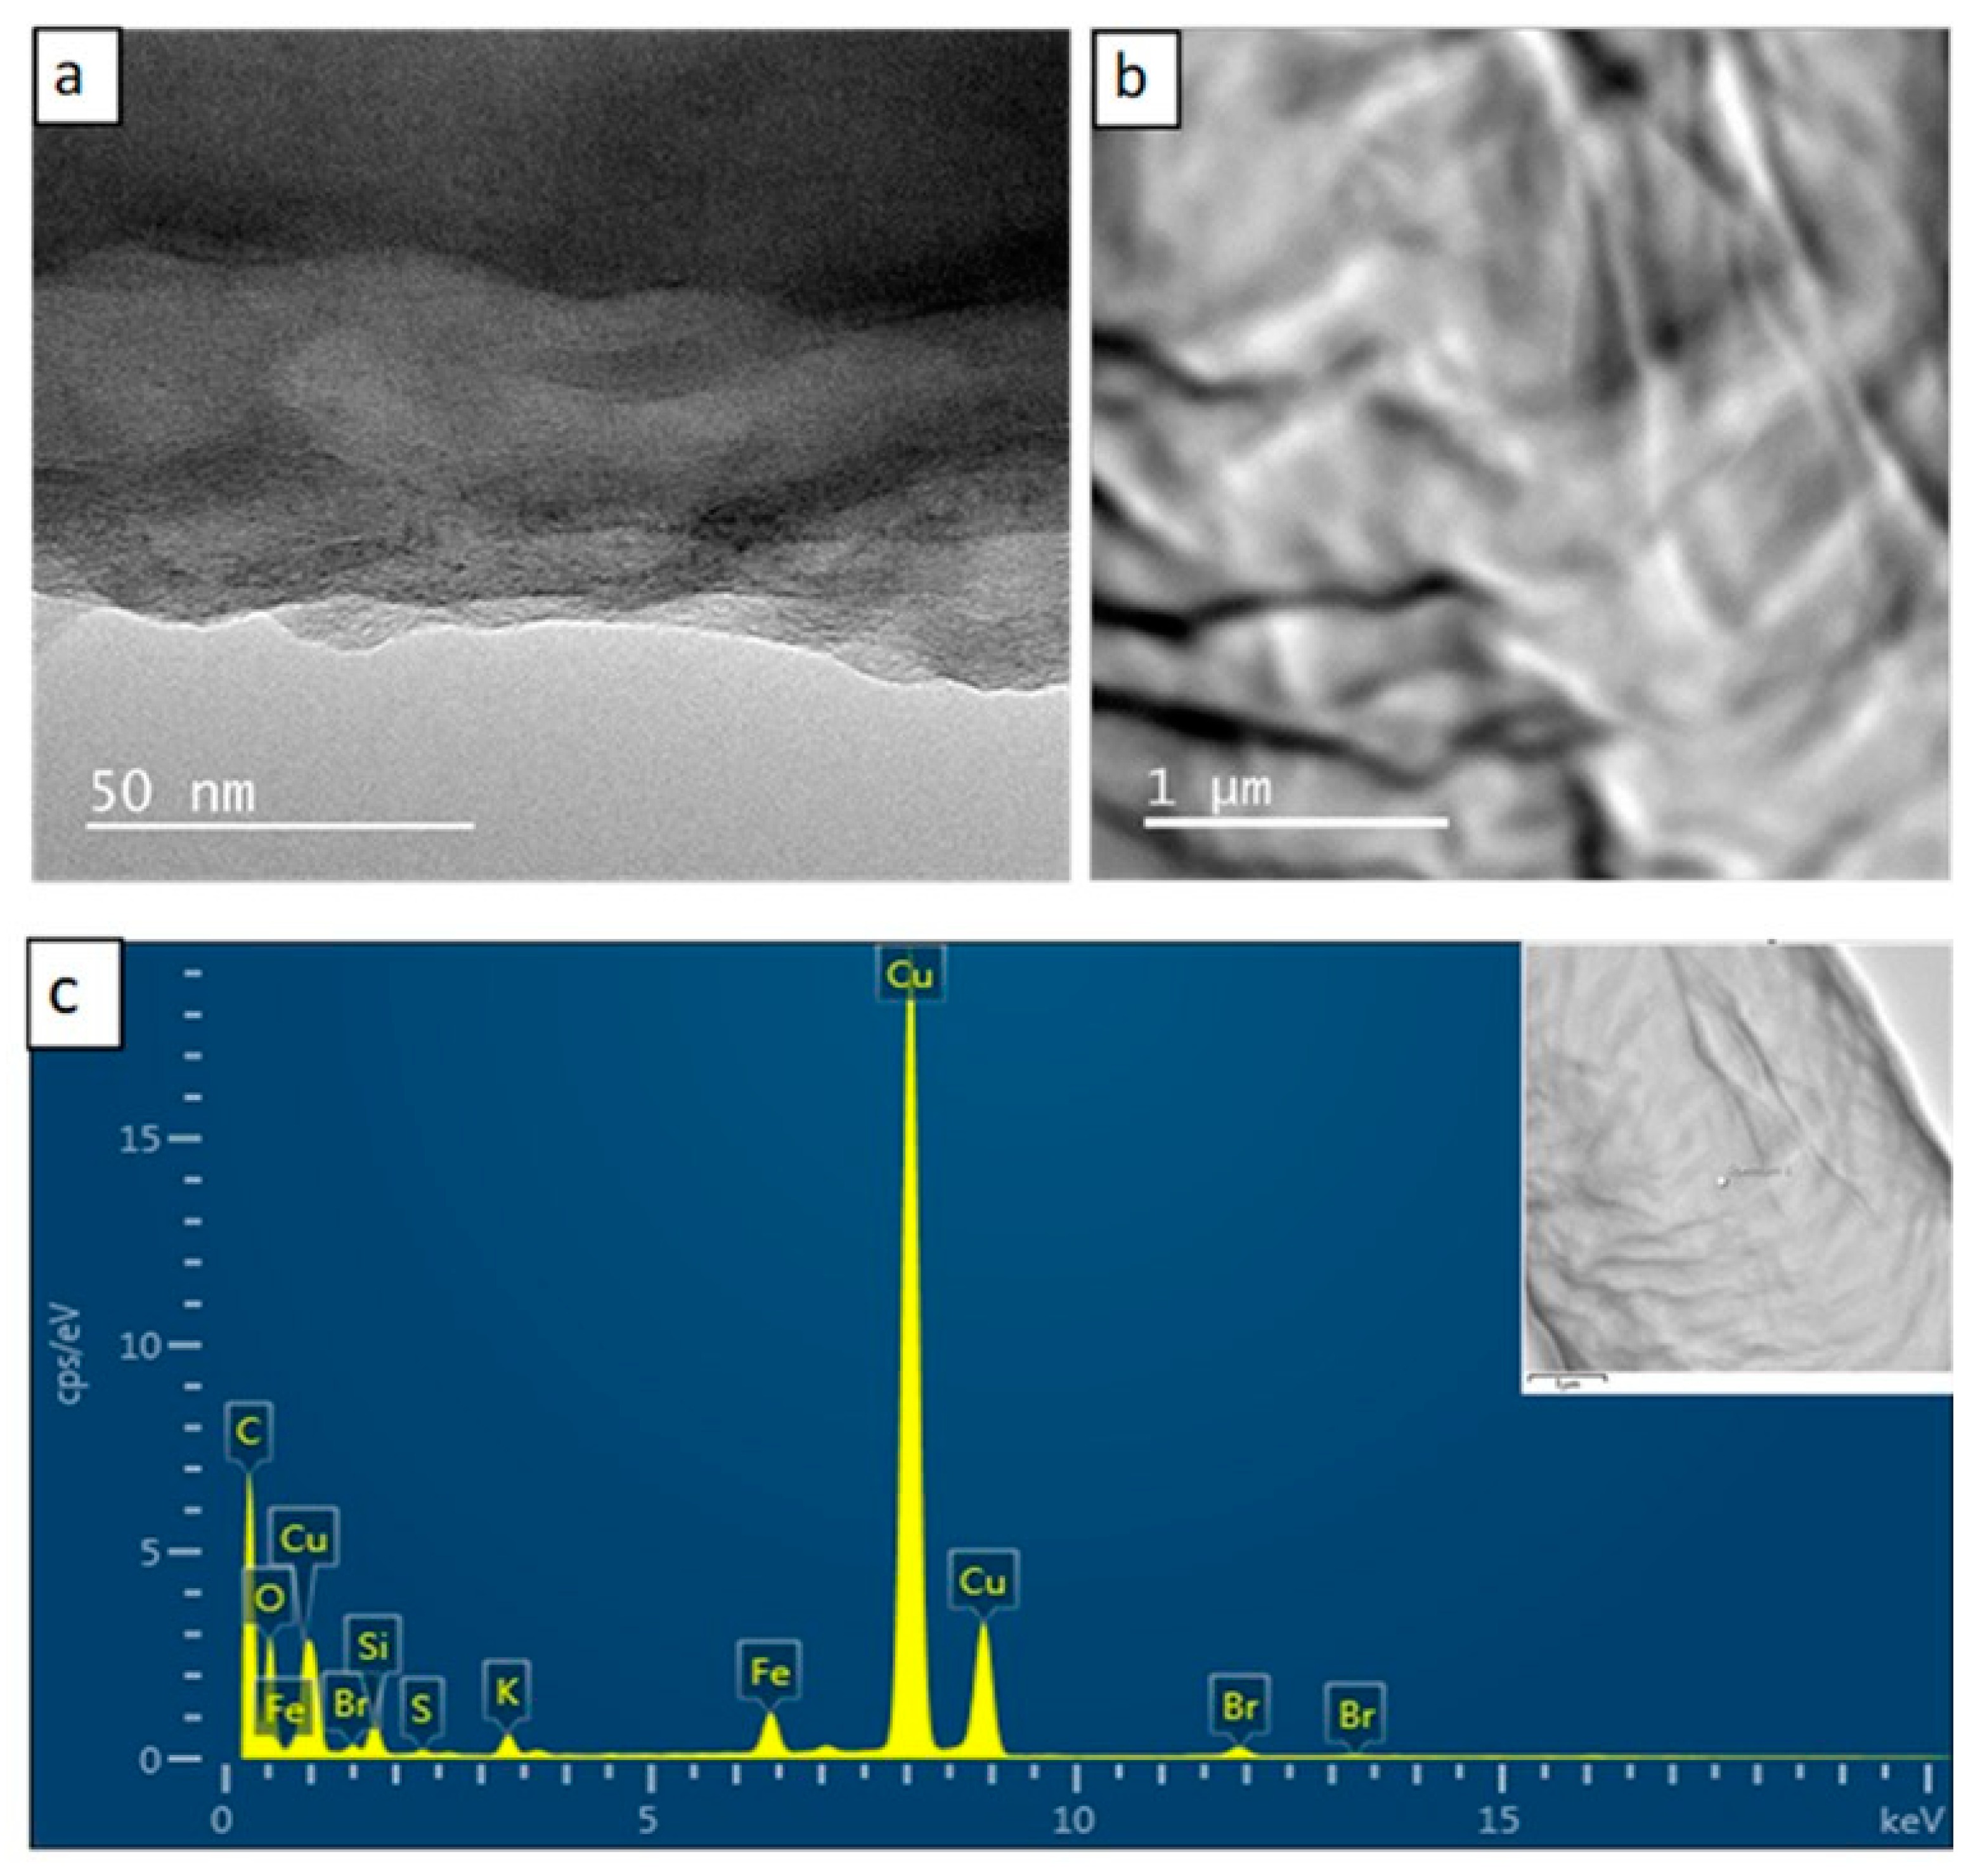
3.5. Transmission Electron Microscopy/Energy Dispersive X-ray Spectroscopy Studies

The reduced graphene oxide was also analyzed via transmission electron microscopy imaging and energy dispersive X-ray spectroscopy (EDS). In preparing samples for TEM imaging, a drop of the reduced graphene oxide dispersion was transferred onto a TEM grid, which was then allowed to dry completely at room temperature in a hood overnight. Figure 4a,b show the high-resolution TEM and Scanning Transmission Electron Microscope (STEM) images of the rGO sample, respectively. The multilayer structure of reduced graphene oxide is observed in the TEM image shown in Figure 4a, and the rGO sheet is clearly observed in the STEM image depicted in Figure 4b. The EDS spectrum (Figure 4c) exhibits a strong carbon peak which is in agreement with the high percentage of carbon in rGO. The EDS spectra also revealed peaks likely to be due to the other materials used or formed during the reduction process. A strong copper peak shown in the spectrum originates from the copper grid used for TEM analysis.

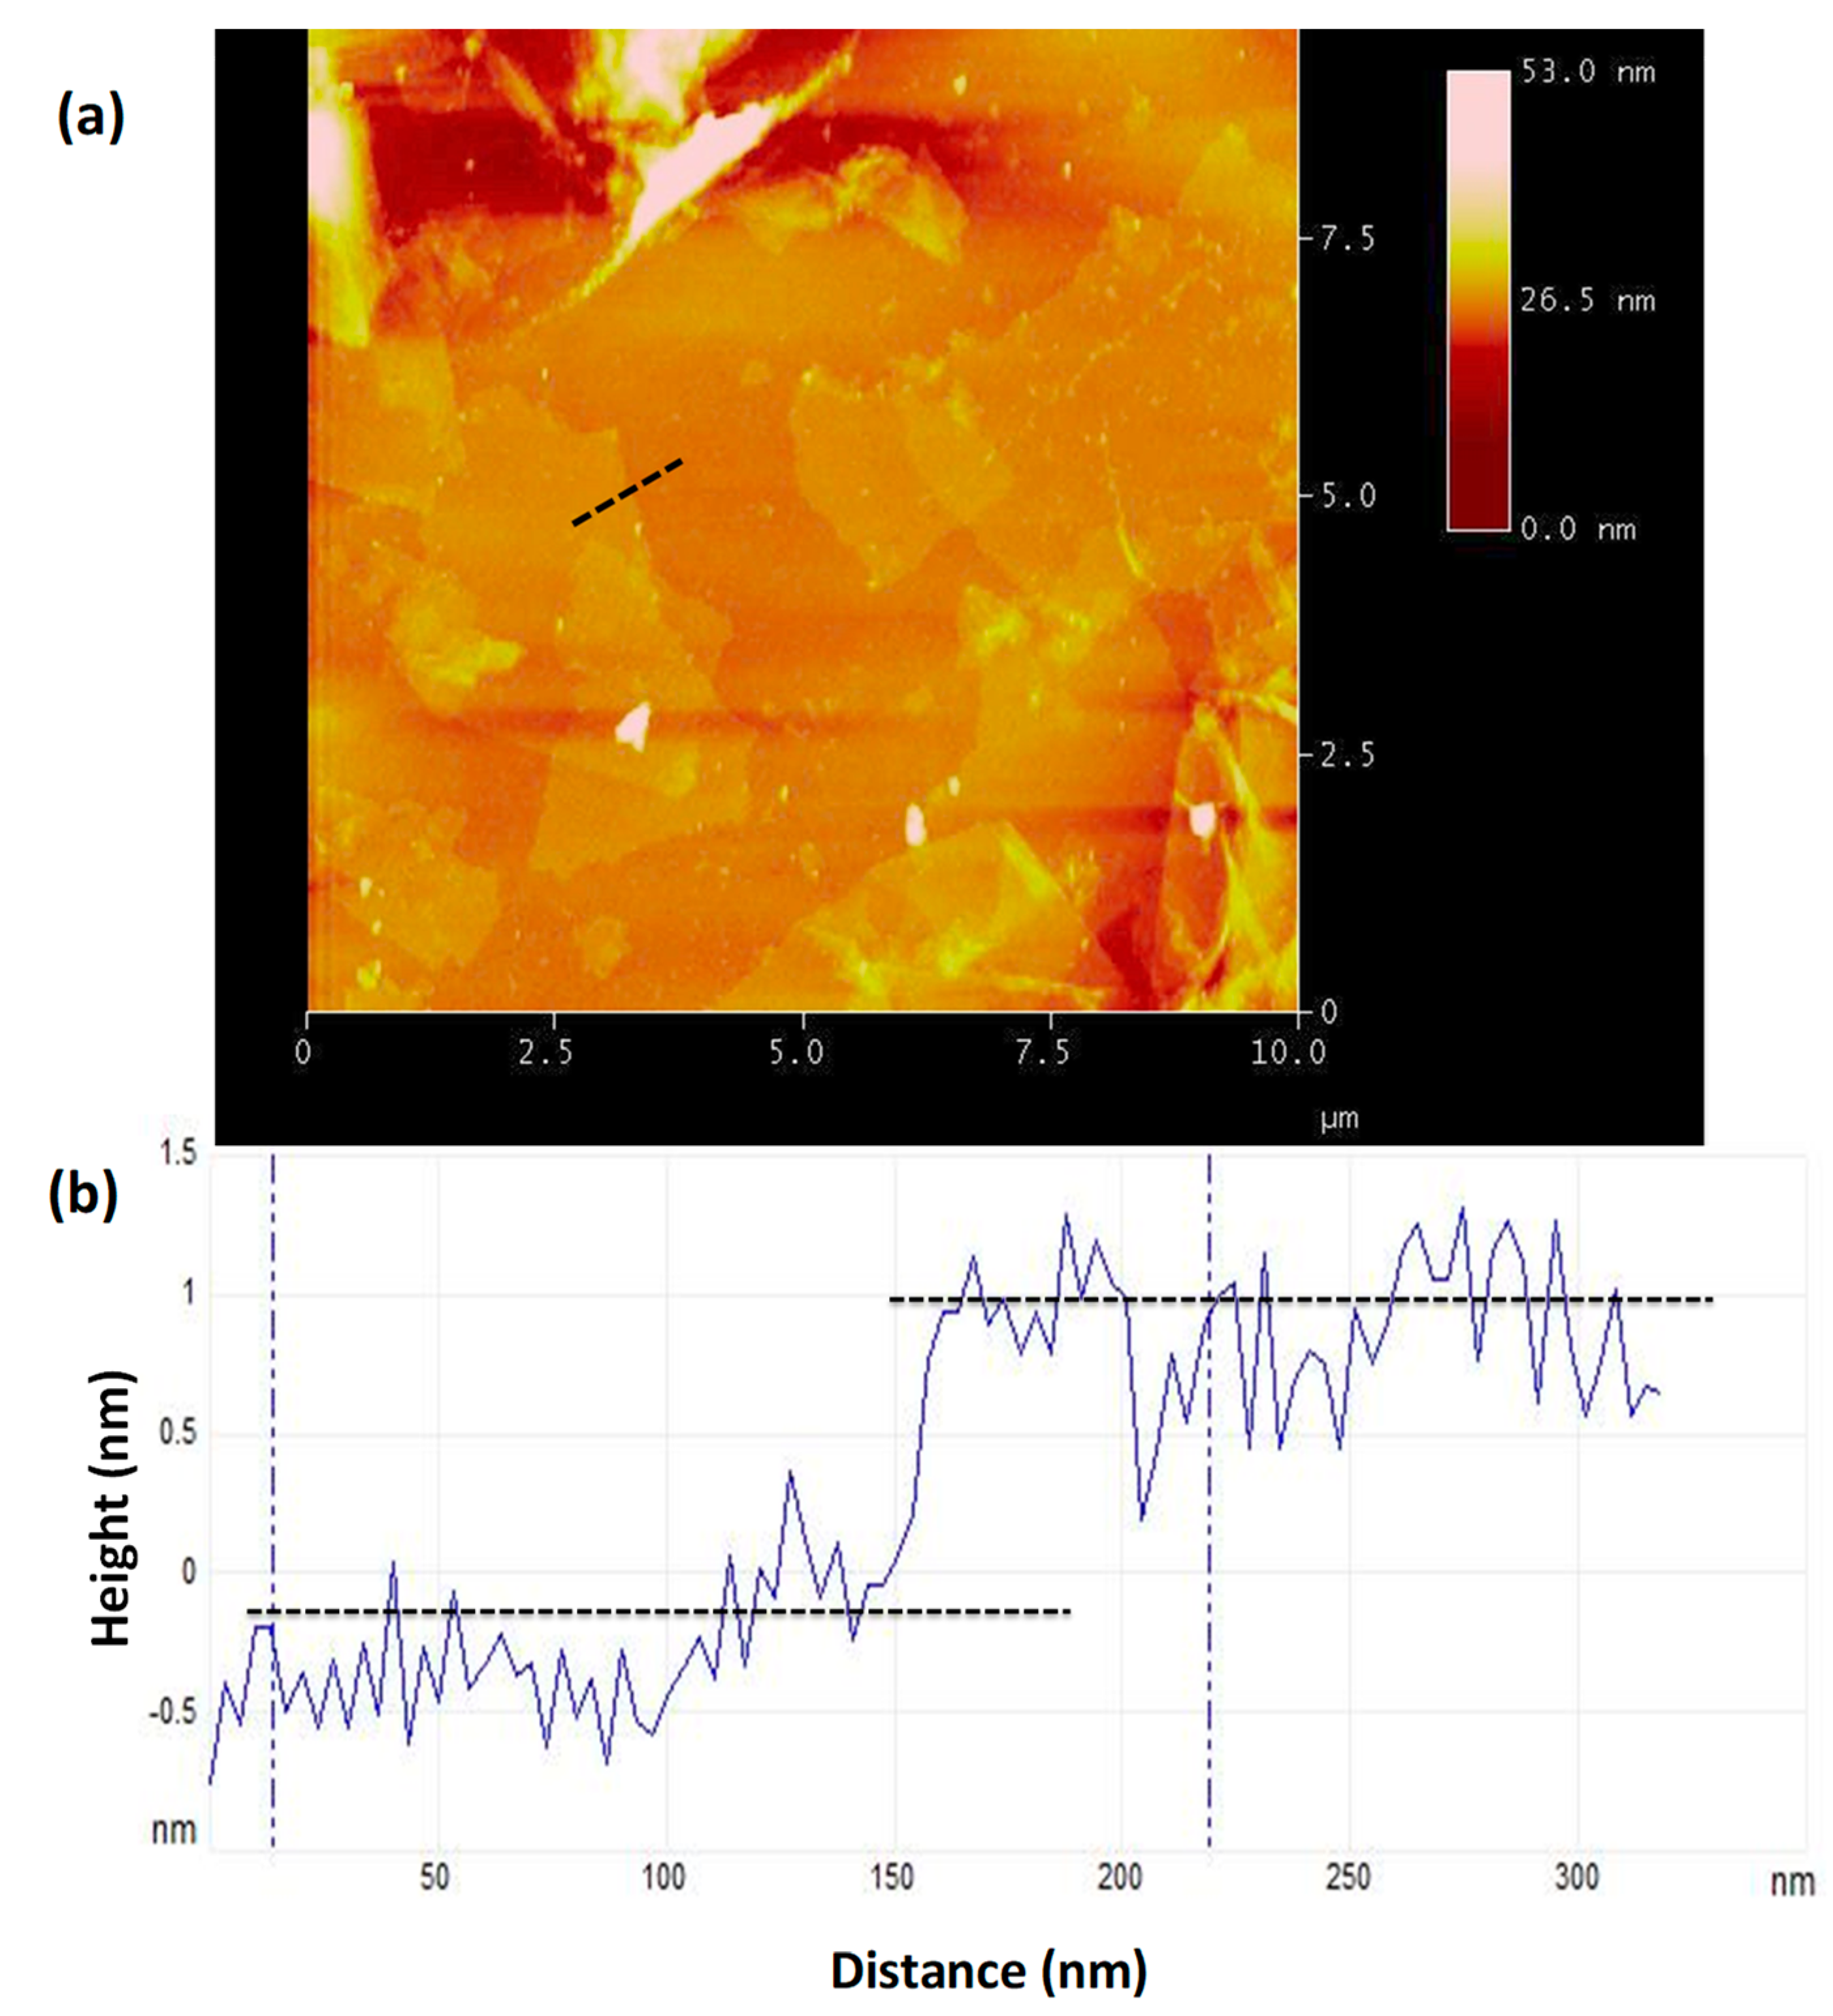
3.6. Atomic Force Microscopy Imaging

The reduced graphene oxide was further characterized using atomic force microscopy as displayed in Figure 5. Figure 5a shows an atomic force microscopic topographical image of a representative single layer flake on Si/SiO2 substrate.
A two-dimensional line profile recorded along the dashed line of Figure 5a is presented in Figure 5b. This height profile of approximately 1 nm layer thickness confirms the detection of a single rGO sheet as shown in Figure 5b [43]. This height is similar to single layer rGO sheet heights reported in previous studies [43,46,47,48,49]. Root mean square (RMS) surface roughness was measured and found to ~0.4 nm. Single and multiple GO sheets are clearly discernible from the optical contrast in the AFM images where the thicker layers give whitish color from its reflection originating from the lack in transparencies.

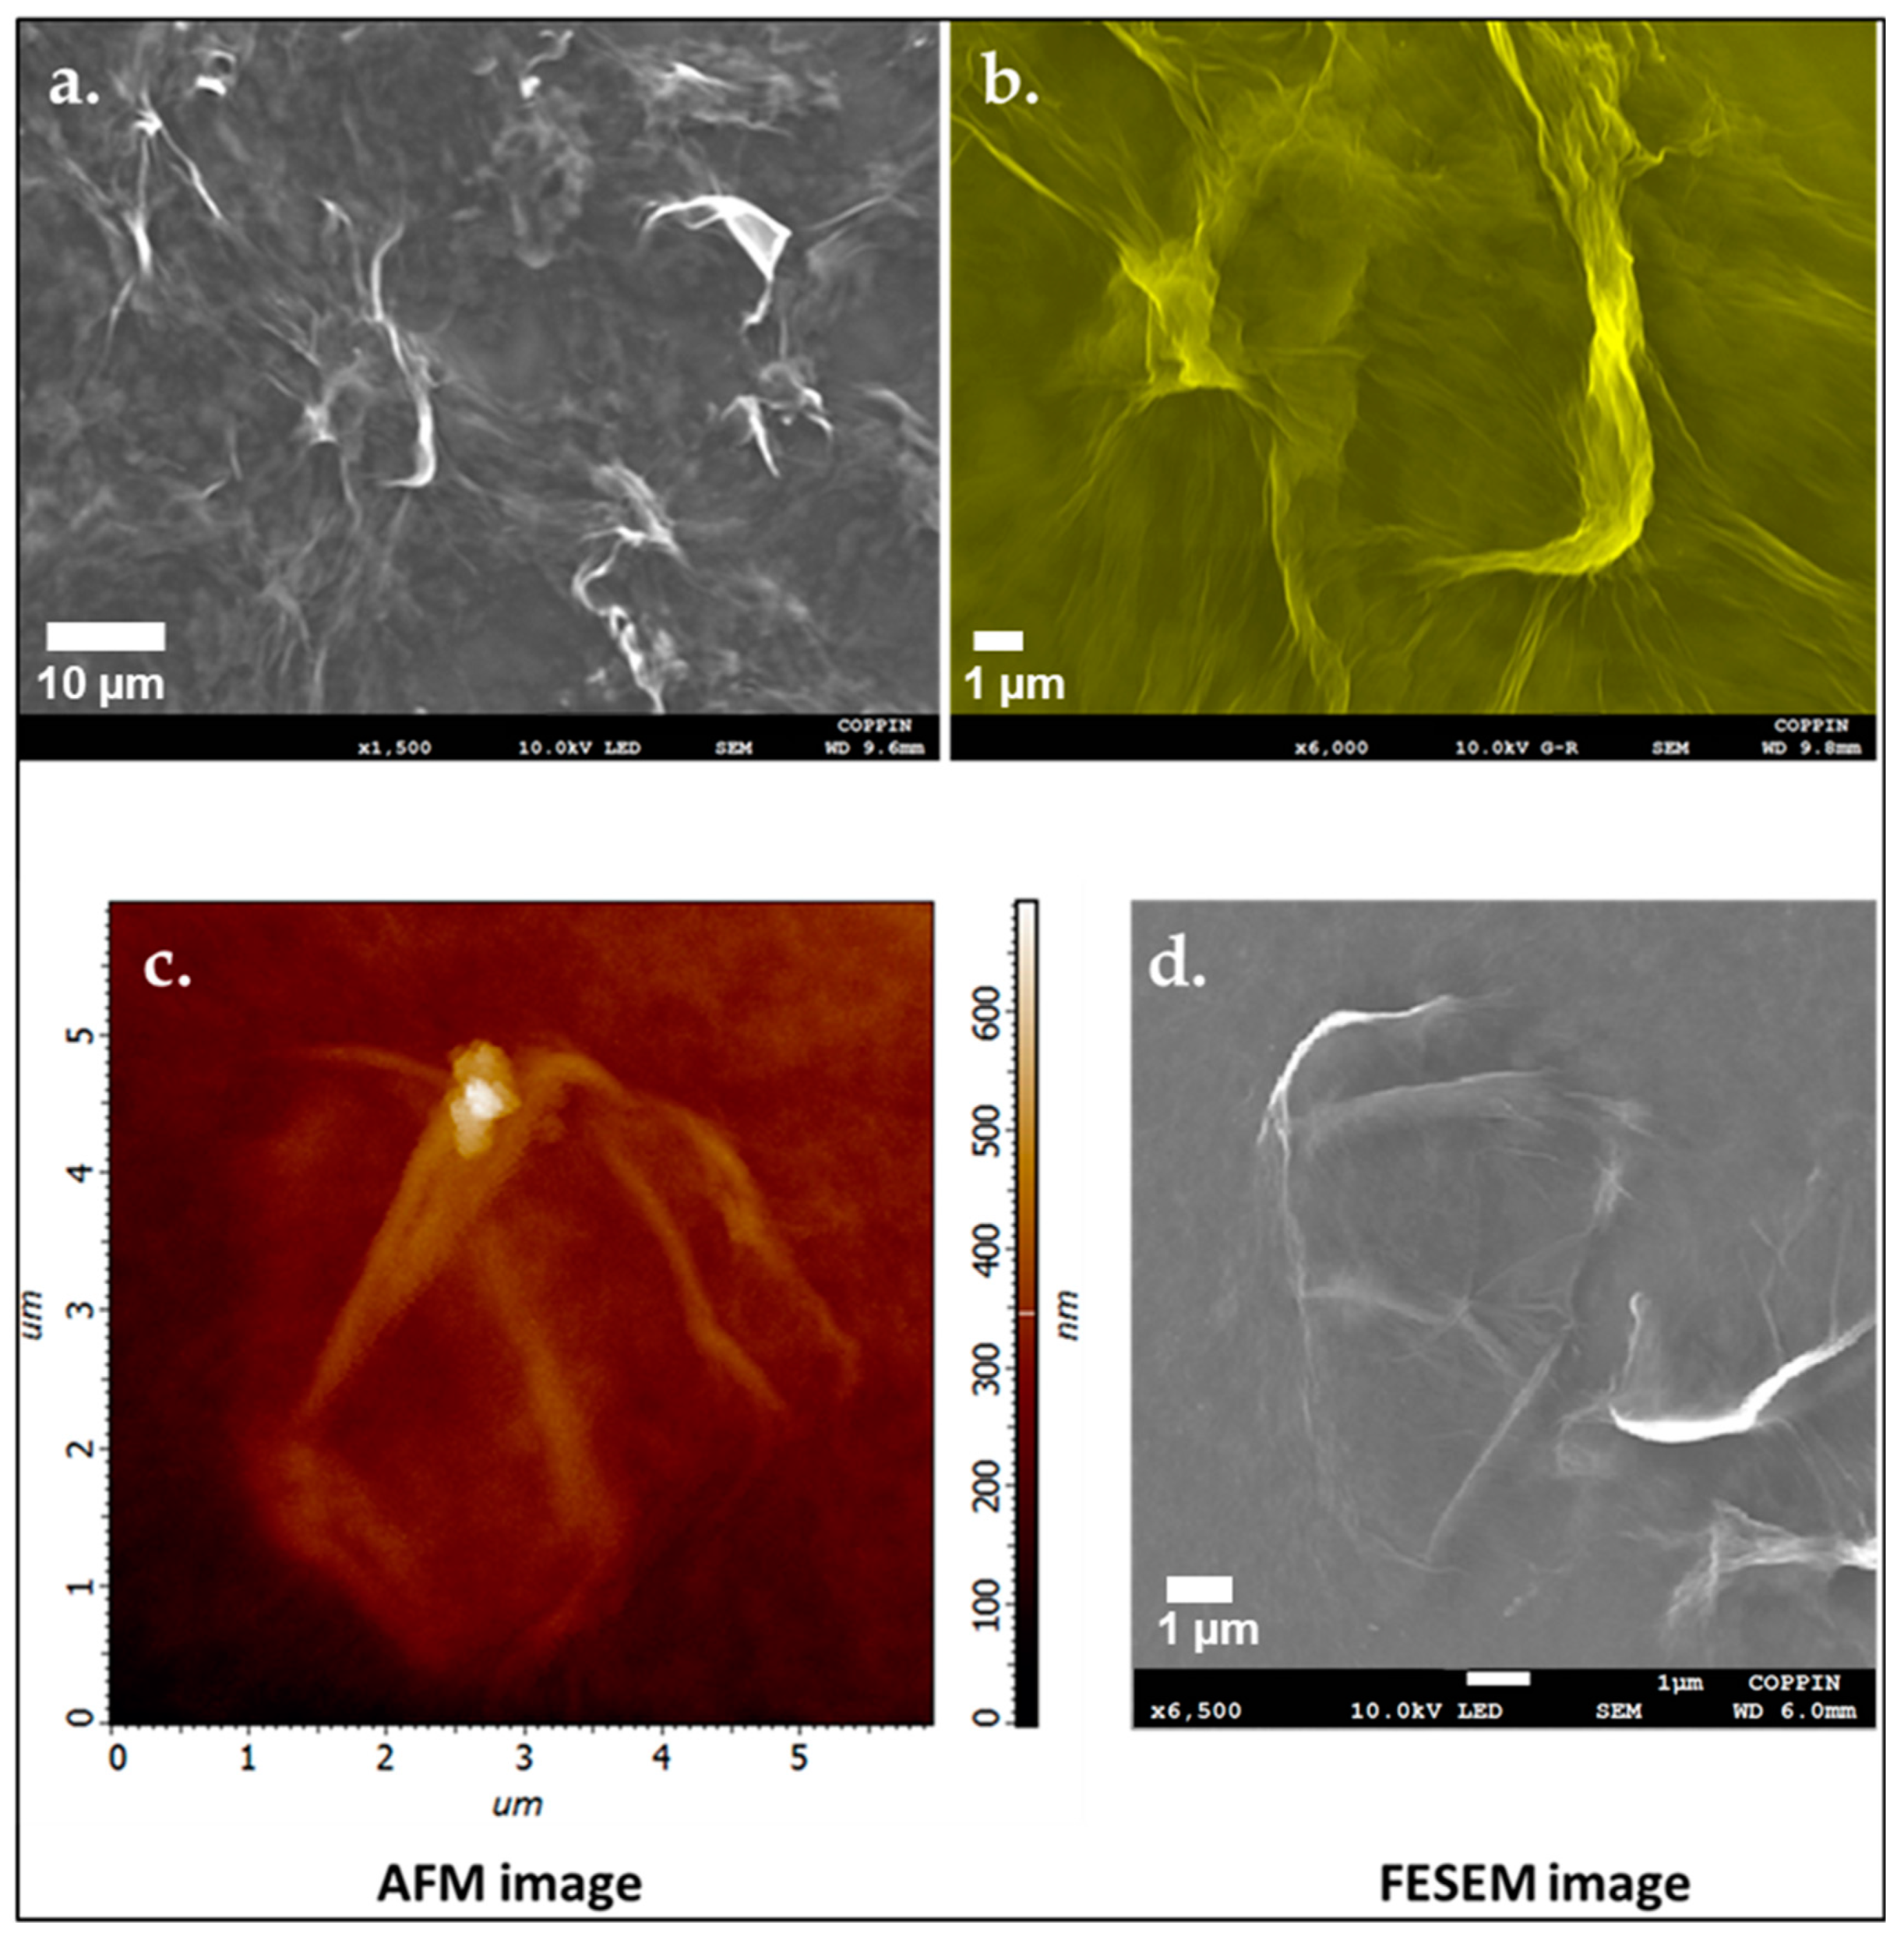
3.7. Field Emission Scanning Electron Microscopy Imaging

Field emission scanning electron microscopy measurements were carried out to study the topography and surface morphology of the reduced graphene oxide. Figure 6 displays the field emission scanning electron microscope images (Figure 6a,b,d), taken at different magnifications and compared with the atomic force microscope image (Figure 6c) of rGO bundle. With the thin rGO sheet, rGO bundles do not get well dispersed in the rGO suspension, as shown in Figure 4. To obtain the AFM and SEM images, a drop of rGO suspension was dried on a Si/SiO2 wafer. The AFM image was obtained in non-contact mode. The scan area was 10 µm × 10 µm showing rGO from single to several layers. The contrast becomes brighter and whitish due to reflectance with the increase of layer numbers. After taking the AFM image, the SEM image was then acquired with the same samples.

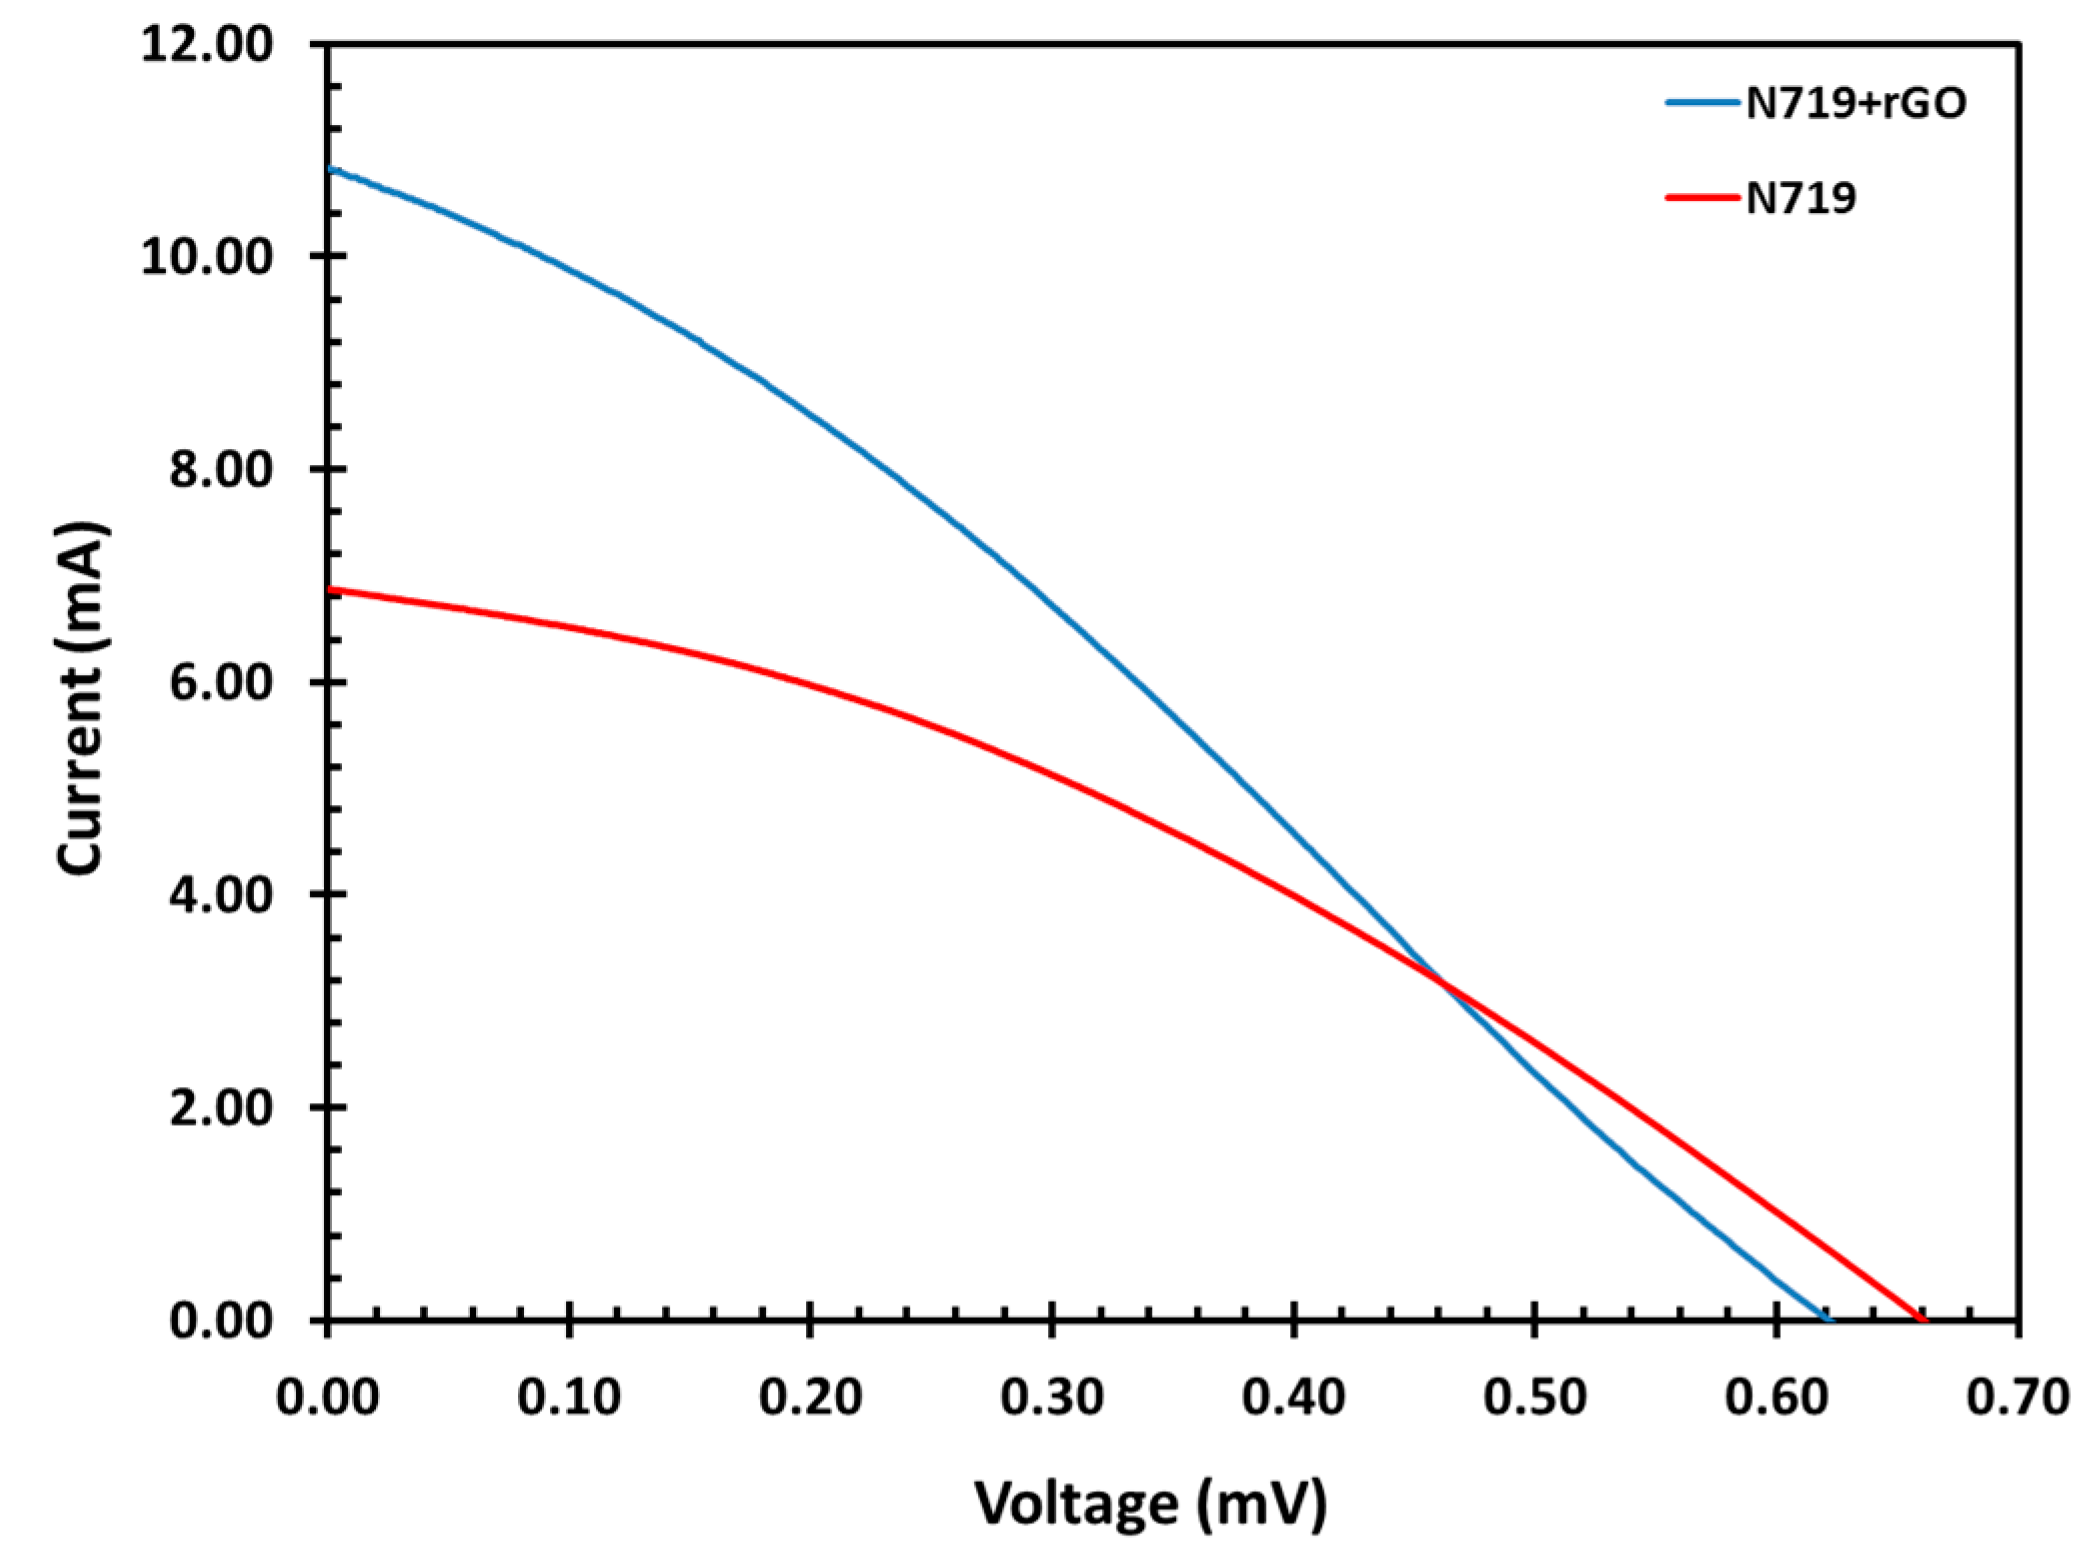
3.8. Current and Voltage Characteristics Measurements

Graphene and derivatives of graphene have been synthesized by various means and have numerous applications in diverse fields [50,51,52,53,54,55,56,57]. In this work, reduced graphene oxides was applied in dye-sensitized solar cells to improve the current and voltage characteristics of the fabricated solar cells. The current and voltage characteristics of the N719 dye and N719/rGO dye-sensitized solar cells were evaluated and cross-compared as displayed in Figure 7 and Table 1. The solar to electric power efficiency of the N719/rGO sensitized solar cells was significantly higher than those of only the N719. The conductive properties of the reduced graphene oxide, thus, play a role in the increase in performance on the DSSC containing rGO. In all, the N719/rGO had an efficiency of 2.02% whereas that of only N719 was 1.35%.

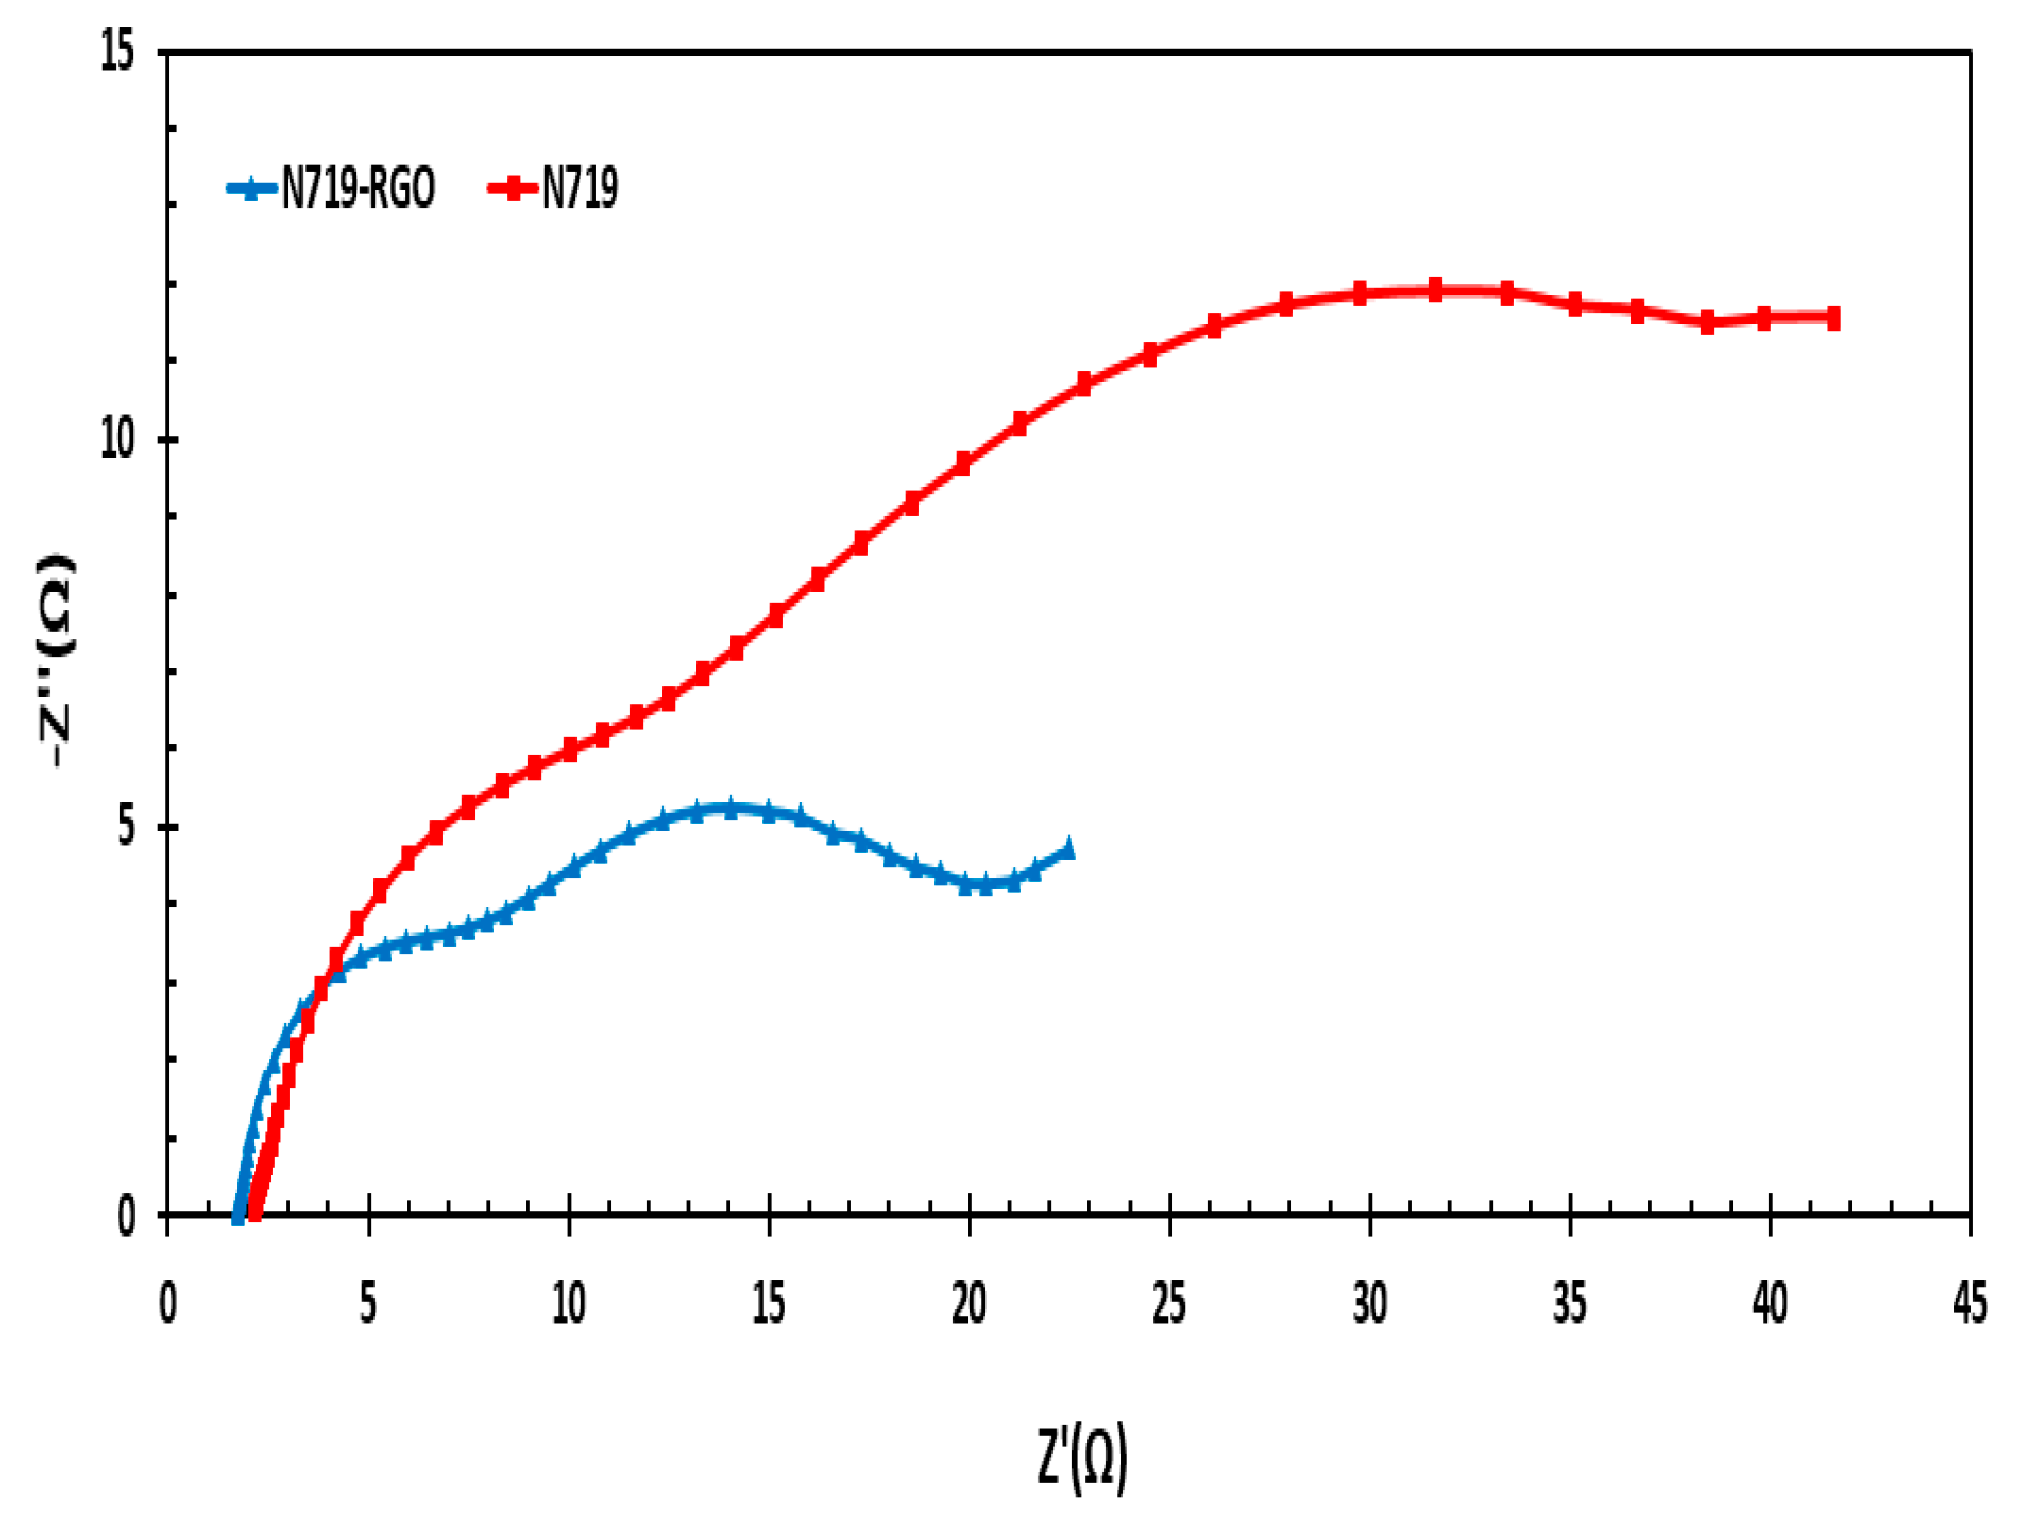
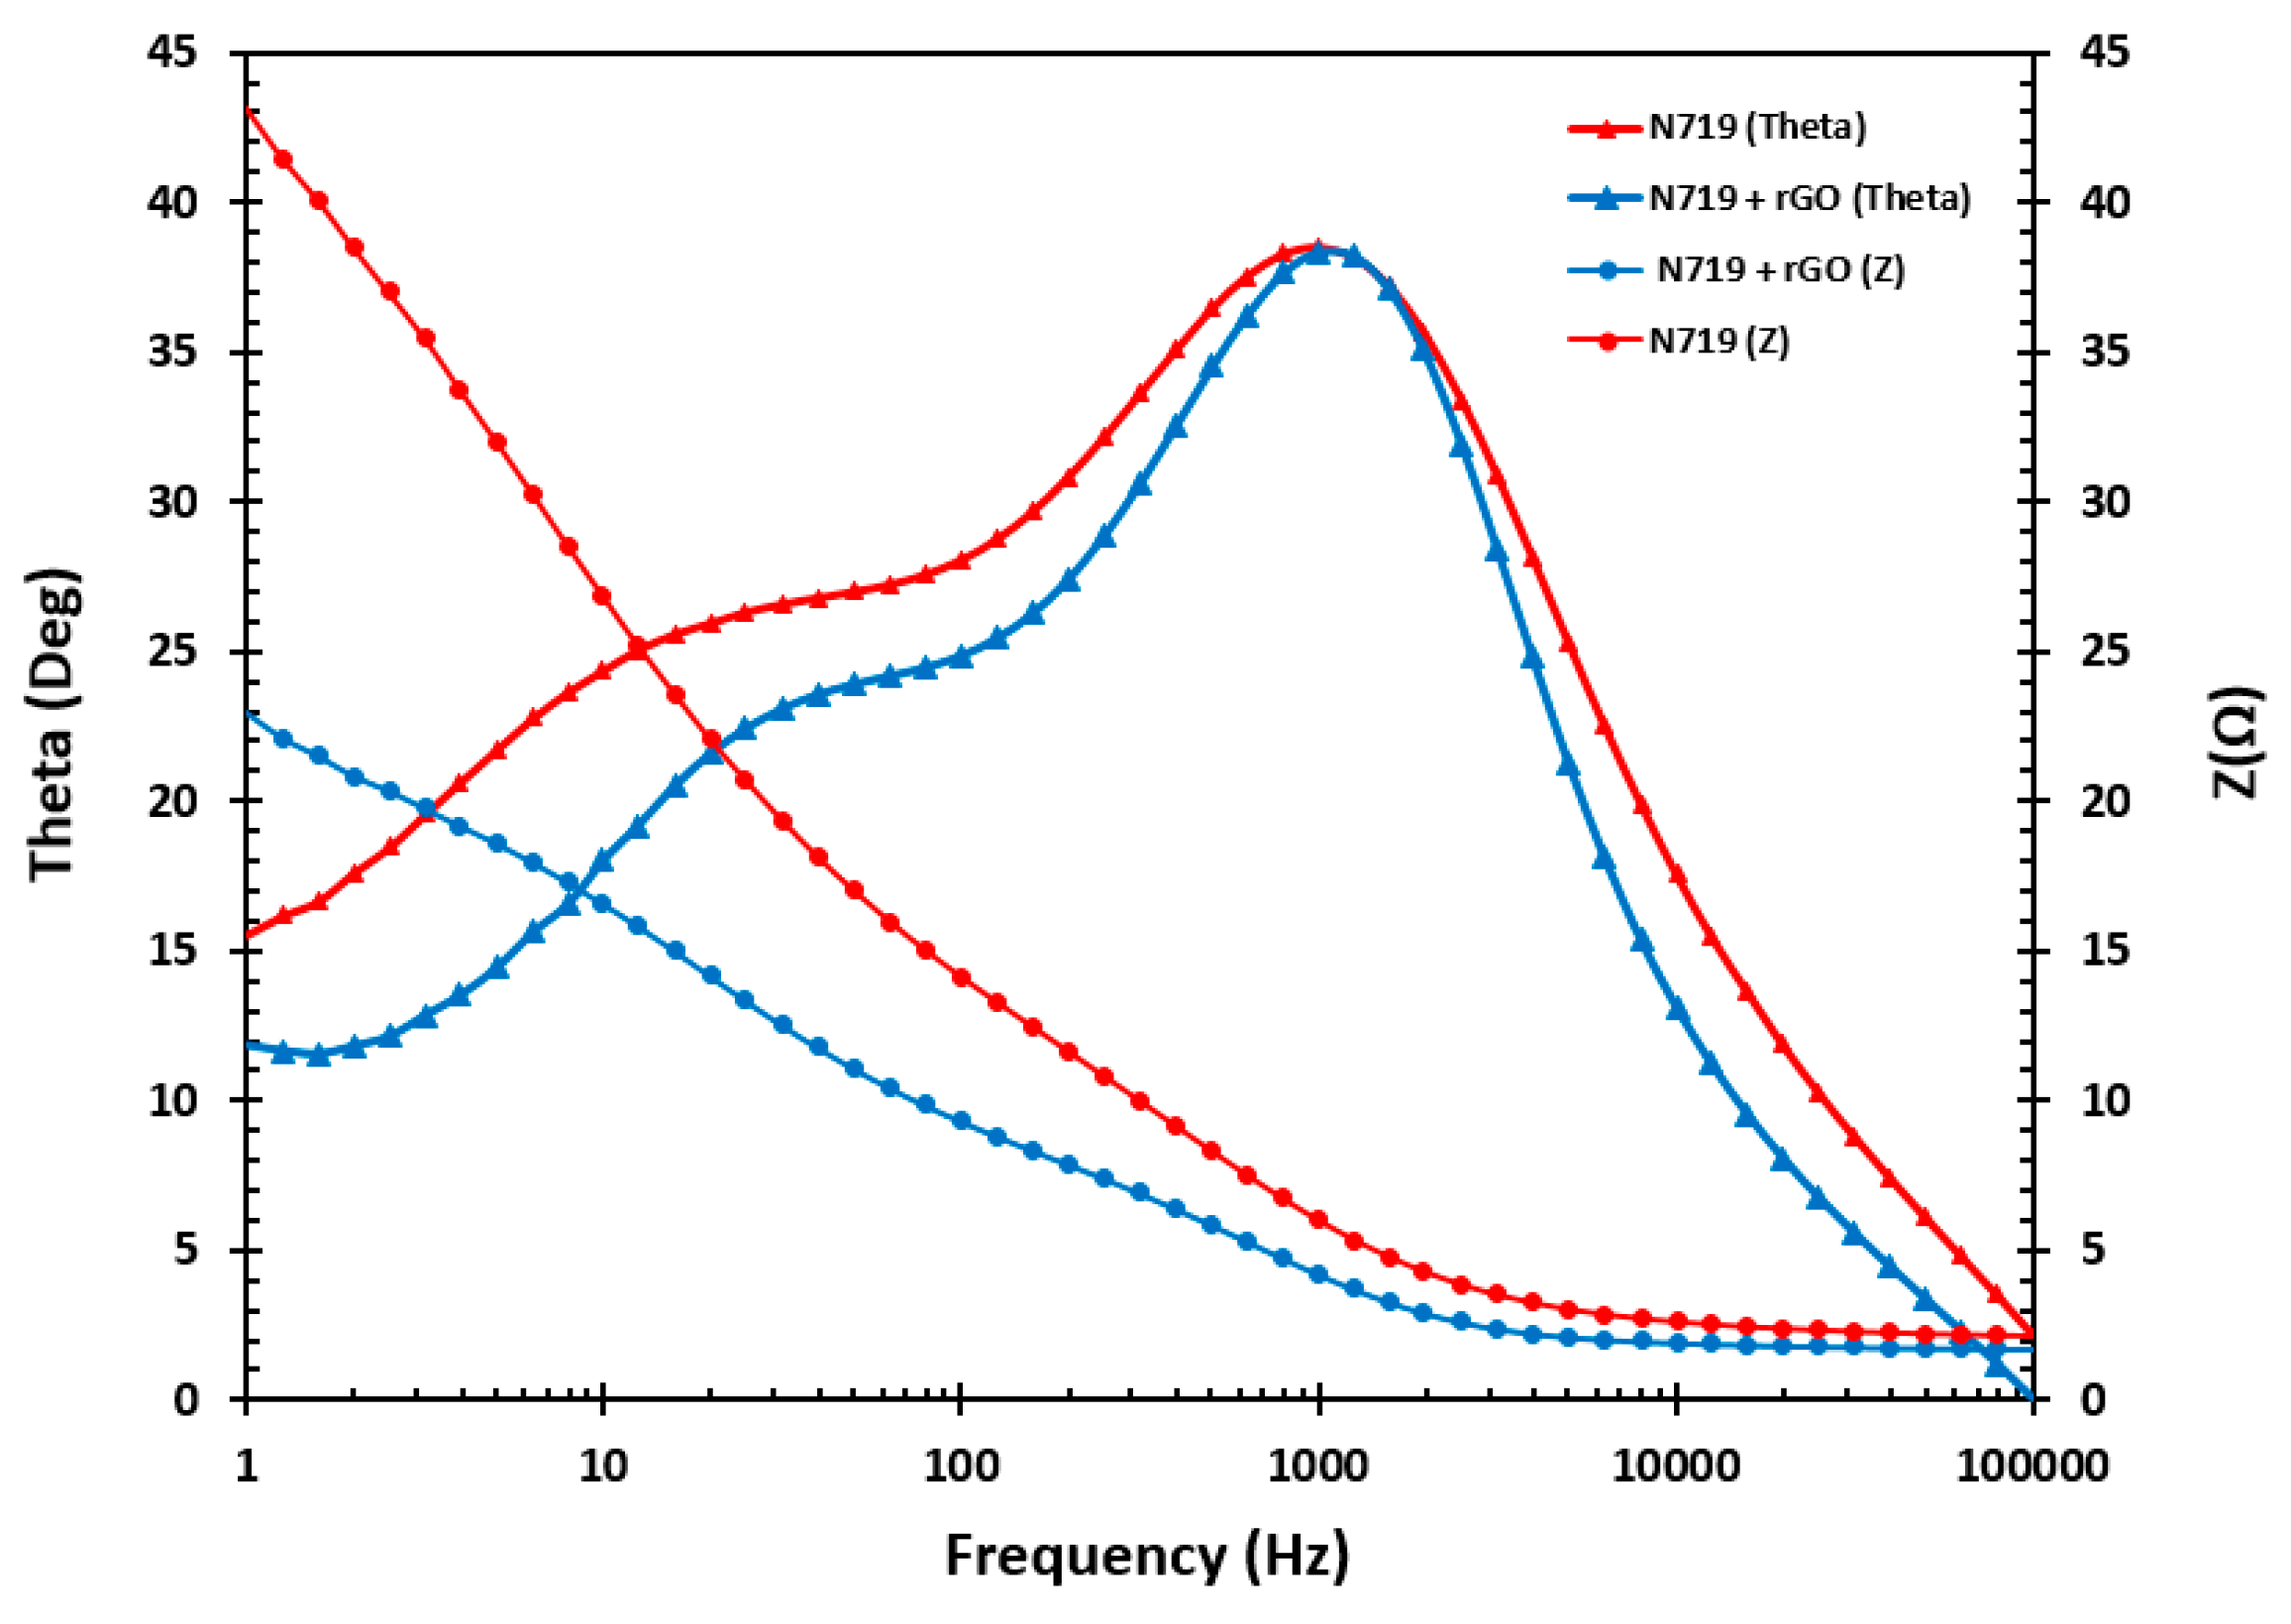
3.9. Impedance Measurement

Impedance measurements are used to investigate the properties and quality of dye-sensitized solar cells. They are usually employed to study the kinetics and energetics of charge transport and recombination in dye-sensitized solar cells. The electrochemical impedance spectra were recorded in the frequency range of 1 Hz and 100 KHz. The measurement provides information about the charge transfer resistance between the counter electrode and redox (I/I3−) electrolyte and also a measure of the resistance to the flow of electron at the TiO2/dye/electrolyte interphase. The impedance measurement results are shown in Figure 8 (Nyquist plot) and Figure 9 (Bode plot). In the Nyquist plot, the equivalent series resistance of the N719 + rGO is a little bit smaller than that of only N719 electrode, but the charge transfer resistance shows the larger difference. The charge transfer resistance can be gained by interpolating the semi-circle to the real x-axis at the low-frequency area. The decrease in the series resistance and the charge transfer resistance results in the increase in the current density of the N719 + rGO. Charge transfer resistance (Rct) obtained from fitting the EIS spectra was approximately 17.5 Ω for N719 and 12.5 Ω for the N719 + rGO. Since the charge transfer resistance to a large extent characterizes the electron flow at the counter electrode, the smaller the resistance, the faster the rate of electron flow and the better the performance of the solar cell. Thus, the results obtained are consistent with the solar-to-electric power efficiency data.

4. Conclusions

In this study, reduced graphene oxide was successfully synthesized from GO and used to enhance the performance of the dye-sensitized solar cell. The extent of GO reduction, thicknesses of rGO, and its dispersion were characterized using UV–visible Spectrometry, Raman spectroscopy, Atomic Force Microscopy, Transmission Electron Microscopy, X-Ray Dispersive Spectroscopy, and Field Emission Scanning Electron Microscopy. The solar to electric power efficiency of the dye-sensitized solar fabricated with the reduced graphene oxide and N719 was 2.02% whereas the conversion efficiency of the dye-sensitized solar cell fabricated with only N719 was 1.61%. The electrochemical impedance measurements corroborated the current–voltage measurements and, thus, showed that the reduced graphene oxide could improve the efficiency of the dye-sensitized solar cell.

Author Contributions

J.U. and S.I.K. conceived the idea and reviewed the final manuscript. W.E.G., H.K. and F.A.C. designed the experiments. W.E.G., H.K. and F.A.C. performed the experiments and wrote the manuscript with the assistance of M.M., M.H.K., and M.M.R. All authors participated in the discussion and commented on the paper.

Funding

This research was funded by the University of Maryland System (Wilson E. Elkins), Grant number 2485897, Constellation, an Exelon Company (E2- Energy to Educate grant program) and Dept. of Education (SAFRA Title III Grant).

Acknowledgments

The authors are also grateful to the Institution of Advancement, Coppin State University, for administrative help. The content is exclusively the responsibility of the authors and does not necessarily represent the official views of the funding agencies.

Conflicts of Interest

There are no conflicts to declare.

References

  1. O’regan, B.; Grätzel, M. A low-cost, high-efficiency solar cell based on dye-sensitized colloidal TiO2 films. Nature 1991, 353, 737–740. [Google Scholar] [CrossRef]
  2. Ghann, W.; Kang, H.; Emerson, E.; Oh, J.; Chavez-Gil, T.; Nesbitt, F.; Williams, R.; Uddin, J. Photophysical properties of near-IR cyanine dyes and their application as photosensitizers in dye sensitized solar cells. Inorg. Chim. Acta 2017, 467, 123–131. [Google Scholar] [CrossRef]
  3. Ghann, W.; Chavez-Gil, T.; Goede, C.I.; Kang, H.; Khan, S.; Sobhi, H.; Nesbitt, F.; Uddin, J. Photophysical, Electrochemical and Photovoltaic Properties of Porphyrin-Based Dye Sensitized Solar Cell. Adv. Mater. Phys. Chem. 2017, 7, 148–172. [Google Scholar] [CrossRef]
  4. Ghann, W.; Sobhi, H.; Kang, H.; Chavez-Gil, T.; Nesbitt, F.; Uddin, J. Synthesis and Characterization of Free and Copper (II) Complex of N, N′-Bis(Salicylidene)Ethylenediamine for Application in Dye Sensitized Solar Cells. J. Mater. Sci. Chem. Eng. 2017, 5, 46–66. [Google Scholar] [CrossRef]
  5. Ghann, W.; Kang, H.; Sheikh, T.; Yadav, S.; Chavez-Gil, T.; Nesbitt, F.; Uddin, J. Fabrication, Optimization and Characterization of Natural Dye Sensitized Solar Cell. Sci. Rep. 2017, 7, 41470. [Google Scholar] [CrossRef] [PubMed] [Green Version]
  6. Ghann, W.; Rahman, A.; Rahman, A.; Uddin, J. Interaction of Sensitizing Dyes with Nanostructured TiO2 Film in Dye-Sensitized Solar Cells Using Terahertz Spectroscopy. Sci. Rep. 2016, 6, 30140. [Google Scholar] [CrossRef] [PubMed]
  7. Zhang, D.; Li, X.; Li, H.; Chen, S.; Sun, Z.; Yin, X.; Huang, S. Graphene-based counter electrode for dye-sensitized solar cells. Carbon 2011, 49, 5382–5388. [Google Scholar] [CrossRef]
  8. Fang, X.; Li, M.; Guo, K.; Zhu, Y.; Hu, Z.; Liu, X.; Chen, B.; Zhao, X. Improved properties of dye-sensitized solar cells by incorporation of graphene into the photoelectrodes. Electrochim. Acta 2012, 65, 174–178. [Google Scholar] [CrossRef]
  9. Chong, S.W.; Lai, C.W.; Hamid, S.B.A. Controllable Electrochemical Synthesis of Reduced Graphene Oxide Thin-Film Constructed as Efficient Photoanode in Dye-Sensitized Solar Cells. Materials (Basel) 2016, 9, 69. [Google Scholar] [CrossRef]
  10. Yeh, M.-H.; Lin, L.-Y.; Chang, L.-Y.; Leu, Y.-A.; Cheng, W.Y.; Lin, J.-J.; Ho, K.-C. Dye-Sensitized Solar Cells with Reduced Graphene Oxide as the Counter Electrode Prepared by a Green Photothermal Reduction Process. ChemPhysChem 2014, 15, 1175–1181. [Google Scholar] [CrossRef]
  11. Gupta, T.; Sakthivel, T.; Sakthivel, S. Recent development in 2D materials beyond graphene. Prog. Mater. Sci. 2015, 73, 44–126. [Google Scholar] [CrossRef]
  12. Dreyer, D.R.; Ruoff, R.S.; Bielawski, C.W. From Conception to Realization: An Historical Account of Graphene and Some Perspectives for Its Future. Angew. Chem. Int. Ed. 2010, 49, 9336–9344. [Google Scholar] [CrossRef] [PubMed]
  13. Koppens, F.H.L.; Mueller, T.; Avouris, P.; Ferrari, A.C.; Vitiello, M.S.; Polini, M. Photodetectors based on graphene, other two-dimensional materials and hybrid systems. Nat. Nanotechnol. 2014, 9, 780–793. [Google Scholar] [CrossRef] [PubMed]
  14. Dubertret, B.; Heine, T.; Terrones, M. The Rise of Two-Dimensional Materials. Acc. Chem. Res. 2015, 48, 1–2. [Google Scholar] [CrossRef] [PubMed]
  15. Novoselov, K.S.; Geim, A.K.; Morozov, S.V.; Jiang, D.; Zhang, Y.; Dubonos, S.V.; Grigorieva, I.V.; Firsov, A.A. Electric Field Effect in Atomically Thin Carbon Films. Science 2004, 306, 666. [Google Scholar] [CrossRef]
  16. Babak, A.; Maria, L.; Yury, G. 2D metal carbides and nitrides (MXenes) for energy storage. Nat. Rev. Mater. 2017, 2, 16098. [Google Scholar]
  17. Fiori, G.; Bonaccorso, F.; Iannaccone, G.; Palacios, T.; Neumaier, D.; Seabaugh, A.; Banerjee, S.K.; Colombo, L. Electronics based on two-dimensional materials. Nat. Nanotechnol. 2014, 9, 768–779. [Google Scholar] [CrossRef]
  18. Sun, Y.; Gao, S.; Lei, F.; Xiao, C.; Xie, Y. Ultrathin Two-Dimensional Inorganic Materials: New Opportunities for Solid State Nanochemistry. Acc. Chem. Res. 2015, 48, 3–12. [Google Scholar] [CrossRef]
  19. Zou, X.; Yakobson, B. An Open Canvas—2D Materials with Defects, Disorder, and Functionality. Acc. Chem. Res. 2015, 48, 73–80. [Google Scholar] [CrossRef]
  20. Khan, A.H.; Ghosh, S.; Pradhan, B.; Dalui, A.; Shrestha, L.K.; Acharya, S.; Ariga, K. Two-Dimensional (2D) Nanomaterials towards Electrochemical Nanoarchitectonics in Energy-Related Applications. Bull. Chem. Soc. Jpn. 2017, 90, 627–648. [Google Scholar] [CrossRef] [Green Version]
  21. Choi, H.; Kim, H.; Hwang, S.; Han, Y.; Jeon, M. Graphene counter electrodes for dye-sensitized solar cells prepared by electrophoretic deposition. J. Mater. Chem. 2011, 21, 7548–7551. [Google Scholar] [CrossRef]
  22. Roy-Mayhew, J.D.; Aksay, I.A. Graphene Materials and Their Use in Dye-Sensitized Solar Cells. Chem. Rev. 2014, 114, 6323–6348. [Google Scholar] [CrossRef] [PubMed]
  23. Tang, Y.B.; Lee, C.S.; Xu, J.; Liu, Z.T.; Chen, Z.H.; He, Z.; Cao, Y.L.; Yuan, G.; Song, H.; Chen, L.; et al. Incorporation of graphenes in nanostructured TiO2 films via molecular grafting for dye-sensitized solar cell application. ACS Nano 2010, 4, 3482–3488. [Google Scholar] [CrossRef] [PubMed]
  24. Muthoosamy, K.; Bai, R.G.; Abubakar, I.B.; Sudheer, S.M.; Lim, H.N.; Loh, H.S.; Huang, N.M.; Chia, C.H.; Manickam, S. Exceedingly Biocompatible and Thin-Layered Reduced Graphene Oxide Nanosheets Using an Eco-Friendly Mushroom Extract Strategy. Int. J. Nanomed. 2015, 10, 1505–1519. [Google Scholar]
  25. Robinson, J.T.; Perkins, F.K.; Snow, E.S.; Wei, Z.; Sheehan, P.E. Reduced Graphene Oxide Molecular Sensors. Nano Lett. 2008, 8, 3137–3140. [Google Scholar] [CrossRef] [PubMed] [Green Version]
  26. Gaidukevič, J.; Pauliukaitė, R.; Niaura, G.; Matulaitienė, I.; Opuchovič, O.; Radzevič, A.; Astromskas, G.; Bukauskas, V.; Barkauskas, J. Synthesis of Reduced Graphene Oxide with Adjustable Microstructure Using Regioselective Reduction in the Melt of Boric Acid: Relationship Between Structural Properties and Electrochemical Performance. Nanomaterials 2018, 8, 889. [Google Scholar] [CrossRef] [PubMed]
  27. Abdolhosseinzadeh, S.; Asgharzadeh, H.; Kim, H.S. Fast and fully-scalable synthesis of reduced graphene oxide. Sci. Rep. 2015, 5, 10160. [Google Scholar] [CrossRef] [PubMed]
  28. Chunder, A.; Pal, T.; Khondaker, S.I.; Zhai, L. Reduced Graphene Oxide/Copper Phthalocyanine Composite and Its Optoelectrical Properties. J. Phys. Chem. C 2010, 114, 15129–15135. [Google Scholar] [CrossRef]
  29. Rahman, M.Y.A.; Sulaiman, A.S.; Umar, A.A.; Salleh, M.M. Dye-sensitized solar cell (DSSC) utilizing reduced graphene oxide (RGO) films counter electrode: Effect of graphene oxide (GO) content. J. Mater. Sci. Mater. Electron. 2016, 28, 1674–1678. [Google Scholar] [CrossRef]
  30. Yang, B.; Zuo, X.; Chen, P.; Zhou, L.; Yang, X.; Zhang, H.; Li, G.; Wu, M.; Ma, Y.; Jin, S.; et al. Nanocomposite of Tin Sulfide nanoparticles with Reduced Graphene Oxide in High-Efficiency Dye-Sensitized Solar Cells. ACS Appl. Mater. Interfaces 2015, 7, 137–143. [Google Scholar] [CrossRef]
  31. Marchezi, P.E.; Sonai, G.G.; Hirata, M.K.; Schiavon, M.A.; Nogueira, A.F. Understanding the Role of Reduced Graphene Oxide in the Electrolyte of Dye-Sensitized Solar Cells. J. Phys. Chem. C 2016, 120, 23368–23376. [Google Scholar] [CrossRef]
  32. Tang, B.; Ji, G.; Wang, Z.; Chen, H.; Li, X.; Yu, H.; Li, S.; Liu, H. Three-dimensional graphene networks and reduced graphene oxide nanosheets co-modified dye-sensitized solar cells. Power Sources 2012, 220, 95. [Google Scholar] [CrossRef]
  33. Zhu, G.; Xu, T.; Lv, T.; Pan, L.; Zhao, Q. Graphene-incorporated nanocrystalline TiO2 films for CdS quantum dot-sensitized solar cells. J. Electroanal. Chem. 2011, 650, 248. [Google Scholar] [CrossRef]
  34. He, Z.; Guai, G.; Liu, J.; Guo, C.; Loo, J.S.; Li, C.M.; Tan, T.T. Nanostructure control of graphene-composited TiO2 by a one-step solvothermal approach for high performance dye-sensitized solar cells. Nanoscale 2011, 3, 4613–4616. [Google Scholar] [CrossRef]
  35. Bell, N.J.; Ng, Y.H.; Du, A.; Smith, H.C.S.C.; Amal, R. Understanding the Enhancement in Photoelectrochemical Properties of Photocatalytically Prepared TiO2-Reduced Graphene Oxide Composite. J. Phys. Chem. C 2011, 115, 6004–6009. [Google Scholar] [CrossRef]
  36. Sun, S.; Gao, L.; Liu, Y. Enhanced de-sensitized solar cell using graphene-TiO2 photoanode prepared by heterogeneous coagulation. Appl. Phys. Lett. 2010, 96, 083113. [Google Scholar] [CrossRef]
  37. Park, J.H.; Seo, S.W.; Kim, J.H.; Choi, C.J.; Kim, H.; Lee, D.K.; Jung, W.S.; Ahn, K.S. Improved Efficiency of Dye-Sensitized Solar Cell Using Graphene-Coated Al2O3-TiO2 Nanocomposite Photoanode. Mol. Cryst. Liq. Cryst. 2011, 538, 285. [Google Scholar] [CrossRef]
  38. Tsai, T.-H.; Chiou, S.-C.; Chen, S.-M. Enhancement of Dye-Sensitized Solar Cells by using GrapheneTiO2 Composites as Photoelectrochemical Working Electrode. Int. J. Electrochem. Sci. 2011, 6, 3333. [Google Scholar]
  39. Joung, D.; Khondaker, S.I. Efros-Shklovskii variable range hopping in reduced graphene oxide sheets of varying carbon sp2 fraction. Phys. Rev. 2012, 86, 235423. [Google Scholar] [CrossRef]
  40. Joung, D.; Khondaker, S.I. Structural Evolution of Reduced Graphene Oxide of Varying Carbon sp2 Fractions Investigated via Coulomb Blockade Transport. J. Phys. Chem. 2013, 117, 26776–26782. [Google Scholar] [CrossRef]
  41. Kang, N.; Khondaker, S.I. The impact of carbon sp2 fraction of reduced graphene oxide on the performance of reduced graphene oxide contacted organic transistors. Phys. Lett. 2014, 105, 223301. [Google Scholar] [CrossRef]
  42. Joung, D.; Khondaker, S.I. Two- to one-dimensional crossover in graphene quantum dot arrays observed in reduced graphene oxide nanoribbons. Phys. Rev. B 2014, 89, 245411–2454117. [Google Scholar] [CrossRef]
  43. Marcano, D.C.; Kosynkin, D.V.; Berlin, J.M.; Sinitskii, A.; Sun, Z.; Slesarev, A.; Alemany, L.B.; Lu, W.; Tour, J.M. Improved Synthesis of Graphene Oxide. ACS Nano 2010, 4, 4806–4814. [Google Scholar] [CrossRef] [Green Version]
  44. Grimm, S.; Schweiger, M.; Eigler, S.; Zaumseil, J. High-Quality Reduced Graphene Oxide by CVD-Assisted Annealing. J. Phys. Chem. C 2016, 120, 3036–3041. [Google Scholar] [CrossRef]
  45. Çiplak, Z.; Yildiz, N.; Çalimli, A. Investigation of Graphene/Ag Nanocomposites Synthesis Parameters for Two Different Synthesis Methods. Fuller. Nanotub. Carbon Nanostruct. 2015, 23, 361–370. [Google Scholar] [CrossRef]
  46. King, A.A.K.; Davies, B.R.; Noorbehesht, N.; Newman, P.; Church, T.L.; Harris, A.T.; Raza, J.M.; Minett, A.I. A New Raman Metric for the Characterization of Graphene oxide and its Derivatives. Sci. Rep. 2016, 6, 19491. [Google Scholar] [CrossRef]
  47. G´omez-Navarro, C.; Weitz, R.T.; Bittner, A.M.; Scolari, M.; Mews, A.; Burghard, M.; Kern, K. Electronic transport properties of individual chemically reduced graphene oxide sheets. Nano Lett. 2007, 7, 3499–3503. [Google Scholar] [CrossRef]
  48. Jung, I.; Dikin, D.A.; Piner, D.R.; Ruoff, R.S. Tunable electrical conductivity of individual graphene oxide sheets reduced at “low” temperatures. Nano Lett. 2008, 8, 4283. [Google Scholar] [CrossRef]
  49. Eda, G.; Fanchini, G.; Chhowalla, M. Large-area ultrathin films of reduced graphene oxide as a transparent and flexible electronic material. Nat. Nanotechnol. 2008, 3, 270. [Google Scholar] [CrossRef]
  50. Kotchey, G.P.; Allen, B.L.; Vedala, H.; Yanamala, N.; Kapralov, A.A.; Tyurina, Y.Y.; Klein-Seetharaman, J.; Kagan, V.E.; Star, A. The Enzymatic Oxidation of Graphene Oxide. The enzymatic oxidation of graphene oxide. ACS Nano 2011, 5, 2098–2108. [Google Scholar] [CrossRef]
  51. Singh, V.; Joung, D.; Zhai, L.; Das, S.; Khondaker, S.I.; Seal, S. Graphene based materials: Past, present and future. Prog. Mater. Sci. 2011, 56, 1178. [Google Scholar] [CrossRef]
  52. Dikin, D.A.; Stankovich, S.; Zimney, E.J.; Piner, R.D.; Dommett, G.H.B.; Evmenenko, G.; Nguyen, S.T.; Ruoff, R.S.; Kim, S.O. Three-Dimensional Self-Assembly of Graphene Oxide Platelets into Mechanically Flexible Macroporous Carbon Film. Angew. Chem. 2010, 122, 10282–10286. [Google Scholar]
  53. Chowdhury, F.A.; Mochida, T.; Otsuki, J.; Alam, M.S. Thermally reduced solution-processed graphene oxide thin film: An efficient infrared photodetector. Chem. Phys. Lett. 2014, 593, 198–203. [Google Scholar] [CrossRef]
  54. Kumar, P.V.; Bernardi, M.; Grossman, J.C. The impact of functionalization on the stability, work function, and photoluminescence of reduced graphene oxide. ACS Nano 2013, 7, 1638. [Google Scholar] [CrossRef]
  55. Loh, K.P.; Bao, Q.; Eda, G.; Chhowalla, M. Graphene oxide as a chemically tunable platform for optical applications. Nat. Chem. 2010, 2, 1015. [Google Scholar] [CrossRef]
  56. Dikin, D.A.; Stankovich, S.; Zimney, E.J.; Piner, R.D.; Dommett, G.H.B.; Evmenenko, G.; Nguyen, S.T.; Dikin, R.S.R.D.A.; Stankovich, S.; Zimney, E.J.; et al. Preparation and characterization of graphene oxide paper. Nature 2007, 448, 457. [Google Scholar] [CrossRef]
  57. Chowdhury, F.A.; Hossain, M.A.; Uchida, K.; Tamura, T.; Sugawa, K.; Mochida, T.; Otsuki, J.; Mohiuddin, T.; Boby, M.A.; Alam, M.S. Graphene oxide/carbon nanoparticle thin film based IR detector: Surface properties and device characterization. AIP Adv. 2015, 5, 107228. [Google Scholar] [CrossRef] [Green Version]
Figure 1. Raman spectrum of the reduced graphene oxide (rGO) sample obtained with a 532 nm excitation wavelength.
Chemengineering 03 00007 g001
Figure 2. UV–Vis spectrum of an aqueous dispersion of reduced graphene oxide.
Chemengineering 03 00007 g002
Figure 3. Dynamic light scattering characterization of reduced graphene oxide.
Chemengineering 03 00007 g003
Figure 4. Transmission Electron Microscopy (TEM), STEM and energy dispersive X-ray spectroscopy (EDS) Analysis of reduced graphene oxide: (a) TEM image; (b) STEM image; (c) EDS analysis of rGO sheet (insert is rGO sheet for the EDS analysis).
Chemengineering 03 00007 g004
Figure 5. Atomic force microscopy (AFM) analysis of reduced graphene oxide: (a) high-resolution AFM image for height measurement of single-layer rGO; (b) 2-D height profile recorded along the black dotted line shown in (a).
Chemengineering 03 00007 g005
Figure 6. Field emission scanning electron microscopy (FESEM) images of reduced graphene oxide at different magnification compared to an AFM image. (a,b) FESEM images of rGO bundle, (c) AFM topographical image and (d) FESEM image of rGO bundle.
Chemengineering 03 00007 g006
Figure 7. Current–Voltage characteristics of rGO/N719 versus N719 dye-sensitized solar cell measured under an illumination of air-mass 1.5 global (AM 1.5 G) having an irradiance of 100 mW/cm2.
Chemengineering 03 00007 g007
Figure 8. Nyquist plots of reduced graphene oxide and N719 versus only N719 measured under an illumination of air-mass 1.5 global (AM 1.5 G) having an irradiance of 100 mW/cm2.
Chemengineering 03 00007 g008
Figure 9. Bode plot of reduced graphene oxide and N719 versus only N719 measured under an illumination of air-mass 1.5 global (AM 1.5 G) having an irradiance of 100 mW/cm2.
Chemengineering 03 00007 g009
Table 1. Current–Voltage Characteristics of dye-sensitized solar cells measured under an illumination of air-mass 1.5 global (AM 1.5 G) having an irradiance of 100 mW/cm2.
SampleVmpImpVocIscFFEfficiency (%)
N719 only0.374.330.666.870.351.61
N719+rGO0.316.466.2410.800.302.02

