Alternative of Biogas Injection into the Danish Gas Grid System—A Study from Demand Perspective


Abstract
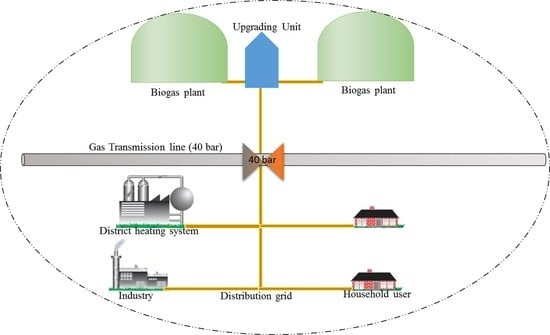
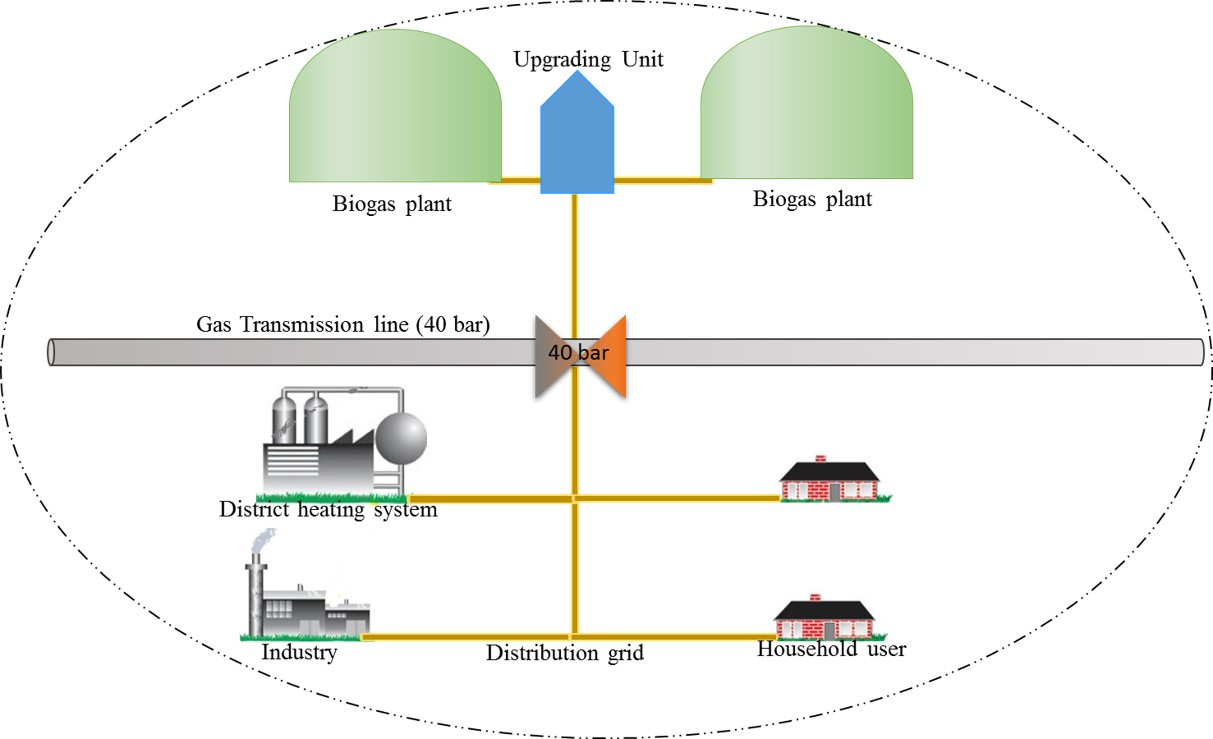
1. Introduction
2. Method
2.1. Gas Measurement
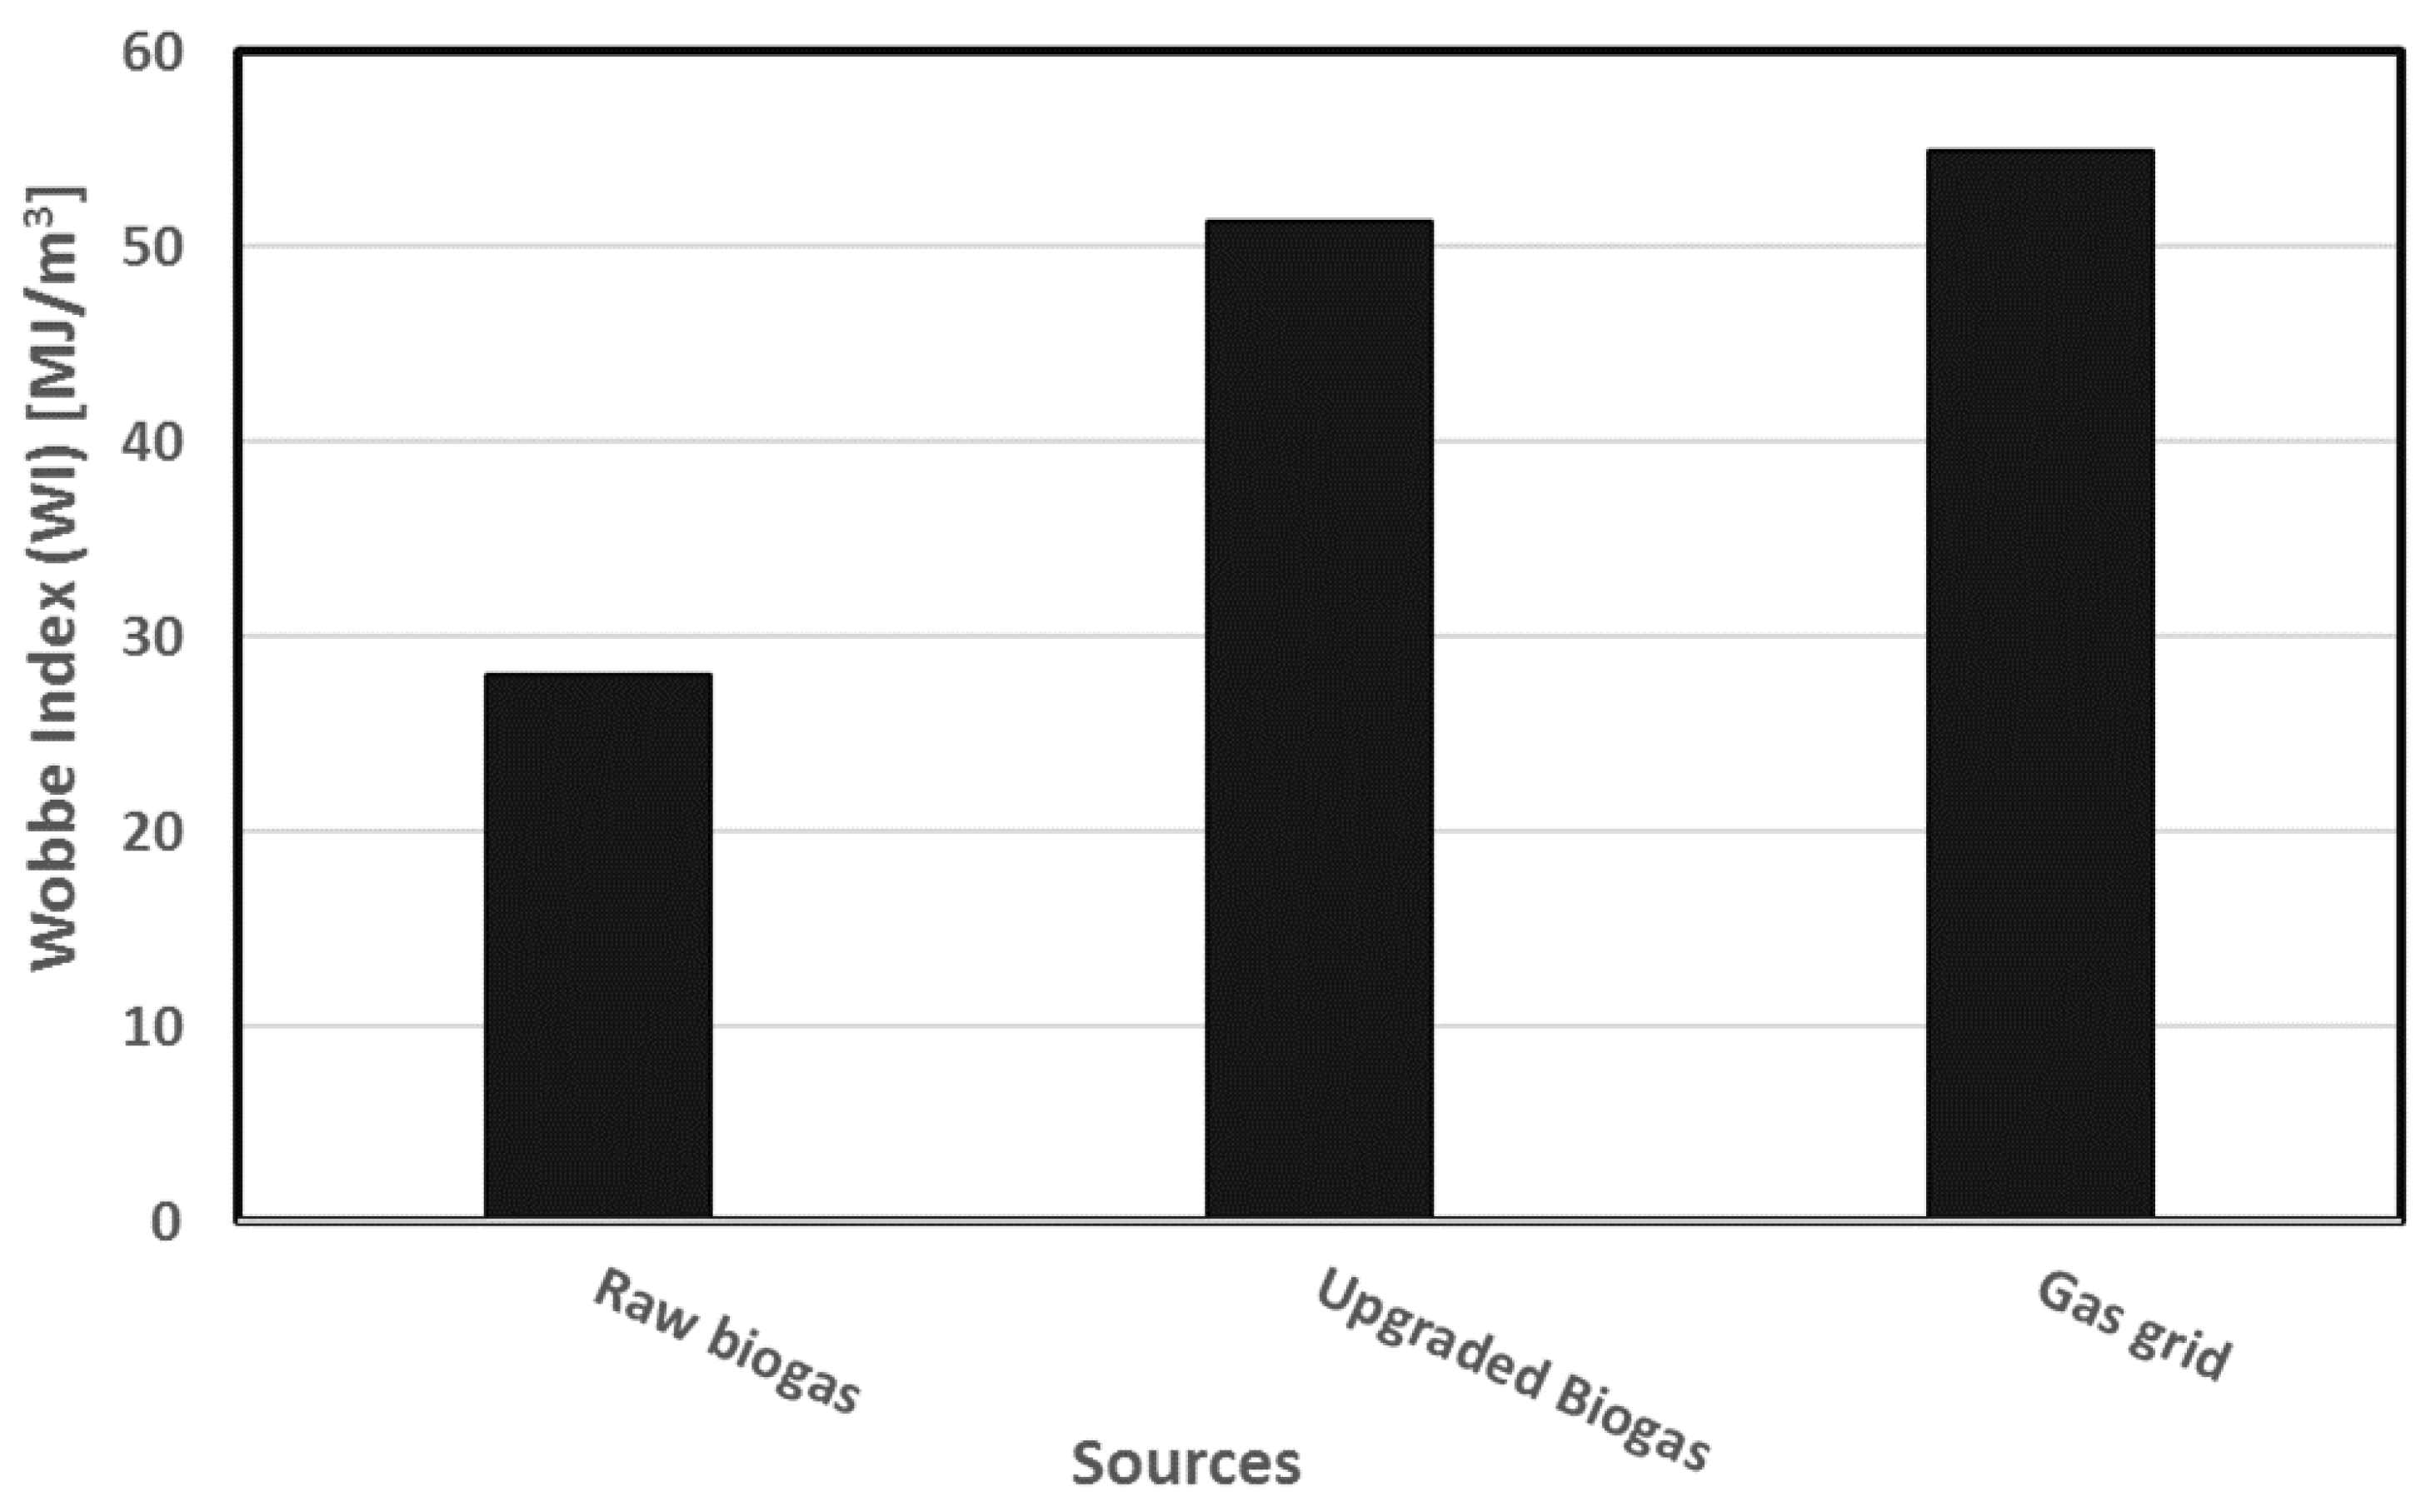
2.2. Wobbe Index (WI)
2.3. Gas Consumption Trend and Cost Analysis
3. Results and Discussion
3.1. Gas Quality
3.2. Wobbe Index (WI) of Different Gases
3.3. Gas Consumption Trend from Selected Users
3.3.1. District Heating System (DHS)
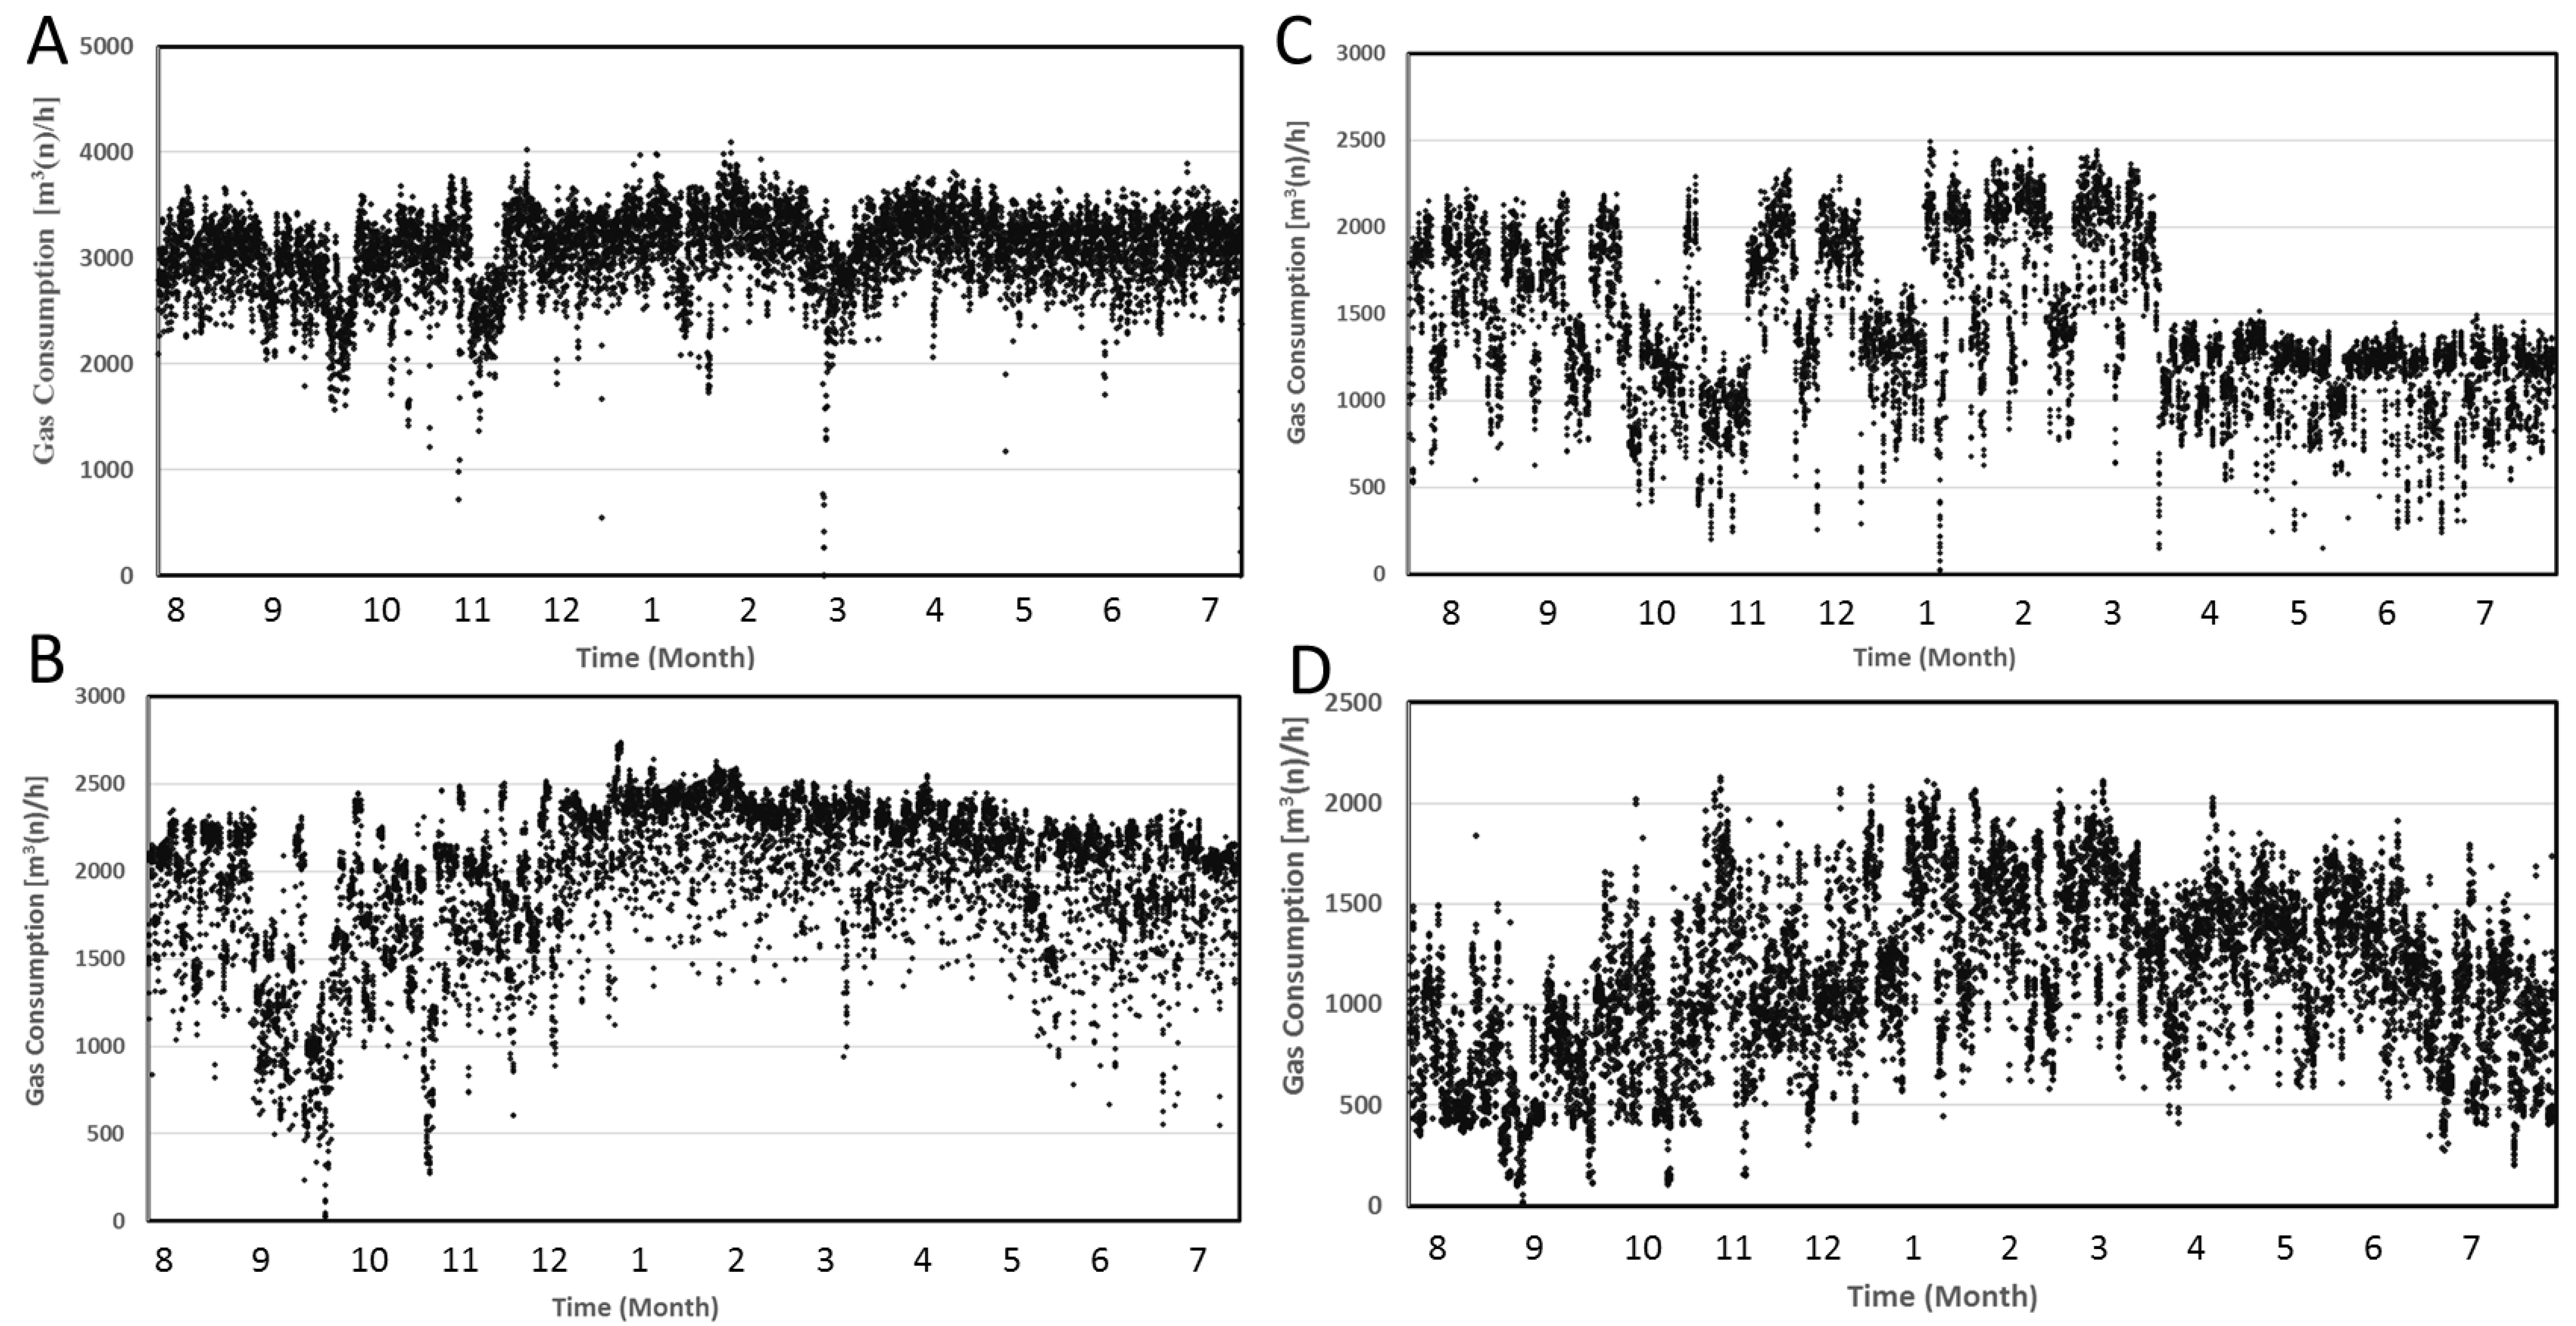
3.3.2. Industry
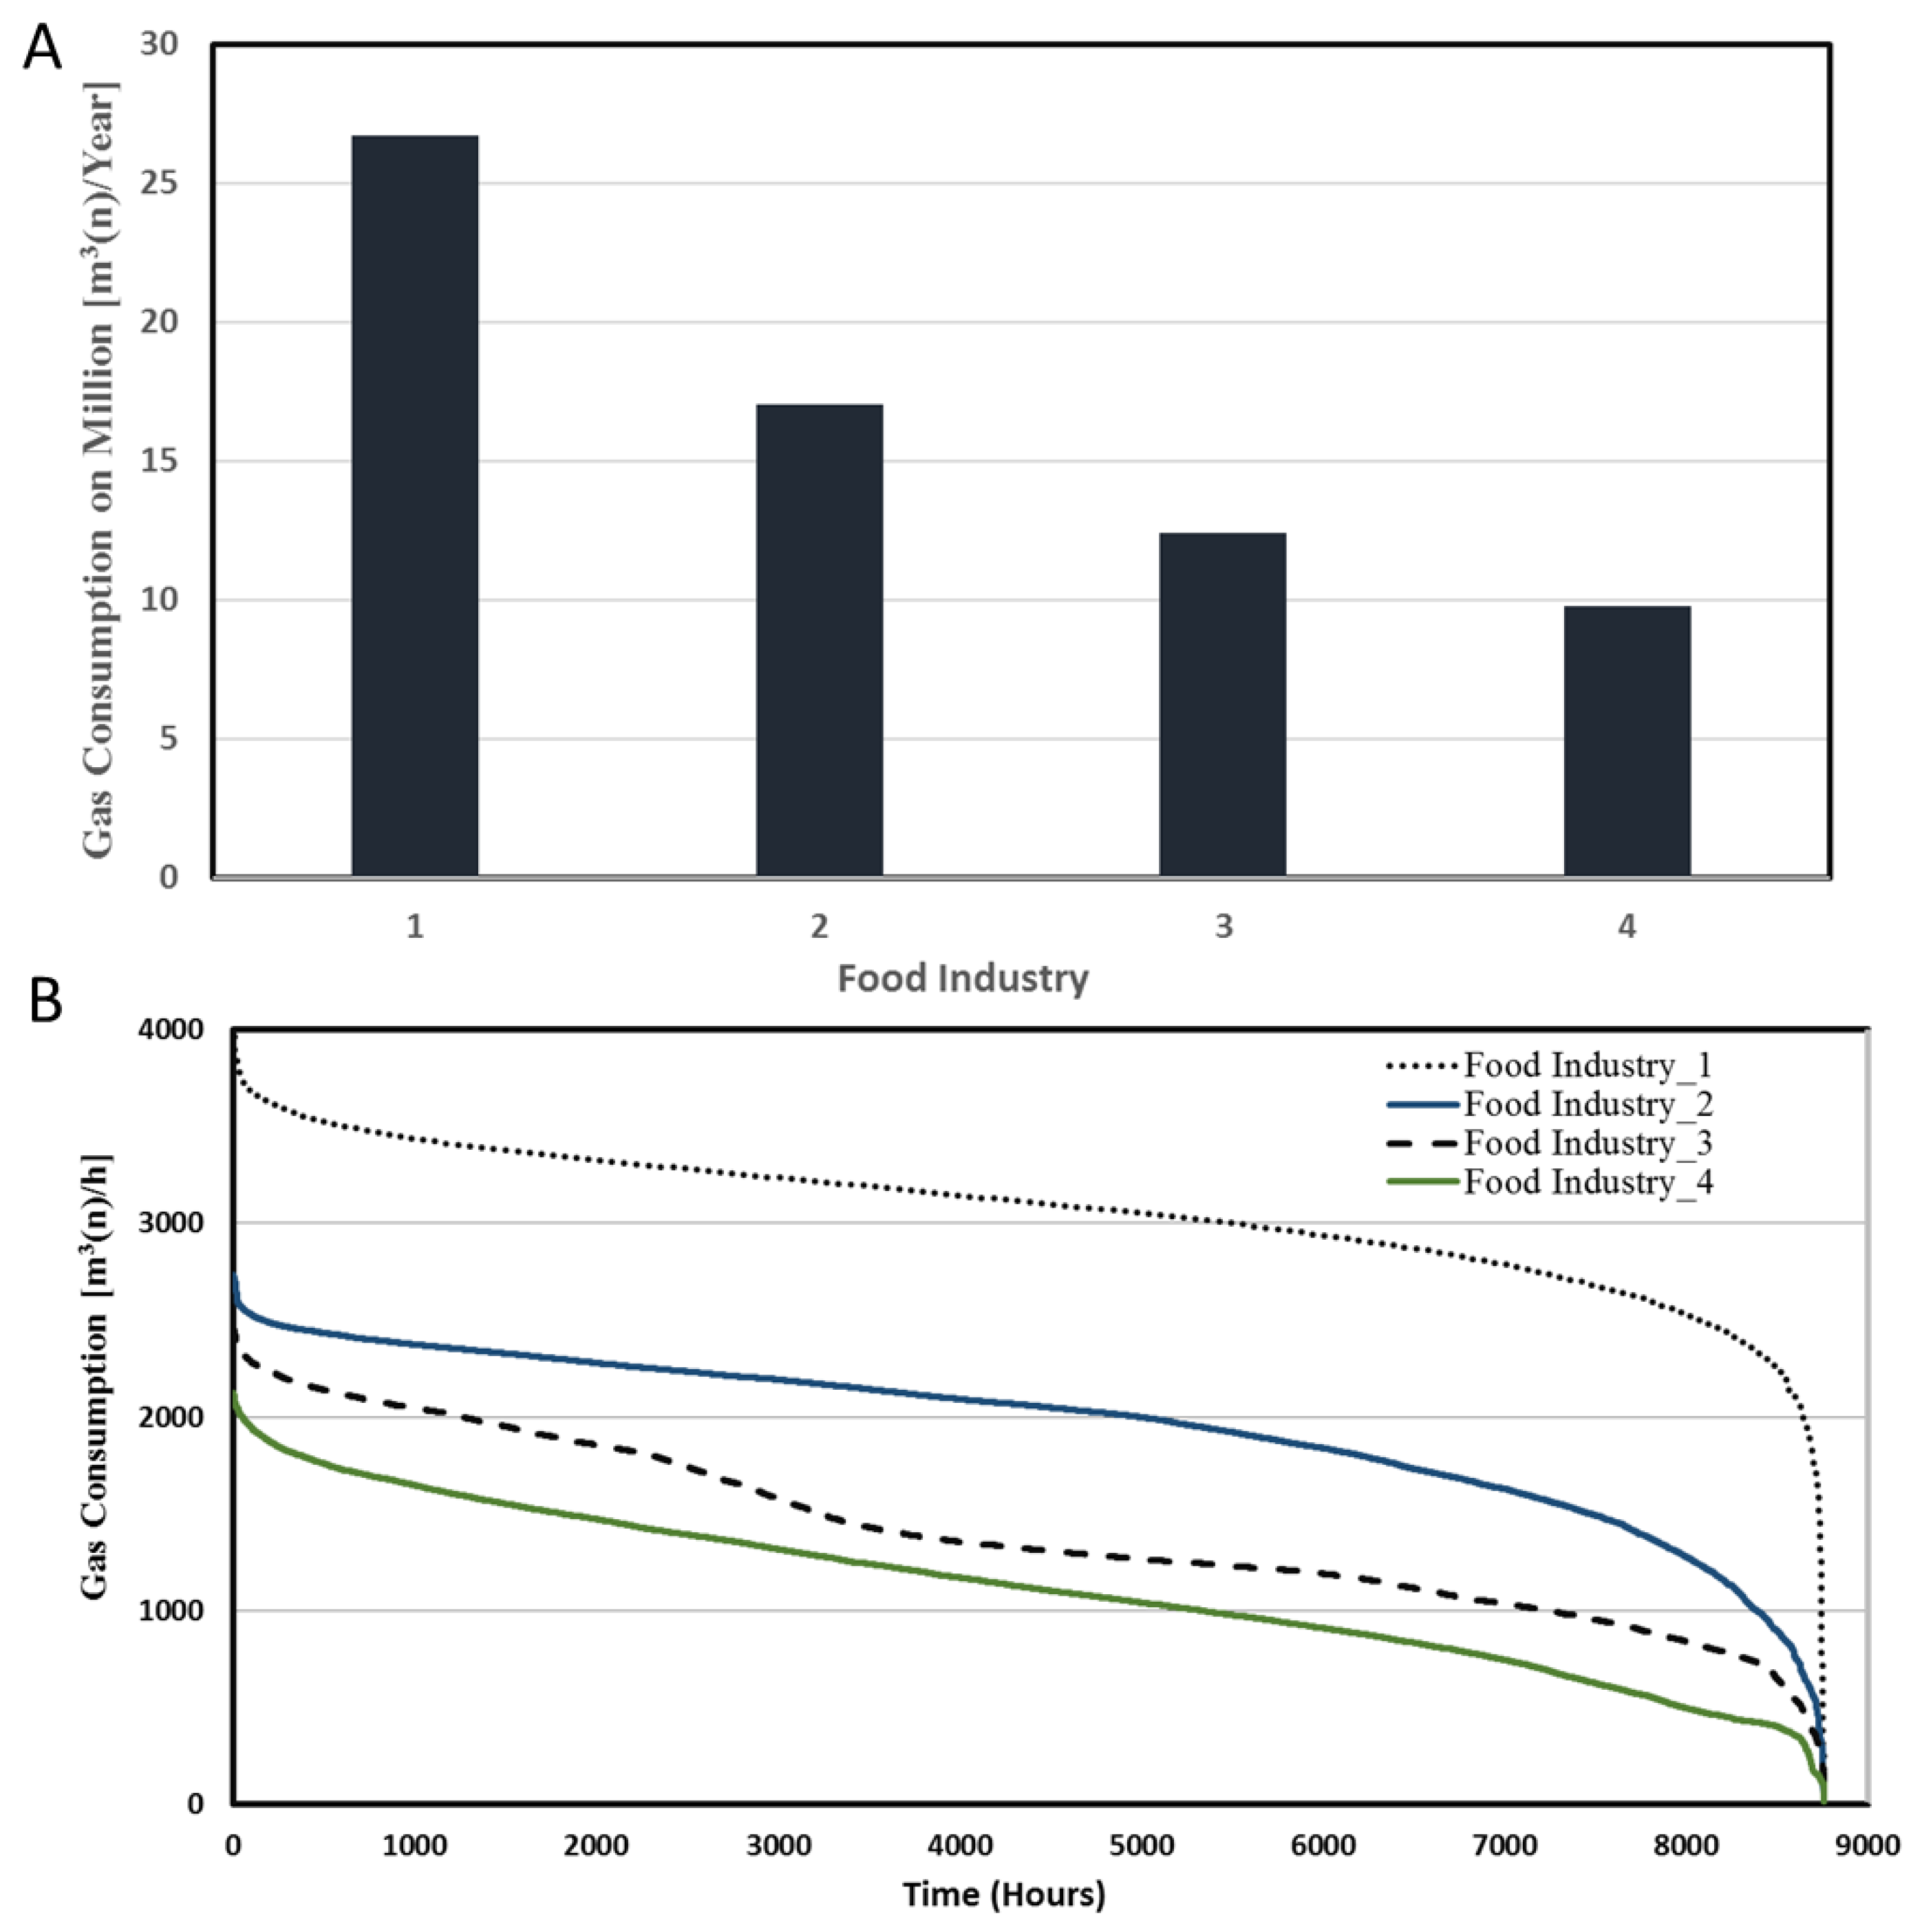
3.3.3. Food Industries
3.4. Compression and Upgrading Cost Analysis
4. Conclusions
Author Contributions
Funding
Acknowledgments
Conflicts of Interest
References
- Angelidaki, I.; Treu, L.; Tsapekos, P.; Luo, G.; Campanaro, S.; Wenzel, H.; Kougias, P.G. Biogas upgrading and utilization: Current status and perspectives. Biotechnol. Adv. 2018, 36, 452–466. [Google Scholar] [CrossRef] [PubMed]
- Aryal, N.; Kvist, T.; Ammam, F.; Pant, D.; Ottosen, L.D.M. An overview of microbial biogas enrichment. Bioresour. Technol. 2018, 264, 359–369. [Google Scholar] [CrossRef] [PubMed]
- Bauer, F.; Hulteberg, C.; Persson, T.; Tamm, D. Biogas Upgrading—Review of Commercial Technologies; Swedish Gas Technology Centre: Malmo, Denmark, 2013. [Google Scholar]
- Sharman, H. Why wind power works for Denmark. Civ. Eng. 2005, 158, 66–72. [Google Scholar] [CrossRef]
- Mathiesen, B.V.; Lund, H.; Connolly, D.; Wenzel, H.; Ostergaard, P.A.; Möller, B.; Nielsen, S.; Ridjan, I.; KarnOe, P.; Sperling, K.; et al. Smart energy systems for coherent 100% renewable energy and transport solutions. Appl. Energy 2015, 145, 139–154. [Google Scholar] [CrossRef]
- Energistyrelsen. Energistatistik 2016; Energistyrelsen: Copenhagen, Denmark, 2016. [Google Scholar]
- Lora Grando, R.; de Souza Antune, A.M.; da Fonseca, F.V.; Sánchez, A.; Barrena, R.; Font, X. Technology overview of biogas production in anaerobic digestion plants: A European evaluation of research and development. Renew. Sustain. Energy Rev. 2017, 80, 44–53. [Google Scholar] [CrossRef]
- Agneessens, L.M.; Ottosen, L.D.M.; Voigt, N.V.; Nielsen, J.L.; de Jonge, N.; Fischer, C.H.; Kofoed, M.V.W. In-situ biogas upgrading with pulse H2 additions: The relevance of methanogen adaption and inorganic carbon level. Bioresour. Technol. 2017, 233, 256–263. [Google Scholar] [CrossRef] [PubMed]
- Aryal, N.; Halder, A.; Zhang, M.; Whelan, P.R.; Tremblay, P.L.; Chi, Q.; Zhang, T. Freestanding and flexible graphene papers as bioelectrochemical cathode for selective and efficient CO2 conversion. Sci. Rep. 2017, 7, 1–8. [Google Scholar] [CrossRef] [PubMed]
- Aryal, N.; Ammam, F.; Patil, S.A.; Pant, D. An overview of cathode materials for microbial electrosynthesis of chemicals from carbon dioxide. Green Chem. 2017, 19, 5748–5760. [Google Scholar] [CrossRef]
- Bailera, M.; Lisbona, P.; Romeo, L.M.; Espatolero, S. Power to gas projects review: Lab, pilot and demo plants for storing renewable energy and CO2. Renew. Sustain. Energy Rev. 2017, 69, 292–312. [Google Scholar] [CrossRef]
- Altfeld, K.; Pinchbeck, D. Admissible Hydrogen Concentrations in Natural Gas Systems; DIV Deutscher Industrieverlag GmbH: München, Gemany, 2013. [Google Scholar]
- Danish Energy Regulatory Authority. National Report for 2016; Danish Energy Regulatory Authority: Copenhagen, Denmark, 2017. [Google Scholar]
- Hoo, P.Y.; Hashim, H.; Ho, W.S. Opportunities and challenges: Landfill gas to biomethane injection into natural gas distribution grid through pipeline. J. Clean. Prod. 2018, 175, 409–419. [Google Scholar] [CrossRef]
- Labidine Messaoudani, Z.; Rigas, F.; Binti Hamid, M.D.; Che Hassan, C.R. Hazards, safety and knowledge gaps on hydrogen transmission via natural gas grid: A critical review. Int. J. Hydrogen Energy 2016, 41, 17511–17525. [Google Scholar] [CrossRef]
- Schouten, J.A.; Janssen-van Rosmalen, R.; Michels, J.P.J. Modeling hydrogen production for injection into the natural gas grid: Balance between production, demand and storage. Int. J. Hydrogen Energy 2006, 31, 1698–1706. [Google Scholar] [CrossRef]
- Alkano, D.; Nefkens, W.J.; Scherpen, J.M.A.; Volkerts, M. Optimal Control in a Micro Gas Grid of Prosumers Using Model Predictive Control. In Proceedings of the 21st International Symposium on Mathematical Theory of Networks and Systems, Groningen, The Netherlands, 7–11 July 2014. [Google Scholar]
- Hernández-Gómez, R.; Fernández-Vicente, T.E.; Martín González, M.C.; Mondéjar, M.E.; Chamorro, C.R. Integration of biogas in the natural gas grid: Thermodynamic characterization of a biogas-like mixture. J. Chem. Thermodyn. 2015, 84, 60–66. [Google Scholar] [CrossRef]
- Chertkov, M.; Backhaus, S.; Lebedev, V. Cascading of fluctuations in interdependent energy infrastructures: Gas-grid coupling. Appl. Energy 2015, 160, 541–551. [Google Scholar] [CrossRef]
- Hengeveld, E.J.; Bekkering, J.; van Gemert, W.J.T.; Broekhuis, A.A. Biogas infrastructures from farm to regional scale, prospects of biogas transport grids. Biomass Bioenergy 2016, 86, 43–52. [Google Scholar] [CrossRef]
- Abeysekera, M.; Wu, J.; Jenkins, N.; Rees, M. Steady state analysis of gas networks with distributed injection of alternative gas. Appl. Energy 2016, 164, 991–1002. [Google Scholar] [CrossRef]
- Bekkering, J.; Hengeveld, E.J.; van Gemert, W.J.T.; Broekhuis, A.A. Will implementation of green gas into the gas supply be feasible in the future? Appl. Energy 2015, 140, 409–417. [Google Scholar] [CrossRef]
- Danish Energy Agency. Technology Data for Energy Transport; Danish Energy Agency: København, Denmark, 2017. [Google Scholar]
- Hengeveld, E.J.; van Gemert, W.J.T.; Bekkering, J.; Broekhuis, A.A. When does decentralized production of biogas and centralized upgrading and injection into the natural gas grid make sense? Biomass Bioenergy 2014, 67, 363–371. [Google Scholar] [CrossRef]
- Chromatograph, G. Test of the Yamatake HGC303 Gas Chromatograph; Danish Gas Technology Center: Hørsholm, Denmark, 2003. [Google Scholar]
- IREA. Biogas for Road Vehicles: Technology Brief; International Renewable Energy Agency: Abu Dhabi, UAE, 2017. [Google Scholar]
- Energinet. Available online: http://www.naturgasfakta.dk/copy4_of_miljoekrav-til-energianlaeg (accessed on 4 July 2018).
- Sandfort, V.; Trabold, B.M.; Abdolvand, A.; Bolwien, C.; Russell, P.S.J.; Wöllenstein, J.; Palzer, S. Monitoring the wobbe index of natural gas using fiber-enhanced Raman spectroscopy. Sensors 2017, 17, 2714. [Google Scholar] [CrossRef] [PubMed]
- Pannucharoenwong, N.; Worasaen, A.; Benjapiyaporn, C.; Jongpluempiti, J.; Vengsungnle, P. Comparison of bio-methane gas Wobbe index in different animal manure substrate. Energy Procedia 2017, 138, 273–277. [Google Scholar] [CrossRef]
- Abeysekera, M.; Rees, M.; Wu, J. Simulation and analysis of low pressure gas networks with decentralized fuel injection. Energy Procedia 2014, 61, 402–406. [Google Scholar] [CrossRef]
- Rehl, T.; Müller, J. CO2 abatement costs of greenhouse gas (GHG) mitigation by different biogas conversion pathways. J. Environ. Manag. 2013, 114, 13–25. [Google Scholar] [CrossRef] [PubMed]
- Abatzoglou, N.; Boivin, S. A review of biogas purification processes. Biofuels Bioprod. Biorefin. 2009, 3, 42–71. [Google Scholar] [CrossRef]
- Börjesson, M.; Ahlgren, E.O. Cost-effective biogas utilisation—A modelling assessment of gas infrastructural options in a regional energy system. Energy 2012, 48, 212–226. [Google Scholar] [CrossRef]
- De Hullu, J.; Maassen, J.I.W.; van Meel, P.A.; Shazad, S.; Vaessen, J.M.P.; Bini, L.; Reijenga, J.C. Comparing Different Biogas Upgrading Techniques; Eindhoven University of Technology: Eindhoven, The Netherlands, 2008. [Google Scholar]
- Leitfaden Biogasaufbereitung Und-Einspeisung. Available online: https://mediathek.fnr.de/media/downloadable/files/samples/l/e/leitfaden_biogaseinspeisung-druck-web.pdf (accessed on 4 July 2018).
- Verbeeck, K.; Buelens, L.C.; Galvita, V.V.; Marin, G.B.; Van Geem, K.M.; Rabaey, K. Upgrading the value of anaerobic digestion via chemical production from grid injected biomethane. Energy Environ. Sci. 2018, 11, 1788–1802. [Google Scholar] [CrossRef]


| Sn. | Gas | Concentration of CH4 (%) | Other Composition Constituents (%) |
|---|---|---|---|
| 1 | Raw biogas | 66.1 ± 0.29 | CO2 (33.3 ± 0.15), N2 (0.5 ± 0.14), O2 (0.1), and H2S # (103.5 ± 9.2) |
| 2 | Upgraded biogas (SNG) | 97.55 ± 0.07 | CO2 (1.35 ± 0.07), N2 (0.6 ± 0.14), O2 (0.6 ± 0.14) |
| 3 | Natural gas from grid † | 97.28 | CO2 (1.73), N2 (0.65), O2 (0.1), H2S # (6.6) and other hydrocarbons such as C2H6 (8.03) C3H8 (3.87), C4H10 (0.46) C4H10 (0.84) C5H12 (0.18) |
| Food Industry | Yearly Gas Consumption in Million (m3/Year) | Compression Cost in Million (€) # | Upgrading Cost in Million (€) & | Total Cost (€) in Million |
|---|---|---|---|---|
| 1 | 26.7 | 1.4 | 2.08 | 3.48 |
| 2 | 17.1 | 0.8 | 1.33 | 2.13 |
| 3 | 12.4 | 0.6 | 0.96 | 1.56 |
| 4 | 9.8 | 0.5 | 0.76 | 1.26 |
© 2018 by the authors. Licensee MDPI, Basel, Switzerland. This article is an open access article distributed under the terms and conditions of the Creative Commons Attribution (CC BY) license (http://creativecommons.org/licenses/by/4.0/).
Share and Cite
Aryal, N.; Kvist, T. Alternative of Biogas Injection into the Danish Gas Grid System—A Study from Demand Perspective. ChemEngineering 2018, 2, 43. https://doi.org/10.3390/chemengineering2030043
Aryal N, Kvist T. Alternative of Biogas Injection into the Danish Gas Grid System—A Study from Demand Perspective. ChemEngineering. 2018; 2(3):43. https://doi.org/10.3390/chemengineering2030043
Chicago/Turabian StyleAryal, Nabin, and Torben Kvist. 2018. "Alternative of Biogas Injection into the Danish Gas Grid System—A Study from Demand Perspective" ChemEngineering 2, no. 3: 43. https://doi.org/10.3390/chemengineering2030043
APA StyleAryal, N., & Kvist, T. (2018). Alternative of Biogas Injection into the Danish Gas Grid System—A Study from Demand Perspective. ChemEngineering, 2(3), 43. https://doi.org/10.3390/chemengineering2030043