Article

Mechanistic Study of CO2 Absorption in Alkanolamine Solutions Based on Density Functional Theory


1
School of Environmental and Municipal Engineering, Qingdao University of Technology, Qingdao 266520, China
2
Qingdao Institute of Bioenergy and Bioprocess Technology, Chinese Academy of Sciences, Qingdao 266520, China
*
Authors to whom correspondence should be addressed.
ChemEngineering 2026, 10(6), 69; https://doi.org/10.3390/chemengineering10060069

Submission received: 31 March 2026 / Revised: 13 May 2026 / Accepted: 25 May 2026 / Published: 27 May 2026

Abstract

Among the various CO2 capture technologies, chemical absorption is currently one of the most widely applied methods in industrial practice. In this study, density functional theory was employed to investigate the reaction mechanisms of CO2 absorption by typical alkanolamine solvents. Reaction pathways between CO2 and four representative alkanolamines—monoethanolamine (MEA), diethanolamine (DEA), triethanolamine (TEA), and methyldiethanolamine (MDEA)—were constructed and analyzed. By evaluating the activation energy barriers of different amines, the thermodynamic characteristics and reaction feasibility of the CO2 absorption process were systematically elucidated. The results show that the primary amine MEA exhibits the lowest activation energy barrier (32.02 kJ/mol), indicating the most favorable reaction kinetics, while the secondary amine DEA shows a slightly higher barrier of 47.35 kJ/mol. As tertiary amines, TEA and MDEA exhibit significantly higher activation energy barriers, indicating slower reaction kinetics; however, they generally possess higher CO2 loading capacities and less stable reaction products, which facilitate solvent regeneration. The activation energy barriers of MDEA and TEA were calculated to be 54.53 kJ/mol and 94.17 kJ/mol, respectively, indicating that MDEA reacts more readily with CO2 than TEA.

1. Introduction

Research on CO2 absorption by alkanolamine solutions primarily originates from the growing concerns over climate change mitigation and greenhouse gas emissions [1]. CO2 is one of the major greenhouse gases, and its emissions are widely recognized as a key driver of global climate change. The combustion of fossil fuels releases large amounts of CO2. Among these, coal is extensively used worldwide for power generation and is characterized by a higher carbon content and lower hydrogen content, leading to greater CO2 emissions upon combustion. Therefore, coal-fired processes are considered one of the dominant sources of CO2 emissions in fossil fuel utilization [2]. Capturing and treating flue gas from thermal power plants is thus regarded as a critical pathway for reducing carbon emissions. Consequently, significant efforts have been devoted to developing efficient CO2 capture technologies to lower atmospheric CO2 concentrations [3].
Among various carbon capture technologies, chemical absorption using liquid solvents has emerged as one of the most promising approaches for industrial applications due to its high separation efficiency, operational stability, and technological maturity [4].
The strong research interest in alkanolamine-based solvents stems from their high affinity for CO2. When CO2 passes through aqueous alkanolamine solutions, it reacts chemically with amines to form carbonate or bicarbonate species, thereby transferring CO2 from the gas phase into the liquid phase [5]. Owing to its high absorption efficiency and excellent industrial applicability, this technology has been widely implemented in post-combustion CO2 capture processes in power plants and chemical industries [6].
In recent years, increasing attention has been paid to integrating alkanolamine absorption technology with carbon capture, utilization, and storage (CCUS) systems to further reduce greenhouse gas emissions and mitigate climate change impacts. Due to their compatibility with existing industrial infrastructure and high level of technological maturity, alkanolamine solvents are considered one of the most promising near-term solutions for large-scale CO2 capture [7]. Therefore, studies on CO2 absorption by alkanolamine solutions are of great environmental significance and practical engineering value.
Bishnoi et al. [8] systematically investigated and modeled the absorption kinetics, solubility, and mass transfer behavior of piperazine (PZ)-activated MDEA systems, providing an experimental foundation for the industrial application of activated MDEA solvents. Danckwerts [9] presented an early comprehensive review of the reaction mechanisms and kinetics of CO2 with MEA and other alkanolamines, establishing a relatively complete intermediate-reaction framework for engineering applications. Samanta et al. [10] studied the absorption rates and reaction mechanisms of PZ/MDEA systems under conditions close to industrial operation using wetted-wall column and stirred-cell (disk) apparatus, and compared the effects of different activator concentrations on reaction rates. Sema et al. [11] conducted systematic experimental studies on the coupling between mass transfer and chemical kinetics in MDEA–MEA blended solvent systems, and proposed rate models suitable for process simulation, demonstrating the advantages of mixed alkanolamine systems over single-component solvents.
Hwang [12] revisited and refined the key reaction pathways of the MEA/CO2 system using density functional theory (DFT) and ab initio molecular dynamics (AIMD), explicitly accounting for the aqueous environment. This work clarified the transition states and the influence of solvent effects on the free-energy surface, marking a shift in the field from empirical descriptions toward molecular-level mechanistic understanding. Putta [13] proposed an activity-based kinetic model capable of more accurately predicting absorption rates near equilibrium conditions, thereby overcoming the limitations of conventional models at high loadings and high amine concentrations. Orestes et al. [14] systematically investigated the interactions between CO2 and amine molecules using DFT, focusing on the stability of zwitterionic intermediates and the influence of different exchange–correlation functionals on reaction energy calculations, thus providing a theoretical evaluation of reaction pathways and the applicability of computational methods.
The use of density functional theory (DFT) simulations to evaluate the feasibility and reaction difficulty of CO2 absorption by different alkanolamines has become an important research focus in recent years. In wet absorption processes, aqueous solutions of monoethanolamine (MEA), diethanolamine (DEA), triethanolamine (TEA), and methyldiethanolamine (MDEA) are the most widely used solvent systems. These compounds possess advantages such as simple molecular structures, low cost, wide availability, and high reactivity toward CO2, and are therefore extensively applied in both single-component and blended alkanolamine systems [15].
At present, research on CO2 capture using alkanolamine solutions mainly focuses on multicomponent blended systems, with experimental studies dominating the field. These studies primarily investigate the effects of different components on CO2 absorption capacity and absorption rate [16]. However, systematic investigations of the reaction mechanisms between single-component alkanolamines and CO2 at the molecular level remain relatively limited, particularly with respect to reaction pathways and energy barrier distributions. A detailed understanding of the reaction mechanisms in single-amine systems can provide essential theoretical insights into the synergistic effects observed in blended amine systems, thereby elucidating the roles of different amines and activators in CO2 absorption processes [17].
To address these issues, this study employs the DMol3 module within the Materials Studio package and applies density functional theory (DFT) to systematically investigate the microscopic reaction mechanisms of MEA, DEA, TEA, and MDEA with CO2. By constructing the geometries of reactants, transition states, and intermediates, and combining transition state searches with intrinsic reaction coordinate (IRC) analysis, the typical reaction pathways were identified. The energy changes and activation barriers of key elementary steps were also calculated [18]. In addition, solvent effects were incorporated using an implicit solvation model to simulate aqueous environments, thereby providing a more realistic representation of the actual absorption systems [19].
On this basis, the effects of different alkanolamine molecular structures on CO2 absorption reactivity and reaction pathway characteristics were systematically compared. The fundamental differences among primary, secondary, and tertiary amines in terms of reaction mechanisms and energy barrier distributions were elucidated. Furthermore, key steps such as proton transfer and the formation of bicarbonate and carbamate species were analyzed in detail, identifying the dominant factors governing reaction rates and absorption performance. The results of this study provide important theoretical guidance for the molecular design of novel alkanolamine absorbents, optimization of reaction mechanisms, and the development of low-energy CO2 capture technologies.

2. Materials and Methods

2.1. Computational Methods

All density functional theory (DFT) calculations were performed using the DMol3 module implemented in the Materials Studio 2019 software package (Dassault Systèmes BIOVIA, San Diego, CA, USA) [20]. The exchange–correlation interactions were described using the generalized gradient approximation (GGA) with the Perdew–Burke–Ernzerhof (PBE) functional [21]. Valence electrons were described using a double numerical plus polarization (DNP) basis set. Geometry optimizations were performed without symmetry constraints.
The convergence criteria for the self-consistent field (SCF), total energy, maximum displacement, and maximum force were set to 2.0 × 10⁻⁶ eV/atom, 2.0 × 10⁻⁵ eV/atom, 2.0 × 10⁻³ Å, and 0.05 eV/Å, respectively. All structures were fully optimized until the convergence criteria were satisfied.
The interaction energy between CO2 and the alkanolamine system was calculated according to the following equation:
E i n t = E c o m p l e x E a m i n e E C O 2
where E c o m p l e x refers to the total energy of the optimized CO2–amine system in the presence of solvation effects, while E a m i n e and E C O 2 correspond to the energies of the isolated species calculated under identical computational conditions.
Solvent effects were taken into account using the conductor-like screening model (COSMO) with water as the solvent.

2.2. Models

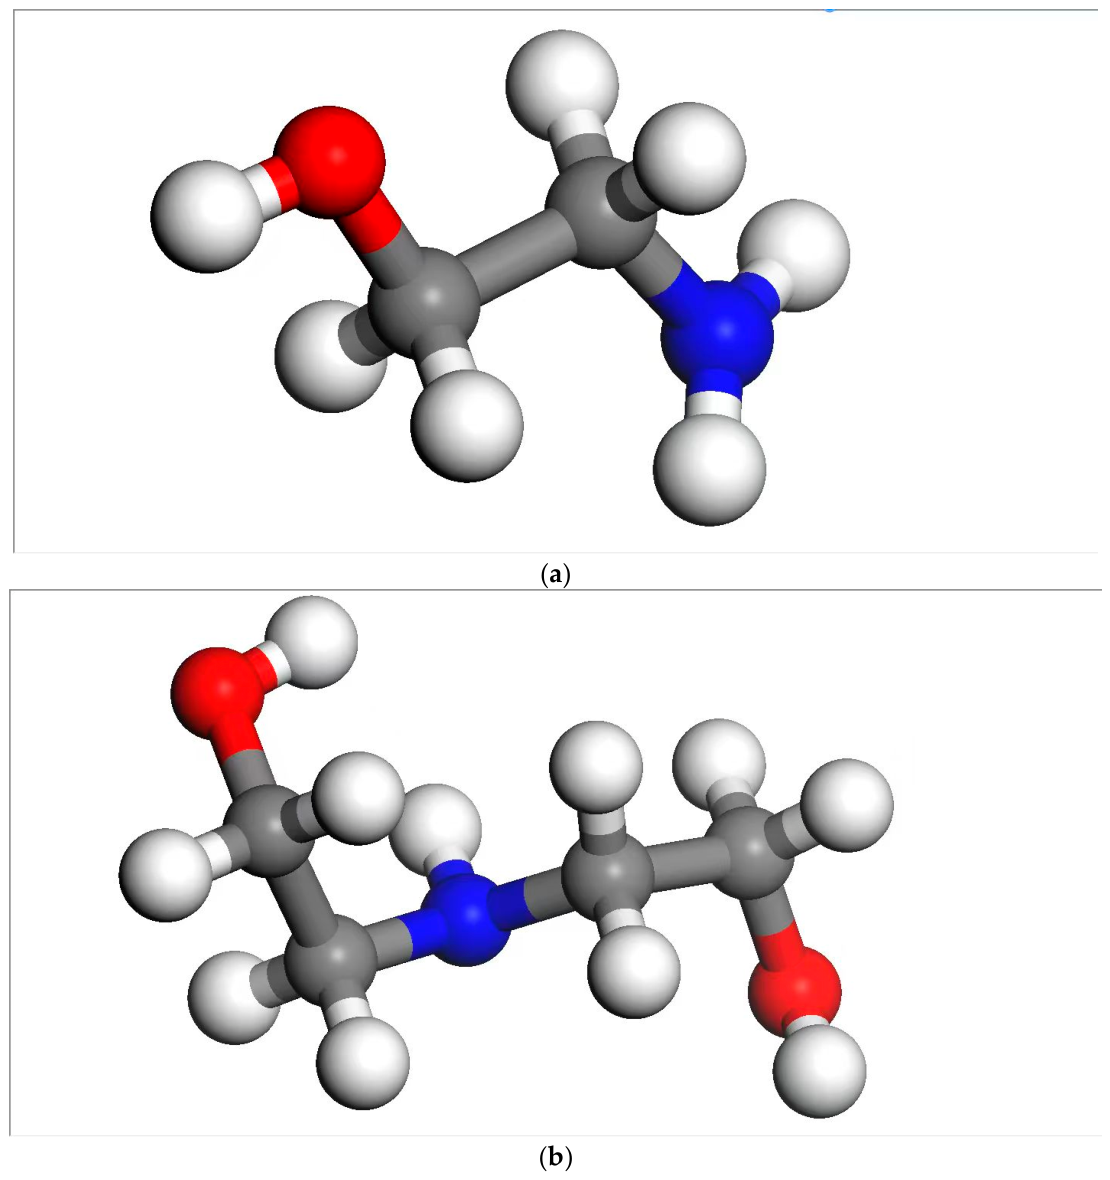
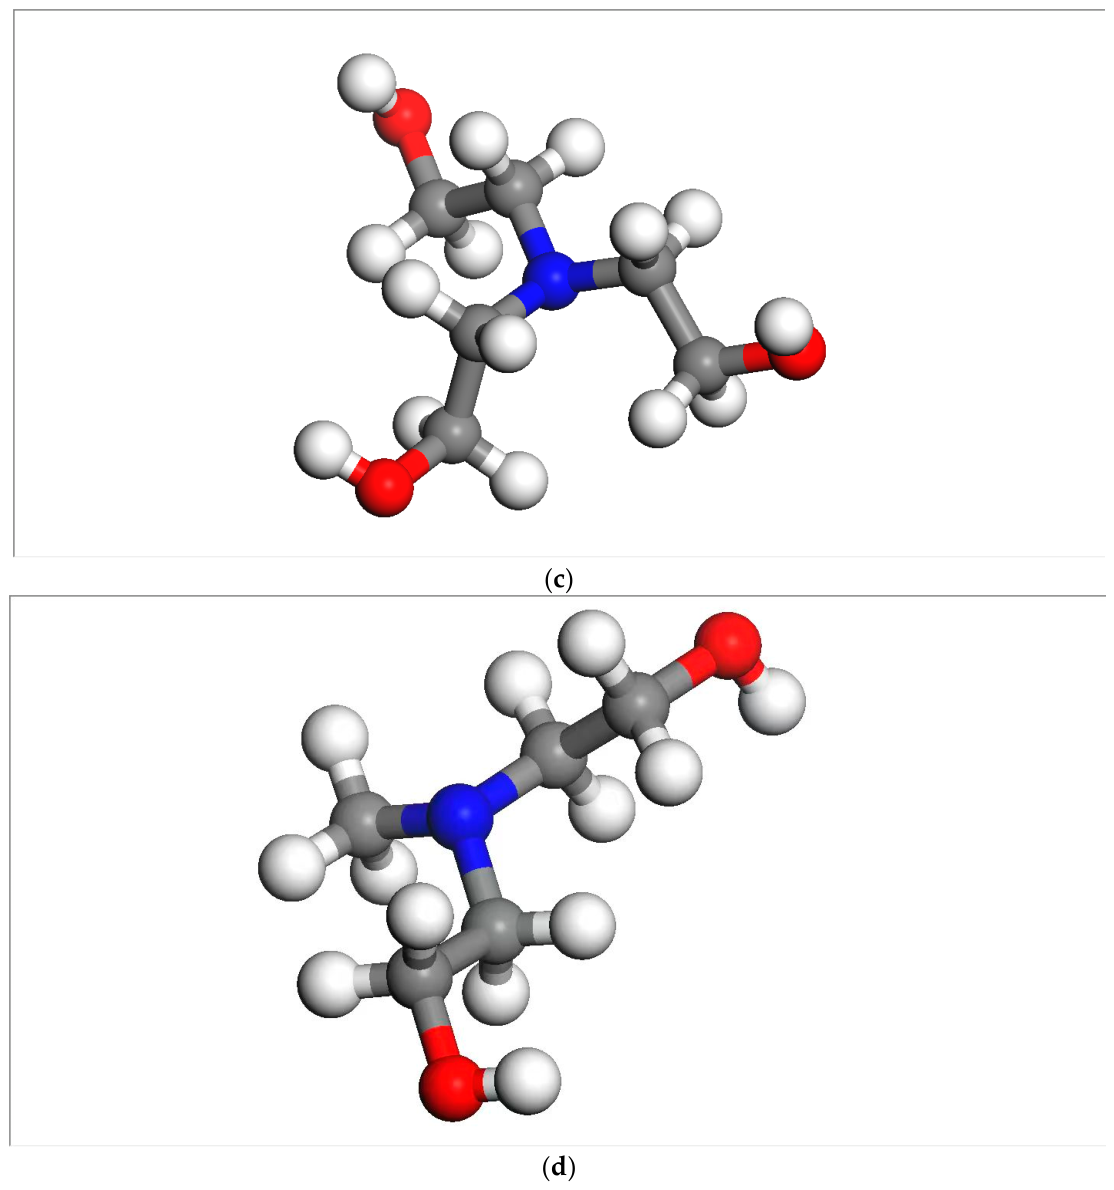
MEA has the chemical formula HO–C2H4–NH2. Owing to its fast absorption kinetics and low cost, MEA is widely used for the removal of acidic gases such as CO2. However, it also exhibits several drawbacks, including relatively low absorption capacity, certain corrosiveness, high energy consumption during regeneration, and susceptibility to oxidation by SO2 and O2 present in flue gas [22]. Despite these limitations, MEA remains an important solvent in industrial applications, particularly in petroleum and natural gas processing, coal chemical industries, and ammonia synthesis. The molecular model of MEA is shown in Figure 1a.
DEA has the chemical formula [(HO–C2H4)2NH]. As a secondary alkanolamine, DEA exhibits basic chemical properties and is capable of absorbing acidic gases such as CO2 and H2S. In aqueous solution, amines behave as weak bases and can react with CO2 through nucleophilic addition and proton transfer to form carbamate species. In the presence of water, bicarbonate species may also be formed [23]. The molecular model of DEA is shown in Figure 1b.
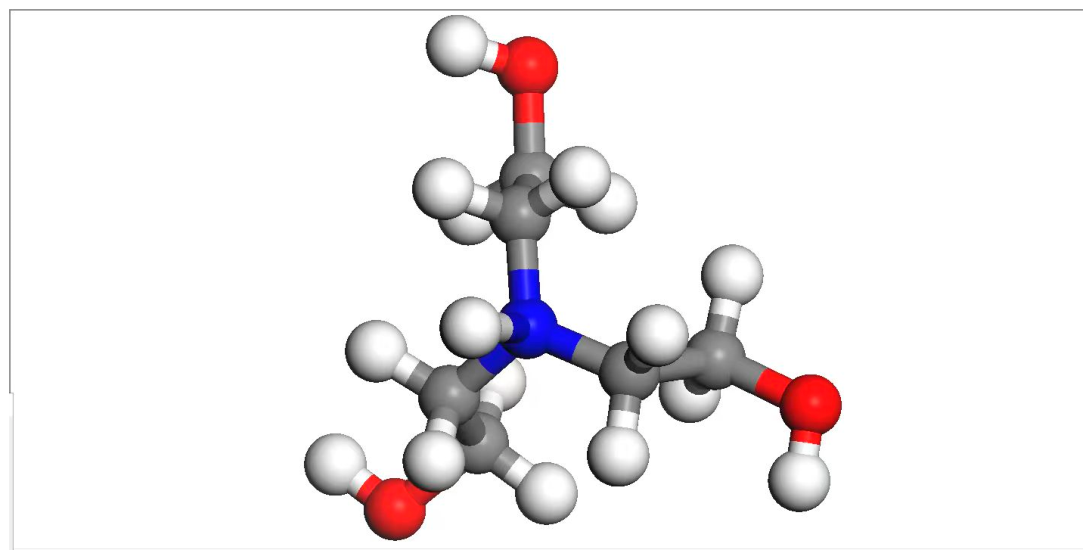
TEA has the molecular formula N(CH2CH2OH)3. In aqueous solution, TEA behaves as a weak base and primarily absorbs CO2 by promoting its hydration reaction to form bicarbonate species. Unlike primary and secondary amines, tertiary amines lack N–H bonds and therefore do not form carbamate intermediates; instead, they act as base catalysts to facilitate the hydration of CO2 in water. The molecular model of TEA is shown in Figure 1c.
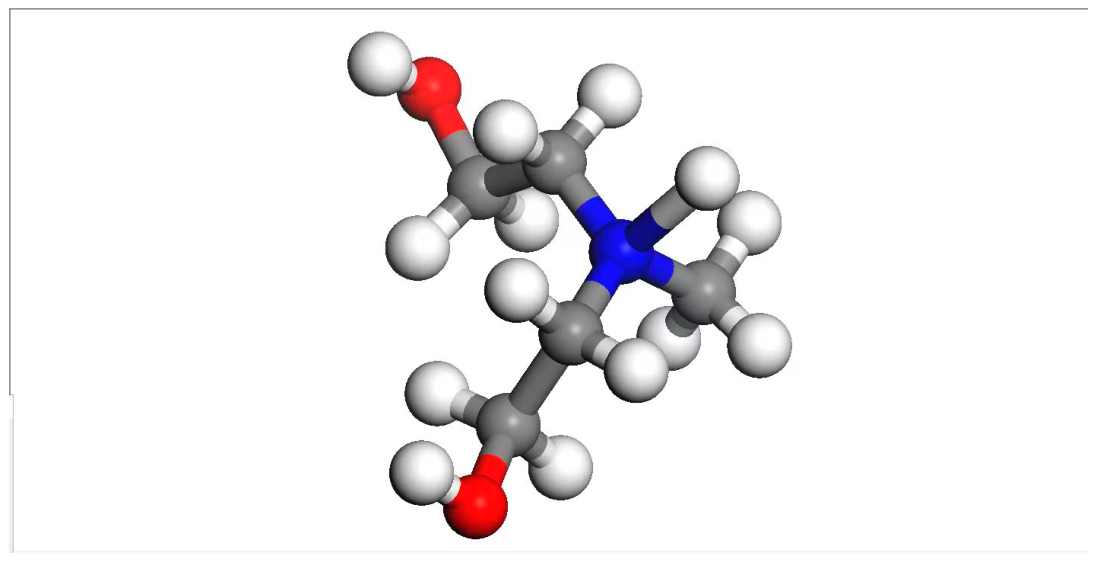
MDEA has the molecular formula CH3N(CH2CH2OH)2. Similar to TEA, MDEA behaves as a weak base in aqueous solution and primarily absorbs CO2 by promoting its hydration to form bicarbonate species. The molecular model of MDEA is shown in Figure 1d.

2.3. Reaction Mechanism

The reaction mechanism between MEA and CO2 can be expressed as:
CO2 + 2HO–C2H4–NH2 → HO–C2H4–NH3+ + HO–C2H4–NHCOO
This overall reaction can be divided into two elementary steps:
CO2 + HO–C2H4–NH2 → HO–C2H4–NHCOO + H+
H+ + HO–C2H4–NH2 → HO–C2H4–NH3+
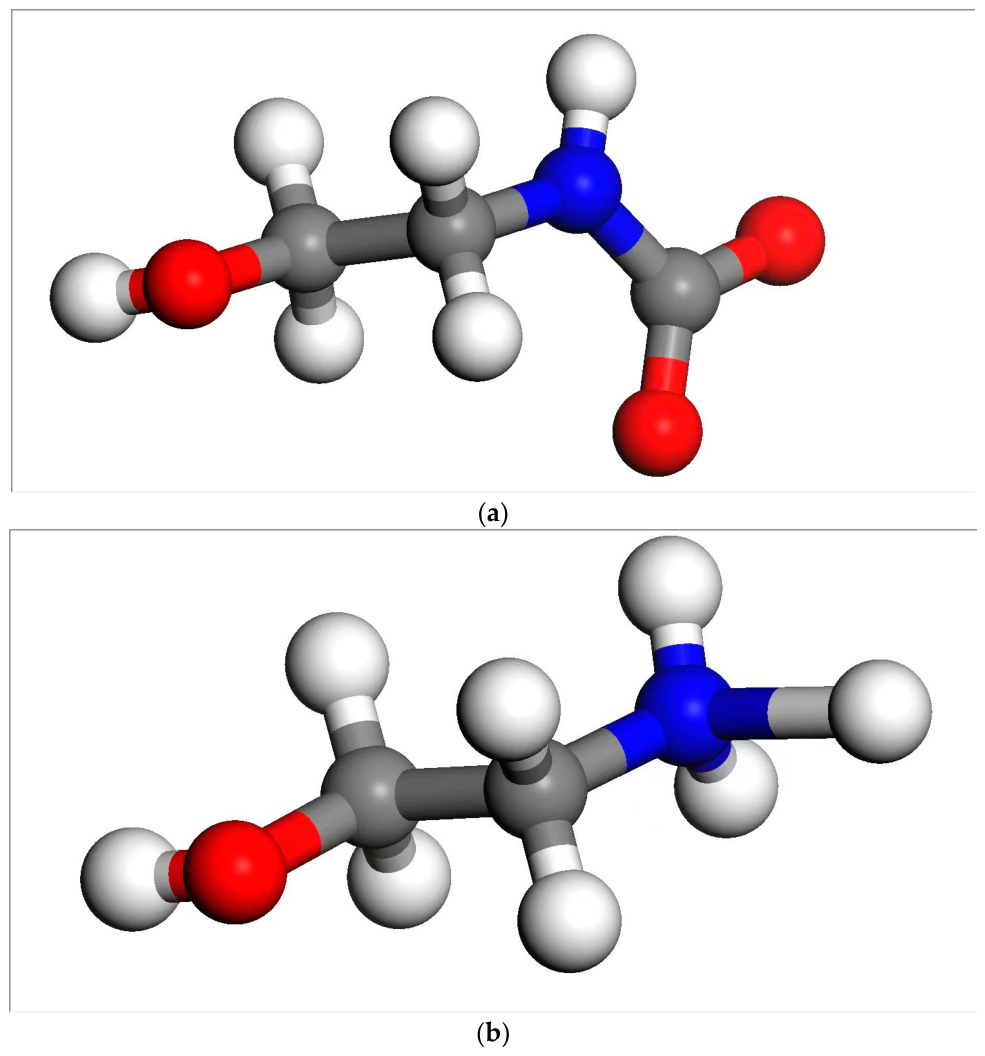
The reaction proceeds via a two-step mechanism. In the first step, MEA approaches the CO2 molecule and undergoes a nucleophilic addition reaction. The nitrogen atom attacks the electrophilic carbon atom of CO2, accompanied by proton transfer from the amine group, leading to the formation of a carbamate species (HO–C2H4–NHCOO) and a proton (H+), as shown in Figure 2a.
In the second step, the released proton is rapidly captured by another MEA molecule, forming a protonated amine species (HO–C2H4–NH3+), as illustrated in Figure 2b.
The reaction mechanism between DEA and CO2 can be expressed as:
CO2 + 2(HO–CH2CH2)2–NH → (HO–CH2CH2)2–NH2+ + (HO–CH2CH2)2–NCOO
This overall reaction can be divided into two elementary steps:
CO2 + (HO–CH2CH2)2–NH → (HO–CH2CH2)2–NCOO + H+
H+ + (HO–CH2CH2)2–NH → (HO–CH2CH2)2–NH2+
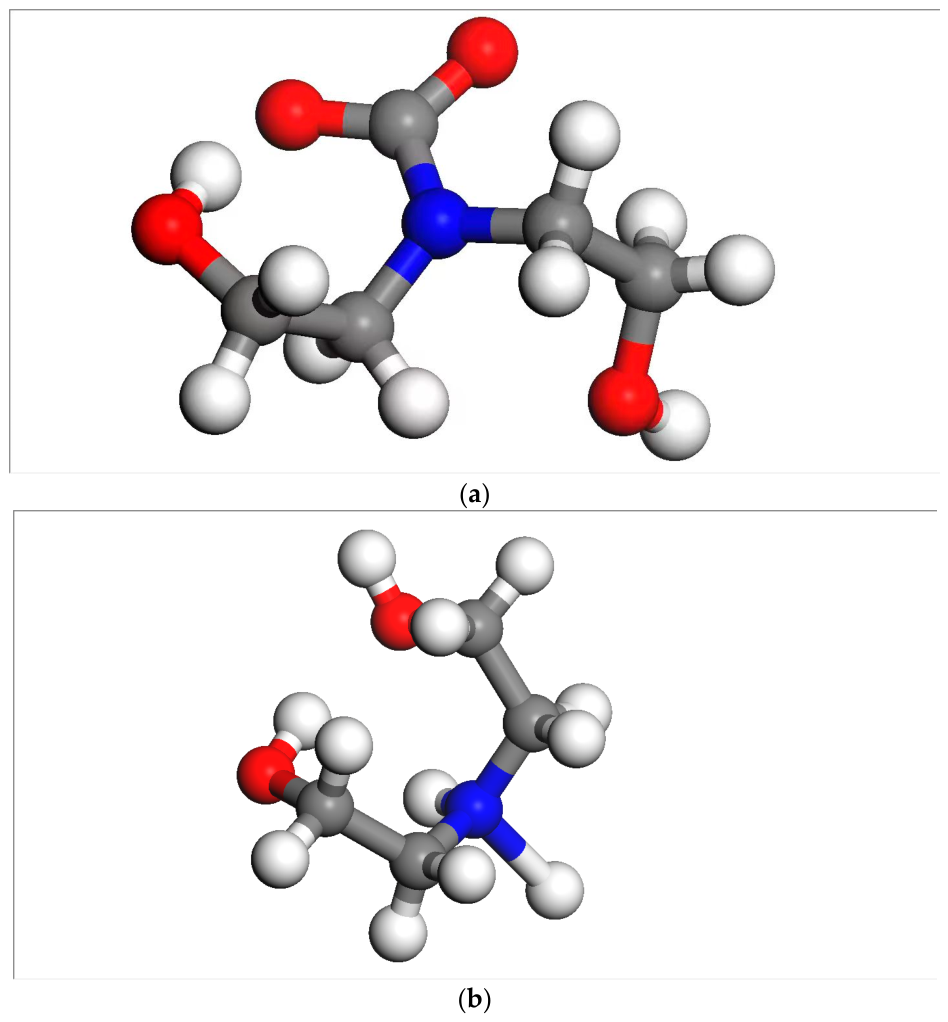
The reaction proceeds via a two-step mechanism. In the first step, DEA approaches the CO2 molecule and undergoes a nucleophilic addition reaction. The nitrogen atom attacks the electrophilic carbon atom of CO2, accompanied by proton transfer from the amine group, leading to the formation of a carbamate species (HO–CH2CH2)2–NCOO (as shown in Figure 3a) and a proton (H+).
In the second step, the released proton is rapidly captured by another DEA molecule, forming the protonated amine species (HO–CH2CH2)2–NH2+, as illustrated in Figure 3b.
The reaction mechanism between TEA and CO2 can be expressed as:
CO2 + H2O + (HO–CH2CH2)3–N →HCO3 + (HO–CH2CH2)3–NH+
This overall reaction can be divided into three elementary steps:
CO2 + H2O → H2CO3
H2CO3 → H+ + HCO3
H+ + (HO–CH2CH2)3–N → (HO–CH2CH2)3–NH+
The reaction proceeds via a three-step mechanism. In the first step, CO2 reacts with water in the weakly basic environment of the TEA solution to form carbonic acid (H2CO3). In the second step, carbonic acid undergoes its first dissociation in solution, producing H+ and HCO3. In the third step, the released proton is rapidly captured by a TEA molecule, forming an N–H bond with the nitrogen atom and yielding the protonated amine species (HO–CH2CH2)3–NH+, as shown in Figure 4 [24].
The reaction mechanism between MDEA and CO2 can be expressed as:
CO2 + H2O + (HO–CH2CH2)2–NCH3 → HCO3 + (HO–CH2CH2)2–N(CH3)H+
This overall reaction can be divided into three elementary steps:
CO2 + H2O → H2CO3
H2CO3→H+ + HCO3-
H+ + (HO–CH2CH2)2–NCH3 → (HO–CH2CH2)2–N(CH3)H+
The reaction proceeds via a three-step mechanism. In the first step, CO2 reacts with water in the weakly basic environment of the MDEA solution to form carbonic acid (H2CO3). In the second step, carbonic acid undergoes its first dissociation in solution, generating H+ and HCO3. In the third step, the released proton is rapidly captured by an MDEA molecule, forming an N–H bond with the nitrogen atom and yielding the protonated amine species (HO–CH2CH2)2–N(CH3)H+, as shown in Figure 5.

2.4. Model Validation

In this study, the COSMO solvation model was employed in the simulations. To verify the reliability of the established computational model, the simulation results obtained using only the implicit solvation model were compared with those obtained using the water-assisted model, while all other computational conditions remained consistent with those described in Section 2.1 Computational Methods.
Under the water-assisted model, the energy barriers for the reaction between MEA and CO2 are presented in Figures S1 and S2. As summarized in Table S1, the comparison between the two models shows that the maximum absolute error between the COSMO solvation model and the water-assisted model is 3.19 kJ/mol. In addition, the calculated energy barrier diagrams obtained from both models exhibit similar trends.
Based on these results, it can be concluded that the COSMO solvation model possesses reliability comparable to that of the water-assisted model and can reasonably reproduce the actual reaction process. Therefore, in the subsequent investigations, the COSMO solvation model was continuously adopted to simplify the computational procedure and data visualization.

3. Results and Discussion

3.1. Reaction Analysis of MEA with CO2

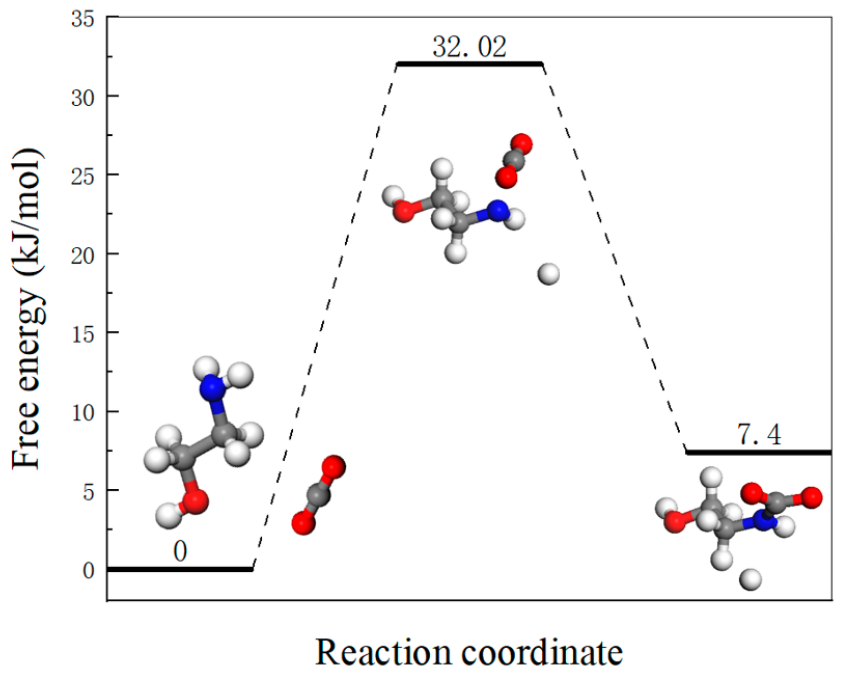
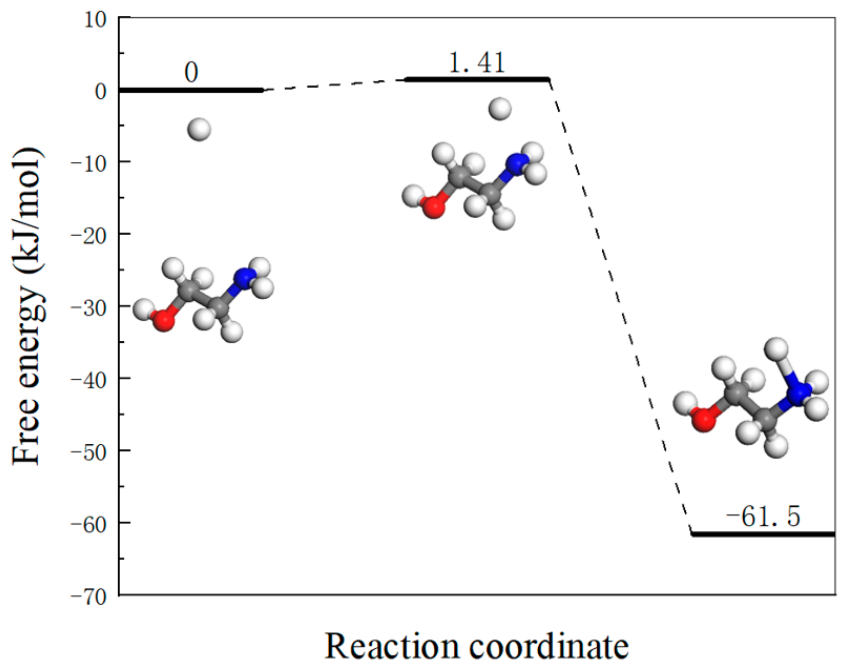
By calculating the energy barriers of the two reaction steps, the energy profile of the reaction process can be clearly determined, and the rate-determining step can be identified. As shown in Figure 6 and Figure 7, the energy barrier of the first step is 32.02 kJ/mol, with an endothermic energy of 7.4 kJ/mol, while the second step exhibits an energy barrier of 1.41 kJ/mol and an exothermic energy of 61.5 kJ/mol. The text continues here.
In the first step, MEA reacts with CO2 to form HO–C2H4–NHCOO and a free proton (H+). This step has the highest energy barrier (32.02 kJ/mol) in the overall reaction, indicating that it is the rate-determining step. The energy barrier of this step mainly originates from the energy required to break the N–H bond. In the second step, the free proton rapidly combines with an MEA molecule to form HO–C2H4–NH3+. This step releases 61.5 kJ/mol of energy, representing the largest energy release in the overall reaction process.
Based on the calculated energy barriers, the reaction of MEA with CO2 is a typical exothermic process [25], indicating that the reaction is thermodynamically favorable and can proceed readily [26].

3.2. Reaction Analysis of DEA with CO2

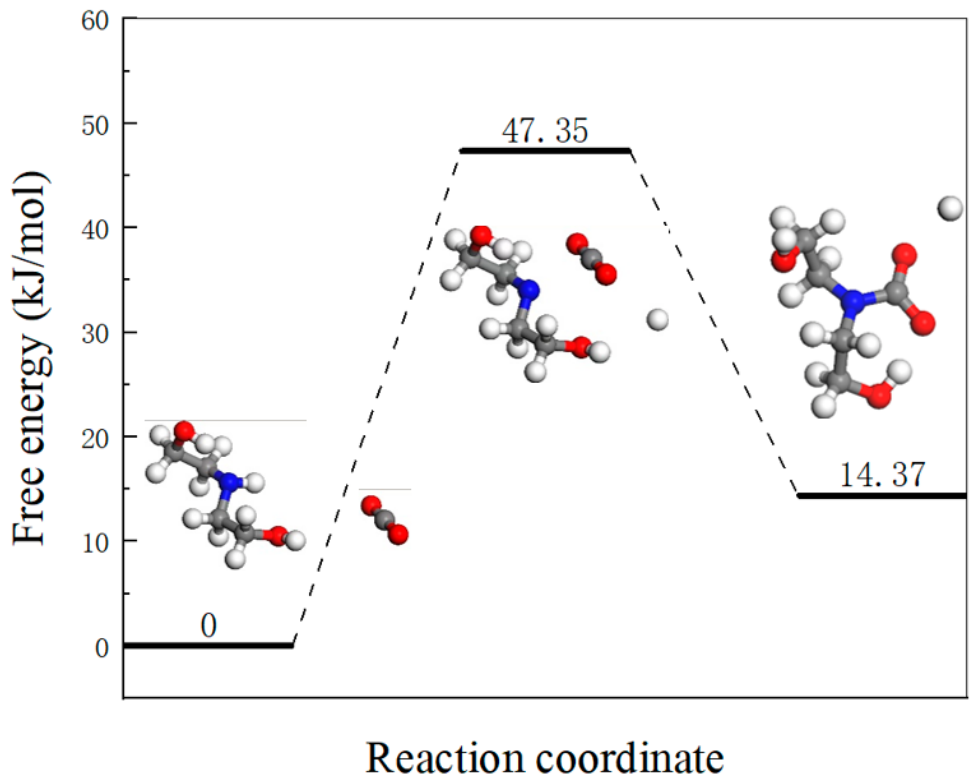
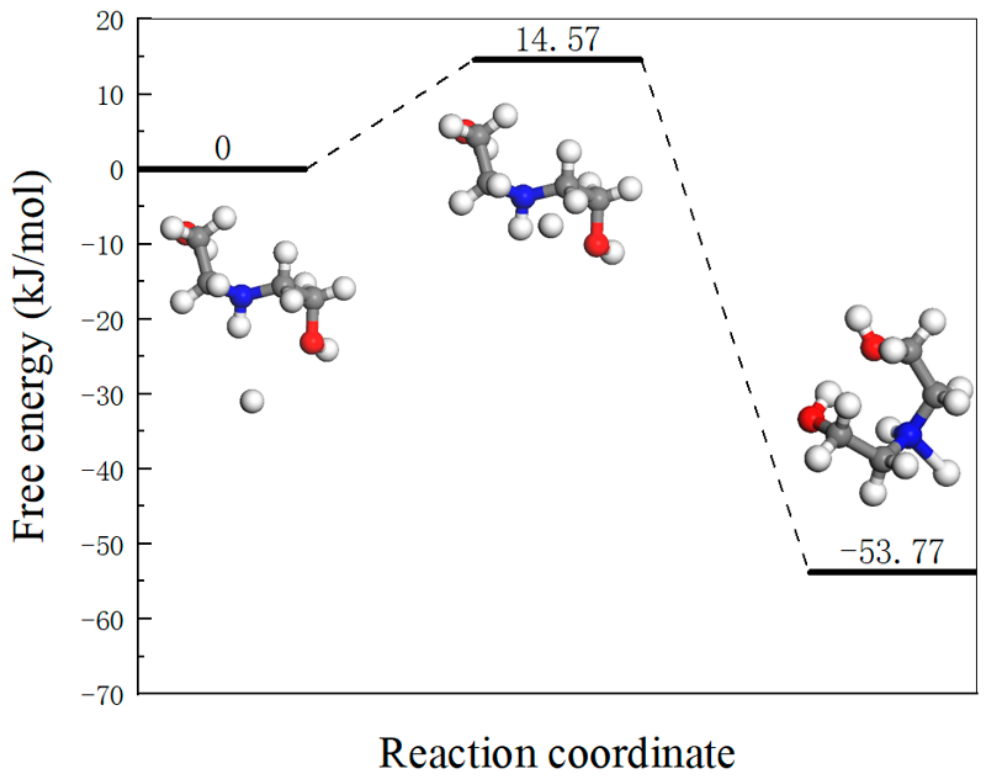
By calculating the energy barriers of the two reaction steps, the energy profile of the reaction process can be clearly elucidated and the rate-determining step can be identified. As shown in Figure 8 and Figure 9, the energy barrier of the first step is 47.35 kJ/mol, with an endothermic energy of 14.37 kJ/mol, while the second step exhibits an energy barrier of 14.57 kJ/mol and an exothermic energy of 53.77 kJ/mol.
In the first step, DEA reacts with CO2 to form (HO–CH2CH2)2–NCOO and a free proton (H+). This step has the highest energy barrier (47.35 kJ/mol) in the overall reaction, indicating that it is the rate-determining step. Similar to the MEA system, the energy barrier mainly arises from the energy required to break the N–H bond. In the second step, the free proton rapidly combines with a DEA molecule to form (HO–CH2CH2)2–NH2+. This step releases 53.77 kJ/mol of energy, representing the largest energy release in the overall reaction.
Based on the calculated energy barriers, the reaction of DEA with CO2 is thermodynamically favorable and exothermic, indicating that the absorption process can proceed readily.
The reaction pathway of DEA is similar to that of MEA. However, the hydrogen bonding interactions in the products formed from DEA are fewer and weaker than those in the MEA system. In addition, the larger steric hindrance of DEA leads to lower stability of the reaction products. As a result, the products of DEA reacting with CO2 are more easily desorbed compared to those of MEA.

3.3. Reaction Analysis of TEA with CO2

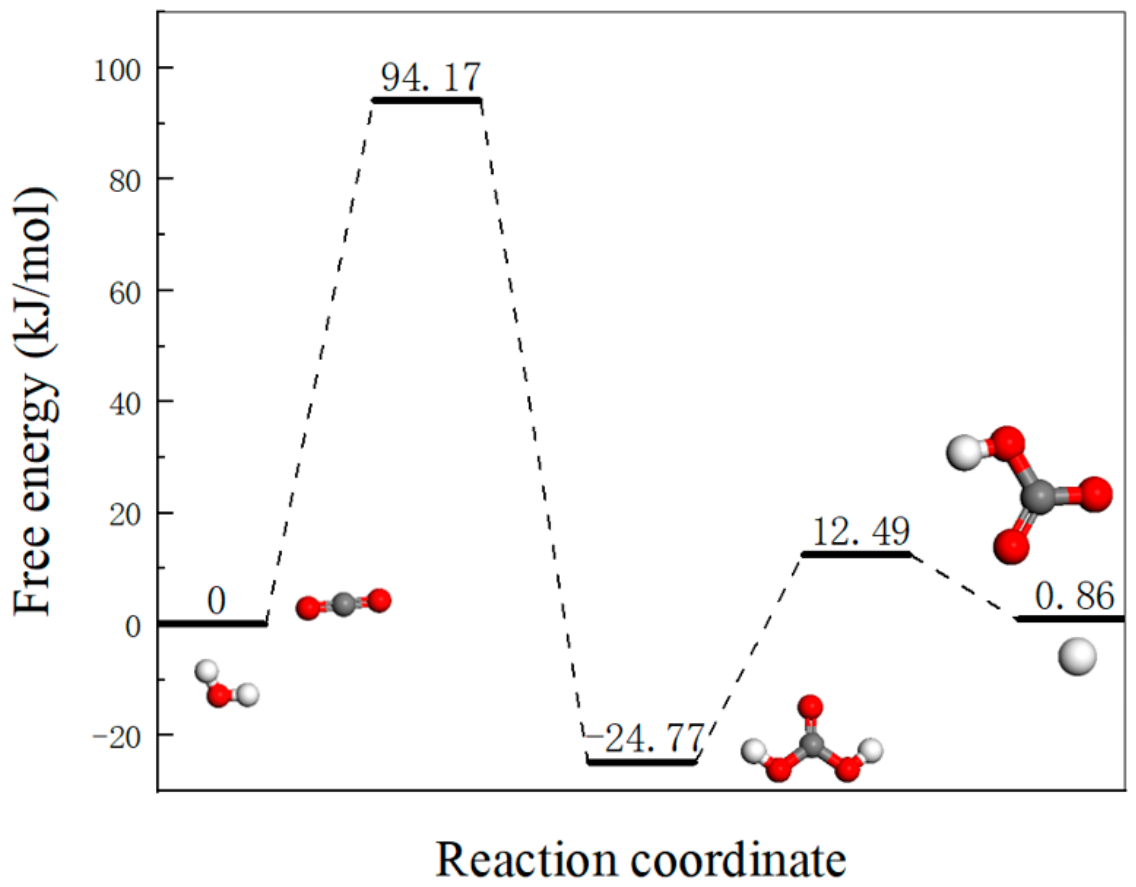
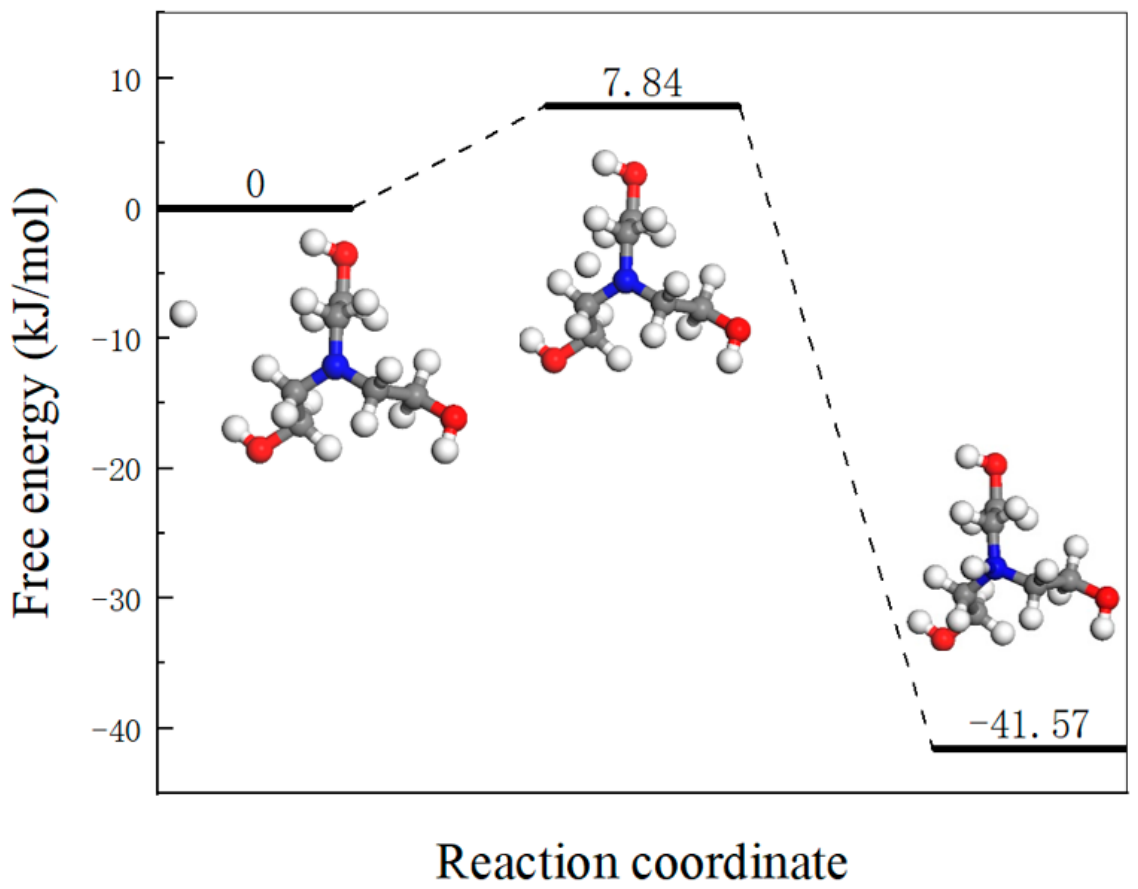
By calculating the energy barriers of the reaction steps, the energy evolution of the reaction process can be clearly elucidated, and the rate-determining step can be identified. As shown in Figure 10 and Figure 11, the maximum energy barrier of the first step is 94.17 kJ/mol, accompanied by an exothermic energy of 24.77 kJ/mol. The second step exhibits an energy barrier of 12.49 kJ/mol with an endothermic energy of 0.86 kJ/mol, while the third step has a maximum energy barrier of 7.84 kJ/mol and an endothermic energy of 41.57 kJ/mol.
In the weakly basic TEA solution, CO2 first reacts with water to form carbonic acid. This step has the highest energy barrier (94.17 kJ/mol) in the overall reaction, indicating that it is the rate-determining step. The energy barrier mainly arises from two contributions: (i) the structural reorganization of the CO2 molecule, involving redistribution of the π-electron system, which requires energy input; and (ii) the partial cleavage of the O–H bond in the water molecule, leading to the formation of a free proton (H+), which also consumes energy.
Subsequently, the released proton combines with a TEA molecule to form (HO–CH2CH2)3–NH+. This step releases 41.57 kJ/mol of energy, representing the largest energy release in the overall reaction process.
Based on the calculated energy barriers, although the reaction of TEA with CO2 is overall exothermic, the hydration of CO2 involves a significantly high activation barrier. As a result, the reaction proceeds at a relatively slow rate and is less favorable compared to primary and secondary amine systems.
The reaction mechanism of TEA with CO2 differs significantly from that of MEA and DEA. As a tertiary amine, the nitrogen atom in TEA is bonded to three hydroxyethyl groups and does not contain any N–H bonds. Therefore, TEA cannot directly react with CO2 to form carbamate species. Instead, it acts as a base, promoting the hydration and subsequent ionization of CO2 in aqueous solution, leading to the formation of bicarbonate ions. It can thus be concluded that although the reaction of TEA with CO2 is not kinetically favorable, the resulting products are relatively unstable and can be readily desorbed.

3.4. Reaction Analysis of MDEA with CO2

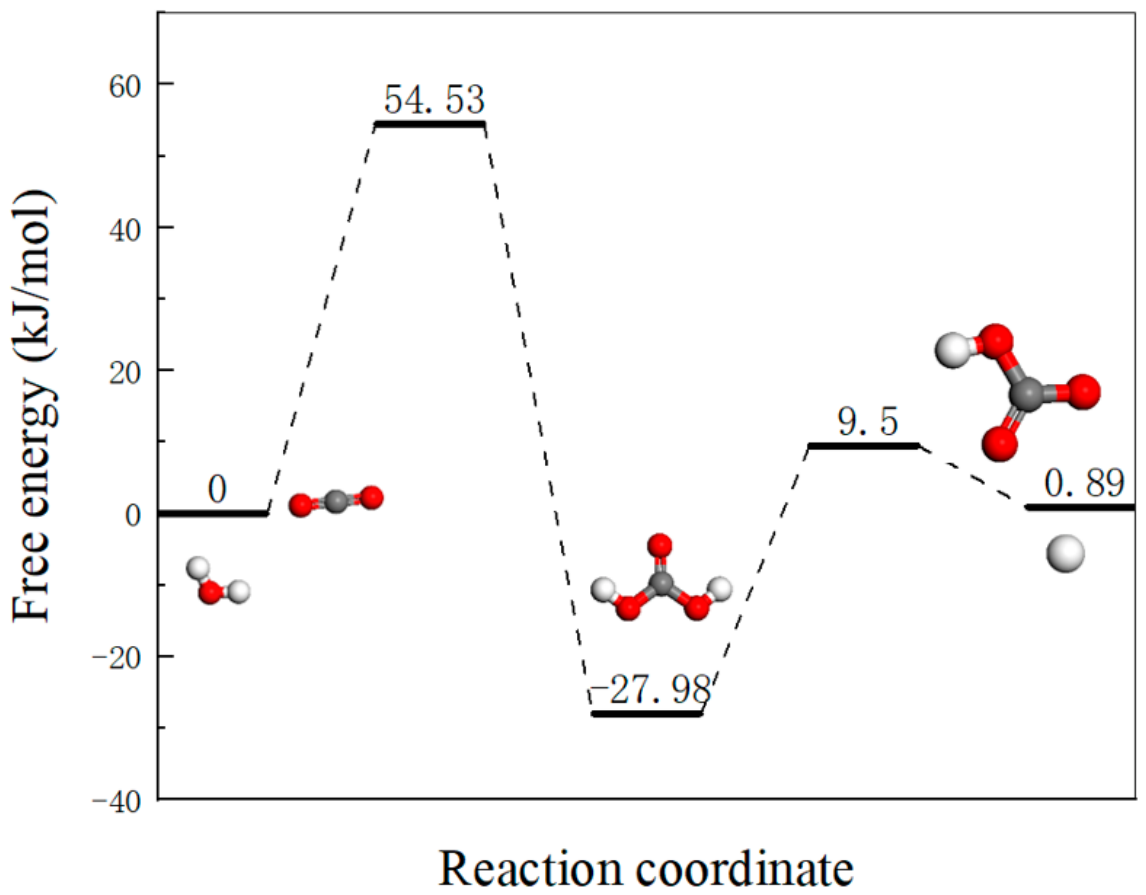
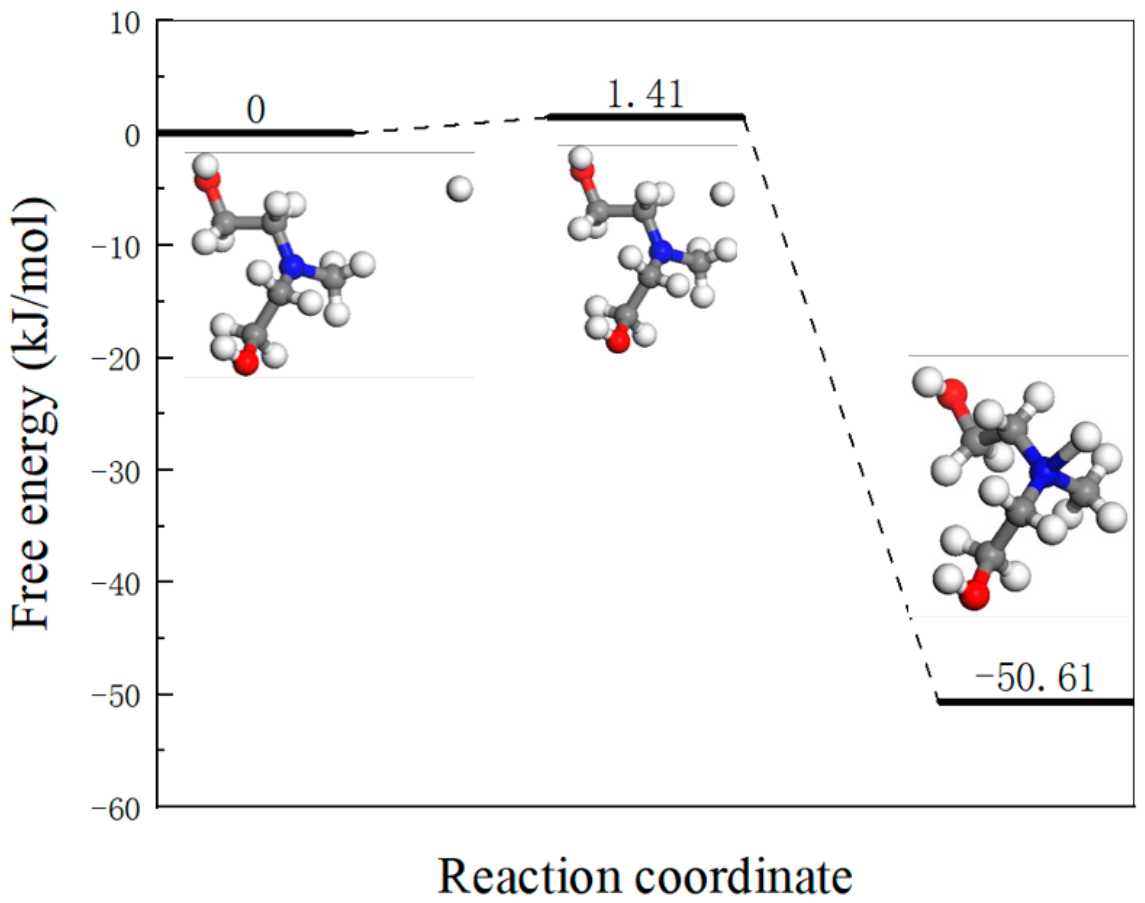
By calculating the energy barriers of the reaction steps, the energy evolution of the reaction process can be clearly elucidated, and the rate-determining step can be identified. As shown in Figure 12 and Figure 13, the maximum energy barrier of the first step is 54.53 kJ/mol, accompanied by an exothermic energy of 27.98 kJ/mol. The second step exhibits an energy barrier of 9.5 kJ/mol with an endothermic energy of 0.89 kJ/mol, while the third step has a maximum energy barrier of 1.41 kJ/mol and an exothermic energy of 50.61 kJ/mol.
In the weakly basic MDEA solution, CO2 first reacts with water to form carbonic acid. This step has the highest energy barrier (54.53 kJ/mol) in the overall reaction, indicating that it is the rate-determining step. The energy barrier mainly arises from two contributions: (i) the distortion of the linear structure of CO2, leading to redistribution of the π-electron system and associated energy consumption; and (ii) the partial cleavage of the O–H bond in the water molecule, which generates a free proton (H+) and requires additional energy input.
Subsequently, the released proton combines with an MDEA molecule to form (HO–CH2CH2)2–N(CH3)H+. This step releases 50.61 kJ/mol of energy, representing the largest energy release in the overall reaction process.
Based on the calculated energy barriers, although the reaction of MDEA with CO2 is overall exothermic, the relatively high activation barrier associated with CO2 hydration results in a slow reaction rate, making the process less favorable compared to primary and secondary amines.
The reaction mechanism of MDEA with CO2 is similar to that of TEA. However, due to its stronger basicity, MDEA exhibits a more pronounced catalytic effect on the hydration of CO2, resulting in a lower activation energy barrier and making the reaction more favorable compared to TEA. Moreover, since the reaction products are bicarbonate species with relatively low stability, the desorption process can also proceed readily.

4. Discussion

Based on the density functional theory (DFT) investigation of the reaction mechanisms of alkanolamine solutions with CO2, the main conclusions are summarized as follows:
1. Reaction pathways differ among amine types.
Primary and secondary amines react with CO2 to release a proton and form a negatively charged carbamate species. The released proton subsequently combines with another amine molecule to form a protonated cation, and together they constitute carbamate. In contrast, tertiary amines react with protons generated from water ionization, promoting the hydration of CO2 to form bicarbonate species.
2. Reaction energies vary for different amines.
The heat released during CO2 absorption follows the order: primary amine > secondary amine > tertiary amine. Specifically, the heat release is 54.1 kJ/mol for primary amines and 49.72 kJ/mol for secondary amines. For tertiary amines, MDEA and TEA release 40.77 kJ/mol and 39.4 kJ/mol, respectively. This indicates that primary amines exhibit the highest exothermicity.
3. Reaction products are different.
Primary and secondary amines form carbamate species upon reaction with CO2, whereas tertiary amines produce bicarbonate species.
4. Activation energy barriers differ significantly.
The highest energy barriers are 32.02 kJ/mol for primary amines and 47.35 kJ/mol for secondary amines. Tertiary amines exhibit much higher barriers, with values of 94.17 kJ/mol for TEA and 54.53 kJ/mol for MDEA. These results indicate that primary amines react most readily with CO2, while tertiary amines show the lowest reactivity. Among tertiary amines, MDEA reacts more easily with CO2 than TEA.
5. Desorption energy requirements vary.
The energy required for desorption is highest for primary amines and lowest for tertiary amines.

Supplementary Materials

The following supporting information can be downloaded at: https://www.mdpi.com/article/10.3390/chemengineering10060069/s1, Figure S1: Energy barrier diagram for the first reaction step of MEA with the water-assisted model. (Carbon, oxygen, hydrogen, and nitrogen atoms are represented by gray, red, white, and blue colors, respectively); Figure S2: Energy barrier diagram for the second reaction step of MEA with the water-assisted model. (Carbon, oxygen, hydrogen, and nitrogen atoms are represented by gray, red, white, and blue colors, respectively); Table S1: Comparison of reaction free energy changes under different simulation models.

Author Contributions

Conceptualization, X.W., H.W. and F.M.; methodology, X.W. and F.M.; software, X.W.; validation, X.W., D.R. and X.Z.; formal analysis, X.W.; investigation, X.W. and S.L.; resources, J.G. and F.X.; data curation, X.W.; writing—original draft preparation, X.W.; writing—review and editing, D.R., X.Z. and J.G.; visualization, X.W.; supervision, D.R., X.Z. and J.G.; project administration, J.G.; funding acquisition, J.G. All authors have read and agreed to the published version of the manuscript.

Funding

This work was supported by the Key R&D Program (Competitive Innovation Platform), Shandong Province (2022CXPT051), Natural Science Foundation of Shandong Province, China (ZR2021QE295).

Data Availability Statement

The original contributions presented in this study are included in the article/Supplementary Material. Further inquiries can be directed to the corresponding author(s).

Conflicts of Interest

The authors declare no conflicts of interests.

Abbreviations

The following abbreviations are used in this manuscript:
MEAMonoethanolamine
DEADiethanolamine
TEATriethanolamine
MDEAMethyldiethanolamine
DFTDensity Functional Theory
GGAGeneralized Gradient Approximation
LUMOLowest Unoccupied Molecular Orbital
HOMOHighest Occupied Molecular Orbital

References

  1. Intergovernmental Panel on Climate Change. Climate Change 2014: Mitigation of Climate Change: Working Group III Contribution to the IPCC Fifth Assessment Report; Cambridge University Press: Cambridge, UK, 2015. [Google Scholar] [CrossRef]
  2. Le Quéré, C.; Andrew, R.M.; Friedlingstein, P.; Sitch, S.; Hauck, J.; Pongratz, J.; Pickers, P.A.; Korsbakken, J.I.; Peters, G.P.; Canadell, J.G.; et al. Global carbon budget 2018. Earth Syst. Sci. Data 2018, 10, 2141–2194. [Google Scholar] [CrossRef]
  3. Boot-Handford, M.E.; Abanades, J.C.; Anthony, E.J.; Blunt, M.J.; Brandani, S.; Mac Dowell, N.; Fernández, J.R.; Ferrari, M.-C.; Gross, R.; Hallett, J.P.; et al. Carbon capture and storage update. Energy Environ. Sci. 2014, 7, 130–189. [Google Scholar] [CrossRef]
  4. Notz, R.; Mangalapally, H.P.; Hasse, H. Post combustion CO2 capture by reactive absorption: Pilot plant description and results of systematic studies with MEA. Int. J. Greenh. Gas Control 2012, 6, 84–112. [Google Scholar] [CrossRef]
  5. Figueroa, J.D.; Fout, T.; Plasynski, S.; McIlvried, H.; Srivastava, R.D. Advances in CO2 capture technology—The U.S. Department of Energy’s Carbon Sequestration Program. Int. J. Greenh. Gas Control 2008, 2, 9–20. [Google Scholar] [CrossRef]
  6. Rochelle, G.T. Amine Scrubbing for CO2 Capture. Science 2009, 325, 1652–1654. [Google Scholar] [CrossRef]
  7. Loachamin, D.; Casierra, J.; Calva, V.; Palma-Cando, A.; Ávila, E.E.; Ricaurte, M. Amine-Based Solvents and Additives to Improve the CO2 Capture Processes: A Review. ChemEngineering 2024, 8, 129. [Google Scholar] [CrossRef]
  8. Bishnoi, S.; Rochelle, G.T. Absorption of CO2 in aqueous piperazine/methyldiethanolamine. AIChE J. 2002, 48, 2788–2799. [Google Scholar] [CrossRef]
  9. Danckwerts, P.V. The reaction of CO2 with ethanolamines. Chem. Eng. Sci. 1979, 34, 443–446. [Google Scholar] [CrossRef]
  10. Samanta, A.; Bandyopadhyay, S.S. Absorption of CO2 into piperazine activated aqueous N-methyldiethanolamine. Chem. Eng. J. 2011, 171, 734–741. [Google Scholar] [CrossRef]
  11. Sema, T.; Naami, A.; Fu, K.; Edali, M.; Liu, H.; Shi, H.; Liang, Z.; Idem, R.; Tontiwachwuthikul, P. Comprehensive mass transfer and reaction kinetics studies of CO2 absorption into aqueous solutions of blended MDEA–MEA. Chem. Eng. J. 2012, 209, 501–512. [Google Scholar] [CrossRef]
  12. Hwang, G.S.; Stowe, H.M.; Paek, E.; Manogaran, D. Reaction mechanisms of aqueous monoethanolamine with CO2: A combined quantum chemical and molecular dynamics study. Phys. Chem. Chem. Phys. 2015, 17, 831–839. [Google Scholar] [CrossRef]
  13. Putta, K.R.; Svendsen, H.F.; Knuutila, H.K. Kinetics of CO2 Absorption in to Aqueous MEA Solutions Near Equilibrium. Energy Procedia 2017, 114, 1576–1583. [Google Scholar] [CrossRef]
  14. Orestes, E.; Machado Ronconi, C.; Carneiro, J.W.D.M. Insights into the interactions of CO2 with amines: A DFT benchmark study. Phys. Chem. Chem. Phys. 2014, 16, 17213–17219. [Google Scholar] [CrossRef]
  15. Meng, F.; Meng, Y.; Ju, T.; Han, S.; Lin, L.; Jiang, J. Research progress of aqueous amine solution for CO2 capture: A review. Renew. Sustain. Energy Rev. 2022, 168, 112902. [Google Scholar] [CrossRef]
  16. Schmitz, M.; Linderholm, C.; Lyngfelt, A. Chemical looping combustion of sulphurous solid fuels using spray-dried calcium manganate particles as oxygen carrier. Energy Procedia 2014, 63, 140–152. [Google Scholar] [CrossRef]
  17. Caplow, M. Kinetics of carbamate formation and breakdown. J. Am. Chem. Soc. 1968, 90, 6795–6803. [Google Scholar] [CrossRef]
  18. Hammer, B.; Hansen, L.B.; Nørskov, J.K. Improved adsorption energetics within density-functional theory using revised perdew-burke-ernzerhof functionals. Phys. Rev. B 1999, 59, 7413–7421. [Google Scholar] [CrossRef]
  19. Tomasi, J.; Mennucci, B.; Cammi, R. Quantum mechanical continuum solvation models. Chem. Rev. 2005, 105, 2999–3094. [Google Scholar] [CrossRef]
  20. Delley, B. From molecules to solids with the DMol3 approach. J. Chem. Phys. 2000, 113, 7756–7764. [Google Scholar] [CrossRef]
  21. Perdew, J.P.; Burke, K.; Ernzerhof, M. Generalized gradient approximation made simple. Phys. Rev. Lett. 1996, 77, 3865–3868. [Google Scholar] [CrossRef]
  22. Bhown, A.S.; Freeman, B.C. Analysis and Status of Post-Combustion CO2 Capture Technologies. Environ. Sci. Technol. 2011, 45, 8624–8632. [Google Scholar] [CrossRef]
  23. Haji-Sulaiman, M.Z.; Aroua, M.K.; Benamor, A. Analysis of Equilibrium Data of CO2 in Aqueous Solutions of Diethanolamine (DEA), Methyldiethanolamine (MDEA) and Their Mixtures Using the Modified Kent Eisenberg Model. Chem. Eng. Res. Des. 1998, 76, 961–968. [Google Scholar] [CrossRef]
  24. Pinsent, B.R.W.; Pearson, L.; Roughton, F.J.W. The kinetics of combination of CO2 with hydroxide ions. Trans. Faraday Soc. 1956, 52, 1512. [Google Scholar] [CrossRef]
  25. Kim, I.; Svendsen, H.F. Heat of absorption of CO2 (CO2) in monoethanolamine (MEA) and 2-(aminoethyl)ethanolamine (AEEA) solutions. Ind. Eng. Chem. Res. 2007, 46, 5803–5809. [Google Scholar] [CrossRef]
  26. Ramezani, R.; Bernhardsen, I.M.; Di Felice, R.; Knuutila, H.K. Physical properties and reaction kinetics of CO2 absorption into unloaded and CO2 loaded viscous monoethanolamine (MEA) solution. J. Mol. Liq. 2021, 329, 115569. [Google Scholar] [CrossRef]
Figure 1. Molecular models of alkanolamines: (a) MEA; (b) DEA; (c) TEA; (d) MDEA. (Carbon, oxygen, hydrogen, and nitrogen atoms are represented by gray, red, white, and blue colors, respectively.)
Chemengineering 10 00069 g001aChemengineering 10 00069 g001b
Figure 2. Products of the reaction between MEA and CO2: (a) HO–C2H4–NHCOO; and (b) HO–C2H4–NH3+. (Carbon, oxygen, hydrogen, and nitrogen atoms are represented by gray, red, white, and blue colors, respectively.)
Chemengineering 10 00069 g002
Figure 3. Products of the reaction between DEA and CO2: (a) (HO–CH2CH2)2–NCOO−; and (b) (HO–CH2CH2)2–NH2+. (Carbon, oxygen, hydrogen, and nitrogen atoms are represented by gray, red, white, and blue colors, respectively.)
Chemengineering 10 00069 g003
Figure 4. Molecular configuration of (HO–CH2CH2)3–NH+. (Carbon, oxygen, hydrogen, and nitrogen atoms are represented by gray, red, white, and blue colors, respectively.)
Chemengineering 10 00069 g004
Figure 5. Molecular configuration of (HO–CH2CH2)2–N(CH3)H+. (Carbon, oxygen, hydrogen, and nitrogen atoms are represented by gray, red, white, and blue colors, respectively.)
Chemengineering 10 00069 g005
Figure 6. Energy barrier diagram for the first reaction step of MEA. (Carbon, oxygen, hydrogen, and nitrogen atoms are represented by gray, red, white, and blue colors, respectively.)
Chemengineering 10 00069 g006
Figure 7. Energy barrier diagram for the second reaction step of MEA. (Carbon, oxygen, hydrogen, and nitrogen atoms are represented by gray, red, white, and blue colors, respectively.)
Chemengineering 10 00069 g007
Figure 8. Energy barrier diagram for the first reaction step of DEA. (Carbon, oxygen, hydrogen, and nitrogen atoms are represented by gray, red, white, and blue colors, respectively.)
Chemengineering 10 00069 g008
Figure 9. Energy barrier diagram for the second reaction step of DEA. (Carbon, oxygen, hydrogen, and nitrogen atoms are represented by gray, red, white, and blue colors, respectively.)
Chemengineering 10 00069 g009
Figure 10. Energy barrier diagram for the first reaction step of TEA. (Carbon, oxygen, hydrogen, and nitrogen atoms are represented by gray, red, white, and blue colors, respectively.)
Chemengineering 10 00069 g010
Figure 11. Energy barrier diagram for the second reaction step of TEA. (Carbon, oxygen, hydrogen, and nitrogen atoms are represented by gray, red, white, and blue colors, respectively.)
Chemengineering 10 00069 g011
Figure 12. Energy barrier diagram for the first reaction step of MDEA. (Carbon, oxygen, hydrogen, and nitrogen atoms are represented by gray, red, white, and blue colors, respectively.)
Chemengineering 10 00069 g012
Figure 13. Energy barrier diagram for the second reaction step of MDEA. (Carbon, oxygen, hydrogen, and nitrogen atoms are represented by gray, red, white, and blue colors, respectively.)
Chemengineering 10 00069 g013
Disclaimer/Publisher’s Note: The statements, opinions and data contained in all publications are solely those of the individual author(s) and contributor(s) and not of MDPI and/or the editor(s). MDPI and/or the editor(s) disclaim responsibility for any injury to people or property resulting from any ideas, methods, instructions or products referred to in the content.