Article

Combined Factors Influencing the Severity of Elderly-Pedestrian Crashes in Local Areas of Korea Using Classification and Regression Trees and Sensitivity Analysis


1
Department of Road Transport, Korea Transport Institute, Sejong-si 30147, Republic of Korea
2
Research Institute, RoadKorea Inc., Seoul 18471, Republic of Korea
*
Author to whom correspondence should be addressed.
Standards 2026, 6(2), 15; https://doi.org/10.3390/standards6020015
Submission received: 30 December 2025 / Revised: 2 April 2026 / Accepted: 3 April 2026 / Published: 10 April 2026

Abstract

This study investigated injury severity in 18,528 police-reported vehicle-to-pedestrian crashes involving elderly pedestrians in legally classified local areas of South Korea during 2012–2021. Injury severity was coded into four ordered categories: fatal, serious, minor, and reported injury. To stabilize scenario extraction from a categorical crash database, an integrated screening workflow was applied, including near-zero-variance filtering, redundancy control among overlapping roadway encodings, representative-variable selection within redundant groups, and chi-square association checks. Classification and regression tree (CART) modeling was then used to identify rule-based combinations of environmental, roadway, driver, pedestrian, and vehicle factors associated with elevated severity, while tree complexity was controlled through cost-complexity pruning and 10-fold cross-validation. A scenario-based sensitivity analysis was further conducted to evaluate counterfactual shifts in severity distributions under targeted control of key conditions within representative high-risk scenarios. The results showed that severe outcomes were concentrated in stacked-risk combinations rather than in single factors alone. A dominant pathway involved nighttime conditions combined with maneuver-related driving contexts and speeding-related violations. High-fatality scenarios persisted even when speed-related predictors were excluded, underscoring the roles of nighttime exposure, visibility limitations, conflict-prone roadway settings, heavy-vehicle involvement, and pedestrian exposure behaviors. The proposed framework translates administrative crash records into concise, operationally interpretable scenarios and intervention-relevant evidence for local-area safety.

1. Introduction

South Korea is undergoing one of the fastest demographic transitions toward a super-aged society, and pedestrian safety for older adults has become a central road safety challenge rather than a marginal concern [1]. Older pedestrians are disproportionately vulnerable because age-related declines in perception, attention, gait stability, and reaction capability increase both the likelihood of crash involvement and the probability of fatal or serious injury once a collision occurs [2]. These risks can be amplified in local areas, including rural towns and small communities, where operating speeds often remain high, pedestrian facilities are discontinuous, nighttime lighting is limited, and emergency medical response can be slower than in metropolitan settings [3]. Under such conditions, similar crash mechanisms may yield more severe outcomes, implying that effective countermeasures require evidence aligned with local-area roadway environments and pedestrian exposure patterns.
A substantial body of crash-injury severity research has examined determinants of severe outcomes using discrete-outcome regression frameworks such as binary logit, multinomial logit, and ordered-response models [4,5,6]. Across prior studies, severity has been linked to lighting and weather conditions, road surface state, roadway functional class, intersection and alignment characteristics, vehicle type, driver behaviors and violations, and pedestrian maneuvers [4,6]. This literature provides important insights into average associations and marginal effects. However, practitioners operating in local areas often face scenario-oriented decision-making needs. They must identify which combinations of conditions generate the most lethal outcomes and which controllable elements within those combinations should be prioritized for enforcement, operations, and engineering countermeasures. For example, nighttime travel on higher-speed facilities can become disproportionately hazardous when combined with hazardous maneuvers such as overtaking and lane changes, yet such stacked-risk patterns are not always communicated clearly by main-effect estimates alone. To improve interpretability and capture interaction structures, transportation safety research has increasingly adopted nonparametric and machine learning approaches. Among them, classification and regression tree (CART) modeling is widely used because it produces rule-based partitions that can be expressed as interpretable if–then pathways and can therefore be mapped naturally to operational risk scenarios [7]. The use of CART and related machine learning approaches in crash severity analysis has continued to increase. Previous studies have shown that vehicle movement, pedestrian age, and driver characteristics are important factors affecting the severity of elderly-pedestrian crashes, and that machine learning models can provide higher classification performance than conventional logistic models [8]. Other studies have identified lighting conditions, vehicle speed, and the physical characteristics of older adults as key contributors to crash severity among elderly pedestrians [9]. Machine learning has also been applied to path analysis in bicycle–vehicle crashes, demonstrating its usefulness in identifying complex interaction patterns among crash-related factors [10]. In addition, association-based approaches have shown that pedestrian age, collision speed, crash time, and crash location are significantly related to fatal crash outcomes among elderly pedestrians [11]. Recent pedestrian safety research has also examined factors specifically associated with pedestrian fatalities in crashes involving motor vehicles. A study based on pedestrian–motor vehicle crashes in Poland reported that the risk of pedestrian death increased under conditions such as driver alcohol impairment, speeding, heavy-vehicle involvement, older pedestrian age, pedestrian alcohol use, nighttime conditions, non-built-up areas, and adverse weather. This line of research is important because it shows that pedestrian fatality risk is shaped not only by individual factors, but also by the combined influence of roadway environment, vehicle type, human behavior, and operating conditions. However, most previous studies have focused on identifying significant fatality-related factors or estimating their average effects. By contrast, the present study extends this line of inquiry by focusing on how such factors combine into interpretable high-risk scenarios in legally defined local areas of Korea and by examining how severity distributions may change under counterfactual adjustments to selected conditions [12].
Previous studies have also examined temporal and environmental influences on pedestrian crash severity. It has been reported that the determinants of elderly-pedestrian crash severity may vary over time depending on broader social conditions and roadway context [13]. Other studies have shown that streetscape and built-environment characteristics can significantly affect pedestrian crash severity, including that of older adults [14]. Spatial analyses using GIS have further indicated that pedestrian crash clusters and injury patterns tend to be concentrated in older urban areas with relatively large elderly populations [15]. Comparative studies by age group have also confirmed that pedestrian injury patterns differ according to vulnerability characteristics [16]. In addition, studies considering socioeconomic and environmental conditions have shown that traffic volume, road geometry, and human factors jointly shape pedestrian crash patterns [17,18]. Although these studies provide meaningful insights, two important limitations remain in the analysis of elderly-pedestrian crashes in local or rural areas. First, Korean traffic crash data often contain duplicated variables that represent similar attributes in different forms. If such variables are not properly screened before modeling, the results may be influenced more by the structural characteristics of the dataset than by the actual crash mechanism. Second, even when high-risk combinations of factors are identified, few studies have quantitatively examined how crash severity may change when one condition within that combination is improved or controlled. Therefore, this study aims to address both of these limitations.
CART has been applied across crash contexts to identify high-risk subgroups and interaction-driven severity patterns. Studies using CART and related tree-based approaches have shown that driver impairment indicators, vehicle and driver attributes, and behavioral factors can dominate high-severity branches in truck-related crashes, while heterogeneity-focused models have highlighted that severity mechanisms can vary across segments and contexts. In vulnerable-road-user safety, pedestrian-focused studies have emphasized that roadway and traffic environment features become especially consequential where pedestrian infrastructure is sparse or discontinuous, and that the speed environment and exposure conditions can strongly influence severe outcomes [19]. Other work has also shown that severity mechanisms can vary spatially and temporally, implying that interventions should be context-sensitive rather than uniform [20]. Collectively, prior research suggests that local-area safety policies benefit from methods that detect interaction structures and translate them into operationally interpretable scenarios.
Despite these advances, two practical gaps remain for elderly-pedestrian safety studies in local-area environments. First, national crash databases can contain multiple categorical variables with overlapping meanings or parallel coding schemes for roadway attributes, such as alternative encodings of road type, intersection type, or alignment. If these redundancies are not handled explicitly, model outputs can be unstable and extracted scenarios may reflect database structure rather than underlying safety mechanisms. A reproducible screening framework is therefore needed to retain policy-relevant predictors while reducing redundancy and noise. Second, even when high-risk scenarios are identified, decision-makers often require more than scenario ranking. They need interpretable estimates of how much the severity profile could plausibly shift if one or more controllable elements were mitigated within a high-risk scenario. This motivates an approach that links scenario identification to intervention-oriented interpretation.
This study addresses these needs by combining an integrated variable-screening framework with CART modeling and a scenario-based sensitivity analysis. The screening framework reduces noise and redundancy among categorical predictors and yields a compact set of interpretable variables suitable for rule extraction. CART is then used to identify combinations of conditions associated with elevated injury severity among elderly pedestrians in Korean local areas. Finally, a sensitivity analysis is conducted on representative high-risk combinations to estimate how severity distributions would change under counterfactual control of key factors, such as speeding-related violations and nighttime exposure in the speed-centered pathway, and visibility- and conflict-related conditions in a non-speed pathway.

2. Materials and Methods

2.1. Research Workflow

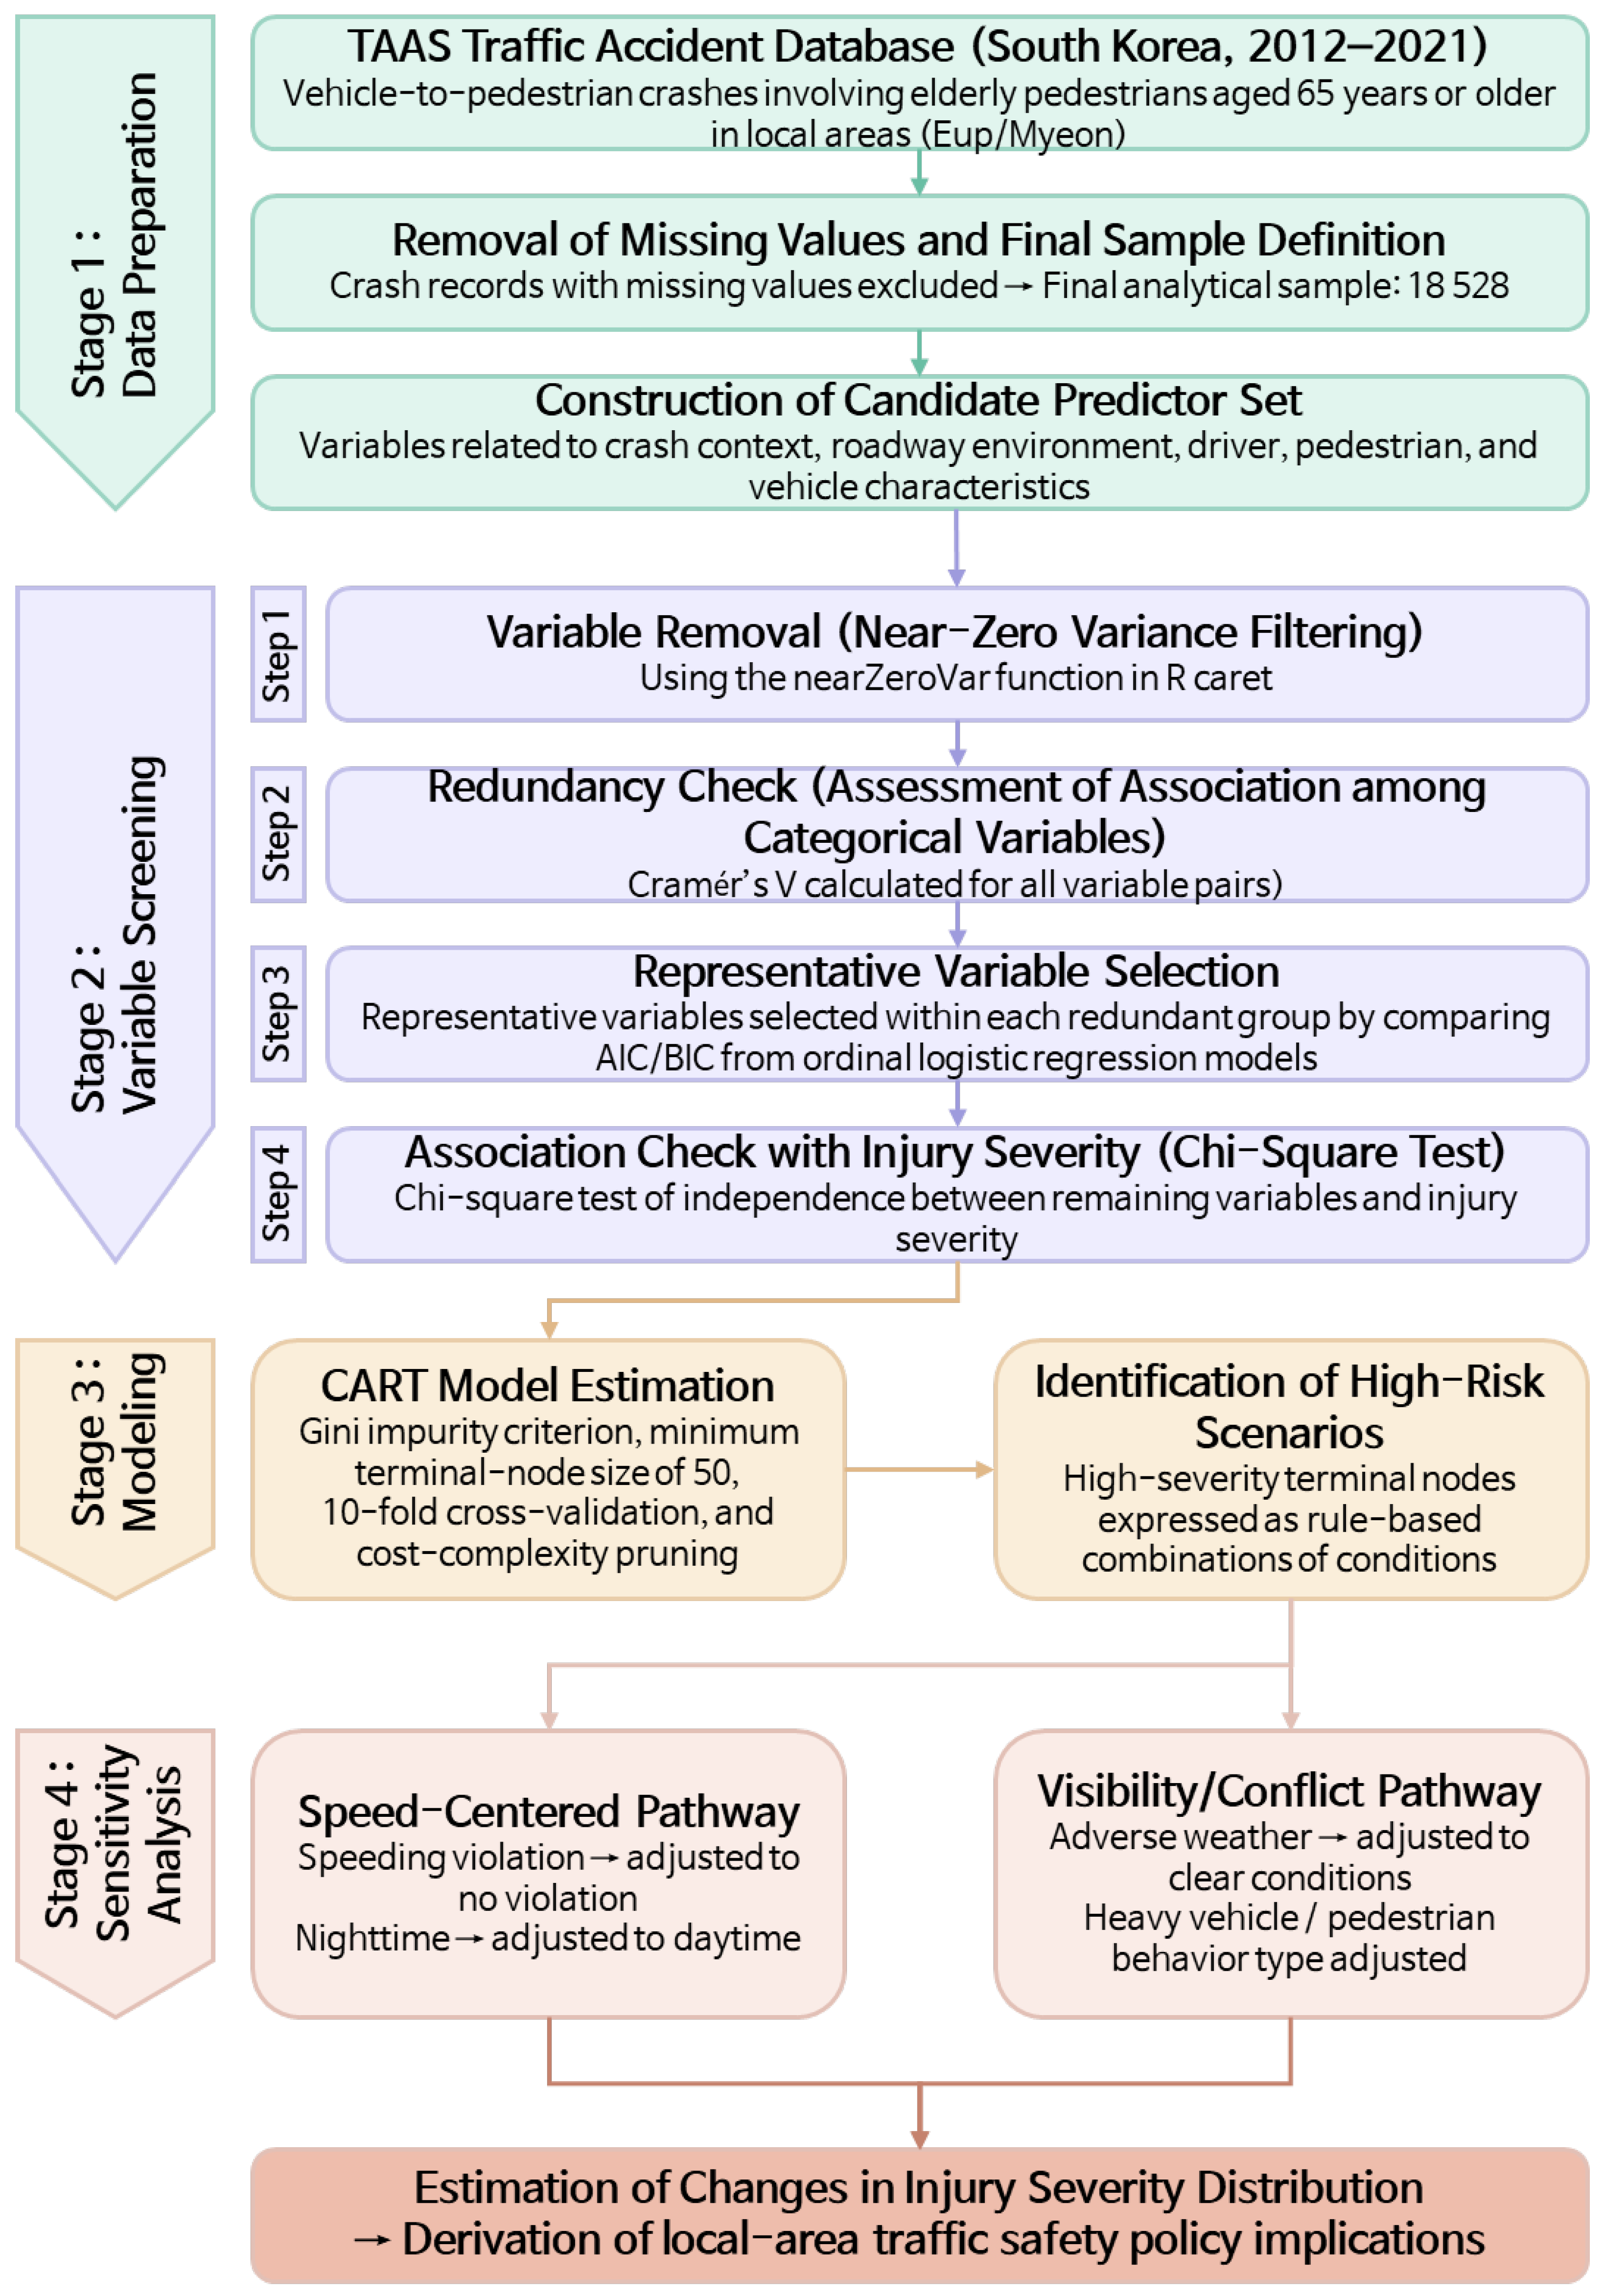
At the methodological level, the study was designed as a four-stage workflow, as illustrated in Figure 1, to move systematically from raw crash records to interpretable and intervention-oriented findings. The first stage focused on data preparation, in which crash records involving elderly pedestrians in local areas were extracted from the TAAS database and records with missing values were excluded to define the final analytical sample. The second stage addressed variable screening, with the aim of reducing noise and redundancy in the categorical crash data through near-zero-variance filtering, redundancy checks using Cramér’s V, representative-variable selection within redundant groups, and chi-square association tests with injury severity. The third stage involved CART model estimation and rule extraction, using the final predictor set to identify interpretable high-risk factor combinations. The fourth stage consisted of scenario-based sensitivity analysis, which was designed to examine how changes in selected controllable conditions could shift the severity distribution and thereby support intervention-oriented policy interpretation.

2.2. Study Design and Data Source

This study analyzed police-reported crash records compiled in the Traffic Accident Analysis System operated by the Korea Road Traffic Authority [21]. The analytical sample was restricted to vehicle-to-pedestrian crashes that occurred in legally classified local areas (towns and villages), involved an elderly pedestrian aged 65 years or older, and occurred during 2012–2021. Records with missing values required for model estimation were excluded, yielding a final dataset of 18,528 crashes. Of the 18,528 crashes, 15.5% (n = 2875) were classified as fatal crashes, 59.5% (n = 11,014) as serious-injury crashes, 23.1% (n = 4285) as minor-injury crashes, and 1.9% (n = 354) as reported-injury crashes. Compared with the national average, local areas showed higher proportions of fatal and serious injury crashes, with approximately 3.2% fatal crashes and 22.4% serious injury crashes at the national level. This pattern may reflect the combined effects of higher operating speeds, insufficient pedestrian facilities, and limited nighttime lighting in local-area environments. The study outcome was the injury severity of the elderly pedestrian recorded in the police casualty classification. Severity was coded into four ordered categories: fatal injury, serious injury, minor injury, and reported injury. These categories are standard in Korean crash statistics and support severity profiling for local-area safety management [22]. The predictor pool was defined from TAAS crash-record fields covering crash context, roadway environment, involved-party characteristics, and vehicle attributes. In TAAS, the first party refers to the at-fault driver (perpetrator), and the second party refers to the pedestrian (victim), consistent with TAAS documentation and definitions [21,23]. The full variable inventory used to define the candidate pool is summarized in Table 1.

2.3. Candidate Variables and Pre-Processing

Candidate predictors were treated as categorical variables to preserve interpretability for countermeasure design. Where necessary, variables were recoded to ensure adequate cell sizes and operationally meaningful levels. Natural environment variables captured visibility and surface condition constraints, including day/night, weather conditions, and road surface conditions. Road environment variables represented the speed environment and conflict setting, including road type, road characteristic fields describing location context, intersection type, and road alignment. Human and vehicle factors described exposure and behavioral mechanisms, including pedestrian sex, pedestrian age group, pedestrian behavior type, driver sex, driver age group, years since license issuance, driver behavior type, driver traffic-law violation type, and vehicle type [24]. Because the analysis was limited to elderly pedestrians aged 65 years and older, pedestrian age was categorized into three groups: 65–69 years, 70–74 years, and 75 years and older. This categorization was intended to reflect differences in physical vulnerability across elderly age groups while maintaining adequate sample sizes within each category. Because TAAS contains multiple categorical fields and, for some roadway concepts, parallel encodings that describe similar attributes, a structured screening workflow was applied before tree modeling to reduce noise, control redundancy, and stabilize rule extraction. Administrative descriptors and fields not used for CART estimation were retained in the variable inventory for completeness but were not included in the final modeling set. The proportion of records removed because of missing values was small relative to the full extract, and the final analytical sample remained suitable for the intended local-area analysis.

2.4. Integrated Variable Screening and Final Predictor Set

Crash databases can include sparse indicators and alternative encodings of similar roadway attributes. To improve split stability and preserve interpretability for rule-based scenario extraction, this study applied an integrated screening procedure before CART estimation.
  • Step 1 (near-zero-variance filtering): Sparse indicator variables were identified and removed using the nearZeroVar function in the R caret package, based on a frequency ratio ≥ 19 or percent unique ≤ 10%.
  • Step 2 (categorical dependency screening): Cramér’s V was calculated for pairs of remaining variables, and variable pairs with V ≥ 0.70 were identified as redundant groups.
  • Step 3 (representative-variable selection): Within each redundant group, a representative variable was selected based on comparisons of AIC and BIC from ordinal logistic regression models.
  • Step 4 (chi-square association screening): Chi-square tests of association with injury severity were conducted for the remaining variables using a significance level of α = 0.05.
The procedure reduced near-constant fields and controlled duplicated information among overlapping roadway descriptors while retaining policy-relevant predictors for scenario interpretation. The workflow consisted of near-zero-variance filtering, redundancy identification using categorical dependency screening, representative-variable selection within redundant groups, and an association check using chi-square tests. The outputs were consolidated into a final predictor set used consistently for CART estimation.

2.4.1. Near-Zero-Variance Filtering

Near-zero-variance screening was used to identify predictors with extreme category imbalance. Highly imbalanced predictors contribute little discriminative information and can induce unstable, sample-specific splits in tree models, potentially producing terminal-node rules that depend on rare categories rather than generalizable mechanisms. Near-zero-variance diagnostics were computed using the nearZeroVar procedure in the caret framework, which evaluates category imbalance using the frequency ratio and percent unique measures [25]. In this dataset, Road alignment 2, the school (children’s) protection zone indicator, the senior (elderly) protection zone indicator, and driver DUI were flagged as near-zero-variance variables and were excluded from subsequent screening and CART estimation to avoid rare-category-driven splits and improve rule stability [26]. This study applied the default thresholds in the R caret package, namely a frequency ratio ≥ 19 and a percent unique ≤ 10%. Even when the thresholds were slightly relaxed or tightened, the same four variables were consistently identified for removal, and the overall CART rule structure remained unchanged, supporting the robustness of the results.

2.4.2. Redundancy Control Using Categorical Dependency Screening

After removing near-zero-variance indicators, redundancy among candidate predictors was evaluated because TAAS provides paired or alternative encodings for certain roadway descriptors. If highly overlapping variables are included simultaneously, CART can allocate splits across redundant fields, reducing interpretability and complicating scenario communication even when the underlying concept is the same. Categorical dependency screening was used to identify highly overlapping variable groups, using an effect-size approach appropriate for multi-category variables, such as Cramér’s V [27]. This step was intended to prevent duplicated information from inflating the apparent importance of a concept simply because it appears in multiple encodings.

2.4.3. Representative-Variable Selection

Within each redundant group identified by dependency screening, one representative variable was retained to ensure that each roadway concept entered the model only once. Representative selection was guided by an ordinal logistic framework with ordered injury severity as the outcome. The objective was pragmatic rather than exhaustive: among alternative encodings describing similar roadway attributes, the encoding that better supported severity differentiation while remaining operationally interpretable for local-area countermeasure design was retained. This selection was applied only within redundancy groups, not as a global feature selection procedure. Within each redundant pair, the representative encoding was selected based on comparative model fit and interpretability (e.g., information criteria and stability of severity differentiation) under an ordinal logistic specification [28].
For each redundant pair, separate ordinal logistic models were fitted and compared in terms of AIC and the consistency of the severity-odds direction. For example, when road type and road characteristics were identified as redundant variables with Cramér’s V ≥ 0.73, road type was selected as the representative variable based on both AIC comparison and policy interpretability, because it more directly reflects the speed environment and roadway functional hierarchy.

2.4.4. Chi-Square Association Checks

After near-zero-variance filtering, chi-square tests of independence were conducted as an association check to confirm that candidate predictors were not trivially unrelated to injury severity [29]. Where sparse cells were present, categories were merged to ensure valid expected counts before applying the chi-square tests. Because some roadway concepts appear in alternative encodings, chi-square results were calculated and reported for transparency at the candidate-variable stage, even when paired encodings were later reduced to a single representative variable for CART estimation. Given the large sample size, very small p-values can occur even when practical associations are modest; therefore, this step was used to screen for non-trivial association rather than to provide a causal ranking. Statistical inference terminology was applied conservatively; when p-values exceed the significance threshold, the appropriate interpretation is to fail to reject the null hypothesis of independence rather than to accept it [30]. For CART estimation, only the representative variables retained from each redundant group were included in the final predictor set, whereas redundant counterparts were excluded, as summarized in the selection summary.

2.4.5. Final Predictor Set for CART Modeling

The screening outputs were consolidated into a final predictor set used to grow and prune the CART models. Retained predictors covered natural environment factors (day/night, weather conditions, road surface conditions), road environment factors (road type, the retained road characteristic encoding, the retained intersection type encoding, and the retained road alignment encoding), pedestrian factors (age group, gender, behavior type), driver factors (age group, gender, years of license experience, behavior type, traffic-law violations), and perpetrator vehicle type.
Excluded variables reflected near-zero-variance filtering and redundancy control decisions, including near-constant indicators and the redundant roadway encodings removed after representative-variable selection. This finalized predictor set was applied consistently in subsequent CART estimation to ensure that extracted terminal-node scenarios reflect substantive safety mechanisms rather than database redundancy or near-constant coding artifacts.

2.5. CART Modeling and Sensitivity Analysis

To control tree complexity and reduce overfitting, cost-complexity pruning and 10-fold cross-validation were applied. The CART models were estimated in R version 4.3.2 (R Foundation for Statistical Computing, R Core Team, Vienna, Austria) using the caret package (version 6.0-94) and the rpart package (version 4.1-19). The optimal complexity parameter (cp) was selected by applying the 1-SE rule to the minimum cross-validation error from 10-fold cross-validation. Gini impurity was used as the splitting criterion, and the minimum number of records in each terminal node was set to 50. Although proportional odds models or ordinal regression trees may also be considered because crash severity is an ordinal outcome, the main purpose of this study was not to maximize predictive accuracy but to derive interpretable if–then-type operational scenarios that can support safety management in local areas. CART is a nonparametric approach that can automatically detect high-order interactions and present combinations of risk factors in an interpretable form without relying on the proportional odds assumption. A systematic comparison with ordinal regression trees should be considered in future research.
A CART model was applied to identify combinations of conditions associated with elevated injury severity and to express them as rule-based scenarios that support operational interpretation [31]. CART partitions the data by selecting, at each node, the predictor and split that maximizes within-node homogeneity of the outcome, using impurity criteria such as the Gini index. Each terminal node is summarized by the observed proportions of the four severity categories. To reduce overfitting, tree complexity was controlled using cost-complexity pruning with cross-validation [31,32]. The pruning objective is expressed as
(T) = R(T) + α|T|,
where T denotes the tree, R(T) represents the classification loss for tree T, |T| is the number of terminal nodes, and α controls the penalty on complexity [31,32]. The final subtree was selected using K-fold cross-validation (K = 10) [32]. Replication details such as minimum node size, splitting rule, pruning criterion, and cross-validation configuration used to select α [33]. In this study, CART was implemented using the Gini impurity criterion, with a minimum terminal-node size and split-search settings chosen to balance stability and interpretability; the final tree was selected via 10-fold cross-validation and cost-complexity pruning.
To translate terminal-node scenarios into intervention-oriented evidence, a scenario-based sensitivity analysis was conducted. Representative high-risk terminal-node rules were organized into two pathways: a speed-centered pathway and a visibility/conflict pathway. For each rule-defined subgroup, baseline severity proportions were computed. A factor-control scenario was then generated by counterfactually removing or substituting one condition, such as removing speeding-related violations, replacing nighttime with daytime, substituting adverse weather with clear conditions, removing heavy-vehicle involvement, or modifying pedestrian exposure behaviors, and severity proportions were recalculated to quantify plausible shifts in the severity distribution under targeted control of key factors.

2.6. Scenario-Based Sensitivity Analysis

Representative terminal nodes associated with a high probability of fatal outcomes were first identified from the CART results, and the corresponding records were extracted. A selected controllable condition was then hypothetically modified for the analysis, for example, changing the traffic-law violation type from “speeding” to “no violation” or changing the lighting condition from “nighttime” to “daytime.” The modified records were then passed through the branching structure of the fitted CART model to obtain the reclassified severity distribution [34]. By comparing the original distribution with the counterfactual distribution, the potential effect of mitigating a specific condition could be quantified.

3. Results

3.1. Research Analytical Framework

The analytical framework of this study consists of three stages. The first stage, data preparation, involved extracting crash records involving elderly pedestrians in local areas from the TAAS database and deriving the final set of predictors through a four-step integrated screening procedure. The second stage, CART model estimation and rule extraction, involved fitting the CART model and identifying high-risk combinations of factors. The third stage, sensitivity analysis and policy interpretation, involved estimating shifts in injury severity distributions under counterfactual changes and deriving intervention-oriented policy implications.

3.2. Crash Severity Trends in Rural Elderly-Pedestrian Crashes

Table 2 summarizes trends in police-reported vehicle-to-pedestrian crashes involving elderly pedestrians aged 65 years or older in legally classified rural or local areas during 2012–2021 (n = 18,528). Over the study period, total crashes increased slightly, while fatalities decreased substantially and serious injuries decreased marginally. Minor injuries increased markedly, and reported injuries also increased. Across the full period, fatalities accounted for 15.5% of cases and serious injuries for 59.5%, indicating that severe outcomes remained substantial even as the distribution shifted toward less severe categories. Overall, crash occurrence did not decline over time, but the severity profile moved toward minor and reported injuries.
To provide a structured basis for interpreting CART-derived terminal-node scenarios, severity-related factors were organized into three domains: natural environment, road environment, and driver behavior and violations. Table 3 summarizes the interpretation mechanisms used throughout the scenario analysis. Natural-environment conditions were interpreted primarily through visibility and surface condition constraints. Road environment conditions were interpreted through the speed environment and the vehicle–pedestrian conflict setting. Driver-related factors were interpreted through transient increases in speed and reductions in situational awareness associated with maneuvering and violations, while pedestrian behaviors relevant to crossing and roadway walking were interpreted as exposure patterns that intensify vehicle–pedestrian conflict, particularly in settings where pedestrian facilities are discontinuous.

3.3. Variable Screening and Chi-Square Test Results

This section details the integrated screening workflow used to define the final predictor set for CART modeling. Because TAAS crash records include many categorical variables and, in some cases, parallel encodings that describe similar roadway attributes, the screening procedure was designed to improve split stability, reduce noise from near-constant fields, and prevent duplicated information from inflating the importance of a concept simply because it appears in multiple encodings. The workflow proceeded in four steps: near-zero-variance filtering, dependency-based redundancy screening, representative-variable retention within redundant groups, and an association screening check using chi-square tests. The resulting final predictor set used for CART is also summarized.
First, near-zero-variance screening was performed to identify predictors with limited discriminative information due to extreme category imbalance. Such variables can induce unstable splits and may produce terminal-node rules driven by rare categories rather than generalizable mechanisms. Table 4 reports the frequency ratio and percent unique diagnostics. Most predictors did not meet the near-zero-variance criterion, indicating sufficient variability for partitioning. However, road alignment 2, school zone, senior zone, and driver DUI were flagged as near-zero-variance variables (Table 4). The zone indicators exhibited extremely large frequency ratios, suggesting that the minority category was too rare to support reliable partitioning. Road alignment 2, which represents an alternative alignment encoding, was similarly dominated by a single category. These near-constant indicators were excluded from subsequent redundancy screening and CART estimation to prevent scenario rules from hinging on sparse categories that do not robustly differentiate crash contexts in the sample.
Second, after removing near-zero-variance indicators, redundancy among roadway descriptor variables was evaluated because TAAS provides paired or alternative encodings for certain road environment concepts. If highly overlapping variables are simultaneously included in CART, the model may allocate splits across redundant fields, reducing interpretability and complicating scenario communication even when the underlying concept is essentially the same. To address this, categorical dependency screening was applied to identify highly overlapping variable groups. Table 5 summarizes the redundancy groups identified: road characteristics 1 versus road characteristics 2, intersection type 1 versus intersection type 2, and road alignment 1 versus road alignment 3.
Third, within each redundancy group, a single representative variable was retained to avoid duplicated information in downstream modeling. The retention decisions are reported in Table 6. Road characteristics 2 was retained (road characteristics 1 excluded), intersection type 2 was retained (intersection type 1 excluded), and road alignment 3 was retained (road alignment 1 excluded). This step ensures that each roadway concept is represented once in the feature space, thereby improving the interpretability and reproducibility of rule-based terminal-node scenarios.
Fourth, chi-square tests of independence were conducted between injury severity and each remaining predictor as an association screening check after near-zero-variance filtering and redundancy control. The results are reported in Table 7, including chi-square statistics, degrees of freedom, and p-values. Given the large sample size, statistical significance is expected even for modest practical association; thus, Table 7 is interpreted as confirming that retained predictors are not trivially unrelated to injury severity rather than providing a causal ranking. The results indicate meaningful variation in severity distributions across several operating-context and behavior-related variables. Notably, driver behavior type exhibits a large chi-square statistic, suggesting substantial severity differences across maneuver contexts. Road type and involved party type also show comparatively large statistics, indicating that facility class and vehicle mix in local areas are closely aligned with severity differences. Day/night and traffic-law violations exhibit strong associations as well, consistent with visibility-related mechanisms and behavior-related risk escalation. Weather conditions and road surface conditions remain statistically associated with severity, supporting their inclusion as context variables that can constrain visibility and braking performance.
Finally, the integrated screening outputs were consolidated into the predictor set used to grow and prune the CART models. Table 8 summarizes retained predictors by domain and lists excluded variables removed due to near-zero-variance filtering or redundancy control. The final natural environment set includes day/night, weather conditions, and road surface conditions. The road environment set includes road type, road characteristics 2, intersection type 2, and road alignment 3. Pedestrian factors include age group, gender, and behavior type, while driver factors include age group, gender, years of license experience, behavior type, and traffic-law violations. Vehicle type was retained as the perpetrator vehicle factor. Excluded variables correspond directly to the near-zero-variance results in Table 4 and the redundancy decisions in Table 5 and Table 6, including road alignment 2, school zone, senior zone, driver DUI, and the redundant encodings of road characteristics 1, intersection type 1, and road alignment 1. This finalized predictor set was applied consistently in the CART estimation steps reported in Section 3.3 and Section 3.4 to ensure that extracted terminal-node scenarios reflect substantive safety mechanisms rather than database redundancy or near-constant coding artifacts.

3.4. High-Risk Factor Combinations for Fatal Outcomes in Rural Elderly-Pedestrian Crashes: CART Results Including Speed-Related Violations

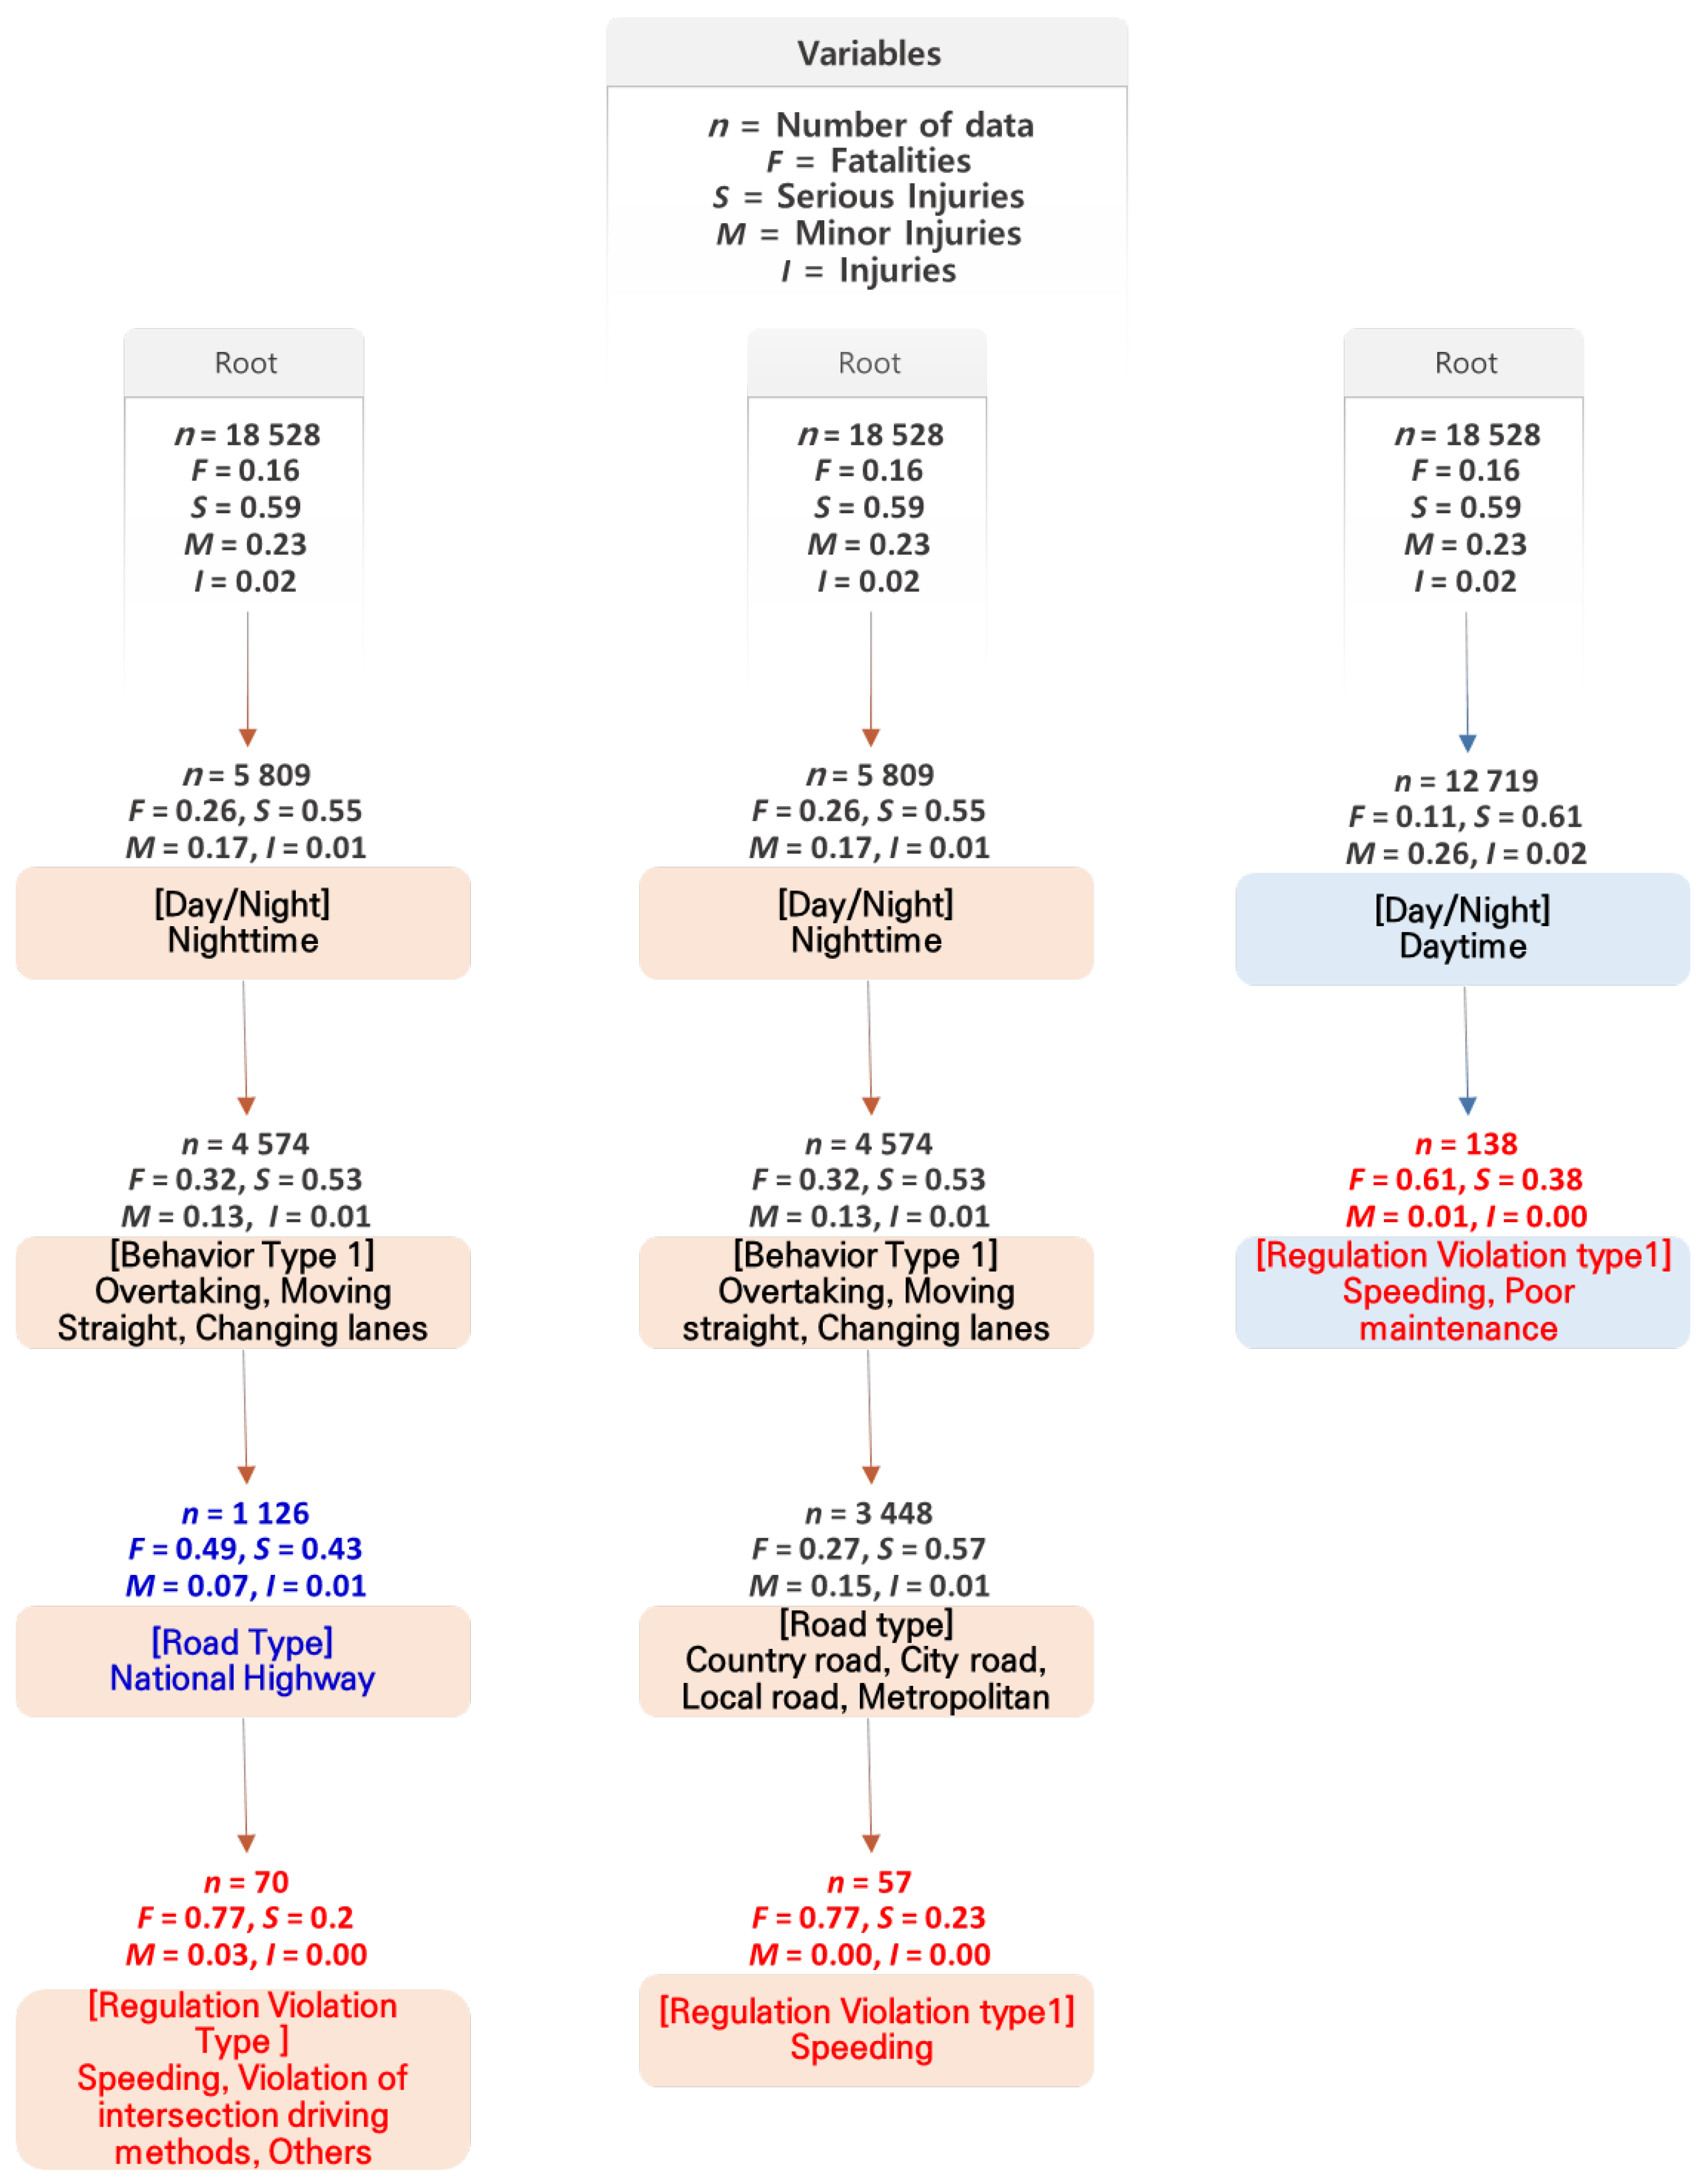
Figure 2 summarizes the pruned CART model estimated with the full predictor set, including speed-related violations. At the root node, fatal injuries accounted for approximately 16% of crashes, while serious injuries dominated the overall distribution. The first split was day/night, indicating that visibility and nighttime operating conditions were the primary discriminator of severity. Under nighttime conditions, the fatality rate increased relative to daytime conditions, showing that comparable crash contexts became substantially more lethal at night for older pedestrians. Within the nighttime branch, the next split was driver behavior type, and the branch involving overtaking, lane changing, or going straight showed a higher concentration of fatal outcomes, indicating the importance of maneuver-related conflict in low-visibility settings. Subsequent splits by road type further highlighted how the road environment contributed to severity escalation under nighttime and maneuver-related conditions. Across the most lethal terminal nodes, speeding-related violations emerged as the dominant escalator, either as a stand-alone mechanism or in combination with nighttime exposure and maneuver-related conflict. A severe daytime pathway associated with speeding also remained visible, indicating that impact speed mechanisms can generate an elevated fatality profile even without nighttime constraints. Overall, Figure 2 indicates that speeding was the most direct severity escalator in this dataset, while nighttime exposure and maneuver-related driving patterns acted as upstream multipliers that amplified the consequences of speeding within specific rule-defined subgroups and thus provided operational targets for intervention.

3.5. High-Risk Factor Combinations Beyond Speed: CART Results After Excluding Speed-Related Variables

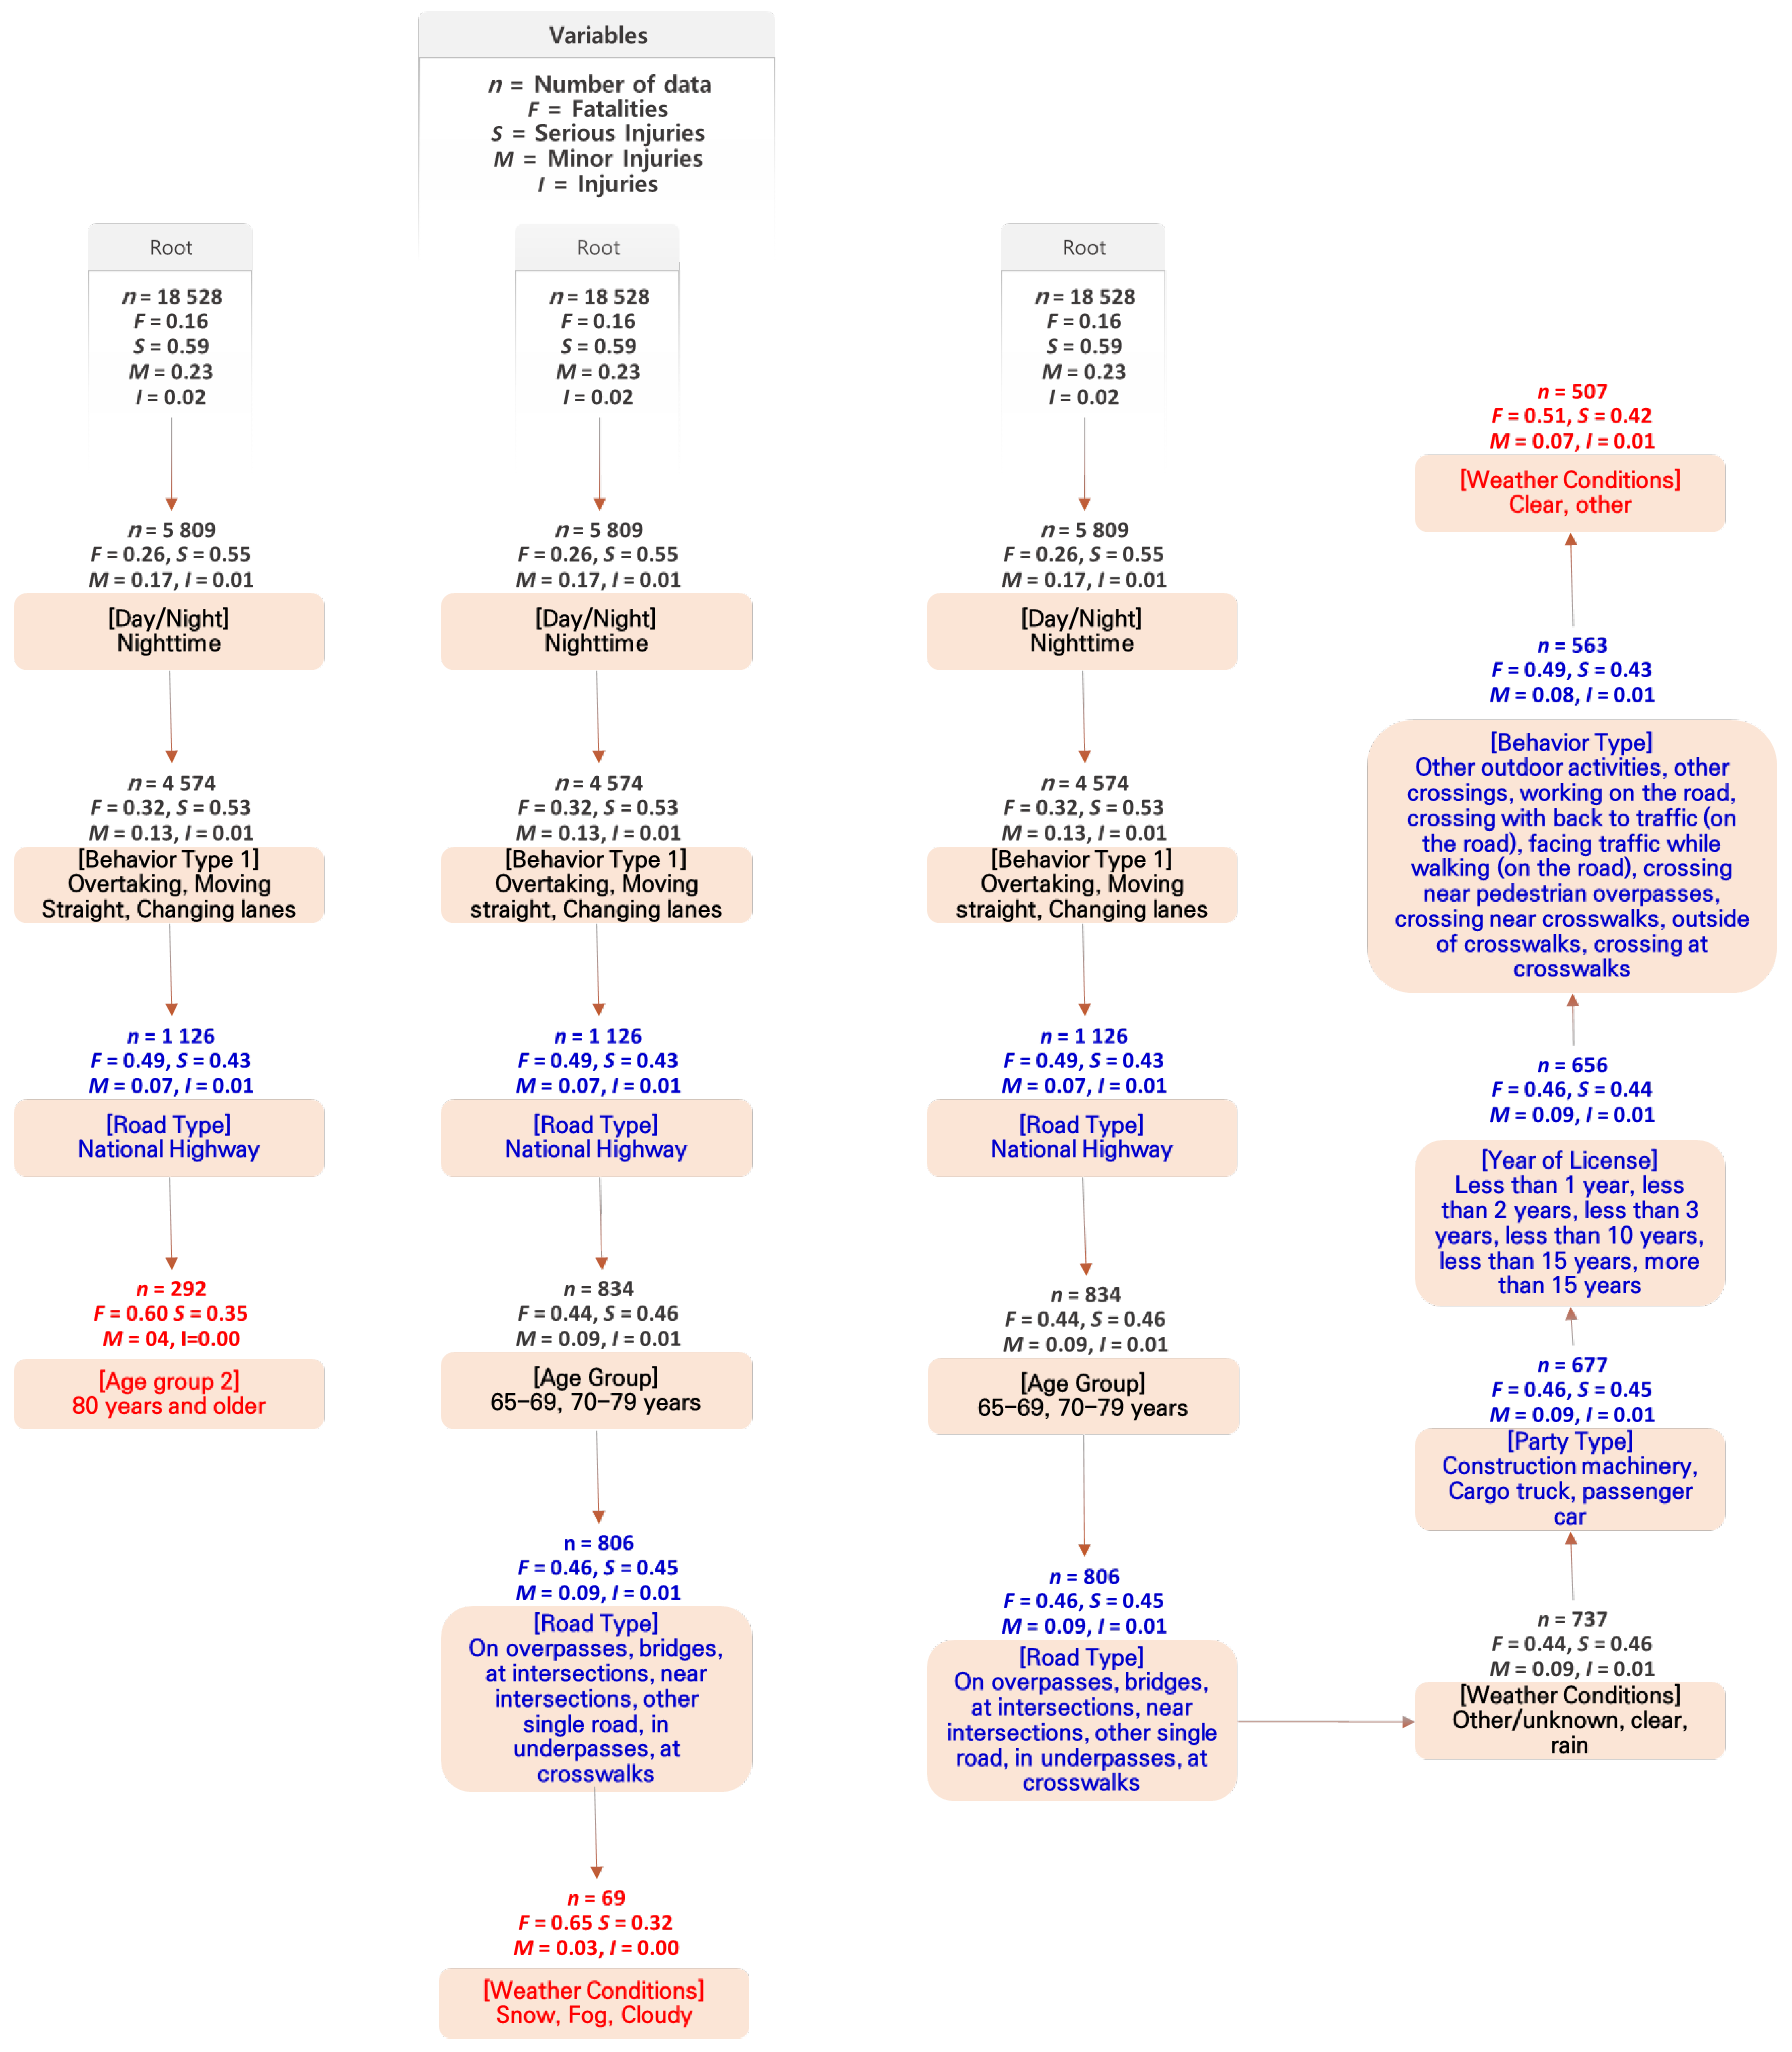
To clarify which mechanisms remained salient when speed-related predictors were not available for splitting, a second CART model was estimated after excluding speed-related variables. Figure 3 summarizes this speed-excluded tree and highlights severe-outcome combinations that persisted beyond speed-related violations. The root node severity profile remained unchanged, but explanatory power shifted toward visibility, conflict setting, and vulnerability mechanisms that still formed highly lethal stacked contexts. As in the speed-included model, the first split in Figure 3 was day/night. Nighttime conditions remained the dominant upstream discriminator, confirming that visibility-limited operating environments are a fundamental driver of severe outcomes for elderly pedestrians in local areas. Within the nighttime branch, driver behavior type again structured the high-severity pathway, and the branch involving overtaking, lane changing, or going straight continued to show a higher fatal share, indicating that maneuver-related conflict remained structurally important even without speed-related predictors.
Within this non-speed framework, Figure 3 highlights severe profiles driven by vulnerability, visibility degradation, and conflict exposure. A pronounced vulnerability pathway emerged when nighttime and maneuver-related contexts occurred on national roads and the pedestrian was aged 80 years or older, indicating that advanced age functioned as a strong vulnerability amplifier under low-visibility and conflict-prone operating conditions. A second pathway appeared when the same nighttime and maneuver-related context on national roads was combined with conflict-prone road settings and adverse visibility weather, consistent with a mechanism in which detection and reaction were degraded where vehicle–pedestrian interactions were concentrated. A third pathway persisted even under clearer weather conditions when pedestrian activity patterns implied high exposure to vehicle conflicts, showing that conflict mechanics and exposure patterns alone could sustain high lethality in local-area environments despite the absence of explicit speed-related splits. Overall, the speed-excluded CART results demonstrate that removing speed-related predictors did not eliminate the identification of high-fatality scenarios, but instead elevated the combined roles of nighttime exposure, maneuver-related driving context, very old pedestrian vulnerability, visibility-limiting weather, and conflict-prone roadway settings and exposure behaviors. These results support countermeasure prioritization beyond speed enforcement, including targeted nighttime conspicuity enhancement, conflict reduction around crosswalk and intersection influence areas, and focused protections for very old pedestrians in local-area operating environments.

3.6. Summary of Major Factors Affecting the Severity of Traffic Accidents Involving Elderly Pedestrians in Rural Areas

Table 9 summarizes representative high-severity combinations extracted from the CART results by separating them into speed-centered and non-speed pathways. Across pathways, severe outcomes are shaped by stacked scenarios in which a small set of operating conditions co-occur rather than by single factors acting in isolation. In the speed-centered pathway, speeding functions as the most direct severity escalator, and its influence becomes substantially stronger when embedded in nighttime conditions and maneuver-related driving contexts. The daytime-speeding pathway further indicates that impact speed alone can yield a fatality profile far above baseline, even without nighttime constraints.
The non-speed pathways clarify what remains highly lethal even when speed-related variables are excluded. Nighttime continues to define high-fatality profiles, and visibility-limiting weather appears as an additional escalator within nighttime branches. Heavy-vehicle involvement together with pedestrian exposure behaviors such as roadway walking and crossing forms a high-risk structure under nighttime conditions, consistent with local-area environments where sidewalk discontinuity and limited separation increase vehicle–pedestrian conflicts and where heavy vehicles can intensify injury outcomes through mass and blind-spot characteristics [24,25].
Table 10 contrasts marginal patterns from descriptive summaries with the interaction-driven structures highlighted by CART factor combination analysis. The comparison indicates that rule-based scenario extraction concentrates attention on a narrower set of conditions that repeatedly form dominant high-fatality pathways, thereby providing operationally interpretable targets for enforcement, operations, and engineering countermeasures beyond what is typically conveyed by marginal tabulations.

3.7. Model Performance and Variable Importance

After cost-complexity pruning and 10-fold cross-validation, the final CART model had a tree depth of 8 and 11 terminal nodes. The baseline accuracy obtained by predicting the most frequent outcome category, serious injury, was 59.8%. Because the primary objective of this study was not to maximize individual-level prediction accuracy but to identify interpretable high-risk scenarios, model performance was evaluated mainly in terms of the interpretability and stability of the extracted terminal-node rules rather than overall classification accuracy alone. From this perspective, the final model was considered suitable for scenario extraction.
The hierarchical branching structure of CART also allows multivariate interactions to be expressed naturally as conditional if–then rules. For example, a split on day/night followed by a split on road type reflects a combined effect in which nighttime conditions and higher-speed roadway environments jointly contribute to crash severity. Unlike regression coefficients, which estimate the average effect of a single variable, this structure explicitly conveys nonlinear interactions among multiple variables under specific combinations of conditions.
To further support the robustness of the findings, variable importance values from the CART model were also examined. The results showed that day/night had the highest importance, followed by road type, driver behavior type, traffic-law violation type, vehicle type, and pedestrian behavior type. These findings described in Table 11 suggest that nighttime conditions and roadway environment are the most influential factors affecting injury severity in elderly-pedestrian crashes, which is consistent with the scenario-based results.

4. Discussion

This study indicates that injury severity for elderly pedestrians in local environments, including rural and small-town settings, is best understood as an interaction-driven process. The same factor can have different implications depending on the surrounding operating context, and risk tends to concentrate in specific situational patterns defined by time, place, and behavior. The rule-based structure produced by CART highlights how visibility, speed, environment, maneuvering, vehicle mass, and pedestrian exposure combine to generate disproportionately severe outcomes. This interpretation is consistent with how local-area safety problems are typically observed and managed, where interventions are often implemented on targeted corridors and road segments rather than uniformly across the network. CART was used to derive interpretable if–then scenarios that can be clearly communicated to practitioners and linked to countermeasure packages. The objective was not to maximize model complexity, but to obtain stable and communicable scenarios using cost-complexity pruning and cross-validation to reduce overfitting [22,23]. The scenario-based sensitivity analysis further complements interpretability by translating rule-defined subgroups into estimated shifts in severity distributions under hypothetical changes in key conditions, thereby linking scenario discovery to decision-oriented interpretation.
This study selected the CART model to derive interpretable if–then rules. Although Random Forest and XGBoost generally provide higher predictive accuracy through ensemble averaging, their decision structures are less easily translated into explicit rule paths, which may limit interpretability in scenario-based communication. Previous research has shown that combining XGBoost with SHAP can provide both high predictive accuracy and interpretability in the analysis of elderly-pedestrian crashes [9]. Future research should therefore consider using CART-based rule extraction together with XGBoost-SHAP analysis to cross-validate the findings. The persistence of high-fatality patterns even after excluding speed-related variables suggests that crash severity mechanisms are multi-layered. Possible contributing factors include (1) the spatial concentration of heavy-vehicle traffic on certain local road segments at night, (2) exposure patterns in which the lack of pedestrian facilities in local areas forces elderly pedestrians to walk on the roadway, and (3) reduced driver perception–reaction time under nighttime visibility constraints. These factors may act as contextual contributors to severe outcomes even when speed-related predictors are not explicitly included in the model.
Several methodological points are worth noting when interpreting the workflow and model outputs. Redundancy control should be emphasized as a precondition for repeated association screening when crash databases contain overlapping encodings. Hypothesis-testing language should also be used precisely, with p-values above the significance threshold interpreted as failure to reject the null hypothesis rather than acceptance of independence [21]. Because most predictors are categorical, dependence and association terminology is more appropriate than linear-correlation language. The handling of near-zero-variance predictors also benefits from explicit robustness checks, since automatic exclusion of rare indicators can remove operationally meaningful conditions. Reporting parallel tree results with and without near-zero-variance exclusions may help justify variable removal if scenario rules and performance remain stable. In addition, model performance should be interpreted against simple baselines and, where possible, at least one conventional parametric comparator, in order to show that scenario extraction provides decision value beyond predicting the most common severity class or relying only on average effects from ordered-response models. Finally, clarity regarding database-specific field definitions is essential. Variables such as alternative alignment encodings should be described with explicit definitions, category structures, and screening rationale, supported by a coding to explain the results [35].
Limitations should be considered when interpreting the results. First, the analysis relies on police-reported crash records, which may reflect reporting variability, underreporting, and severity misclassification. Minor injuries may be underreported in police records, and if misclassification of crash severity follows a systematic pattern, selection bias may occur. Second, the TAAS dataset does not include direct variables related to lighting infrastructure, such as the presence of streetlights or illumination level. Therefore, the “nighttime condition” in this study refers to natural lighting conditions after sunset, and the protective effect of artificial lighting should be examined separately in future research. Third, spatial heterogeneity was not explicitly modeled because crashes from local areas across the country were analyzed together without reflecting regional differences in roadway function, pedestrian facility level, or population aging. Fourth, the absence of exposure data, such as traffic volume and pedestrian volume, limits the ability to distinguish crash occurrence from exposure-adjusted risk. Fifth, temporal stability was not tested, although the effects of risk factors may vary over time. Finally, GIS-based spatial analysis was not conducted in this study. Although GIS is often used in transportation safety research to visualize the spatial distribution of risk and support location-based interpretation [15], the TAAS dataset provides location information only at the administrative district level and does not include precise geographic coordinates, which limits detailed spatial mapping. In addition, the main purpose of this study was to identify interpretable combinations of risk factors and intervention-oriented scenarios using integrated crash data from local areas across the country, rather than to examine the spatial clustering of individual crash locations. Future research may combine CART-based scenario analysis with GIS-based spatial analysis to provide a more comprehensive explanation of both where and why severe elderly-pedestrian crashes occur.
Future work should strengthen validation through temporal holdout testing and external benchmarking, and should stratify analyses by functional class, access control, and pedestrian accessibility. Linking crash records with clinical or insurance sources could improve severity labeling, while incorporating exposure measures such as traffic volume, pedestrian activity, and land-use context would support more precise targeting guidance.

5. Conclusions

This study examined injury severity in 18,528 vehicle-to-pedestrian crashes involving older adults aged 65 years and older in Korean local areas during 2012–2021. The results showed that severe outcomes were concentrated in a limited set of stacked-risk scenarios rather than being explained by single factors alone. Across the analysis, nighttime conditions, higher-speed roadway environments, maneuver-related driving behavior, and pedestrian exposure patterns consistently emerged as major contributors to severe outcomes. CART-based scenario extraction clarified how these conditions combined to produce the most lethal crash situations, and scenario-based sensitivity analysis translated those situations into intervention-relevant shifts in injury severity distributions under counterfactual control of key conditions.
More specifically, the CART results showed that the most critical fatality pathway in local areas was speed-centered. In the speed-included model, the highest-fatality scenarios were characterized by nighttime travel on higher-speed facilities combined with speeding-related violations and hazardous driving maneuvers, particularly overtaking and lane changing. This result indicates that speed control is the most influential leverage point for reducing fatal outcomes in local-area environments. Accordingly, targeted speed management should be prioritized on rural corridors and road segments with older pedestrian activity through enforceable speed limits, automated enforcement where feasible, and geometric or traffic-calming measures that reduce operating speeds near pedestrian generators.
The results also showed that substantial fatality risk persisted even when speed-related predictors were excluded from the model. In the speed-excluded scenarios, nighttime exposure remained the dominant upstream condition, while very old pedestrian age, visibility-limiting weather, conflict-prone roadway settings, heavy-vehicle involvement, and pedestrian behaviors such as roadway walking and crossing continued to define highly lethal conditions. This finding suggests that severe elderly-pedestrian crashes in local areas cannot be understood only through explicit speed-related violations. Rather, they reflect layered interactions among visibility constraints, roadway conflict environments, vehicle characteristics, and pedestrian exposure. For this reason, local-area safety strategies should combine speed measures with visibility enhancement and conflict reduction interventions, including improved nighttime lighting, enhanced pavement marking reflectivity, pedestrian separation facilities, and continuity of pedestrian travel paths in sections where sidewalks are discontinuous.
The model performance results also support the usefulness of the proposed framework for scenario extraction. After cost-complexity pruning and 10-fold cross-validation, the final CART model had a tree depth of 5 and 12 terminal nodes, and approximately 68% of the nodes in the full candidate tree were removed through pruning. The overall accuracy was 55.3%, compared with 48.0% for the baseline model, and the balanced accuracy was 45.8%. Although the objective of this study was not to maximize predictive accuracy, these results indicate that the model achieved an acceptable level of performance for identifying stable and interpretable high-risk combinations. In addition, variable-importance results showed that day/night had the highest importance, followed by road type, driver behavior type, traffic-law violation type, vehicle type, and pedestrian behavior type. This result further confirms that nighttime conditions and roadway environment are central in explaining severe elderly-pedestrian crash outcomes in local areas.
Several practical implications for roadway design and local safety management can be drawn directly from these results. On national highways and similar higher-speed roads passing through areas with a high concentration of elderly residents, design standards should place greater emphasis on nighttime visibility through LED street lighting and more reflective pavement markings. In sections where pedestrian facilities are discontinuous, shoulder paving and protective roadside facilities should be considered in roadway design guidelines. In areas with concentrated truck and construction vehicle traffic, the principle of spatiotemporal separation between pedestrians and vehicles should be incorporated into design practice. It is also recommended that local-area road safety standards consider expanding elderly protection zones and village protection areas, together with physical traffic-calming measures.
This study differs from previous research in three main respects [17,18,36]. First, it explicitly defines legally classified local areas as the unit of analysis, thereby addressing the limitation of directly applying findings from urban-centered studies to local-area environments. Second, it proposes a four-step integrated screening framework tailored to crash datasets with overlapping encodings and substantial noise, which supports more stable extraction of high-risk scenarios. Third, it provides intervention-oriented evidence by estimating how injury severity distributions may shift under counterfactual changes in specific conditions. In this sense, the study offers a practical approach for converting administrative crash records into decision-support outputs tailored to elderly-pedestrian safety in local areas, which is particularly relevant for rural administrations operating under constrained resources and rapid population aging.
Finally, the framework proposed in this study may also be extended to other vulnerable road-user groups, including bicyclists, children, and motorcyclists. Future research should test the framework in other crash contexts, compare it with alternative machine learning approaches, and integrate it with behavioral pathway analysis or GIS-based spatial analysis to provide a more comprehensive explanation of both where and why severe crashes occur.

Author Contributions

Conceptualization, D.-y.L. and H.-j.Y.; methodology, D.-y.L. and H.-j.Y.; investigation, D.-y.L.; data curation, D.-y.L. and H.-j.Y.; writing—original draft preparation, H.-j.Y.; writing—review and editing, D.-y.L.; visualization, H.-j.Y.; supervision, D.-y.L.; funding acquisition, D.-y.L. All authors have read and agreed to the published version of the manuscript.

Funding

This work was conducted as part of an independent research project by the Korea Transport Institute (KOTI). The task number was not assigned separately because it was a task performed internally.

Institutional Review Board Statement

Not applicable. This study analyzed de-identified secondary administrative crash records and did not involve human subject recruitment or intervention.

Informed Consent Statement

Not applicable.

Data Availability Statement

The crash records analyzed in this study were obtained from the Traffic Accident Analysis System (TAAS) of the Korea Road Traffic Authority (KoROAD) and are not publicly available due to privacy and legal restrictions. Access may be granted by KoROAD upon request and approval. The analysis code and derived, non-identifiable data products can be provided by the corresponding author upon reasonable request, subject to permission from the data provider.

Acknowledgments

The authors would like to thank the members of the research team for their guidance and support throughout this project.

Conflicts of Interest

Author Ho-jun Yoo was employed by the company RoadKorea Inc. The remaining authors declare that the research was conducted in the absence of any commercial or financial relationships that could be construed as a potential conflict of interest. The authors declare no conflicts of interest.

Abbreviations

The following abbreviations are used in this manuscript:
OECDOrganisation for Economic Co-operation and Development
CARTClassification and Regression Tree
KoROADKorea Road Traffic Authority
DUIDriving Under the Influence
TAASTraffic Accident Analysis System
NZVNear-Zero Variance
H1Alternative Hypothesis
H0Null Hypothesis

References

  1. Statistics Korea (KOSTAT). Population Projections for Korea: 2022–2072; Statistics Korea: Daejeon, Republic of Korea, 2023. [Google Scholar]
  2. World Health Organization (WHO). Global Status Report on Road Safety 2023; WHO: Geneva, Switzerland, 2023. [Google Scholar]
  3. Park, S.-H.; Bae, M.-K. Exploring the determinants of the severity of pedestrian injuries by pedestrian age: A case study of Daegu Metropolitan City, South Korea. Int. J. Environ. Res. Public Health 2020, 17, 2358. [Google Scholar] [CrossRef] [PubMed]
  4. Behnood, A.; Mannering, F. Determinants of bicyclist injury severities in bicycle–vehicle crashes: A random parameters approach with heterogeneity in means and variances. Anal. Methods Accid. Res. 2017, 16, 35–47. [Google Scholar] [CrossRef]
  5. Cerwick, D.M.; Gkritza, K.; Shaheed, M.S.; Hans, Z. A comparison of the mixed logit and latent class methods for crash severity analysis. Anal. Methods Accid. Res. 2014, 3–4, 11–27. [Google Scholar] [CrossRef]
  6. Sun, Z.; Wang, J.; Chen, Y.; Lu, H. Influence factors on injury severity of traffic accidents and differences in urban functional zones: The empirical analysis of Beijing. Int. J. Environ. Res. Public Health 2018, 15, 2722. [Google Scholar] [CrossRef] [PubMed]
  7. Jung, S.; Qin, X.; Oh, C. Improving strategic policies for pedestrian safety enhancement using classification tree modeling. Transp. Res. Part A Policy Pract. 2016, 85, 53–64. [Google Scholar] [CrossRef]
  8. Guo, M.; Yuan, Z.; Janson, B.; Peng, Y.; Yang, Y.; Wang, W. Older pedestrian traffic crashes severity analysis based on an emerging machine learning XGBoost. Sustainability 2021, 13, 926. [Google Scholar] [CrossRef]
  9. Wang, H.; Liang, G. Analysis of injury severity in elderly pedestrian traffic accidents based on XGBoost. Appl. Sci. 2025, 15, 9909. [Google Scholar] [CrossRef]
  10. Lu, W.; Liu, J.; Fu, X.; Yang, J.; Jones, S. Integrating machine learning into path analysis for quantifying behavioral pathways in bicycle-motor vehicle crashes. Accid. Anal. Prev. 2022, 168, 106622. [Google Scholar] [CrossRef]
  11. Fang, T.; Xu, F.; Zou, Z. Causal factors in elderly pedestrian traffic injuries based on association analysis. Appl. Sci. 2025, 15, 1170. [Google Scholar] [CrossRef]
  12. Macioszek, E.; Granà, A.; Krawiec, S. Identification of factors increasing the risk of pedestrian death in road accidents involving a pedestrian with a motor vehicle. Arch. Transp. 2023, 65, 7–25. [Google Scholar] [CrossRef]
  13. Tamakloe, R.; Zhang, K.; Kim, I. Temporal instability of the determinants of fatal/severe elderly pedestrian injury outcomes in intersections and non-intersections before, during, and after the COVID-19 pandemic. Accid. Anal. Prev. 2024, 205, 107676. [Google Scholar] [CrossRef]
  14. Zhang, K.; Chen, B.; Tamakloe, R.; Bai, Y.; Kim, I. Does the streetscape built environment matter in explaining crash injury severity among older adults? J. Transp. Geogr. 2025, 131, 104540. [Google Scholar] [CrossRef]
  15. Hu, L.; Wu, X.; Huang, J.; Peng, Y.; Liu, W. Investigation of clusters and injuries in pedestrian crashes using GIS in Changsha, China. Saf. Sci. 2020, 127, 104710. [Google Scholar] [CrossRef]
  16. Wang, Z.; Guo, H.; Zhang, C.; Hu, Z.; Zhou, F.; Sun, Z.; Sherony, R.; Bao, S. Investigating pedestrian crash injury patterns: A comparative study of children and non-children. Accid. Anal. Prev. 2025, 222, 108223. [Google Scholar] [CrossRef] [PubMed]
  17. Saha, B.; Fatmi, M.R.; Rahman, M.M. Modelling injury severity of victims in collisions involving public transit in Dhaka, Bangladesh. Int. J. Crashworthiness 2022, 28, 13–20. [Google Scholar] [CrossRef]
  18. Iqra, S.A.; Huq, A.S.; Iqra, S.H. Factors influencing pedestrian crashes in Dhaka City: A multiple correspondence analysis approach. In Lecture Notes in Civil Engineering; Springer: Singapore, 2024; pp. 201–211. [Google Scholar] [CrossRef]
  19. Chang, L.-Y.; Chien, J.-T. Analysis of driver injury severity in truck-involved accidents using a non-parametric classification tree model. Saf. Sci. 2013, 51, 17–22. [Google Scholar] [CrossRef]
  20. Mannering, F.L.; Shankar, V.; Bhat, C.R. Unobserved heterogeneity and the statistical analysis of highway accident data. Anal. Methods Accid. Res. 2016, 11, 1–16. [Google Scholar] [CrossRef]
  21. Wang, J.; Ma, S.; Jiao, P.; Ji, L.; Sun, X.; Lu, H. Analyzing the risk factors of traffic accident severity using a combination of random forest and association rules. Appl. Sci. 2023, 13, 8559. [Google Scholar] [CrossRef]
  22. Liu, C.; Sharma, A. Using the multivariate spatio-temporal Bayesian model to analyze traffic crashes by severity. Anal. Methods Accid. Res. 2018, 17, 14–31. [Google Scholar] [CrossRef]
  23. Korea Road Traffic Authority (KoROAD). Traffic Accident Statistics (Yearbook/Annual Report). Available online: https://taas.koroad.or.kr/ (accessed on 30 December 2025).
  24. Korea Road Traffic Authority (KoROAD). Traffic Accident Analysis System (TAAS). Available online: https://taas.koroad.or.kr/sta/acs/exs/typical.do?menuId=WEB_KMP_OVT_UAS_ASA (accessed on 30 December 2025).
  25. Zhang, S.; Khattak, A.; Matara, C.M.; Hussain, A.; Farooq, A. Hybrid feature selection-based machine learning classification system for the prediction of injury severity in single and multiple-vehicle accidents. PLoS ONE 2022, 17, e0262941. [Google Scholar] [CrossRef] [PubMed]
  26. Korea Road Traffic Authority (KoROAD). TAAS User Guide/Data Dictionary (1st Party/2nd Party Definitions and Variable Codes). Available online: https://taas.koroad.or.kr/ (accessed on 30 December 2025).
  27. Kuhn, M. Building predictive models in R using the caret package. J. Stat. Softw. 2008, 28, 1–26. [Google Scholar] [CrossRef]
  28. Hastie, T.; Tibshirani, R.; Friedman, J. The Elements of Statistical Learning; Springer: New York, NY, USA, 2001. [Google Scholar]
  29. Cramér, H. Mathematical Methods of Statistics; Princeton University Press: Princeton, NJ, USA, 1946. [Google Scholar]
  30. Agresti, A. Categorical Data Analysis, 3rd ed.; Wiley: Hoboken, NJ, USA, 2013. [Google Scholar]
  31. Wasserstein, R.L.; Lazar, N.A. The ASA statement on p-values: Context, process, and purpose. Am. Stat. 2016, 70, 129–133. [Google Scholar] [CrossRef]
  32. McCullagh, P. Regression models for ordinal data. J. R. Stat. Soc. Ser. B 1980, 42, 109–142. [Google Scholar] [CrossRef]
  33. Breiman, L.; Friedman, J.H.; Olshen, R.A.; Stone, C.J. Classification and Regression Trees; Wadsworth: Belmont, CA, USA, 1984. [Google Scholar]
  34. Kuhn, M.; Johnson, K. Applied Predictive Modeling; Springer: New York, NY, USA, 2013. [Google Scholar]
  35. Beam, A.L.; Manrai, A.K.; Ghassemi, M. Challenges to the reproducibility of machine learning models in health care. JAMA 2020, 323, 305–306. [Google Scholar] [CrossRef] [PubMed]
  36. Homayoun, S.; Milad, J.; Mina, G.; Parvin, S. Predictors of pre-hospital vs. hospital mortality due to road traffic injuries in an Iranian population: Results from Tabriz integrated road traffic injury registry. BMC Emerg. Med. 2022, 22, 37. [Google Scholar] [CrossRef] [PubMed]
Figure 1. Step-by-step research workflow for data preparation, variable screening, CART modeling, and scenario-based sensitivity analysis.
Standards 06 00015 g001
Figure 2. CART-derived high-risk terminal-node scenarios for fatal outcomes (including speed-related predictors).
Standards 06 00015 g002
Figure 3. CART-derived high-risk factor combinations for fatal outcomes after excluding speed-related predictors.
Standards 06 00015 g003
Table 1. Variable inventory extracted from crash records.
Main CategorySubcategoryRemarks
Traffic Accident OverviewDate and Time of Occurrence-
Day/Night
Day of the Week
Location(City/District)
Weather Conditions
Road Surface Conditions
Accident Details(Casualties)Number of fatalities, serious injuries, minor injuries, injury reports
Traffic Accident PartiesType of Accident-
GenderInvolved parties: 1st party, 2nd party
AgeInvolved parties: 1st party, 2nd party
Student AccidentInvolved parties: 1st party, 2nd party
Years Since License Issued1st Party
Degree of Bodily InjuryInvolved parties: 1st party, 2nd party
Driving Under Influence1st Party
Violation of Regulations1st Party
Behavior TypeInvolved parties: 1st party, 2nd party
Injury LocationInvolved parties: 1st party, 2nd party
Traffic Accident VehiclesVehicle Type1st Party
Vehicle Use1st Party
Traffic Accident Road EnvironmentRoad Type-
Road Characteristics
Intersection Type
Road Alignment
Median Separation Facility
School Zone
Elderly Protection Zone
The 1st party refers to the perpetrator in the traffic accident, while the 2nd party refers to the victim.
Table 2. Trends of rural elderly-pedestrian crashes by injury severity (2012–2021).
YearFatalSerious InjuriesMinor InjuriesReported InjuriesTotal Accidents
20123271046305261704
20133201056297151688
20143041042333291708
20153191084361381802
20162931093362371785
20173161288550452199
20182911187505402023
20192641255557402116
2020239968475511733
2021202995540331770
Total287511,014428535418,528
Percentage15.559.523.11.9100
Increase rate
(2012~2021)
−38.2−4.977.026.93.9
Table 3. Framework for interpreting severity-related factors by domain.
Major CategorySubcategoryDetailed CategoryRelated Factors
Natural Environmental FactorsDay/NightNightDriver Visibility Constraints
Weather ConditionsFog, Overcast, RainDriver Visibility Constraints
Road Surface ConditionsWetness/Humidity, Frost/IceDriver Braking Constraints
Road Environmental FactorsRoad TypeNational Road, Local RoadHigh Traffic Speed
Road CharacteristicsOverpass, Bridge, CrosswalkLack of Separation Between Sidewalks and Roads, Vehicle–Pedestrian Conflict
Driver Human FactorsBehavior TypeLane Change, Overtaking, TurningTemporary High Speed, Temporary Visibility Constraints
Regulation ViolationsSpeeding, Failure to Maintain Safe Distance, Crossing Center Line, Overtaking Prohibition ViolationTemporary High Speed, Temporary Visibility Constraints
Table 4. Variance analysis results for candidate predictors (NZV screening).
VariableVariable Values (Summary)Frequency RatioPercent UniqueNZV
Day/NightDaytime, Nighttime2.1895330.010794False
Weather ConditionsClear, Cloudy, Rain, Fog, Snow, Other/Unknown14.34960.032383False
Road Surface ConditionsDry, Frost/Ice, Snow Cover, Wet/Humid, Thawing, Other10.246460.026986False
Age of First PartyUnder 20 Years, 21–29 Years, 30–39 Years, 40–49 Years, 50–59 Years, 60–64 Years, 65–69 Years, 70–79 Years, 80 Years and Above1.312160.48575False
Age of Second Party65–69 Years, 70–79 Years, 80 Years and Above1.7158540.016192False
Gender of First PartyMale, Female3.4552610.016192False
Gender of Second PartyMale, Female1.189290.016192False
Years of License HeldLess than 1 Year, Less than 2 Years, ~, 15 Years and Above5.458160.053792False
Type of PartiesPassenger Car, Cargo Truck, Van, Motorcycle, Moped, Construction Equipment, Special Vehicles, Agricultural Machinery, Personal Mobility Device (PM), All-Terrain Vehicle (ATV)2.1308120.070164False
Road TypeNational Road, Local Road, Special/Metropolitan Road, City Road, County Road1.0161660.026986False
Road Characteristics 1On Bridge, At Intersection, Near Intersection, At Intersection Crosswalk, Other Single, In Underpass (Road), Inside Tunnel, Near Crosswalk, On Crosswalk1.7433550.016192False
Road Characteristics 22.9673630.05937False
Intersection Type 1Intersection—Three-Way; Intersection—Four-Way; Intersection—Five-Way or More; Intersection—Roundabout; Not an Intersection; Other Unknown1.8768850.016192False
Intersection Type 23.7684140.032383False
Road Alignment 1Straight, Curve (Right/Left), Downhill/Uphill/Level10.134230.016192False
Road Alignment 220.108960.021589True
Road Alignment 314.054730.026986False
School ZoneYes, No335.87270.010794True
Senior ZoneYes, No925.40.010794True
Behavior Type of First PartyWhile Going Straight, While Turning, While Reversing, While Starting, While Parking, While Waiting in Traffic, While Making a U-turn, While Changing Lanes, While Overtaking, Other/Unknown7.0814510.070164False
Behavior Type of Second PartyOther, Engaged in Other Roadside Activities, While Crossing Other, While Walking Near the Road Edge, While Performing Road Work, While Using Amusement Equipment, While Playing on the Road, While Working on the Road, While Walking with Back to Traffic, While Walking Facing Traffic, While Walking on Sidewalk, While Boarding, While Alighting, While Crossing Near Overpass, While Crossing on Crosswalk, While Crossing Near Crosswalk, While Crossing Outside Crosswalk, While Crossing on Crosswalk1.4011880.09715False
Violation of RegulationOverworking, Speeding, Violating Intersection Operation, Failing to Protect Pedestrians, Improper Turn, Failing to Slow Down or Stop, Signal Violation, Failing to Maintain Safe Distance, Failing to Drive Safely, Violating Overtaking Rules, Violating Overtaking Method, Crossing Central Line, Obstructing Traffic for Straight and Right Turn Vehicles, Failing to Yield, Lane Violation (Changing Lanes Violations), Violating Vehicle Maintenance Regulations, Pedestrian Fault, Other (Driver Violation)7.2167730.080959False
Table 5. Redundant variable groups identified by dependency screening.
GroupRedundant Variable Groups Identified by
Categorical Dependency Screening
1Road characteristics 1 & 2
2Intersection type 1 & 2
3Road alignment 1 & 3
Table 6. Selected and excluded variables among redundant groups.
GroupSelectedExcluded
1Road characteristics 2Road characteristics 1
2Intersection type 2Intersection type 1
3Road alignment 3Road alignment 1
Table 7. Chi-square test of independence between injury severity and predictors.
Independent VariableVariableχ2Degree of Freedomp-Value
Accident Type (Severity)
F = Fatalities
S = Serious Injuries
M = Minor Injuries
I = Injuries
Day/Night813.507935.089225 × 10−176
Weather condition181.5657151.148913 × 10−30
Road Surface Condition67.79467128.262698 × 10−10
Age Group 1657.6841241.932644 × 10−123
Age Group 2196.61266<2 × 10⁻¹⁶
Gender 1684.186761.586917 × 10−144
Gender 290.3689162.539835 × 10−17
License Experience 1343.9395271.140404 × 10−56
Involved Party Type 1870.686361.816642 × 10−159
Road Type877.1211124.693628 × 10−180
Road Characteristics 1101.262261.368176 × 10−19
Road Characteristics 2166.1895308.412481 × 10−21
Intersection Type 144.7099465.344205 × 10−08
Intersection Type 250.29701151.076713 × 10−05
Road Alignment 1151.732563.328311 × 10−30
Road Alignment 3210.3934122.319622 × 10−38
Action Type 11398.519361.361268 × 10−270
Action Type 2550.5498515.952763 × 10−85
Law Violation 1810.5564426.036496 × 10−143
Table 8. Independent variable selection results (final predictors for CART).
Dependent VariableIndependent Variable
Type ClassificationSelectedExcluded
Accident Type (Severity)
F = Fatalities
S = Serious Injuries
M = Minor Injuries
I = Injuries
Natural Environmental FactorsDay/night, Weather conditions, Road surface conditions-
Road Environmental FactorsRoad type, Road characteristics 2, Intersection type 2, Road alignment 3-
Victim (Pedestrian) Human FactorsAge group, Gender, Behavior typeRoad characteristics 1, Intersection type 1, Road alignment 1, Road alignment 2, Children’s protection zones, Elderly protection zones
Perpetrator (Driver) Human FactorsAge group, Gender, Years of license experience, Behavior type, Traffic violationsDriving under the influence
(DUI)
Perpetrator Vehicle FactorsVehicle type-
Table 9. Representative high-severity factor combinations from CART analysis (speed-included and speed-excluded pathways).
Major CategorySubcategoryDetailed CategoryRelated Factors
Speed-Centric Combination ①[Natural Environmental Factors](Day/Night) NightDriver visibility constraints
[Road Environmental Factors](Road Types) General National Road/Local Management RoadHigh traffic speed
[Driver (Operator) Human Factors](Behavior Type) Overtaking, Lane Changing, Going StraightDriver behavior
(Regulatory Violations) SpeedingDriver behavior
Speed-Centric Combination
[Natural Environmental Factors](Day/Night) Day
[Driver (Operator) Human Factors](Regulatory Violations) SpeedingHigh traffic speed
Non-Speed Combination ①[Natural Environmental Factors](Day/Night) NightDriver visibility constraints
(Weather Conditions) Snow, Fog, OvercastDriver visibility constraints
[Road Environmental Factors](Road Types) General National RoadHigh traffic speed
[Driver (Operator) Human Factors](Behavior Type) Overtaking, Lane Changing, Going StraightDriver behavior
Non-Speed Combination ②[Natural Environmental Factors](Day/Night) NightDriver visibility constraints
[Road Environmental Factors](Road Types) General National RoadHigh traffic speed
[Driver (Operator) Human Factors](Behavior Type) Overtaking, Lane Changing, Going StraightDriver behavior
[Perpetrator Vehicle Factors](Vehicle Types) Construction Machinery, Freight VehiclesDriver visibility constraints
[Victim (Pedestrian) Human Factors](Behavior Type) Walking on Road, CrossingVehicle–pedestrian conflict
Table 10. Comparison of factors highlighted by basic statistical analysis versus CART factor combination analysis.
CategoryBasic Statistical AnalysisFactor Combination Analysis
Natural Environmental Factors[Day/Night] Nighttime[Day/Night] Nighttime/Daytime
[Weather Conditions] Fog, Cloudy, Rain[Weather Conditions] Fog, Cloudy, Rain
[Road Surface Conditions] Wetness/Humidity, Frost/Ice
Road Environmental Factors[Road Types] General National Road, Local Road[Road Types] General National Road/Local Road, Provincial Road, County Road, Metropolitan Road
[Road Characteristics] Overpass, Bridge, Near Crosswalk
Driver (Operator) Human Factors[Behavior Type] Lane Changing, Overtaking, Left/Right Turn[Behavior Type] Overtaking, Lane Changing, Going Straight
[Regulatory Violations] Speeding, Failure to Maintain Safe Distance, Crossing Center Line, Overtaking Prohibition Violation[Regulatory Violations] Speeding
Perpetrator Vehicle Factors[Vehicle Types] Construction Machinery, Special Vehicles, Freight Vehicles[Vehicle Types] Construction Machinery, Freight Vehicles
Victim (Pedestrian) Human Factors[Behavior Type] Crossing[Behavior Type] Walking on Road, Crossing
Table 11. Variable importance.
Day/Night (100)Road Type (89.3)Driver Behavior Type (72.1)
Traffic-Law Violation Type (68.4)Vehicle Type (51.2)Pedestrian Behavior Type (43.6)
Disclaimer/Publisher’s Note: The statements, opinions and data contained in all publications are solely those of the individual author(s) and contributor(s) and not of MDPI and/or the editor(s). MDPI and/or the editor(s) disclaim responsibility for any injury to people or property resulting from any ideas, methods, instructions or products referred to in the content.