Chironomus riparius Proteome Responses to Spinosad Exposure

 ,
,  , and
, and 
Abstract
1. Introduction
2. Material and Methods
2.1. Test Chemicals
2.2. Organism Culture and Exposure
2.3. Protein Extraction
2.4. Sample Preparation for iTRAQ®
2.5. Two-Dimensional Reversed Phase Liquid Chromatography
2.6. Mass Spectrometric Analysis, Protein Identification, and Quantification
2.7. Statistical Analysis
3. Results
4. Discussion
5. Conclusions
Supplementary Materials
Author Contributions
Funding
Conflicts of Interest
References
- Chen, S.; Chen, B.; Fath, B.D. Ecological risk assessment on the system scale: A review of state-of-the-art models and future perspectives. Ecol. Model. 2013, 250, 25–33. [Google Scholar] [CrossRef]
- Sánchez-Bayo, F.; Tennekes, H.A. Assessment of ecological risks of agrochemicals requires a new framework. Environ. Risk Assess. Remediat. 2017, 1, 20–28. [Google Scholar] [CrossRef]
- Nikinmaa, M. An Introduction to Aquatic Toxicology; Elsevier: Amsterdam, The Netherlands, 2014. [Google Scholar]
- Hartmann, E.M.; Durighello, E.; Pible, O.; Nogales, B.; Beltrametti, F.; Bosch, R.; Christie-Oleza, J.A.; Armengaud, J. Proteomics meets blue biotechnology: A wealth of novelties and opportunities. Mar. Genom. 2014, 17, 35–42. [Google Scholar] [CrossRef] [PubMed]
- Yates, J.R., III. A century of mass spectrometry: From atoms to proteomes. Nat. Methods 2011, 8, 633–637. [Google Scholar] [CrossRef]
- Sanchez, B.C.; Ralston Hooper, K.; Sepúlveda, M.S. Review of recent proteomic applications in aquatic toxicology. Environ. Toxicol. Chem. 2011, 30, 274–282. [Google Scholar] [CrossRef]
- Ji, C.; Wu, H.; Wei, L.; Zhao, J. iTRAQ-based quantitative proteomic analyses on the gender-specific responses in mussel Mytilus galloprovincialis to tetrabromobisphenol A. Aquat. Toxicol. 2014, 157, 30–40. [Google Scholar] [CrossRef]
- Borgatta, M.; Hernandez, C.; Decosterd, L.A.; Chèvre, N.; Waridel, P. Shotgun ecotoxicoproteomics of Daphnia pulex: Biochemical effects of the anticancer drug tamoxifen. J. Proteome Res. 2015, 14, 279–291. [Google Scholar] [CrossRef]
- Chen, H.; Song, Q.; Diao, X.; Zhou, H. Proteomic and metabolomic analysis on the toxicological effects of Benzo[a]pyrene in pearl oyster Pinctada martensii. Aquat. Toxicol. 2016, 175, 81–89. [Google Scholar] [CrossRef]
- Oliveira, I.B.; Groh, K.J.; Stadnicka-Michalak, J.; Schönenberger, R.; Beiras, R.; Barroso, C.M.; Langford, K.H.; Thomas, K.V.; Suter, M.J.-F. Tralopyril bioconcentration and effects on the gill proteome of the Mediterranean mussel Mytilus galloprovincialis. Aquat. Toxicol. 2016, 177, 198–210. [Google Scholar] [CrossRef]
- Vellinger, C.; Sohm, B.; Parant, M.; Immel, F.; Usseglio-Polatera, P. Investigating the emerging role of comparative proteomics in the search for new biomarkers of metal contamination under varying abiotic conditions. Sci. Total Environ. 2016, 562, 974–986. [Google Scholar] [CrossRef]
- Martyniuk, C.J.; Alvarez, S.; Denslow, N.D. DIGE and iTRAQ as biomarker discovery tools in aquatic toxicology. Ecotoxicol. Environ. Saf. 2012, 76, 3–10. [Google Scholar] [CrossRef] [PubMed][Green Version]
- Wang, W.; Lv, Y.; Fang, F.; Hong, S.; Guo, Q.; Hu, S.; Zou, F.; Shi, L.; Lei, Z.; Ma, K.; et al. Identification of proteins associated with pyrethroid resistance by iTRAQ-based quantitative proteomic analysis in Culex pipiens pallens. Parasites Vectors 2015, 8, 95. [Google Scholar] [CrossRef] [PubMed]
- Dowling, V.A.; Sheehan, D. Proteomics as a route to identification of toxicity targets in environmental toxicology. Proteomics 2006, 6, 5597–5604. [Google Scholar] [CrossRef] [PubMed]
- López-Barea, J.; Gómez-Ariza, J.L. Environmental proteomics and metallomics. Proteomics 2006, 6 (Suppl. 1), S51–S62. [Google Scholar] [CrossRef] [PubMed]
- Benninghoff, A.D. Toxicoproteomics—The Next Step in the Evolution of Environmental Biomarkers? Toxicol. Sci. 2007, 95, 1–4. [Google Scholar] [CrossRef]
- Lemos, M.F.L.; Soares, A.M.V.M.; Correia, A.C.; Esteves, A.C. Proteins in ecotoxicology—How, why and why not? Proteomics 2010, 10, 873–887. [Google Scholar] [CrossRef] [PubMed]
- Armitage, P.D.; Pinder, L.C.; Cranston, P.S. (Eds.) The Chironomidae: Biology and Ecology of Non-Biting Midges; Springer Science & Business Media: Dordrecht, The Netherlands, 1995. [Google Scholar]
- Péry, A.R.R.; Ducrot, V.; Mons, R.; Garric, J. Modelling toxicity and mode of action of chemicals to analyse growth and emergence tests with the midge Chironomus riparius. Aquat. Toxicol. 2003, 65, 281–292. [Google Scholar] [CrossRef]
- Weltje, L.; Rufli, H.; Heimbach, F.; Wheeler, J.; Vervliet-Scheebaum, M.; Hamer, M. The chironomid acute toxicity test: Development of a new test system. Integr. Environ. Assess. Manag. 2010, 6, 301–307. [Google Scholar] [CrossRef]
- Ferrington, L.C. Global diversity of non-biting midges (Chironomidae; Insecta-Diptera) in freshwater. Hydrobiologia 2008, 595, 447. [Google Scholar] [CrossRef]
- Taenzler, V.; Bruns, E.; Dorgerloh, M.; Pfeifle, V.; Weltje, L. Chironomids: Suitable test organisms for risk assessment investigations on the potential endocrine disrupting properties of pesticides. Ecotoxicology 2007, 16, 221–230. [Google Scholar] [CrossRef]
- Osmulski, P.; Leyko, W. Structure, function and physiological role of Chironomus haemoglobin. Comp. Biochem. Physiol. Part B Comp. Biochem. 1986, 85, 701–722. [Google Scholar] [CrossRef]
- Choi, J.; Roche, H. Effect of Potassium Dichromate and Fenitrothion on Hemoglobins of Chironomus Riparius Mg. (Diptera, Chironomidae) Larvae: Potential Biomarker of Environmental Monitoring. Environ. Monit. Assess. 2004, 92, 229–239. [Google Scholar] [CrossRef] [PubMed]
- Lee, S.-M.; Lee, S.-B.; Park, C.-H.; Choi, J. Expression of heat shock protein and hemoglobin genes in Chironomus tentans (Diptera, chironomidae) larvae exposed to various environmental pollutants: A potential biomarker of freshwater monitoring. Chemosphere 2006, 65, 1074–1081. [Google Scholar] [CrossRef] [PubMed]
- Lee, S.-E.; Yoo, D.-H.; Son, J.; Cho, K. Proteomic evaluation of cadmium toxicity on the midge Chironomus riparius Meigen larvae. Proteomics 2006, 6, 945–957. [Google Scholar] [CrossRef] [PubMed]
- Choi, J.; Ha, M.-H. Effect of cadmium exposure on the globin protein expression in 4th instar larvae of Chironomus riparius Mg. (Diptera: Chironomidae): An ecotoxicoproteomics approach. Proteomics 2009, 9, 31–39. [Google Scholar] [CrossRef] [PubMed]
- Monteiro, H.R.; Pestana, J.L.T.; Novais, S.C.; Leston, S.; Ramos, F.; Soares, A.M.V.M.; Devreese, B.; Lemos, M.F.L. Assessment of fipronil toxicity to the freshwater midge Chironomus riparius: Molecular, biochemical, and organismal responses. Aquat. Toxicol. 2019, 216, 105292. [Google Scholar] [CrossRef]
- Salgado, V.L.; Sparks, T.C. The Spinosyns: Chemistry, Biochemistry, Mode of Action, and Resistance; Elsevier: Amsterdam, The Netherlands, 2005; pp. 137–173. [Google Scholar]
- Monteiro, H.R.; Pestana, J.L.T.; Novais, S.C.; Soares, A.M.V.M.; Lemos, M.F.L. Toxicity of the insecticides spinosad and indoxacarb to the non-target aquatic midge Chironomus riparius. Sci. Total Environ. 2019, 666, 1283–1291. [Google Scholar] [CrossRef]
- ASTM. Standard Guide for Conducting Acute Toxicity Tests on Test Materials with Fishes, Macroinvertebrates, and Amphibians; ASTM International: West Conshohocken, PA, USA, 2002. [Google Scholar]
- Cilia, M.; Fish, T.; Yang, X.; McLaughlin, M.; Thannhauser, T.W.; Gray, S. A comparison of protein extraction methods suitable for gel-based proteomic studies of aphid proteins. J. Biomol. Tech. 2009, 20, 201–215. [Google Scholar]
- Gilar, M.; Olivova, P.; Daly, A.E.; Gebler, J.C. Two-dimensional separation of peptides using RP-RP-HPLC system with different pH in first and second separation dimensions. J. Sep. Sci. 2005, 28, 1694–1703. [Google Scholar] [CrossRef]
- Van Oudenhove, L.; De Vriendt, K.; Van Beeumen, J.; Mercuri, P.S.; Devreese, B. Differential proteomic analysis of the response of Stenotrophomonas maltophilia to imipenem. Appl. Microbiol. Biotechnol. 2012, 95, 717–733. [Google Scholar] [CrossRef]
- Shilov, I.V.; Seymour, S.L.; Patel, A.A.; Loboda, A.; Tang, W.H.; Keating, S.P.; Hunter, C.L.; Nuwaysir, L.M.; Schaeffer, D.A. The Paragon Algorithm, a next generation search engine that uses sequence temperature values and feature probabilities to identify peptides from tandem mass spectra. Mol. Cell Proteom. 2007, 6, 1638–1655. [Google Scholar] [CrossRef] [PubMed]
- Marinković, M.; de Leeuw, W.C.; de Jong, M.; Kraak, M.H.S.; Admiraal, W.; Breit, T.M.; Jonker, M.J. Combining Next-Generation Sequencing and Microarray Technology into a Transcriptomics Approach for the Non-Model Organism Chironomus Riparius. PLoS ONE 2012, 7, e48096. [Google Scholar]
- Min, X.J.; Butler, G.; Storms, R.; Tsang, A. OrfPredictor: Predicting protein-coding regions in EST-derived sequences. Nucleic Acids Res. 2005, 33, W677–W680. [Google Scholar] [CrossRef] [PubMed]
- Quaglia, M.; Pritchard, C.; Hall, Z.; O’Connor, G. Amine-reactive isobaric tagging reagents: Requirements for absolute quantification of proteins and peptides. Anal. Biochem. 2008, 379, 164–169. [Google Scholar] [CrossRef]
- Choi, J.; Roche, H.; Caquet, T. Hypoxia, hyperoxia and exposure to potassium dichromate or fenitrothion alter the energy metabolism in Chironomus riparius Mg. (Diptera: Chironomidae) larvae. Comp. Biochem. Physiol. Part C Toxicol. Pharmacol. 2001, 130, 11–17. [Google Scholar] [CrossRef]
- Weber, R.E.; Braunitzer, G.; Kleinschmidt, T. Functional Multiplicity and Structural Correlations in the Hemoglobin System of Larvae of Chironomus Thummi Thummi (Insecta, Diptera)—Hb Components Ctt-I, Ctt-Ii-Beta, Ctt-Iii, Ctt-Iv, Ctt-Vi, Ctt-Viib, Ctt-Ix and Ctt-X. Comp. Biochem. Physiol. B 1985, 80, 747–753. [Google Scholar] [CrossRef]
- Burmester, T.; Hankeln, T. The respiratory proteins of insects. J. Insect Physiol. 2007, 53, 285–294. [Google Scholar] [CrossRef]
- Weber, R.E. Functions of Invertebrate Hemoglobins with Special Reference to Adaptations to Environmental Hypoxia. Integr. Comp. Biol. 1980, 20, 79–101. [Google Scholar] [CrossRef]
- Choi, J.; Roche, H.; Caquet, T. Characterization of superoxide dismutase activity in Chironomus riparius Mg. (Diptera, Chironomidae) larvae—A potential biomarker. Comp. Biochem. Physiol. Part C Pharmacol. Toxicol. Endocrinol. 1999, 124, 73–81. [Google Scholar] [CrossRef]
- Oh, J.T.; Epler, J.H.; Bentivegna, C.S. A rapid method of species identification of wild chironomids (Diptera: Chironomidae) via electrophoresis of hemoglobin proteins in sodium dodecyl sulfate polyacrylamide gel (SDS-PAGE). Bull. Entomol. Res. 2014, 104, 639–651. [Google Scholar] [CrossRef]
- Ha, M.-H.; Choi, J. Effects of environmental contaminants on hemoglobin of larvae of aquatic midge, Chironomus riparius (Diptera: Chironomidae): A potential biomarker for ecotoxicity monitoring. Chemosphere 2008, 71, 1928–1936. [Google Scholar] [CrossRef] [PubMed]
- Grazioli, V.; Rossaro, B.; Parenti, P.; Giacchini, R.; Lencioni, V. Hypoxia and anoxia effects on alcohol dehydrogenase activity and hemoglobin content in Chironomus riparius Meigen. J. Limnol. 2016, 75, 347–354. [Google Scholar]
- Bergtrom, G.; Laufer, H.; Rogers, R. Fat body: A site of hemoglobin synthesis in Chironomus thummi (diptera). J. Cell Biol. 1976, 69, 264–274. [Google Scholar] [CrossRef] [PubMed]
- Vafopoulou-Mandalos, X.; Laufer, H. Regulation of hemoglobin synthesis by ecdysterone and juvenile hormone during development of Chironomus thummi (Diptera). Differentiation 1984, 27, 94–105. [Google Scholar] [CrossRef] [PubMed]
- Osmulski, P.A.; Leyko, W. The Structure and Function of Chironomus Hemoglobins. In Structure and Function of Invertebrate Oxygen Carriers; Springer: New York, NY, USA, 1991; Volume 11, pp. 305–312. [Google Scholar]
- Dominguez, R.; Holmes, K.C. Actin Structure and Function. Annu. Rev. Biophys. 2011, 40, 169–186. [Google Scholar] [CrossRef] [PubMed]
- Lodish, H.; Berk, A.; Baltimore, D.; Matsudaira, P.; Zipursky, S.L.; Darnell, J. Molecular Cell Biology; W.H. Freeman & Company: New York, NY, USA, 1995; Volume 16, pp. 134455–134955. [Google Scholar]
- Goodson, H.V.; Hawse, W.F. Molecular evolution of the actin family. J. Cell Sci. 2002, 115, 2619–2622. [Google Scholar]
- Wickstead, B.; Gull, K. The evolution of the cytoskeleton. J. Cell Biol. 2011, 194, 513–525. [Google Scholar] [CrossRef]
- Nelson, D.L.; Cox, M.M. Lehninger Principles of Biochemistry; W.H. Freeman & Company: New York, NY, USA, 2013; Volume 33. [Google Scholar]
- Gómez-Mendikute, A.; Etxeberria, A.; Olabarrieta, I.; Cajaraville, M.P. Oxygen radicals production and actin filament disruption in bivalve haemocytes treated with benzo(a)pyrene. Mar. Environ. Res. 2002, 54, 431–436. [Google Scholar] [CrossRef]
- Gómez-Mendikute, A.; Cajaraville, M.P. Comparative effects of cadmium, copper, paraquat and benzo[a]pyrene on the actin cytoskeleton and production of reactive oxygen species (ROS) in mussel haemocytes. Toxicol. In Vitro 2003, 17, 539–546. [Google Scholar] [CrossRef]
- Dalle-Donne, I.; Rossi, R.; Milzani, A.; Di Simplicio, P.; Colombo, R. The actin cytoskeleton response to oxidants: From small heat shock protein phosphorylation to changes in the redox state of actin itself. Free Radic. Biol. Med. 2001, 31, 1624–1632. [Google Scholar] [CrossRef]
- Milzani, A.; DalleDonne, I.; Colombo, R. Prolonged Oxidative Stress on Actin. Arch. Biochem. Biophys. 1997, 339, 267–274. [Google Scholar] [CrossRef] [PubMed]
- Andersen, S.O.; Hojrup, P.; Roepstorff, P. Insect cuticular proteins. Insect Biochem. Mol. Biol. 1995, 25, 153–176. [Google Scholar] [CrossRef]
- Habbachi, W.; Bensafi, H.; Adjami, Y.; Ouakid, M.L.; Farine, J.-P.; Everaerts, C. Spinosad Affects Chemical Communication in the German Cockroach, Blatella germanica (L). J. Chem. Ecol. 2009, 35, 1423–1426. [Google Scholar] [CrossRef] [PubMed]
- Poynton, H.C.; Loguinov, A.V.; Varshavsky, J.R.; Chan, S.; Perkins, E.J.; Vulpe, C.D. Gene expression profiling in Daphnia magna part I: Concentration-dependent profiles provide support for the No Observed Transcriptional Effect Level. Environ. Sci. Technol. 2008, 42, 6250–6256. [Google Scholar] [CrossRef] [PubMed]
- Dubrovsky, E.B. Hormonal cross talk in insect development. Trends Endocrinol. Metab. 2005, 16, 6–11. [Google Scholar] [CrossRef] [PubMed]
- Fretz, A.; Spindler, K.D. Hormonal regulation of actin and tubulin in an epithelial cell line from Chironomus Tentans. Arch. Insect Biochem. Physiol. 1999, 41, 71–78. [Google Scholar] [CrossRef]
- Spindler, K.D.; Spindler-Barth, M.; Londershausen, M. Chitin metabolism: A target for drugs against parasites. Parasitol. Res. 1990, 76, 283–288. [Google Scholar] [CrossRef]
- EPA Spinosad; Notice of Filing a Pesticide Petition to Establish a Tolerance for a Certain Pesticide Chemical in or on Food. Fed. Regist. 2005, 70, 41730–41735.
- Ewence, A.; Brescia, S.; Johnson, I.; Rumsby, P.C. An approach to the identification and regulation of endocrine disrupting pesticides. Food Chem. Toxicol. 2015, 78, 214–220. [Google Scholar] [CrossRef]
- Blethen, S.L.; Kaplan, N.O. Characteristics of arthropod arginine kinases. Biochemistry 1968, 7, 2123–2135. [Google Scholar] [CrossRef]
- Games, P.D.; Alves, S.N.; Katz, B.B.; Tomich, J.M.; Serrão, J.E. Differential protein expression in the midgut of Culex quinquefasciatus mosquitoes induced by the insecticide temephos. Med. Vet. Entomol. 2016, 30, 253–263. [Google Scholar] [CrossRef] [PubMed]
- Zheng, X.; Xie, Z.; Wang, S.; Lin, P. Determination of the protein expression profiles of Propsilocerus akamusi (Tokunaga) Malpighian tubules response to cadmium stress by iTRAQ coupled LC-MS/MS. J. Proteom. 2017, 164, 85–93. [Google Scholar] [CrossRef] [PubMed]
- Aardema, M.J.; MacGregor, J.T. Toxicology and genetic toxicology in the new era of “toxicogenomics”: Impact of “-omics” technologies. Mutat. Res. 2002, 499, 13–25. [Google Scholar] [CrossRef]
- Gündel, U.; Kalkhof, S.; Zitzkat, D.; von Bergen, M.; Altenburger, R.; Küster, E. Concentration–response concept in ecotoxicoproteomics Effects of different phenanthrene concentrations to the zebrafish (Danio rerio) embryo proteome. Ecotoxicol. Environ. Saf. 2012, 76, 11–22. [Google Scholar]
- McAlister, G.C.; Huttlin, E.L.; Haas, W.; Ting, L.; Jedrychowski, M.P.; Rogers, J.C.; Kuhn, K.; Pike, I.; Grothe, R.A.; Blethrow, J.D.; et al. Increasing the Multiplexing Capacity of TMTs Using Reporter Ion Isotopologues with Isobaric Masses. Anal. Chem. 2012, 84, 7469–7478. [Google Scholar] [CrossRef]
- Frost, D.C.; Greer, T.; Li, L. High-resolution enabled 12-plex DiLeu isobaric tags for quantitative proteomics. Anal. Chem. 2015, 87, 1646–1654. [Google Scholar] [CrossRef]
- Dephoure, N.; Gygi, S.P. Hyperplexing: A method for higher-order multiplexed quantitative proteomics provides a map of the dynamic response to rapamycin in yeast. Sci Signal. 2012, 5, rs2. [Google Scholar] [CrossRef]


| Treatment | Labeling Reagent | |
|---|---|---|
| iTRAQ 1 | iTRAQ 2 | |
| Control | 121 | 116 |
| Control | 115 | 119 |
| T1 | 116 | 121 |
| T1 | 119 | 118 |
| T2 | 114 | 115 |
| T2 | 118 | 117 |
| T3 | 117 | 113 |
| T3 | 113 | 114 |
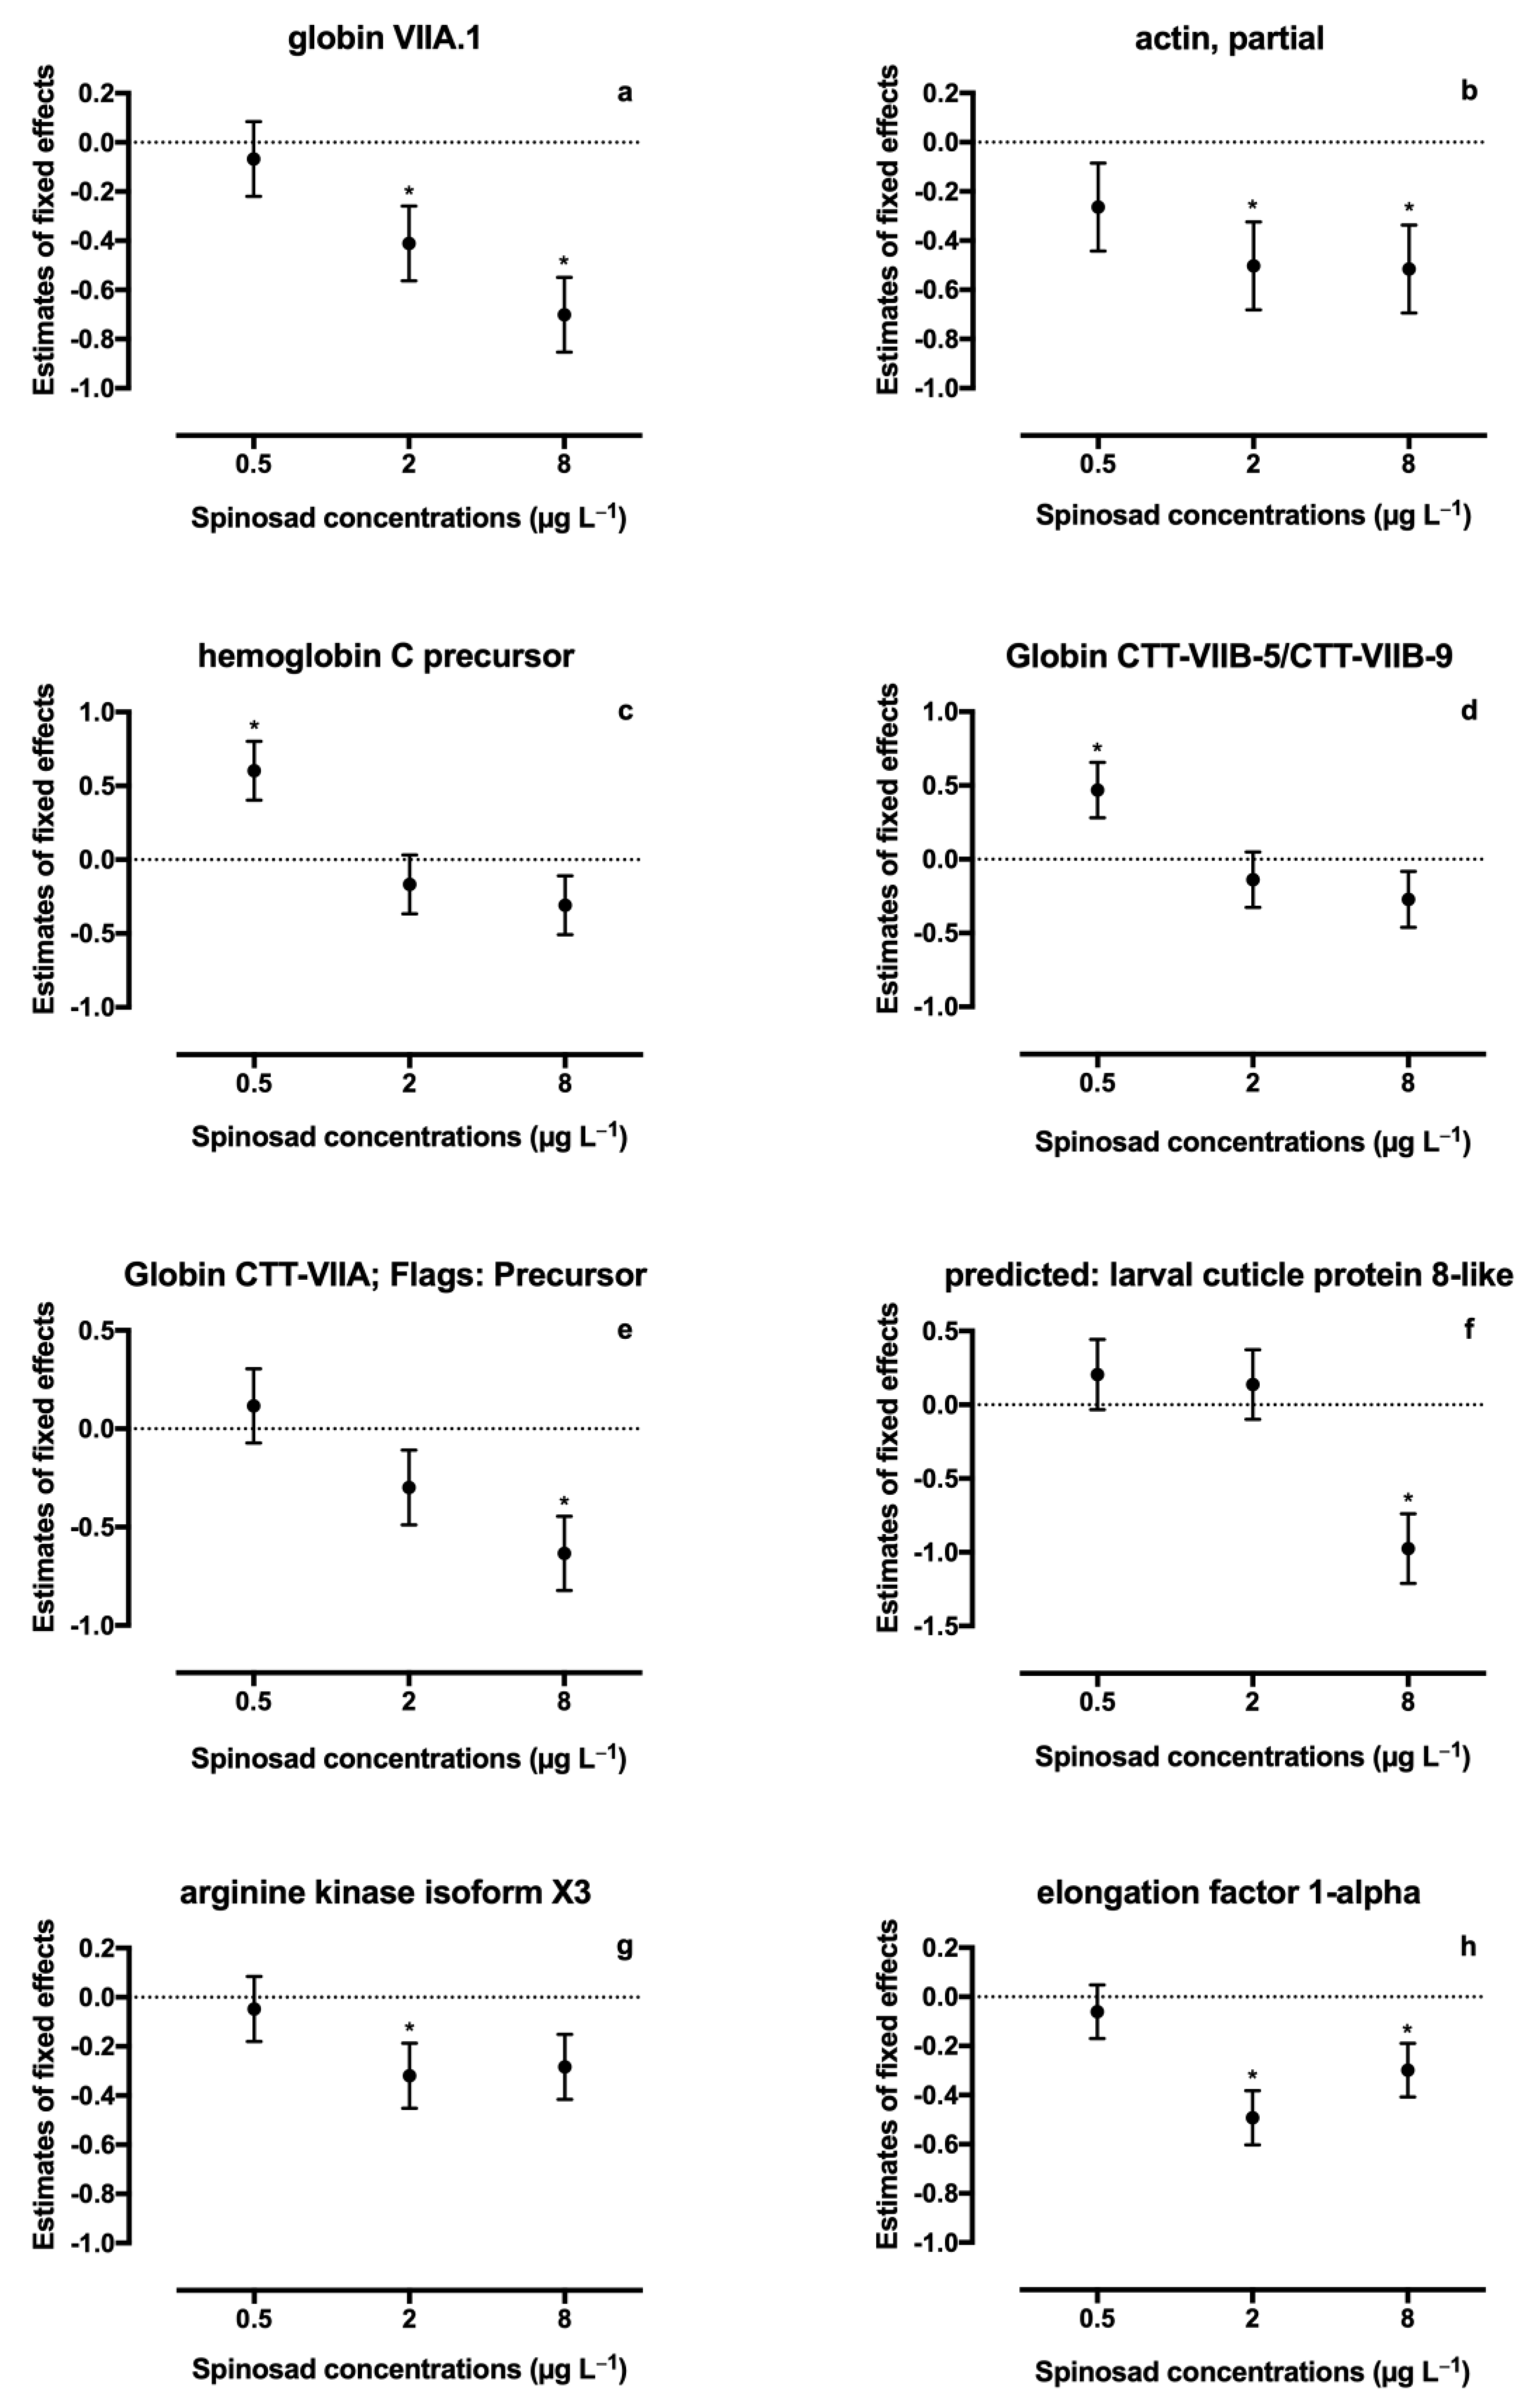
| Total Score | % Cov. | GenBank Accession # | Peptides (95%) | Blast Top Result/Protein Match | Species | Protein Accession # | Significant Changes * |
|---|---|---|---|---|---|---|---|
| 20.00 | 59.0 | KA181893 | 14 | globin VIIA.1 | Chironomus thummi thummi | AAB58930.1 |  T2 and T3 T2 and T3 |
| 18.29 | 47.3 | KA184259 | 18 | actin, partial | Zygaena filipendulae | AHW40461.1 | T2 and T3 |
| 18.23 | 89.4 | KA177778 | 12 | hemoglobin C precursor | Chironomus thummi | AAA28251.1 |  T1 T1 |
| 16.14 | 78.9 | KA193165 | 11 | Globin CTT-VIIB-5/CTT-VIIB-9 | Chironomus thummi thummi | P84298.1 | T1 |
| 14.00 | 72.9 | KA196492 | 8 | Globin CTT-VIIA; Flags: Precursor | Chironomus thummi thummi | P02226.2 | T3 |
| 12.00 | 82.0 | KA195409 | 12 | predicted: larval cuticle protein 8-like | Drosophila kikkawai | XP_017017873.1 | T3 |
| 8.00 | 24.0 | KA178027 | 5 | arginine kinase isoform X3 | Bactrocera dorsalis | XP_029408871.1 | T2 |
| 4.00 | 14.5 | KA183802 | 3 | elongation factor 1-alpha | Polypedilum vanderplanki | BAH28891 | T2 and T3 |
decrease; increase.Publisher’s Note: MDPI stays neutral with regard to jurisdictional claims in published maps and institutional affiliations. |
© 2020 by the authors. Licensee MDPI, Basel, Switzerland. This article is an open access article distributed under the terms and conditions of the Creative Commons Attribution (CC BY) license (http://creativecommons.org/licenses/by/4.0/).
Share and Cite
Monteiro, H.R.; Pestana, J.L.T.; Soares, A.M.V.M.; Devreese, B.; Lemos, M.F.L. Chironomus riparius Proteome Responses to Spinosad Exposure. Toxics 2020, 8, 117. https://doi.org/10.3390/toxics8040117
Monteiro HR, Pestana JLT, Soares AMVM, Devreese B, Lemos MFL. Chironomus riparius Proteome Responses to Spinosad Exposure. Toxics. 2020; 8(4):117. https://doi.org/10.3390/toxics8040117
Chicago/Turabian StyleMonteiro, Hugo R., João L. T. Pestana, Amadeu M. V. M. Soares, Bart Devreese, and Marco F. L. Lemos. 2020. "Chironomus riparius Proteome Responses to Spinosad Exposure" Toxics 8, no. 4: 117. https://doi.org/10.3390/toxics8040117
APA StyleMonteiro, H. R., Pestana, J. L. T., Soares, A. M. V. M., Devreese, B., & Lemos, M. F. L. (2020). Chironomus riparius Proteome Responses to Spinosad Exposure. Toxics, 8(4), 117. https://doi.org/10.3390/toxics8040117