Trace Element Uptake by Herbaceous Plants from the Soils at a Multiple Trace Element-Contaminated Site


Abstract
1. Introduction
2. Materials and Methods
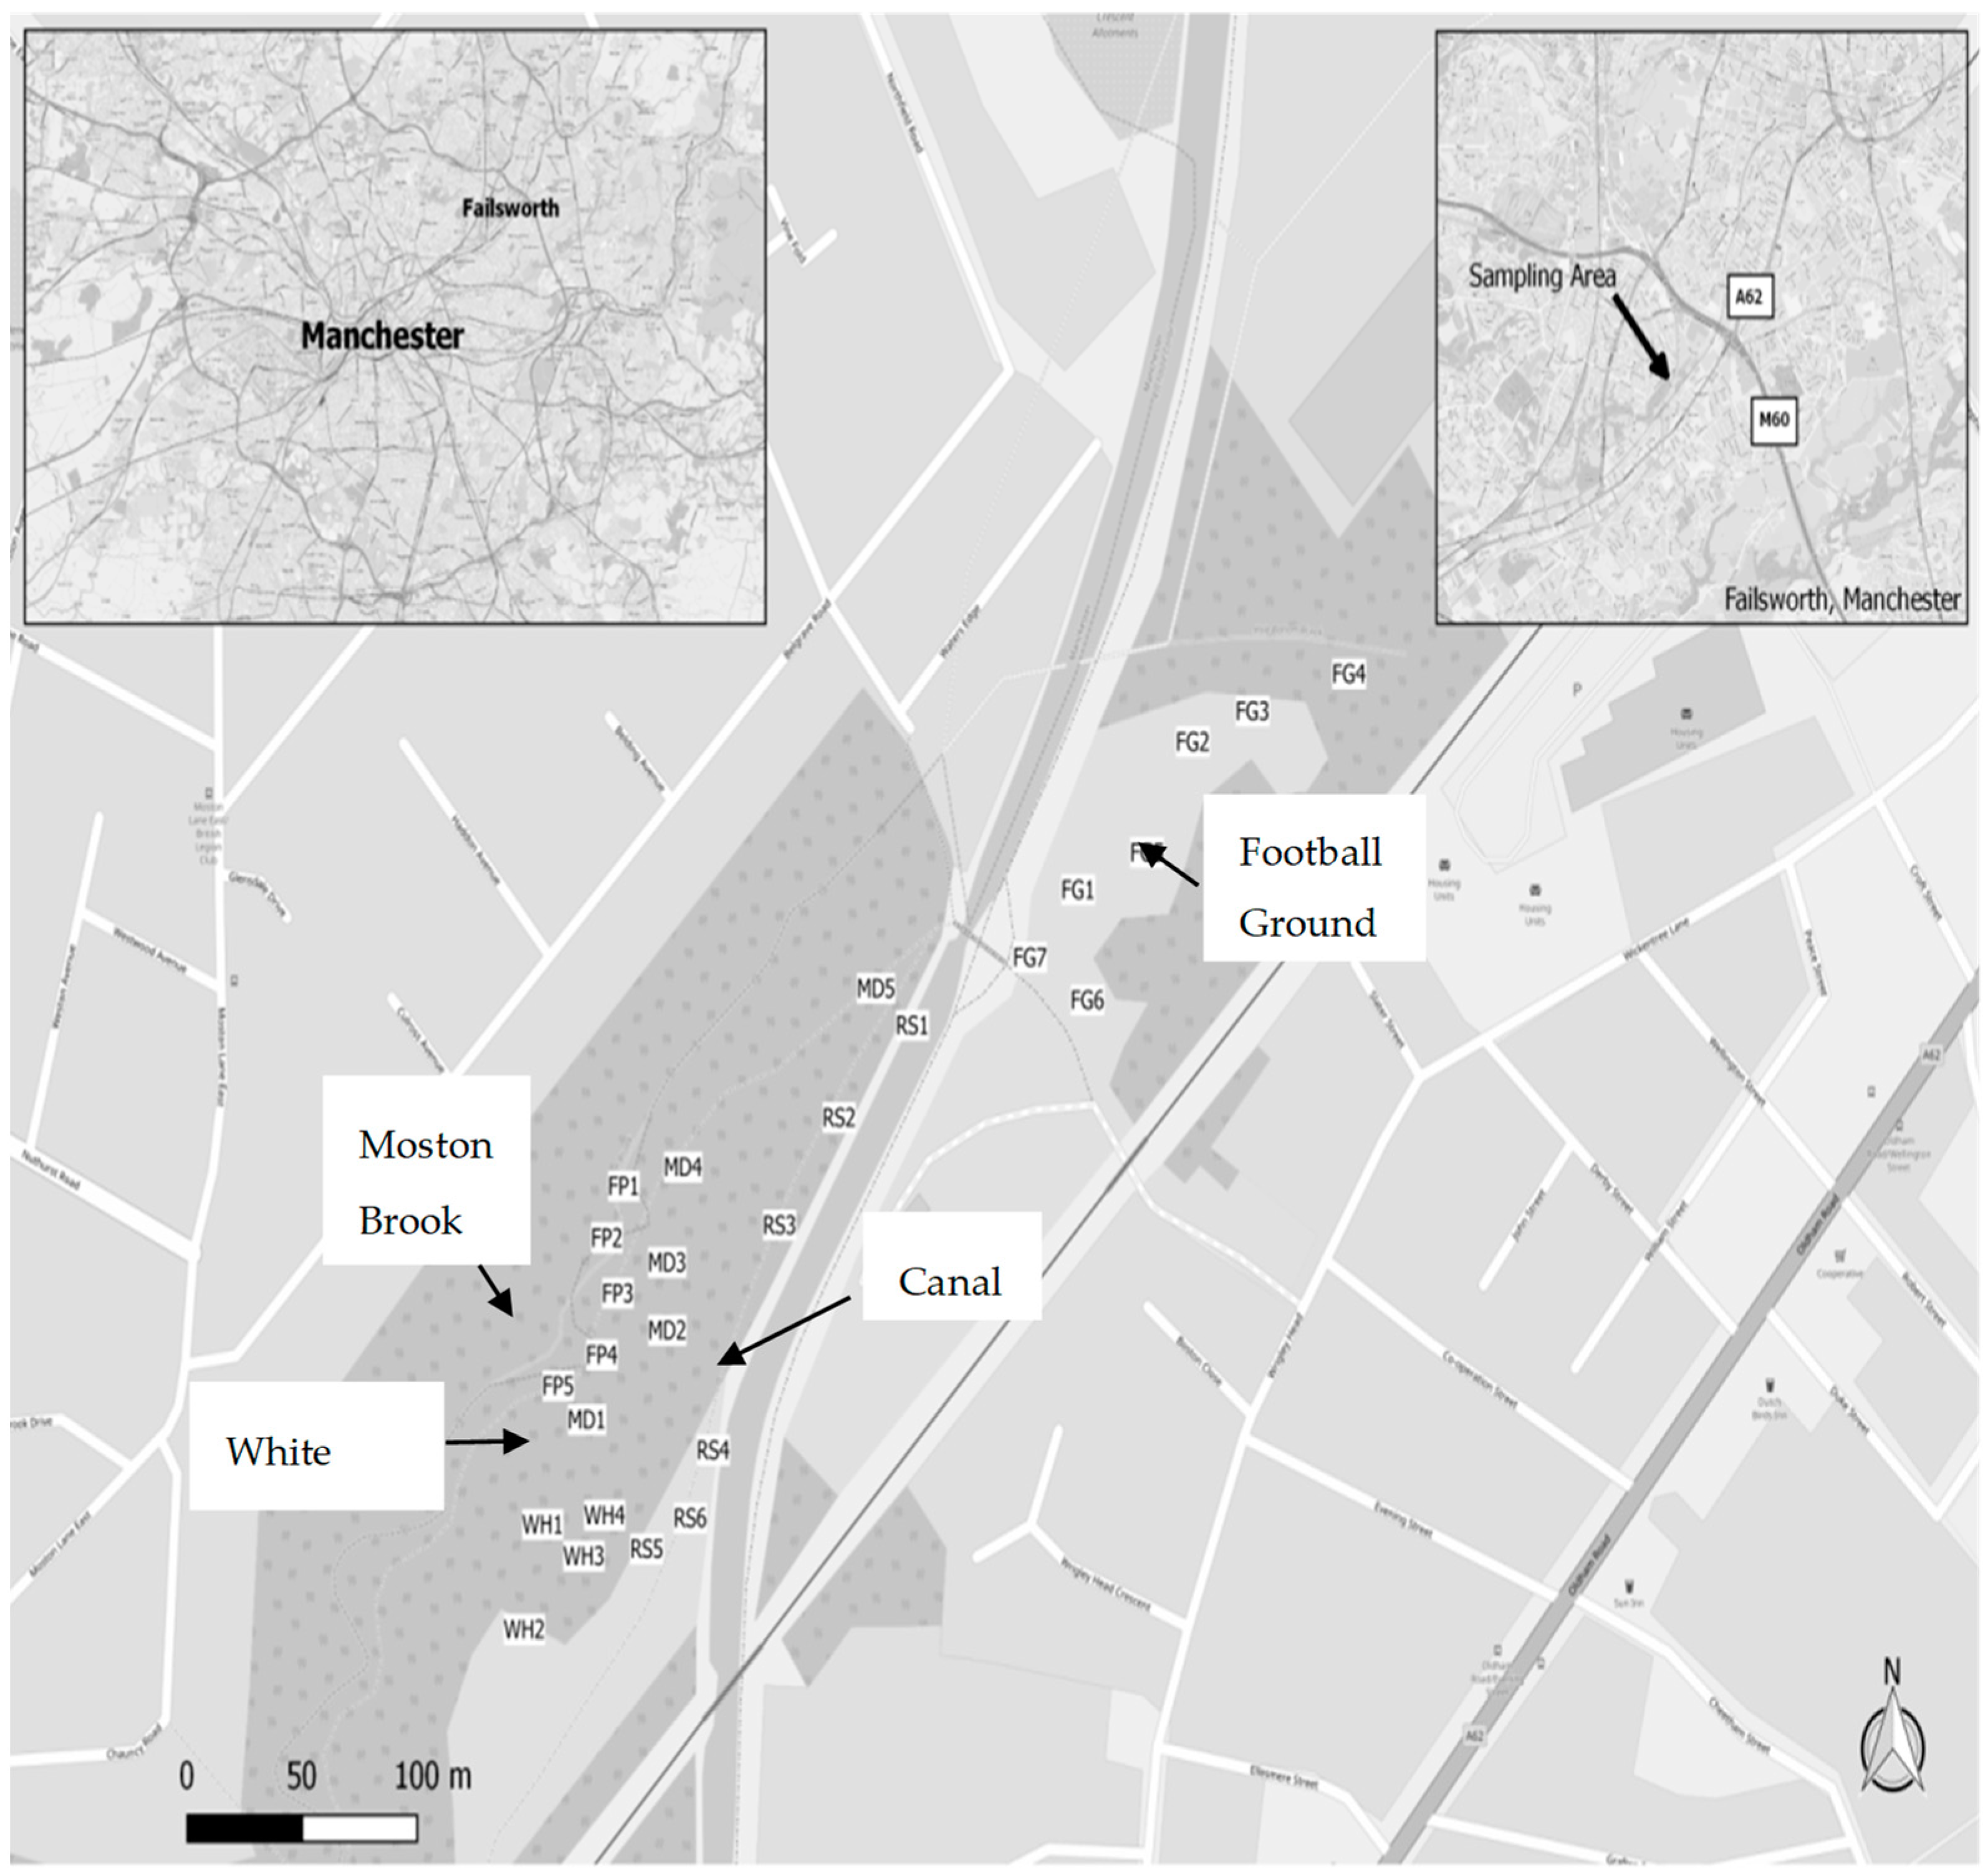
2.1. The Study Site
2.2. Field and Laboratory Methods
3. Results
3.1. pH and EC
3.2. Total Concentration of Trace Elements in the Investigated Soils
3.3. Concentration of Trace Elements in Plant Tissues
3.3.1. Roots
3.3.2. Shoots
4. Discussion
4.1. Trace Elements in the Investigated Soils
4.2. Bioaccumulation of Trace Elements
4.3. Root-Shoot Translocation
4.4. Environmental Implications
5. Conclusions
Author Contributions
Funding
Conflicts of Interest
References
- Ali, H.; Khan, E.; Sajad, M.A. Phytoremediation of heavy metals-concepts and applications. Chemosphere 2013, 91, 869–881. [Google Scholar] [CrossRef] [PubMed]
- Brun, L.A.; Maillet, J.; Hinsinger, P.; Pepin, M. Evaluation of copper availability to plants in copper-contaminated vineyard soils. Environ. Pollut. 2001, 111, 293–302. [Google Scholar] [CrossRef]
- Ginocchio, R.; Rodríguez, P.H.; Badilla-Ohlbaum, R.; Allen, H.E.; Lagos, G.E. Effect of soil copper content and pH on copper uptake of selected vegetables grown under controlled conditions. Environ. Toxicol. Chem. 2002, 21, 1736–1744. [Google Scholar] [CrossRef] [PubMed]
- Yoon, J.; Cao, X.; Zhou, Q.; Ma, L.Q. Accumulation of Pb, Cu, and Zn in Native Plants Growing on a Contaminated Florida Site. Sci. Total Environ. 2006, 368, 456–464. [Google Scholar] [CrossRef] [PubMed]
- Elless, M.P.; Blaylock, M.J.; Huang, J.W.; Gussman, C.D. Plants as a natural source of concentrated mineral nutritional supplements. Food Chem. 2000, 71, 181–188. [Google Scholar] [CrossRef]
- Ye, X.; Li, H.; Ma, Y.; Wu, L.; Sun, B. The bioaccumulation of Cd in rice grains in paddy soils as affected and predicted by soil properties. J. Soils Sediment. 2014, 14, 1407–1416. [Google Scholar] [CrossRef]
- Adams, M.L.; Zhao, F.J.; McGrath, S.P.; Nicholson, F.A.; Chambers, B.J. Predicting cadmium concentrations in wheat and barley grain using soil properties. J. Environ. Qual. 2004, 33, 532–541. [Google Scholar] [CrossRef]
- Cao, F.; Wang, R.; Cheng, W.; Zeng, F.; Ahmed, I.M.; Hu, X.; Wu, F. Genotypic and environmental variation in cadmium, chromium, lead and copper in rice and approaches for reducing the accumulation. Sci. Total Environ. 2014, 496, 275–281. [Google Scholar] [CrossRef]
- Warne, M.S.J.; Heemsbergen, D.; Stevens, D.; McLaughlin, M.; Cozens, G.; Whatmuff, M.; Pritchard, D. Modeling the toxicity of copper and zinc salts to wheat in 14 soils. Environ. Toxicol. Chem. 2008, 27, 786–792. [Google Scholar] [CrossRef]
- Liu, W.X.; Shen, L.F.; Liu, J.W.; Wang, Y.W.; Li, S.R. Uptake of toxic heavy metals by rice (Oryza sativa L.) cultivated in the agricultural soil near Zhengzhou City, People’s Republic of China. Bull. Environ. Contam. Toxicol. 2007, 79, 209–213. [Google Scholar] [CrossRef]
- Nguyen, T.H.; Sakakibara, M.; Sano, S.; Hori, R.S.; Sera, K. The Potentialof Eleocharis acicularis for Phytoremediation: Case Study at an Abandoned Mine Site, Clean. Soil Air Water 2009, 37, 203–208. [Google Scholar]
- Ranjeev, K.S.; Ram, N.; Vishal, C. Accumulation of Metals in NaturallyGrown Weeds (Aquatic Macrophytes) Grown on an Industrial Effluent Channel, Clean. Soil Air Water 2007, 35, 261–265. [Google Scholar]
- Groundwork Oldham and Rochdale. Moston Brook Feasibility Study; Manchester City Council: Manchester, UK, 2008.
- Bressy, F.C.; Brito, G.B.; Barbosa, I.S.; Teixeira, L.S.; Korn, M.G.A. Determination of trace element concentrations in tomato samples at different stages of maturation by ICP OES and ICP-MS following microwave-assisted digestion. Microchem. J. 2013, 109, 145–149. [Google Scholar] [CrossRef]
- Ross, S.M.; Wood, M.D.; Copplestone, D.; Warriner, M.; Crook, P. Environmental Concentrations of Heavy Metals in UK Soil and Herbage; UK Soil and Herbage Pollutant Survey (UKSHS) Report; Environment Agency: Bristo, UK, 2007.
- DEFRA. Development of Category 4 Screening Levels for Assessment of Land Affected by Contamination; Final Project Report (Revision 2); Department for Environment, Food and Rural Affairs: London, UK, 2014.
- Johnson, C.C.; Ander, E.L.; Cave, M.R.; Palumbo-Roe, B. Normal Background Concentrations (NBCs) of Contaminants in English Soils: Final Project Report. 2012. Available online: https://www.bgs.ac.uk/gbase/NBCDefraProject.html (accessed on 1 December 2018).
- Alloway, B.J. Heavy Metals in Soils; Chapman & Hall: London, UK, 1995. [Google Scholar]
- McGrath, S.P. Range of Metal Concentrations in Topsoils of England and Wales in Relation to Soil Protection Guidelines (No. CONF-860626-); Rothamsted Experimental Station: Harpenden, UK, 1986. [Google Scholar]
- Kabata-Pendias, A. Trace Elements in Soils and Plants, 3rd ed.; CRC Press: Boca Raton, FL, USA, 2000. [Google Scholar]
- Archer, F.C.; Hodgson, I.H. Total and extractable trace element contents of soils in England and Wales. J. Soil Sci. 1987, 38, 421–431. [Google Scholar] [CrossRef]
- McGrath, S.P.; Loveland, P.J. The Soil Geochemical Atlas of England and Wales; Blackie Academic & Professional: Glasgow, UK, 1992. [Google Scholar]
- Zhao, F.J.; Lombi, E.; McGrath, S.P. Assessing the potential for zinc and cadmium phytoremediation with the hyperaccumulator Thlaspi caerulescens. Plant Soil 2003, 249, 37–43. [Google Scholar] [CrossRef]
- Bose, S.; Vedamati, J.; Rai, V.; Ramanathan, A.L. Metal uptake and transport by Tyaha angustata L. grown on metal contaminated waste amended soil: An implication of phytoremediation. Geoderma 2008, 145, 136–142. [Google Scholar] [CrossRef]
- Tiwari, K.K.; Singh, N.K.; Patel, M.P.; Tiwari, M.R.; Rai, U.N. Metal contamination of soil and translocation in vegetables growing under industrial wastewater irrigated agricultural field of Vadodara, Gujarat, India. Ecotoxicol. Environ. Saf. 2011, 74, 1670–1677. [Google Scholar] [CrossRef]
- Mugica-Alvarez, V.; Cortés-Jiménez, V.; Vaca-Mier, M.; Domínguez-Soria, V. Phytoremediation of Mine Tailings Using Lolium Multiflorum. Int. J. Environ. Sci. Dev. 2015, 6, 246–251. [Google Scholar] [CrossRef]
- Galal, T.M.; Shehata, H.S. Bioaccumulation and translocation of heavy metals by Plantago major L. grown in contaminated soils under the effect of traffic pollution. Ecol. Indic. 2015, 48, 244–251. [Google Scholar] [CrossRef]
- Page, V.; Feller, U. Heavy Metals in crop plants: Transport and redistribution processes on the whole plant level. Agronomy 2015, 5, 447–463. [Google Scholar] [CrossRef]
- Ximénez-Embún, P.; Rodríguez-Sanz, B.; Madrid-Albarrán, Y.; Cámara, C. Uptake of heavy metals by lupin plants in artificially contaminated sand: Preliminary results. Int. J. Environ. Anal. Chem. 2002, 82, 805–813. [Google Scholar] [CrossRef]
- Page, V.; Feller, U. Selective transport of zinc, manganese, nickel, cobalt and cadmium in the root system and transfer to the leaves in young wheat plants. Ann. Bot. 2005, 96, 425–434. [Google Scholar] [CrossRef] [PubMed]
- Chandra, R.; Bharagava, R.N.; Yadav, S.; Mohan, D. Accumulation and distribution of toxic metals in wheat (Triticum aestivum L.) and Indian mustard (Brassica campestris L.) irrigated with distillery and tannery effluents. J. Hazard. Mater. 2009, 162, 1514–1521. [Google Scholar] [CrossRef] [PubMed]
- Han, D.F.; Luo, D.; Chen, Y.H.; Wang, G. Transfer of Cd, Pb, and Zn to water spinach from a polluted soil amended with lime and organic materials. J. Soils Sediment. 2013, 13, 1360–1368. [Google Scholar] [CrossRef]
- Kamari, A.; Yusoff, M.; Najiah, S.; Putra, W.P.; Ishak, C.F.; Hashim, N.; Mohamed, A.; Phillip, E. Metal uptake in water spinach grown on contaminated soil amended with chicken manure and coconut tree sawdust. Environ. Eng. Manag. J. 2014, 13, 2219–2228. [Google Scholar] [CrossRef]
- Tangahu, B.V.; Abdullah, S.R.S.; Basri, H.; Idris, M.; Anuar, N.; Mukhlisin, M. A review on heavy metals (As, Pb, and Hg) uptake by plants through phytoremediation. Int. J. Chem. Eng. 2011, 2011, 939161. [Google Scholar] [CrossRef]
- Polechońska, L.; Klink, A. Trace metal bioindication and phytoremediation potentialities of Phalaris arundinacea L. (reed canary grass). J. Geochem. Explor. 2014, 146, 27–33. [Google Scholar] [CrossRef]
- Misra, S.G.; Mani, D. Soil Pollution; Ashish Publishing House: Punjabi Bagh, India, 1991. [Google Scholar]
- MacLean, K.S.; Robinson, A.R.; MacConnell, H.H. The effect of sewage-sludge on the heavy metal content of soils and plant tissue. Commun. Soil Sci. Plan. 1987, 18, 1303–1316. [Google Scholar] [CrossRef]
- Stalikas, C.D.; Mantalovas, A.C.; Pilidis, G.A. Multielement concentrations in vegetable species grown in two typical agricultural areas of Greece. Sci. Total Environ. 1997, 206, 17–24. [Google Scholar] [CrossRef]
- Gupta, N.; Khan, D.K.; Santra, S.C. An assessment of heavy metal contamination in vegetables grown in wastewater-irrigated areas of Titagarh, West Bengal, India. Bull. Environ. Contam. Toxicol. 2008, 80, 115–118. [Google Scholar] [CrossRef]
- Pan, X.D.; Wu, P.G.; Jiang, X.G. Levels and potential health risk of heavy metals in marketed vegetables in Zhejiang, China. Sci. Rep. 2016, 6, 20317. [Google Scholar] [CrossRef] [PubMed]
- Adams, D.; Scott, A.J.; Hardman, M. Guerrilla warfare in the planning system: Revolution or convergence in sustainable planning discourse? Geogr. Ann. 2014, 95, 375–387. [Google Scholar] [CrossRef]
- Wong, M.H. Ecological restoration of mine degraded soils, with emphasis on metal contaminated soils. Chemosphere 2003, 50, 775–780. [Google Scholar] [CrossRef]
- Khan, A.G. Role of soil microbes in the rhizospheres of plants growing on trace metal contaminated soils in phytoremediation. J. Trace Elem. Med. Biol. 2005, 18, 355–364. [Google Scholar] [CrossRef] [PubMed]
- Pacwa-Płociniczak, M.; Płociniczak, T.; Yu, D. Effect of silene vulgaris and heavy metal pollution on soil microbial diversity in long-term contaminated soil. Water Air Soil Pollut. 2018, 229, 13. [Google Scholar] [CrossRef] [PubMed]
- Jiang, R.; Wang, M.; Chen, W.; Li, X. Ecological risk evaluation of combined pollution of herbicide siduron and heavy metals in soils. Sci. Total Environ. 2018, 626, 1047–1056. [Google Scholar] [CrossRef] [PubMed]


| Location | pH | EC (µS/cm) |
|---|---|---|
| FG1 | 7.12 | 39.1 |
| FG2 | 6.62 | 35.2 |
| FG3 | 5.86 | 70.6 |
| FG4 | 8.32 | 96.4 |
| FG5 | 6.57 | 17.6 |
| FG6 | 6.16 | 64.8 |
| FG7 | 6.76 | 182 |
| FP1 | 7.58 | 39.2 |
| FP2 | 7.69 | 135 |
| FP3 | 6.27 | 70.6 |
| FP4 | 7.41 | 138 |
| FP5 | 7.10 | 152 |
| MD1 | 7.53 | 123 |
| MD2 | 5.46 | 38.9 |
| MD3 | 6.21 | 42.1 |
| MD4 | 7.61 | 153 |
| MD5 | 7.02 | 64.3 |
| RS1 | 6.39 | 116 |
| RS2 | 6.47 | 72.4 |
| RS3 | 6.50 | 45.2 |
| RS4 | 6.81 | 132 |
| RS5 | 5.50 | 53.5 |
| RS6 | 6.25 | 61.5 |
| WH1 | 5.85 | 37.5 |
| WH2 | 6.12 | 62.1 |
| WH3 | 6.16 | 51.4 |
| WH4 | 6.09 | 45.5 |
| Median | 6.50 | 64.5 |
| Range | 5.46–8.32 | 17.6–182 |
| Location | As | Cr | Cu | Mn | Ni | Pb | Zn |
|---|---|---|---|---|---|---|---|
| FG1 | 69 | 155 | 2768 | 3855 | 802 | 1492 | 1263 |
| FG2 | 80 | 154 | 3348 | 3458 | 920 | 1587 | 1026 |
| FG3 | 770 | 223 | 59 | 361 | UDL a | 649 | 89 |
| FG4 | 12 | 47 | 197 | 397 | 55 | 114 | 186 |
| FG5 | 39 | 121 | 1237 | 3499 | 1075 | 891 | 1881 |
| FG6 | 40 | 103 | 408 | 767 | 145 | 345 | 218 |
| FG7 | 51 | 133 | 626 | 1017 | 129 | 402 | 580 |
| FP1 | 510 | 161 | 78 | 502 | 57 | 362 | 143 |
| FP2 | 148 | 144 | 170 | 774 | 71 | 434 | 453 |
| FP3 | 472 | 136 | 119 | 499 | 17 | 919 | 242 |
| FP4 | 54 | 108 | 63 | 428 | 53 | 137 | 128 |
| FP5 | 50 | 95 | 60 | 416 | 55 | 132 | 119 |
| MD1 | 34 | 87 | 32 | 581 | 11 | 46 | 72 |
| MD2 | 1132 | 126 | 38 | 49 | UDL | 623 | 28 |
| MD3 | 269 | 142 | 35 | 340 | 6 | 191 | 71 |
| MD4 | 761 | 204 | 79 | 309 | UDL | 690 | 89 |
| MD5 | 215 | 126 | 57 | 432 | 11 | 253 | 121 |
| RS1 | 350 | 165 | 78 | 351 | 24 | 337 | 174 |
| RS2 | 451 | 172 | 52 | 362 | 22 | 330 | 95 |
| RS3 | 88 | 177 | 2380 | 1957 | 425 | 1316 | 1450 |
| RS4 | 324 | 152 | 75 | 524 | 9 | 329 | 118 |
| RS5 | 857 | 202 | 89 | 2245 | UDL | 597 | 92 |
| RS6 | 688 | 217 | 88 | 254 | UDL | 569 | 109 |
| WH1 | 993 | 200 | 61 | 383 | UDL | 1380 | 89 |
| WH2 | 96 | 108 | 134 | 312 | 10 | 156 | 95 |
| WH3 | 268 | 139 | 51 | 466 | UDL | 257 | 107 |
| WH4 | 125 | 117 | 54 | 394 | 17 | 148 | 98 |
| Median | 215 | 142 | 78 | 432 | 17 | 362 | 119 |
| Min | 12 | 47 | 32 | 49 | UDL | 46 | 28 |
| Max | 1132 | 223 | 3348 | 3855 | 1075 | 1587 | 1881 |
| UK soil range b | 0.5–143 | 1.14–236 | 2.27–96.7 | 10–12,200 | 1.16–216 | 2.6–713 | 2.63–442 |
| UK soil median b | 7.1 | 29.2 | 17.2 | 420 | 15.8 | 37.4 | 65.9 |
| UK screening level c | 32–40 d | - | - | - | - | 82–330 d | - |
| Location | Plant Species | Common Name | As | Cr | Cu | Mn | Ni | Pb | Zn |
|---|---|---|---|---|---|---|---|---|---|
| FG1 | Agrostis stolonifera | Creeping bent | 5 | 12 | 422 | 478 | 191 | 182 | 333 |
| FG2 | Artemisia vulgaris | Mugwort | 2 | 2 | 82 | 88 | 105 | 10 | 190 |
| FG3 | Argrostis capillaries | Common bent | 3 | 2 | 88 | 108 | 57 | 39 | 373 |
| FG4 | Chamerion angustifolium | Rosebay willowherb | 1 | 2 | 19 | 25 | 6 | 3 | 53 |
| FG5 | Agrostis tenuis | Slender rush | 3 | 10 | 731 | 456 | 317 | 256 | 558 |
| FG6 | Dactylis glomerata | Cocksfoot | 2 | 10 | 77 | 212 | 28 | 27 | 180 |
| FG7 | Urtica dioica | Stinging nettle | 2 | 7 | 61 | 59 | 16 | 15 | 124 |
| FP1 | Galium aparine | Cleavers | 2 | UDL | 25 | 37 | 1 | 8 | 56 |
| FP2 | Phalaris arundinacea | Reed canary grass | 3 | 2 | 14 | 34 | 3 | 14 | 111 |
| FP3 | Heracleum sphondylium | Hogweed | 2 | UDL | 9 | 25 | 22 | 19 | 55 |
| FP4 | Juncus inflexus | Hard rush | 5 | 8 | 43 | 192 | 8 | 19 | 88 |
| FP5 | Impatiens glandulifera | Himalayan balsam | 4 | UDL | 38 | 42 | 15 | 12 | 119 |
| MD1 | Plantago lanceolata | Ribowort plantain | 1 | 2 | 24 | 51 | 3 | 4 | 120 |
| MD2 | Lolium multiflorum | Italian Rye grass | 4 | 1 | 22 | 207 | 3 | 13 | 215 |
| MD3 | Juncus effusus | Soft rush | 24 | 4 | 27 | 89 | 9 | 31 | 116 |
| MD4 | Chamerion angustifolium | Rosebay willowherb | 5 | 2 | 13 | 36 | 5 | 16 | 50 |
| MD5 | Holcus lanatus | Yorkshire fog | 8 | 1 | 40 | 111 | 10 | 7 | 173 |
| RS1 | Urtica dioica | Stinging nettle | 52 | 4 | 72 | 177 | 12 | 41 | 417 |
| RS2 | Dactylis glomerata | Cocksfoot | 57 | 46 | 42 | 234 | 12 | 68 | 82 |
| RS3 | Festuca pratensis | Meadow fescue | 32 | 3 | 23 | 225 | 5 | 48 | 83 |
| RS4 | Glyceria maxima | Reed sweetgrass | 28 | 4 | 104 | 271 | 6 | 36 | 280 |
| RS5 | Phleum pratense | Timothy grass | 29 | 3 | 47 | 584 | 16 | 26 | 161 |
| RS6 | Lolium pratense | Ryegrass | 97 | 35 | 51 | 313 | 17 | 101 | 148 |
| WH1 | Equisetum arvense | Field horsetail | 40 | 2 | 53 | 56 | 5 | 83 | 82 |
| WH2 | Cynosurus cristatus | Crested dog’s tail | 4 | 7 | 32 | 582 | 9 | 13 | 118 |
| WH3 | Filipendula ulmaria | Meadowsweet | 4 | 4 | 54 | 187 | 7 | 19 | 141 |
| WH4 | Bistorta officinalis | Bistort | 103 | 3 | 28 | 485 | 12 | 50 | 52 |
| Median | 5 | 3 | 42 | 182 | 11 | 23 | 122 | ||
| Min | 1 | UDL | 9 | 25 | 1 | 3 | 50 | ||
| Max | 103 | 46 | 731 | 584 | 317 | 256 | 558 |
| Location | Plant Species | Common Name | As | Cr | Cu | Mn | Ni | Pb | Zn |
|---|---|---|---|---|---|---|---|---|---|
| FG1 | Agrostis stolonifera | Creeping bent | 1.0 | 0.6 | 10.3 | 37.5 | 23.9 | 3.4 | 53.8 |
| FG2 | Artemisia vulgaris | Mugwort | 1.7 | 0.3 | 12.3 | 81.2 | 24.1 | 2.0 | 189 |
| FG3 | Argrostis capillaries | Common bent | 0.3 | 0.2 | 10.5 | 33.3 | 13.5 | 2.3 | 67.9 |
| FG4 | Chamerion angustifolium | Rosebay willowherb | 0.7 | UDL | 8.5 | 21.6 | 2.6 | 0.2 | 39.8 |
| FG5 | Agrostis tenuis | Slender rush | 1.3 | 0.7 | 58.7 | 83.3 | 52.8 | 27.8 | 147 |
| FG6 | Dactylis glomerata | Cocksfoot | 0.0 | 0.2 | 9.3 | 98.5 | 5.3 | 2.7 | 39.5 |
| FG7 | Urtica dioica | Stinging nettle | 0.3 | 0.3 | 18.2 | 9.1 | 1.4 | 1.3 | 17.7 |
| FP1 | Galium aparine | Cleavers | 0.4 | 0.1 | 4.4 | 14.8 | 0.8 | 1.1 | 25.7 |
| FP2 | Phalaris arundinacea | Reed canary grass | 0.8 | 0.2 | 11.6 | 201 | 5.4 | 3.4 | 84.6 |
| FP3 | Heracleum sphondylium | Hogweed | 0.3 | 0.4 | 6.7 | 17.1 | 1.6 | 2.3 | 56.8 |
| FP4 | Juncus inflexus | Hard rush | 3.4 | 0.4 | 12.1 | 28.0 | 0.9 | 1.6 | 28.1 |
| FP5 | Impatiens glandulifera | Himalayan balsam | 0.3 | 0.2 | 7.7 | 55.7 | 2.8 | 1.8 | 41.8 |
| MD1 | Plantago lanceolata | Ribowort plantain | 0.4 | 0.3 | 4.8 | 10.6 | 1.1 | 1.2 | 19.7 |
| MD2 | Lolium multiflorum | Italian Rye grass | 0.6 | 0.2 | 6.3 | 105 | 1.4 | 3.3 | 44.0 |
| MD3 | Juncus effusus | Soft rush | 1.1 | 0.4 | 5.7 | 9.6 | 1.0 | 0.3 | 39.6 |
| MD4 | Chamerion angustifolium | Rosebay willowherb | 0.7 | 0.4 | 7.2 | 27.9 | 1.0 | 1.4 | 32.4 |
| MD5 | Holcus lanatus | Yorkshire fog | 0.6 | 0.7 | 4.2 | 12.4 | 1.0 | 1.2 | 14.5 |
| RS1 | Urtica dioica | Stinging nettle | 0.3 | 0.2 | 10.4 | 28.9 | 1.4 | 2.0 | 22.3 |
| RS2 | Dactylis glomerata | Cocksfoot | 1.5 | 0.3 | 5.7 | 33.3 | 1.9 | 2.5 | 21.4 |
| RS3 | Festuca pratensis | Meadow fescue | 1.3 | 0.5 | 8.6 | 123 | 2.0 | 4.1 | 37.0 |
| RS4 | Glyceria maxima | Reed sweetgrass | 2.6 | 0.4 | 7.1 | 92.1 | 1.1 | 1.3 | 25.5 |
| RS5 | Phleum pratense | Timothy grass | 6.2 | 0.8 | 8.8 | 278 | 4.3 | 6.6 | 40.1 |
| RS6 | Lolium pratense | Ryegrass | 0.2 | 0.3 | 4.9 | 124 | 2.6 | 1.7 | 26.3 |
| WH1 | Equisetum arvense | Field horsetail | 0.7 | 0.6 | 10.7 | 43.7 | 1.3 | 3.6 | 50.9 |
| WH2 | Cynosurus cristatus | Crested dog’s tail | 0.4 | 0.6 | 5.2 | 178 | 3.7 | 1.6 | 35.3 |
| WH3 | Filipendula ulmaria | Meadowsweet | UDL | 0.4 | 3.5 | 12.1 | 3.2 | 0.6 | 18.2 |
| WH4 | Bistorta officinalis | Bistort | 1.0 | 0.8 | 8.8 | 540 | 3.5 | 0.6 | 63.4 |
| Median | 0.7 | 0.4 | 8.5 | 37.5 | 2.0 | 1.8 | 39.5 | ||
| Min | UDL | UDL | 3.5 | 9.1 | 0.8 | 0.2 | 14.5 | ||
| Max | 6.2 | 0.8 | 58.7 | 540 | 52.8 | 27.8 | 189 |
| Location | Plant Species | Common Name | As | Cr | Cu | Mn | Ni | Pb | Zn |
|---|---|---|---|---|---|---|---|---|---|
| FG1 | Agrostis stolonifera | Creeping bent | 0.07 | 0.08 | 0.15 | 0.12 | 0.24 | 0.12 | 0.26 |
| FG2 | Artemisia vulgaris | Mugwort | 0.02 | 0.01 | 0.02 | 0.03 | 0.12 | 0.01 | 0.19 |
| FG3 | Argrostis capillaries | Common bent | 0.00 | 0.01 | 1.48 | 0.30 | 0.00 | 0.06 | 4.18 |
| FG4 | Chamerion angustifolium | Rosebay willowherb | 0.11 | 0.05 | 0.10 | 0.06 | 0.11 | 0.02 | 0.29 |
| FG5 | Agrostis tenuis | Slender rush | 0.09 | 0.08 | 0.59 | 0.13 | 0.30 | 0.29 | 0.30 |
| FG6 | Dactylis glomerata | Cocksfoot | 0.05 | 0.10 | 0.19 | 0.28 | 0.19 | 0.08 | 0.83 |
| FG7 | Urtica dioica | Stinging nettle | 0.04 | 0.05 | 0.10 | 0.06 | 0.12 | 0.04 | 0.22 |
| FP1 | Galium aparine | Cleavers | 0.01 | 0.00 | 0.32 | 0.07 | 0.02 | 0.02 | 0.39 |
| FP2 | Phalaris arundinacea | Reed canary grass | 0.02 | 0.02 | 0.08 | 0.05 | 0.04 | 0.03 | 0.25 |
| FP3 | Heracleum sphondylium | Hogweed | 0.00 | 0.00 | 0.07 | 0.05 | 1.31 | 0.02 | 0.23 |
| FP4 | Juncus inflexus | Hard rush | 0.10 | 0.07 | 0.67 | 0.45 | 0.15 | 0.14 | 0.69 |
| FP5 | Impatiens glandulifera | Himalayan balsam | 0.08 | 0.00 | 0.64 | 0.10 | 0.27 | 0.09 | 1.00 |
| MD1 | Plantago lanceolata | Ribowort plantain | 0.04 | 0.02 | 0.75 | 0.09 | 0.23 | 0.09 | 1.67 |
| MD2 | Lolium multiflorum | Italian Rye grass | 0.00 | 0.01 | 0.58 | 4.22 | 0.00 | 0.02 | 7.69 |
| MD3 | Juncus effusus | Soft rush | 0.09 | 0.03 | 0.77 | 0.26 | 1.51 | 0.16 | 1.63 |
| MD4 | Chamerion angustifolium | Rosebay willowherb | 0.01 | 0.01 | 0.16 | 0.12 | 0.00 | 0.02 | 0.56 |
| MD5 | Holcus lanatus | Yorkshire fog | 0.04 | 0.01 | 0.71 | 0.26 | 0.89 | 0.03 | 1.43 |
| RS1 | Urtica dioica | Stinging nettle | 0.15 | 0.02 | 0.93 | 0.50 | 0.51 | 0.12 | 2.39 |
| RS2 | Dactylis glomerata | Cocksfoot | 0.13 | 0.27 | 0.81 | 0.65 | 0.54 | 0.21 | 0.86 |
| RS3 | Festuca pratensis | Meadow fescue | 0.36 | 0.02 | 0.01 | 0.12 | 0.01 | 0.04 | 0.06 |
| RS4 | Glyceria maxima | Reed sweetgrass | 0.09 | 0.03 | 1.39 | 0.52 | 0.69 | 0.11 | 2.36 |
| RS5 | Phleum pratense | Timothy grass | 0.03 | 0.01 | 0.53 | 0.26 | 0.00 | 0.04 | 1.76 |
| RS6 | Lolium pratense | Ryegrass | 0.14 | 0.16 | 0.58 | 1.23 | 0.00 | 0.18 | 1.36 |
| WH1 | Equisetum arvense | Field horsetail | 0.04 | 0.01 | 0.86 | 0.15 | 0.00 | 0.06 | 0.92 |
| WH2 | Cynosurus cristatus | Crested dog’s tail | 0.04 | 0.06 | 0.24 | 1.86 | 0.96 | 0.09 | 1.23 |
| WH3 | Filipendula ulmaria | Meadowsweet | 0.01 | 0.03 | 1.07 | 0.40 | 0.00 | 0.08 | 1.32 |
| WH4 | Bistorta officinalis | Bistort | 0.82 | 0.03 | 0.52 | 1.23 | 0.72 | 0.34 | 0.52 |
| Median | 0.04 | 0.02 | 0.58 | 0.26 | 0.15 | 0.08 | 0.86 | ||
| Min | 0.00 | 0.00 | 0.01 | 0.03 | 0.00 | 0.01 | 0.06 | ||
| Max | 0.82 | 0.27 | 1.48 | 4.22 | 1.51 | 0.34 | 7.69 |
| Location | Plant Species | Common Name | As | Cr | Cu | Mn | Ni | Pb | Zn |
|---|---|---|---|---|---|---|---|---|---|
| FG1 | Agrostis stolonifera | Creeping bent | 0.19 | 0.01 | 0.02 | 0.08 | 0.13 | 0.02 | 0.16 |
| FG2 | Artemisia vulgaris | Mugwort | 0.92 | 0.15 | 0.15 | 0.92 | 0.22 | 0.20 | 0.99 |
| FG3 | Argrostis capillaries | Common bent | 0.08 | 0.09 | 0.12 | 0.31 | 0.23 | 0.06 | 0.18 |
| FG4 | Chamerion angustifolium | Rosebay willowherb | 0.48 | 0.02 | 0.44 | 0.85 | 0.41 | 0.05 | 0.74 |
| FG5 | Agrostis tenuis | Slender rush | 0.39 | 0.07 | 0.08 | 0.18 | 0.16 | 0.11 | 0.26 |
| FG6 | Dactylis glomerata | Cocksfoot | 0.00 | 0.02 | 0.12 | 0.46 | 0.19 | 0.10 | 0.22 |
| FG7 | Urtica dioica | Stinging nettle | 0.12 | 0.05 | 0.30 | 0.16 | 0.08 | 0.09 | 0.14 |
| FP1 | Galium aparine | Cleavers | 0.16 | 0.00 | 0.17 | 0.39 | 0.59 | 0.13 | 0.45 |
| FP2 | Phalaris arundinacea | Reed canary grass | 0.27 | 0.10 | 0.83 | 5.42 | 1.76 | 0.25 | 0.76 |
| FP3 | Heracleum sphondylium | Hogweed | 0.16 | 1.94 | 0.75 | 0.69 | 0.07 | 0.12 | 1.03 |
| FP4 | Juncus inflexus | Hard rush | 0.63 | 0.05 | 0.28 | 0.15 | 0.12 | 0.08 | 0.32 |
| FP5 | Impatiens glandulifera | Himalayan balsam | 0.07 | 0.54 | 0.20 | 1.31 | 0.19 | 0.15 | 0.34 |
| MD1 | Plantago lanceolata | Ribowort plantain | 0.28 | 0.15 | 0.20 | 0.21 | 0.43 | 0.29 | 0.16 |
| MD2 | Lolium multiflorum | Italian Rye grass | 0.56 | 0.13 | 0.28 | 0.51 | 0.50 | 0.25 | 0.20 |
| MD3 | Juncus effusus | Soft rush | 0.04 | 0.09 | 0.21 | 0.11 | 0.11 | 0.01 | 0.34 |
| MD4 | Chamerion angustifolium | Rosebay willowherb | 0.14 | 0.17 | 0.58 | 0.78 | 0.18 | 0.09 | 0.65 |
| MD5 | Holcus lanatus | Yorkshire fog | 0.07 | 0.94 | 0.10 | 0.11 | 0.10 | 0.16 | 0.08 |
| RS1 | Urtica dioica | Stinging nettle | 0.01 | 0.06 | 0.15 | 0.16 | 0.12 | 0.05 | 0.05 |
| RS2 | Dactylis glomerata | Cocksfoot | 0.03 | 0.01 | 0.13 | 0.14 | 0.16 | 0.04 | 0.26 |
| RS3 | Festuca pratensis | Meadow fescue | 0.04 | 0.12 | 0.38 | 0.55 | 0.44 | 0.09 | 0.44 |
| RS4 | Glyceria maxima | Reed sweetgrass | 0.10 | 0.09 | 0.07 | 0.34 | 0.18 | 0.04 | 0.09 |
| RS5 | Phleum pratense | Timothy grass | 0.21 | 0.28 | 0.19 | 0.48 | 0.27 | 0.25 | 0.25 |
| RS6 | Lolium pratense | Ryegrass | 0.00 | 0.01 | 0.10 | 0.40 | 0.15 | 0.02 | 0.18 |
| WH1 | Equisetum arvense | Field horsetail | 0.02 | 0.26 | 0.20 | 0.78 | 0.26 | 0.04 | 0.06 |
| WH2 | Cynosurus cristatus | Crested dog’s tail | 0.09 | 0.08 | 0.16 | 0.31 | 0.40 | 0.12 | 0.30 |
| WH3 | Filipendula ulmaria | Meadowsweet | 0.01 | 0.11 | 0.06 | 0.06 | 0.44 | 0.03 | 0.13 |
| WH4 | Bistorta officinalis | Bistort | 0.01 | 0.25 | 0.31 | 1.11 | 0.29 | 0.01 | 1.22 |
| Median | 0.10 | 0.09 | 0.19 | 0.39 | 0.19 | 0.09 | 0.26 | ||
| Min | 0.00 | 0.00 | 0.02 | 0.06 | 0.07 | 0.01 | 0.05 | ||
| Max | 0.92 | 1.94 | 0.83 | 5.42 | 1.76 | 0.29 | 1.22 |
© 2019 by the authors. Licensee MDPI, Basel, Switzerland. This article is an open access article distributed under the terms and conditions of the Creative Commons Attribution (CC BY) license (http://creativecommons.org/licenses/by/4.0/).
Share and Cite
Nworie, O.E.; Qin, J.; Lin, C. Trace Element Uptake by Herbaceous Plants from the Soils at a Multiple Trace Element-Contaminated Site. Toxics 2019, 7, 3. https://doi.org/10.3390/toxics7010003
Nworie OE, Qin J, Lin C. Trace Element Uptake by Herbaceous Plants from the Soils at a Multiple Trace Element-Contaminated Site. Toxics. 2019; 7(1):3. https://doi.org/10.3390/toxics7010003
Chicago/Turabian StyleNworie, Obinna Elijah, Junhao Qin, and Chuxia Lin. 2019. "Trace Element Uptake by Herbaceous Plants from the Soils at a Multiple Trace Element-Contaminated Site" Toxics 7, no. 1: 3. https://doi.org/10.3390/toxics7010003
APA StyleNworie, O. E., Qin, J., & Lin, C. (2019). Trace Element Uptake by Herbaceous Plants from the Soils at a Multiple Trace Element-Contaminated Site. Toxics, 7(1), 3. https://doi.org/10.3390/toxics7010003