Highlights
What are the main findings?
- Copper sulfate exposure disrupts wheat germination by suppressing ethylene, increasing ammonia levels, and triggering oxidative stress and Cu2+ accumulation.
What is the implication of the main finding?
- Integrated CO2LPAS-EPR facilitates the non-invasive real-time detection of heavy metal stress for environmental and agricultural applications.
Abstract
Copper is an essential micronutrient for plants, but excessive levels can induce toxicity and impair physiological functions. This study evaluates the toxic effects of copper sulfate (CuSO4) on the germination of common wheat (Triticum aestivum), with emphasis on the gas emission dynamics and oxidative stress biomarkers. Seeds were germinated in agar and exposed to CuSO4 at concentrations of 1 µM, 100 µM, 1 mM, and 10 mM; distilled water served as the control. Ethylene and ammonia emissions were quantified using CO2 laser photoacoustic spectroscopy, while electron paramagnetic resonance (EPR) spectroscopy was employed to detect free radicals and Cu2+ complexes. Exposure to Cu concentrations ≥ 1 mM significantly inhibited germination and biomass accumulation. Enhanced ethylene and ammonia emissions, particularly at 10 mM, indicated stress-related metabolic responses. The EPR spectra confirmed the presence of semiquinone radicals and Cu2+ complexes under higher Cu levels. These results demonstrate that photoacoustic and EPR techniques are effective tools for the early detection of metal-induced phytotoxicity and offer a non-invasive approach to environmental toxicity screening and plant stress assessment.
1. Introduction
Copper (Cu) is an essential micronutrient required in trace amounts for typical physiological function in plants, but it becomes toxic when present in excess. In soils, copper’s solubility is primarily influenced by pH and organic matter content [1]. The copper requirements for healthy plant development vary among species and cultivars [2], while phytotoxicity depends on the metal’s solubility and bioavailability [3,4]. Both copper deficiency and excess can inhibit plant growth and disrupt key biochemical pathways [5,6].
Copper plays a vital role in several physiological and metabolic functions in plants. It involves photosynthesis, carbon and nitrogen metabolism, oxidative stress defense, and cell wall synthesis. Additionally, depending on its oxidation state, copper can act as a reducing or oxidizing agent in various biochemical reactions [7].
Copper deficiency, typically defined as concentrations below 5 mg/kg of a plant’s dry weight, can severely impair plant growth [2]. Symptoms initially manifest in the young leaves and reproductive organs and include an altered root architecture, leaf deformation, chlorosis, and necrosis [7,8]. Copper deficiency is also associated with a reduced chlorophyll content and impaired photosynthesis [2,7,8]; diminished activity of nitrogen-assimilating enzymes such as glutamine synthetase [9]; and altered gene expression patterns [10].
Conversely, excessive copper concentrations are toxic and elicit adverse morphological, physiological, and molecular effects throughout plant development. Numerous studies have reported reduced seed germination under copper exposure [10,11,12], although the extent of this effect varies significantly among species, indicating different tolerance levels. High copper levels also negatively impact plant morphology by reducing root and stem length and limiting leaf expansion [13,14,15,16], ultimately decreasing biomass and productivity [13,17,18]. Furthermore, excess copper can interfere with the uptake and accumulation of other essential mineral nutrients [2,14,19,20]. These toxic effects depend on the species, copper concentration, exposure duration, and growth conditions [2].
One of the most widely documented consequences of copper toxicity is the inhibition of photosynthesis, often associated with a decline in chlorophyll content [2,8,21,22,23]. This is believed to result from structural damage to the photosynthetic apparatus under elevated copper levels [2,17]. At the cellular level, copper toxicity induces oxidative stress by generating reactive oxygen species (ROS). ROS accumulation has been confirmed in multiple plant species under copper exposure [2,16,24], where it contributes to oxidative damage to proteins, lipids, and DNA, thereby disrupting cellular homeostasis.
While the adverse effects of copper stress on wheat germination and nitrogen metabolism have previously been documented [25,26], earlier studies have largely relied on traditional, often invasive techniques to assess biochemical and physiological changes. In contrast, the present study introduces an innovative, dual-analytical approach that integrates CO2 laser photoacoustic spectroscopy (CO2LPAS) and electron paramagnetic resonance (EPR) spectroscopy. CO2LPAS offers real-time, non-destructive detection of key volatile biomarkers (ethylene and ammonia) at ppb levels [27,28], enabling continuous monitoring of stress-induced metabolic shifts. EPR spectroscopy complements this by revealing radical species, discussing copper(II) semiquinonato [29] and Cu2+ accumulation patterns in distinct plant tissues with high molecular specificity. This combined strategy allows for a dynamic and comprehensive evaluation of the early-stage responses to copper toxicity in wheat, offering novel insights beyond those obtainable using the conventional methods. Compared to conventional methods such as gas chromatography (GC) and mass spectrometry (MS) [30,31,32], CO2LPAS enables real-time analysis without extensive sample preparation [33]. It is particularly well suited to studying dynamic biological processes, such as plant respiration. While GC and MS offer excellent chemical specificity, they are generally more time-consuming, expensive, and less adaptable to continuous or in situ monitoring. Although compact and low-cost, electrochemical sensors typically lack the sensitivity and selectivity required to detect low concentrations of gases [34,35] such as ethylene or ammonia in complex biological environments. CO2LPAS effectively bridges this gap, offering parts-per-billion detection limits, high selectivity via laser wavelength tuning, and the ability to monitor multiple volatile compounds simultaneously.
This study utilized CO2LPAS to quantify the ethylene and ammonia emissions from germinating wheat seedlings, allowing for a dynamic assessment of the physiological disruptions caused by copper toxicity. In parallel, electron paramagnetic resonance (EPR) spectroscopy was used to detect free radicals [36] and to investigate the copper uptake in wheat germ samples exposed to copper sulfate (CuSO4). As a highly sensitive technique for identifying species with unpaired electrons, EPR spectroscopy facilitates the analysis of paramagnetic species in biological tissues [37]. By correlating respiratory gas emissions with copper accumulation, this study seeks to offer an integrated view of the physiological and biochemical effects of copper toxicity in wheat, shedding light on the underlying stress response mechanisms. This versatile approach could also be adapted to other stressors (e.g., cadmium, drought). Against this background, our study stands out by employing an innovative dual-technique approach, leveraging CO2LPAS to dynamically quantify ethylene and ammonia emissions and EPR spectroscopy to characterize free radicals and copper uptake. This dual-technique approach uncovered novel mechanistic insights into copper stress: (1) the suppression of ethylene signaling likely via the inhibition of biosynthetic enzymes and (2) metabolic disruption, as evidenced by ammonia accumulation and free radical suppression. The EPR spectra also revealed tissue-specific Cu2+ complexation patterns, suggesting differing detoxification strategies in the roots, grains, and leaves.
2. Materials and Methods
2.1. Seed Preparation
Common wheat seeds (Triticum aestivum) were obtained from a local producer, a local agricultural supplier in our region. Seeds with visible defects were removed, and selected seeds were disinfected using a 3% hydrogen peroxide solution. The seeds were exposed to the hydrogen peroxide solution for a specified duration, ensuring thorough disinfection, and were then dried on absorbent paper.
2.2. The Germination Setup
For each treatment condition, three independent biological replicates were used. Each replicate consisted of a separate Duran glass container containing 40 individual wheat seeds germinated under identical conditions in 0.6% agar solution. This approach ensured that each replicate represented an independent biological event and that the results reflected the population-level variability rather than instrument precision. In total, 15 containers were used: 3 for each of the 5 treatment groups (control + 4 CuSO4 concentrations).
Gas emission measurements and EPR analyses were carried out on bulk samples from each biological replicate to obtain averaged physiological and spectroscopic responses.
2.3. The CuSO4 Treatment
Copper sulfate (CuSO4) solutions were prepared using copper(II) sulfate pentahydrate (Sigma-Aldrich, St. Louis, MO, USA, M = 249.99 g/mol). The concentrations tested were 1 µM, 100 µM, 1 mM, and 10 mM. Distilled water served as the control treatment. After 72 h of germination under controlled conditions (22 °C, dark), the seedlings were approximately 1 cm in size. At this stage, 2.5 mL of the respective CuSO4 solution or distilled water was added to each container.
2.4. Environmental Control
The germination process was conducted in a Nuve TK120 climate chamber (NÜVE, Ankara, Turkey, located at the National Institute for Laser Plasma and Radiation Physics, Department of Plasma Physics and Nuclear Fusion, Măgurele, Romania) at 22 °C in complete darkness for the first 72 h. After the CuSO4 solutions had been applied, the chamber was programmed to a 16 h light/8 h dark cycle, simulating normal photoperiod conditions. Light was provided by fluorescent lamps with a light intensity of approximately 150 µmol·m−2·s−1 at the seedling level. Relative humidity was maintained at 60 ± 5% throughout the germination and treatment periods to ensure optimal moisture levels in the agar medium.
2.5. Gas Analysis via CO2 Laser Photoacoustic Spectroscopy
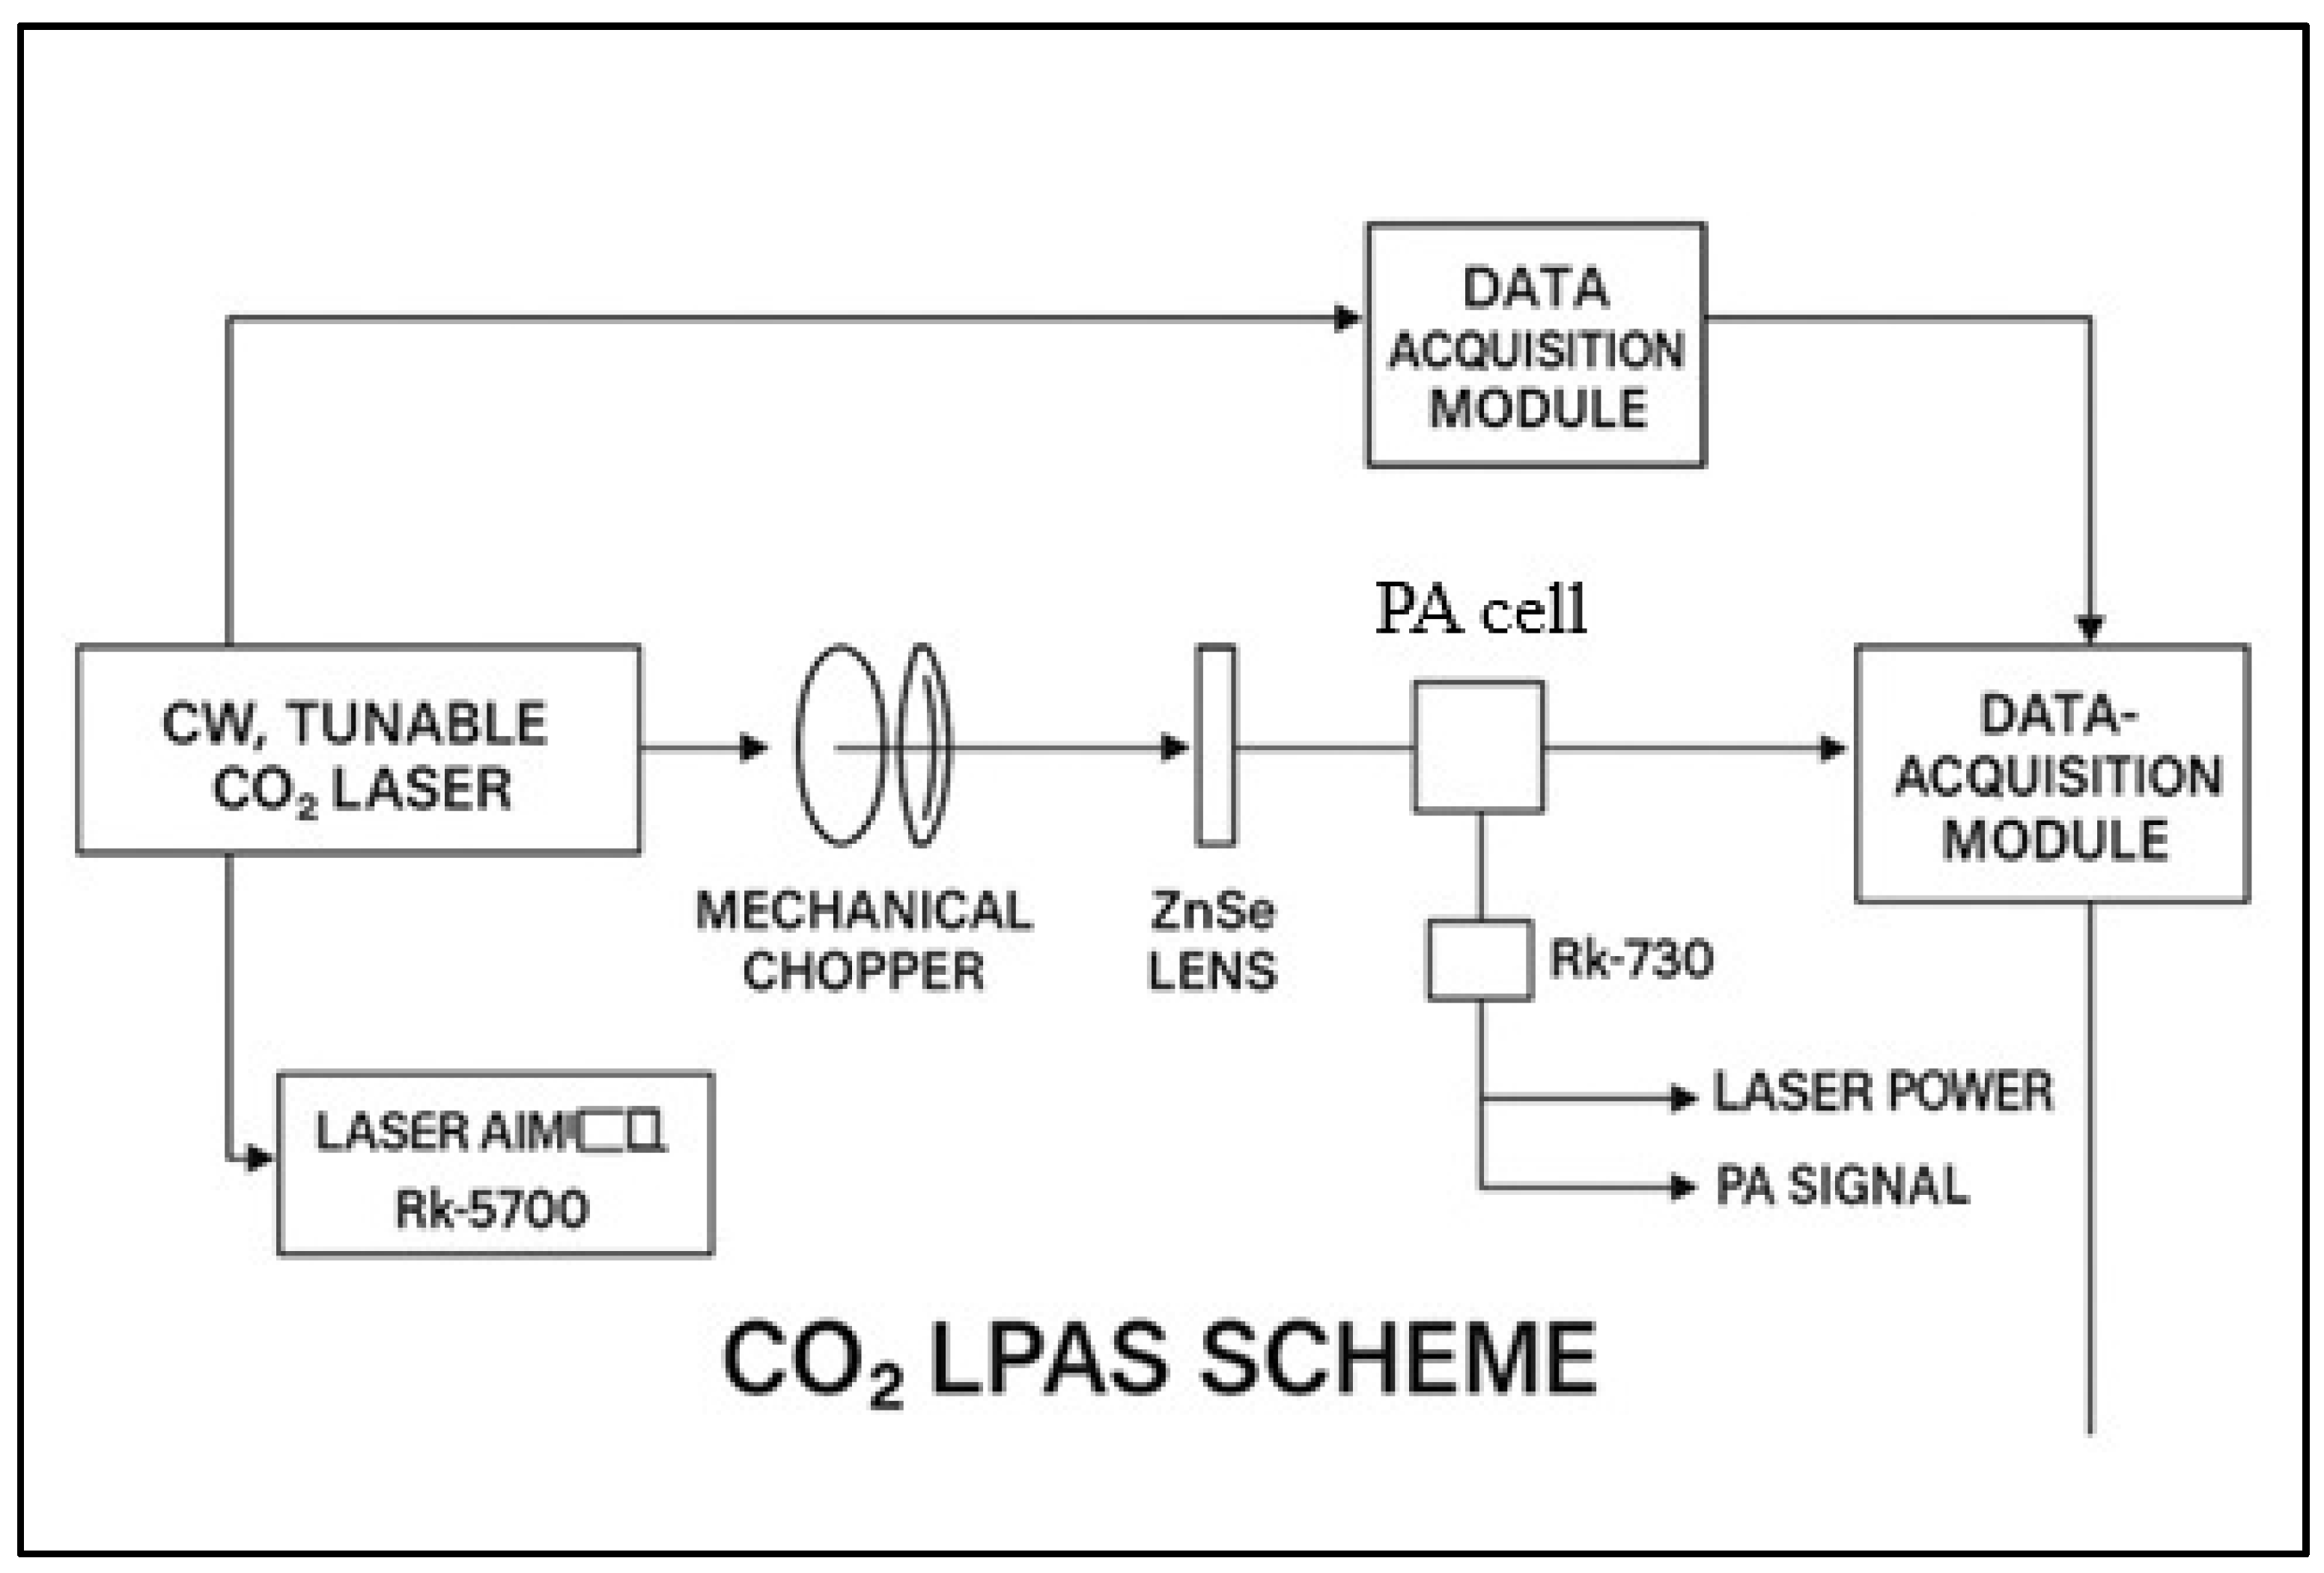
The ethylene and ammonia concentrations in plant respiration were measured 48 h post-treatment, i.e., 120 h after the start of germination. A custom-built CO2 laser photoacoustic spectroscopy system was used, as can be seen in Figure 1, originally developed and characterized in our earlier work [38] and later optimized for biological plant-based measurements, as described in [39], and consisting of (i) a frequency-stabilized CO2 laser operating in the 9.2–10.8 μm range, (ii) a longitudinal resonant photoacoustic cell with a 564 Hz resonance frequency, and (iii) an electronic signal processing unit, including a lock-in amplifier.

Figure 1.
A schematic diagram of the custom-built CO2 laser photoacoustic spectroscopy (LPAS) system. The setup consists of three major subsystems: (1) a frequency-stabilized CO2 laser operating in the 9.2–10.8 μm range, (2) a longitudinally resonant photoacoustic (PA) cell designed for gas detection, and (3) a data acquisition and signal processing system, including a lock-in amplifier.
The sample under investigation in terms of the emission of gases produced in various biological processes is connected to the photoacoustic (PA) cell through a sealed system. The cuvettes in which the samples are placed are made of glass and equipped with an inlet and a gas outlet. For experiments that require the plant’s gas production to be recorded, the cuvettes can be adjusted to isolate these parts without destructively affecting the sample.
The pressure in the measurement setup is controlled in real time using a Type 122 A Baratron capacitive manometer (MKS Instruments, Inc., Andover, MA, USA). The emitted gas is carried by a buffer gas, in this case, synthetic air, to be introduced into the measurement cell. Before it is introduced into the FA cell, the gas sample passes through a trap that retains the interfering/ununited gas. This is practically achieved by introducing trap filters into the gas circuit, efficiently retaining any other components possibly present in the measurement gas. In this direction, a trap with a volume of 120 cm3 containing potassium hydroxide (KOH pellets) is necessary to remove CO2 and water vapor from plant respiration. After removing unwanted components, the measurement gas can be introduced into the PA cell for measurement. The gas flow was regulated using precision mass flow controllers (MKS 1179A and 2259CC, MKS Instruments, Andover, MA, USA). Nitrogen flushing between samples ensured minimal background drift (<10%).
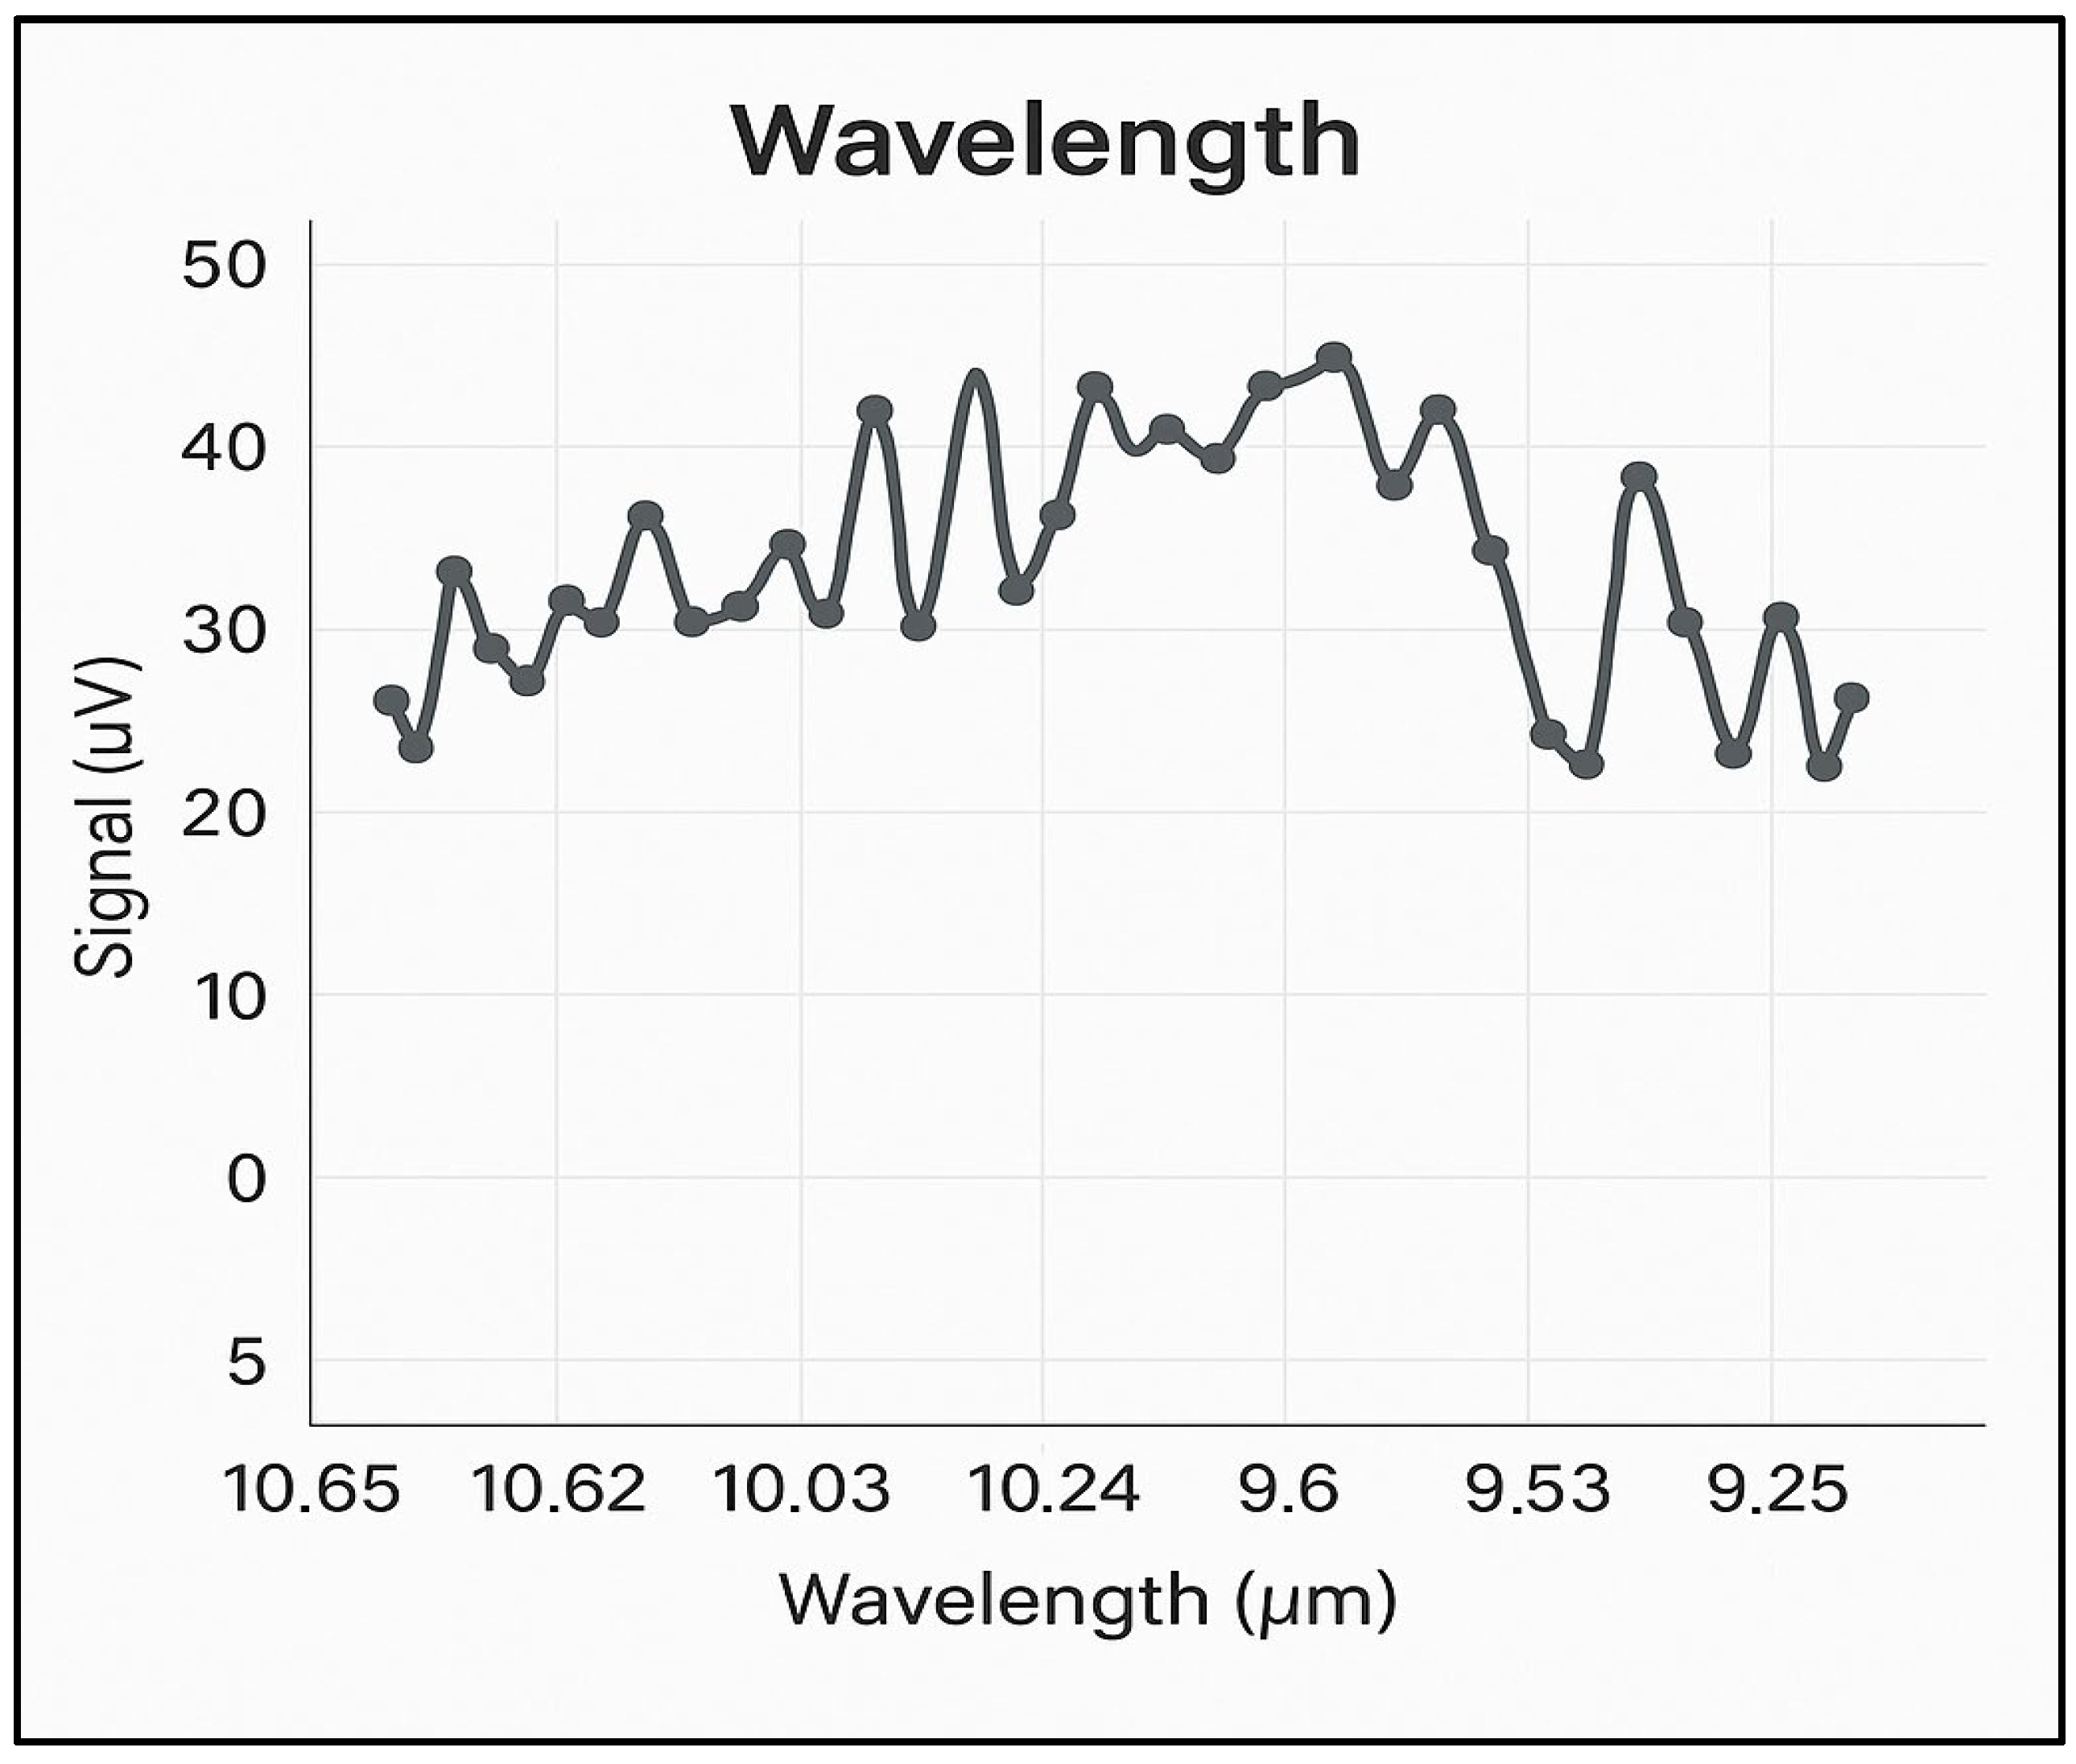
The noise encountered in the photoacoustic experiments was minimized, with the highest background noise found to be 6 µV/W or a maximum of 30 µV in nitrogen at 6.0 purity (99.9999%). Figure 2 shows the background noise spectrum in nitrogen, at atmospheric pressure, across all four branches of the CO2 laser emission spectrum, i.e., between 9.2 and 10.8 µm. With this noise value and the optimized characteristics of the photoacoustic cell, a detection limit below 1 ppb for ethylene at the wavelength of the 10P(14) line of the CO2 laser is ensured.
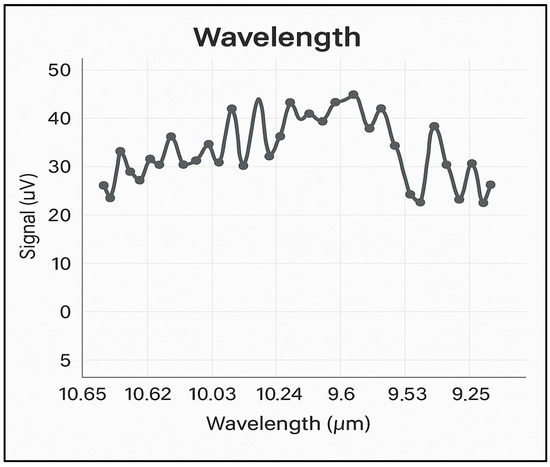
Figure 2.
The absorption spectrum of CO2 laser radiation on the four branches 10P, 10R, 9P, and 9R in 6.0 pure nitrogen.
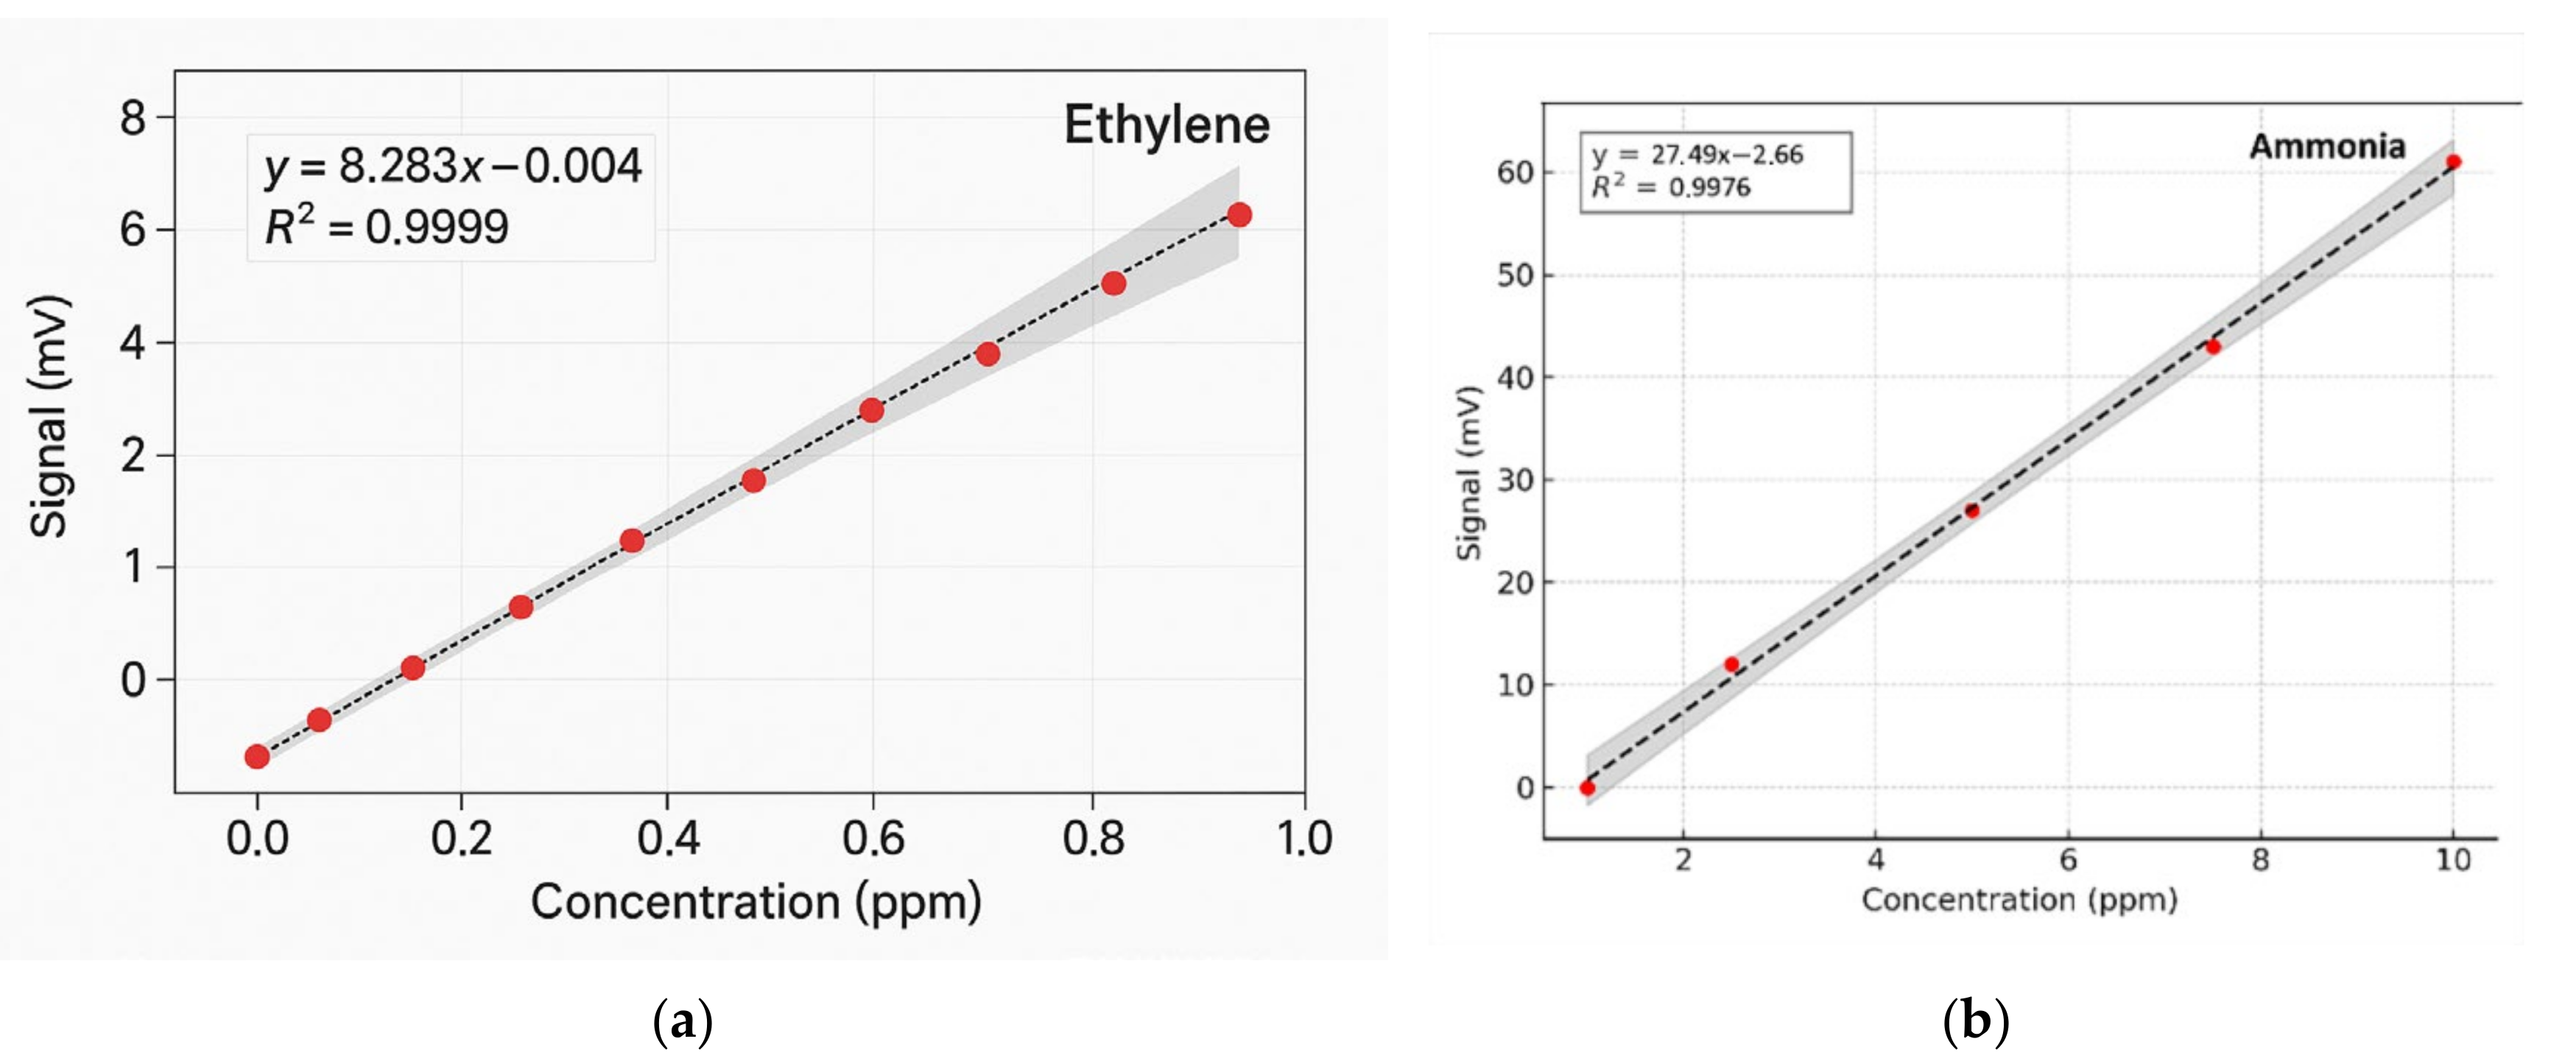
To determine the concentrations of ethylene and ammonia in the respiration of common wheat plants, the absorption coefficients for the two gases were preliminarily determined in the emission range of the CO2 laser. Thus, for the determination of the absorption coefficients of ethylene (see Figure 3a), a certified, commercially prepared mixture containing 0.96 ppm ethylene in pure nitrogen was used. To determine the ammonia absorption coefficients (see Figure 3b), a certified mixture containing 10 ppm (parts per million) of ammonia in pure nitrogen was used. These measurements were taken at a total pressure of approximately 1030 mbar and a temperature T = 23 °C. To ensure selective detection of ethylene and ammonia in the plant-emitted gas mixture, the CO2 laser was tuned to specific laser lines with known, high absorption coefficients, the 10P(14) line at λ = 10.529 µm for ethylene (α = 30.4 cm−1 atm−1) and the 9R(30) line at λ = 9.217 µm for ammonia (α = 57.12 cm−1 atm−1), based on certified standard mixtures. To eliminate potential spectral interference from common background gases such as CO2 and water vapor, the sample stream was passed through a trap containing potassium hydroxide (KOH pellets), which effectively removed these components before analysis. The photoacoustic cell was flushed with high-purity nitrogen (N2 6.0, 99.9999%) between samples to minimize background noise and carryover. Background spectra (Figure 2) confirmed low noise and the absence of interfering absorption across the CO2 laser emission range. Additionally, the calibration curves for both target gases (Figure 4) confirmed the linearity and specificity of the system’s response at the chosen wavelengths.
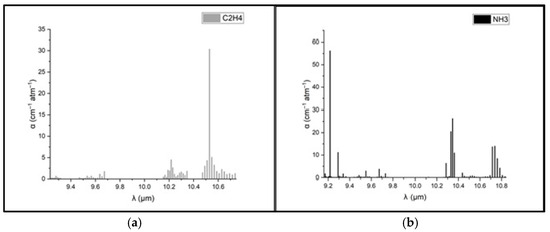
Figure 3.
Absorption coefficients at laser lines for (a) ethylene and (b) ammonia [39,40,41].
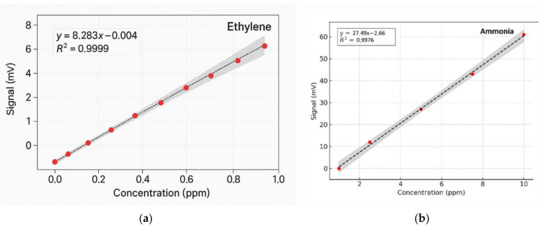
Figure 4.
Regression curves and Pearson’s correlation coefficients using GraphPad Prism version 10 for (a) ethylene and (b) ammonia [41].
The method’s high sensitivity allowed us to investigate some fundamental processes in plant physiology. As long as the absorption factors of ethylene and ammonia at separate laser wavelengths were specifically estimated, the CO2 laser was set to specific lines: first on the 10P(14) line and then on the 9R(30) line. Calibration measurements (concentration-dependent response) for both ammonia and ethylene (see Figure 4a,b) were experimentally determined using the accepted values for ethylene and ammonia.
2.6. The Statistical Analysis
The data are presented as the mean ± standard deviation (SD). A one-way analysis of variance (ANOVA) was used to evaluate the significance of the differences between treatment groups for each measured parameter (gas emission levels). When the ANOVA indicated significant differences (p < 0.05), Tukey’s post hoc test was applied to identifying specific group differences. The statistical analysis was conducted with GraphPad Prism 10 and OriginPro 2019. All statistical analyses were based on three independent biological replicates per group, ensuring a meaningful comparison of the treatment effects.
2.7. Paramagnetic Species Analysis via EPR Spectroscopy
Electron paramagnetic resonance (EPR) spectroscopy was employed to monitor the copper uptake from aqueous solutions with varying concentrations. This technique also enabled the detection of the free radicals present in the wheat samples.
EPR spectroscopy is a powerful analytical tool that provides unique information about magnetic interactions in atomic or molecular systems containing unpaired electrons. Its versatility allows for a wide range of applications—from studying the relaxation processes in multilevel spin systems in a crystal [42] to identifying the free radicals induced by ionizing radiation [43] and investigating cultural heritage materials [44]. It can also be used to analyze diamagnetic systems via spin-probe and spin-trapping techniques [45].
The EPR experiments were carried out at the Research Center for Advanced ESR Techniques of the National Institute of Materials Physics (Măgurele, Romania). All measurements were performed at room temperature using a Bruker EMX-plus X-band spectrometer (Bruker, Billerica, MA, USA) equipped with a Varian E-12 electromagnet [46].
EPR spectroscopy was employed to monitor the copper uptake from aqueous solutions with varying concentrations. This technique also enabled the detection of the free radicals present in the wheat samples. Due to the polar nature of the growth medium, measurements were performed on dried samples.
To investigate the absorption of copper, EPR measurements were carried out on three types of samples: agar substrate with plant roots, germinated wheat grains, and leaves. For each sample type, experimental determinations were performed at three different CuSO4 concentrations: 100 µM, 1 mM, and 100 mM. At concentrations lower than 1 mM, the presence of Cu ions was not observed in the EPR spectra [47,48].
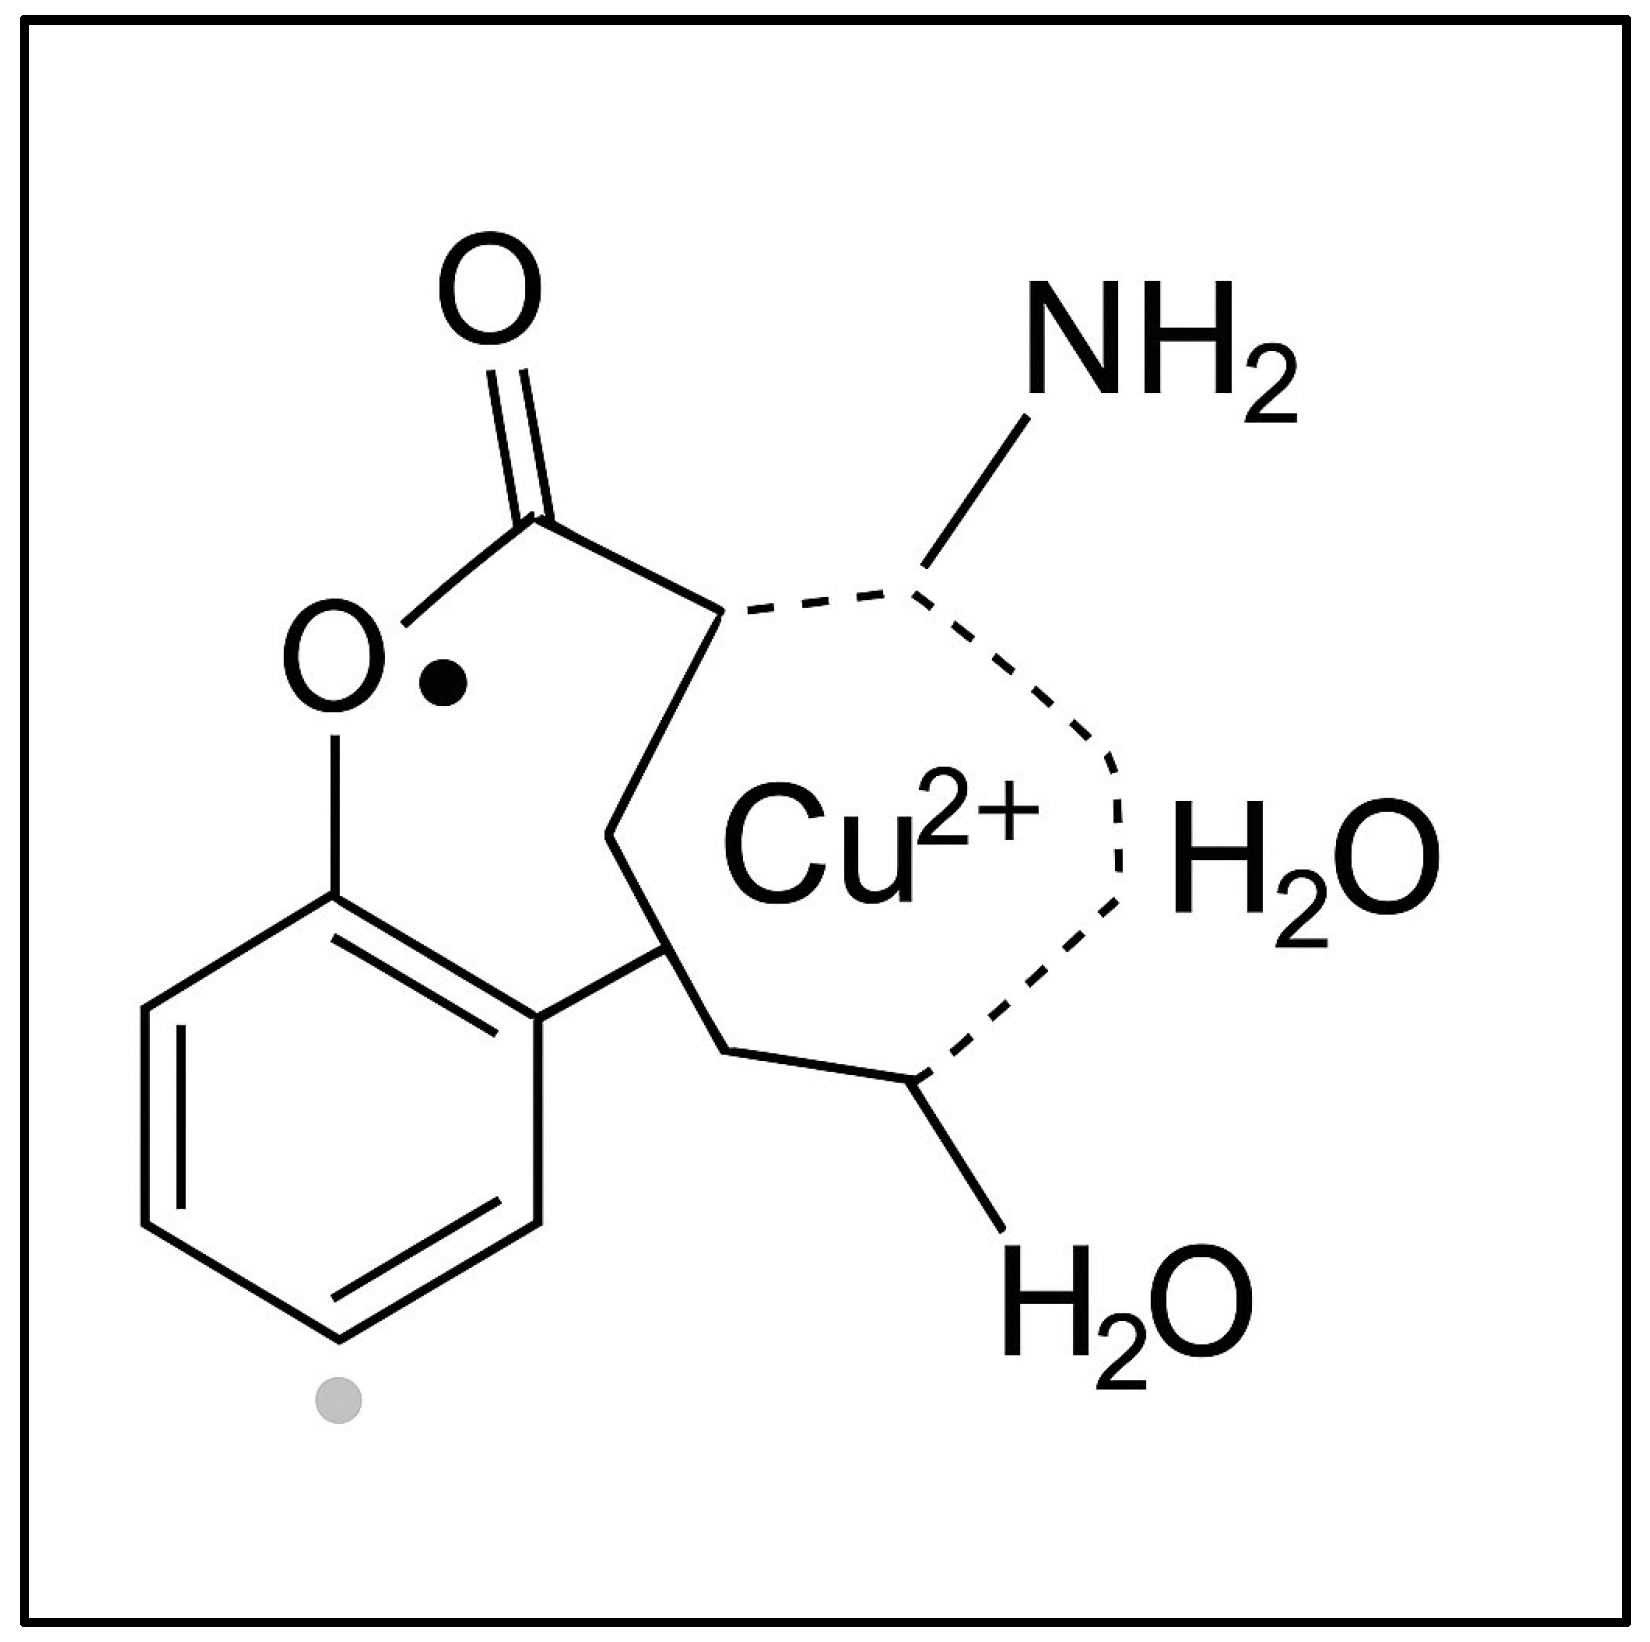
A common feature observed in all sample types (agar with roots, grains, and leaves) was a signal corresponding to a g-factor of g = 2.0048 ± 0.0002, also present in ungerminated wheat grains. This signal was attributed to the presence of semiquinone-type free radicals [49]. Figure 5 illustrates a coordination complex formed between a copper(II) ion (Cu2+) and a semiquinone-type radical ligand derived from a catecholic structure. The Cu2+ center is coordinated into a distorted square planar or square pyramidal geometry involving (i) two oxygen atoms from the semiquinone ligand (highlighting its bidentate binding and radical character); (ii) one amino group (representing nitrogen donor atoms from amino acids or peptides in the plant tissue); and (iii) one or two water molecules (completing the coordination sphere). This model, presented in Figure 5, reflects the interaction between transition metal ions and organic radicals observed in the wheat germ samples via EPR spectroscopy. The semiquinone radical is EPR-active, and its presence, alongside Cu2+, indicates the interactions during Cu exposure.

Figure 5.
The proposed structure of a copper(II)–semiquinone radical complex with plant-derived ligands.
In biochemical processes, copper ions can exist in both Cu2+ and Cu+ oxidation states. The valence state plays a critical role in mediating intracellular transport and reactivity. However, due to its closed-shell electronic configuration (d10), Cu+ is EPR-silent and cannot be detected by this technique. In contrast, Cu2+ ions, with a d9 electronic configuration and a single unpaired electron (S = 1/2), produce a characteristic EPR signal. This unpaired electron interacts with the copper nucleus (I = 3/2), resulting in a typical four-line hyperfine splitting pattern.
Considering the ground-state orbital symmetry (dx2–y2) of the Cu2+ ion—which depends on the nature of the coordinating ligands—the EPR spectrum is expected to display a characteristic anisotropic signal with hyperfine splitting observed in the parallel region.
In cases where Cu2+ ions form clusters or aggregates, the EPR spectra are affected by additional exchange or dipolar interactions. Depending on their strength, these interactions can obscure the anisotropic features or even the hyperfine structure entirely.
3. Results
The exposure of germinating wheat seeds to increasing concentrations of copper sulfate resulted in significant physiological and biochemical alterations, as evidenced by changes in the plant respiration markers.
3.1. The Germination Protocol for Common Wheat Plants (Triticum aestivum)
A controlled germination protocol was carried out for common wheat seeds in a 6% agar solution, thus establishing a protocol for seed germination in a controlled environment. For three consecutive days and 48 h after the seedlings were contaminated, the samples were analyzed by measuring the concentrations of ethylene and ammonia in the respiration of the wheat plantlets, thus also establishing a protocol for the analysis of plant respiration using CO2LPAS. The parameters of the CO2LPAS system are presented in Table 1.

Table 1.
Selection of measurable factors for determining gases in common wheat seedlings.
The respiration in common wheat plants (Triticum aestivum) under controlled conditions and heavy metal stress was analyzed [49] according to the protocol outlined in Table 2. The heavy metal stress was induced using CuSO4 solutions at concentrations of 1 µM, 100 µM, 1 mM, and 10 mM.
Table 2.
Germination parameters.
3.2. Gas Emission Analysis
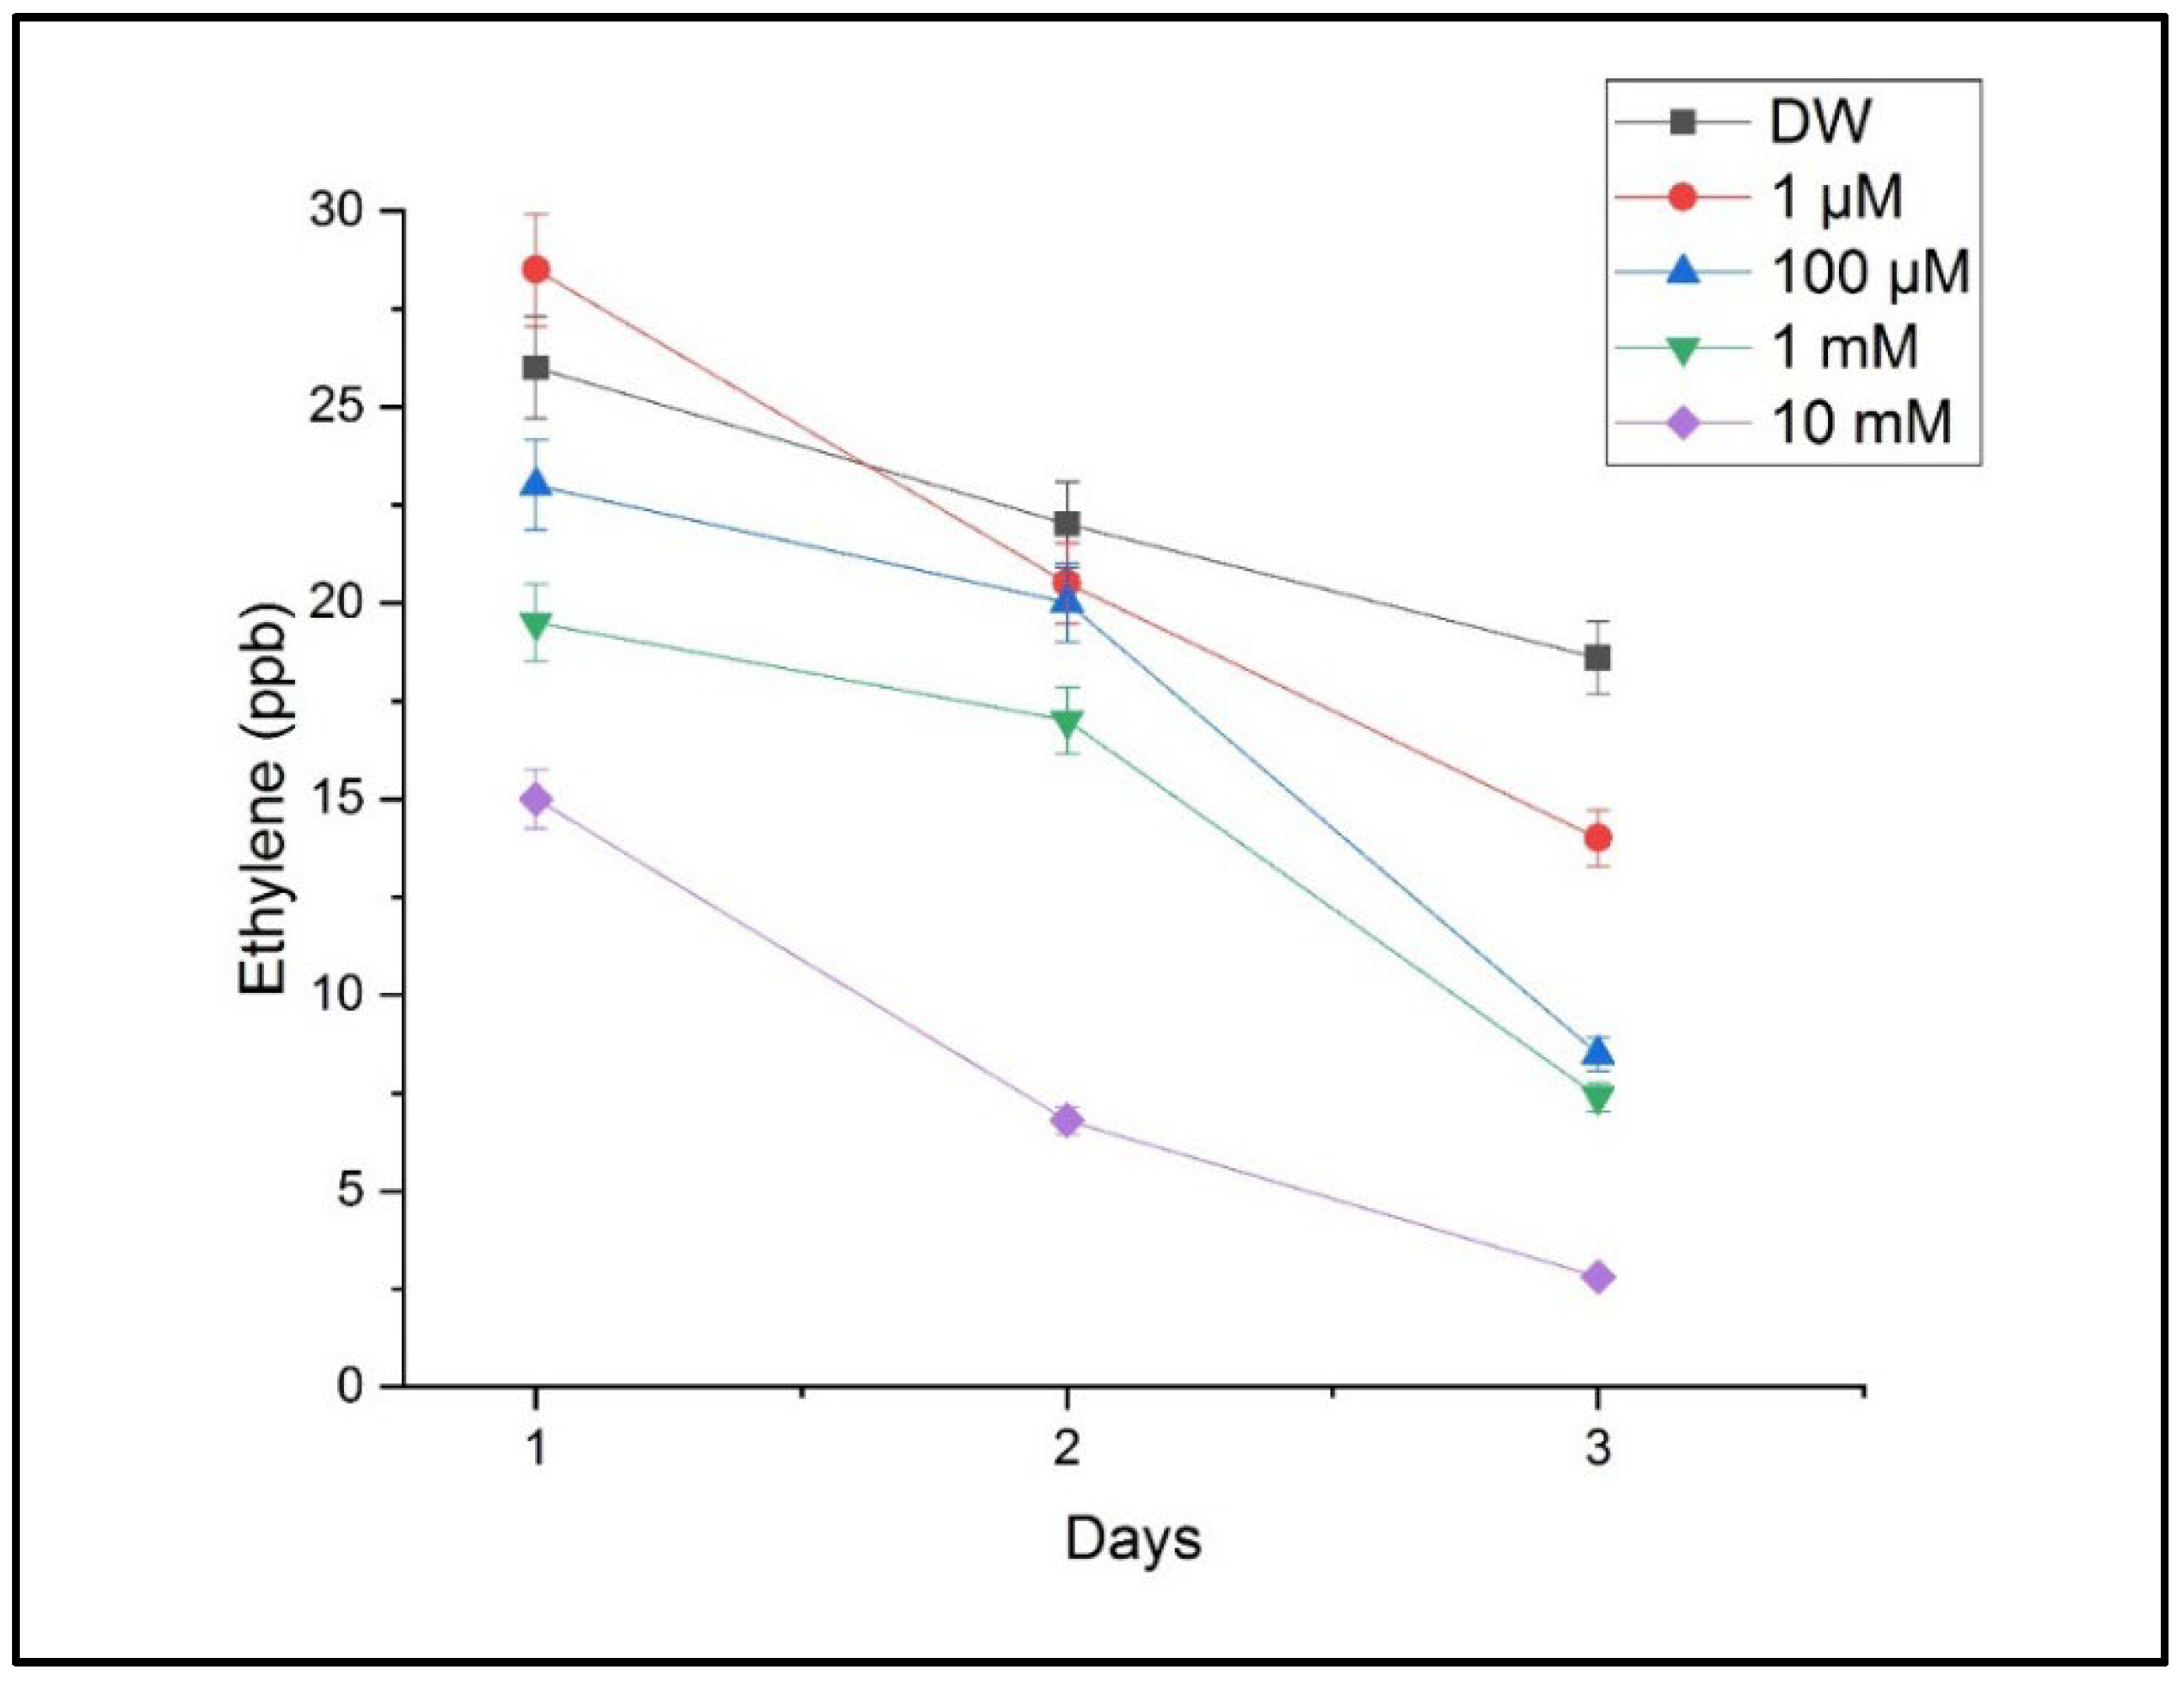
The measurements performed using CO2 laser photoacoustic spectroscopy revealed significant alterations in the ethylene and ammonia concentrations in the headspace of the treated samples. Ethylene levels, which are associated with stress signaling and growth regulation, showed a progressive decrease with an increasing Cu concentration. The highest ethylene emission was detected in the seedlings treated with 10 mM of CuSO4, indicating a strong stress response, as shown in Figure 6.
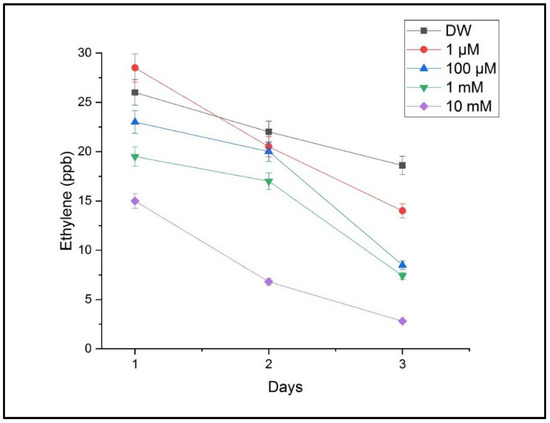
Figure 6.
The ethylene concentrations in the headspace of germinating wheat seeds after exposure to different concentrations of CuSO4 compared with those for the reference sample, with DW (distilled water). Mean ethylene emission (ppmV) measured via LPAS at 120 h post-germination; error bars represent the standard deviation from three replicates.
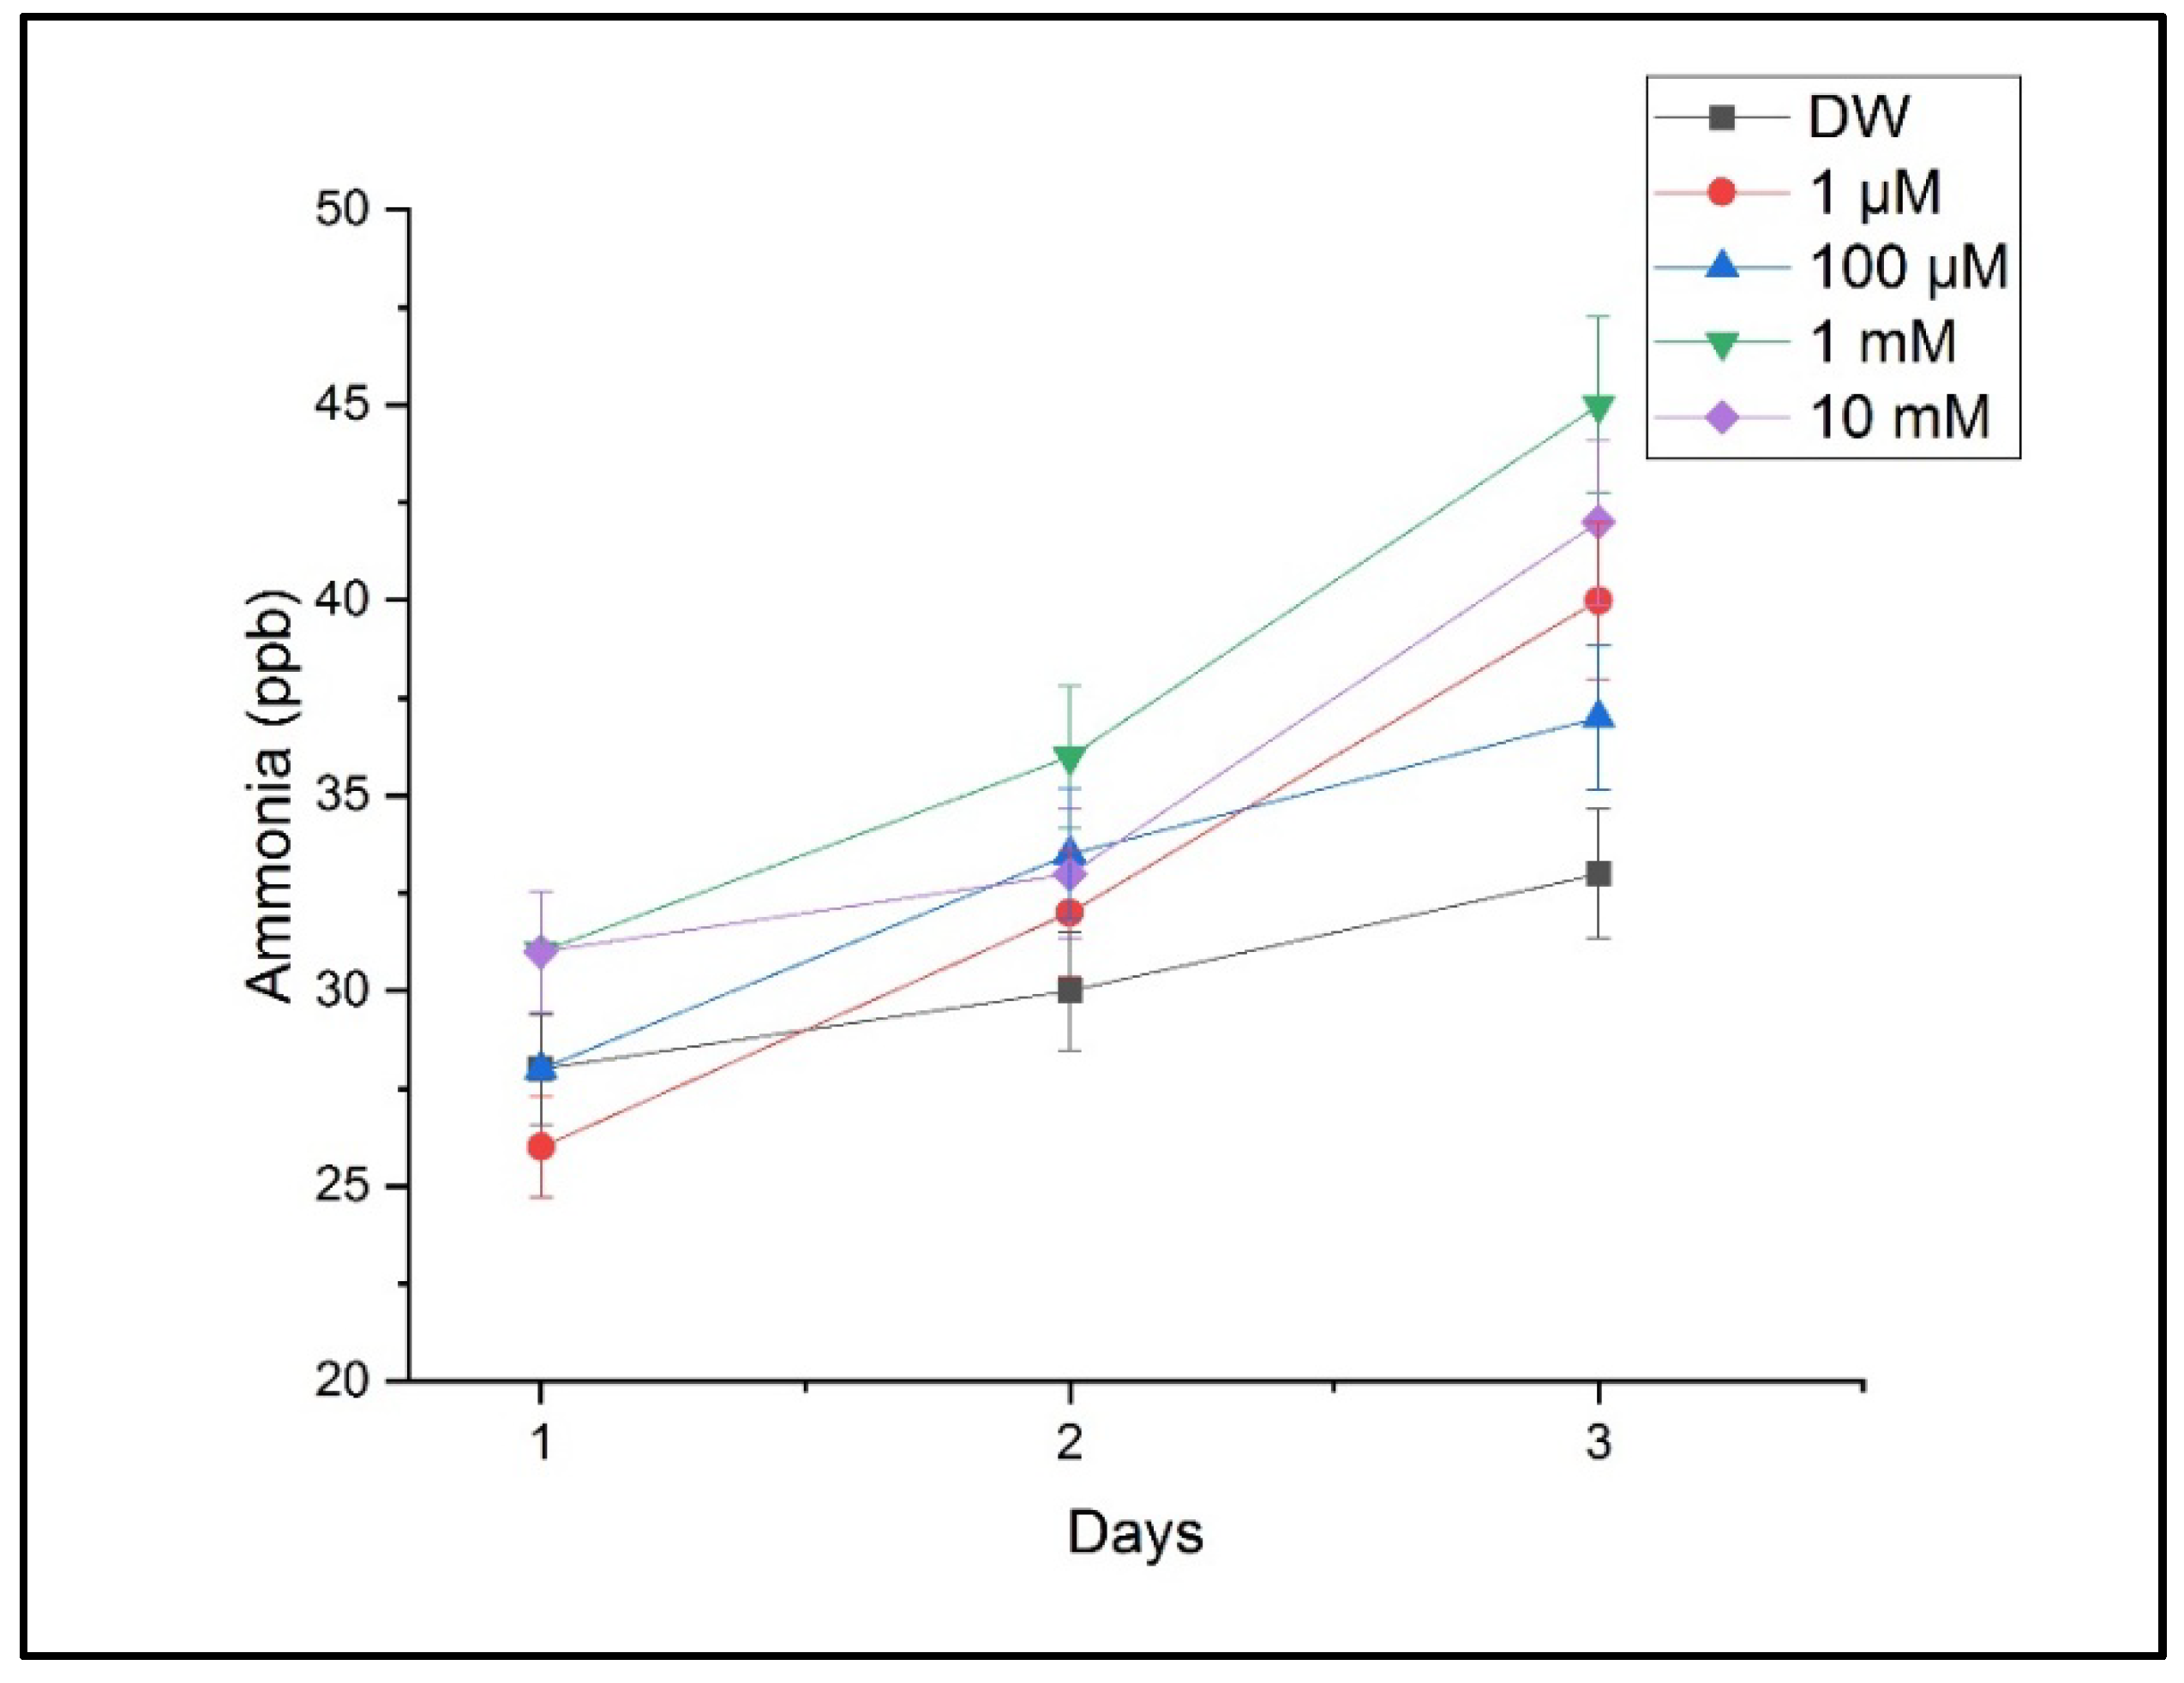
Figure 7 presents ammonia levels indicative of a disrupted nitrogen metabolism. Ammonia increased significantly under the 1 mM and 10 mM treatments, supporting the hypothesis that copper interferes with key metabolic pathways.
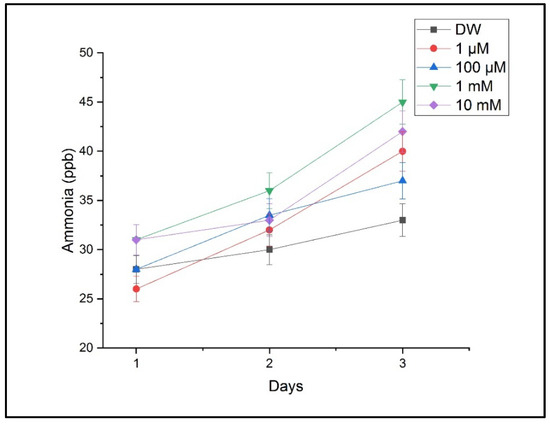
Figure 7.
Ammonia concentration in plant respiration under varying CuSO4 treatments. Ammonia levels were detected using LPAS. Values correspond to mean ± SD from triplicate measurements.
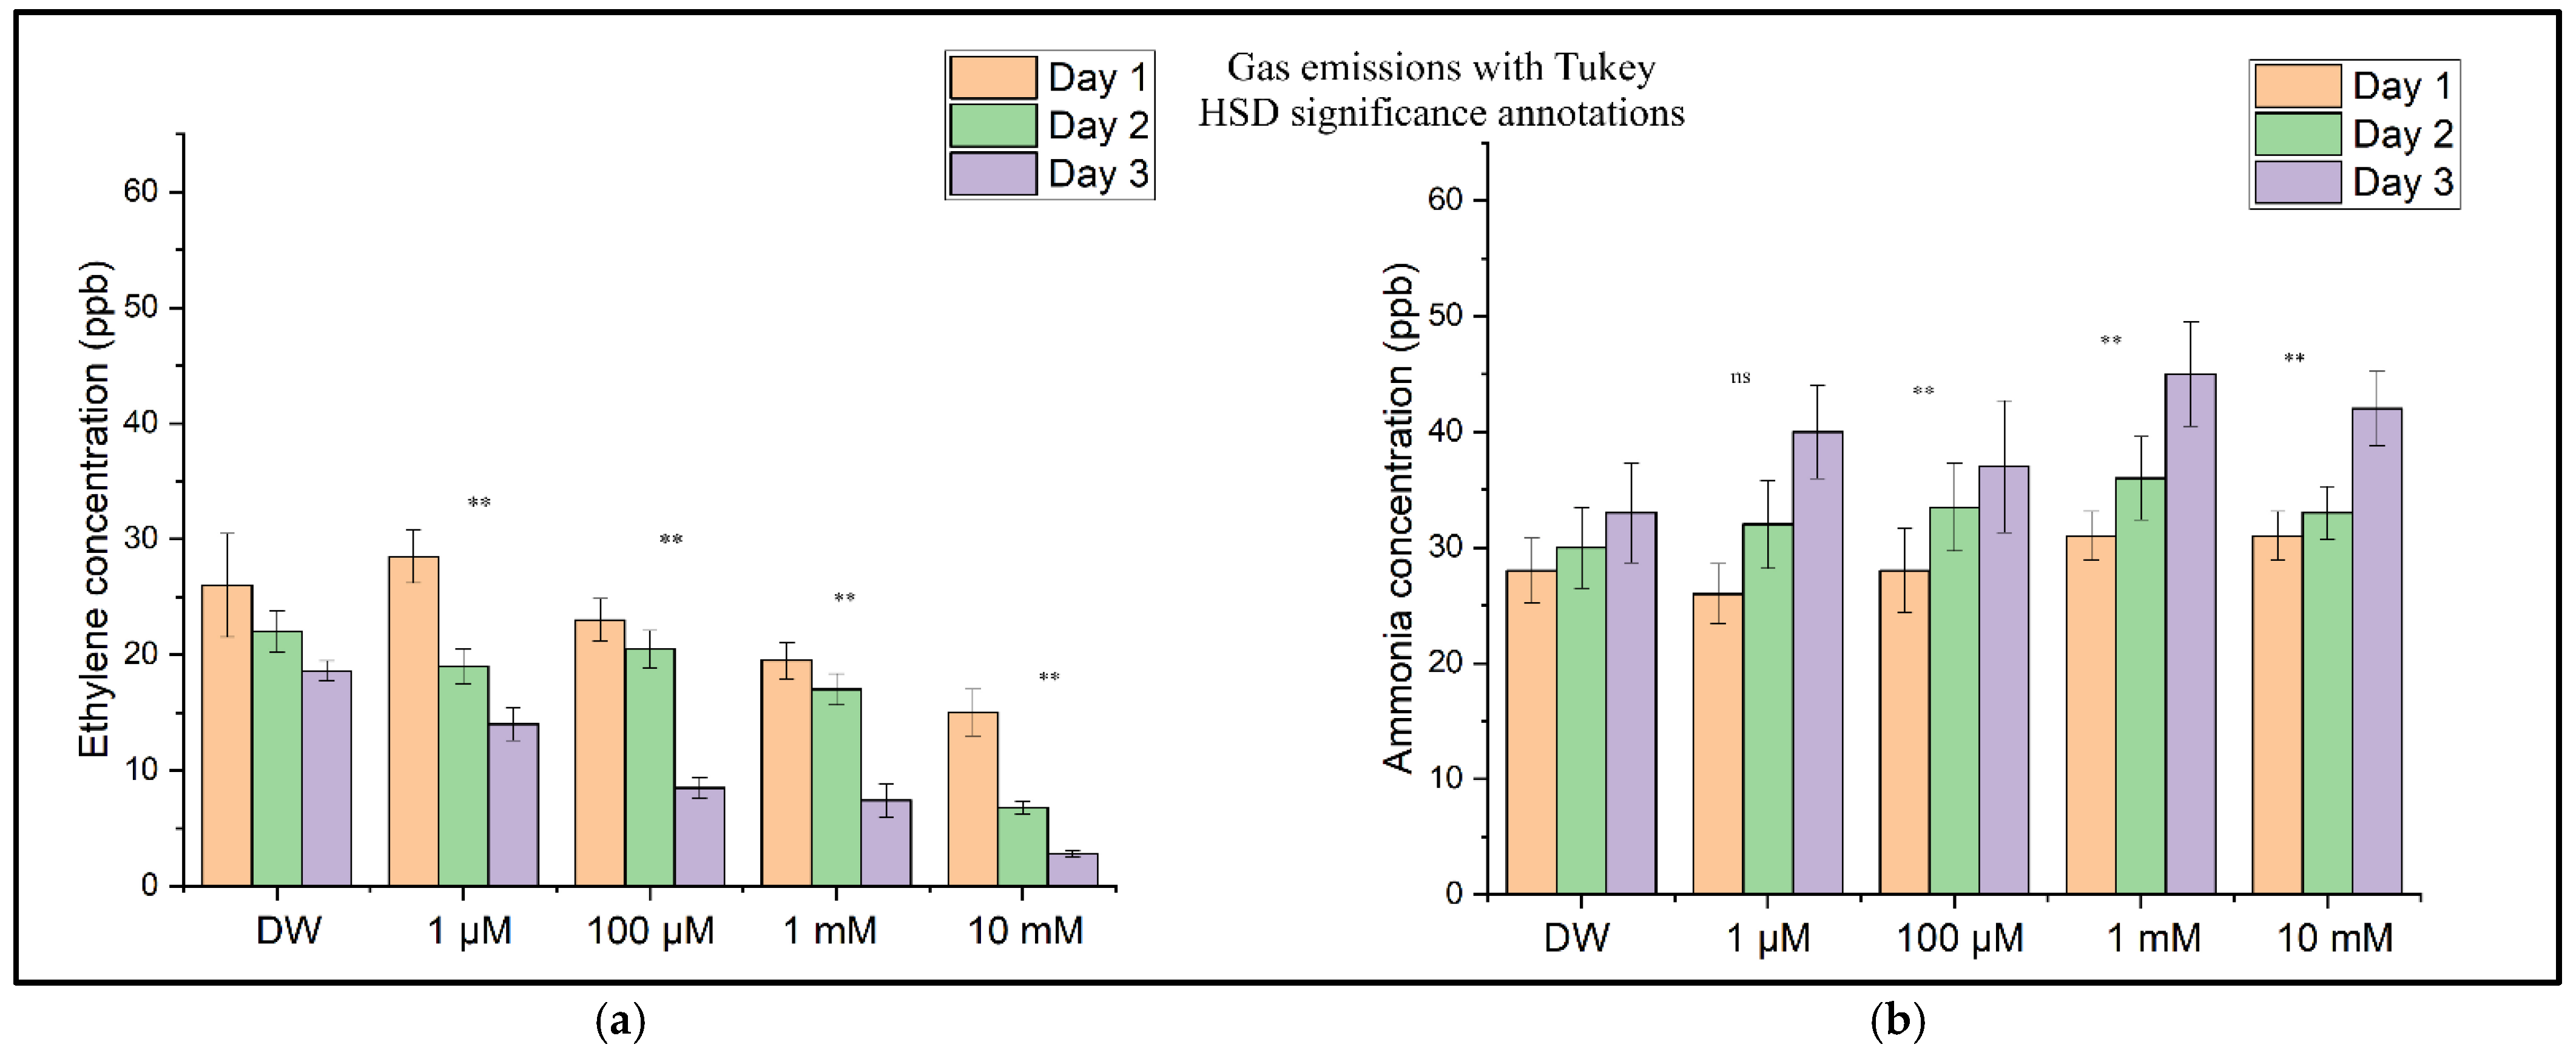
Figure 8 shows the concentration levels of ethylene (Figure 8a) and ammonia (Figure 8b) for the sample batches (with DW (distilled water) and CuSO4 solution) determined through independent measurements performed over three consecutive days. These distributions show a decrease in the ethylene concentration as the CuSO4 concentration increases, corresponding to inhibition of the wheat seedlings’ growth and development, followed over time at all four concentrations. In contrast to ethylene, the ammonia concentration increases with an increase in the CuSO4 concentration and the duration of copper sulfate solution assimilation in the seedlings. This increase in ammonia concentration corresponds to the degradation of proteins and amino acids at the plant level [26].
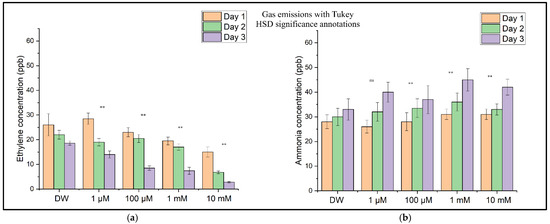
Figure 8.
(a) The ethylene (C2H4) concentrations in the headspace of wheat seedlings measured on Day 1, Day 2, and Day 3 after CuSO4 treatment. (b) The ammonia (NH3) concentrations in the headspace of wheat seedlings were measured on the same days. Bars represent the means of three biological replicates ± SD. Significance relative to the control (DW) was assessed using Tukey’s HSD post hoc test: p < 0.01 (**), ns = not significant.
Figure 9a,b show the evolution of common wheat germs over 72 h after exposure to copper sulfate. While visual analysis reveals significant growth differences only in the germs treated with the highest concentrations (1 mM and 10 mM of CuSO4), germs exposed to lower concentrations (1 µM and 100 µM) appear visually similar to the distilled water control. However, our measurements using laser photoacoustic spectroscopy suggest that changes indeed occur at the cellular level, even without any visible signs of stress.
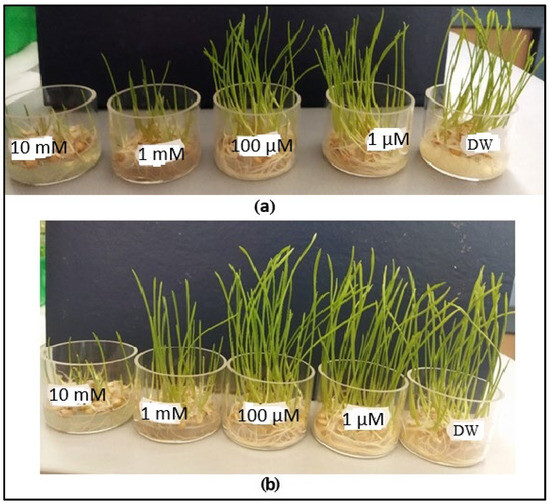
Figure 9.
Visual representation of common wheat germ growth: (a) 48 h and (b) 72 h after exposure to distilled water (DW) and varying concentrations of CuSO4.
3.3. Statistical Analyses
A statistical analysis was conducted to evaluate the impact of CuSO4 exposure on ethylene (C2H4) and ammonia (NH3) emissions during wheat germination. The one-way ANOVA revealed significant differences among the treatment groups in their ethylene (p = 0.0054) and ammonia (p = 0.0010) concentrations. Post hoc comparisons using Tukey’s Honest Significant Difference (HSD) test demonstrated that the ethylene emissions were significantly reduced at all tested CuSO4 concentrations (1 µM to 10 mM) compared to those in the control group treated with distilled water (p < 0.01 for all comparisons). For ammonia, significantly higher emission levels were observed at concentrations of 100 µM, 1 mM, and 10 mM of CuSO4 (p < 0.01), while the 1 µM treatment did not differ significantly from the control (p = 0.058). These results indicate dose-dependent suppression of ethylene biosynthesis and concomitant stimulation of ammonia release under copper-induced stress, suggesting a physiological shift in metabolic responses to heavy metal exposure.
The results of the one-way ANOVA tests for the ethylene (C2H4) and ammonia (NH3) data are presented in Table 3. These p-values are <0.01, indicating statistically significant differences among the treatment groups for both gases.
Table 3.
The one-way ANOVA tests for ethylene (C2H4) and ammonia (NH3).
To assess the differences between treatment groups further, Tukey’s HSD post hoc test was applied following the one-way ANOVA for both ethylene and ammonia emissions. The results of these comparisons are visually summarized in Figure 10. For ethylene (Figure 10a), all CuSO4 treatments showed statistically significant reductions in emissions compared to those in the control (p < 0.01), consistent with the dose-dependent suppression observed in the earlier figures. In contrast, ammonia levels (Figure 10b) were significantly elevated only at concentrations of 100 µM and above (p < 0.01), while the 1 µM treatment did not differ significantly from the control. These post hoc findings confirm that copper exposure induces opposing shifts in respiratory gas production, with ethylene biosynthesis suppressed and ammonia accumulation enhanced in a concentration-dependent manner.
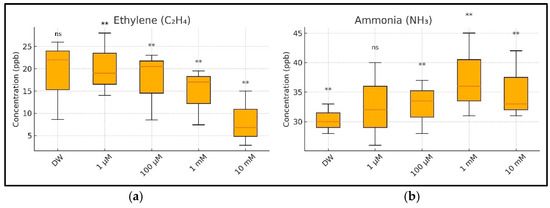
Figure 10.
A summary of the ethylene (C2H4) and ammonia (NH3) concentrations in the respiration of germinating wheat seeds under copper (CuSO4) stress, aggregated across three measurement days (Days 1–3): (a) boxplot of ethylene concentrations showing a significant, dose-dependent decline with increasing CuSO4 concentrations; (b) boxplot of ammonia concentrations showing a significant increase from 100 µM upward, indicating stress-induced nitrogen metabolism disruption. Tukey’s HSD post hoc comparisons were performed relative to the control group (DW): ns = not significant, ** = p < 0.01. Values are based on three biological replicates per treatment.
3.4. A Comparative Analysis of the Ethylene and Ammonia Emissions on Days 1, 2, and 3
Ethylene (C2H4) and ammonia (NH3) emissions, measured via CO2 laser photoacoustic spectroscopy, showed opposing trends in response to increasing CuSO4 concentrations, particularly pronounced at concentrations above 100 µM. This methodological approach is consistent with that used by Popa et al. [48], who applied CO2 laser photoacoustic detection to monitoring the gas emissions from Triticum aestivum under cadmium stress.
Table 4 consolidates the data on the time evolution of the ethylene and ammonia emissions, illustrating the dynamic physiological responses of Triticum aestivum to varying concentrations of Cu2+ stress across three days. On Day 1, the onset of Cu2+ exposure already induced noticeable suppression of the ethylene emissions, even at the lowest concentration tested (1 µM of CuSO4), where a 49.1% reduction was observed. This suppression intensified with an increasing CuSO4 dose, reaching approximately 73% at 10 mM. Concurrently, the ammonia emissions began to exhibit an upward trend starting from 100 µM of CuSO4, signaling the initiation of stress-induced metabolic adjustments, particularly at higher concentrations. By Day 2, the inhibitory effect on ethylene production became more pronounced, indicating a sustained and deepening impact of CuSO4 toxicity on ethylene biosynthesis or signaling pathways. Correspondingly, ammonia levels showed a sharp increase, with the concentrations at 10 mM of CuSO4 more than doubling compared to those for the control. This cumulative rise in ammonia provides compelling evidence of progressive metabolic disruption and heightened stress responses as the exposure time to CuSO4 extends. The trends observed on previous days were amplified further on Day 3. Ethylene levels demonstrated a sharp, dose-dependent decline, with the emission rates dropping by 51.0% at both 1 µM and 1 mM CuSO4 relative to those for the control (28.6 ppb). At the highest concentration (10 mM), ethylene emissions were suppressed by over 90%, strongly suggesting the severe disruption of essential regulatory or metabolic pathways under extreme Cu2+ stress, potentially linked to oxidative damage. In stark contrast, ammonia levels continued their increase proportional to the CuSO4 dose, escalating from 23 ppb in the control to 62 ppb at 10 mM—a substantial 169.6% rise. This significant elevation in ammonia is indicative of enhanced deamination of amino acids or widespread protein catabolism, serving as critical markers of severe metal-induced stress. The combined pattern of decreasing ethylene and increasing ammonia throughout the three days provides a robust indicator of the significant metabolic activity occurring in response to escalating copper toxicity.
Table 4.
Comparative tables and summaries for Days 1, 2, and 3.
3.5. The Detection of Free Radicals and Cu2+ Complexes via EPR Spectroscopy
To assess the uptake and assimilation of Cu2+ ions by the wheat plants, EPR measurements were performed on three distinct plant components: the roots along with agar growth medium, germinated wheat grains, and leaves. This approach allowed for comprehensive evaluation of copper’s distribution and accumulation within different parts of the plant.
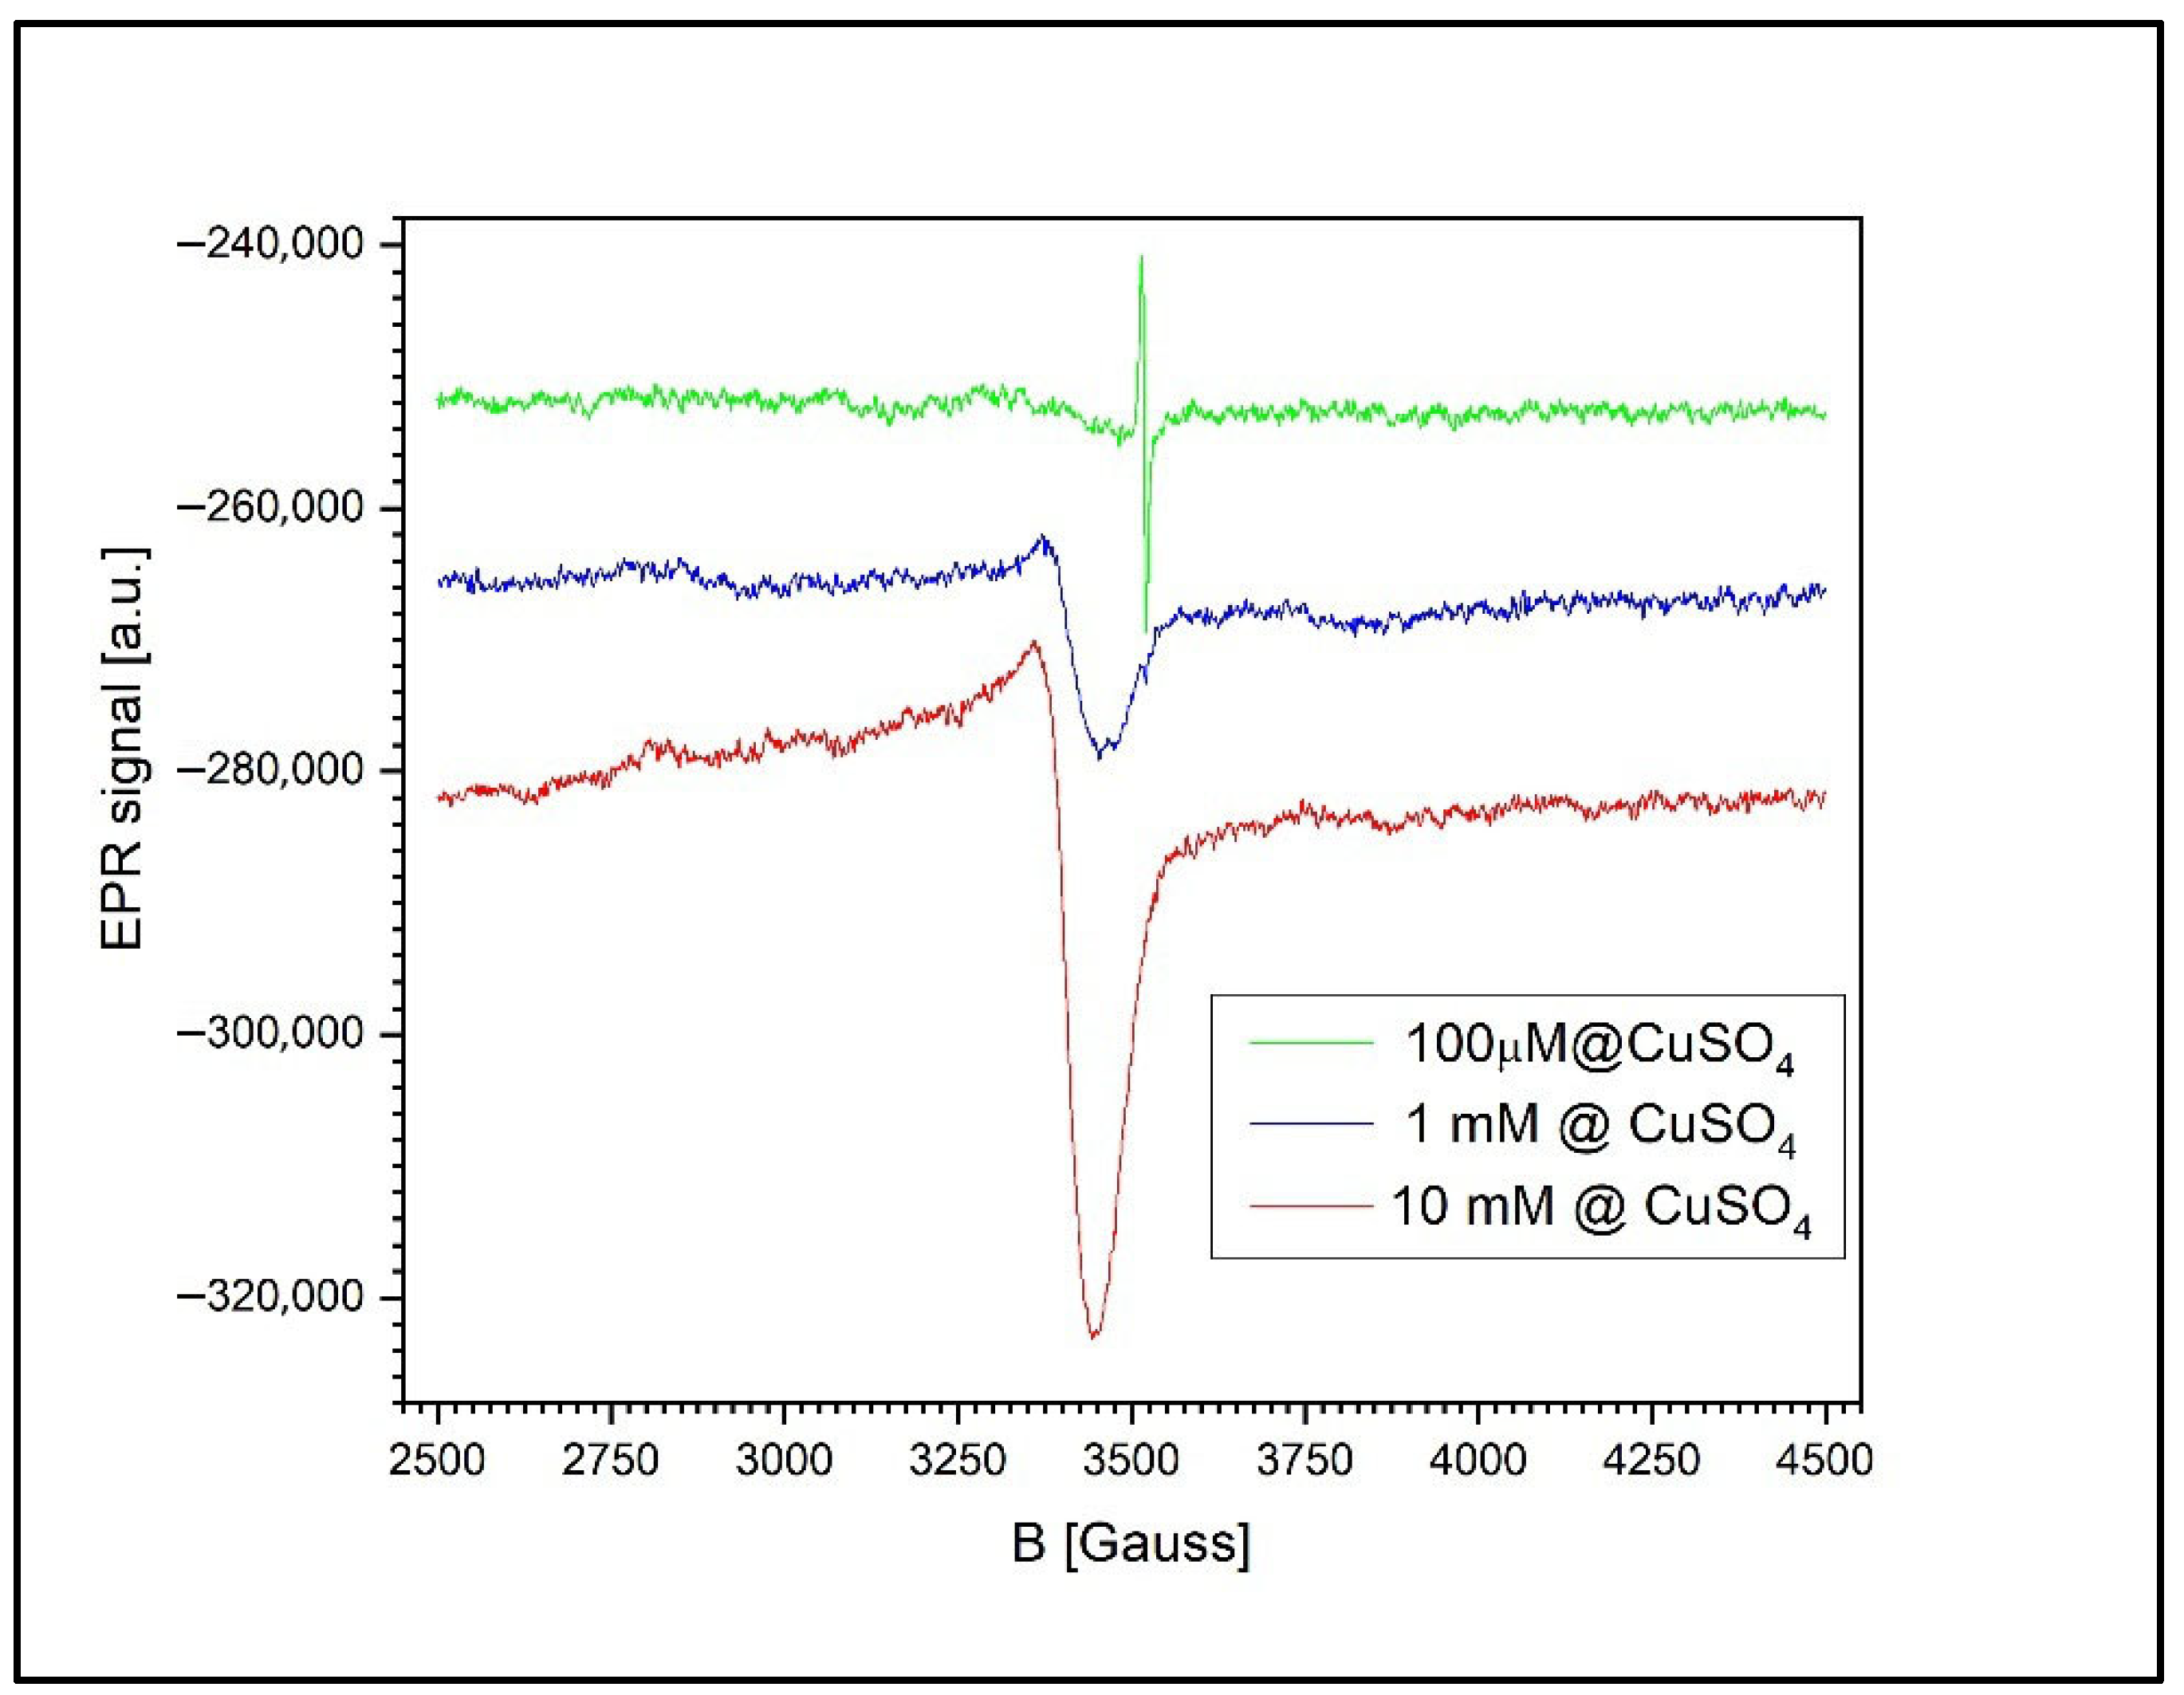
Figure 11 presents the EPR signals recorded from the wheat roots and the surrounding agar medium at three different CuSO4 concentrations: 100 µM, 1 mM, and 10 mM. At concentrations below 1 mM, the spectrum reveals only the signal associated with free radicals in the roots of the germinated wheat grains, corresponding to a g-factor of g = 2.0048 ± 0.0002 and a peak-to-peak linewidth of 6.5 G.
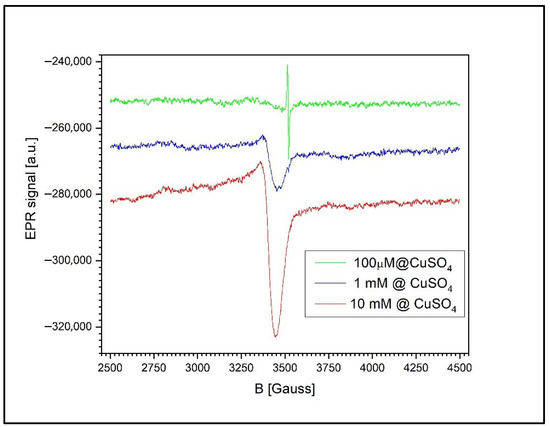
Figure 11.
The EPR spectra of wheat roots and agar medium after treatment with CuSO4 at 100 µM, 1 mM, and 10 mM. A semiquinone radical signal (g = 2.0048) is present at all concentrations, while a broad Cu2+ signal with unresolved anisotropy appears at ≥1 mM, indicating copper accumulation and possible ion interactions.
At higher concentrations (1 mM and 10 mM), a second, asymmetric EPR signal appears, indicating the presence of unresolved anisotropy. This broadening is likely due to exchange and/or dipole–dipole interactions between the Cu2+ ions. The new signal is characterized by a g-factor of g = 2.0677 ± 0.0002 and a peak-to-peak linewidth of 85.5 ± 0.5 G.
At 1 mM of Cu2+, the free radical signal is still detectable, though significantly reduced in amplitude relative to the Cu2+ signal, with a Cu2+-to-radical amplitude ratio (I_Cu/I_RL) of 12.2. However, at 10 mM of Cu2+, the free radical signal is no longer observed, likely due to sensitivity limitations. In this case, the semiquinone radical signal is more than 120 times weaker than the Cu2+ ion’s signal and thus falls below the detection threshold.
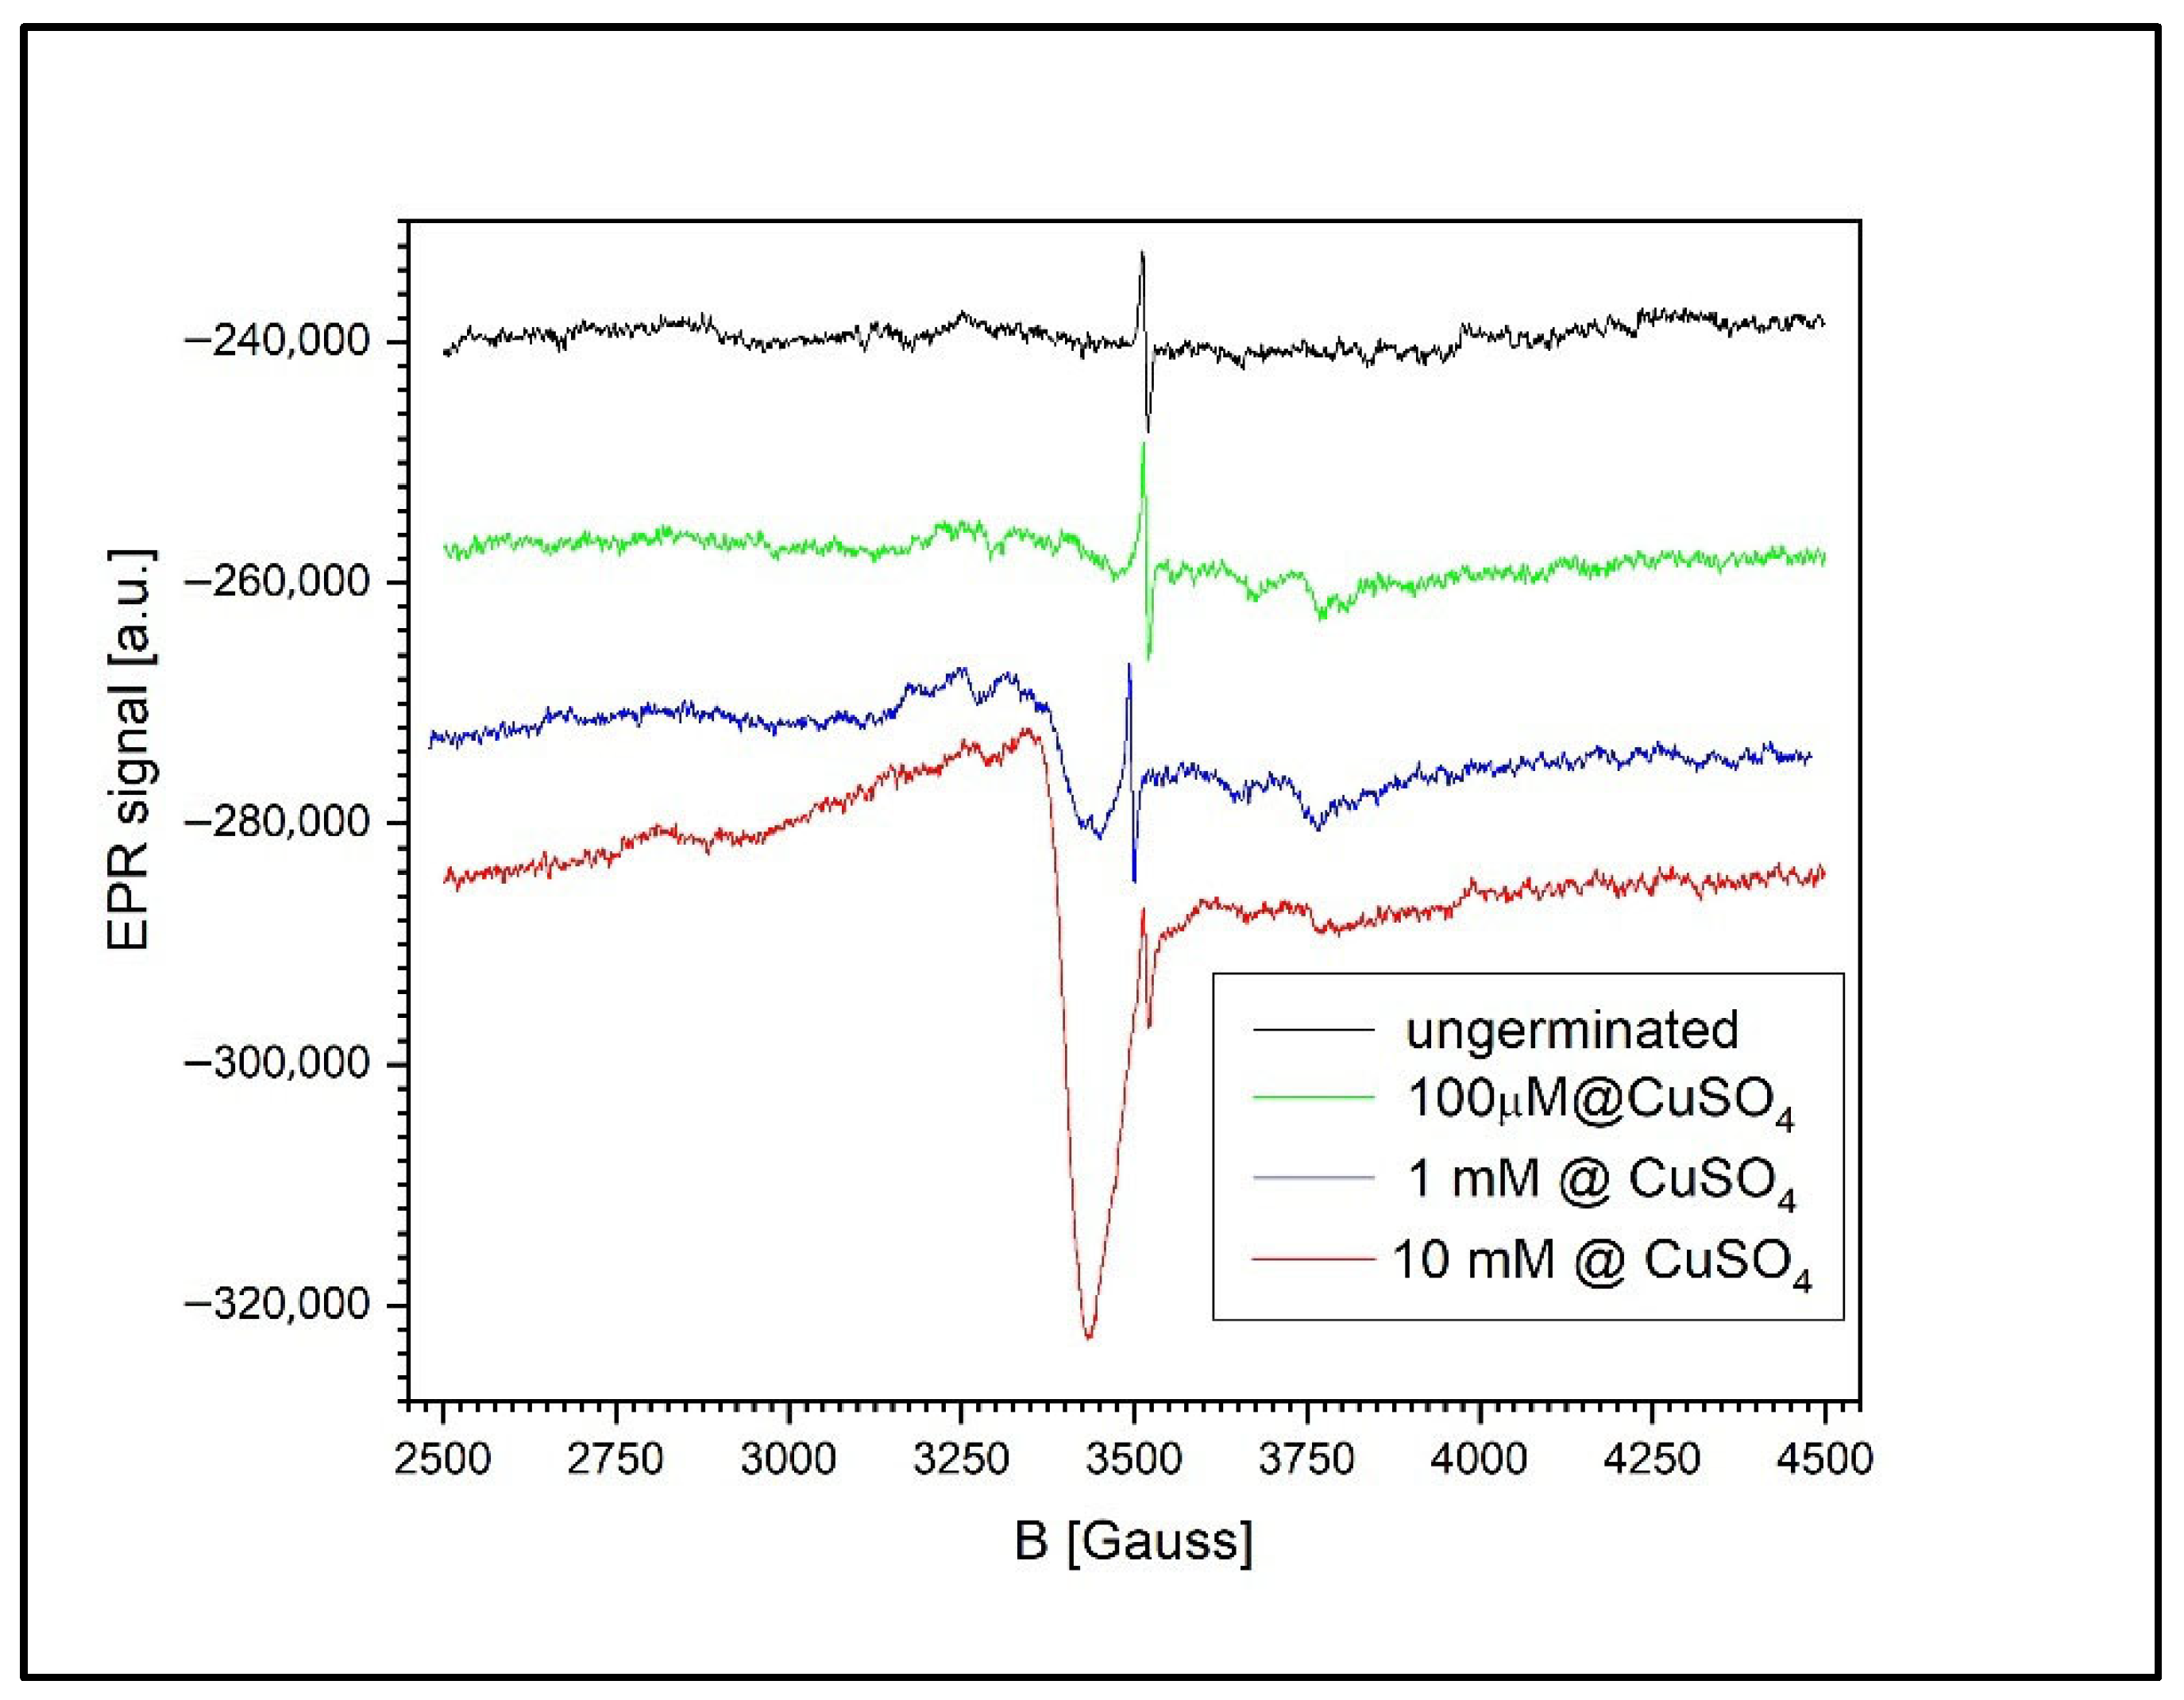
Figure 12 shows the EPR signal evolution for both ungerminated wheat grains and grains germinated in CuSO4 solutions of varying concentrations: 100 µM, 1 mM, and 10 mM. A common feature across all samples is the presence of the semiquinone-type free radical signal, observed even in the non-germinated control grains.

Figure 12.
EPR spectra of ungerminated and germinated wheat grains exposed to CuSO4 at 100 µM, 1 mM, and 10 mM. Semiquinone radical signals are present in all samples, while Cu2+ signals become detectable at ≥100 µM and increase with concentration, suggesting Cu cluster formation.
For the germinated wheat grains, the EPR spectrum contains not only the characteristic semiquinone radical signal (g = 2.0048 ± 0.0002) but also additional fine structures. These secondary signals originate from various free radicals involved in the complex biochemical processes associated with germination, as previously reported in the literature [50].
The accumulation of Cu2+ in the wheat grains becomes detectable only at concentrations above 100 µM. The shape of the Cu2+ EPR signal at higher concentrations suggests the presence of large Cu2+ clusters, as evidenced by the absence of a resolved hyperfine structure typically observed for isolated Cu2+ ions. This broadening effect is likely caused by dipole–dipole or exchange interactions between closely spaced Cu2+ centers.
Moreover, the size and abundance of these clusters appear to increase approximately linearly with the CuSO4 concentration. This is reflected in the ratio of the Cu2+ EPR signal’s intensity to that of the semiquinone radical. At 1 mM, this ratio is 0.549, whereas at 10 mM, it rises to 5.042, indicating a substantial increase in Cu2+ accumulation within the grains.
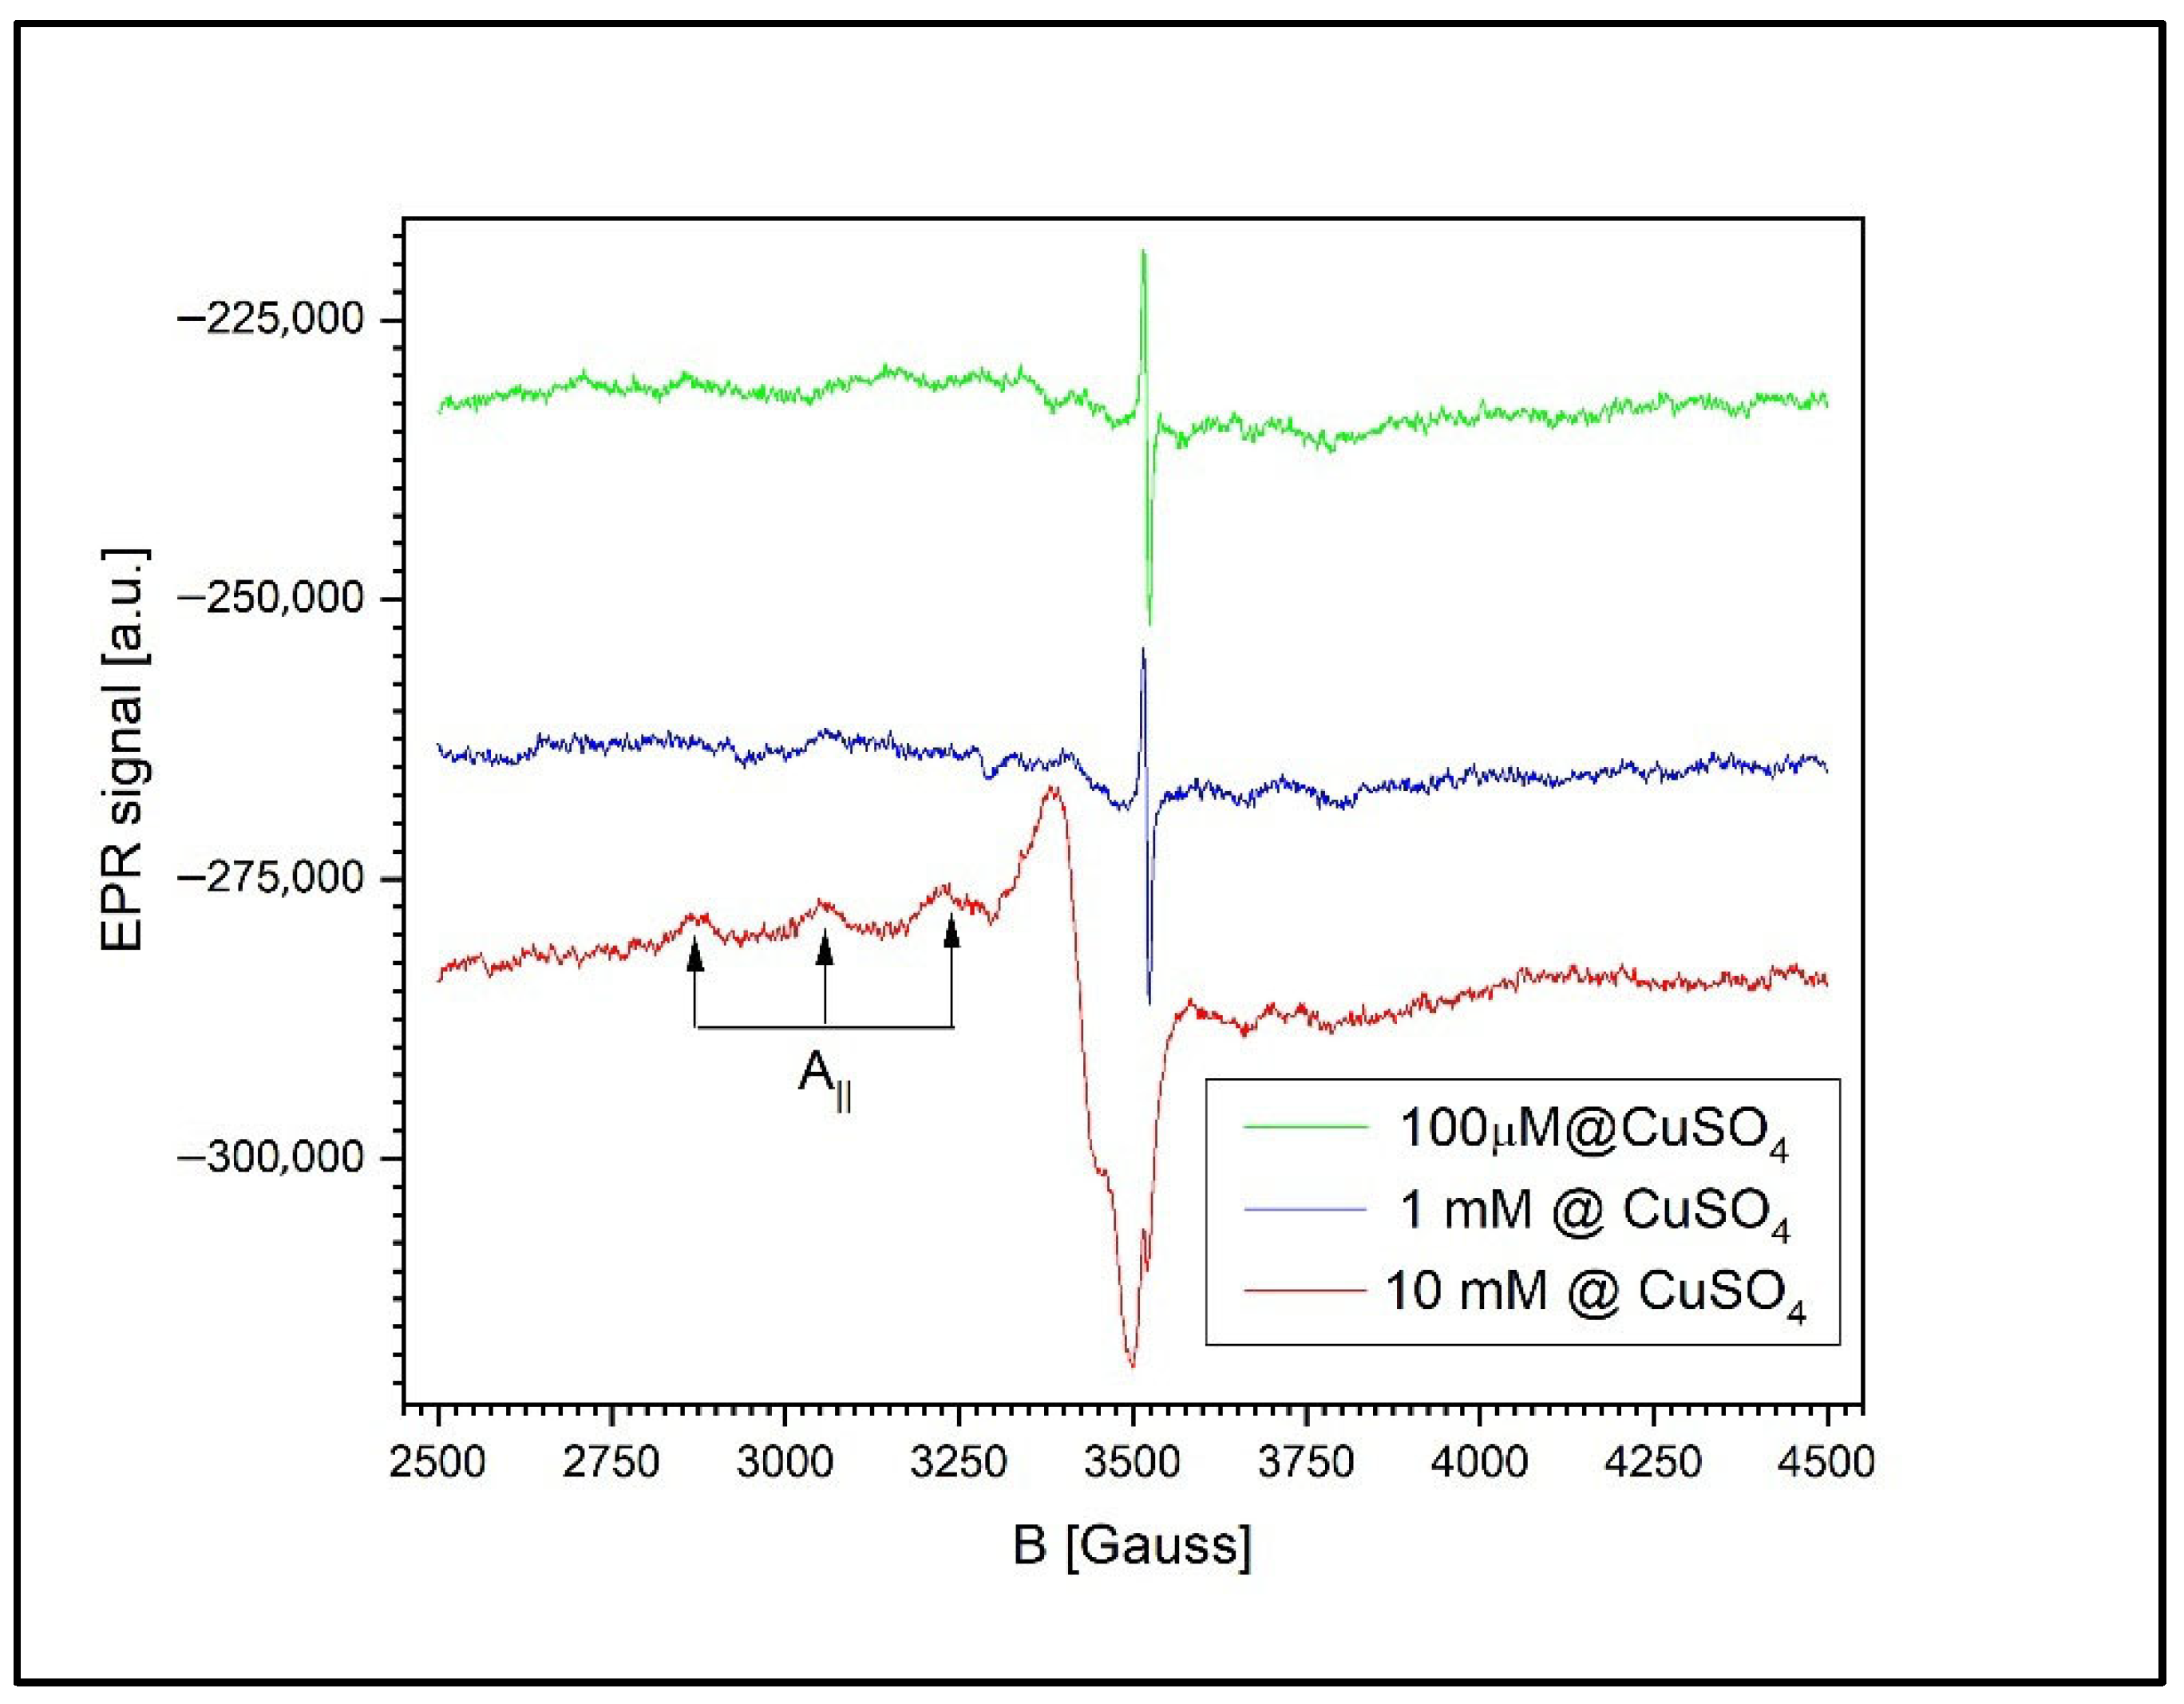
Figure 13 illustrates the dependence of the EPR signal on the CuSO4 concentration in the wheat leaves. Although the spectra exhibit the same general features across all concentrations, closer inspection reveals notable differences compared to the previously analyzed samples (roots and grains). Specifically, in the case of the leaves, the EPR spectrum of Cu2+ displays a distinct hyperfine structure characteristic of isolated Cu2+ ions. This structure arises from the interaction between the magnetic moment of the unpaired electron and the nuclear magnetic moment of copper, associated with a nuclear spin of I = 3/2.
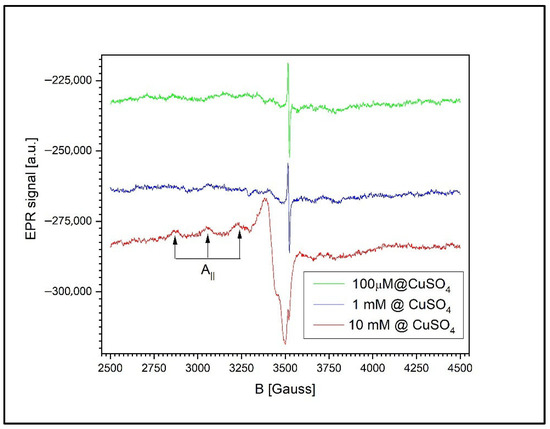
Figure 13.
The EPR spectra of the wheat leaves exposed to CuSO4 at 100 µM, 1 mM, and 10 mM. The Cu2+ signal exhibits well-resolved hyperfine splitting, indicative of isolated ions in a tetragonally distorted environment. The Cu2+/semiquinone signal ratio increases with concentration, suggesting intracellular distribution without clustering.
The presence of a well-resolved hyperfine structure strongly suggests that the Cu2+ ions in the leaf tissue are coordinated into a molecular environment of tetragonal symmetry with orthorhombic distortion. The spectral parameters characterizing this configuration are as follows:
and the hyperfine coupling constant Az = 175 ± 2 G. Only three of the four expected hyperfine components are resolved in the spectrum, as the fourth overlaps with the signal along the gx; direction.
gₓ = 2.0614 ± 0.0002,
gᵧ = 2.0267 ± 0.0002,
gz = 2.2399 ± 0.0002,
Interestingly, the relative intensity ratio between the Cu2+ signal and the semiquinone free radical signal remains consistent as the CuSO4 concentration increases. At 1 mM, the Cu2+/semiquinone signal ratio is 0.1367, while at 10 mM, it increases significantly to 13.59. This consistent ratio, coupled with the clearly resolved hyperfine structure, suggests that in the leaf tissue, copper ions are more uniformly distributed within the cells, rather than aggregating into clusters. These findings imply the presence of distinct mechanisms of copper’s assimilation into the leaves compared to those in the roots or grains, leading to a more homogeneous intracellular distribution of Cu2+ at the tested concentrations.
4. Discussion
This study provides new mechanistic insights into the physiological and biochemical responses of wheat seeds (Triticum aestivum) during early germination under copper (Cu2+) stress, using an integrated, non-invasive analytical approach.
The key innovation of this study lies not in identifying a new biological effect of copper stress but in employing a synergistic, non-invasive analytical platform to quantify and correlate both gaseous and paramagnetic responses in germinating wheat. By leveraging the sensitivity of CO2LPAS for volatile emissions and the molecular specificity of EPR for radical species and metal complexes, we were able to detect early disruptions in ethylene and ammonia dynamics and link them directly to oxidative processes and copper uptake. This integrated approach enables the detection of subtle physiological stress markers in real time and in situ, representing a significant methodological advancement over the traditional gas chromatography, spectrophotometry, and destructive tissue assays commonly used in prior studies.
A central mechanistic finding is the suppression of ethylene biosynthesis under copper exposure, as evidenced by the dose-dependent decrease in ethylene (C2H4) emissions across all tested CuSO4 concentrations. By Day 3, ethylene levels were reduced by over 90% at 10 mM of CuSO4, indicating a strong inhibitory effect. Ethylene is essential for seed germination and stress adaptation, and our data suggest that excess copper interferes with ethylene synthesis pathways—likely by inhibiting the activity of key enzymes such as 1-aminocyclopropane-1-carboxylic acid (ACC) synthase and ACC oxidase, as has been observed under other metal stress conditions [51]. This suppression may impair stress mitigation, contributing to growth inhibition. Copper exposure likely induces oxidative stress in wheat seeds, contributing to cellular damage by generating ROS [52]. ROS can cause lipid peroxidation, protein denaturation, and DNA damage, which may disrupt normal cellular functions and lead to the growth retardation and developmental alterations observed [53]. Additionally, the inhibition of ethylene biosynthesis could amplify the stress response further, as ethylene is a critical hormone in mediating stress responses in plants. Ethylene overproduction has been linked to the induction of senescence, growth inhibition, and the activation of defense pathways under metal contamination [54,55,56].
A second major insight relates to the ammonia (NH3) accumulation, which increased significantly at 1 mM and 10 mM of CuSO4. This suggests the disruption of nitrogen metabolism [57], likely due to enhanced deamination of amino acids and the inhibition of glutamine synthetase, an enzyme responsible for ammonia detoxification [58,59]. Rising NH3 levels indicate a catabolic shift in metabolism, reflecting protein breakdown and impaired nitrogen assimilation under oxidative stress. The simultaneous suppression of ethylene and increase in ammonia emissions reflect a shift in the metabolic priorities under metal-induced stress and highlight the utility of CO2LPAS in capturing early-stage physiological perturbations in plants [60,61,62].
The statistical analysis using the one-way ANOVA and Tukey’s post hoc tests confirmed that both gas emissions were significantly altered by Cu exposure. Ethylene emissions were significantly reduced at all tested Cu concentrations (1 µM to 10 mM), while ammonia emissions increased significantly at concentrations of 100 µM and above. These findings point to robust, dose-dependent disruption of the primary metabolic pathways under Cu stress. The overall trends in ethylene and ammonia emissions observed across all CuSO4 treatments are further supported by the summary presented in Figure 10. The ethylene concentrations decreased consistently with increasing copper levels, reflecting dose-dependent inhibition of ethylene biosynthesis pathways. Conversely, ammonia emissions increased significantly only at concentrations of 100 µM and higher, indicating that low-level Cu exposure (1 µM) may not have yet disrupted nitrogen metabolism. The inclusion of the statistical annotations in Figure 10 offers a clear visual representation of these effects, which align closely with the numerical post hoc results originally detailed in Tables S1 and S2 (now moved to the Supplementary Materials for clarity). This dual trend—ethylene suppression and ammonia accumulation—provides robust evidence of distinct, concentration-dependent metabolic disruptions under copper stress during early seedling development. Our findings are relevant to plant physiology and significantly affect agricultural productivity and environmental health. Excess copper in soils due to using copper-based pesticides or industrial contamination poses a serious threat to crops, especially in regions with high environmental copper concentrations [63]. The effects of copper exposure observed in this study could lead to reduced wheat yields and altered grain quality, potentially impacting food security and economic stability in agricultural communities.
Moreover, while copper toxicity extends beyond wheat to other crops and plant species with similar sensitivities to heavy metal stress—with studies on cereals like maize and barley showing identical responses to copper exposure [64]—it is important to note that the direct findings of this study are specific to Triticum aestivum. Further research is necessary to confirm the precise mechanisms and dose-responses across a broader range of plant species and genotypes, as physiological responses to heavy metals can vary significantly.
Several studies have explored copper toxicity in a variety of plant species, revealing both shared and species-specific responses. In cucumber (Cucumis sativus), Alaoui-Sossé et al. [20] reported impaired carbohydrate metabolism and ion imbalances under excess copper, while in radish (Raphanus sativus), Lukatkin et al. [24] observed elevated oxidative stress markers without a clear correlation with ethylene signaling. In contrast, Filek et al. [36] demonstrated in wheat that radical pools were highly sensitive to oxidative agents such as selenium and zearalenone, supporting our EPR findings. Barley and maize, both cereal crops like wheat, show similar trends in photosynthetic inhibition under Cu stress [17,18], but relatively less is known about their real-time gas exchange responses.
What distinguishes the present study is its simultaneous monitoring of the ethylene and ammonia emissions over time combined with direct EPR evidence of radical suppression and copper complex formation in specific tissues.
EPR spectroscopy provided corroborating evidence of tissue-specific patterns of copper assimilation [65]. A consistent EPR signal (g = 2.0048) corresponding to semiquinone-type free radicals was detected in all samples, including untreated seeds. Upon exposure to Cu concentrations ≥ 1 mM, a secondary EPR signal attributed to Cu2+ complexes emerged.
In the root and agar samples, this Cu2+ signal was broad and lacked a resolved hyperfine structure, indicating cluster formation and strong exchange interactions. The suppression of the semiquinone signal at higher Cu levels suggests radical quenching or degradation by ROS. These EPR signatures are consistent with the findings of Filek et al. (2017) [36], who reported similar radical suppression and metal-induced signal broadening in wheat grains exposed to zearalenone and selenium. Our observations suggest that Cu2+, like other oxidative agents, can disrupt endogenous radical pools through ROS-mediated damage or direct metal–radical interactions.
In the grains, similar cluster formation was evident, and the Cu2+/radical intensity ratio increased nearly tenfold from 1 mM to 10 mM of CuSO4, indicating significant intracellular Cu uptake.
Copper exposure consistently induces oxidative stress by generating ROS and disturbing redox-active radical pools [66]; furthermore, tissue-specific EPR signatures indicate distinct detoxification or compartmentalization strategies in the roots, grains, and leaves, which have implications for plant resilience and copper tolerance [6,67]. Interestingly, the leaf tissues showed a distinct spectral profile. The Cu2+ signal exhibited well-resolved hyperfine splitting characteristic of isolated copper ions in a tetragonally distorted molecular environment. This suggests that unlike in the roots and grains, copper is more uniformly distributed in the leaves, likely due to differences in metal transport and compartmentalization mechanisms. The distinct EPR spectra in the leaf tissue echo the results from Labanowska et al. (2021), who observed differential responses in oat, barley, and wheat exposed to ozone [50]. Their data support the notion that leaves possess more robust detoxification and compartmentalization mechanisms compared to those in root systems. These findings support the use of tissue-specific strategies for copper detoxification and localization in plants.
These results have clear implications for both plant physiology and agricultural sustainability. Copper-based fungicides and industrial activities are known sources of soil contamination, and our data show that even micromolar levels of copper can disrupt hormonal and metabolic pathways in wheat seedlings. Ethylene suppression may impair growth and development, while ammonia accumulation signals metabolic stress and potential toxicity.
Furthermore, EPR spectroscopy revealed distinct tissue-specific patterns of copper uptake and radical suppression, advancing our understanding of Cu2+ detoxification strategies for different plant organs. In the roots and grains, EPR spectra showed broad, unresolved Cu2+ signals and a marked decrease in or the disappearance of semiquinone radicals at higher Cu concentrations, indicating Cu clustering and oxidative radical quenching. In contrast, the leaves exhibited well-resolved Cu2+ hyperfine structures, suggesting that copper remained in a more dispersed ionic state and was possibly compartmentalized better within the leaf tissues.
Together, these findings demonstrate that Cu2+ toxicity affects germinating wheat through a multifaceted mechanism involving (i) suppressed ethylene biosynthesis that hinders hormonal stress signaling; (ii) enhanced protein degradation and nitrogen dysregulation, and (iii) differential tissue responses to copper accumulation, indicating organ-specific detoxification and stress dynamics.
This mechanistic framework expands the current knowledge on metal-induced plant stress and shows that CO2LPAS and EPR can sensitively and dynamically capture these early stress signatures. These techniques not only provide non-destructive alternatives to the conventional methods but also enable real-time physiological monitoring with high specificity. A significant consideration is that this study was conducted under controlled indoor conditions. While these laboratory settings are crucial for isolating specific variables and ensuring reproducibility, they inherently do not fully replicate the complex environmental factors (e.g., varied soil composition, fluctuating temperatures, co-occurring stressors) encountered in natural agricultural fields. Therefore, validating these findings through future field-based studies is essential to understanding their implications under more realistic environmental scenarios.
The integrated application of CO2LPAS and EPR techniques successfully revealed how copper stress disrupts key physiological and biochemical processes in wheat seedlings. These findings not only expand our understanding of metal-induced stress mechanisms but also suggest practical diagnostic tools for early toxicity detection. However, a key limitation of this study is its focus on early-stage responses during germination. Future work should therefore investigate the long-term physiological impacts; examine the recovery mechanisms; and evaluate mitigation strategies, such as antioxidants and phytoremediation, for enhancing crop resilience to heavy metal stress. This approach could also be adapted to other stressors (e.g., cadmium, drought).
5. Conclusions
This study elucidates the early toxicological impact of copper exposure on germinating wheat seeds, integrating physiological and molecular markers to assess plant stress responses. Ethylene suppression and ammonia accumulation, detected via CO2 laser photoacoustic spectroscopy, reveal clear disruptions in hormonal signaling and nitrogen metabolism under Cu stress. Complementary EPR spectroscopy confirmed oxidative stress through the detection of semiquinone radicals and Cu2+ complexes, with tissue-specific patterns of copper accumulation and radical suppression.
The combined use of LPAS and EPR presents a powerful, non-invasive strategy for monitoring heavy metal toxicity in plants. These findings not only enhance our understanding of copper-induced stress mechanisms but also offer practical applications in environmental monitoring and sustainable agriculture. Future work should investigate the long-term physiological effects of metal stress and assess the efficacy of targeted mitigation strategies, such as antioxidants, genetic modification, and phytoremediation approaches, in enhancing plants’ resilience to copper and other heavy metals.
Supplementary Materials
The following supporting information can be downloaded at https://www.mdpi.com/article/10.3390/toxics13070604/s1. Table S1: Ethylene (C2H4)—Tukey HSD Summary; Table S2: Ammonia (NH3)—Tukey HSD Summary.
Author Contributions
Conceptualization: M.P., C.P. and A.-M.B.; methodology: C.P., A.-M.B., A.C.J. and V.B.; software: M.P. and V.B.; validation: M.P., C.P. and V.B.; formal analysis: M.P. and V.B.; investigation: M.P., C.P., A.-M.B. and V.B.; resources: C.P.; data curation: M.P. and V.B.; writing—original draft preparation: M.P. and V.B.; writing—review and editing: M.P., C.P., A.-M.B. and V.B.; visualization: M.P.; supervision: M.P. and V.B.; project administration: M.P. and C.P.; funding acquisition: M.P. All authors have read and agreed to the published version of the manuscript.
Funding
This research was supported by the Romanian Ministry of Education and Research, under the Romanian National Nucleu Program LAPLAS VII—contract no. 30N/2023.
Institutional Review Board Statement
Not applicable.
Informed Consent Statement
Not applicable.
Data Availability Statement
The original contributions presented in this study are included in the article. Further inquiries can be directed to the corresponding authors.
Acknowledgments
A.C.J. acknowledges funding through the Core Program of the National Institute of Materials Physics, Project PC1-PN23080101. The authors would like to thank Monica Măgureanu and Florin Bîlea from the National Institute for Laser Plasma and Radiation Physics, Department of Plasma Physics and Nuclear Fusion, for their valuable technical support during the wheat seed germination process and for providing access to the germination chamber.
Conflicts of Interest
The authors declare no conflicts of interest.
References
- Bravin, M.N.; Garnier, C.; Lenoble, V.; Gérard, F.; Dudal, Y.; Hinsinger, P. Root-induced changes in pH and dissolved organic matter binding capacity affect copper dynamic speciation in the rhizosphere. Geochim. Cosmochim. Acta 2012, 84, 256–268. [Google Scholar] [CrossRef]
- Adrees, M.; Ali, S.; Rizwan, M.; Ibrahim, M.; Abbas, F.; Farid, M.; Zia-ur-Rehman, M.; Irshad, M.K.; Bharwana, S.A. The effect of excess copper on growth and physiology of important food crops: A review. Environ. Sci. Pollut. Res. 2015, 22, 8148–8162. [Google Scholar] [CrossRef] [PubMed]
- Gong, B.; He, E.; Xia, B.; Ying, R.; Peijnenburg, W.J.G.M.; Liu, Y.; Qiu, H. Bioavailability and phytotoxicity of rare earth metals to Triticum aestivum under various exposure scenarios. Ecotoxicol. Environ. Saf. 2020, 205, 111346. [Google Scholar] [CrossRef] [PubMed]
- Ait Ali, N.; Ater, M.; Sunahara, G.I.; Robidoux, P.Y. Phytotoxicity and bioaccumulation of copper and chromium using barley (Hordeum vulgare L.) in spiked artificial and natural forest soils. Ecotoxicol. Environ. Saf. 2004, 57, 363–374. [Google Scholar] [CrossRef]
- Chen, G.; Li, J.; Han, H.; Du, R.; Wang, X. Physiological and Molecular Mechanisms of Plant Responses to Copper Stress. Int. J. Mol. Sci. 2022, 23, 12950. [Google Scholar] [CrossRef]
- Xu, E.; Liu, Y.; Gu, D.; Zhan, X.; Li, J.; Zhou, K.; Zhang, P.; Zou, Y. Molecular Mechanisms of Plant Responses to Copper: From Deficiency to Excess. Int. J. Mol. Sci. 2024, 25, 6993. [Google Scholar] [CrossRef]
- Hänsch, R.; Mendel, R.R. Physiological functions of mineral micronutrients (Cu, Zn, Mn, Fe, Ni, Mo, B, Cl). Curr. Opin. Plant Biol. 2009, 12, 259–266. [Google Scholar] [CrossRef]
- Yruela, I. Copper in plants: Acquisition, transport and interactions. Funct. Plant Biol. 2009, 36, 409–430. [Google Scholar] [CrossRef]
- Hristozkova, M.; Geneva, M.; Stancheva, I. Response of pea plants (Pisum sativum L.) to reduced supply with molybdenum and copper. Int. J. Agric. Biol. 2006, 8, 218–220. [Google Scholar]
- Gang, A.; Vyas, A.; Vyas, H. Toxic effect of heavy metals on germination and seedling growth of wheat. J. Environ. Res. Develop. 2013, 8, 206–213. [Google Scholar]
- Singh, D.; Nath, K.; Sharma, Y.K. Response of wheat seed germination and seedling growth under copper stress. J. Environ. Biol. 2007, 28, 409–414. [Google Scholar] [PubMed]
- Verma, J.P.; Singh, V.; Yadav, J. Effect of copper sulphate on seed germination, plant growth and peroxidase activity of Mung bean (Vigna radiata). Int. J. Bot. 2011, 7, 200–204. [Google Scholar] [CrossRef]
- Benimali, C.S.; Medina, A.; Navarro, C.M.; Medina, R.B.; Amoroso, M.J.; Gómez, M.I. Bioaccumulation of copper by Zea mays: Impact on root, shoot and leaf growth. Water Air Soil. Pollut. 2010, 210, 365–370. [Google Scholar] [CrossRef]
- Ali, N.A.; Bernal, M.P.; Ater, M. Tolerance and bioaccumulation of copper in Phragmites australis and Zea mays. Plant Soil 2002, 239, 103–111. [Google Scholar] [CrossRef]
- Lin, J.; Jiang, W.; Liu, D. Accumulation of copper by roots, hypocotyls, cotyledons and leaves of sunflower (Helianthus annuus L.). Bioresour. Technol. 2003, 86, 151–155. [Google Scholar] [CrossRef]
- Işeri, O.D.; Korpe, D.A.; Yurtcu, E.; Sahin, F.I.; Haberal, M. Copper-induced oxidative damage, antioxidant response and genotoxicity in Lycopersicum esculentum Mill. and Cucumis sativus L. Plant Cell Rep. 2011, 30, 1713–1721. [Google Scholar] [CrossRef]
- Xu, J.; Yang, L.; Wang, Z.; Dong, G.; Huang, J.; Wang, Y. Toxicity of copper on rice growth and accumulation of copper in rice grain in copper contaminated soil. Chemosphere 2006, 62, 602–607. [Google Scholar] [CrossRef]
- Dresler, S.; Hanaka, A.; Bednarek, W.; Maksymiec, W. Accumulation of low-molecular-weight organic acids in roots and leaf segments of Zea mays plants treated with cadmium and copper. Acta Physiol. Plant 2014, 36, 1565–1575. [Google Scholar] [CrossRef]
- Kopittke, P.M.; Menzies, N.W. Effect of Cu toxicity on growth of cowpea (Vigna unguiculata). Plant Soil 2006, 279, 287–296. [Google Scholar] [CrossRef]
- Alaoui-Sossé, B.; Genet, P.; Vinit-Dunand, F.; Toussaint, M.L.; Epron, D.; Badot, P.M. Effect of copper on growth in cucumber plants and its relationships with carbohydrate accumulation and changes in ion contents. Plant Sci. 2004, 166, 1213–1218. [Google Scholar] [CrossRef]
- Wodala, B.; Eitel, G.; Gyula, T.N.; Ördög, A.; Horváth, F. Monitoring moderate Cu and Cd toxicity by chlorophyll fluorescence and P700 absorbance in pea leaves. Photosynthetica 2012, 50, 380–386. [Google Scholar] [CrossRef]
- Vinit-Dunand, F.; Epron, D.; Alaoui-Sossè, B.; Badot, P.M. Effects of copper on growth and on photosynthesis of mature and expanding leaves in cucumber plants. Plant Sci. 2002, 163, 53–58. [Google Scholar] [CrossRef]
- Chatterjee, J.; Chatterjee, C. Phytotoxicity of cobalt, chromium and copper in cauliflower. Environ. Pollut. 2000, 109, 69–74. [Google Scholar] [CrossRef] [PubMed]
- Lukatkin, A.; Egorova, I.; Michailova, I.; Malec, P.; Strzałka, K. Effect of copper on pro-and antioxidative reactions in radish (Raphanus sativus L.) in vitro and in vivo. J. Trace Elem. Med. Biol. 2014, 28, 80–86. [Google Scholar] [CrossRef] [PubMed]
- Fatma, M.; Asgher, M.; Iqbal, N.; Rasheed, F.; Sehar, Z.; Sofo, A.; Khan, N.A. Ethylene Signaling under Stressful Environments: Analyzing Collaborative Knowledge. Plants 2022, 11, 2211. [Google Scholar] [CrossRef]
- Farhan, M.; Sathish, M.; Kiran, R.; Mushtaq, A.; Baazeem, A.; Hasnain, A.; Hakim, F.; Naqvi, S.A.H.; Mubeen, M.; Iftikhar, Y.; et al. Plant Nitrogen Metabolism: Balancing Resilience to Nutritional Stress and Abiotic Challenges. Phyton 2024, 93, 581–609. [Google Scholar] [CrossRef]
- Popa, C.; Bratu, A.M.; Bacalum, M.; Prepelita, P. Application of the Laser Technology on the Effect of Cd Phytotoxicity in the Detection of NH3, C2H4, C2H5OH and CO2 Biomolecules at Triticum aestivum Plantlets. Sustain. Chem. Pharm. 2020, 15, 100208. [Google Scholar] [CrossRef]
- Hadjiaghaie Vafaie, R.; Hosseinzadeh, G. Using a Photoacoustic Cell for Spectroscopy of Toxic Air Pollutants including CO2, SO2 and NO Gases. Sustainability 2023, 15, 9225. [Google Scholar] [CrossRef]
- Ziółkowska, A.; Witwicki, M. Understanding the Exchange Interaction between Paramagnetic Metal Ions and Radical Ligands: DFT and Ab Initio Study on Semiquinonato Cu(II) Complexes. Int. J. Mol. Sci. 2023, 24, 4001. [Google Scholar] [CrossRef]
- Agustika, D.K.; Mercuriani, I.S.; Ariyanti, N.A.; Purnomo, C.W.; Triyana, K.; Iliescu, D.D.; Leeson, M.S. Gas Chromatography-Mass Spectrometry Analysis of Compounds Emitted by Pepper Yellow Leaf Curl Virus-Infected Chili Plants: A Preliminary Study. Separations 2021, 8, 136. [Google Scholar] [CrossRef]
- Thamer, F.H.; Thamer, N. Gas Chromatography–Mass Spectrometry (GC-MS) Profiling Reveals Newly Described Bioactive Compounds in Citrullus colocynthis (L.) Seeds Oil Extracts. Heliyon 2023, 9, e16861. [Google Scholar] [CrossRef]
- Dagar, R.; Gautam, A.; Priscilla, K.; Sharma, V.; Gupta, P.; Kumar, R. Sample Preparation from Plant Tissue for Gas Chromatography–Mass Spectrometry (GC-MS). In Plant Functional Genomics, Methods in Molecular Biology; Maghuly, F., Ed.; Springer Nature: Berlin/Heidelberg, Germany, 2024; Volume 2788, pp. 19–32. [Google Scholar] [CrossRef]
- Popa, C.; Petrus, M. Heavy Metals Impact at Plants Using Photoacoustic Spectroscopy Technology with Tunable CO2 Laser in the Quantification of Gaseous Molecules. Microchem. J. 2017, 137, 390–399. [Google Scholar] [CrossRef]
- Cämmerer, M.; Mayer, T.; Penzel, S.; Rudolph, M.; Borsdorf, H. Application of Low-Cost Electrochemical Sensors to Aqueous Systems to Allow Automated Determination of NH3 and H2S in Water. Sensors 2020, 20, 2814. [Google Scholar] [CrossRef] [PubMed]
- Nejadmansouri, M.; Majdinasab, M.; Nunes, G.S.; Marty, J.L. An Overview of Optical and Electrochemical Sensors and Biosensors for Analysis of Antioxidants in Food during the Last 5 Years. Sensors 2021, 21, 1176. [Google Scholar] [CrossRef] [PubMed]
- Filek, M.; Łabanowska, M.; Kurdziel, M.; Sieprawska, A. Electron Paramagnetic Resonance (EPR) Spectroscopy in Studies of the Protective Effects of 24-Epibrasinolide and Selenium against Zearalenone-Stimulation of the Oxidative Stress in Germinating Grains of Wheat. Toxins 2017, 9, 178. [Google Scholar] [CrossRef]
- Augusto, O.; Truzzi, D.R.; Linares, E. Electron Paramagnetic Resonance (EPR) for Investigating Relevant Players of Redox Reactions: Radicals, Metalloproteins and Transition Metal Ions. Redox Biochem. Chem. 2023, 5–6, 100009. [Google Scholar] [CrossRef]
- Dumitras, D.C.; Dutu, D.C.; Matei, C.; Magureanu, A.M.; Petrus, M.; Popa, C. Laser photoaocustic spectroscopy: Principles, instrumentation, and characterization. J. Optoelectron. Adv. Mater. 2007, 9, 3655–3701. [Google Scholar]
- Petrus, M.; Popa, C.; Bratu, A.M.; Bercu, V.; Gebac, L.; Mihai, D.-M.; Butcaru, A.-C.; Stanica, F.; Gogot, R. A Synergistic Approach Using Photoacoustic Spectroscopy and AI-Based Image Analysis for Post-Harvest Quality Assessment of Conference Pears. Molecules 2025, 30, 2431. [Google Scholar] [CrossRef]
- Dumitras, D.C.; Dutu, D.C.; Matei, C.; Cernat, R.; Banita, S.; Patachia, M.; Bratu, A.M.; Petrus, M.; Popa, C. Evaluation of Ammonia Absorption Coefficients by Photoacoustic Spectroscopy for Detection of Ammonia Levels in Human Breath. Laser Phys. 2011, 21, 796–800. [Google Scholar] [CrossRef]
- Popa, C.; Petrus, M.; Bratu, A.M. Alfalfa (Medicago sativa) Sprouts Respiratory Responses to Cadmium Stress Using IR LPAS. Molecules 2022, 27, 1891. [Google Scholar] [CrossRef]
- Martinelli, M.; Massa, C.A.; Pardi, L.A.; Bercu, V.; Popescu, F.F. Relaxation Processes in a Multilevel Spin System Investigated by Linewidth Analysis of the Multifrequency High-Frequency EPR Spectra. Phys. Rev. B 2003, 67, 014425. [Google Scholar] [CrossRef]
- Bercu, V.; Negut, C.D.; Duliu, O.G. EPR Investigation of Some Desiccated Ascomycota and Basidiomycota Gamma-Irradiated Mushrooms. Radiat. Phys. Chem. 2010, 79, 1275–1278. [Google Scholar] [CrossRef]
- Bercu, V.; Duliu, O.G.; Manea, B.; Opris, V.; Emandi, A.; Persa, D.; Gebac, L.; Tuta, C.; Parnic, V.; Mirea, P.; et al. Electron Paramagnetic Resonance and Discriminant Analysis of White Pigment Used by Early Neolithic Potters in the Eastern Romanian Plain. J. Archaeol. Sci. Rep. 2024, 60, 104810. [Google Scholar] [CrossRef]
- Bercu, V.; Martinelli, M.; Massa, C.A.; Pardi, L.A.; Rössler, E.A.; Leporini, D. Anomaly of the Rotational Nonergodicity Parameter of Glass Formers Probed by High Field Electron Paramagnetic Resonance. J. Chem. Phys. 2008, 129, 081102. [Google Scholar] [CrossRef]
- Nistor, S.V.; Stefan, M. In-depth investigation of EPR spectra of Mn2+ ions in ZnS single crystals with pure cubic structure. J. Phys. Condens. Matter 2009, 21, 145408. [Google Scholar] [CrossRef]
- de Carvalho, R.P.; Guedes, K.J.; Pinheiro, M.V.B.; Krambrock, K. Biosorption of copper by dried plant leaves studied by electron paramagnetic resonance and infrared spectroscopy. Hydrometallurgy 2001, 59, 407–412. [Google Scholar] [CrossRef]
- Luna, A.S.; da Costa, A.C.A.; Henriques, C.A.; Herbst, M.H. Electron Paramagnetic Resonance and Atomic Absorption Spectrometry as tools for the investigation of Cu(II) biosorption by Sargassum filipendula. Hydrometallurgy 2007, 86, 105–113. [Google Scholar] [CrossRef]
- Rex, R. Electron Paramagnetic Resonance Studies of Stable Free Radicals in Lignins and Humic Acids. Nature 1960, 188, 1185–1186. [Google Scholar] [CrossRef]
- Łabanowska, M.; Filek, M.; Kurdziel, M.; Bidzińska, E.; Miszalski, Z.; Hartikainen, H. Effects of Selenium and Sulphur Supplementation on Antioxidant Capacity in Wheat Leaves: Chloroplast and Mitochondria Activities. J. Plant Physiol. 2013, 170, 136–145. [Google Scholar] [CrossRef]
- Khan, S.; Alvi, A.F.; Saify, S.; Iqbal, N.; Khan, N.A. The Ethylene Biosynthetic Enzymes, 1-Aminocyclopropane-1-Carboxylate (ACC) Synthase (ACS) and ACC Oxidase (ACO): The Less Explored Players in Abiotic Stress Tolerance. Biomolecules 2024, 14, 90. [Google Scholar] [CrossRef]
- Sharma, R.; Bhardwaj, R.; Thukral, A.K.; Al-Huqail, A.A.; Sissiqui, M.H.; Ahmad, P. Oxidative stress mitigation and initiation of antioxidant and osmoprotectant responses mediated by ascorbic acid in Brassica juncea L. subjected to copper (II) stress. Ecotoxicol. Environ. Saf. 2019, 182, 109436. [Google Scholar] [CrossRef]
- Juan, C.A.; Pérez de la Lastra, J.M.; Plou, F.J.; Pérez-Lebeña, E. The Chemistry of Reactive Oxygen Species (ROS) Revisited: Outlining Their Role in Biological Macromolecules (DNA, Lipids and Proteins) and Induced Pathologies. Int. J. Mol. Sci. 2021, 22, 4642. [Google Scholar] [CrossRef] [PubMed]
- Hossain, M.A.; Piyatida, P.; Teixeira da Silva, J.A.; Fujita, M. Molecular Mechanism of Heavy Metal Toxicity and Tolerance in Plants: Central Role of Glutathione in Detoxification of Reactive Oxygen Species and Methylglyoxal and in Heavy Metal Chelation. J. Bot. 2012, 2012, 872875. [Google Scholar] [CrossRef]
- Thao, N.P.; Khan, M.I.; Thu, N.B.; Hoang, X.L.; Asgher, M.; Khan, N.A.; Tran, L.S. Role of Ethylene and Its Cross Talk with Other Signaling Molecules in Plant Responses to Heavy Metal Stress. Plant Physiol. 2015, 169, 73–84. [Google Scholar] [CrossRef] [PubMed]
- Munawar, A.; Akram, M.S.; Ali, S.; Sarker, P.K.; El-Sheikh, M.A. Deciphering morphological and biochemical modulations in mungbean by application of ethylene precursor and inhibitors under cadmium stress. Sci. Rep. 2025, 15, 15294. [Google Scholar] [CrossRef]
- Wang, D.; Zhang, Y.; Chi, Q.; Hu, X.; Li, S.; Li, S. Ammonia exposure induced abnormal expression of cytokines and heat shock proteins via glucose metabolism disorders in chicken neutrophils. Environ. Sci. Pollut. Res. Int. 2019, 26, 10529–10536. [Google Scholar] [CrossRef]
- Zayed, O.; Hewedy, O.A.; Abdelmoteleb, A.; Ali, M.; Youssef, M.S.; Roumia, A.F.; Seymour, D.; Yuan, Z.C. Nitrogen Journey in Plants: From Uptake to Metabolism, Stress Response, and Microbe Interaction. Biomolecules 2023, 13, 1443. [Google Scholar] [CrossRef]
- Alves, A.; Ribeiro, R.; Azenha, M.; Cunha, M.; Teixeira, J. Effects of Exogenously Applied Copper in Tomato Plants’ Oxidative and Nitrogen Metabolisms under Organic Farming Conditions. Horticulturae 2023, 9, 323. [Google Scholar] [CrossRef]
- Yang, S.; Xu, Y.; Tang, Z.; Jin, S.; Yang, S. The Impact of Alkaline Stress on Plant Growth and Its Alkaline Resistance Mechanisms. Int. J. Mol. Sci. 2024, 25, 13719. [Google Scholar] [CrossRef]
- Afzal, M.; Muhammad, S.; Tan, D.; Kaleem, S.; Khattak, A.A.; Wang, X.; Chen, X.; Ma, L.; Mo, J.; Muhammad, N.; et al. The Effects of Heavy Metal Pollution on Soil Nitrogen Transformation and Rice Volatile Organic Compounds under Different Water Management Practices. Plants 2024, 13, 871. [Google Scholar] [CrossRef]
- Qaderi, M.M.; Evans, C.C.; Spicer, M.D. Plant Nitrogen Assimilation: A Climate Change Perspective. Plants 2025, 14, 1025. [Google Scholar] [CrossRef]
- Alkhanjaf, A.A.M.; Sharma, S.; Sharma, M.; Kumar, R.; Arora, N.K.; Kumar, B.; Umar, A.; Baskoutas, S.; Mukherjee, T.K. Microbial strategies for copper pollution remediation: Mechanistic insights and recent advances. Environ. Pollut. 2024, 346, 123588. [Google Scholar] [CrossRef]
- Ceramella, J.; De Maio, A.C.; Basile, G.; Facente, A.; Scali, E.; Andreu, I.; Sinicropi, M.S.; Iacopetta, D.; Catalano, A. Phytochemicals Involved in Mitigating Silent Toxicity Induced by Heavy Metals. Foods 2024, 3, 978. [Google Scholar] [CrossRef] [PubMed]
- Sieprawska, A.; Labanowska, M.; Kurdziel, M.; Filek, M.; Skorka, M.; Barbasz, A. Protective responses of tolerant and sensitive wheat seedlings to systemic and local zearalenone application—Electron paramagnetic resonance studies. BMC Plant Biol. 2021, 21, 393. [Google Scholar] [CrossRef]
- Chaki, M.; Begara-Morales, J.C.; Barroso, J.B. Oxidative Stress in Plants. Antioxidants 2020, 9, 481. [Google Scholar] [CrossRef]
- Basso, M.F.; Aprile, A.; Negussu, M.; Colzi, I.; Pernice, I.; Lo Passo, C.; Gonnelli, C.; Frontini, A.; De Bellis, L.; Buti, M.; et al. Transcriptional Responses of Durum Wheat to Chronic Chromium Exposure Reveal Candidate Proteins Involved in Metal Detoxification and Compartmentalization. Environ. Exp. Bot. 2024, 228, 105953. [Google Scholar] [CrossRef]


Disclaimer/Publisher’s Note: The statements, opinions and data contained in all publications are solely those of the individual author(s) and contributor(s) and not of MDPI and/or the editor(s). MDPI and/or the editor(s) disclaim responsibility for any injury to people or property resulting from any ideas, methods, instructions or products referred to in the content. |
© 2025 by the authors. Licensee MDPI, Basel, Switzerland. This article is an open access article distributed under the terms and conditions of the Creative Commons Attribution (CC BY) license (https://creativecommons.org/licenses/by/4.0/).