1. Introduction
Exposure to heavy metals is one of the biggest risks to the biological system and, in particular, human health [
1]. Heavy metals are persistent environmental contaminants that pose considerable health hazards upon accumulation in dietary items. Among these potentially toxic elements (PTEs), Pb and Cd are particularly concerning due to their toxicity and ability to bioaccumulate in the human body [
2].
Their selection in this study is based on previous environmental assessments in Lebanon, which have reported alarming levels of these PTEs in soil, water, and vegetation due to industrial emissions, excessive use of agriculture fertilizers and pesticides, uncontrolled dumping of solid waste, and the use of contaminated water or feed in livestock farming [
3,
4,
5]. In a study done by Moustafa et al. [
3], Cd and Pb were found to be the most prevalent pollutants in soil and groundwater assessed in the area of Akkar northern Lebanon. In another study by Borjac et al. [
4] in Deir Kanoun Southern Lebanon, Cd and Pb concentrations at several locations exceeded international regulatory thresholds in soil samples collected from the dump and along the canal in the area. Similarly, in the Central Bekaa Valley, ecological risk assessments based on soil analyses classified cadmium (Cd) and lead (Pb) as posing high to moderate environmental threats, while chromium (Cr), nickel (Ni), copper (Cu), and zinc (Zn) were associated with low risk levels [
5].
The impact of heavy metals from food origin on human health was explained and summarized by a review done by Peralta-Videa et al. [
6]. In a study done by Unicef [
7], Pb is reported as a neurotoxin that affects cognitive development, while Cd can harm the kidneys, liver, and bones, and affect the female reproductive system as well [
6]. According to the International Agency for Research on Cancer (IARC), Cd is a Group 1 carcinogen [
8]. These potentially toxic elements can bioaccumulate as a result of prolonged food exposure, raising the possibility of chronic toxicity. Industrial emissions, contaminated water, soil, and the use of agricultural inputs such as fertilizers and pesticides are some of the ways that heavy metal contamination can occur. In addition to these findings, global health authorities such as the World Health Organization (WHO) have classified Pb and Cd as major public health threats due to their carcinogenic, nephrotoxic, neurotoxic, and reproductive effects [
9,
10]. Furthermore, both elements are included on the United States Environmental Protection Agency’s (EPA) list of priority pollutants, underscoring their global significance as hazardous contaminants [
11].
Monitoring the amounts of heavy metals in food products is essential to guarantee public health and consumer safety because of the possible health effects [
12]. It has long been known that dairy products are among the most essential and nutrient-dense foods. Several key components present in dairy products, including fatty acids, amino acids, minerals, and vitamins, are critical for a child’s development and immune system [
13]. Yogurt is one of the dairy products most widely consumed, and is made by a fermentation process by different bacteria using milk as a raw material. Additionally, yogurt provides the human body with proteins, minerals, and vitamins, and its advantage is that it can be consumed by people who have lactose intolerance [
14].
Dairy products, including yogurt, are susceptible to contamination because heavy metals in animals bioaccumulate. While trace elements are often non-toxic to human health, excessive consumption of essential elements can potentially be harmful to human well-being [
15]. The concentrations of metals (including heavy metals and trace elements) in dairy products may be derived from the contaminated environment and the packing materials utilized during production. As an example, plants used as animal feed have the ability to absorb heavy metals from soil and groundwater, which can subsequently be transmitted into raw milk [
16]. For example, through the fertilizer of contaminated crops, Cd can find its way into animal feed [
17]. On the other hand, the main source of Pb is industrial contamination, which contaminates soil, water, and animal feed before joining the feed channel [
18]. Research done by Bousbia et al. showed that the incidence and amounts of heavy metals in milk and dairy products can vary from one study to another and from one country to another due to different factors such as the route of exposure, animal diet, lactation, and environmental pollution [
19].
Milk, as a raw material for all dairy products, is considered to be a source of potentially toxic element (PTE) pollution, as it can become more contaminated and, therefore, more dangerous when it is transferred through different stages (e.g., from production to fermentation to other products or from production to consumption) [
20,
21]. It is very important to mention that PTEs are not destroyed throughout the manufacturing processes of dairy products; therefore, they can be transported into products such as yogurt [
22]. Among the heavy metals, Pb and Cd are considered two highly toxic PTEs that can be found in air, water, soil, and food products [
20,
23]. They are classified as dangerous PTEs, and their toxicity is well known as one of the major worldwide pollutants [
24]. For this reason, it is critical to ensure that these two
potentially toxic elements are present in food items at the lowest possible concentrations to maintain food safety and protect consumers [
25]. The Commission Regulation (EU) 2023/915, which changes Regulation (EC) No. 1881/2006, states that raw milk and dairy products can contain up to 0.020 mg/kg and 0.005 mg/kg of lead and Cd, respectively [
26].
Different studies reported the quantification of heavy metals, especially Pb and Cd, in milk and milk products worldwide. As an example, Er et al. [
27] evaluated the Pb levels in milk and yogurt samples in Turkey. They found that Pb levels were in the range of 15–61 ng/mL and 21–42 ng/g for milk and yogurt, respectively. Additionally, Winiarska-Mieczan et al. [
22] determined the Pb and Cd in yogurts and cream cheese samples in Poland. In addition, Zhou et al. [
28] found that the levels of Pb and Cd were higher than the acceptable levels in milk samples, and this was attributed to industrial activities that probably led to milk contamination in China. Yi-Jie Dai et al. [
29] reported the Pb and Cd contamination of Mish and Karish cheese samples, respectively, in Egypt. Rebellato et al. [
30] determined Pb and Cd levels in yogurt samples in Brazil, and they were 21.58 and 4.20 µg/kg, respectively.
This study aims to evaluate the levels of Pb and Cd in Lebanese yogurt samples collected from various regions and assess their compliance with regulatory limits. In addition, it also estimates the dietary intake of Pb and Cd through yogurt consumption in the Lebanese population. The findings of this study provide valuable insights into the potential health risks associated with yogurt consumption in Lebanon. To the best of our knowledge, no previous studies have been conducted to assess the presence of toxic metals, in particular, Pb and Cd, in yogurt samples across different regions in Lebanon, nor have they estimated consumer exposure based on dietary intake data through yogurt consumption.
2. Materials and Methods
2.1. Lebanon
Lebanon is located on the eastern Mediterranean coast between 33°03′–34°45′ N latitude and 35°05′–36°30′9″ E longitude. From west to east, Lebanon can be geographically divided into four areas: a coastal plain along the west, the Mount Lebanon mountain chain, the fertile Bekaa Plain, and the Anti-Lebanon mountain chain that runs along the eastern border with Syria; the fertile Bekaa Plain lies between the two mountain chains [
31]. The area of Lebanon is 10,452 km
2 and its population is 5,364,482 people (2024 est.) [
32]; hence, Lebanon has a high population density of 513 persons/km
2. In 2017, industry contributed 13.1% to the gross domestic product, and agriculture, which employed more than 39% of the population in 2009 [
33], contributed 3% [
34]. Both of these sectors are considered to be major contributors to heavy metal contamination in the environment [
35].
2.2. Sampling
Yogurt samples were collected from 11 different Lebanese regions: Nabatiyeh (Na), South Area (S), Chouf (C), Metn (M), Kesserwan (K), Jbeil (J), Batroun (B), North Area (No), Akkar (A), Bekaa (Be), and Baalbeck-Hermel (BH). A total of 15 samples were obtained from different dairy farms in each region, resulting in 165 samples. All yogurt products were produced using traditional methods, within the farm’s premises without the addition of preservatives, stabilizers, or flavoring agents, and were made exclusively from cow’s milk sourced from the same region of production. These yogurts reflect the naturally processed dairy products commonly consumed in Lebanon, and represent the regional diversity of local milk production practices.
Following collection, the samples were immediately transported under refrigerated and sterile conditions to the laboratory facilities. Upon arrival, the samples were subjected to chemical analysis without delay, in order to preserve their integrity and prevent any potential degradation or alteration in contaminant concentrations. The general nutritional composition of the collected yogurt samples is summarized in
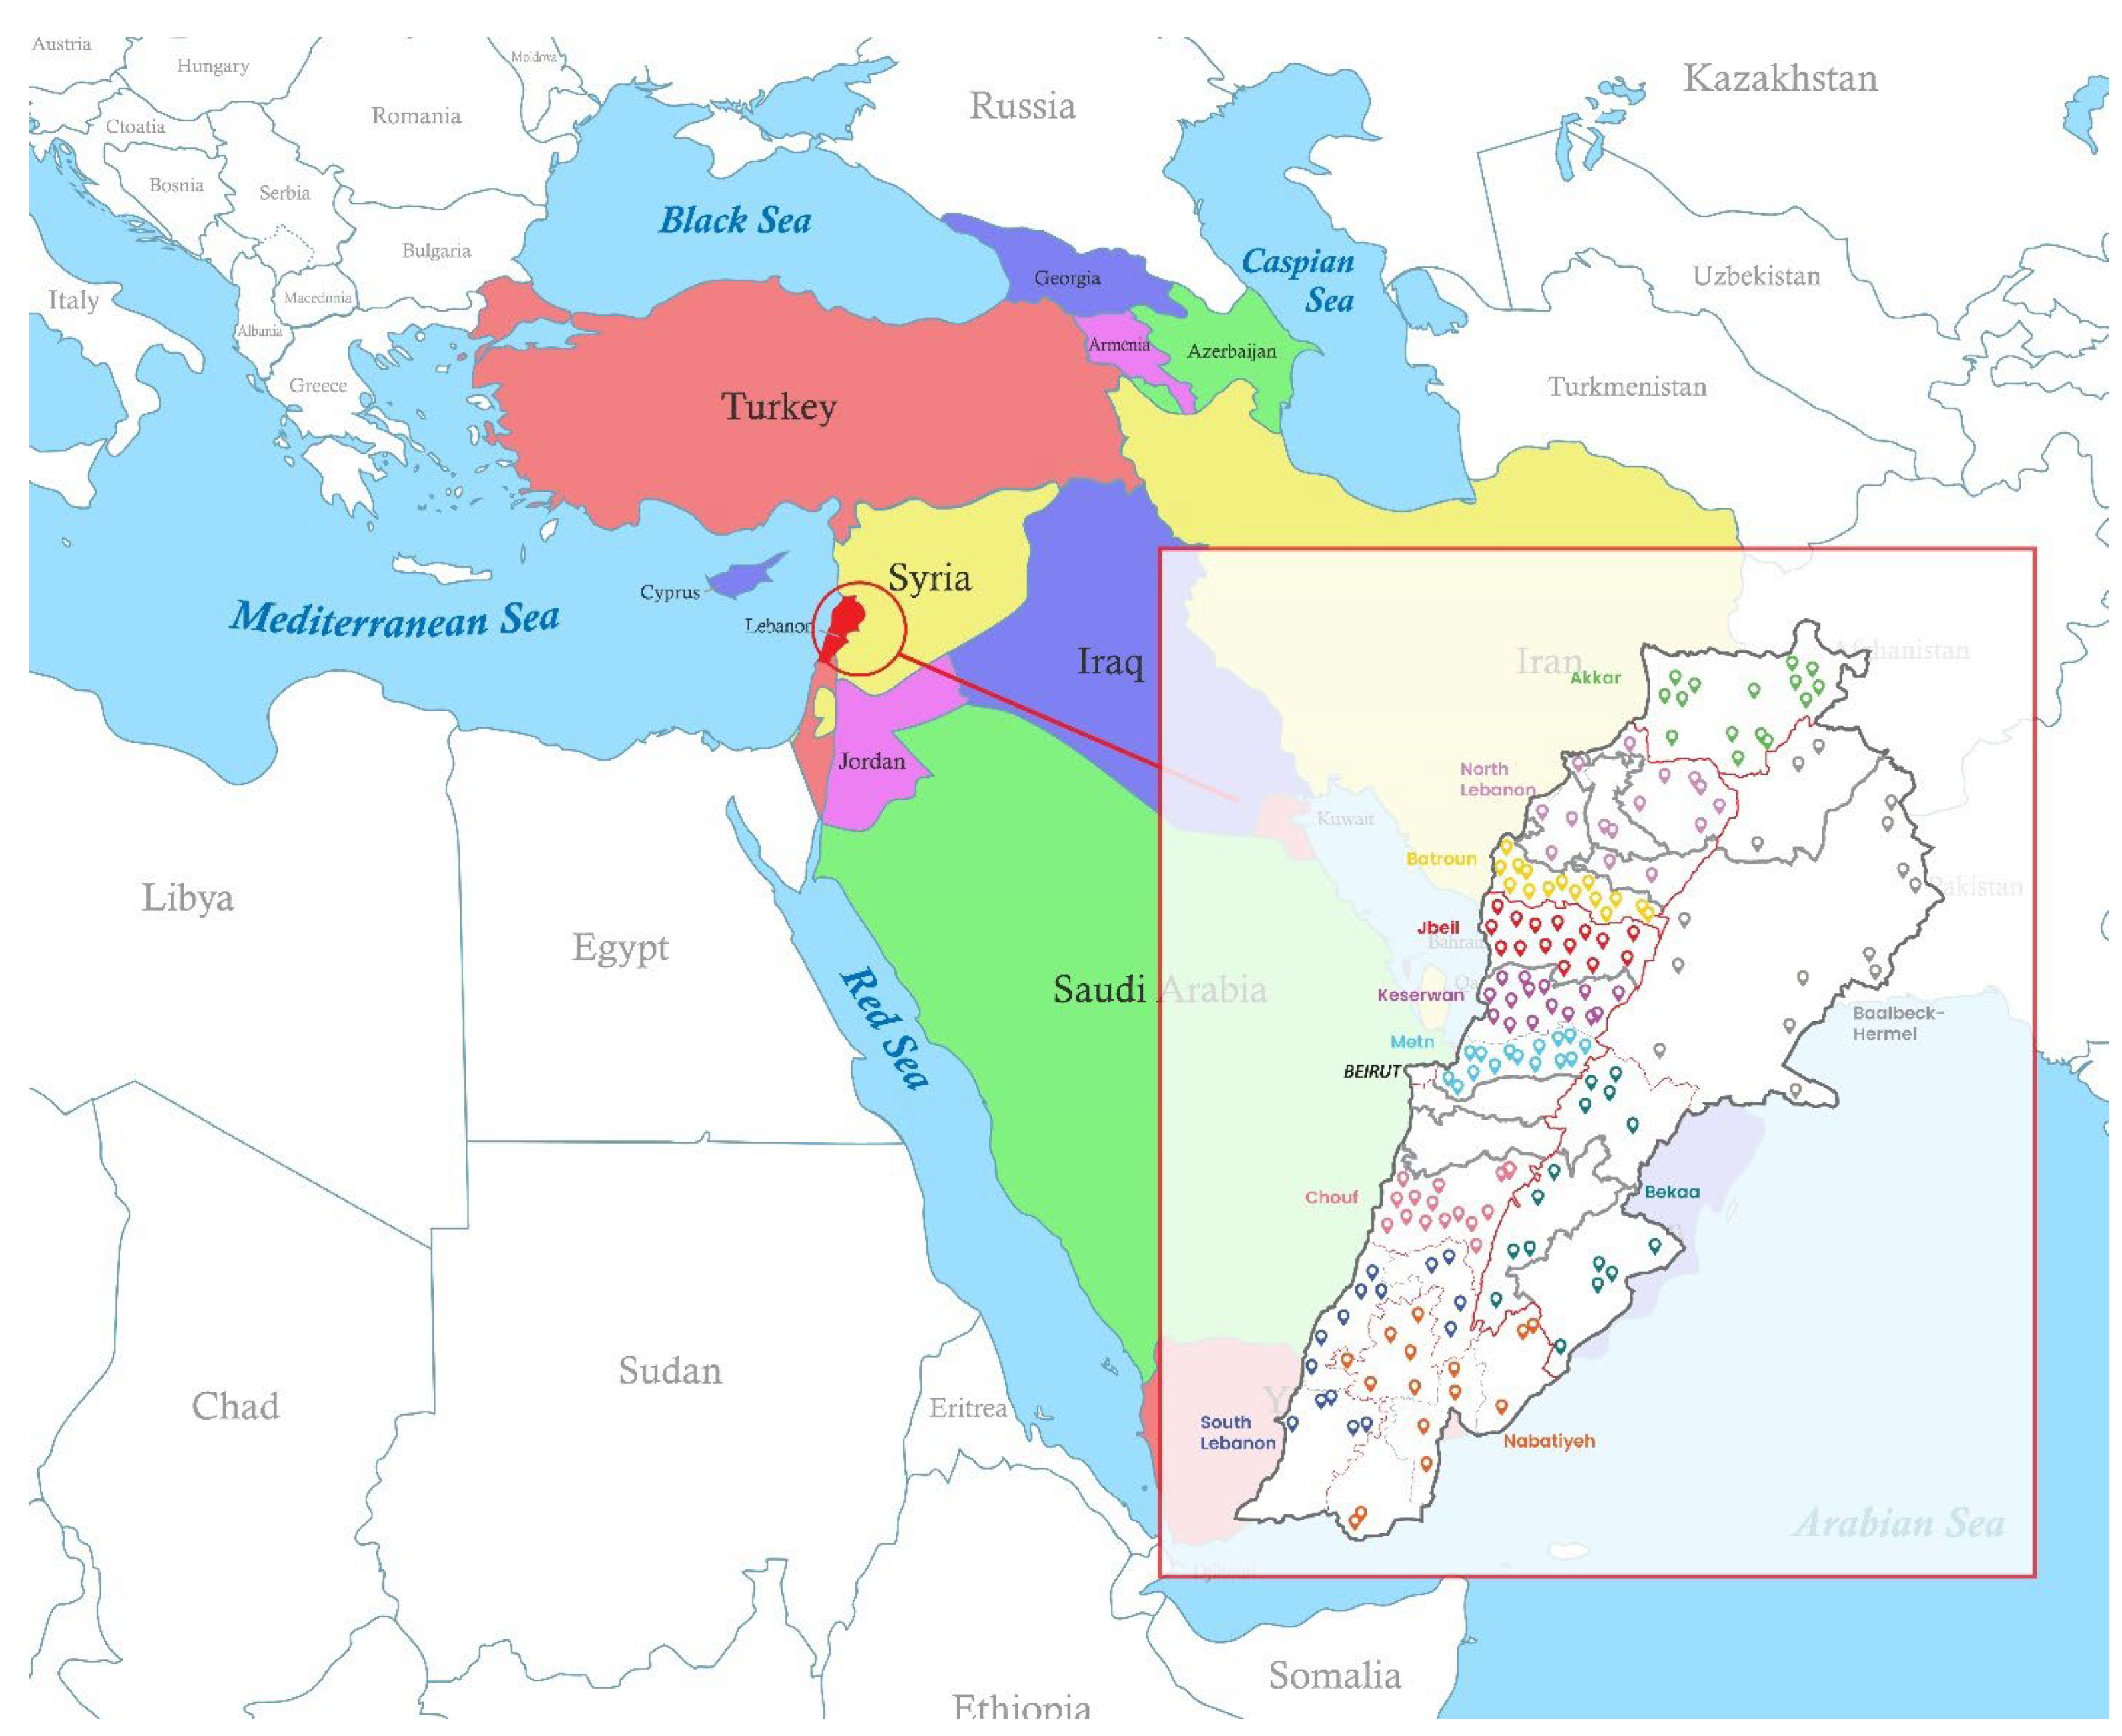
Table 1. The geographic distribution of the study areas is illustrated in
Figure 1, which also locates Lebanon in relation to the global map for added contextual reference.
2.3. Description of Study Areas
To contextualize the variations in heavy metal concentrations observed across the sampled yogurt products, this section provides a brief overview of each of the 11 Lebanese regions from which samples were collected. The descriptions focus on demographics, predominant economic activities, and potential sources of environmental pollution, if any, that could influence heavy metal contamination in dairy products.
Nabatiyeh (Na): Located in southern Lebanon, Nabatiyeh is characterized by a mix of urban and rural areas. The economy is primarily based on agriculture, with tobacco being a significant crop. The region has experienced environmental challenges due to growing urbanization, industrialization, and population growth, which contribute to the presence of contaminants, and in turn degrades freshwater quality and puts the ecosystem at severe risk [
36].
South Area (S): This region encompasses parts of southern Lebanon. The primary economic activity relies on agriculture, particularly tobacco and olive cultivation. Environmental pollution arises from agricultural runoff and the dumping or burning of industrial, household, electronic, plastic, and medical waste, which has led to the contamination of soil and water sources [
4].
Chouf (C): Situated in the Mount Lebanon Governorate, Chouf is known for its diverse topography and forested areas. The local economy relies on agriculture, including fruit orchards and olive groves. While industrial activity is limited, the use of fertilizers and pesticides in agriculture could be potential sources of environmental contaminants.
Metn (M): Metn is a district in the Mount Lebanon Governorate with a mix of urban centers and rural villages. The area hosts various industries, including manufacturing and construction, which may contribute to environmental pollution [
37]. Additionally, the high population density and vehicular traffic can lead to increased air and soil contamination.
Kesserwan(K): Also part of Mount Lebanon, the region’s economy is driven by tourism, agriculture, and light industry. Environmental concerns include pollution from industrial discharges and untreated sewage affecting water quality [
37].
Jbeil (O): Also known as Byblos, Jbeil is a coastal district with a rich historical heritage. The economy is driven by tourism, agriculture, fishing, and small-scale industries. Environmental issues include coastal pollution from industrial and domestic waste, as well as challenges related to water resource management [
37].
Batroun (B): Batroun is a coastal city in northern Lebanon known for its tourism and agriculture, particularly citrus groves. Environmental concerns include pollution from agricultural runoff and inadequate waste disposal systems [
37].
North Area (No): This region includes parts of northern Lebanon with diverse economic activities, including agriculture, industry, and services. Tripoli, the largest and most significant city in the northern area and the second-largest city in Lebanon, contributes to industrial emissions in the region and discharges solid waste into the Mediterranean Sea from its dumpsite. Other sources of pollution in the North Area stem from the mismanagement of sewage, industrial, and hazardous solid waste [
37].
Akkar (A): Akkar is Lebanon’s northernmost governorate, characterized by its rural landscape and agricultural economy. Akkar, the second Lebanese agricultural zone after Bekaa plain, is highly contaminated by prohibited agricultural products. Many studies showed severe contamination of Akkar plain groundwater and soil by nitrate, nitrite, and pesticides [
38,
39,
40]. According to El-Fadel et al. [
41], the coastal waters in Akkar are contaminated by industrial wastewater discharges.
Bekaa (Be): The Bekaa Valley is Lebanon’s primary agricultural region, producing a significant portion of the country’s crops. However, the area faces environmental issues such as water pollution from agricultural runoff and industrial waste, which can affect soil and water quality. Excess fertilizer input and uncontrolled disposal of refuse may have resulted in soil and ground water contamination with nitrates and heavy metals [
42,
43].
Baalbeck-Hermel (BH): Located in northeastern Lebanon, the economy is based on agriculture and livestock. Environmental issues include soil and water pollution from agricultural chemicals, as well as contamination resulting from inadequate waste disposal and water scarcity in the region.
2.4. Reagents
All reagents used were of analytical grade. Nitric acid (≥65%) and hydrogen peroxide (30%) were obtained from Sigma-Aldrich (Steinheim, Germany). Stock solutions were diluted with ultrapure water to create fresh individual standard solutions. Pb standard solutions were prepared by serial dilution from a 1000 ± 4 mg/L stock solution sourced from Fluka Analytical (Buchs, Switzerland). Cd standards were similarly prepared by diluting a 1000 mg/L Certipur® stock solution obtained from Merck (Darmstadt, Germany). Fresh working standard solutions were prepared prior to each analytical run to ensure accuracy and stability. All glassware and plasticware were thoroughly cleaned before use. Initially, they were soaked overnight in 1% nitric acid, then rinsed three times with ultrapure water and allowed to air dry in a dust-free environment to prevent contamination.
2.5. Preparation of Samples
The method was previously developed and validated on chickpeas by Kassouf et al. [
44]. Three replicates of 2 g fresh homogenized samples (no freeze-drying was performed) were accurately weighed into a modified polytetrafluoroethylene (PTFE-TFM) microwave bomb vessel. After adding 7 mL of nitric acid and 1 mL of hydrogen peroxide, the sample digestion was performed in a high-performance microwave digestion system (Anton Paar, Multiwave 3000, Graz, Austria) according to the previously described program by Kassouf et al. [
44]
. After cooling, the final clear digest was transferred to 50 mL polypropylene tubes, diluted to volume with ultrapure water, and filtered through 4 µm PTFE syringe filters (Whatman, Maidstone, UK) to remove particulates before analysis.
2.6. Metal Analysis
Quantification of Pb and Cd was performed using graphite furnace atomic absorption spectrometry (GFAAS) with a Shimadzu AA-6800 atomic absorption spectrometer equipped with an ASC-6100 autosampler and WizAArd software for data acquisition. The GFAAS instrument was operated under optimized conditions for each metal, using wavelengths of 283.3 nm for Pb and 228.8 nm for Cd, and a lamp current of 10 mA. External calibration curves were generated using at least five concentration levels for each metal, prepared fresh from stock solutions.
2.7. Method Validation
White cabbage certified reference material (BCR
® -679, Sigma Aldrich, Geel, Belgium) was used to control the accuracy of sample treatment and analysis of Cd with a recovery in the range of 94–111%. On the other hand, the accuracy for Pb was previously validated by Kassouf et al. on chickpea samples (Kassouf et al., 2013) [
44]. Method validation also included assessments of precision, limit of detection (LOD), and limit of quantification (LOQ). LOD and LOQ were estimated from the average signal of blank solutions prepared via the same digestion procedure, with LOD calculated as the average blank signal plus three times the standard deviation and LOQ as the average plus ten times the standard deviation. The resulting values were compatible with expected concentrations in dairy matrices: LODs for Pb and Cd were 0.004 mg/kg and 0.0007 mg/kg, respectively, and LOQs were 0.012 mg/kg and 0.0021 mg/kg, respectively, in agreement with levels typically observed in food samples [
44]. Precision, expressed as the relative standard deviation (RSD%) of triplicate spiked sample analyses, was consistently below 15%, confirming the reproducibility.
2.8. Estimated Dietary Intake for Pd and Cd
The estimation of daily intake (EDI, μg/kg b.w./day) for Pb and Cd compounds in yogurt samples was conducted using Equation (1):
where C is the mean concentration of Pd or Cd (mg/kg, ww), MS is the meal size (daily consumption of yogurt, gram per day), and b.w. is the body weight (kg) of the adult consumer. The EDI was calculated for Pd and Cd compounds quantified above the LOQ values in the yogurt samples. According to Nasreddine et al. [
45], the mean consumption of yogurt for adults in Lebanon was 68.3 g/day and the average body mass of adult consumers was 73.8 kg [
46]. Data on the average consumption of yogurt in children and adolescents have not yet been published in Lebanon; therefore, we will conduct the EDI for Lebanese adult consumers only.
2.9. Data Analysis
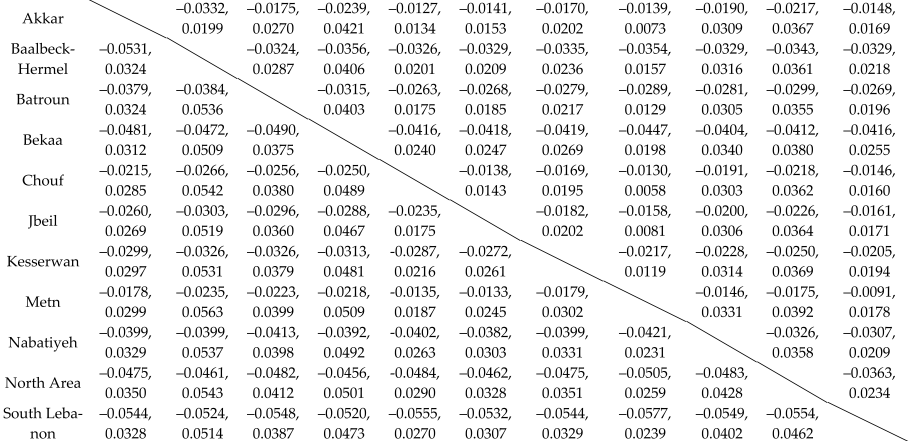
The obtained data were analyzed using IBM SPSS Statistics V26. Descriptive statistical parameters, including mean and standard deviation, were used to describe and compare the measured levels of Pb and Cd in yogurt samples across different regions. One-sample two-sided t-tests were conducted to compare measured concentrations with regulatory limits, and a one-way ANOVA was performed to assess variations in heavy metal concentrations among regions. A post hoc multiple comparisons test is performed using the Games–Howell test for comparing the means among the various regions. Statistical significance was set at p ≤ 0.05. The percentage of samples exceeding the permissible limits was also calculated to evaluate the extent of contamination.
4. Safety Policy Recommendation for Dairy Products
The safety of dairy products necessitates addressing contamination threats on several levels. The most important thing is to reduce heavy metal contamination. To decrease the incidence of contamination in dairy products, a multi-step approach that includes source identification, detection, and regulatory enforcement is needed. Pb and Cd can enter dairy products via dirty soil, water, and animal feed; therefore, environmental control is an important initial step. Limiting industrial emissions, enforcing soil remediation in damaged agricultural zones, and regulating livestock feed quality can all help to reduce these metal levels in milk, which is the origin of all dairy products. The first step for this approach is the requirement of regular testing and enhanced detection methods. Additionally, advanced analytical techniques should also be incorporated into routine monitoring programs to detect contamination in the early stages. Establishing checkpoints at several stages, from milk collection to final processing, guarantees that contaminated samples are detected and eliminated before they reach consumers. The second step is the education of dairy farmers, who must be instructed on optimal procedures for reducing heavy metal absorption by livestock. Adjusting feed composition, monitoring water sources, and using sustainable farming techniques can all help to decrease contamination risks. Last but not least, regulatory authorities should require stringent compliance with heavy metal limitations in dairy products, such as applying routine inspections, standardized testing processes, and penalties.


 ,
, 


